Embed Size (px)
Citation preview
This PDF is a selection from a published volume from theNational Bureau of Economic Research
Volume Title: Growth and Productivity in East Asia, NBER-EastAsia Seminar on Economics, Volume 13
Volume Author/Editor: Takatoshi Ito and Andrew K. Rose,editors
Volume Publisher: University of Chicago Press
Volume ISBN: 0-226-38680-5
Volume URL: http://www.nber.org/books/ito_04-2
Conference Date: June 20-22, 2002
Publication Date: June 2004
Title: The Contribution of FDI Flows to Domestic Investmentin Capacity, and Vice Versa
Author: Assaf Razin
URL: http://www.nber.org/chapters/c10747

149
5.1 Introduction
The term “foreign direct investment” (FDI) usually brings to mind asignificant contribution of FDI to domestic investment and to capital in-flows. However, there has been a lot of skepticism concerning the contri-bution of FDI to these engines of growth. As noted by Froot (1991), FDI(the purchase by a domestic resident of a controlling stake in a foreigncompany) actually requires neither capital flows nor investment in capac-ity. Conceptually, FDI is an extension of corporate control over interna-tional boundaries. Froot put it succinctly: “When Japanese-owned Bridge-stone takes control over the US firm Firestone, capital need not flow intothe US. US domestic lenders can largely finance the equity purchase.Any borrowing by Bridgestone from foreign-based third parties also doesnot qualify as FDI (although it would count as an inflow of portfolio cap-ital into the US). And, of course, in such acquisition there is no investmentexpenditure; merely an international transfer in the title of corporateassets.” Does this example capture the essence of FDI in emerging econ-omies?
The answer we provide in this paper, based on a new theory and new em-pirical evidence, is that FDI flows do play an important role in the skim-ming of high-productivity investment projects and thereby contribute sig-nificantly to domestic investment in both the quantity and the qualitydimensions.
5The Contribution of FDI Flowsto Domestic Investment inCapacity, and Vice Versa
Assaf Razin
Assaf Razin is Mario Henrique Simonsen Professor of Public Economics at Tel Aviv Uni-versity, Friedman Professor of International Economics at Cornell University, and a researchassociate of the National Bureau of Economic Research.

5.2 Old and New Theories
Theories of FDI can essentially be divided into two categories: micro(industrial organization) theories and macro finance (cost of capital) theo-ries. The early literature that explains FDI in microeconomic terms focuseson market imperfections and on the desire of multinational enterprisesto expand their market power (see Caves 1971). Subsequent literaturecentered more on firm-specific advantages, owing to product superiorityor cost advantages that stemmed from economies of scale, multiplanteconomies and advanced technology, or superior marketing and distribu-tion (see Helpman 1984). According to this view, multinationals find itcheaper to expand directly in a foreign country, rather than through trade,in cases where the advantages associated with cost or product are based oninternal, indivisible assets based on knowledge and technology. Alternativeexplanations for FDI have focused on regulatory restrictions, includingtariffs and quotas, that either encourage or discourage cross-border acqui-sitions, depending on whether one considers horizontal or vertical inte-grations.
Studies examining the macroeconomic effects of exchange rate on FDIfocused on the positive effects of an exchange rate depreciation of the hostcountry on FDI inflows, because it lowers the cost of production and in-vestment in the host countries, raising the profitability of FDI. The wealtheffect is another channel through which a depreciation of the real exchangerate could raise FDI. A depreciation of the real exchange rate, by raisingthe relative wealth of foreign firms, could make it easier for those firms touse retained profits to finance investment abroad and to post a collateral inborrowing from domestic lenders in the host country capital market (seeFroot 1991 and Razin and Sadka 2003). There is also a large literature ondifferent forms of spillovers from inward investors in the form of new tech-nologies, new ideas, and capital accumulation on the growth of output inthe domestic economy (see Blomström, Kokko, and Globerman 2001).
What is the essential difference between portfolio investment and FDIinvestment from the point of view of corporate governance?
Management under portfolio equity ownership may be plagued by afree-rider problem. Under dispersed ownership, if an individual share-holder does something to improve the quality of management, the benefitswill also accrue to all other shareholders (see Hart 2000). In contrast, theFDI investor, who is endowed with management skills and gains control ofthe firm, has better incentives to pursue proper monitoring of managementand will be in a better position to micromanage the firm. Furthermore,based on possessing “intangible capital” in his or her source country, theFDI investor can apply more efficient management standards in the hostcountry compared to domestic investors. Thus, the unique advantage to
150 Assaf Razin

FDI, which has only recently been explored, is the potential for superiormicromanagement, based on the specialization in niches of industry. Im-portant issues with FDI from this standpoint are (1) what the salient char-acteristics are of the free-FDI-flows equilibrium, when FDI investors takecontrol over domestic firms; (2) what constitutes the gains from FDI flowsto the host economy, given that the foreign investors appropriate theprivate rewards resulting from their superior management skills; and(3) whether or not the free-FDI-flows regime is more efficient than free-portfolio-flows regime.
In an integrated capital market, with full information, all forms of capi-tal flows (FDI, loans, and portfolio equity and debt) are indistinguishable.In the presence of incomplete information, these flows are significantlydifferent from one another. In Razin and Sadka (2002), we developed astylized model of FDI in the presence of imperfect information with re-spect to the firm’s productivity.
We formalized the unique advantage of FDI investment over other typesof investment in a stylized model. Suppose that initially all firms are stillowned by original (domestic) uninformed owners, and suppose that theproductivity shock is purely idiosyncratic. At the beginning of the first pe-riod, when investment decisions are made, firms are still uninformed aboutthe productivity shock (the productivity level of the specific firm that theyown). It will be revealed only in the second period, when output from newcapital becomes public knowledge. In order to make new investment thefirm must first incur a fixed setup cost. As the firms are all ex ante identi-cal, if they have to make the investment decision based on this level of in-formation, they will all invest the same, in accordance with the expectedlevel of the productivity factor. Assume now that at this stage, before theproductivity factor is known, foreign direct investors step in. Upon ac-quiring and effectively managing the firm, the FDI investor can bettermonitor the productivity of the firm than his or her domestic investorcounterpart. He or she can thus fine-tune the level of capital stock moreclosely to the value of the productivity factor. Anticipating this fine-tunedinvestment schedule, the value of the firm to the potential FDI investor islarger than the reservation value to the original owner and the correspon-ding bid value to potential domestic investors. Therefore, FDI investorswill outbid domestic investors for the firms in the domestic industry. Com-petition among potential FDI investors will drive the price up close to theprice that reflects the upgraded management of the firm. The initial do-mestic owners will gain the rent, which is equal to difference between theFDI investor’s shadow price and the initial owner’s reservation price.
If the competition between potential FDI investors is perfect, all the ben-efits from the superior FDI management skills accrue to the host economy,leaving the FDI investors with a return on their investment just equalling
The Contribution of FDI Flows to Domestic Investment in Capacity 151
the world rate of interest. The gains to the host economy from FDI inflowscan in this case be classified into two categories. First, there are the con-ventional gains that stem from opening the economy to the new flow ofcapital, thereby allowing a more efficient intertemporal allocation of con-sumption (e.g., via consumption smoothing). Second, there are the intrin-sic gains associated with the superior micromanagement by FDI investors.The entire gain of the FDI investors is captured by the domestic economybecause of assumed perfect competition among these investors over thedomestic firms. If, however, there is imperfect competition among FDI in-vestors, the gains will split between them and the host country.
The economic gains from FDI, relative to portfolio inflows, lie only inthe efficiency of investment, since in both cases there are consumption-smoothing effects and the same world interest rate (r) prevails in the hostcountry in both the FDI-flows regime and the portfolio-flows regime. Inother words, the gains from FDI, in comparison to portfolio flows, do notinclude the traditional gains from opening up the domestic capital marketto foreign capital inflows because these traditional gains are also present inthe portfolio-flows regime. Razin and Sadka (2002) were able also to showthat, under some plausible conditions on the form of the production func-tion, the size of the aggregate stock of capital is larger under FDI than un-der portfolio equity flows.
5.3 The Evidence1
Like its theoretical counterpart, empirical work has tended to focus ei-ther on underlying factors to explain the location of FDI flows acrosscountries or on explaining the cyclical behaviour of FDI flows using macro-economic variables and assessing the contribution of FDI flows to invest-ment and growth.
To what extent is there empirical support for such claims of the signifi-cant impact of FDI on domestic investment?
5.3.1 Previous Literature
A comprehensive study by Bosworth and Collins (1999) provides evi-dence concerning the effect of capital inflows on domestic investment forfifty-eight developing countries during 1978–95. The authors distinguishamong three types of inflows: FDI, portfolio investment, and other finan-cial flows (primarily bank loans). Bosworth and Collins find that an in-crease of a dollar in capital inflows is associated with an increase in do-mestic investment of about fifty cents. (Both capital inflows and domestic
152 Assaf Razin
1. See Borensztein, DeGregorio, and Lee (1998) and Bosworth and Collins (1999) for a sim-ilar panel data analysis.

investment are expressed as percentages of gross domestic product[GDP]). This result, however, masks significant differences among differ-ent types of inflows. Foreign direct investment appears to bring about closeto a one-for-one increase in domestic investment; there is virtually no dis-cernible relationship between portfolio inflows and investment (little or noimpact), and the impact of loans falls between those of the other two. Theseresults hold both for the fifty-eight-country sample and for a subset ofeighteen emerging markets (see fig. 5.1).
The Contribution of FDI Flows to Domestic Investment in Capacity 153
Fig. 5.1 Estimated impact of capital flows on domestic investmentSource: Loungani and Razin (2001), based on Bosworth and Collins (1999).Note: The height of the bar represents the estimated impact of $1 of the indicated capital flowon domestic investment.

An additional (striking) feature of FDI flows that was noted in previousliterature is that the share of FDI in total inflows is higher in riskier coun-tries, as measured either by countries’ credit ratings for sovereign (govern-ment) debt or other indicators of country risk (see fig. 5.2). There is alsosome evidence that the FDI share is higher in countries where the qualityof corporate governance institutions is lower. What can explain theseseemingly paradoxical findings? One explanation is that FDI is more likely,compared with other forms of capital flows, to take place in countries withmissing or inefficient markets. In such settings, foreign investors will preferto operate directly instead of relying on local financial markets, suppliers,or legal arrangements.
5.3.2 Determinants of Foreign Direct Investment Flows:A Gravity Model
Razin, Rubinstein, and Sadka (2003) employ a gravity model of bilat-eral FDI and portfolio capital flows in order to explain determinants of themobility of financial capital across countries. The authors estimate jointlya participation equation (the decision whether to export FDI at all) and agravity equation (the decision how much FDI exports to make). They findthat the error terms in these two equations are negatively and significantlycorrelated. The negative correlation suggests that the source countrieswith relatively low set up costs of FDI investment are also those with highmarginal productivity of capital. These findings are summarized in table5.1.
In Mody, Razin, and Sadka (2002) we interpret the industry specializa-tion measure in the source country as an indication of a comparative ad-vantage to the potential foreign direct investors in eliciting good invest-
154 Assaf Razin
Fig. 5.2 FDI’s share in total inflows is higher in countries with weaker credit ratingsSource: Albuquerque (2003).

ment opportunities in the destination country, relative to domestic in-vestors in the host country. This advantage may stem, for example, fromthe ability of FDI investors to apply better industry-specific microman-agement standards. To capture this element we assume a lower cost ofcream skimming (of high-productivity firms) on the part of foreign directinvestors. The second category of variables underscores the role of infor-mation as a determinant of FDI inflows. As banks are the main providersof debt capital in emerging markets, and they usually conduct rigorousscrutiny of the creditworthiness of their debtors, we conjecture that, ceterisparibus, firms with high debt-equity ratio tend to be more transparent. Inthis case, the advantage of FDI investors in their cream-skimming skills(that is, the selection of high-productivity firms) is less pronounced andtherefore FDI inflows are less abundant.
5.4 Capital Inflows, Investment in Capacity, and Growth: Panel Data
5.4.1 Empirical Framework for the Panel-Data Analysis
In this subsection I describe the econometric approach for the estima-tion of the interactions between domestic investment, FDI flows, interna-tional loans, and international portfolio investment. The sample consistsof sixty-four developing countries, including Israel,2 in the period 1976 to
The Contribution of FDI Flows to Domestic Investment in Capacity 155
Table 5.1 Determinants of FDI in a Gravity Equation and Selection Equation
Gravity Selection
Host GDP per capita 0.762 0.264(0.054) (0.030)
Source GDP per capita 0.002 1.928(0.207) (0.073)
Common language 1.209 0.024(0.085) (0.049)
Average years of schooling (host) 0.087 0.000(0.023) (0.014)
Average years of schooling (source) 0.295 0.058(0.025) (0.015)
rho –0.585 –0.585(0.077) (0.077)
No. of observations 9,848 9,843
Source: Razin, Rubinstein, and Sadka (2003).Notes: Maximum livelihood estimation: FDI (real US$) from source to destination country(1981–98, three-year averages). Numbers in parentheses are standard errors.
2. This section draws on Hecht, Razin, and Shinar (2003).

1997 (twenty-two years in total; see appendix A). All the variables but thedummies are expressed in terms of GDP percentages. The source of data isthe World Development Indicators (WDI) database (see appendix A). Thesystem of equations is given by
1. I � �i1 j � �i2I(–1) � �i3DY � �i 4DY(–1) � �i5FDI � �i6P � �i7L
� �i8G
2. FDI � �f 1 j � �f 2FDI(–1) � �f 3I � �f 4DY � �f 5DY(–1) � �f 6Res2
3. L � �l1j � �l 2L(–1) � �l3I � �l4DY � �l5DY(–1)
4. P � �p1j � �p2P(–1) � �p3I � �p4DY � �p5DY(–1) � �p6Res1,
where
I � gross domestic investment (% of GDP)FDI � foreign direct investment (% of GDP)L � bank loans (% of GDP)P � portfolio investment flows (% of GDP)DY � annual percentage growth rate of GDPG � general government consumption (% of GDP)Res1 � multiple exchange rates (single exchange rate � 0; more than one � 1)Res2 � restrictions on current account transactions (no controls � 0; con-
trols � 1)j � country index, j � 01, 02, 03, . . . , 64
The four-equation system has four endogenous variables: I, FDI, P, andL as dependent variables and observations. Every equation also includes,as an explanatory variable, the dependent variable lagged one period. Theexogenous variables used for identification are government expenditure(G ), a dummy variable for multiple exchange rates (Res1), a dummy vari-able for restrictions on current account transactions (Res2), and lagged de-pendent variables.
Table 5.2 describes the interactions among the endogenous and the ex-ogenous variables in the four-equation system.
Two versions are estimated: ordinary least squares (OLS) regressions, asa benchmark, and two-stage least squares (TSLS) regressions with a coun-try-specific effect. To avoid nonstationarity of the residuals in the four-equation system, we introduce lagged dependent variables on the right-hand side of the equation system.
5.4.2 Domestic Investment: Findings
Tables 5.3 through 5.6 present the estimation results, and we discussthem equation by equation.
156 Assaf Razin

We start with table 5.3, which describes the effects of capital inflows ondomestic investment.
The coefficient of FDI is significant in the OLS and TSLS regressions.Long-run FDI effect on domestic investment is 0.94 in the OLS regressionand 0.68 in the TSLS regression. Thus, potential for an upward bias in theOLS estimation procedure appears to be validated. Indeed the effect ofFDI on domestic investment is smaller in TSLS regressions. The loan co-efficient is significant and positive in both the OLS and the TSLS regres-sions, at a similar magnitude. However, the long-run coefficient (adjusted
The Contribution of FDI Flows to Domestic Investment in Capacity 157
Table 5.2 Expected Interactions among Endogenous and Exogenous Variables
EndogenousVariables Exogenous Variables
FDI P L I I(–1) FDI(–1) P(–1) L(–1) DY DY(–1) G Res2 Res1
I � � � � � � �
FDI � � � � �
P � � � � �
L � � � �
Table 5.3 Determinants of Domestic Investment in Capacity
OLS TSLS
Foreign direct investment, FDI 0.16 0.23(5.2) (6.8)
Loan inflows, L –0.06 0.12(–2.2) (3.0)
Portfolio inflows, P 0.03 0.18(0.3) (2.0)
Lagged domestic investment, I(–1) 0.87 0.66(96.1) (51.2)
Output growth, DY 0.15 0.15(10.4) (10.9)
Lagged output growth, DY(–1) 0.06 0.06(3.8) (4.4)
Government expenditure, G 0.03 0.01(2.3) (0.5)
Long-run effect of FDI on I 0.94 0.68Long-run effect of L on I –0.35 0.35Long-run effect of P on I 0.18 0.53R2 adjusted 0.40 0.53
Notes: Estimated using Eviews software. I(–1), FDI, P, L, and G are in terms of ratio to GDP;t-values appear in parentheses.

for the lag structure of the regression) moves up from –0.35 in the TSLS re-gression. The coefficient of the portfolio-investment variable is not signifi-cant in the OLS regression and becomes significant in the TSLS regression.Interestingly, the long-run effect of FDI on domestic investment, 0.68, ex-ceeds the corresponding effect of portfolio investment, 0.53, which in turnexceeds the effect of loans, 0.35.
Foreign Direct Investment Inflows
Table 5.4 describes the effect of domestic investment on FDI inflows, al-lowing for the effects of a group of other traditional variables, such asgrowth and capital controls.
The coefficient of domestic investment is positive and significant in boththe OLS and the TSLS regression. The long-run effect in the OLS (0.08) issmaller than in the TSLS (0.14).
Loan Inflows
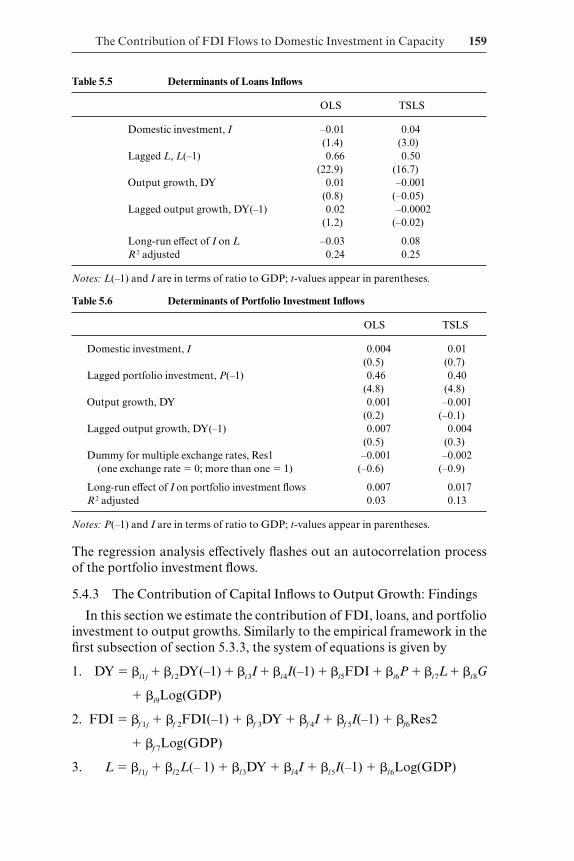
Table 5.5 describes the effect of domestic investment on loan inflows, al-lowing for the effect of growth. The coefficient of domestic investment isnegative and nonsignificant in the OLS but positive and significant in theTSLS regression. The long-run effect moves up from –0.03 in the OLS re-gression to 0.08 in the TSLS regression.
Portfolio Inflows
Table 5.6 describes the effect of domestic investment on portfolio invest-ment inflows. The explanatory power of the regression is poor, however,and most of the right-hand-side variables have nonsignificant coefficients.
158 Assaf Razin
Table 5.4 Determinants of FDI Inflows
OLS TSLS
Domestic investment, I 0.03 0.07(3.0) (5.0)
Lagged foreign direct investment, FDI(–1) 0.60 0.50(19.6) (16.0)
Output growth, DY 0.01 0.02(0.10) (1.6)
Lagged output growth, DY(–1) –0.01 0.02(–0.1) (1.3)
Dummy for capital controls, Res2 –0.03 –0.02(no controls � 0; controls � 1) (–2.1) (–1.2)
Long-run effect of I on FDI 0.08 0.14R2 adjusted 0.13 0.29
Notes: FDI and I are in terms of ratio to GDP; t-values appear in parentheses.
The Contribution of FDI Flows to Domestic Investment in Capacity 159
Table 5.5 Determinants of Loans Inflows
OLS TSLS
Domestic investment, I –0.01 0.04(1.4) (3.0)
Lagged L, L(–1) 0.66 0.50(22.9) (16.7)
Output growth, DY 0.01 –0.001(0.8) (–0.05)
Lagged output growth, DY(–1) 0.02 –0.0002(1.2) (–0.02)
Long-run effect of I on L –0.03 0.08R 2 adjusted 0.24 0.25
Notes: L(–1) and I are in terms of ratio to GDP; t-values appear in parentheses.
Table 5.6 Determinants of Portfolio Investment Inflows
OLS TSLS
Domestic investment, I 0.004 0.01(0.5) (0.7)
Lagged portfolio investment, P(–1) 0.46 0.40(4.8) (4.8)
Output growth, DY 0.001 –0.001(0.2) (–0.1)
Lagged output growth, DY(–1) 0.007 0.004(0.5) (0.3)
Dummy for multiple exchange rates, Res1 –0.001 –0.002(one exchange rate � 0; more than one � 1) (–0.6) (–0.9)
Long-run effect of I on portfolio investment flows 0.007 0.017R 2 adjusted 0.03 0.13
Notes: P(–1) and I are in terms of ratio to GDP; t-values appear in parentheses.
The regression analysis effectively flashes out an autocorrelation processof the portfolio investment flows.
5.4.3 The Contribution of Capital Inflows to Output Growth: Findings
In this section we estimate the contribution of FDI, loans, and portfolioinvestment to output growths. Similarly to the empirical framework in thefirst subsection of section 5.3.3, the system of equations is given by
1. DY � �i1j � �i 2DY(–1) � �i3I � �i4I(–1) � �i5FDI � �i6P � �i7L� �i8G
� �i9Log(GDP)
2. FDI � �f 1j � �f 2FDI(–1) � �f 3DY � �f 4I � �f 5I(–1) � �f6Res2
� �f 7Log(GDP)
3. L � �l1j � �l2L(– 1) � �l3DY � �l4I � �l5I(–1) � �l6Log(GDP)
160 Assaf Razin
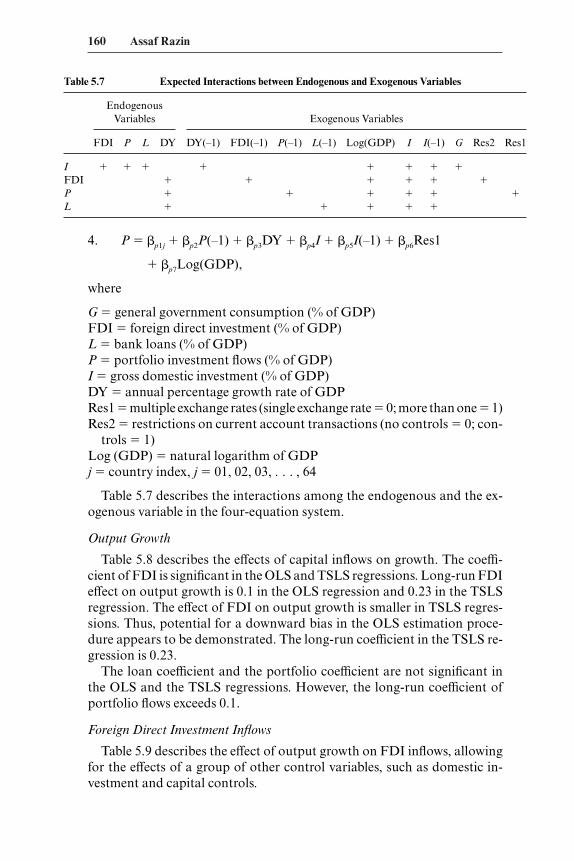
Table 5.7 Expected Interactions between Endogenous and Exogenous Variables
EndogenousVariables Exogenous Variables
FDI P L DY DY(–1) FDI(–1) P(–1) L(–1) Log(GDP) I I(–1) G Res2 Res1
I � � � � � � � �
FDI � � � � � �
P � � � � � �
L � � � � �
4. P � �p1j � �p2P(–1) � �p3DY � �p4I � �p5I(–1) � �p6Res1
� �p7Log(GDP),
where
G � general government consumption (% of GDP)FDI � foreign direct investment (% of GDP)L � bank loans (% of GDP)P � portfolio investment flows (% of GDP)I � gross domestic investment (% of GDP)DY � annual percentage growth rate of GDPRes1 � multiple exchange rates (single exchange rate � 0; more than one � 1)Res2 � restrictions on current account transactions (no controls � 0; con-
trols � 1)Log (GDP) � natural logarithm of GDPj � country index, j � 01, 02, 03, . . . , 64
Table 5.7 describes the interactions among the endogenous and the ex-ogenous variable in the four-equation system.
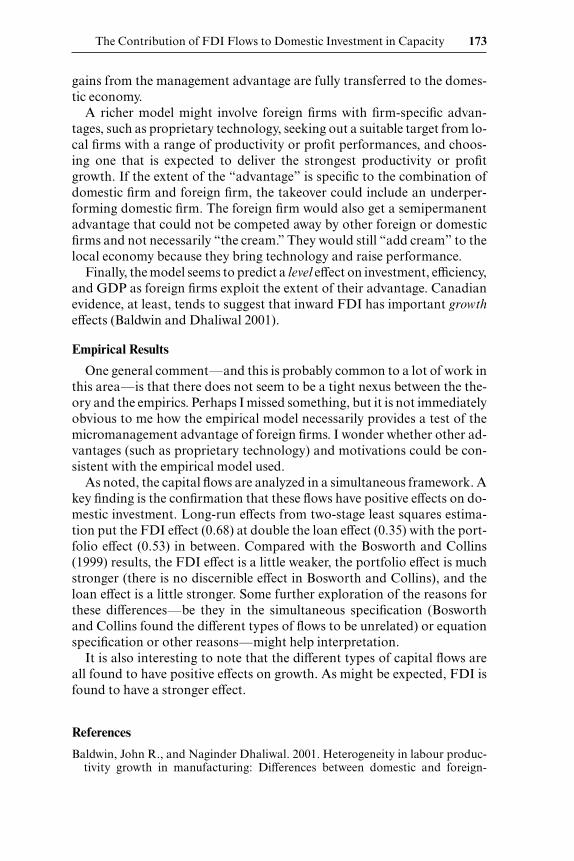
Output Growth
Table 5.8 describes the effects of capital inflows on growth. The coeffi-cient of FDI is significant in the OLS and TSLS regressions. Long-run FDIeffect on output growth is 0.1 in the OLS regression and 0.23 in the TSLSregression. The effect of FDI on output growth is smaller in TSLS regres-sions. Thus, potential for a downward bias in the OLS estimation proce-dure appears to be demonstrated. The long-run coefficient in the TSLS re-gression is 0.23.
The loan coefficient and the portfolio coefficient are not significant inthe OLS and the TSLS regressions. However, the long-run coefficient ofportfolio flows exceeds 0.1.
Foreign Direct Investment Inflows
Table 5.9 describes the effect of output growth on FDI inflows, allowingfor the effects of a group of other control variables, such as domestic in-vestment and capital controls.
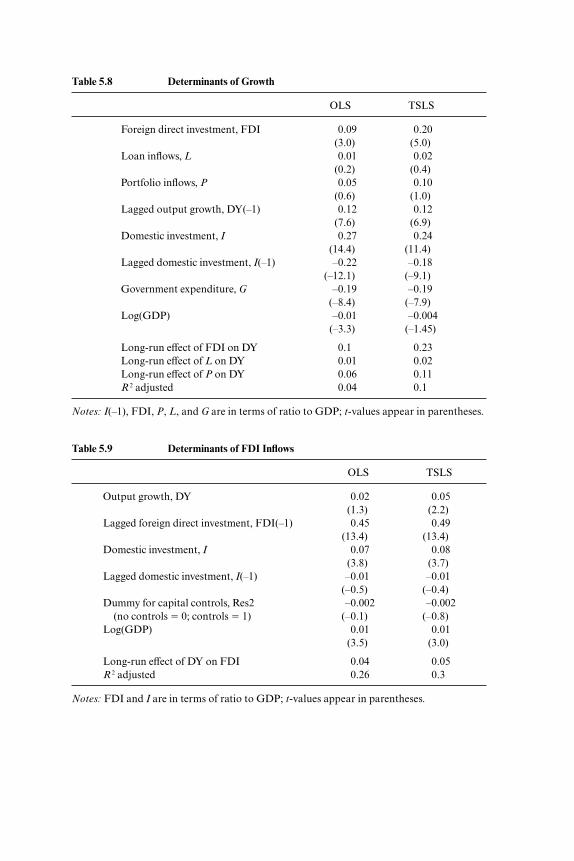
Table 5.8 Determinants of Growth
OLS TSLS
Foreign direct investment, FDI 0.09 0.20(3.0) (5.0)
Loan inflows, L 0.01 0.02(0.2) (0.4)
Portfolio inflows, P 0.05 0.10(0.6) (1.0)
Lagged output growth, DY(–1) 0.12 0.12(7.6) (6.9)
Domestic investment, I 0.27 0.24(14.4) (11.4)
Lagged domestic investment, I(–1) –0.22 –0.18(–12.1) (–9.1)
Government expenditure, G –0.19 –0.19(–8.4) (–7.9)
Log(GDP) –0.01 –0.004(–3.3) (–1.45)
Long-run effect of FDI on DY 0.1 0.23Long-run effect of L on DY 0.01 0.02Long-run effect of P on DY 0.06 0.11R 2 adjusted 0.04 0.1
Notes: I(–1), FDI, P, L, and G are in terms of ratio to GDP; t-values appear in parentheses.
Table 5.9 Determinants of FDI Inflows
OLS TSLS
Output growth, DY 0.02 0.05(1.3) (2.2)
Lagged foreign direct investment, FDI(–1) 0.45 0.49(13.4) (13.4)
Domestic investment, I 0.07 0.08(3.8) (3.7)
Lagged domestic investment, I(–1) –0.01 –0.01(–0.5) (–0.4)
Dummy for capital controls, Res2 –0.002 –0.002(no controls � 0; controls � 1) (–0.1) (–0.8)
Log(GDP) 0.01 0.01(3.5) (3.0)
Long-run effect of DY on FDI 0.04 0.05R 2 adjusted 0.26 0.3
Notes: FDI and I are in terms of ratio to GDP; t-values appear in parentheses.

The coefficient of output growth is positive and significant in the TSLSregression. The long-run effect is 0.05.
Loan Inflows
Table 5.10 describes the effect of output growth on loans inflows, allow-ing for the effect of domestic investment. The coefficient of output growthis nonsignificant in both the regressions.
Portfolio Inflows
Table 5.11 describes the effect of output growth on portfolio investmentinflows. The explanatory power of the regression is poor, however, andmost of the right-hand-side variables have nonsignificant coefficients. The
162 Assaf Razin
Table 5.10 Determinants of Loans Inflows
OLS TSLS
Output growth, DY –0.005 –0.005(–0.3) (–0.2)
Lagged L, L(–1) 0.49 0.49(14.2) (14.0)
Domestic investment, I 0.06 0.07(3.2) (3.4)
Lagged domestic investment, I(–1) –0.03 –0.04(–1.5) (–1.8)
Log(GDP) –0.01 –0.01(–2.8) (–2.3)
Long-run effect of I on L –0.01 –0.01R 2 adjusted 0.27 0.27
Notes: L(–1) and I are in terms of ratio to GDP; t-values appear in parentheses.
Table 5.11 Determinants of Portfolio Investment Inflows
OLS TSLS
Output growth, DY –0.0004 0.003(–0.025) (0.12)
Lagged portfolio investment, P(–1) 0.37 0.37(3.9) (3.9)
Domestic investment, I 0.003 0.001(0.2) (0.05)
Lagged domestic investment, I(–1) 0.01 0.01(0.3) (0.4)
Dummy for multiple exchange rates, Res1 –0.002 –0.002(one exchange rate � 0; more than one � 1) (–0.72) (–0.6)
Long-run effect of I on Port 0 0R 2 adjusted 0.15 0.15
Notes: P(–1) and I are in terms of ratio to GDP; t-values appear in parentheses.

regression analysis effectively flashes out an autocorrelation process of theportfolio investment flows.
Summary
We now summarize the main findings of the panel data analysis con-cerning interactions between capital inflows and investment in capacity (orgrowth):
1. Foreign direct investment flows have a larger (independent) effect ondomestic investment in capacity (or growth) than loan inflows or foreign-portfolio inflows.
2. Domestic investment in capacity (or output growth) has more pro-nounced effects on FDI inflows than on either loan inflows or foreign-portfolio inflows.
5.5 Conclusion
Kindleberger (1969) suggests that in order to think about FDI we mustask not why capital might flow into a country, but rather why some partic-ular asset would be worth more under foreign than under domestic control.In this chapter I discuss empirical implications of a new theory of FDI,which captures a unique feature: hands-on management standards that en-able investors to react in real time to the changing economic environmentsurrounding the investors. Equipped with superior managerial skills, for-eign direct investors are able to outbid portfolio investors for the top pro-ductivity firms in a particular industry in which they have specialized in thesource country. Consequently, FDI investors would make investment bothlarger and higher quality than the domestic investors. The theory can ex-plain both two-way FDI flows among developed countries and one-wayFDI flows from developed to developing countries. Gains to the host coun-try from FDI stem from the informational value of FDI.
Main predictions of the theory are consistent with evidence from paneldata: Larger FDI coefficients in the domestic-investment and output-growth regressions relative to the portfolio equity and international loansinflow coefficients reflect a unique role for FDI in the domestic investmentand growth process.
Does this mean that the chapter brings out a case for subsidizing eitherdomestic investment in capacity (because it brings in more FDI) or FDI(because it helps domestic investment in capacity and growth)?
A cautionary word based on the Irish case is in order. One can argue,convincingly, that the heavy subsidization of FDI inflows in Ireland in thepast two decades resulted in impressive GDP growth rates but with lesspronounced effect on the well-being of Irish residents, as crudely measuredby the Irish gross national product growth rates. Thus, gains to the host
The Contribution of FDI Flows to Domestic Investment in Capacity 163
country are not fully captured by the increase in domestic investment in ca-pacity, to which FDI inflows give rise.
Appendix A
List of Sixty-Four Countries in HRS Estimation
Algeria Costa Rica Korea, Republic of RwandaArgentina Côte d’Ivoire Lesotho SenegalBangladesh Dominica Malawi Sierra LeoneBelize Ecuador Malaysia South AfricaBenin Egypt, Arab Republic of Mali Sri LankaBolivia Gabon Mauritania St. Vincent and the Botswana The Gambia Mauritius GrenadinesBrazil Ghana Mexico SwazilandBurkina Faso Grenada Morocco Syrian Arab RepublicBurundi Guatemala Nepal ThailandCameroon Guyana Niger TogoCentral African India Nigeria Trinidad and Tobago
Republic Indonesia Pakistan TunisiaChad Israel Papua New Guinea UruguayChile Jamaica Peru ZambiaColombia Jordan The Philippines ZimbabweCongo, Republic of the Kenya
Sources of Data
The principal source of data is the World Bank WDI 2000 CD-ROM.Capital control data were taken from IMF publications.A few missing data items regarding loans for Israel were taken from the
Bank of Israel resources.
Appendix B
Definitions of Series
Terms of trade: (DTT) adjustment (constant LCU) (NY.TTF.GNFS.KN).The terms-of-trade effect equals capacity to import less exports of goodsand services in constant prices. Data are in constant local currency. Thechange is calculated as the difference from one year to the other.
Public spending on education: (ED3), total (% of GNP, UNESCO)(SE.XPD.TOTL.GN.ZS). Public expenditure on education (total) is thepercentage of GNP accounted for by public spending on public educationplus subsidies to private education at the primary, secondary, and tertiarylevels. For more information, see WDI table 2.9.
164 Assaf Razin

GDP per capita: (CY), PPP (current international $) (NY.GDP.PCAP.PP.CD). GDP per capita based on purchasing power parity (PPP). GDPPPP is gross domestic product converted to international dollars usingPPP rates. An international dollar has the same purchasing power overGDP as the U.S. dollar in the United States. Data are in current interna-tional dollars. For more information, see WDI tables 1.1, 4.11, and 4.12.For the estimation we used the logarithm of CY.
Foreign direct investment: (FDI), net inflows (% of GDP) (BX.KLT.DINV.DT.GD.ZS). Foreign direct investment is net inflows of investmentto acquire a lasting management interest (10 percent or more of votingstock) in an enterprise operating in an economy other than that of the in-vestor. It is the sum of equity capital, reinvestment of earnings, other long-term capital, and short-term capital as shown in the balance of payments.For more information, see WDI table 5.1.
General government consumption: (G ) (% of GDP) (NE.CON.GOVT.ZS). General government consumption includes all current spending forpurchases of goods and services (including wages and salaries). It also in-cludes most expenditures on national defense and security but excludesgovernment military expenditures that are part of government capital for-mation. For more information, see WDI table 4.9.
Gross domestic investment: (I ) (% of GDP) (NE.GDI.TOTL.ZS). Grossdomestic investment consists of outlays on additions to the fixed assets ofthe economy plus net changes in the level of inventories. Fixed assets in-clude land improvements (fences, ditches, drains, and so on); plant, ma-chinery, and equipment purchases; and the construction of roads, railways,and the like, including commercial and industrial buildings, offices,schools, hospitals, and private residential dwellings. Inventories are stocksof goods held by firms to meet temporary or unexpected fluctuations inproduction or sales. For more information, see WDI tables 1.4 and 4.9.
GDP growth: (DY) (annual %) (NY.GDP.MKTP.KD.ZG). Annual per-centage growth rate of GDP at market prices based on constant local cur-rency. Aggregates are based on constant 1995 U.S. dollars. For more infor-mation, see WDI tables 4.1 and 4.2.
Portfolio investment: (P), excluding LCFAR (BoP, current US$) (BN.KLT.PTXL.CD). Portfolio investment excluding liabilities constitutingforeign authorities’ reserves covers transactions in equity securities anddebt securities. Data are in current U.S. dollars. This series was divided inthe matching GDP to get the portfolio investment as a share of GDP.
Bank and trade-trade lending: (L) (PPG � PNG) (NFL, current US$)(DT.NFL.PCBO.CD). Bank and trade-related lending covers commercialbank lending and other private credits. Data are in current U.S. dollars. Formore information, see WDI table 6.7. This series was divided in the match-ing GDP to get the loans flows as a share of GDP.
Total financial flows: (TLY64F) is the sum of FDI, total portfolio flows
The Contribution of FDI Flows to Domestic Investment in Capacity 165

(PLY64), and total loans (OLY64), where flows are divided by GDP. Datainclude sixty-four developing countries.
Capital controls: Data on capital controls for all IMF member coun-tries, years 1966–97. Dummy takes the value 1 when a restriction is inplace, and 0 otherwise.
1. Multiple exchange rates (Res1)2. Restrictions on current account transactions (Res2)3. Restrictions on capital account transactions (Res3)4. Surrender of export proceeds (Res4)
References
Albuquerque, Rui. 2003. The composition of capital flows: Risk sharing throughforeign direct investment. Journal of International Economics 61:353–83.
Blomström, Magnus, Ari Kokko, and Steven Globerman. 2001. The determinantsof host country spillovers from foreign direct investment: A review and synthe-sis of the literature. In Inward investment, technological change and growth: Theimpact of multinational corporations on the U.K. economy, ed. N. Pain, 34–65.New York: Palgrave Press.
Borensztein, Eduardo, Jose De Gregorio, and Jong-Wha Lee. 1998. How does foreigndirect investment affect growth? Journal of International Economics 45:115–35.
Bosworth, Barry P., and Susan M. Collins. 1999. Capital flows to developingeconomies: Implications for saving and investment. Brookings Papers on Eco-nomic Activity, Issue no. 1:143–69.
Caves, Richard E. 1971. International corporations: The industrial economics offoreign investment. Economica 38:1–27.
Froot, Kenneth A. 1991. Japanese foreign direct investment. In US-Japan economicforum, ed. Martin Feldstein and Yoshi Kosai. Cambridge, Mass.: National Bu-reau of Economic Research and Japan Center for Economic Growth.
Hart, Oliver. 2000. Financial contracting. Journal of Economic Literature 39 (4):1079–110.
Hecht, Joel, Assaf Razin, and Nitsan Shinar. 2003. Interactions between capitalflows and investment. Foreign Exchange Activity Department working paper.Jerusalem: Bank of Israel, February.
Helpman, Elhanan. 1984. A simple theory of international trade with multina-tional corporations. Journal of Political Economy 92:451–71.
Kindleberger, Charles P. 1969. American business abroad: Six lectures on direct in-vestment. New Haven, Conn.: Yale University Press.
Loungani, Prakash, and Assaf Razin. 2001. How beneficial is foreign direct invest-ment for developing countries? Finance and Development 38 (2): 6–10.
Mody, Ashoka, Assaf Razin, and Efraim Sadka. 2002. The role of information indriving FDI: Theory and evidence. NBER Working Paper no. 9255. Cambridge,Mass.: National Bureau of Economic Research.
Razin, Assaf, and Efraim Sadka. 2002. Labor, capital, and finance: Internationalflows. New York: Cambridge University Press.
———. 2003. Gains from FDI inflows with incomplete information. EconomicsLetters 78 (1): 71–77.
166 Assaf Razin

Razin, Assaf, Yona Rubinstein, and Efraim Sadka. 2003. Which countries exportFDI, and how much. NBER Working Paper no. 10145. Cambridge, Mass.: Na-tional Bureau of Economic Research.
Comment Kyoji Fukao
Assaf Razin’s paper proposes an interesting new theory of foreign direct in-vestment (FDI). The new theory is based on the following two assump-tions:
1. Some foreign investors can get information on the optimal invest-ment level of local firms at a lower fixed cost than firms in the host country.
2. A potential buyer needs to acquire the local firm in order to apply itstechnology.
According to Razin, FDI is the result of informational advantages offoreign firms. In contrast with this, the standard theory regards FDI as in-ternational movements of intangible assets, such as the stock of techno-logical knowledge or marketing know-how.1 Foreign firms conduct directinvestment because they can carry out production at a lower cost or havebetter marketing skills. Since international mergers and acquisitions(M&As) have increased substantially in the last decade and asymmetric in-formation issues seem to play an important role in M&A processes, Razin’snew theory is very timely and provides a useful contribution to the studyon international M&As.
I have three comments. My first comment is on the applicability of thenew theory to “green field” investments. Although cross-border M&Ashave rapidly increased especially in the case of FDI among developedeconomies, the majority of direct investments into developing economiesare still of the “green field” type. Table 5C.1 shows the share of M&A-typeinvestments in total FDI flows in each region during the period from 1997to 1999. According to this table, in the case of FDI inflows into developingAsia, only 21 percent of total FDI consisted of M&As. In Razin’s paper thenew theory is applied to the empirical study based on data of total FDIflows. I think that the author had better elaborate on the applicability of hisnew theory to green field investments.
My second comment concerns the identification problem. In the empir-ical part of the paper, the author provides several interesting pieces of evi-
The Contribution of FDI Flows to Domestic Investment in Capacity 167
Kyoji Fukao is professor of economics at the Institute of Economic Research, HitotsubashiUniversity, and a fellow at the Research Institute of Economy, Trade and Industry.
1. On the standard theory of FDI, see Caves (1982) and Dunning (1977).

dence that are consistent with the prediction of the theory: Compared withportfolio investment, inward FDI has a larger positive effect on domesticinvestment and economic growth in the host country. Although such find-ings are interesting, the “evidence” provided does not prove the validity ofthe new theory since we can also explain these phenomena using the stan-dard theory. According to the standard theory, FDI will increase the stockof intangible assets, such as technological knowledge or marketing know-how in the host country, which will enhance domestic investment and eco-nomic growth. I hope that in future the author provides us with some newimplications and tests by which we can empirically distinguish the new the-ory from the standard theory.
My last comment is on the relationship between a parent company andits affiliates abroad. In East Asian manufacturing industry, there exist closelinkages and coordination between parents and their affiliates. Productionprocesses are commonly fragmented within an enterprise group, and un-skilled labor–intensive processes are located in developing countries suchas China.2 Multinationals engage in FDI in developing East Asia not tomake profits from their superior knowledge on investment timing but to es-tablish efficient global production networks by combining their advancedtechnologies with developing countries’ cheap labor.
To sum up my comments, Razin’s paper gives us important new insightson FDI, especially on M&As, but it seems that we cannot directly apply histheory to efficiency-seeking green field–type FDI in manufacturing indus-tries, which is the dominant form of FDI in East Asia.
References
Caves, Richard E. 1982. Multinational enterprise and economic analysis. Cam-bridge, U.K.: Cambridge University Press.
Dunning, John H. 1977. Trade, location of economic activity, and the multi-national enterprise: A search for an eclectic approach. In The international allo-
168 Assaf Razin
Table 5C.1 Cross-Border M&As as a Percentage of FDI Inflows, 1997–99
%
United States 78Western Europe 79Latin America 59Central and Eastern Europe 34Developing Asia 21Developing countries total 30
Source: UNCTAD, World Investment Report 2000, 2000.
2. On Japanese firms’ intra–firm-group fragmentation of production processes, see Kimura(2001).

cation of economic activity, ed. B. Ohlin, P. O. Hesselborn, and P. M. Wijkman,395–418. London: Macmillan.
Kimura, Fukunari. 2001. Fragmentation, internalization, and inter-firm linkages:Evidence from the micro data of Japanese manufacturing firms. In Global pro-duction and trade in East Asia, ed. Leonard K. Cheng and Henryk Kiezkowski,129–52. Boston: Kluwer Academic.
Comment Dean Parham
Assaf Razin’s paper is now rather different from the one he presented atEASE-13. I have adapted my comments by generalizing my original re-marks and adding a few more that are specifically directed at the paper asit now stands. My remarks have been informed in part by material pro-vided in a recent study of foreign direct investment by the ProductivityCommission (2002).
Foreign direct investment (FDI) is an important issue. It has been grow-ing faster than world GDP, especially since the late 1990s (fig. 5C.1). Theauthor’s work investigates “commercial” motivations for FDI, which arebecoming more important in a world of fewer barriers to investment flowsand growing maturity of financial markets and institutions. The relativeimportance of commercial motives was illustrated in a recent survey ofAustralian firms engaging in outward FDI (figs. 5C.2 and 5C.3).
The paper also distinguishes between FDI, portfolio investment, andloans. It recognizes that free-rider problems induce different behavior onthe part of FDI and portfolio investors. Foreign direct investment is seento promote growth through a higher amount and more efficient allocationof investment. Some prima facie support for this proposition lies in the im-provement (or lessened deterioration) in capital productivity growth inAustralia that has coincided with increased inward FDI in the 1980s and1990s (fig. 5C.4).
The examination of FDI, portfolio, and loan flows and their effects ondomestic investment flows—all in a simultaneous framework—is the mainnovel feature of the paper. I will make a few comments about the theoreti-cal motivation in the paper before looking at the empirical results.
Theoretical Motivation
Necessary preconditions for FDI are commonly thought to include thefollowing factors:
• The foreign firm has some firm-specific assets (e.g., proprietary tech-nology, know-how) that it wishes to use to advantage.
The Contribution of FDI Flows to Domestic Investment in Capacity 169
Dean Parham is assistant commissioner at the Productivity Commission, Australia.

• There are net locational advantages for the foreign firm in the hostcountry (e.g., access to large markets, lower costs).1
• There are advantages in internalizing operations (through a branchoperation) rather than relying on markets to exchange goods and ser-vices between foreign and local firms. For example, there may be diffi-culties in specifying requirements between foreign and local firms bymeans of contracts—a problem that may be intensified with thegrowth in “knowledge-intensive” production processes.
170 Assaf Razin
Fig. 5C.1 Global trends in outward FDI flows and GDP (index 1995 � 100)Source: Productivity Commission (2002).
1. Advantages, such as lower transportation costs, need to outweigh disadvantages of per-haps less local knowledge, and so on.
Fig. 5C.2 Commercial motives for offshore productionSource: Productivity Commission (2002).

The paper identifies an advantage to the foreign firm in the form of su-perior micromanagement. This most clearly fits with the first of the afore-mentioned motivations. But it has more to do with management skill thanproprietary technology. It confers an advantage on FDI that is not avail-able to portfolio investment.
The theoretical specification appears to invoke some simplifications.The foreign-firm advantage, in the form of better micromanagement, canbe available to all foreign firms. Foreign firms are able to compete away thegains from their advantage. But the advantage is available to no domesticfirm. This seems to require a production factor that can jump everywhere,except over country borders (or, more specifically, the border to the onecountry considered as a target).
Domestic firms appear to be homogeneous with respect to productivityperformance (and inferior management). In practice, foreign firms arelikely to decide on
• whether to establish a local branch presence (with brand name) or takeover a local firm; and,
• if they decide on a takeover, whether to take over high-performing orunderperforming firms, depending on expectations of productivity (orprofit) growth across the range of firms.
The foreign-firm advantage can be competed away and captured by thedomestic economy in the form of higher takeover prices. The advantage offoreigners is reflected in bid prices. If the advantage is not firm specific, for-eign firms would have to build expectations about other foreign firms’ bidsinto their own bids. This is where the competition appears to take place—in the bids. With perfect competition between foreign FDI bidders, the
The Contribution of FDI Flows to Domestic Investment in Capacity 171
Fig. 5C.3 Government influences on offshore productionSource: Productivity Commission (2002).
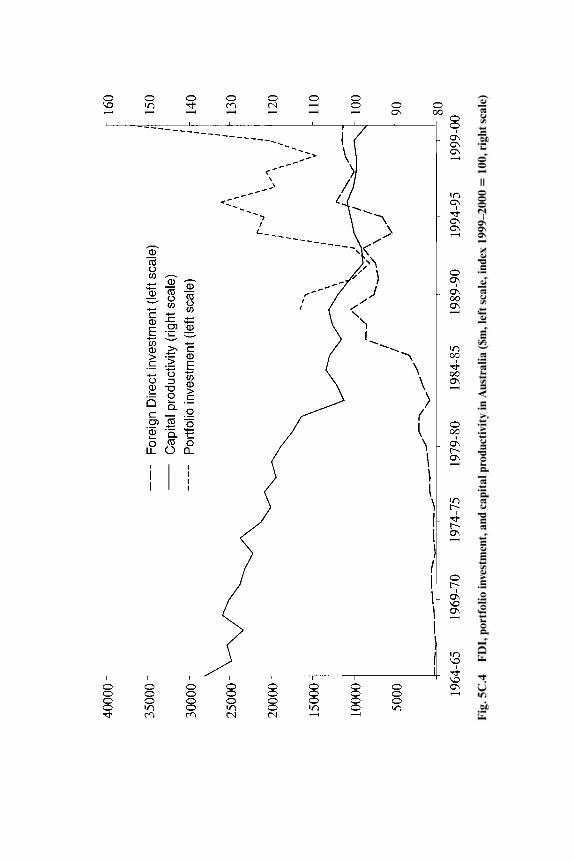
Fig
. 5C
.4F
DI,
por
tfol
io in
vest
men
t, a
nd c
apit
al p
rodu
ctiv
ity
in A
ustr
alia
($m
, lef
t sca
le, i
ndex
199
9–20
00 �
100,
rig
ht s
cale
)
gains from the management advantage are fully transferred to the domes-tic economy.
A richer model might involve foreign firms with firm-specific advan-tages, such as proprietary technology, seeking out a suitable target from lo-cal firms with a range of productivity or profit performances, and choos-ing one that is expected to deliver the strongest productivity or profitgrowth. If the extent of the “advantage” is specific to the combination ofdomestic firm and foreign firm, the takeover could include an underper-forming domestic firm. The foreign firm would also get a semipermanentadvantage that could not be competed away by other foreign or domesticfirms and not necessarily “the cream.” They would still “add cream” to thelocal economy because they bring technology and raise performance.
Finally, the model seems to predict a level effect on investment, efficiency,and GDP as foreign firms exploit the extent of their advantage. Canadianevidence, at least, tends to suggest that inward FDI has important growtheffects (Baldwin and Dhaliwal 2001).
Empirical Results
One general comment—and this is probably common to a lot of work inthis area—is that there does not seem to be a tight nexus between the the-ory and the empirics. Perhaps I missed something, but it is not immediatelyobvious to me how the empirical model necessarily provides a test of themicromanagement advantage of foreign firms. I wonder whether other ad-vantages (such as proprietary technology) and motivations could be con-sistent with the empirical model used.
As noted, the capital flows are analyzed in a simultaneous framework. Akey finding is the confirmation that these flows have positive effects on do-mestic investment. Long-run effects from two-stage least squares estima-tion put the FDI effect (0.68) at double the loan effect (0.35) with the port-folio effect (0.53) in between. Compared with the Bosworth and Collins(1999) results, the FDI effect is a little weaker, the portfolio effect is muchstronger (there is no discernible effect in Bosworth and Collins), and theloan effect is a little stronger. Some further exploration of the reasons forthese differences—be they in the simultaneous specification (Bosworthand Collins found the different types of flows to be unrelated) or equationspecification or other reasons—might help interpretation.
It is also interesting to note that the different types of capital flows areall found to have positive effects on growth. As might be expected, FDI isfound to have a stronger effect.
References
Baldwin, John R., and Naginder Dhaliwal. 2001. Heterogeneity in labour produc-tivity growth in manufacturing: Differences between domestic and foreign-
The Contribution of FDI Flows to Domestic Investment in Capacity 173

controlled establishments. In Productivity growth in Canada, 61–75. Ottawa: Sta-tistics Canada.
Bosworth, Barry P., and Susan M. Collins. 1999. Capital flows to developingeconomies: Implications for saving and investment. Brookings Papers on Eco-nomic Activity, Issue no. 1:143–69.
Productivity Commission. 2002. Offshore investment by Australian firms: Surveyevidence. Commission Research Paper. Canberra, Australia: AusInfo.
174 Assaf Razin

IIMicro Productivity