Embed Size (px)
Citation preview
1February 5th, 2013
Localiza Rent a Car S.A.4Q12 and 2012 results
R$ million, IFRS
4Q11 4Q12
2
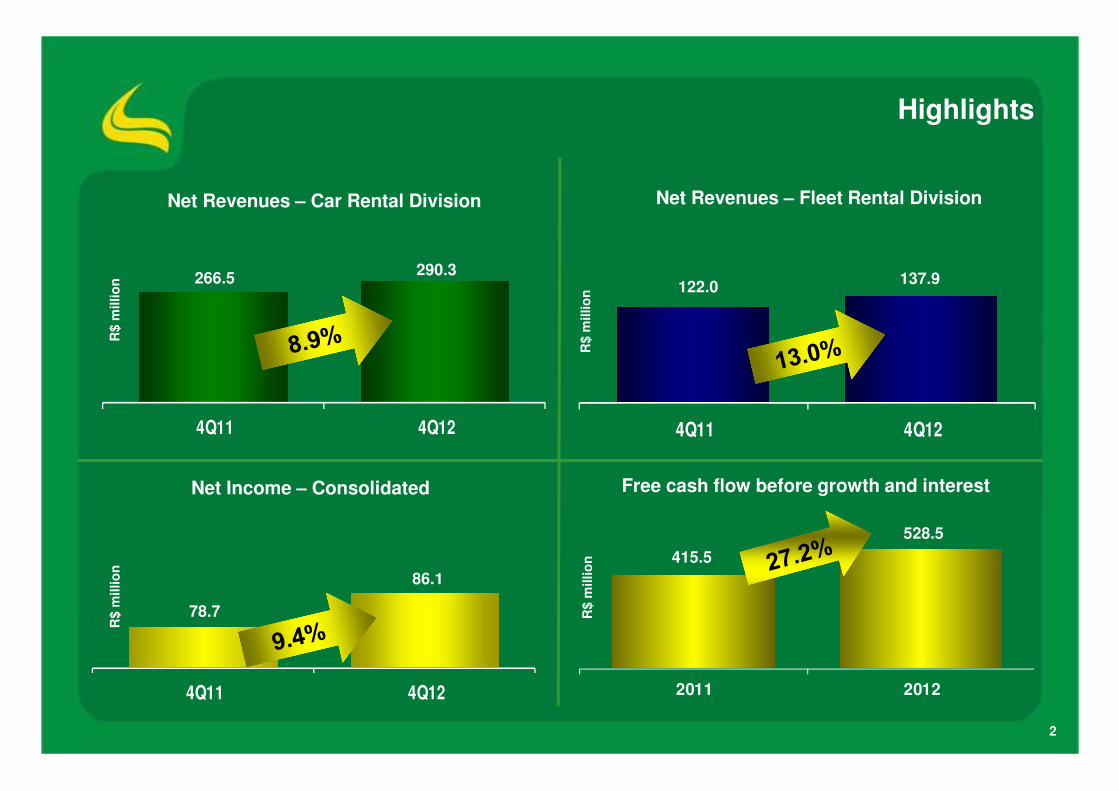
Net Revenues – Car Rental Division
R$ m
illio
n
Net Revenues – Fleet Rental Division
R$ m
illio
n
Net Income – Consolidated
Highlights R
$ m
illio
n
Free cash flow before growth and interest
4Q11 4Q12
266.5290.3
122.0137.9
4Q11 4Q12
78.7
86.1
2011 2012
R$ m
illio
n 415.5
528.5
3
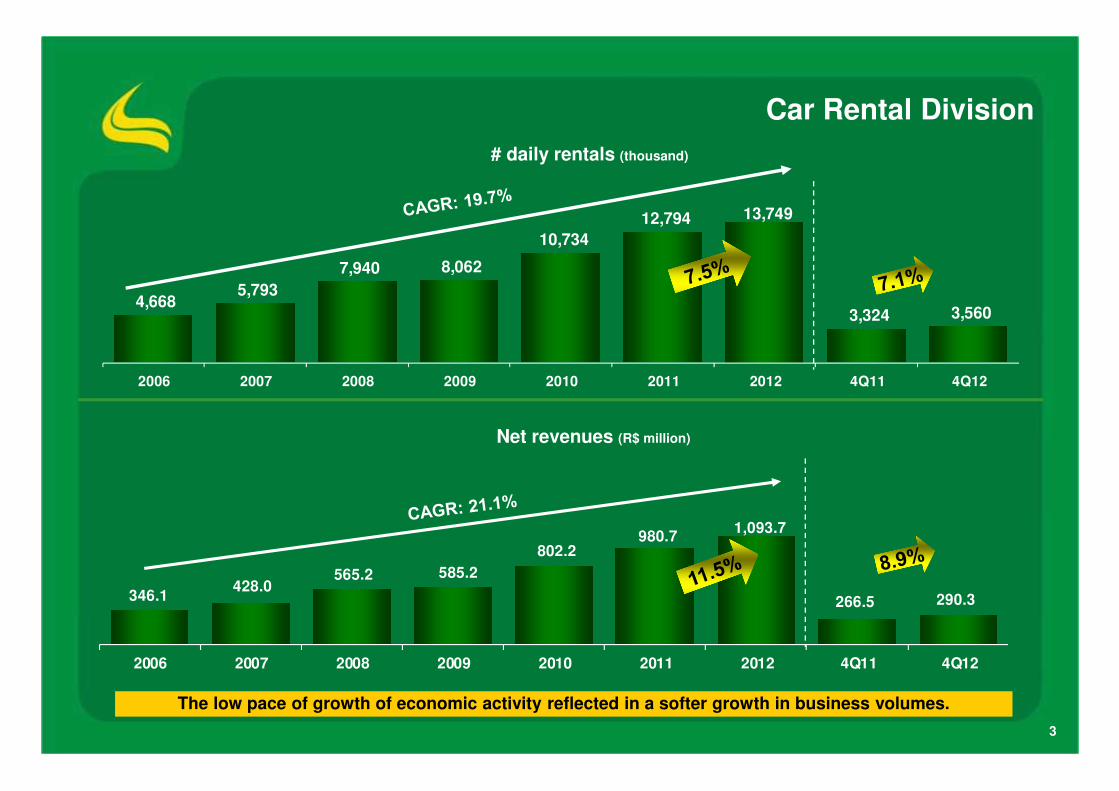
Net revenues (R$ million)
# daily rentals (thousand)
Car Rental Division
The low pace of growth of economic activity reflected in a softer growth in business volumes.
4,668 5,793
7,940 8,062
10,734
12,794 13,749
3,324 3,560
2006 2007 2008 2009 2010 2011 2012 4Q11 4Q12
346.1428.0
565.2 585.2
802.2980.7
1,093.7
266.5 290.3
2006 2007 2008 2009 2010 2011 2012 4Q11 4Q12
4
Fly and Drive
5
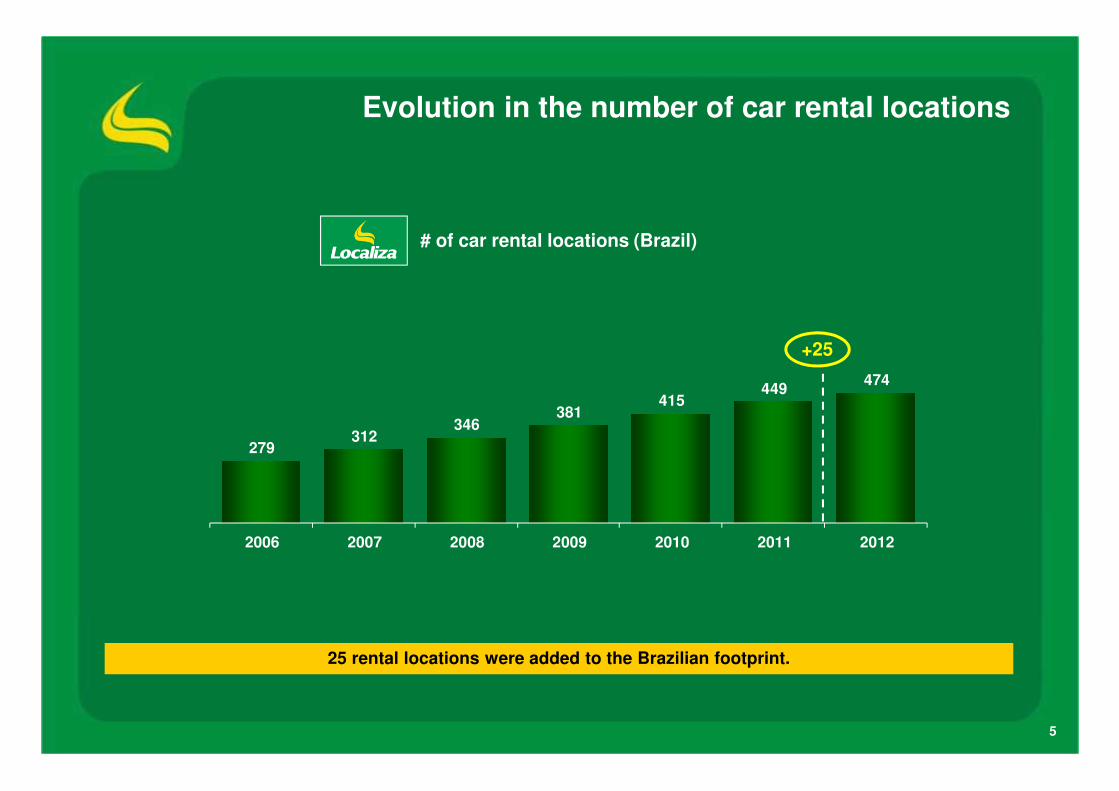
Evolution in the number of car rental locations
25 rental locations were added to the Brazilian footprint.
# of car rental locations (Brazil)
279312
346381
415449
474
2006 2007 2008 2009 2010 2011 2012
+25
6
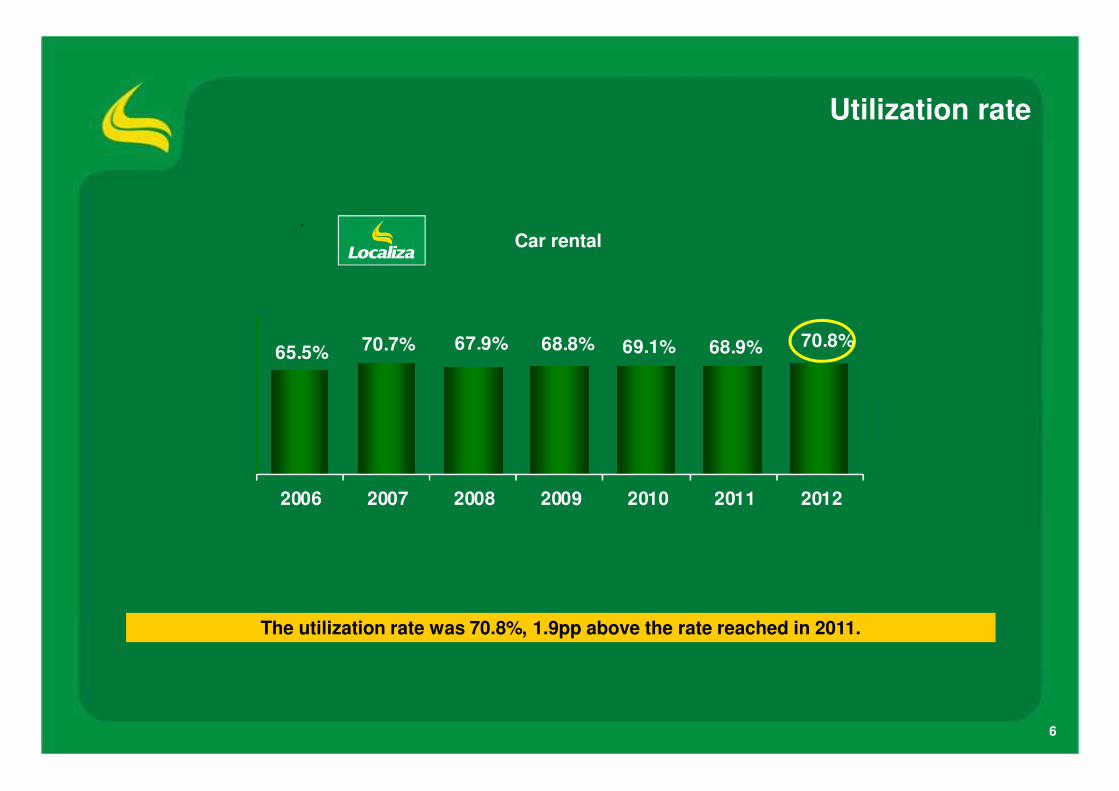
Utilization rate
The utilization rate was 70.8%, 1.9pp above the rate reached in 2011.
Car rental
65.5% 70.7% 67.9% 68.8% 69.1% 68.9% 70.8%
0 .0 %
5 .0 %
1 0. 0 %
1 5. 0 %
2 0. 0 %
2 5. 0 %
3 0. 0 %
3 5. 0 %
4 0. 0 %
4 5. 0 %
5 0. 0 %
5 5. 0 %
6 0. 0 %
6 5. 0 %
7 0. 0 %
7 5. 0 %
8 0. 0 %
8 5. 0 %
9 0. 0 %
9 5. 0 %
1 00 . 0%
2006 2007 2008 2009 2010 2011 2012
7
Net revenues (R$ million)
# daily rentals (thousand)
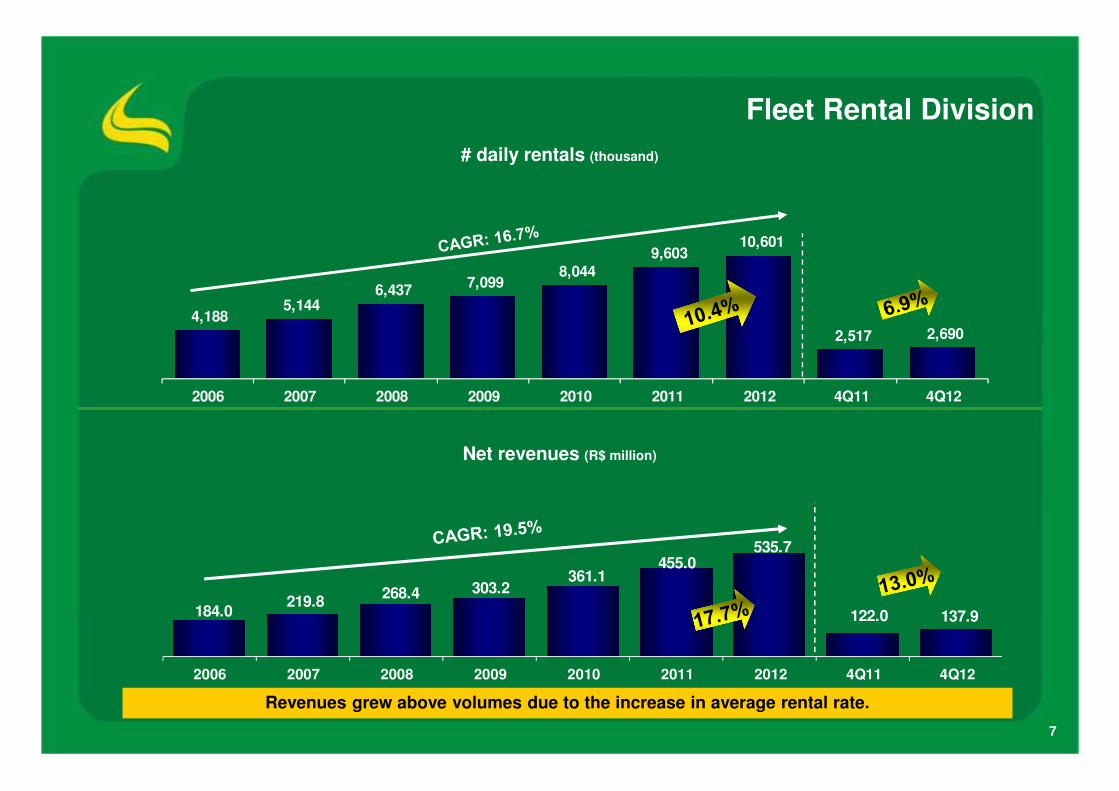
Fleet Rental Division
Revenues grew above volumes due to the increase in average rental rate.
4,188 5,144
6,437 7,099
8,044 9,603
10,601
2,517 2,690
2006 2007 2008 2009 2010 2011 2012 4Q11 4Q12
184.0 219.8
268.4 303.2 361.1
455.0 535.7
122.0 137.9
2006 2007 2008 2009 2010 2011 2012 4Q11 4Q12
8
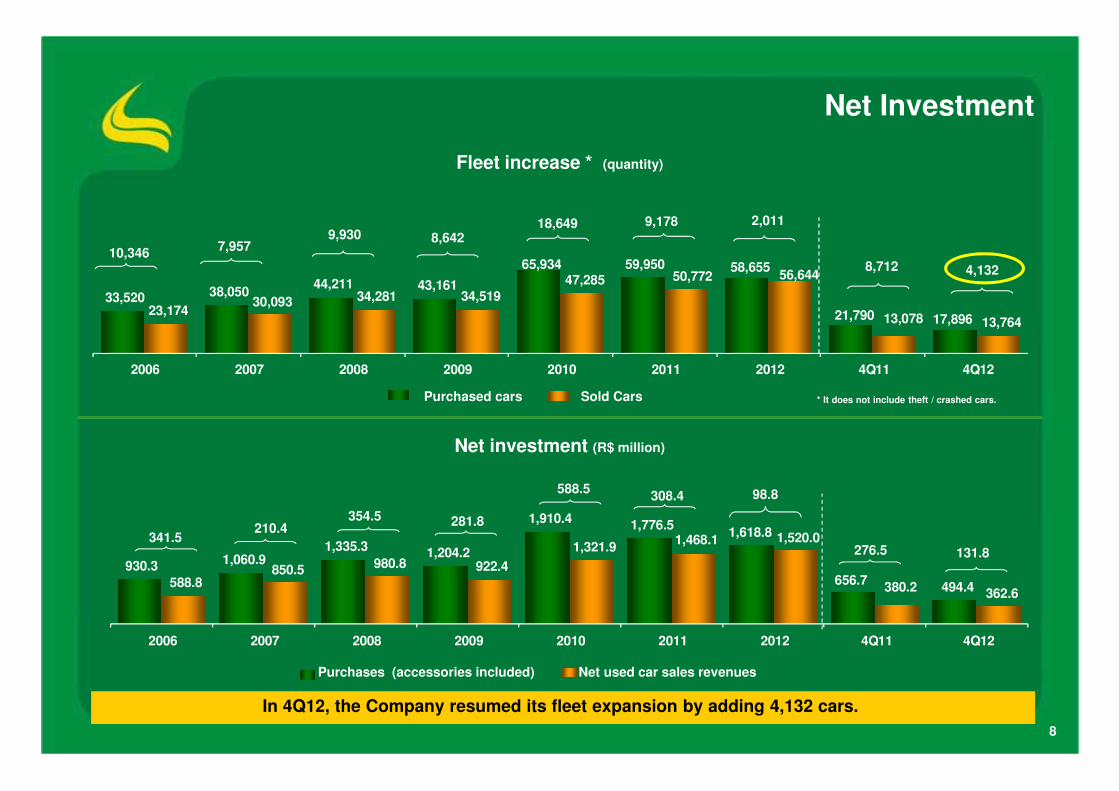
Net Investment
In 4Q12, the Company resumed its fleet expansion by adding 4,132 cars.
Fleet increase * (quantity)
33,520 38,050 44,211 43,161
65,934 59,950 58,655
21,790 17,896 23,174
30,093 34,281 34,519
47,285 50,772 56,644
13,078 13,764
2006 2007 2008 2009 2010 2011 2012 4Q11 4Q12
10,3467,957
9,930 8,642
Purchased cars Sold Cars
9,178 2,011
8,712 4,132
18,649
* It does not include theft / crashed cars.
Net investment (R$ million)
930.3 1,060.9 1,335.3 1,204.2
1,910.4 1,776.5
1,618.8
656.7 494.4 588.8
850.5 980.8 922.4
1,321.9 1,468.1 1,520.0
380.2 362.6
2006 2007 2008 2009 2010 2011 2012 4Q11 4Q12
Purchases (accessories included) Net used car sales revenues
341.5210.4
308.4 98.8
354.5 281.8
588.5
276.5 131.8
9
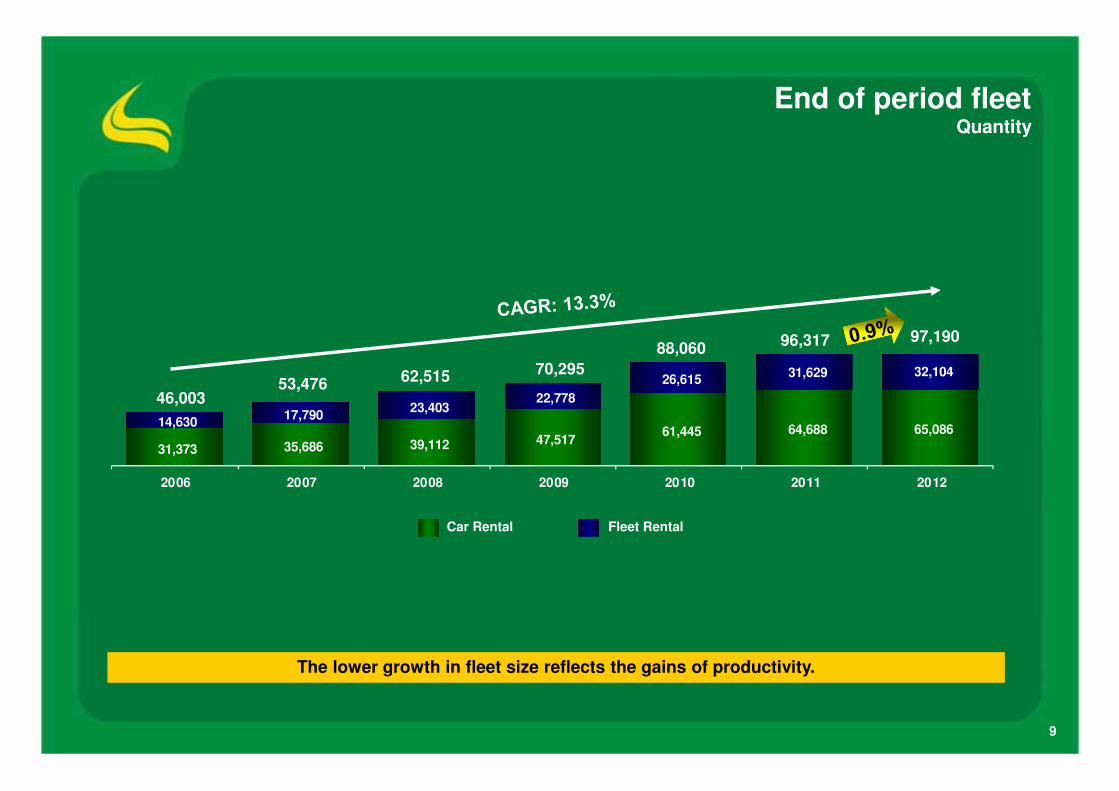
End of period fleetQuantity
The lower growth in fleet size reflects the gains of productivity.
31,373 35,686 39,112 47,517 61,445 64,688 65,086
14,630 17,790
23,403 22,778
26,615 31,629 32,104
2006 2007 2008 2009 2010 2011 2012
46,00353,476
Car Rental Fleet Rental
62,515 70,295
97,19096,31788,060
10
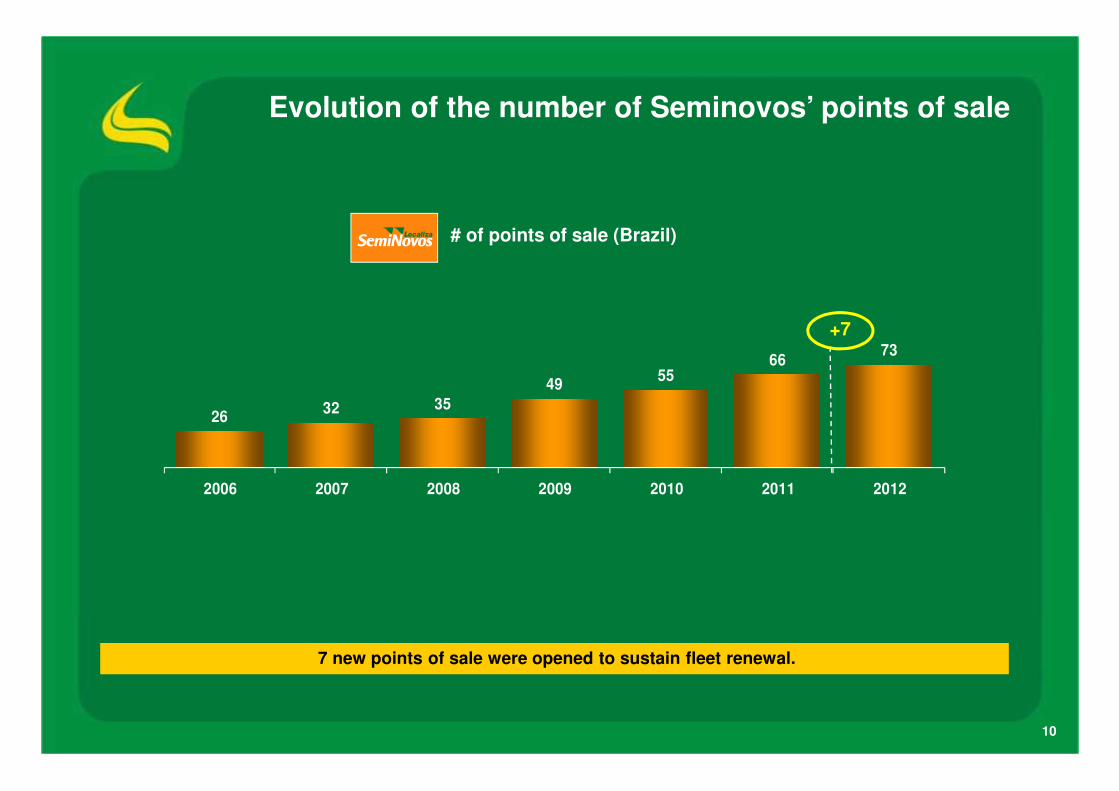
Evolution of the number of Seminovos’ points of sale
7 new points of sale were opened to sustain fleet renewal.
# of points of sale (Brazil)
2632 35
4955
6673
2006 2007 2008 2009 2010 2011 2012
+7
11
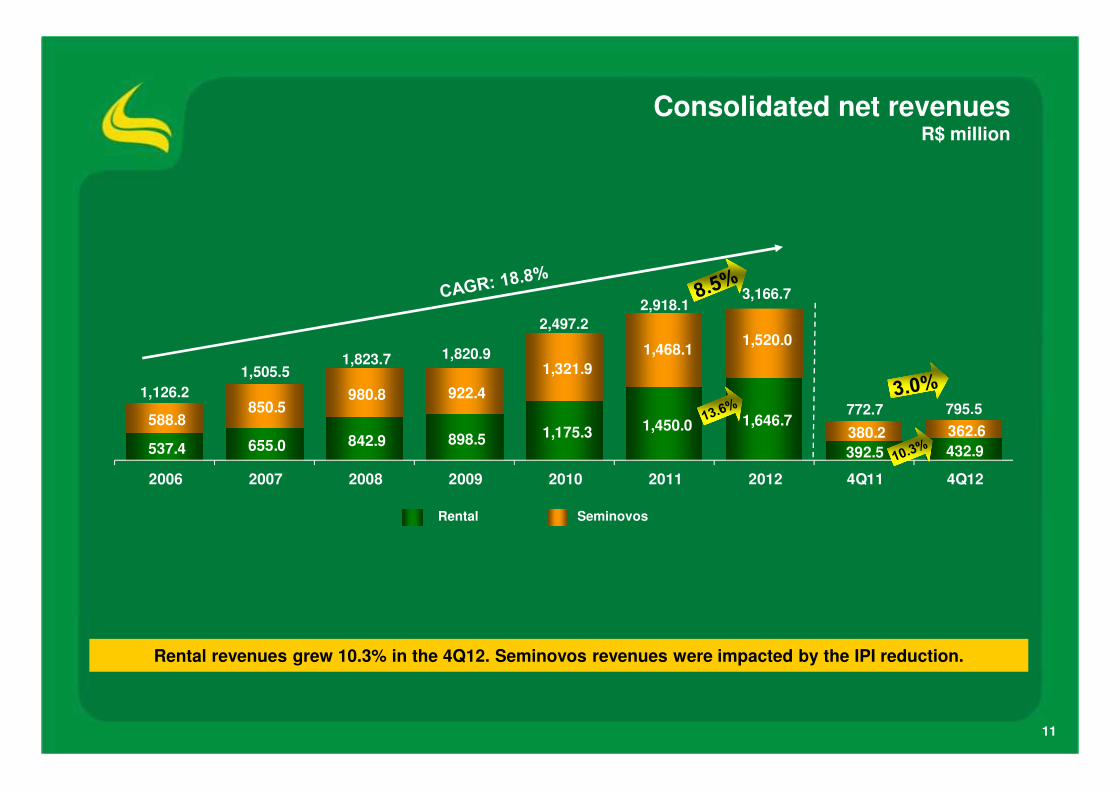
Consolidated net revenuesR$ million
Rental revenues grew 10.3% in the 4Q12. Seminovos revenues were impacted by the IPI reduction.
Rental Seminovos
537.4 655.0 842.9 898.5 1,175.3 1,450.0 1,646.7
392.5 432.9
588.8 850.5
980.8 922.4
1,321.9
1,468.1 1,520.0
380.2 362.6
2006 2007 2008 2009 2010 2011 2012 4Q11 4Q12
1,126.2
1,505.51,823.7
2,918.1
772.7 795.5
1,820.9
2,497.2
3,166.7
12
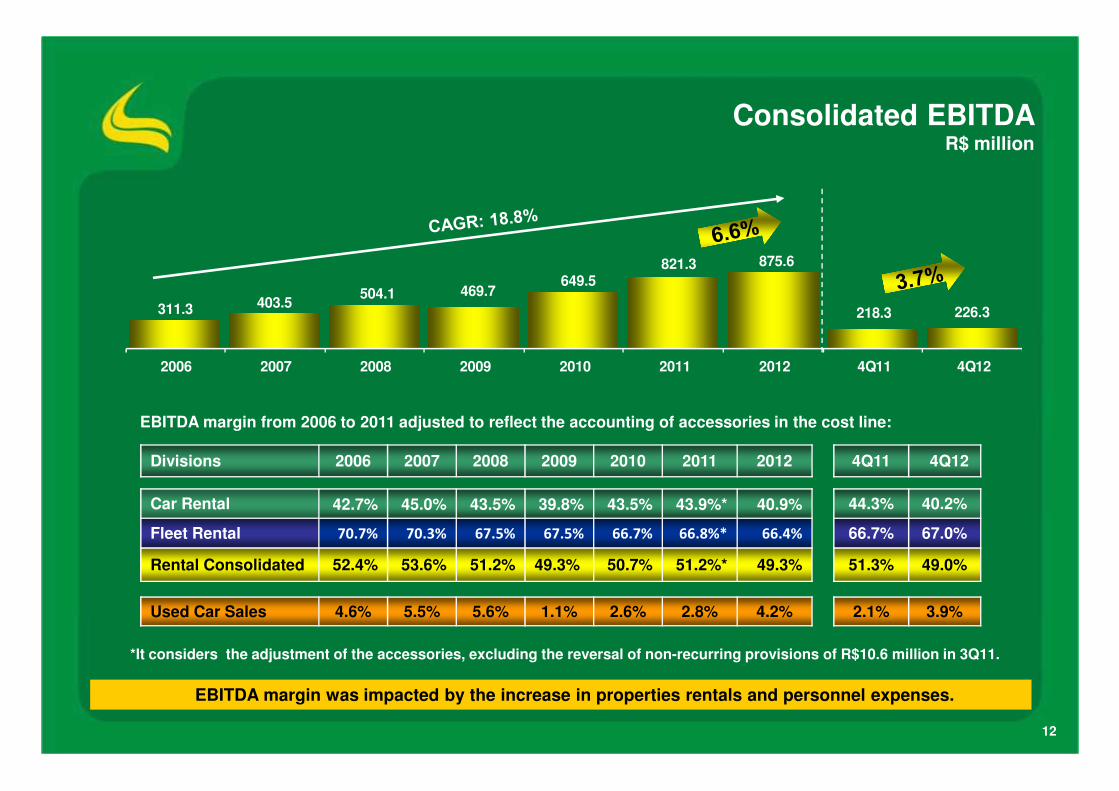
Consolidated EBITDA R$ million
EBITDA margin was impacted by the increase in properties rentals and personnel expenses.
Divisions 2006 2007 2008 2009 2010 2011 2012 4Q11 4Q12
Car Rental 42.7% 45.0% 43.5% 39.8% 43.5% 43.9%* 40.9% 44.3% 40.2%
Fleet Rental 70.7% 70.3% 67.5% 67.5% 66.7% 66.8%* 66.4% 66.7% 67.0%
Rental Consolidated 52.4% 53.6% 51.2% 49.3% 50.7% 51.2%* 49.3% 51.3% 49.0%
Used Car Sales 4.6% 5.5% 5.6% 1.1% 2.6% 2.8% 4.2% 2.1% 3.9%
311.3 403.5504.1 469.7
649.5821.3 875.6
218.3 226.3
2006 2007 2008 2009 2010 2011 2012 4Q11 4Q12
*It considers the adjustment of the accessories, excluding the reversal of non-recurring provisions of R$10.6 million in 3Q11.
EBITDA margin from 2006 to 2011 adjusted to reflect the accounting of accessories in the cost line:
13
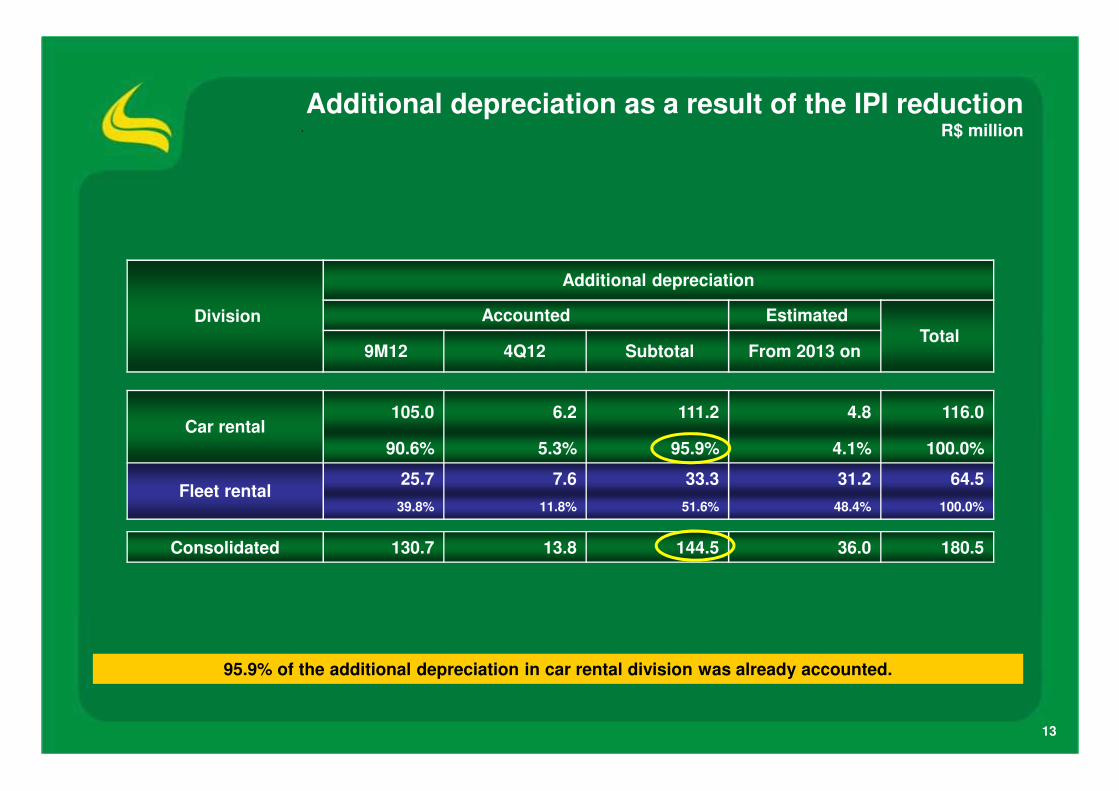
Additional depreciation as a result of the IPI reduction R$ million
Division
Additional depreciation
Accounted Estimated Total
9M12 4Q12 Subtotal From 2013 on
Car rental105.0 6.2 111.2 4.8 116.0
90.6% 5.3% 95.9% 4.1% 100.0%
Fleet rental 25.7 7.6 33.3 31.2 64.5
39.8% 11.8% 51.6% 48.4% 100.0%
Consolidated 130.7 13.8 144.5 36.0 180.5
95.9% of the additional depreciation in car rental division was already accounted.
14
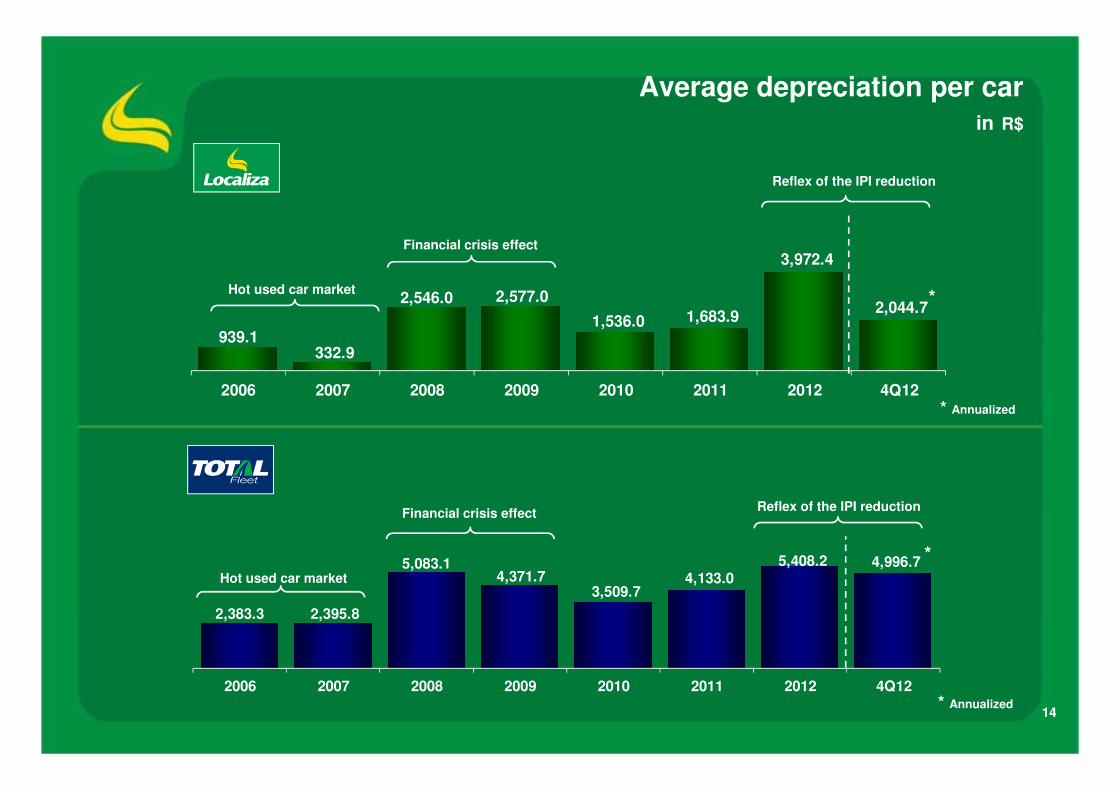
Average depreciation per carin R$
939.1 332.9
2,546.0 2,577.0
1,536.0 1,683.9
3,972.4
2,044.7
2006 2007 2008 2009 2010 2011 2012 4Q12* Annualized
*Hot used car market
Financial crisis effect
Reflex of the IPI reduction
2,383.3 2,395.8
5,083.1 4,371.7
3,509.7 4,133.0
5,408.2 4,996.7
2006 2007 2008 2009 2010 2011 2012 4Q12* Annualized
*Hot used car market
Financial crisis effectReflex of the IPI reduction
15
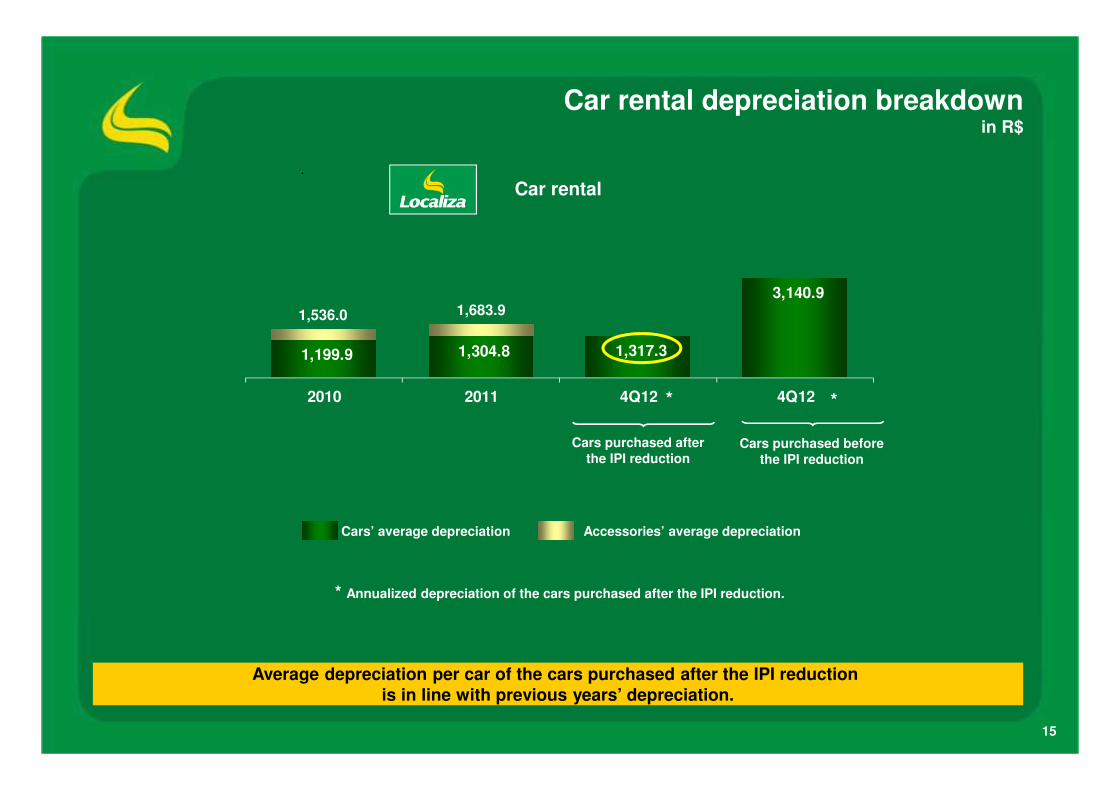
Car rental depreciation breakdown in R$
Car rental
* Annualized depreciation of the cars purchased after the IPI reduction.
Average depreciation per car of the cars purchased after the IPI reduction is in line with previous years’ depreciation.
1,199.9 1,304.8 1,317.3
3,140.9
2010 2011 4Q12 4Q12*
1,536.0 1,683.9
Cars’ average depreciation Accessories’ average depreciation
*
Cars purchased after the IPI reduction
Cars purchased before the IPI reduction
16
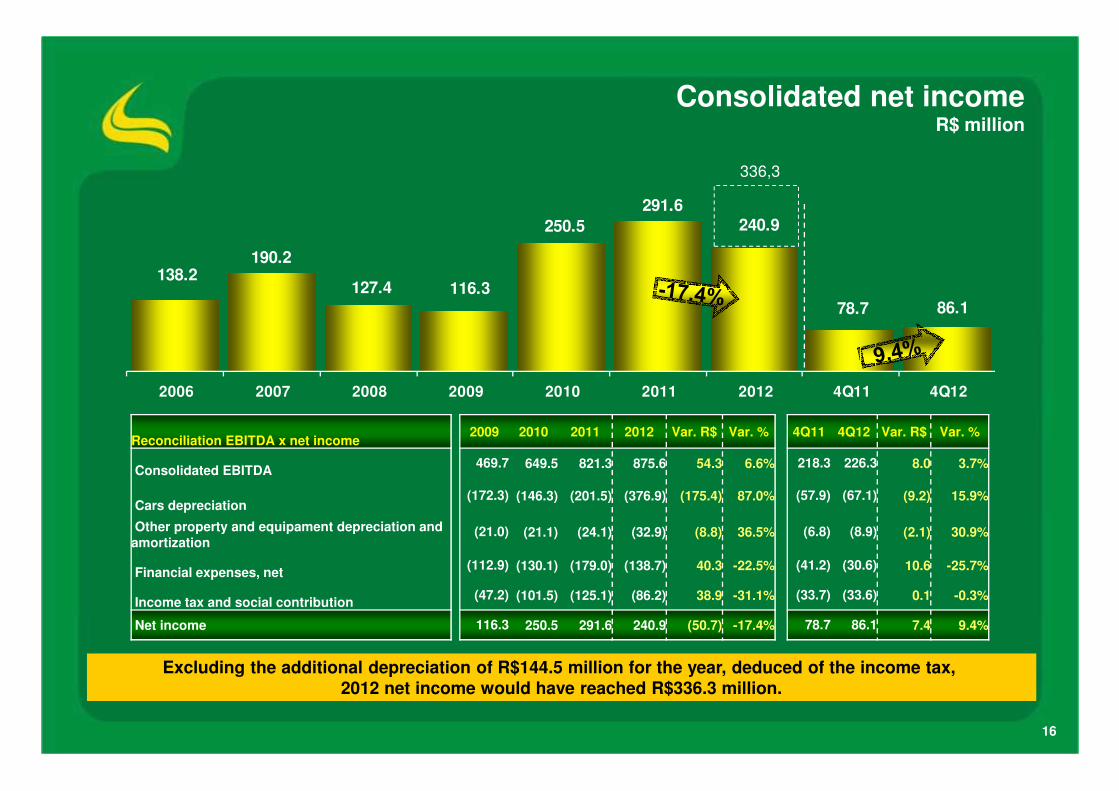
Consolidated net incomeR$ million
Excluding the additional depreciation of R$144.5 million for the year, deduced of the income tax, 2012 net income would have reached R$336.3 million.
Reconciliation EBITDA x net income2009 2010 2011 2012 Var. R$ Var. % 4Q11 4Q12 Var. R$ Var. %
Consolidated EBITDA469.7 649.5 821.3 875.6 54.3 6.6% 218.3 226.3 8.0 3.7%
Cars depreciation(172.3) (146.3) (201.5) (376.9) (175.4) 87.0% (57.9) (67.1) (9.2) 15.9%
Other property and equipament depreciation andamortization
(21.0) (21.1) (24.1) (32.9) (8.8) 36.5% (6.8) (8.9) (2.1) 30.9%
Financial expenses, net(112.9) (130.1) (179.0) (138.7) 40.3 -22.5% (41.2) (30.6) 10.6 -25.7%
Income tax and social contribution(47.2) (101.5) (125.1) (86.2) 38.9 -31.1% (33.7) (33.6) 0.1 -0.3%
Net income 116.3 250.5 291.6 240.9 (50.7) -17.4% 78.7 86.1 7.4 9.4%
138.2190.2
127.4 116.3
250.5
291.6240.9
78.7 86.1
2006 2007 2008 2009 2010 2011 2012 4Q11 4Q12
336,3
1717
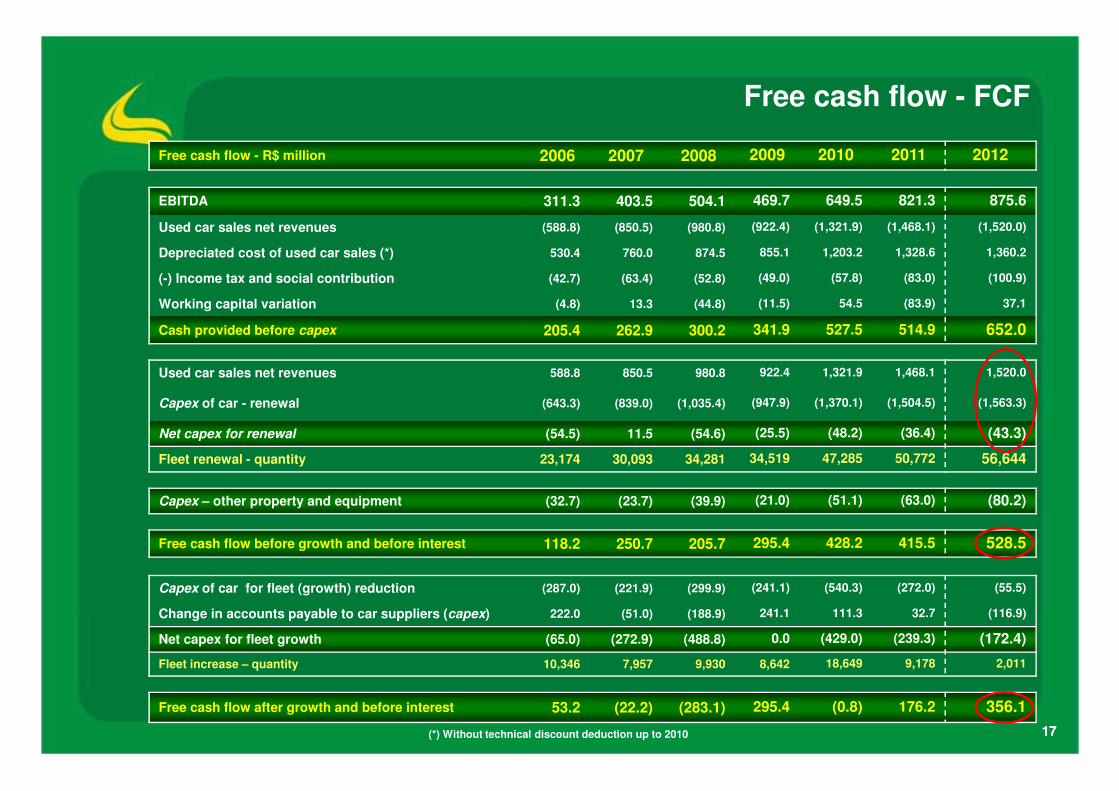
Free cash flow - FCF
(*) Without technical discount deduction up to 2010
Free cash flow - R$ million 2006 2007 2008 2009 2010 2011 2012
EBITDA 311.3 403.5 504.1 469.7 649.5 821.3 875.6
Used car sales net revenues (588.8) (850.5) (980.8) (922.4) (1,321.9) (1,468.1) (1,520.0)
Depreciated cost of used car sales (*) 530.4 760.0 874.5 855.1 1,203.2 1,328.6 1,360.2
(-) Income tax and social contribution (42.7) (63.4) (52.8) (49.0) (57.8) (83.0) (100.9)
Working capital variation (4.8) 13.3 (44.8) (11.5) 54.5 (83.9) 37.1
Cash provided before capex 205.4 262.9 300.2 341.9 527.5 514.9 652.0
Used car sales net revenues 588.8 850.5 980.8 922.4 1,321.9 1,468.1 1,520.0
Capex of car - renewal (643.3) (839.0) (1,035.4) (947.9) (1,370.1) (1,504.5) (1,563.3)
Net capex for renewal (54.5) 11.5 (54.6) (25.5) (48.2) (36.4) (43.3)
Fleet renewal - quantity 23,174 30,093 34,281 34,519 47,285 50,772 56,644
Capex – other property and equipment (32.7) (23.7) (39.9) (21.0) (51.1) (63.0) (80.2)
Free cash flow before growth and before interest 118.2 250.7 205.7 295.4 428.2 415.5 528.5
Capex of car for fleet (growth) reduction (287.0) (221.9) (299.9) (241.1) (540.3) (272.0) (55.5)
Change in accounts payable to car suppliers (capex) 222.0 (51.0) (188.9) 241.1 111.3 32.7 (116.9)
Net capex for fleet growth (65.0) (272.9) (488.8) 0.0 (429.0) (239.3) (172.4)
Fleet increase – quantity 10,346 7,957 9,930 8,642 18,649 9,178 2,011
Free cash flow after growth and before interest 53.2 (22.2) (283.1) 295.4 (0.8) 176.2 356.1
18
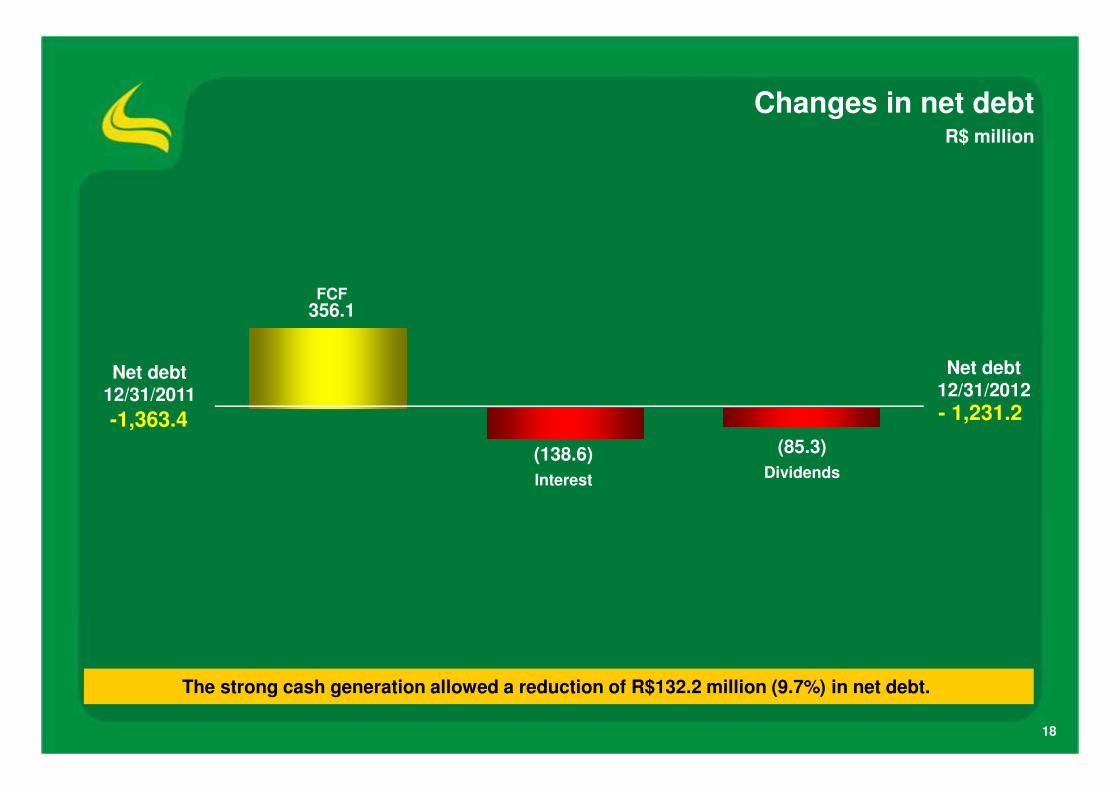
Changes in net debt R$ million
The strong cash generation allowed a reduction of R$132.2 million (9.7%) in net debt.
- 1,231.2
(138.6)
Interest
(85.3)
Dividends
Net debt 12/31/2012
FCF356.1
-1,363.4
Net debt12/31/2011
19
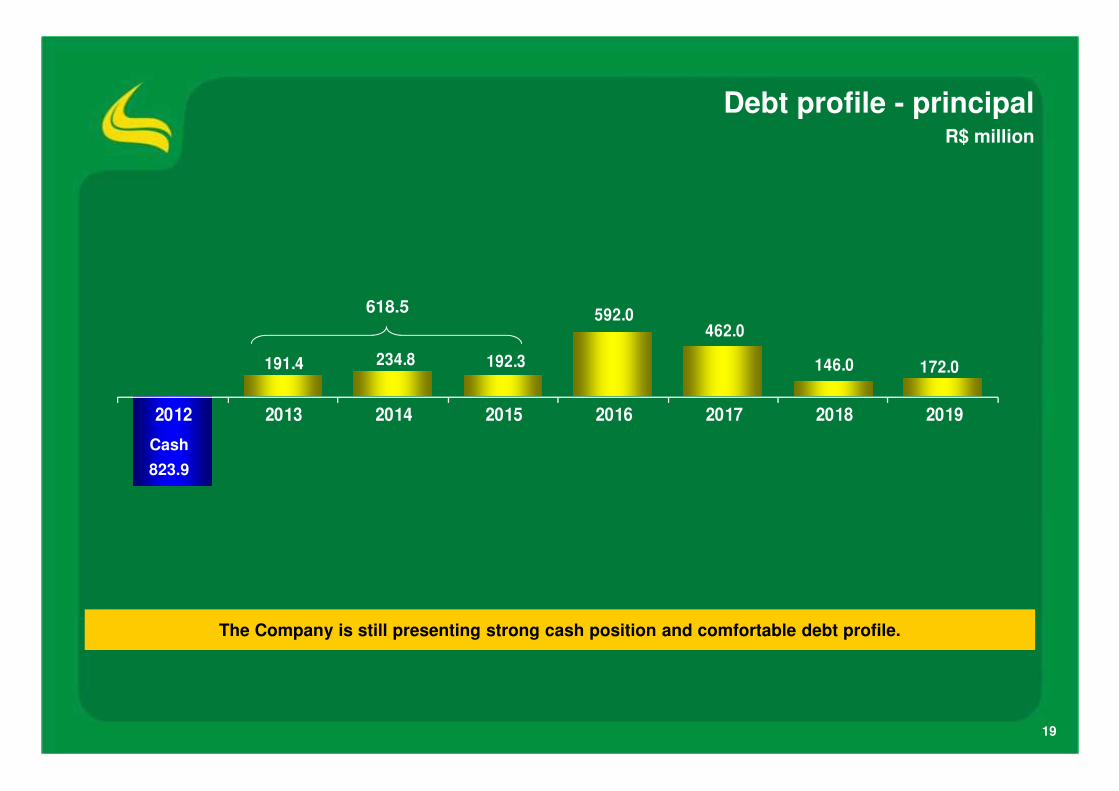
Debt profile - principalR$ million
The Company is still presenting strong cash position and comfortable debt profile.
191.4 234.8 192.3
592.0 462.0
146.0 172.0
2012 2013 2014 2015 2016 2017 2018 2019
Cash
823.9
618.5
20
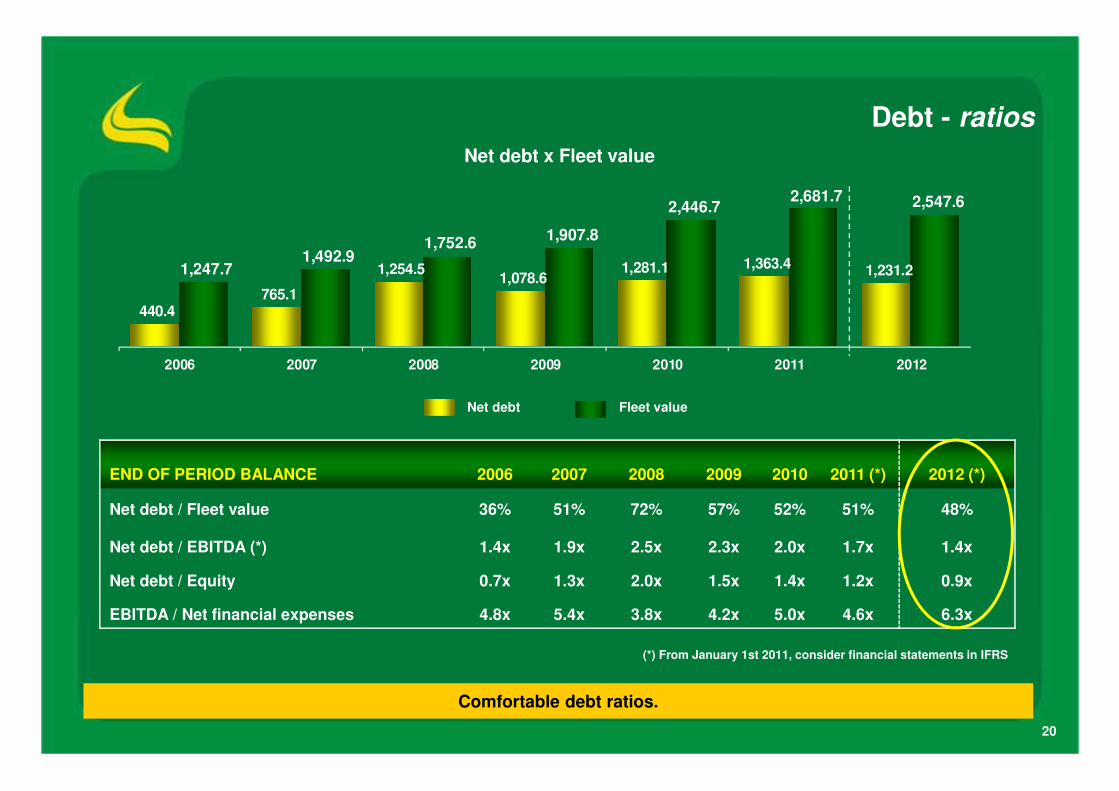
Debt - ratios
Net debt x Fleet value
END OF PERIOD BALANCE 2006 2007 2008 2009 2010 2011 (*) 2012 (*)
Net debt / Fleet value 36% 51% 72% 57% 52% 51% 48%
Net debt / EBITDA (*) 1.4x 1.9x 2.5x 2.3x 2.0x 1.7x 1.4x
Net debt / Equity 0.7x 1.3x 2.0x 1.5x 1.4x 1.2x 0.9x
EBITDA / Net financial expenses 4.8x 5.4x 3.8x 4.2x 5.0x 4.6x 6.3x
(*) From January 1st 2011, consider financial statements in IFRS
440.4 765.1
1,254.5 1,078.6
1,281.1 1,363.4 1,231.2 1,247.7 1,492.9
1,752.6 1,907.8
2,446.7 2,681.7 2,547.6
2006 2007 2008 2009 2010 2011 2012
Net debt Fleet value
Comfortable debt ratios.
21
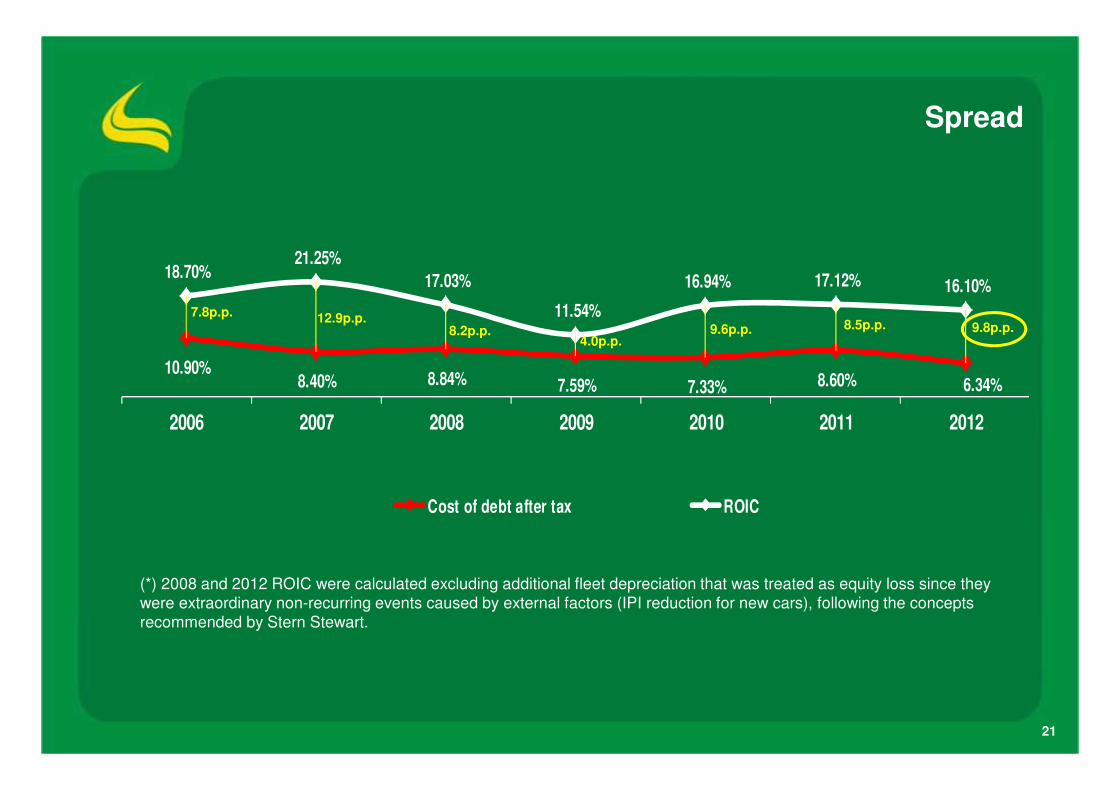
Spread
10.90%8.40% 8.84% 7.59% 7.33% 8.60% 6.34%
18.70%21.25%
17.03%
11.54%
16.94% 17.12% 16.10%
2006 2007 2008 2009 2010 2011 2012
Cost of debt after tax ROIC
7.8p.p. 12.9p.p.8.2p.p.
4.0p.p.9.6p.p. 8.5p.p. 9.8p.p.
(*) 2008 and 2012 ROIC were calculated excluding additional fleet depreciation that was treated as equity loss since they
were extraordinary non-recurring events caused by external factors (IPI reduction for new cars), following the concepts
recommended by Stern Stewart.
22
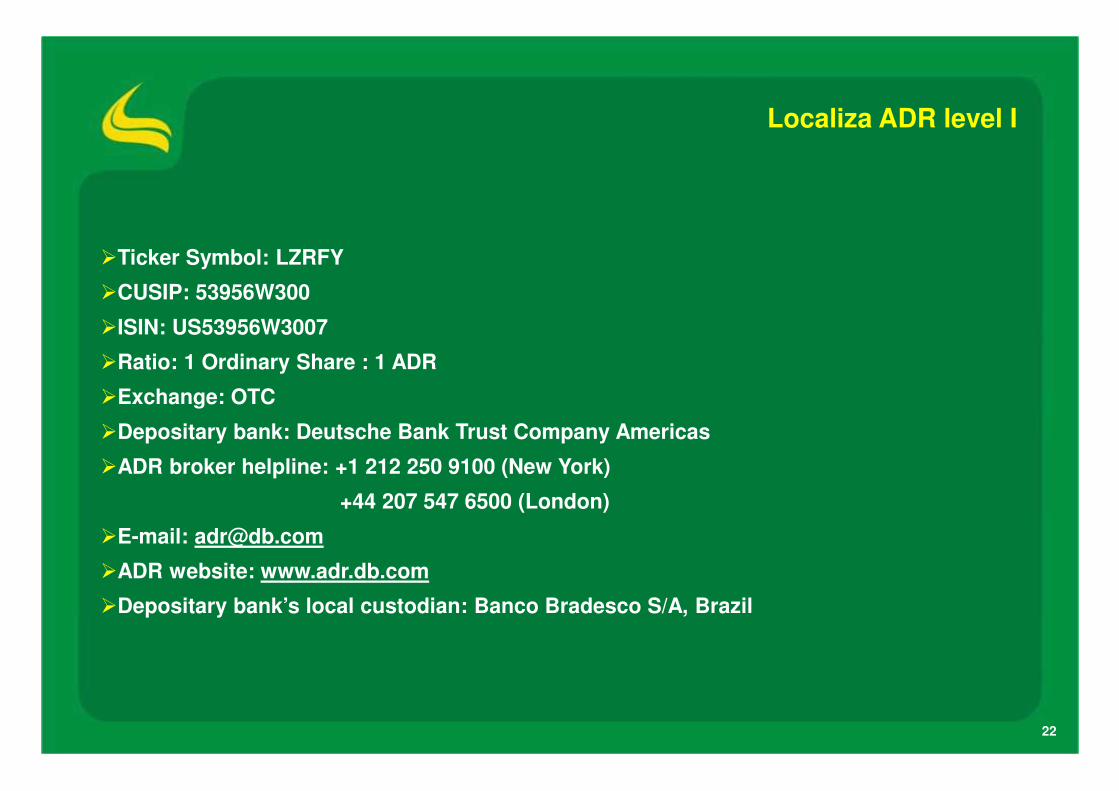
Localiza ADR level I
�Ticker Symbol: LZRFY
�CUSIP: 53956W300
�ISIN: US53956W3007
�Ratio: 1 Ordinary Share : 1 ADR
�Exchange: OTC
�Depositary bank: Deutsche Bank Trust Company Americas
�ADR broker helpline: +1 212 250 9100 (New York)
+44 207 547 6500 (London)
�E-mail: [email protected]
�ADR website: www.adr.db.com
�Depositary bank’s local custodian: Banco Bradesco S/A, Brazil
23
Disclaimer
Thank you!
The material presented is a presentation of general background information about LOCALIZA as of the date of the presentation. It is information in summary form and does not purport tobe complete. It is not intended to be relied upon as advice to potential investors. This presentation is strictly confidential and may not be disclosed to any other person. No representationor warranty, express or implied, is made concerning, and no reliance should be placed on, the accuracy, fairness, or completeness of the information presented herein.
This presentation contains statements that are forward-looking within the meaning of Section 27A of the Securities Act of 1933 and Section 21E of the Securities Exchange Act of 1934.Such forward-looking statements are only predictions and are not guarantees of future performance. Investors are cautioned that any such forward-looking statements are and will be, asthe case may be, subject to many risks, uncertainties and factors relating to the operations and business environments of LOCALIZA and its subsidiaries that may cause the actual resultsof the companies to be materially different from any future results expressed or implied in such forward-looking statements.
Although LOCALIZA believes that the expectations and assumptions reflected in the forward-looking statements are reasonable based on information currently available to LOCALIZA’smanagement, LOCALIZA cannot guarantee future results or events. LOCALIZA expressly disclaims a duty to update any of the forward-looking statement.
Securities may not be offered or sold in the United States unless they are registered or exempt from registration under the Securities Act of 1933. Any offering of securities to be made inthe United States will be made by means of an offering memorandum that may be obtained from the underwriters. Such offering memorandum will contain, or incorporate by reference,detailed information about LOCALIZA and its business and financial results, as well as its financial statements.
This presentation does not constitute an offer, or invitation, or solicitation of an offer, to subscribe for or purchase any securities. Neither this presentation nor
anything contained herein shall form the basis of any contract or commitment whatsoever.
www.localiza.com/ir
E-mail: [email protected]
Phone: +55 31 3247-7024