Embed Size (px)
Citation preview
1
Remoteness Structure
What is the Remoteness Structure?
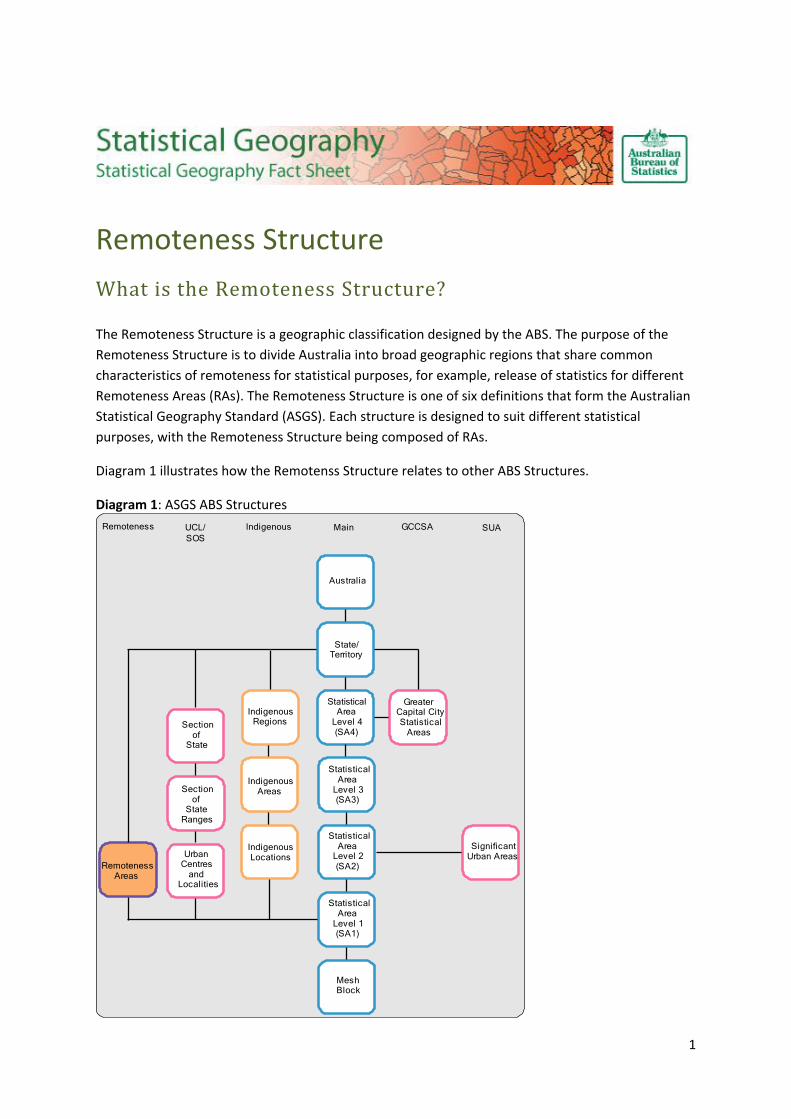
The Remoteness Structure is a geographic classification designed by the ABS. The purpose of the
Remoteness Structure is to divide Australia into broad geographic regions that share common
characteristics of remoteness for statistical purposes, for example, release of statistics for different
Remoteness Areas (RAs). The Remoteness Structure is one of six definitions that form the Australian
Statistical Geography Standard (ASGS). Each structure is designed to suit different statistical
purposes, with the Remoteness Structure being composed of RAs.
Diagram 1 illustrates how the Remotenss Structure relates to other ABS Structures.
Diagram 1: ASGS ABS Structures
GreaterCapital CityStatistical
Areas
SignificantUrban AreasUrban
Centresand
Localities
Sectionof
State
Sectionof
StateRanges
RemotenessAreas
UCL/
SOS
Remoteness GCCSAMainIndigenous
MeshBlock
StatisticalArea
Level 1(SA1)
StatisticalArea
Level 2(SA2)
StatisticalArea
Level 4(SA4)
State/Territory
Australia
IndigenousLocations
IndigenousAreas
IndigenousRegions
StatisticalArea
Level 3(SA3)
SUA

2
How does the ABS design Remoteness Areas?
RAs are based on the Accessibility/Remoteness Index of Australia (ARIA+) which is supplied to the
ABS by the University of Adelaide. The index is supplied as a one kilometre grid covering all of
Australia. Each grid point is allocated a value which is based on the measurement of road distances
to service centres. The ASGS Statistical Area Level 1 (SA1) are then overlayed onto the grid and an
average score is calculated based upon the grid points that are contained within each SA1. The
resulting average score determines which remoteness category is allocated to each SA1.
Table 1: 2011 Remoteness Areas of Australia
RA Category
RA Name SA1 Average ARIA+ Value Ranges
0 Major Cities of Australia 0 to 0.2
1 Inner Regional Australia greater than 0.2 and less than or equal to 2.4
2 Outer Regional Australia greater than 2.4 and less than or equal to 5.92
3 Remote Australia greater than 5.92 and less than or equal to 10.53
4 Very Remote Australia greater than 10.53
5 Migratory - Offshore - Shipping
9 No usual address
Impact of using SA1s to design Remoteness Areas
For 2011 the Remoteness Areas have been built from whole SA1s, which contrasts with 2001 and
2006 Remoteness Areas which were built using whole Census Collection Districts (CCDs). However,
the impact of this change in the base geography is considered to be minimal. This is due to there
being no substantial change in the methodology used to define the Remoteness Areas. Therefore in
most cases it is possible to make a valid comparison of the same Remoteness Area across Censuses.
When undertaking such comparisons it should be noted that:
Remoteness is dynamic. Remoteness generally declines over time as new services are built
and the road network is improved.
The regions from which they are built (CCDs in 2001 and 2006, and SA1s in 2011) also
change with the underlying settlement pattern.
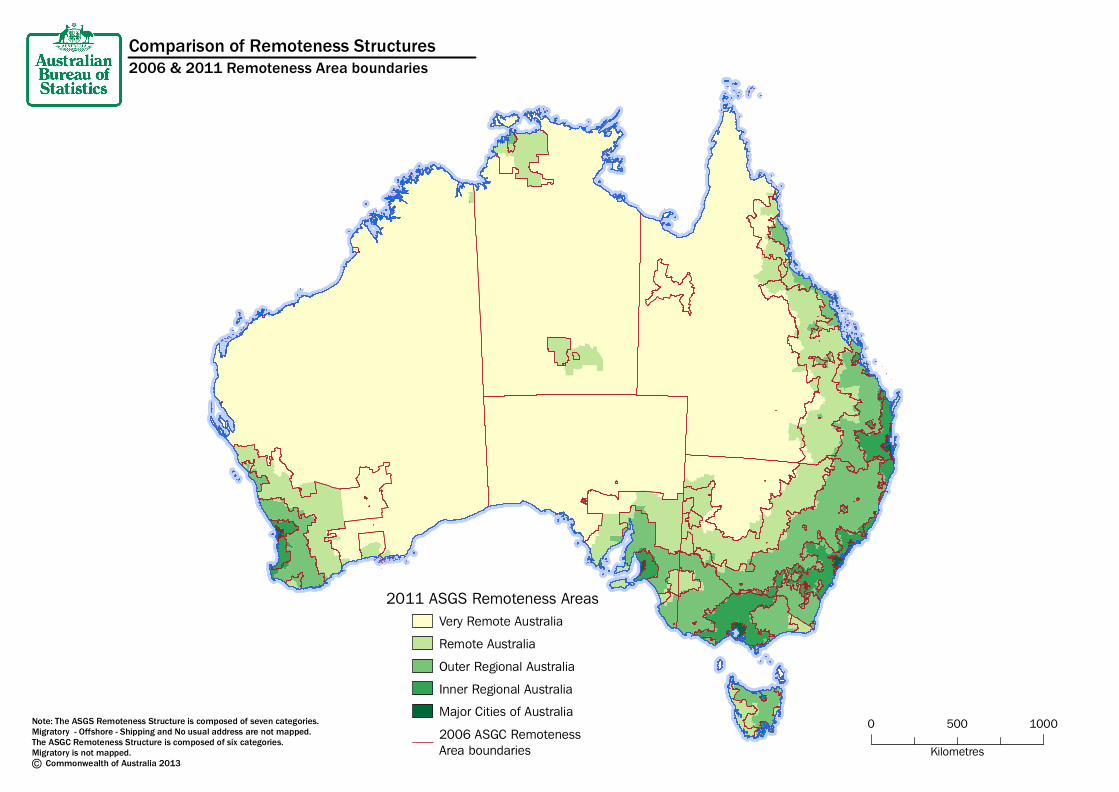
2011 Urban Centres and Localities that have changed
Remoteness Area when compared to 2006
For 2011 there are 102 Urban Centres and Localities (UCLs) where the RA category has changed
when compared to 2006. 49 UCLs have decreased in remoteness, whereas 53 UCLs have increased in
remoteness. The complete lists of UCLs that have changed remoteness are in Appendix 1 and
Appendix 2. The map below illustrates the differences in boundaries between RA 2006 and RA 2011.

3
Where can I find Remoteness Area Boundaries?
2011 Remoteness Area boundaries are available in Mapinfo Interchange and ESRI Shapefile formats
and can be downloaded from the ‘ABS Geography Publications’ chapter of the ABS Statistical
Geography website: http://www.abs.gov.au/geography
Alternatively, Remoteness Area digital boundaries are available through the ‘Downloads’ tab of the
ASGS Remoteness Structure online publication: Australian Statistical Geography Standard (ASGS):
Volume 5 - Remoteness Structure, July 2011 (cat. no. 1270.0.55.005).
Where can I get further information?
More information on the ASGS and ABS Statistical Geography can be found by visiting the ABS
website: http://www.abs.gov.au/geography
Any questions or comments can be emailed to [email protected]
0 1000500
Kilometres
Comparison of Remoteness Structures
2011 ASGS Remoteness Areas
2006 ASGC RemotenessArea boundaries
Very Remote Australia
Remote Australia
Outer Regional Australia
Inner Regional Australia
Major Cities of Australia
2006 & 2011 Remoteness Area boundaries
Note: The ASGS Remoteness Structure is composed of seven categories.Migratory - Offshore - Shipping and No usual address are not mapped.The ASGC Remoteness Structure is composed of six categories.Migratory is not mapped. Commonwealth of Australia 2013©
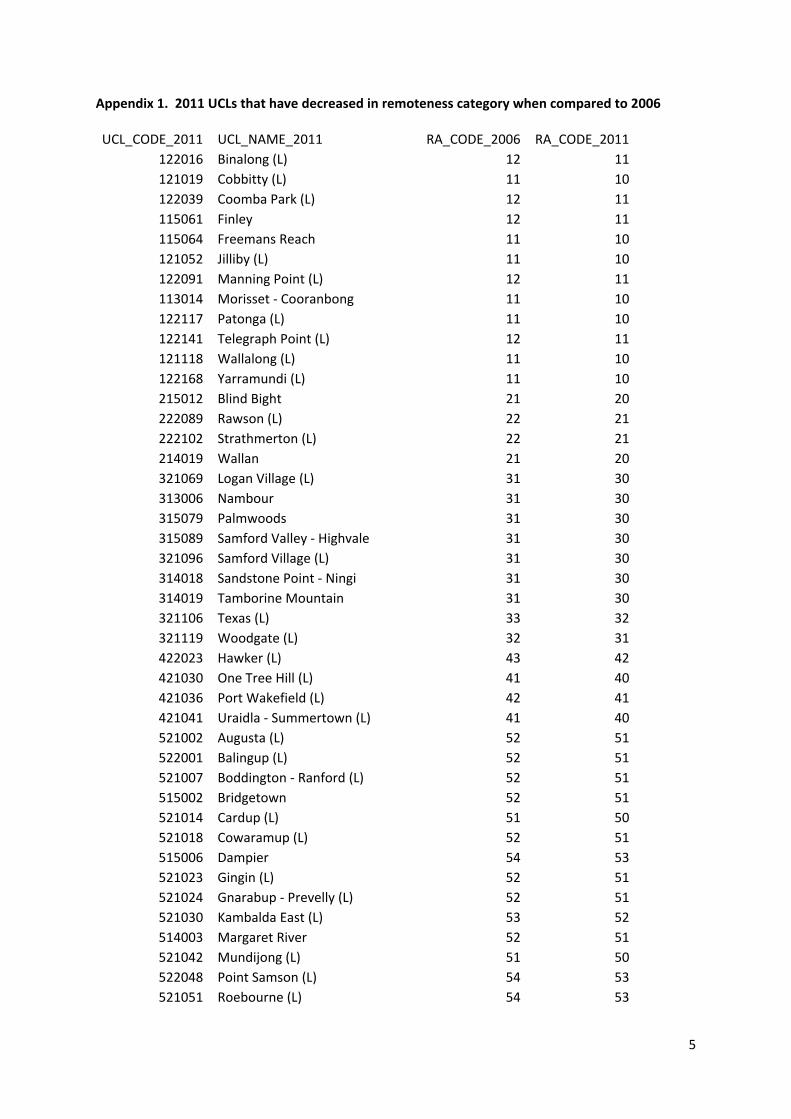
5
Appendix 1. 2011 UCLs that have decreased in remoteness category when compared to 2006
UCL_CODE_2011 UCL_NAME_2011 RA_CODE_2006 RA_CODE_2011
122016 Binalong (L) 12 11
121019 Cobbitty (L) 11 10
122039 Coomba Park (L) 12 11
115061 Finley 12 11
115064 Freemans Reach 11 10
121052 Jilliby (L) 11 10
122091 Manning Point (L) 12 11
113014 Morisset - Cooranbong 11 10
122117 Patonga (L) 11 10
122141 Telegraph Point (L) 12 11
121118 Wallalong (L) 11 10
122168 Yarramundi (L) 11 10
215012 Blind Bight 21 20
222089 Rawson (L) 22 21
222102 Strathmerton (L) 22 21
214019 Wallan 21 20
321069 Logan Village (L) 31 30
313006 Nambour 31 30
315079 Palmwoods 31 30
315089 Samford Valley - Highvale 31 30
321096 Samford Village (L) 31 30
314018 Sandstone Point - Ningi 31 30
314019 Tamborine Mountain 31 30
321106 Texas (L) 33 32
321119 Woodgate (L) 32 31
422023 Hawker (L) 43 42
421030 One Tree Hill (L) 41 40
421036 Port Wakefield (L) 42 41
421041 Uraidla - Summertown (L) 41 40
521002 Augusta (L) 52 51
522001 Balingup (L) 52 51
521007 Boddington - Ranford (L) 52 51
515002 Bridgetown 52 51
521014 Cardup (L) 51 50
521018 Cowaramup (L) 52 51
515006 Dampier 54 53
521023 Gingin (L) 52 51
521024 Gnarabup - Prevelly (L) 52 51
521030 Kambalda East (L) 53 52
514003 Margaret River 52 51
521042 Mundijong (L) 51 50
522048 Point Samson (L) 54 53
521051 Roebourne (L) 54 53

6
522053 Upper Swan (L) 51 50
522054 Walpole (L) 53 52
522062 Wyalkatchem (L) 53 52
622001 Bagdad (L) 62 61
615005 Dodges Ferry - Lewisham 62 61
722028 Titjikala (L) 74 73
Note: (L) indicates a locality.

7
Appendix 2. 2011 UCLs that have increased in remoteness category when compared to 2006
UCL_CODE_2011 UCL_NAME_2011 RA_CODE_2006 RA_CODE_2011
121007 Berridale (L) 11 12
115025 Bourke 13 14
121012 Brewarrina (L) 13 14
122034 Cargo (L) 11 12
115095 Lake Cargelligo 12 13
121063 Lawrence (L) 11 12
122088 Lyndhurst (L) 11 12
121070 Medlow Bath (L) 10 11
122095 Menindee (L) 13 14
122097 Moonbi (L) 11 12
121083 Mulgoa (L) 10 11
121087 Nords Wharf (L) 10 11
122114 Otford (L) 10 11
121100 Rylstone (L) 11 12
122133 Stanwell Tops (L) 10 11
115142 Uralla 11 12
115143 Urunga 11 12
121123 Wongarbon (L) 11 12
122164 Woodstock (L) 11 12
222004 Baw Baw Village (L) 21 22
222008 Beulah (L) 22 23
221010 Briagolong (L) 21 22
215053 Mortlake 21 22
221068 Tallangatta (L) 21 22
315017 Charleville 33 34
315018 Cherbourg 31 32
322137 Chillagoe (L) 33 34
322033 Dirranbandi (L) 33 34
322035 Duaringa (L) 32 33
322038 Erakala (L) 31 32
322041 Farleigh (L) 31 32
322055 Hideaway Bay - Dingo Beach (L) 32 33
322059 Injune (L) 33 34
315046 Jimboomba 30 31
322065 Lamb Island (L) 31 32
321077 Mitchell (L) 33 34
322087 Nebo (L) 32 33
315088 Russell Island 31 32
322121 Trebonne (L) 32 33
315098 Walkerston 31 32
321122 Yarraman (L) 31 32
422016 Clarendon (L) 40 41
412002 Mount Gambier 41 42

8
415047 Willunga 40 41
521016 Coolgardie (L) 53 54
521043 Norseman (L) 53 54
615010 Latrobe 61 62
621019 Richmond (L) (Tas.) 61 62
621020 Rosebery (L) 62 63
622038 Tullah (L) 62 63
722007 Batchelor (L) 72 73
722021 Nauiyu Nambiyu (Daly River) (L) 73 74
715008 Wadeye 73 74
Note: (L) indicates a locality.