Embed Size (px)
DESCRIPTION
Are there rational speculative bubbles in ASEAN stock markets?. Gilbert V. Nartea Bo Hu and Baiding Hu Faculty of Commerce Lincoln University New Zealand. Introduction. Bubbles : long run up in price followed by a crash. (e.g., ++++++++++++ -) - PowerPoint PPT Presentation
Citation preview

ARE THERE RATIONAL SPECULATIVE BUBBLES IN ASEAN STOCK MARKETS?
Gilbert V. NarteaBo Hu and Baiding HuFaculty of CommerceLincoln UniversityNew Zealand
Introduction
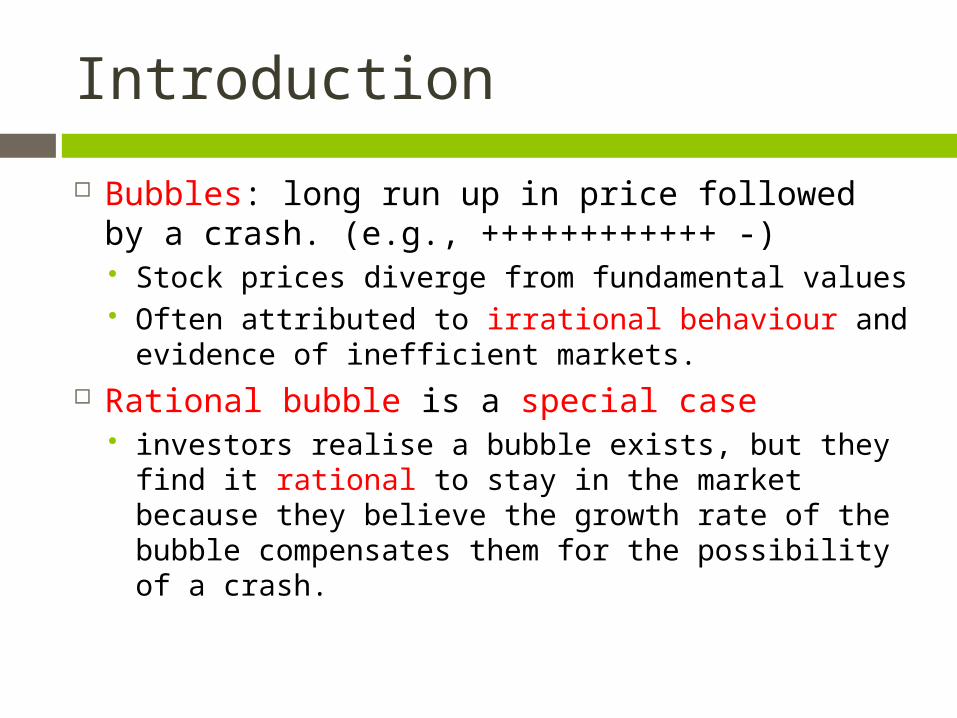
Bubbles: long run up in price followed by a crash. (e.g., ++++++++++++ -) Stock prices diverge from fundamental values Often attributed to irrational behaviour and
evidence of inefficient markets. Rational bubble is a special case
investors realise a bubble exists, but they find it rational to stay in the market because they believe the growth rate of the bubble compensates them for the possibility of a crash.
Introduction
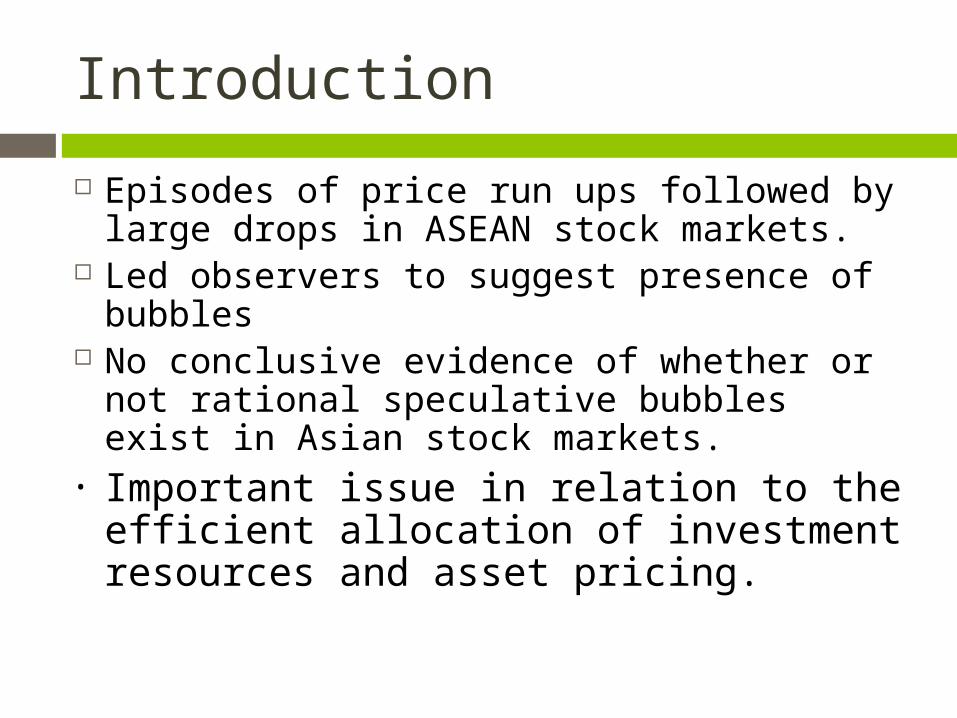
Episodes of price run ups followed by large drops in ASEAN stock markets.
Led observers to suggest presence of bubbles
No conclusive evidence of whether or not rational speculative bubbles exist in Asian stock markets.
• Important issue in relation to the efficient allocation of investment resources and asset pricing.
Introduction
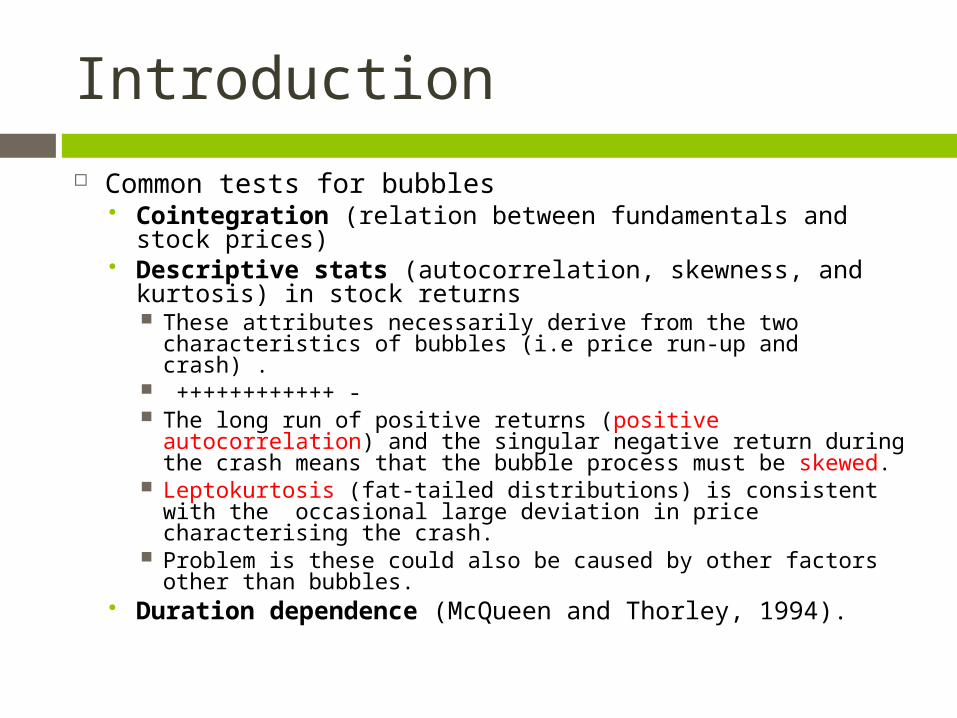
Common tests for bubbles Cointegration (relation between fundamentals and
stock prices) Descriptive stats (autocorrelation, skewness, and
kurtosis) in stock returns These attributes necessarily derive from the two
characteristics of bubbles (i.e price run-up and crash) . ++++++++++++ - The long run of positive returns (positive autocorrelation)
and the singular negative return during the crash means that the bubble process must be skewed.
Leptokurtosis (fat-tailed distributions) is consistent with the occasional large deviation in price characterising the crash.
Problem is these could also be caused by other factors other than bubbles.
Duration dependence (McQueen and Thorley, 1994).
Introduction
We use descriptive stats and duration dependence tests for Indonesia, Malaysia, and the Philippines (1991 to 2009).
Preliminary results
Introduction
McQueen and Thorley (1994) Testable implication of rational
speculative bubbles:the longer is the run of positive returns, the smaller is the probability that the run will end (negative duration dependence)
Introduction
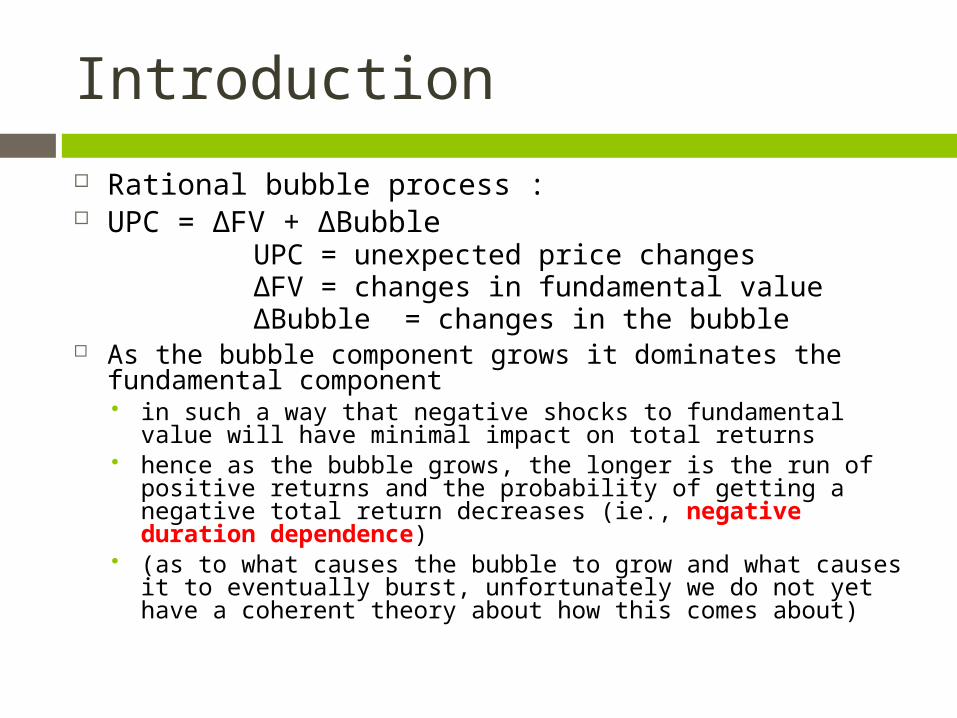
Rational bubble process : UPC = ΔFV + ΔBubble
UPC = unexpected price changesΔFV = changes in fundamental value ΔBubble = changes in the bubble
As the bubble component grows it dominates the fundamental component in such a way that negative shocks to fundamental value will
have minimal impact on total returns hence as the bubble grows, the longer is the run of positive
returns and the probability of getting a negative total return decreases (ie., negative duration dependence)
(as to what causes the bubble to grow and what causes it to eventually burst, unfortunately we do not yet have a coherent theory about how this comes about)
Introduction
Duration dependence test does not require specification of the underlying fundamental
value relationship model. normality of the time series behaviour
under investigation

Literature Review
Chan et al. (1998) Duration dependence tests (1975- 1994) Rational speculative bubbles in Thailand but not
in Hong Kong, Japan, Korea, Malaysia, Taiwan. Sarno and Taylor (1999)
Cointegration tests (1989-1997) Bubbles in China, Indonesia, Malaysia,
Philippines, Singapore, South Korea, Taiwan and Thailand
Ali et al. (2009) and Mokhtar et al. (2006) Rational speculative bubbles in Malaysia

Literature Review
Jirasakuldech et al. (2008) cointegration and duration dependence
tests (1975- 2006) Rational speculative bubbles in the Thai
stock market consistent with those of Watanapalachaikul and Islam (2007).
Rangel and Pillay (2007) excess volatility tests, cointegration tests,
duration dependence tests, and the intrinsic bubbles model (1975-2007)
Rational speculative bubbles in Singapore
Data and Methods
McQueen and Thorley (1994) suggest monthly data contains less noise but short data series from monthly data could
result in lack of power of tests used we use both monthly and weekly index values.
Monthly and weekly closing prices from Datastream (February 1991- December 2009) Jakarta Composite Index, Kuala Lumpur Composite Index and the Philippine Stock Exchange Index
Data and Methods
We use real returns First, transform real returns into run
lengths of positive and negative observed returns, i.e., ++++++---+++++++++-
Run is a sequence of returns with the same sign.
Data and Methods
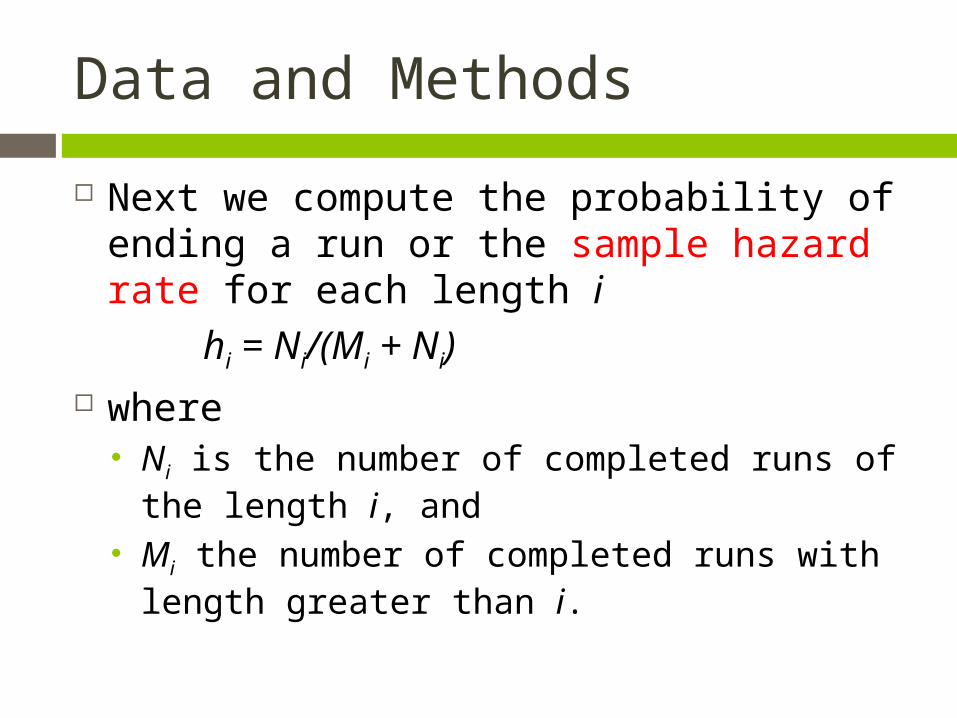
Next we compute the probability of ending a run or the sample hazard rate for each length i
hi = Ni/(Mi + Ni) where
Ni is the number of completed runs of the length i, and
Mi the number of completed runs with length greater than i.
Data and Methods
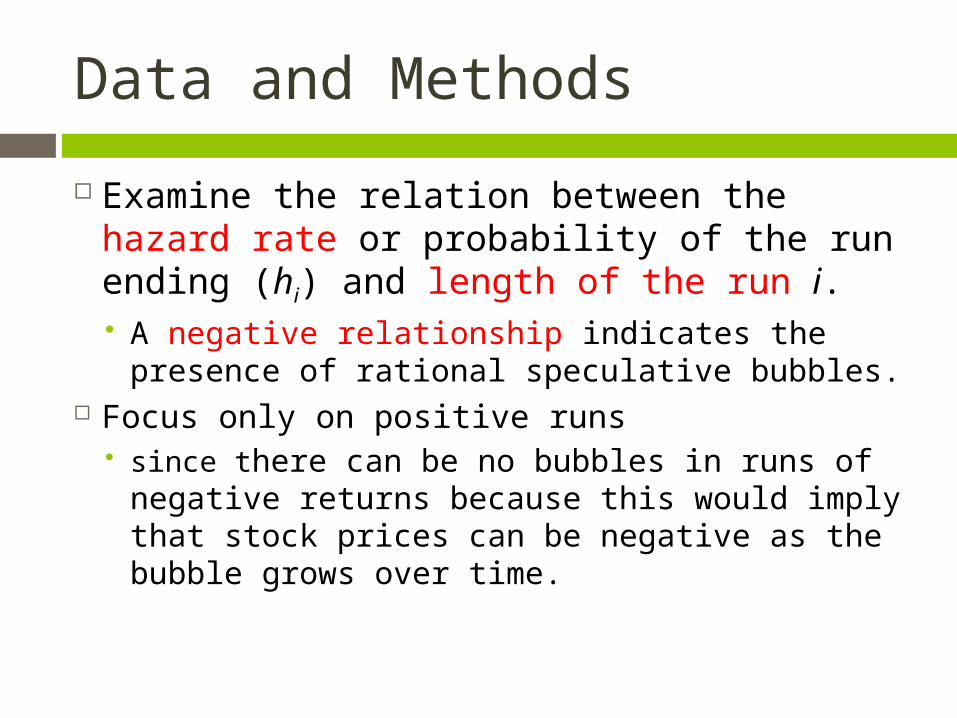
Examine the relation between the hazard rate or probability of the run ending (hi) and length of the run i. A negative relationship indicates the
presence of rational speculative bubbles. Focus only on positive runs
since there can be no bubbles in runs of negative returns because this would imply that stock prices can be negative as the bubble grows over time.
Data and Methods
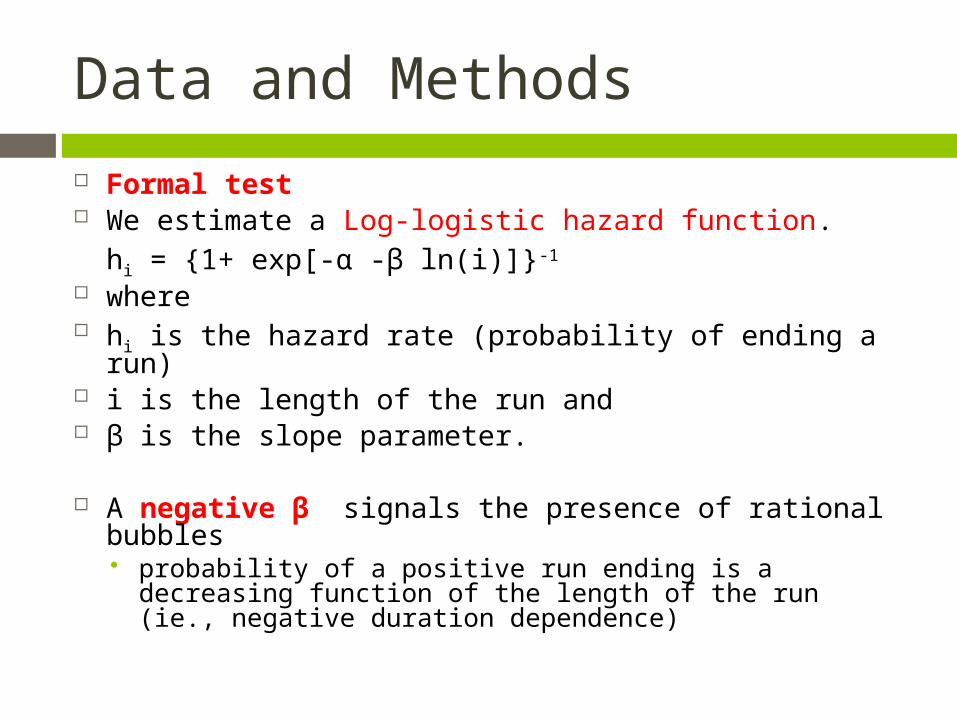
Formal test We estimate a Log-logistic hazard function.
hi = {1+ exp[-α -β ln(i)]}-1 where hi is the hazard rate (probability of ending a run) i is the length of the run and β is the slope parameter.
A negative β signals the presence of rational bubbles probability of a positive run ending is a decreasing
function of the length of the run (ie., negative duration dependence)
Empirical Results
Index plots Descriptive statistics Duration dependence tests
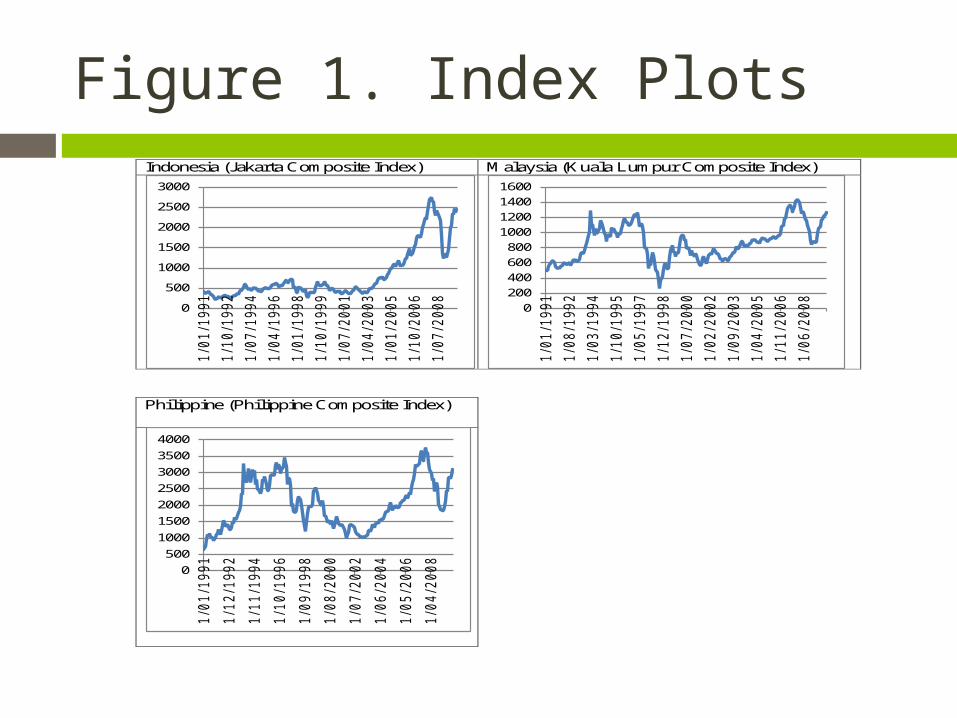
Figure 1. Index PlotsIndonesia (Jakarta Composite Index) Malaysia (Kuala Lumpur Composite Index)
Philippine (Philippine Composite Index)
0
500
1000
1500
2000
2500
3000
1/01/1991
1/10/1992
1/07/1994
1/04/1996
1/01/1998
1/10/1999
1/07/2001
1/04/2003
1/01/2005
1/10/2006
1/07/2008
0200400600800
1000120014001600
1/01/1991
1/08/1992
1/03/1994
1/10/1995
1/05/1997
1/12/1998
1/07/2000
1/02/2002
1/09/2003
1/04/2005
1/11/2006
1/06/2008
05001000150020002500300035004000
1/01/1991
1/12/1992
1/11/1994
1/10/1996
1/09/1998
1/08/2000
1/07/2002
1/06/2004
1/05/2006
1/04/2008
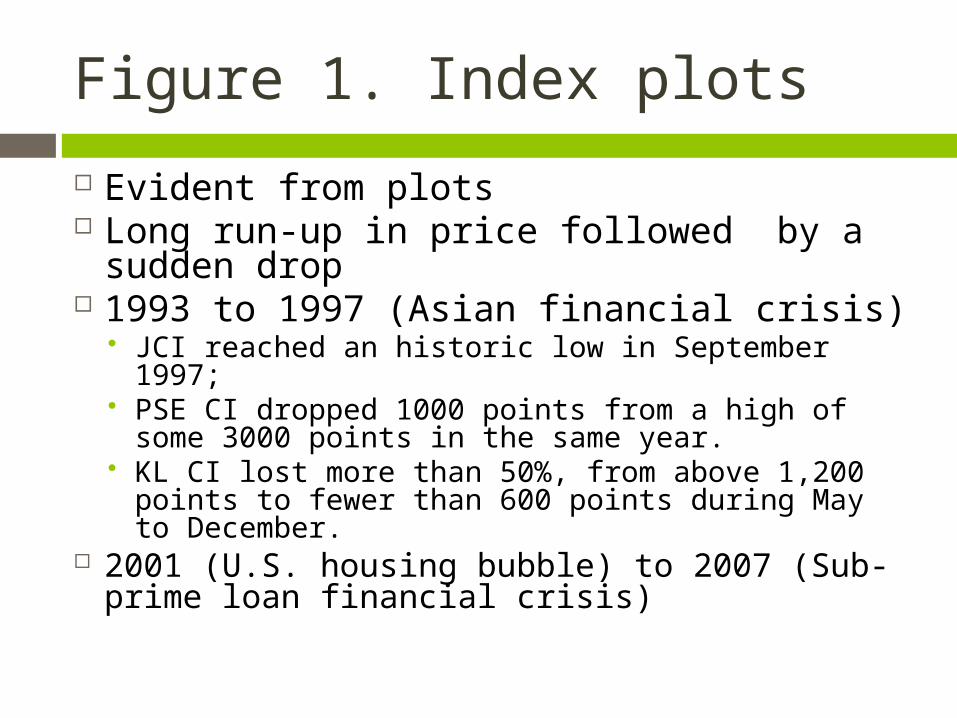
Figure 1. Index plots
Evident from plots Long run-up in price followed by a
sudden drop 1993 to 1997 (Asian financial crisis)
JCI reached an historic low in September 1997; PSE CI dropped 1000 points from a high of
some 3000 points in the same year. KL CI lost more than 50%, from above 1,200
points to fewer than 600 points during May to December.
2001 (U.S. housing bubble) to 2007 (Sub-prime loan financial crisis)
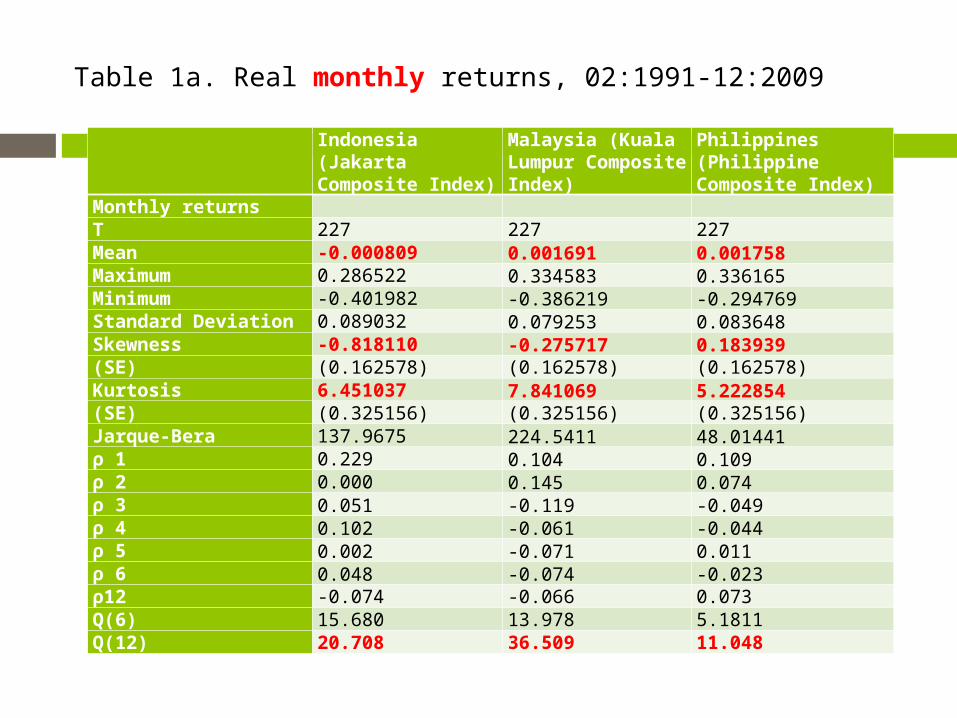
Table 1a. Real monthly returns, 02:1991-12:2009
Indonesia (Jakarta Composite Index)
Malaysia (Kuala Lumpur Composite Index)
Philippines (Philippine Composite Index)
Monthly returns T 227 227 227Mean -0.000809 0.001691 0.001758Maximum 0.286522 0.334583 0.336165Minimum -0.401982 -0.386219 -0.294769Standard Deviation 0.089032 0.079253 0.083648Skewness -0.818110 -0.275717 0.183939(SE) (0.162578) (0.162578) (0.162578)Kurtosis 6.451037 7.841069 5.222854(SE) (0.325156) (0.325156) (0.325156)Jarque-Bera 137.9675 224.5411 48.01441ρ 1 0.229 0.104 0.109ρ 2 0.000 0.145 0.074ρ 3 0.051 -0.119 -0.049ρ 4 0.102 -0.061 -0.044ρ 5 0.002 -0.071 0.011ρ 6 0.048 -0.074 -0.023ρ12 -0.074 -0.066 0.073Q(6) 15.680 13.978 5.1811Q(12) 20.708 36.509 11.048
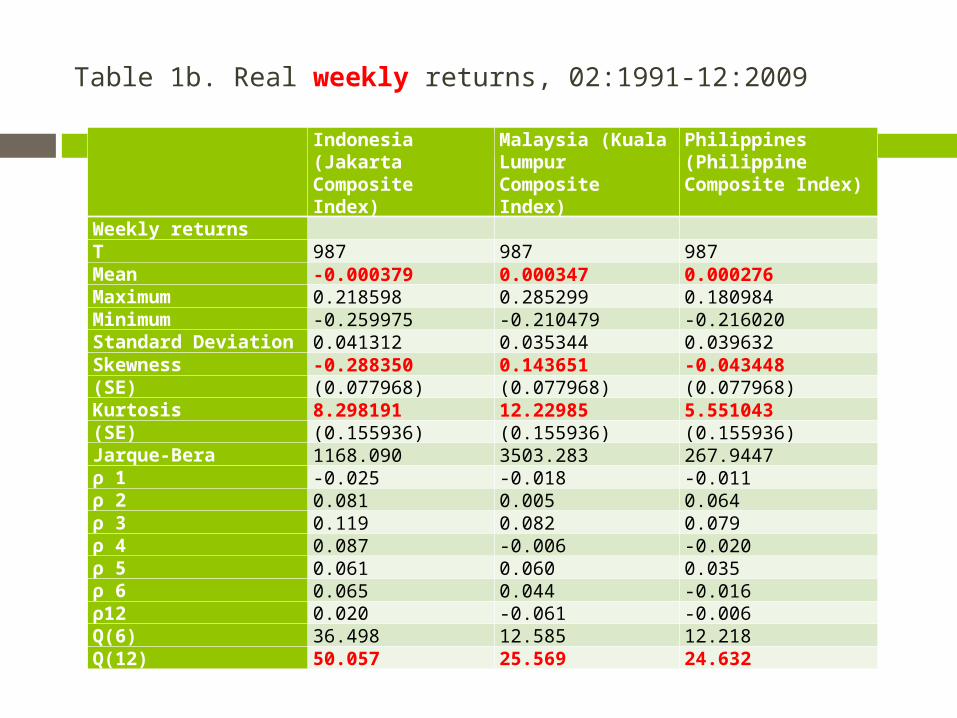
Table 1b. Real weekly returns, 02:1991-12:2009
Indonesia (Jakarta Composite Index)
Malaysia (Kuala Lumpur Composite Index)
Philippines (Philippine Composite Index)
Weekly returns T 987 987 987Mean -0.000379 0.000347 0.000276Maximum 0.218598 0.285299 0.180984Minimum -0.259975 -0.210479 -0.216020Standard Deviation 0.041312 0.035344 0.039632Skewness -0.288350 0.143651 -0.043448(SE) (0.077968) (0.077968) (0.077968)Kurtosis 8.298191 12.22985 5.551043(SE) (0.155936) (0.155936) (0.155936)Jarque-Bera 1168.090 3503.283 267.9447ρ 1 -0.025 -0.018 -0.011ρ 2 0.081 0.005 0.064ρ 3 0.119 0.082 0.079ρ 4 0.087 -0.006 -0.020ρ 5 0.061 0.060 0.035ρ 6 0.065 0.044 -0.016ρ12 0.020 -0.061 -0.006Q(6) 36.498 12.585 12.218Q(12) 50.057 25.569 24.632
Descriptive statistics
Mean Monthly returns Similar for Malaysia and the Philippines Indonesia had a negative average monthly real
return Maximum Monthly returns
Similar for Malaysia and the Philippines Lower for Indonesia
Minimum Monthly returns Indonesia experienced the lowest real return,
followed by Malaysia then Philippines. ALL monthly and weekly return distributions
are Non-normal (Jarque-Bera test statistics).
Descriptive statistics
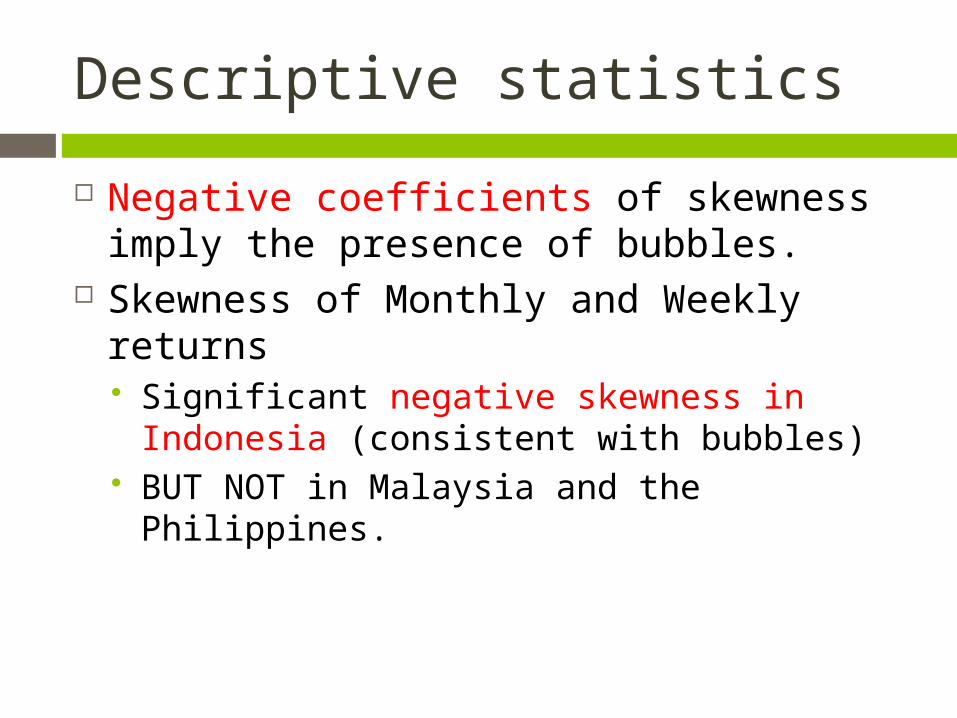
Negative coefficients of skewness imply the presence of bubbles.
Skewness of Monthly and Weekly returns Significant negative skewness in Indonesia
(consistent with bubbles) BUT NOT in Malaysia and the Philippines.

Descriptive statistics
• Leptokurtosis of returns also imply the presence of rational speculative bubbles.• Monthly and weekly returns in ALL
markets exhibit leptokurtosis • Consistent with the presence of rational
speculative bubbles.
Descriptive statistics
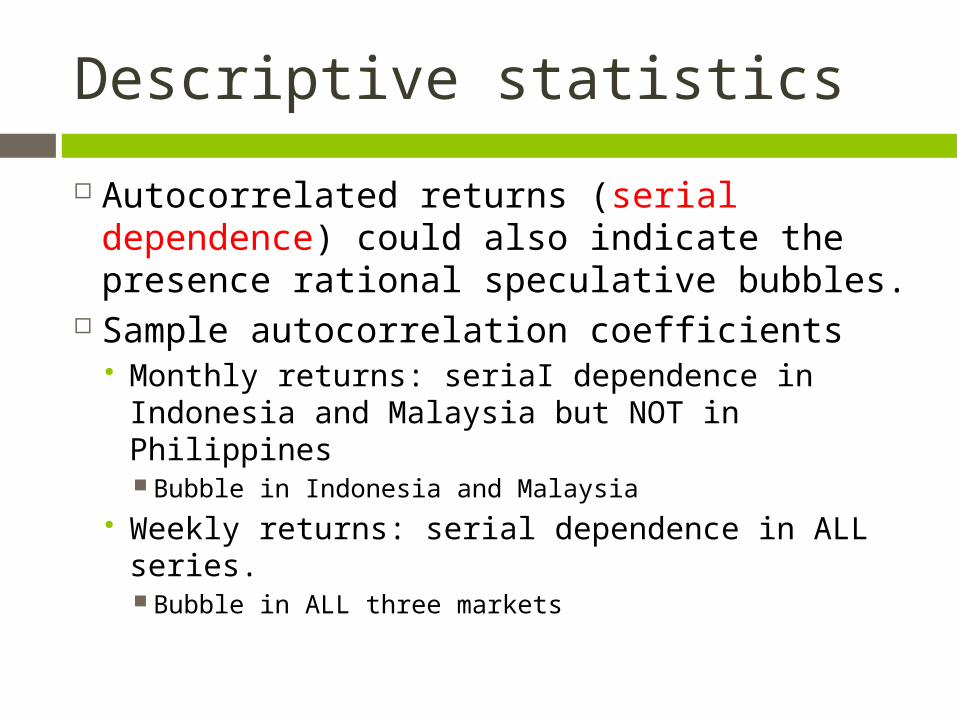
Autocorrelated returns (serial dependence) could also indicate the presence rational speculative bubbles.
Sample autocorrelation coefficients Monthly returns: seriaI dependence in
Indonesia and Malaysia but NOT in Philippines Bubble in Indonesia and Malaysia
Weekly returns: serial dependence in ALL series. Bubble in ALL three markets
Descriptive statistics
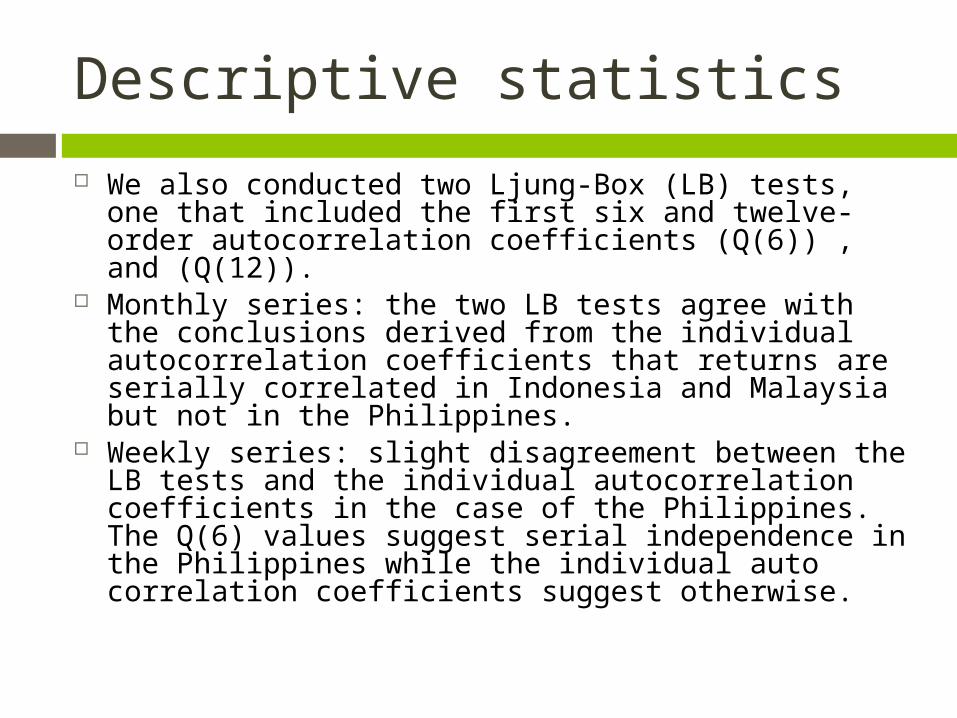
We also conducted two Ljung-Box (LB) tests, one that included the first six and twelve-order autocorrelation coefficients (Q(6)) , and (Q(12)).
Monthly series: the two LB tests agree with the conclusions derived from the individual autocorrelation coefficients that returns are serially correlated in Indonesia and Malaysia but not in the Philippines.
Weekly series: slight disagreement between the LB tests and the individual autocorrelation coefficients in the case of the Philippines. The Q(6) values suggest serial independence in the Philippines while the individual auto correlation coefficients suggest otherwise.
Descriptive statistics
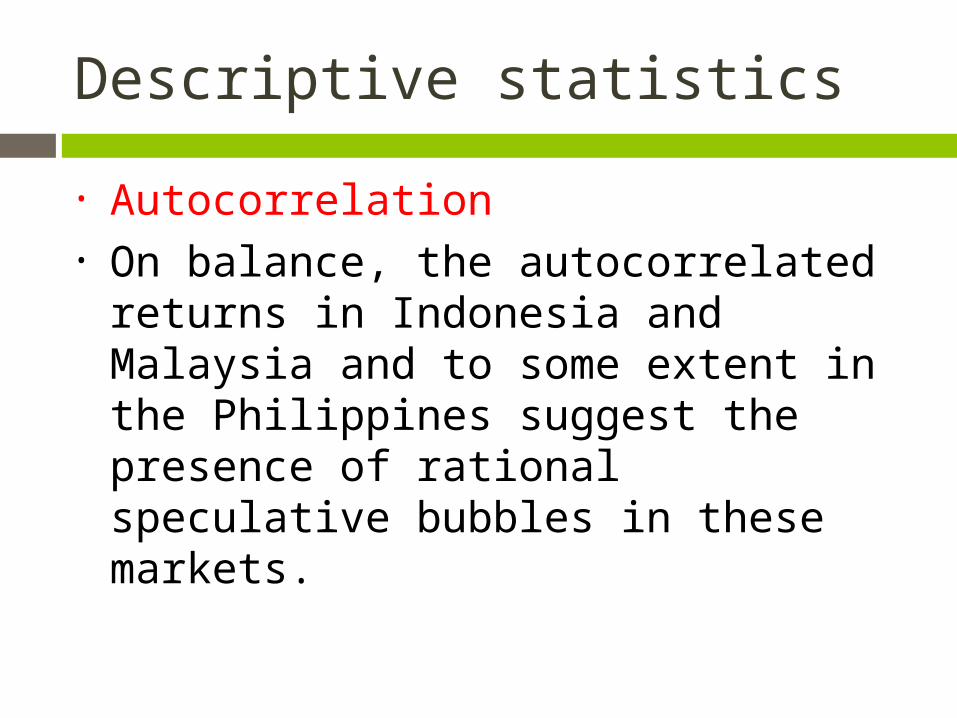
• Autocorrelation• On balance, the autocorrelated
returns in Indonesia and Malaysia and to some extent in the Philippines suggest the presence of rational speculative bubbles in these markets.
Descriptive statistics
In summary The characteristics of the return
distributions indicate (in varying degrees) the presence of rational speculative bubbles in these markets.
However, these characteristics could also be due to factors NOT related to rational speculative bubbles.
Hence we conduct duration dependence tests next.
Duration dependence tests
Monthly returns Weekly returns Sub-period analysis
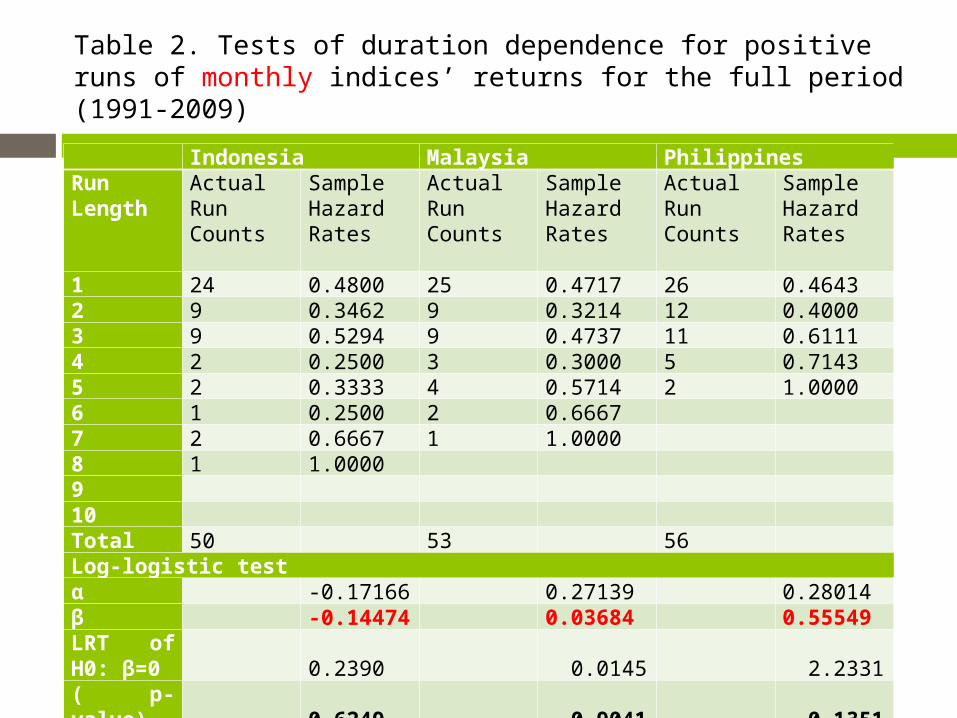
Table 2. Tests of duration dependence for positive runs of monthly indices’ returns for the full period (1991-2009)
Indonesia Malaysia PhilippinesRun Length
Actual Run Counts
SampleHazardRates
Actual Run Counts
SampleHazardRates
Actual Run Counts
SampleHazardRates
1 24 0.4800 25 0.4717 26 0.46432 9 0.3462 9 0.3214 12 0.40003 9 0.5294 9 0.4737 11 0.61114 2 0.2500 3 0.3000 5 0.71435 2 0.3333 4 0.5714 2 1.00006 1 0.2500 2 0.6667 7 2 0.6667 1 1.0000 8 1 1.0000 9 10 Total 50 53 56 Log-logistic testα -0.17166 0.27139 0.28014β
-0.14474
0.03684
0.55549
LRT of H0: β=0 0.2390
0.0145
2.2331
( p-value) 0.6249
0.9041
0.1351
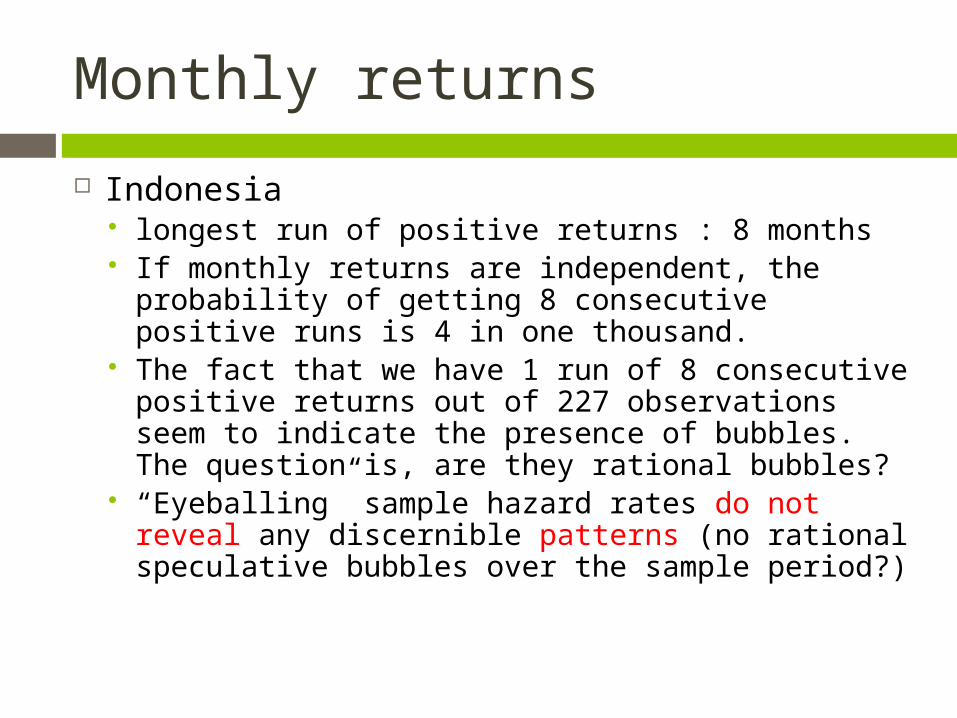
Monthly returns
Indonesia longest run of positive returns : 8 months If monthly returns are independent, the
probability of getting 8 consecutive positive runs is 4 in one thousand.
The fact that we have 1 run of 8 consecutive positive returns out of 227 observations seem to indicate the presence of bubbles. The question is, are they rational bubbles?
“Eyeballing” sample hazard rates do not reveal any discernible patterns (no rational speculative bubbles over the sample period?)
Monthly returns
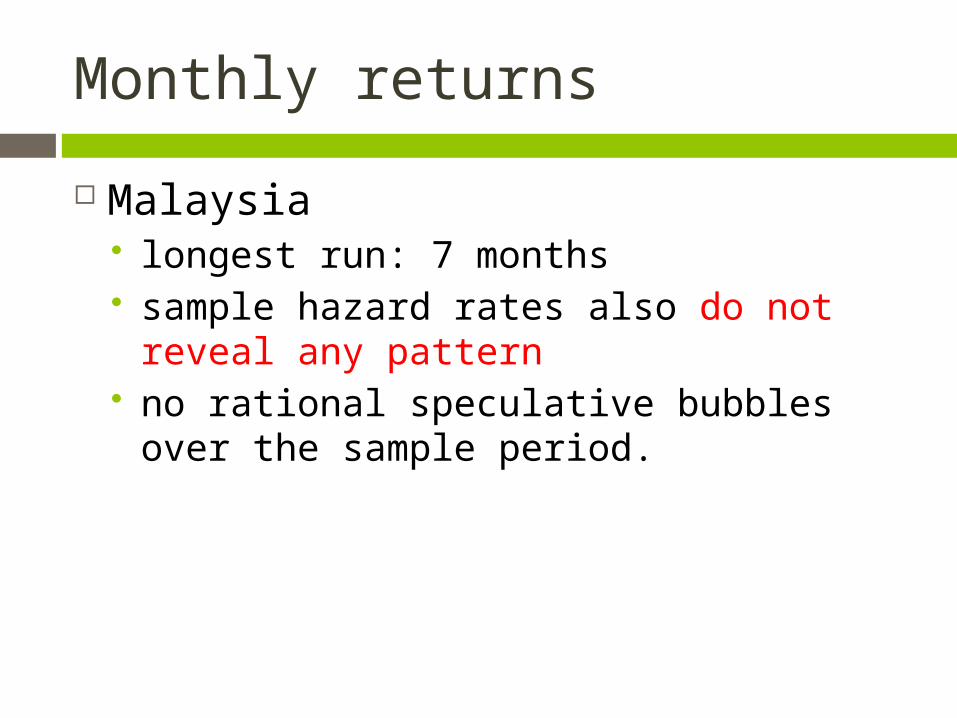
Malaysia longest run: 7 months sample hazard rates also do not reveal
any pattern no rational speculative bubbles over the
sample period.
Monthly returns
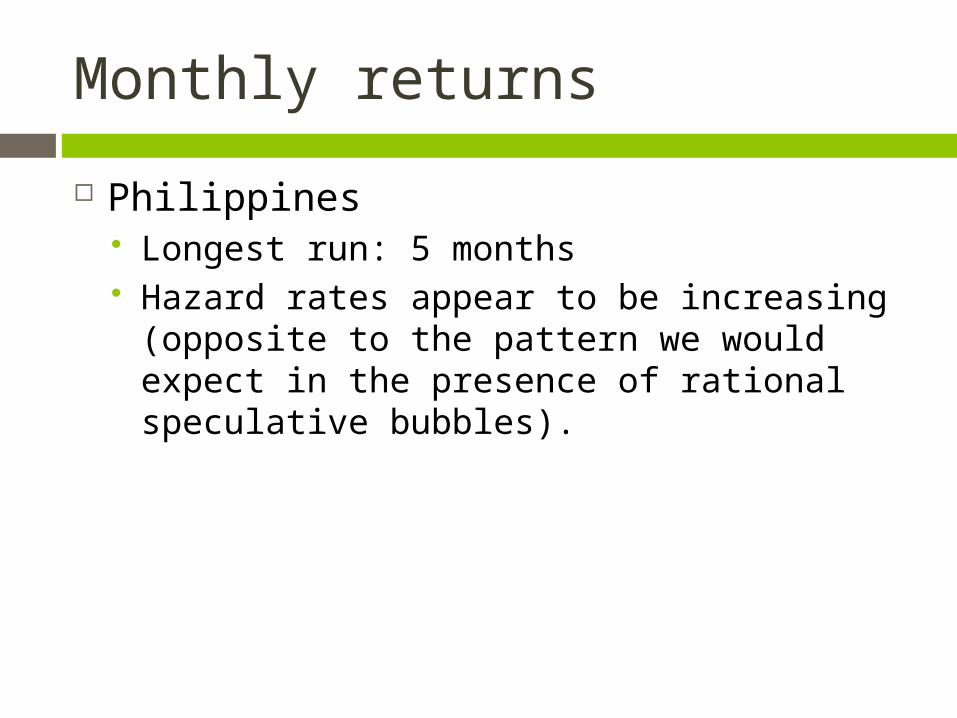
Philippines Longest run: 5 months Hazard rates appear to be increasing
(opposite to the pattern we would expect in the presence of rational speculative bubbles).

Monthly returns
Log-logistic test on the level of beta. Indonesia is negative at -0.14474, BUT
statistically insignificant (p-value of 0.6249) Malaysia and the Philippines are of the
wrong sign and statistically insignificant. Therefore, No rational speculative bubbles
in Indonesia, Malaysia and the Philippines
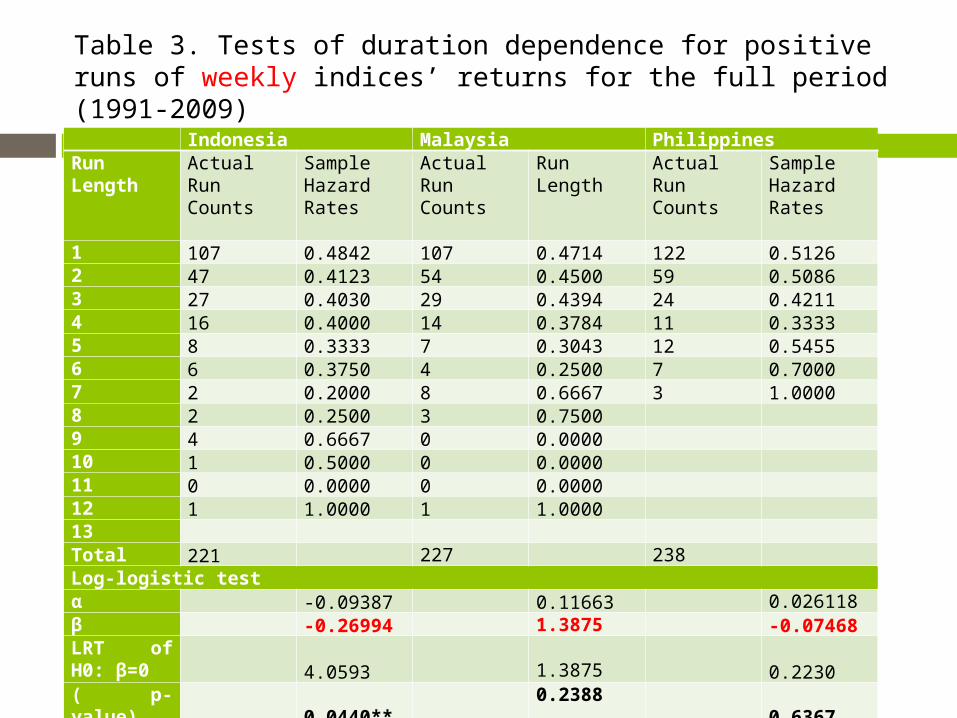
Table 3. Tests of duration dependence for positive runs of weekly indices’ returns for the full period (1991-2009)
Indonesia Malaysia PhilippinesRun Length
Actual Run Counts
SampleHazardRates
Actual Run Counts
Run Length
Actual Run Counts
SampleHazardRates
1 107 0.4842 107 0.4714 122 0.51262 47 0.4123 54 0.4500 59 0.50863 27 0.4030 29 0.4394 24 0.42114 16 0.4000 14 0.3784 11 0.33335 8 0.3333 7 0.3043 12 0.54556 6 0.3750 4 0.2500 7 0.70007 2 0.2000 8 0.6667 3 1.00008 2 0.2500 3 0.7500 9 4 0.6667 0 0.0000 10 1 0.5000 0 0.0000 11 0 0.0000 0 0.0000 12 1 1.0000 1 1.0000 13 Total 221 227 238 Log-logistic testα -0.09387 0.11663 0.026118β -0.26994 1.3875 -0.07468LRT of H0: β=0 4.0593
1.3875 0.2230
( p-value) 0.0440** 0.2388 0.6367
Weekly returns
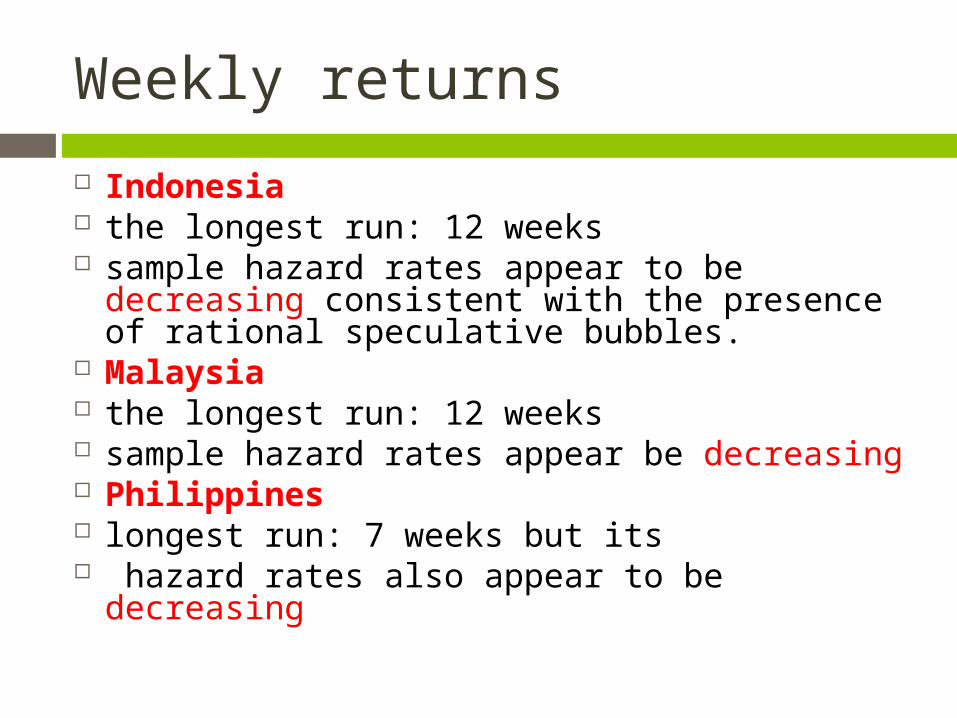
Indonesia the longest run: 12 weeks sample hazard rates appear to be
decreasing consistent with the presence of rational speculative bubbles.
Malaysia the longest run: 12 weeks sample hazard rates appear be decreasing Philippines longest run: 7 weeks but its hazard rates also appear to be decreasing
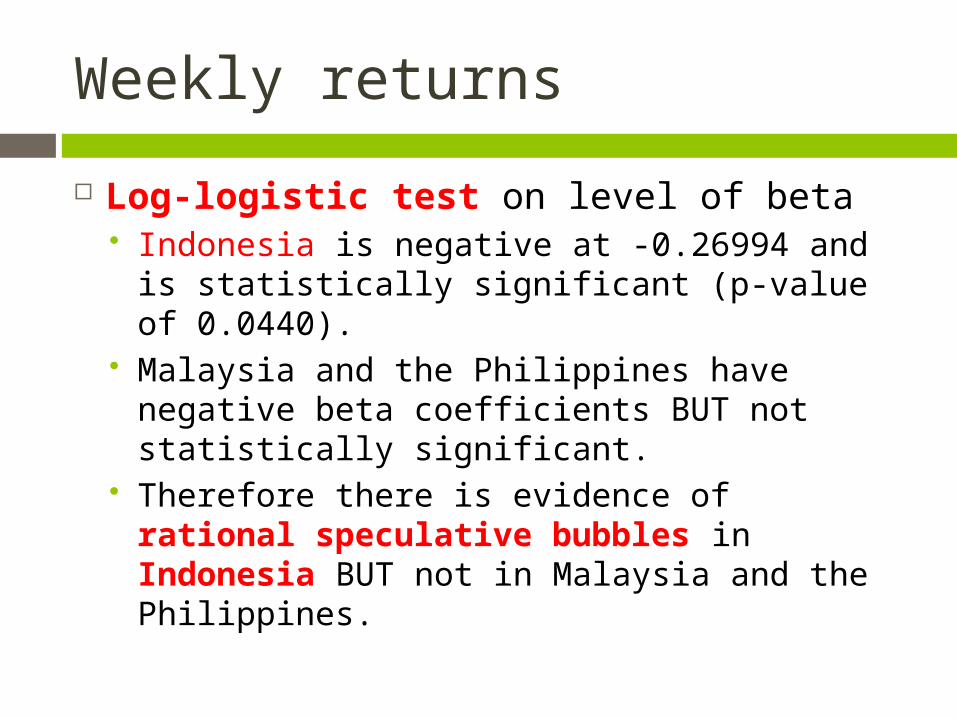
Weekly returns
Log-logistic test on level of beta Indonesia is negative at -0.26994 and is
statistically significant (p-value of 0.0440). Malaysia and the Philippines have negative
beta coefficients BUT not statistically significant.
Therefore there is evidence of rational speculative bubbles in Indonesia BUT not in Malaysia and the Philippines.
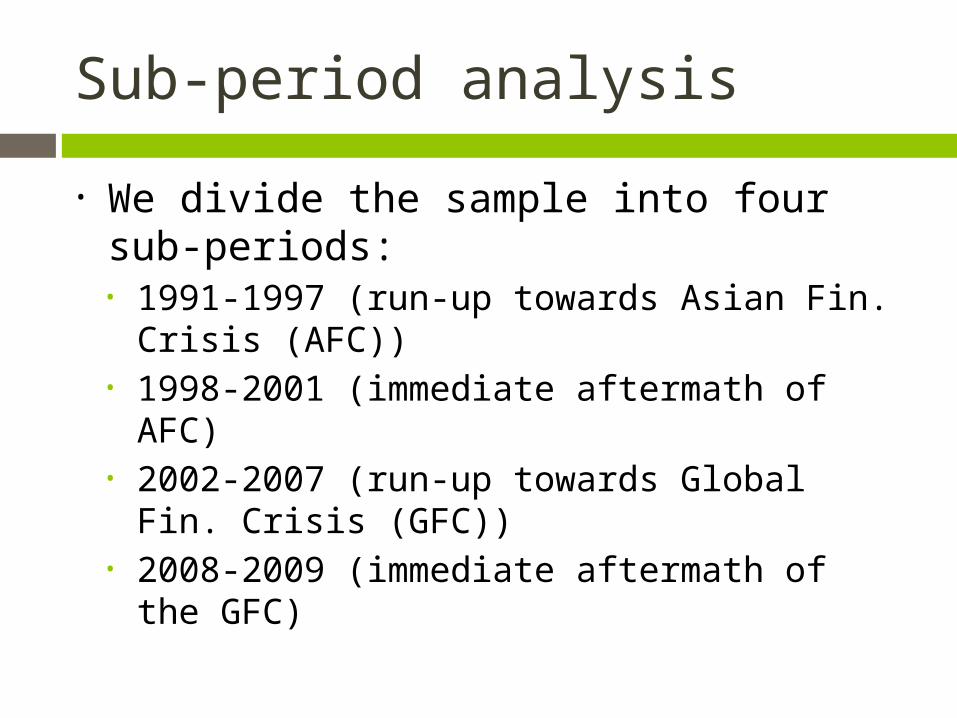
Sub-period analysis
• We divide the sample into four sub-periods:• 1991-1997 (run-up towards Asian Fin.
Crisis (AFC)) • 1998-2001 (immediate aftermath of AFC)• 2002-2007 (run-up towards Global Fin.
Crisis (GFC)) • 2008-2009 (immediate aftermath of the
GFC)
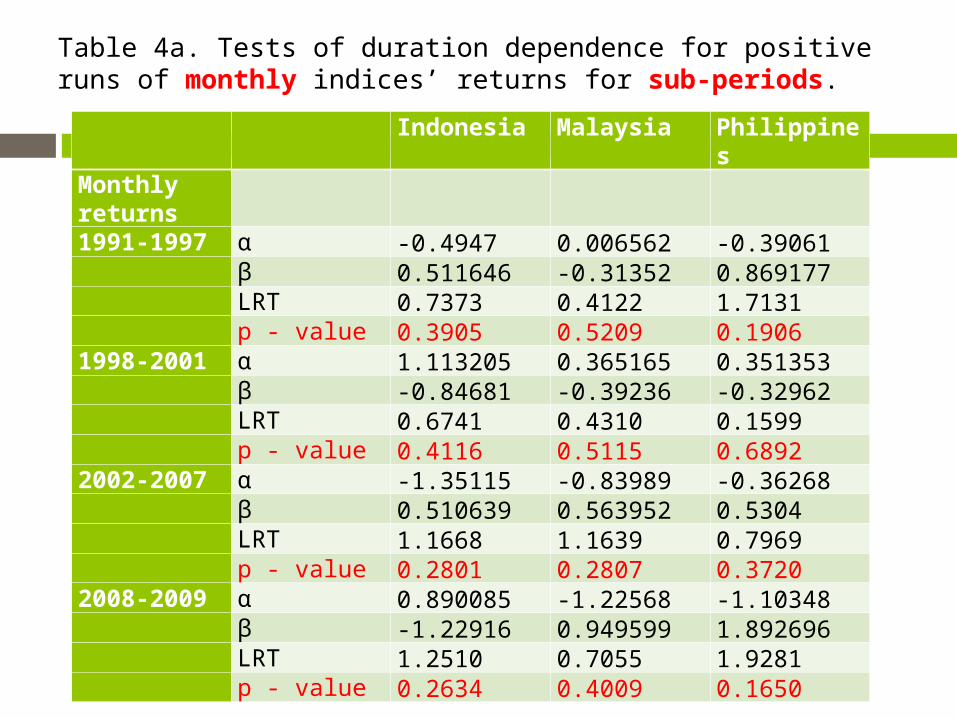
Table 4a. Tests of duration dependence for positive runs of monthly indices’ returns for sub-periods.
Indonesia Malaysia Philippines
Monthly returns
1991-1997 α -0.4947 0.006562 -0.39061 β 0.511646 -0.31352 0.869177 LRT 0.7373 0.4122 1.7131 p - value 0.3905 0.5209 0.19061998-2001 α 1.113205 0.365165 0.351353 β -0.84681 -0.39236 -0.32962 LRT 0.6741 0.4310 0.1599 p - value 0.4116 0.5115 0.68922002-2007 α -1.35115 -0.83989 -0.36268 β 0.510639 0.563952 0.5304 LRT 1.1668 1.1639 0.7969 p - value 0.2801 0.2807 0.37202008-2009 α 0.890085 -1.22568 -1.10348 β -1.22916 0.949599 1.892696 LRT 1.2510 0.7055 1.9281 p - value 0.2634 0.4009 0.1650
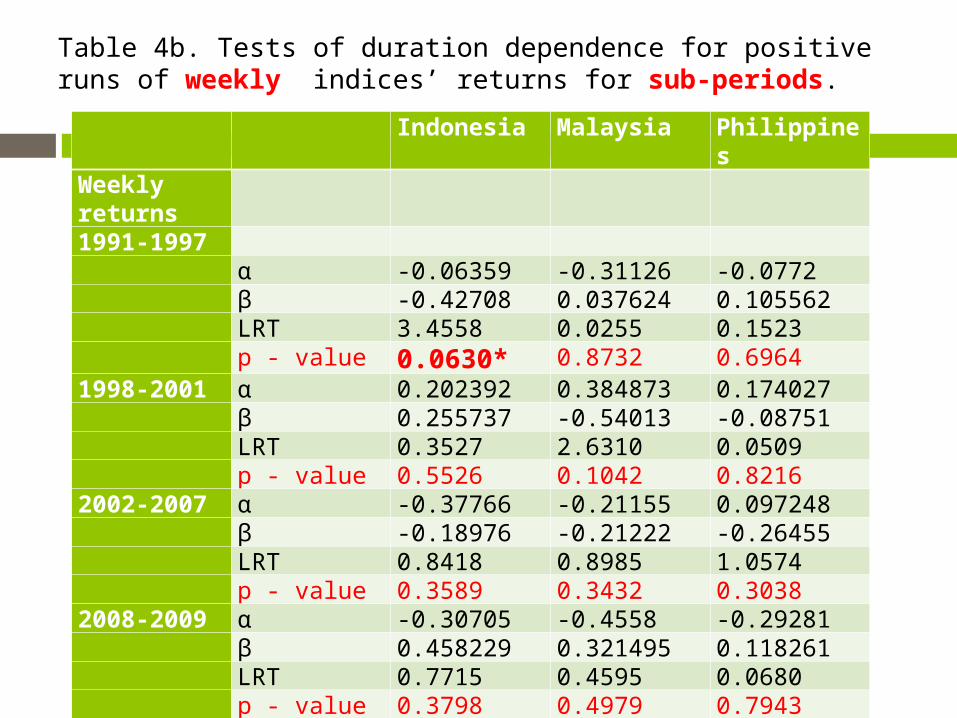
Table 4b. Tests of duration dependence for positive runs of weekly indices’ returns for sub-periods.
Indonesia Malaysia Philippines
Weekly returns
1991-1997 α -0.06359 -0.31126 -0.0772 β -0.42708 0.037624 0.105562 LRT 3.4558 0.0255 0.1523 p - value 0.0630* 0.8732 0.69641998-2001 α 0.202392 0.384873 0.174027 β 0.255737 -0.54013 -0.08751 LRT 0.3527 2.6310 0.0509 p - value 0.5526 0.1042 0.82162002-2007 α -0.37766 -0.21155 0.097248 β -0.18976 -0.21222 -0.26455 LRT 0.8418 0.8985 1.0574 p - value 0.3589 0.3432 0.30382008-2009 α -0.30705 -0.4558 -0.29281 β 0.458229 0.321495 0.118261 LRT 0.7715 0.4595 0.0680 p - value 0.3798 0.4979 0.7943
Sub-periods
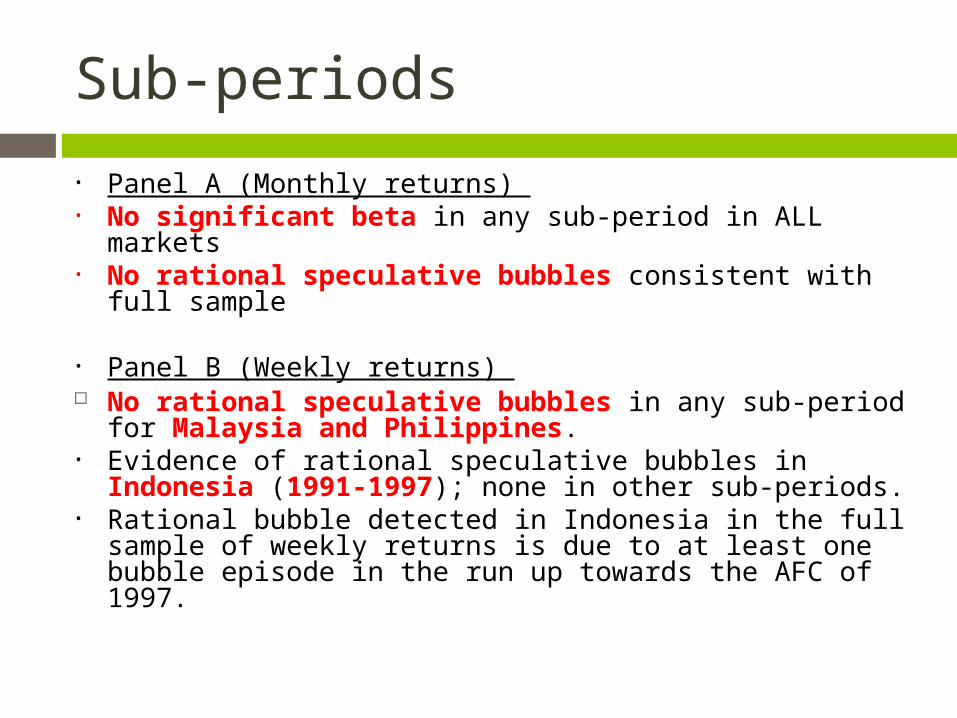
• Panel A (Monthly returns) • No significant beta in any sub-period in ALL
markets• No rational speculative bubbles consistent with
full sample
• Panel B (Weekly returns) No rational speculative bubbles in any sub-period
for Malaysia and Philippines. • Evidence of rational speculative bubbles in Indonesia
(1991-1997); none in other sub-periods. • Rational bubble detected in Indonesia in the full
sample of weekly returns is due to at least one bubble episode in the run up towards the AFC of 1997.
Concluding remarks
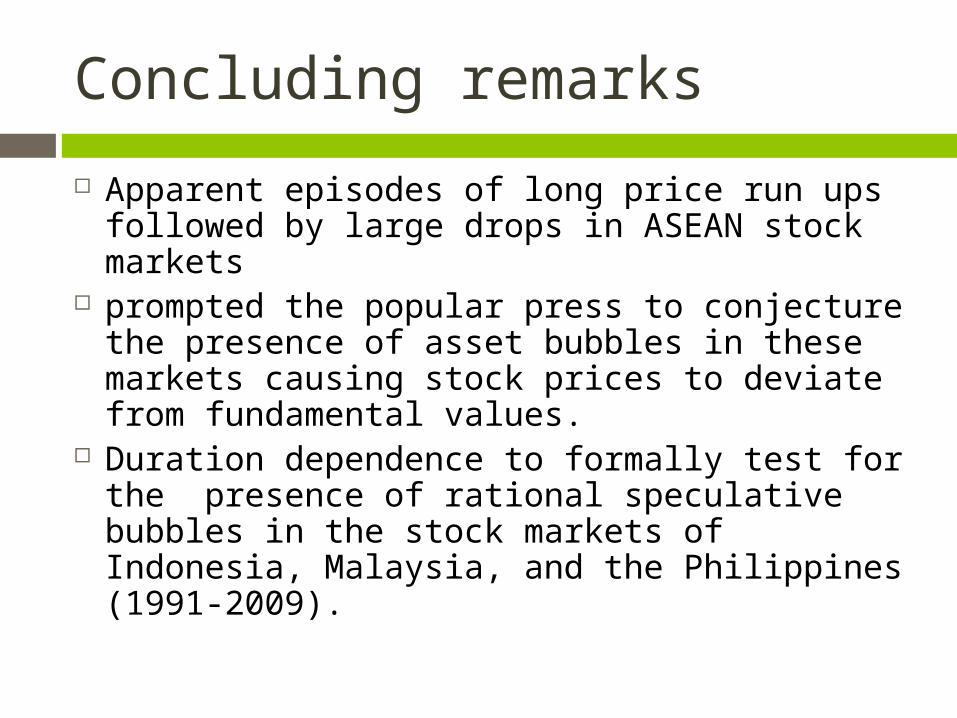
Apparent episodes of long price run ups followed by large drops in ASEAN stock markets
prompted the popular press to conjecture the presence of asset bubbles in these markets causing stock prices to deviate from fundamental values.
Duration dependence to formally test for the presence of rational speculative bubbles in the stock markets of Indonesia, Malaysia, and the Philippines (1991-2009).
Concluding remarks
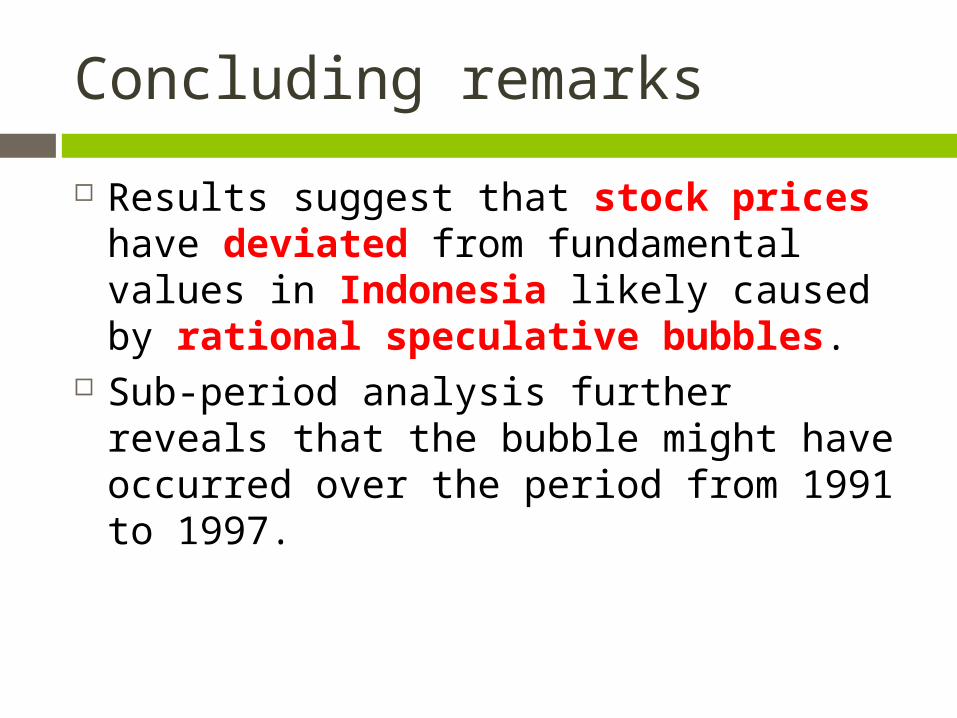
Results suggest that stock prices have deviated from fundamental values in Indonesia likely caused by rational speculative bubbles.
Sub-period analysis further reveals that the bubble might have occurred over the period from 1991 to 1997.

Concluding remarks
We do not detect rational bubbles in Malaysia and the Philippines.
This implies that the long run up in prices and the subsequent drop seen in the months leading up to the AFC and GFC could have been justified by fundamental value changes (ie, no bubble).
However also possible that there was a bubble but caused by irrational investor behaviour.
Or our tests may not be powerful enough to detect bubbles.
We suggest that further research into this area is warranted.

Thank you