Embed Size (px)
Citation preview
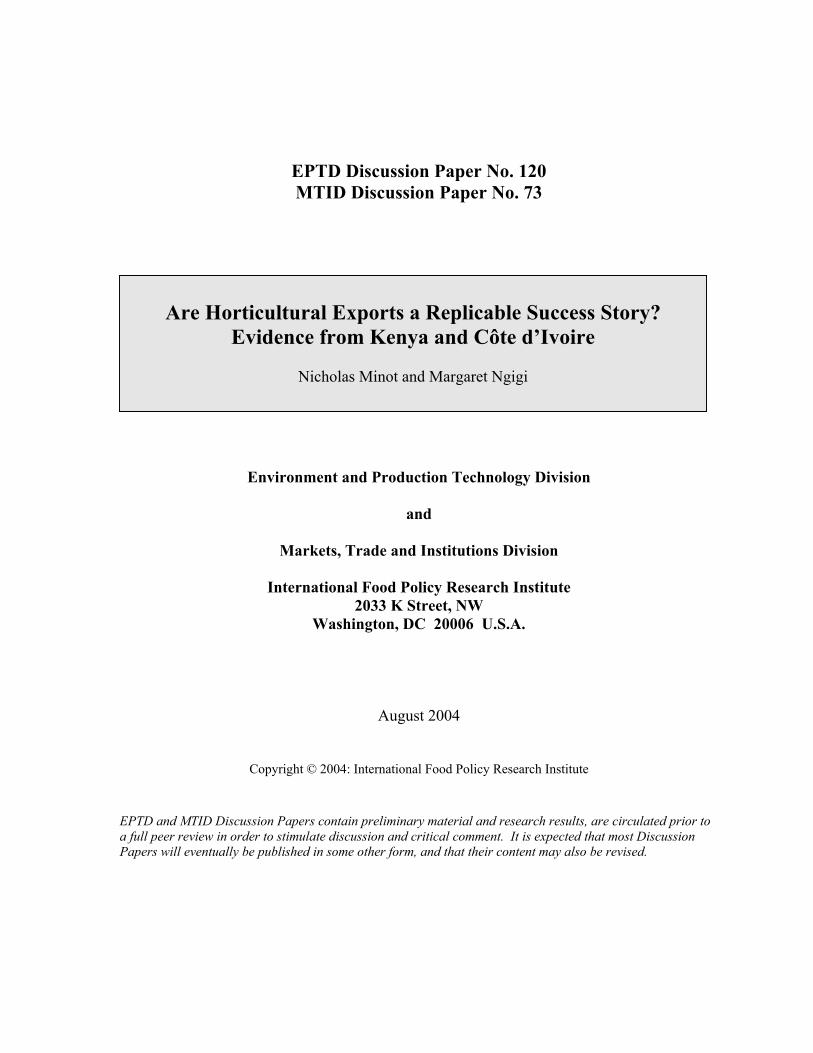
EPTD Discussion Paper No. 120 MTID Discussion Paper No. 73
Environment and Production Technology Division
and
Markets, Trade and Institutions Division
International Food Policy Research Institute 2033 K Street, NW
Washington, DC 20006 U.S.A.
August 2004
Copyright © 2004: International Food Policy Research Institute
EPTD and MTID Discussion Papers contain preliminary material and research results, are circulated prior to a full peer review in order to stimulate discussion and critical comment. It is expected that most Discussion Papers will eventually be published in some other form, and that their content may also be revised.
Are Horticultural Exports a Replicable Success Story?
Evidence from Kenya and Côte d�Ivoire
Nicholas Minot and Margaret Ngigi

i
ABSTRACT
Kenyan horticultural exports are often cited as a success story in African agriculture. Fruit and vegetable exports from Côte d'Ivoire have received less attention, but the export value is similar to that of Kenya. This paper focuses on three questions. First, do the horticultural sectors of Kenya and Côte d'Ivoire constitute valid success stories? Second, what factors have contributed to the success (or lack thereof)? And third, to what degree can the success be replicated in other African countries?
The paper finds that Kenyan horticultural exports are indeed a success story: horticulture has become the third largest earner of foreign exchange, more than half the exports are produced by smallholders, and smallholders gain from producing for the export market. At the same time, the total number of smallholders producing for export is relatively small, and trends in European retailing may shift the advantage to larger producers. Côte d'Ivoire is not as clearly a success story because the most of the exports are produced on large industrial estates and because growth has been uneven. Ivorian exports rely on preferential access to European markets relative to Latin American exporters, raising doubts about sustainability.
Factors in the growth and success of horticultural exports include a realistic exchange rate, stable policies, a good investment climate, competitive international transport connections, institutional, and social links with markets in Europe, and continual experimentation with the market institutions to link farmers and exporters. Smallholder participation is encouraged by farmer training and extension schemes, investment in small-scale irrigation, and assistance in establishing links with exporters.
Many of the lessons of Kenyan horticulture can be applied elsewhere in Africa. Indeed, Kenya faces increasing competition from neighboring countries trying to replicate its success. At the same time, market institutions take time to develop, and demand constraints probably prevent other African countries from achieving the same level of success as Kenya.
Keywords: horticulture, exports, Kenya, Côte d'Ivoire

ii
TABLE OF CONTENTS
1. Introduction 1 2. Historical Background of Kenyan Horticulture 5 3. Fruit and Vegetable Production 23 4. Characteristics of Fruit and Vegetable Growers 32 5. Fruit and Vegetable Marketing 60 6. Comparison with Côte D�Ivoire 72 7. Conclusions 81 References 97

ARE HORTICULTURAL EXPORTS A REPLICABLE SUCCESS STORY? EVIDENCE FROM KENYA AND CÔTE D'IVOIRE
Nicholas Minot1 and Margaret Ngigi2
1. INTRODUCTION
In a recent survey in which experts were asked to identify successes in African
agriculture, horticultural exports were the third most common commodity-specific citation.
About half of the respondents who listed horticulture mentioned Kenya by name (Gabre-
Madhin and Haggblade 2001). It is not difficult to see why Kenyan horticulture is
considered a success story. First, the sector has grown significantly over the past several
decades (Figure 1). The fruit and vegetable exports from Kenya have increased four-fold in
constant dollar terms since 1974, reaching US$ 167 million in 2000. In fact, horticulture has
become the third largest source of foreign exchange after tourism and tea3. Second, small
farmers have participated significantly in the growth of the sector. It is estimated that about
half of Kenyan horticultural exports are produced by smallholders. Although less well-
documented, fruit and vegetable exports in Côte d'Ivoire have also expanded rapidly, rising
4.4 percent annually over the 1990s to match the value of Kenyan fruit and vegetable
exports. Smallholders have also played an important role in exports from Côte d'Ivoire.
After South Africa, Kenya and Côte d'Ivoire are the largest fruit and vegetable exporters in
sub-Saharan African.
1 Research Fellow in the Markets and Structural Studies Division, International Food Policy Research Institute, Washington, D.C. Email: [email protected]. 2 Lecturer, Department of Agricultural Economics and Agribusiness Management, Egerton University, Njoro, Kenya. Email: [email protected]. 3 Coffee and tea have been the main export commodities of Kenya for decades. However, as a result of recent declines in world coffee prices, the export revenue from horticulture passed that of coffee in 2000 (FAOStat 2002).

2
Figure 1--Value of Kenyan fruit and vegetable exports and share of agricultural export revenue
0
20
40
60
80
100
120
140
160
180
61 63 65 67 69 71 73 75 77 79 81 83 85 87 89 91 93 95 97 99
Val
ue o
f fru
it &
veg
etab
le e
xpor
ts (m
illio
n U
S$)
0%
5%
10%
15%
20%
25%
30%
35%
40%
45%
50%
Shar
e of
agr
icul
tura
l exp
ort r
even
ue
Nominal value ofexportsReal value of exports
Source: FAOStat for agricultural statistics and U.S. Department of Commerce for U.S. consumer price index.
This paper uses the cases of Kenya and Côte d'Ivoire to examine the question of
whether horticultural exports represent a replicable success story. This question can be
divided into three parts:
• Do the horticultural sectors of Kenya and Côte d'Ivoire constitute valid success stories in terms of its sustainability and their impact on rural incomes and poverty?
• What factors have contributed to the success (or lack thereof) in the horticultural sector?
• To what degree can the positive aspects of horticultural sector be replicated in other African countries?
In spite of the rapid growth of the horticultural sector in Kenya, the answer to the first
question is not obvious. First, some observers see a trend toward consolidation, in which
small farmers are gradually being squeezed out of the lucrative export market for
horticulture. The argument is that increasing concentration in European retail markets and

3
rising concern over the environmental and labor conditions at the farm-level are pushing
exporters to work with larger farmers, who can more easily document their production
practices (Dolan et al. 1999). Second, it is not clear whether trade liberalization under the
World Trade Organization will benefit African horticultural exporters, by further opening
European markets, or hurt them by eroding some of the preferential access to the European
market that they currently enjoy (Stevens and Kennan 1999). And third, the fact that small
farmers produce most of the exported fruits and vegetables certainly suggests a poverty-
reducing impact, but it is difficult to make any definitive statement without better
information on the number of beneficiaries, the characteristics of the growers, and the size of
the gains.
Even if we assume, for the moment, that the horticultural sectors in Kenya and Côte
d'Ivoire are success stories in terms of growth, poverty impact, and sustainability, an
important question is whether there are lessons that can be applied to other African countries
interested in helping small farmers participate in profitable export markets for horticultural
goods. In other words, are the factors behind their success related to public policy and
investment that other countries can emulate? Or is the success based on historical, climatic,
and geographic factors that cannot be replicated elsewhere? To answer these questions, it is
necessary to understand the historical development of horticulture. We are particularly
interested in the role of policy, the regulatory environment, and public investment in
facilitating the growth of the sector over time.
This paper discusses the case of Kenya in some detail because it is the most widely
recognized success story in horticulture, because the growth of its horticultural sector in
Kenya is well documented, and because we have access to recent household data that shed
4
light on the characteristics of horticultural growers in Kenya. The case of Côte d'Ivoire is
discussed more briefly, mainly to provide a basis of comparison with the Kenyan case. Some
of the similarities between the two countries serve to reinforce the assessment of factors
behind success, while the contrasts demonstrate the diversity of experience across countries.
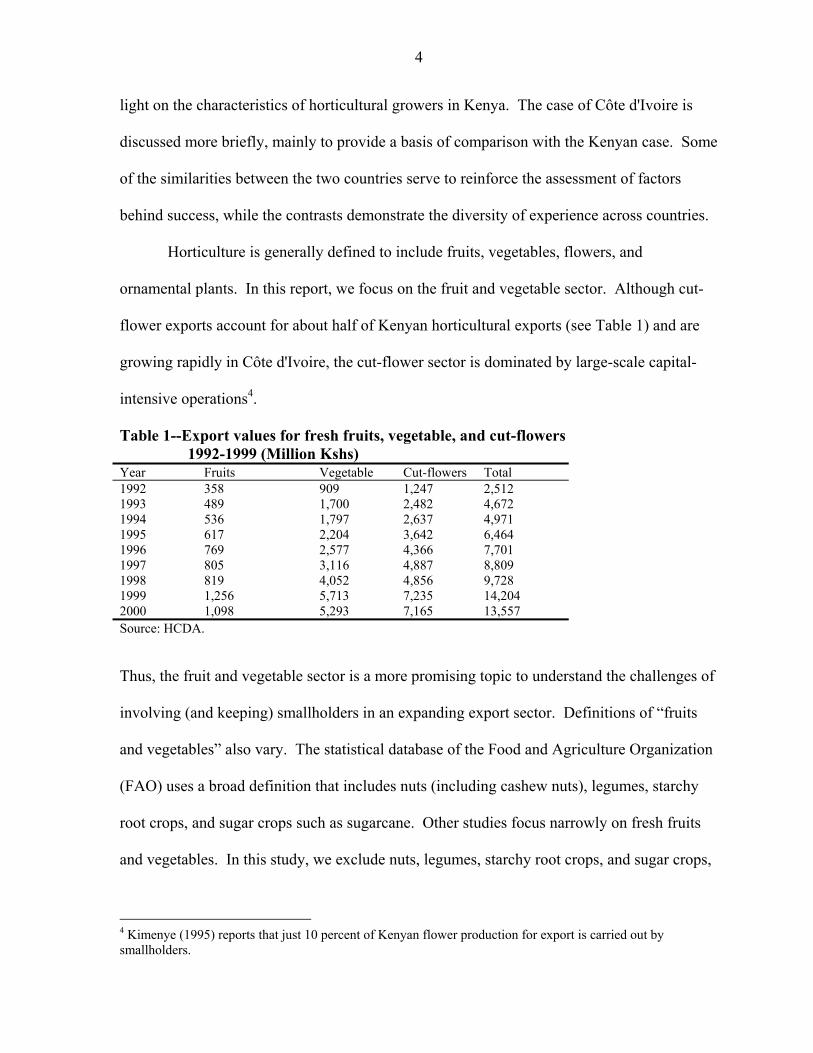
Horticulture is generally defined to include fruits, vegetables, flowers, and
ornamental plants. In this report, we focus on the fruit and vegetable sector. Although cut-
flower exports account for about half of Kenyan horticultural exports (see Table 1) and are
growing rapidly in Côte d'Ivoire, the cut-flower sector is dominated by large-scale capital-
intensive operations4.
Table 1--Export values for fresh fruits, vegetable, and cut-flowers 1992-1999 (Million Kshs)
Year Fruits Vegetable Cut-flowers Total 1992 358 909 1,247 2,512 1993 489 1,700 2,482 4,672 1994 536 1,797 2,637 4,971 1995 617 2,204 3,642 6,464 1996 769 2,577 4,366 7,701 1997 805 3,116 4,887 8,809 1998 819 4,052 4,856 9,728 1999 1,256 5,713 7,235 14,204 2000 1,098 5,293 7,165 13,557 Source: HCDA. Thus, the fruit and vegetable sector is a more promising topic to understand the challenges of
involving (and keeping) smallholders in an expanding export sector. Definitions of �fruits
and vegetables� also vary. The statistical database of the Food and Agriculture Organization
(FAO) uses a broad definition that includes nuts (including cashew nuts), legumes, starchy
root crops, and sugar crops such as sugarcane. Other studies focus narrowly on fresh fruits
and vegetables. In this study, we exclude nuts, legumes, starchy root crops, and sugar crops,
4 Kimenye (1995) reports that just 10 percent of Kenyan flower production for export is carried out by smallholders.

5
but include both fresh and processed fruits and vegetables. Nonetheless, because we use data
from various sources, some discrepancies in definitions are unavoidable.
The paper is divided into seven sections. Section 2 examines the historical
background of horticultural development in Kenya, attempting to identify the driving forces
behind the growth of this sector. In Section 3, we examine the economics of horticultural
production and marketing in order to assess the impact of horticultural on the livelihoods of
growers. Section 4 examines the characteristics of fruit and vegetable growers, using survey
data and case study interviews. Section 5 summarizes the channels used in marketing fruits
and vegetables in Kenya. Section 6 examines the fruit and vegetable export sector in Côte
d'Ivoire in order to provide a point of comparison with the Kenyan case study. And Section
7 summarizes the results and draws some lessons for policy.
2. HISTORICAL BACKGROUND OF KENYAN HORTICULTURE
The growth of the Kenyan fruit and vegetable sector has not been a smooth,
continuous process. Rather, the sector has expanded in fits and starts, with numerous
changes in the commodity mix, the role of the state, the types of marketing institutions, and
the characteristics of the participating farmers. Any division of this complex process is
somewhat arbitrary, but for the purposes of presentation it is useful to divide the evolution of
the sector into five periods: the pre-war colonial period, the post-war colonial period, the
early independence period, from 1974 to 1990, and since 1990.
PRE-WAR COLONIAL PERIOD
Kenya was made a protectorate of Great Britain in 1895 and a British colony in 1920.
Kenya�s commercial horticultural production started taking root during this period.

6
According to Hill (1956), the Imperial British East African Company was experimenting
with temperate fruits and vegetables as early as 1893. In 1901, colonial white settler farmers
founded the East African Agricultural and Horticultural Society (presently the Agricultural
Society of Kenya). At the same time, Indians recruited to construct the Kenya-Uganda
railway had introduced Asian vegetables5, which today accounts for about 10% of the total
volume of the country�s fresh horticultural exports.
The beginnings of Kenya�s formal horticultural research activity also traces to the
period. According to M�Ribu et. al (1993), the colonial government was, by 1911
experimenting with tropical fruits at Matuga along the Indian coast (this later became the
Matuga Agricultural Research Station). Later in 1920, a second experimental site for tropical
fruits was established close to where the National Agricultural Laboratories is currently
located. In 1931, the Department of Agriculture embarked on a plant introduction service to
facilitate the adoption of and expansion of area planted with crops developed in the
experimental stations.
According to Martin (1973, cited in Jaffee 1995), trade in small quantities of
vegetables and tropical fruits already existed along the coast with Arab and Indian traders
exporting the produce to Zanzibar. In the 1930s, low commodity prices motivated some
European farmers to grow passion fruit. Four small factories were constructed to produce
passion fruit juice for export to South Africa and Australia. A Passion Fruit Board was
created by the colonial authorities to provide technical assistance and regulate trade.
However, the quantities were modest, and both production and processing collapsed with the
disruption of trade during World War II (Jaffee 1994).
5 �Asian vegetables� include eggplant, chillis, dudhi, karela, okra, and other vegetables used widely in South Asian cooking

7
Thus, the roots of the commercial horticultural sector were established during this
period. Lack of official attention to marketing of horticultural produce resulted in a situation
in which any impetus for expanding the production or commercialization of horticulture
came from the private sector. However, given the limited domestic market and the high costs
of transportation to external markets, it is debatable whether more supportive policies and
public investment would have stimulated more rapid development of the sector.
POST-1940 COLONIAL PERIOD
World War II stimulated the development of horticultural production and processing
in two ways. First, regular trade flows were disrupted by hostilities, reducing the availability
of imported horticultural goods. Wartime regulations meant tight controls on imports,
particularly on commodities not considered essential to the economy. As a result, domestic
producers and processors benefited from a larger domestic market, even if consumers were
paying higher prices for the goods.
Second, faced with high wartime-demands, especially for provisions to the Allied
forces in North Africa and Middle East, the authorities launched a project to produce
dehydrated vegetables. As part of this project, dehydration factories were constructed in
Kerogoya and Karatina. Some of the raw materials were supplied by large �nuclear estates�
managed by the processors. Much of the raw material supplies, however, was sourced from
small-scale African farmers in the surrounding areas. To boost production, irrigation schemes
were developed in swampy areas for collective farming by African. These farmers were
organized to supply potatoes, cabbage, carrots, and other vegetables to the factories. They
were given improved seed, technical assistance, and a guaranteed market for their output. In
spite of initial problems, the project eventually expanded to process 22,000 tons of produce

8
sourced from 13,500 small-scale farmers. After the war, the demand for dehydrated
vegetables by the military dried up. Although there was some consideration of the option of
maintaining the two factories, there was opposition from settlers who had established their
own canneries during the war. By 1947, both plants were dismantled.
As Jaffee (1995) notes, the scheme was relatively short-lived, but was a pioneering
effort in several ways. It demonstrated that African farmers could be mobilized for
commercial agricultural production of new crops if inputs, technical assistance, and a stable
market could be provided. This model was later adopted in various cash-crop programs such
as the one implemented by the Kenya Tea Development Authority. In addition, it
represented one of the earliest large-scale irrigation schemes, again serving as an example to
be followed later, most notably in the Mwea Irrigation Scheme.
This period also saw the expansion of experimental works started in the previous
period. By 1946, experimentation with tropical zone fruits had expanded to Tigoni (now the
location of the Potato Research Centre), Molo and Kitale agricultural research stations and in
1955, the Perkerra Irrigation Research Station started work on hot season fruits and
vegetables. The National Horticultural Research Center was started in 1957 at Thika.
In the late 1940s, two British companies built pineapple-canning factories in Kenya to
supply the United Kingdom. When they started operations, both factories sourced their raw
material from large-scale settler farms. In 1954, the Swynnerton Plan called for government
assistance to increase the participation of smallholders in the production of cash crops such
as coffee and tea. Part of this plan was to increase the role of smallholders in supplying raw
materials to the pineapple processing plants. Smallholders were subsequently provided with
planting materials, technical assistance, and a guaranteed market. Early efforts suffered a

9
number of serious problems including under-staffing, production in inappropriate zones, and
violence associated with the independence movement. In spite of these problems,
smallholders accounted for 75 percent of the supply of pineapples to these factories by the
early 1960s (Winter-Nelson 1995; Kimenye 1995; Jaffee 1994).
Thus, during the post-war colonial period, horticultural development was still very
limited. At independence, in 1963, fruit and vegetable exports were just US$ 3.8 million (or
US$ 19 million in 1995 dollars), representing less than 3 percent of agricultural exports (see
(Figure 1). Nonetheless, the wartime dehydrated vegetable scheme demonstrated the
feasibility of engaging smallholders in commercial horticultural production, given the right
institutional support. And the Swynnerton Plan provided further support for the concept of
smallholder production of commercial crops, even if the implementation was plagued with
difficulties.
EARLY INDEPENDENCE
Independence brought three significant changes to the horticultural sector in Kenya.
First, the new government came into power giving higher priority to improving conditions
for the African majority. A land reform program was launched in which the government
purchased most of the land farmed by Europeans (particularly in the western highlands) and
distributed it to tens of thousands of African smallholders. Because of the relatively good
soils and location of this region, this program expanded the opportunities for smallholder to
become involved in horticulture and other forms of commercial agriculture. Furthermore,
social considerations weighed heavily in public investment and regulatory decisions. A
series of state enterprises were created (some from analogous colonial organizations) to
implement the development goals of the government.

10
The second change was the creation of the Horticultural Crops Development
Authority (HCDA) in 1967. Although the marketing boards for other crops generally played
a direct role in buying and selling agricultural commodities, often with a legal monopoly on
marketing, the HCDA played a more facilitative role, attempting to coordinate various
participants in the industry6. This was partly a matter of practical necessity, since HCDA had
limited staff and resources. Even with a larger budget and staff, however, state enterprises
rarely have the agility and skills necessary to deal with the diversity of the sector and the
perishability of the product. Several researchers have noted that the fact that the HCDA did
not attempt to directly manage and control horticultural trade probably allowed the sector to
develop more rapidly (Kimenye 1995; Djikstra 1997; and Harris et. al 2000).
The third change in the post-independence period is the growth of international
investment in the Kenyan horticultural sector. The most important example of this was the
entry of Del Monte into the Kenyan pineapple sector. In 1965, one of the two pineapple
factories, Kenya Packers, came under the control of Del Monte (then called the California
Packing Corporation), the largest fruit processor in the world. Although Del Monte invested
in the factory and applied its technical and marketing expertise, the sector grew slowly and
remained only marginally viable. According to Del Monte:
In spite of a Government-sponsored drive to encourage quality pineapple production
by smallholders, it soon became clear that these smallholders could not provide the necessary
quantities on a regular basis to keep the canning plant consistently and profitably in
operation. Many outgrowers chose instead to sell their crop to the local fresh fruit market
6 Initially, the HCDA was given a legal monopoly on onion exports, but this proved unsuccessful and was abandonned in 1986.

11
where they could fetch better prices, while much of the locally grown fruit was not of a
quality suited to the demands of Del Monte�s stringent standards (Del Monte, 1988).
In 1968, Del Monte arranged to lease 9000 hectares of land from the government to
develop a nucleus estate to produce pineapple for the factory. This would insulate Del Monte
from changes in pineapple supply due to farmers selling on the fresh market or switching to
coffee when world prices were high. Furthermore, mechanization and hormone applications
allow the estate to spread production over much of the year, keeping the plant in operation
longer. The capacity of the processing plant and the nucleus estate were expanded over time
and, by 1974, purchases from smallholder outgrowers was discontinued.
In addition to Del Monte, other international companies came to invest in Kenya. A
joint venture was formed between Cottees, an Australian firm, and a government parastatal.
Kenya Fruit Processing (KFP) developed processing facilities and tried to stimulate local
production. The Horticultural Crop Development Authority (HCDA) assisted by providing
seedlings, sprayers, chemicals, and other inputs on credit. By the early 1970s, KFP was one
of the largest exporters of passion fruit juice in the world (Jaffee 1995).
Not all of the foreign investment projects were successful. A joint venture between a
British company and a Kenyan parastatal established a vegetable dehydration plant in
Kinangop, a cool, highland area with a new smallholder settlement scheme but relatively low
agricultural potential. The government�s interest in the scheme was to provide a marketing
outlet for resettlement farmers in Kinangop, while the foreign partners were attempting to
develop a viable commercial operation. Conflicts between these two objectives occurred
often and by 1968, the company was close to bankruptcy. The government purchased the
plant and paid off debts to protect the interests of smallholders in the area, but the factory

12
continued to incur losses. In 1973, a new joint venture with a German firm was implemented
with a more commercial orientation. The scheme did well in the mid-1970s, but eventually
closed in 1982. The international market for dehydrated vegetables had contracted, while the
local market for fresh vegetables had expanded and resulted in significant �leakage� that the
company could not control.
Thus, the early independence period was characterized by more active support for the
incorporation of smallholders in commercial agriculture, the formation of the Horticultural
Crops Development Authority, and increasing investment in horticulture, including
international investment. The processing sector was dominated by joint ventures between
foreign companies and state enterprises, often working toward different objectives. Between
1963 and 1974, fruit and vegetable exports grew from US$ 3.8 million to US$ 10 million,
representing a growth rate of 4.4 percent per year in real terms. The contribution of fruits and
vegetables to total agricultural exports remained at slightly less than 3 percent because other
agricultural exports grew at a similar rate (see Figure 1).
TAKE-OFF (1974-1990)
Starting around 1974, Kenyan fruit and vegetable production and exports began to
grow more rapidly. Overall, fruit and vegetable exports rose to US$ 95 million in 1990 or
8.0 percent per year in real terms over the period 1974-90. The importance of fruit and
vegetable exports in overall agricultural exports increased dramatically during this period.
Whereas fruits and vegetables accounted for about 3 percent of agricultural export earnings
in the 1960s and early 1970s, by 1990 its contribution had reached 14 percent (see Figure 1).
In the mid-1970s, this growth was driven by investments that increased the capacity
of the Kenyan pineapple processing industry, led by Del Monte. Between 1974 and 1977,

13
pineapple product exports grew more than six-fold, so that, by 1977, they accounted for 65
percent of Kenyan fruit and vegetable exports. In contrast, the growth in the late 1970s and
1980s was driven by the growth in exports of fresh vegetables and, to a lesser degree, fresh
fruit (see Figure 2). The diversification into fruits and vegetables was partly motivated by
world commodity prices. After peaking in 1977, coffee and tea prices fells sharply in the
following years, forcing many farmers to look for alternative income-generating crops.
Figure 2--Trends in the composition of Kenyan fruit and vegetable exports
Green beansFresh vegetables
Canned pineapples
Pineapple juice (SS)Other fruit
Other vegetables
0
20
40
60
80
100
120
140
160
180
61 63 65 67 69 71 73 75 77 79 81 83 85 87 89 91 93 95 97 99
Val
ue o
f fru
it &
veg
etab
le e
xpor
ts
(200
0 U
S$ m
illio
n)
Source: FAOStat for agricultural statistics and U.S. Department of Commerce for U.S. consumer price index.
At the same time, export demand for vegetables grew in the 1970s as an indirect
effect of the expulsion of the South Asian community from Uganda under the regime of Idi
Amin. Many of these refugees resettled in the United Kingdom, contributing to the growing
Asian community there and a demand for Asian vegetables. Kenya offered several
advantages as a source to meet the growing demand for Asian vegetables. It could supply

14
Asian vegetables throughout the year instead of on a seasonal basis. In addition, Kenyan
smallholders already had experience growing Asian vegetables for the local Asian
community. In fact, there were small exports of Asian vegetables to the UK as early as 1952
(Kimenye 1995). And finally, the presence of an Asian community in Kenya meant that
there were family and social ties between Asian traders in London and those in Nairobi,
reducing the risk and transaction costs in expanding this trade (Djikstra 1997).
Another factor in the growth of fresh fruit and vegetable production is the growth in
the Kenyan tourism industry. By 1980, Kenya was receiving 372 thousand international
tourists per year, more than any other African country after South Africa (World Bank 2002).
Although canned goods can be transported by ship from Africa to Europe, fresh produce
generally must generally be air-freighted7. When export volumes were too small to justify a
charter cargo jet, the cargo capacity of passenger jets provided a means of air-freighting
Kenyan produce to Europe (later, as volume increased, cargo jets were used more widely).
In addition, the tourism industry increased the demand for high-quality fruits and vegetables
by hotels and restaurants, giving Kenyan farmers more experience in horticultural production
and an outlet for produce not meeting export standards. Thus, the horticultural sector in
Kenya has benefited from the development of Nairobi as a regional hub and as an important
tourism destination.
The growth in Kenyan horticultural exports is also linked to the increasing
involvement of smallholders in the sector. In the early 1970s, no more than several hundred
smallholders were producing for the fresh fruit and vegetable export market, accounting for
just 10-20 percent of the total volume. As mentioned above, low international prices for
7 A major exception is bananas and pineapple. As discussed in Section 6, Côte d'Ivoire exports bananas and fresh pineapple to Europe on specially-designed refrigerated ships. In fact, bananas are transported from Latin America to Europe by ship.

15
coffee and tea made it economical to involve smallholders in export horticulture. Coffee
prices boomed again in the 1980s, but by then many smallholders had acquired skills in
horticultural production. At least as important, exporters began to recognize the potential of
smallholder to meet the growing European demand. By the mid-1980s, Jaffee (1995)
estimates that there were 13-16 thousand smallholders involved in growing fresh produce for
export. They accounted for 40-65 percent of the supplies of French beans, Asian vegetables,
mango, avocado, and passion fruit for export.
The learning process required to organize smallholder production for export is
illustrated by the history of Yatta. Yatta has an irrigation scheme built in the 1950s and a
resettlement community dating from the 1960s. Vegetable marketing was limited, however,
until the road connecting it to Nairobi was paved in 1980. Yatta farmers formed a self-help
group to find a reliable market for their vegetables. The group linked up with Kenya
Horticultural Exports, one of the largest fresh vegetable exporters. Initially KHE contracted
the group to provide vegetables, supplying seed and inputs on credit. The system worked
until other buyers began entering the region and �poaching� the output committed to KHE,
allowing farmers to avoid repayment of loans. Drought and non-repayment caused the
collapse of the input supply system, but KHE continues to buy from the region, competing
with many other traders (Jaffee 1995). The export of fresh vegetables other than French
beans was US$ 63 million in 2000 (see Table 2). Although, it is difficult to document, much
of these exports are thought to be Asian vegetables.

16
Table 2--Composition of Kenyan exports of fruits and vegetables (2000) Type of Fruits
Value (1000 US$)
Percent
Fruits 53,569 100.0 Canned pineapples 33,383 62.3 Pineapple juice 9,853 18.4 Fruit tropical fresh 5,153 9.6 Mangoes 2,556 4.8 Prepared fruit 821 1.5 Fresh fruit 595 1.1 Fruit juice 448 0.8 Pineapples 255 0.5 Apples 125 0.2 Citrus 102 0.2 Others 278 0.5 Vegetables 113,100 100.0 Fresh vegetables 63,827 56.4 Green beans 37,584 33.2 Prepared vegetables 10,495 9.3 Frozen vegetables 504 0.4 Green peas 276 0.2 Leeks & other alliac. veg 183 0.2 Cabbages 155 0.1 Others 76 0.0 Total 166,669 Source: FAO Stat. .
Smallholders also play an important role in growing French beans for export. Fresh
and canned French beans have become one of the most important horticultural exports from
Kenya. Although Kenya has long exported French beans to Europe, the volume began to
increase in the 1970s. Initially, exports were limited to the winter-spring months when
European producers cannot supply. However, the advantages of lower labor and land costs,
combined with the rising need for suppliers that can provide produce throughout the year
resulted in a shift toward sourcing French beans and other vegetables in North Africa and
sub-Saharan Africa. This growth was the result of continuous experimentation by farmers
and traders with alternative institutional arrangements. Jaffee (1995) describes the
tumultuous history of Njoro Canners and Hortiequip as they tried alternative institutional
arrangements to provide inputs on credit, obtain reliable high-quality supplies, and ensure
17
repayment of loans. At its peak, in 1990, this scheme had 24 thousand contracted
smallholder farmers growing French beans and other vegetables.
Not all fruit and vegetable production for export is grown by smallholders, however.
Del Monte had been expanding its nucleus estate pineapple capacity for some years when, in
1974, it stopped purchasing pineapples from smallholders and began relying entirely on its
own production. Technological change in production and increasing international
competition were encouraging larger-scale operations and vertically integrated producer-
processor operations. According to Jaffee (1994), the trend toward large-scale production of
pineapple was occurring in other exporting countries such as the Philippines, Thailand, and
Taiwan. Del Monte canned pineapple exports increased by a factor of five between 1974 and
1977, reaching 45 thousand metric tons. Currently, Kenya exports US$ 33 million in canned
pineapple, making it the most important horticultural export. In addition, pineapple juice
exports are in the range of US$ 10 million, making them the fifth largest horticultural export
(see Table 2).
Thus, this period was characterized by impressive growth in the production and
export of fruits and vegetables, particularly pineapples, Asian vegetables, and French beans.
By 1988, Kenya was the main supplier of fresh and chilled vegetables to the 12 countries
then in the European Union (Dolan et al 1999).
NEW CHALLENGES (1990 TO THE PRESENT)
According to the FAO, the growth of Kenyan fruit and vegetable exports slowed in
the 1990s. The export value rose from US$ 95 million in 1990 to US$ 167 million in 2000,
representing an annual growth rate of 2.7 percent in real terms. Similarly, its share in overall
agricultural exports remained in the range of 10-15 percent, though it rose to 18 percent in

18
2000 (see Figure 1). On the other hand, statistics from the Horticultural Crop Development
Authority (HCDA) show strong growth, at least in volume, during the 1990s (see Tables 4
and 1). The discrepancy may be related to different definitions of horticulture. The FAO
Table 4--Export volumes for fresh fruits, vegetables, and cut-flower 1992-2000 Year Fruits Vegetable Cut-
flowers Total
1992 11,232 26,323 19,806 57,363 1993 11,697 26,765 23,635 62,119 1994 13,079 26,878 25,121 65,178 1995 13,865 32,126 29,373 71,758 1996 16,869 32,742 35,212 84,523 1997 17,450 30,880 35,850 84,180 1998 11,350 36,800 30,220 78,370 1999 15,595 46,377 36,992 98,964 2000 14,669 43,400 36,480 94,550 Annual growth rate
3.4%
6.4%
9.0%
6.4%
Source: HCDA.
data refer to fresh and processed fruit and vegetables exports, while the HCDA figures
include cut flowers, which have grown rapidly, and exclude processed fruits and vegetables,
which have declined in the 1990s. The difference may also reflect changes in the
composition of horticultural exports or declining prices.
Although revenue growth has slowed, fruit and vegetable exports have become more
diversified. The importance of canned pineapple in fruit and vegetable export revenue fell
from 40 percent in 1990 to 20 percent in 2000 (see Figure 2). This is partly due to the
decline in canned pineapple exports (under pressure from Thailand and other exporters) and
partly due to the expansion in fresh fruit and vegetable exports over this period. Although
French beans, Asian vegetables, canned pineapple, and avocados dominate exports, Kenya
now exports 30 different fruits and 27 vegetables (Thiru 2000). In spite of increased
19
competition from Côte d�Ivoire, Morocco, Zimbabwe, South Africa, and Cameroon, Kenya
continues to be the most important supplier of vegetables to the European Union.
Nonetheless, Kenya and other horticultural exporters face new challenges related to
changes in the structure of consumer demand and to the transformation of the food retail
market in Europe. Kenya�s ability to maintain and strengthen its role in horticultural exports
will depend on its ability to adapt constructively to these changes.
Rise of supermarkets In 1989, 33 percent of the fresh fruits and vegetables in the
United Kingdom were sold by supermarkets. By 1997, this share had increased to around 70
percent (Evans 1999). Furthermore, even among supermarkets, chains have increased their
market share. According to Dolan et al (1999), UK supermarket chains increased their
market share in fresh fruits and vegetables from 63 percent in 1994 to 76 percent in 1997.
This trend is also occurring in continental Europe. Increasingly, these supermarket chains
are bypassing wholesalers to negotiate directly with exporters in Kenya and other countries.
This creates a more direct link between consumer demand in the importing countries and
producers in the exporting countries. In the interest of protecting their reputation, these
supermarket chains are imposing new restrictions and even organizing production in
developing countries. The managing director of Homegrown (Kenya) Ltd, one of the largest
horticultural exporters, stated that �Rarely [does] Homegrown grow anything unless a
supermarket has programmed it.� (Evans 1999?).
Increasing concern over food safety. European consumers are increasingly aware of
the health consequences of pesticide residues. Even consumers who are not part of the
growing �organic food� movement (which is stronger in Europe than in the United States)
are increasingly wary of agricultural chemicals. In 1990, the U.K passed the Food Safety Act
20
which obliged food retailers to demonstrate �due diligence� to ensure that the food they sell
is safe. In practice, this means that supermarkets have become much more involved in
imposing requirements on how food is produced throughout the commodity supply chain,
even to the degree of monitoring and controlling horticultural production in developing
countries (Dolan et al 1999). Minimum residue levels (MRLs) of pesticides have become a
focal point for this concern. The Fresh Produce Exporters Association (FPEAK) has
produced a 31-page Code of Practice for growers (FPEAK 1999). The Code covers
employment practices, agro-chemical application procedures, land use guidelines, and so on.
The last two pages provide a 14-step documentation procedure for ensuring the traceability
of produce being handled by the exporter. This is an important step in establishing a
common set of standards regarding safe handling of fresh fruits and vegetables and
disseminating the information. However, some aspects of the Code imply significant costs
and there are currently no enforcement mechanisms.
Increasing demand for convenience. European consumers, like those in other
industrialized countries, are demanding some forms of prepared fresh fruits and vegetables.
This preparation can includes washing, peeling, cutting, packaging in small units, pre-mixed
vegetables, and so on. Because these activities are labor-intensive, they raise the opportunity
for adding value in the exporting country.
Competition from other suppliers. Kenya horticulture currently enjoys duty-free
access to European markets as a result of the Lomé Agreement, which was recently renewed
for the period 2000-2005. Trade liberalization will, therefore, probably erode this
preferential access. An analysis by Stevens and Kennan (1999) indicates that Kenya may

21
eventually face greater competition from Egypt, South Africa, Chile, Brazil, and Thailand if
the EU liberalizes imports.
Even without trade liberalization, horticultural markets are highly competitive subject
to rapid shifts in export competitiveness. Jaffee (1995) describes the turbulent history of
attempts to expand exports of dehydrated vegetables, passion fruit juice, and pineapple
products, including several bankruptcies and government buy-outs. Kenya lost the European
fresh pineapple market to Côte d�Ivoire in the 1980s, it was squeezed out of avocado exports
to Europe by the higher quality of Israeli and South African products, and it lost the
European market for courgettes, sweet peppers, and other temperate vegetables by European
and Mediterranean suppliers. Yet it has shown resilience in finding new markets and
expanding its exports of French beans, Asian vegetables, and cut flowers. This experience
suggests that it would be difficult for the government to �pick winners� in order to target
assistance toward crops with high potential. Export comparative advantage evolves
continuously in response to changes in markets, technology, and other competitors. A better
strategy would be to provide infrastructure and other public goods and facilitate investment
in general, allowing private firms to test the competitiveness of each sector.
How have these trends affected the participation of smallholders in Kenya�s fruit and
vegetable export sector? There is some concern that the expanding role of supermarkets and
the increasing importance of food safety certification will result in consolidation of the fruit
and vegetable export sector since only the larger exporters can provide the reputation,
documentation, and volume that supermarkets are now demanding. Furthermore, these
shifts may lead to consolidation in horticultural production for export. It is much easier for a
supermarket or an exporter to verify that proper production practices are being followed on a

22
handful of medium- and large-scale farms than it is to monitor 100 or 200 small-scale
growers. The concept of �traceability� has risen in prominence. Only if a given lot of
produce can be traced back to its original producer can the producer be held accountable for
problems with quality or pesticide residues (see Dolan et al 1999 and Dolan and Humphrey
2000).
Estimates from the early 1990s suggest that over half of the export fruit and vegetable
production was supplied by smallholders (see Kimenye 1995 and Jaffee 1995). More
recently, the Horticultural Crops Development Authority estimated that 40 percent of
exported fruit and 70 percent of exported vegetables are produced by smallholders (Harris et
al 2001). Given the greater importance of vegetable exports, this implies that 55-60 percent
of fruit and vegetable exports are still produced by smallholders. Dolan and Humphreys
(2000) make the case that smallholders are being squeezed out of export production because
of the difficulty of ensuring compliance with food safety and quality requirements imposed
by supermarkets and other buyers. They argue that these requirements are leading exporters
to grow their own produce or purchase from large-scale commercial farms. According to
their interviews with four leading exporters, just 18 percent of vegetables for export come
from smallholders.
On the other hand, these four large exporters are probably not typical of other
exporters. Furthermore, exporters may wish to under-report the share of their production that
comes from smallholders to satisfy European buyers who are suspicious of smallholder
quality control (Harris et al 2001). Jaffee (2003) interviewed several dozen exporters and
estimates that smallholders account for 27 percent of exported fresh vegetables and 85
percent of exported fresh fruit, for an average of 47 percent of fresh fruit and vegetable

23
exports8. He points out that, although the dominance of U.K. supermarkets has increased,
about 60 percent of the Kenyan fresh fruit and vegetable exports are sold to U.K. wholesalers
and other European countries which have much less strict food safety and quality
requirements.
3. FRUIT AND VEGETABLE PRODUCTION
Fruits and vegetables in Kenare grown on a wide range of different types of
conditions, from small farms with less than two hectares using family labor to large-scale
commercial farms with over 100 hectares and advanced technology. This section describes
some of the main patterns found in Kenyan fruit and vegetable production based on findings
from previous studies, case studies drawn from our own farmer interviews, and the results of
the 2000 Rural Household Survey (RHS). The 2000 RHS was carried out by Egerton
College, Tegemeo Institute, and Michigan State University. The sample included 1512 rural
households designed to be representative of the agricultural regions of Kenya9. The RHS
collected information on crop production and marketing, the use of inputs, access to credit,
income, and farmer decision-making regarding maize marketing and storage. The income
section gathered information on income from livestock operations, non-farm household
enterprises, and wages. For our analysis, we focus on the 1482 households (98 percent) who
were involved in crop production.
8 Neither Dolan and Humphry (2000) nor Jaffee (2003) provide the definitions used to classify farms as small, medium, or large, but Ngigi (2002) defines smallholders as those farming 1-2 acres (0.2-0.4 hectares) in high-rainfall zones and 5-10 acres (2-4 hectares) in semi-arid zones (Ngigi 2002). 9 The sampling design excluded arid and semi-arid areas used primarily for extensive grazing. It appears that the sample was designed to include large-scale commercial farms since the largest farm in the sample has 82 hectares. Even so, the small number of observations for large-scale farms (there are eight farms with more than 20 hectares) makes it difficult to draw reliable conclusions regarding these farms from the survey data.

24
PRODUCTION TECHNOLOGY
Land As mentioned above, fruits and vegetables in Kenya are grown on everything
from tiny garden plots of 50 m2 to industrial plantations covering hundreds of hectares. The
size of the farms varies across crops depending partly on the economies of scale in
production and processing. Pineapples for canning are grown by Del Monte on vertically
integrated pineapple plantations covering 4,000 hectares (Del Monte, 1988). The vertical
integration allows Del Monte to stagger production using plant hormones, thus providing a
steady supply of pineapples for processing. In contrast, mango and avocado exports are
produced largely by smallholders. Jaffee (2003) reports that large-scale commercial growers
have not been able to compete with smallholders who have lower labor costs and greater
motivation to provide careful husbandry.
French beans are grown by both small and large farms. ECI (2001) distinguishes
three categories of French bean grower. Large commercial farms have 50-100 hectares and
grow various types of vegetables for export using hired labor and modern technology. They
are either owned by exporters or have formal contracts with large exporters. Small- and
medium-scale contract growers may have as little as 0.25 hectares of French beans, but the
exporter provides seed and sometimes chemicals on credit. They hire about 15 laborers per
hectare of French beans planted. The third category is independent smallholders who have 1-
5 hectares but only plant a fraction of this with French beans. Without a contract, they use
less purchased inputs, often recycle seed, and sell at lower prices due to differences in quality
and/or variety.
One survey of farmers on a main road near Nairobi found that growers of
horticultural export crops had owned an average of 2.7 hectares, compared to 1.2 hectares for
other farmers in the vicinity (McCulloch and Ota 2003). Similar results are found in the

25
Rural Household Survey: French bean growers had an average of 2.9 hectares, of which 0.8
hectares were planted with French beans. Three-quarters of the French bean growers had
less than three hectares of land and 86 percent planted less than one hectare of beans, but one
farmer planted more than 10 hectares of French beans.
Irrigation An estimated 84 thousand hectares of Kenyan crop land are irrigated,
representing about two percent of the total. Six large-scale public irrigation schemes account
for 10 thousand hectares, most of which are devoted to rice and cotton production. These
schemes are operated by the National Irrigation Board which supplies inputs, dictates
cropping decisions, and controls the marketing of the output of the tenant farmers. The
irrigated area under these large-scale schemes has remained stagnant over the last 30 years,
and all have suffered problems of dependence on government subsidies, declining
government services, and farmer complaints. Indeed, two of the six schemes are essentially
non-operational, while the largest one, the Mwea Irrigation Scheme, faced a tenant rebellion
in 1998 in which farmers refused to deliver their rice to the NIB10. The near collapse of the
rice input delivery system has prompted many farmers in the Scheme to turn to horticulture
(Ngigi 2002; Kabutha and Mutero 2002; Onjala 2001).
Another 40 thousand hectares are irrigated by large-scale private farms growing high-
value crops such as flowers and horticulture for export. These farms use boreholds and water
pumps, often distributing the water by drip irrigation.
10 The Mwea Irrigation Scheme (MIS) is the largest public irrigation scheme in Kenya, covering almost 6000 hectares and supporting 3000 families. Farmers in the scheme are tenants and are obliged to grow rice, following production methods specified by the National Irrigation Board (NIB). Horticultural production has developed both inside and outside the MIS, sometimes using water diverted from the canals. In 1998-99, the tenants rebelled against the NIB, refusing to sell their rice to the NIB and demanding better prices and more flexibility. The services provided by the NIB to rice farmers have deteriorated, and many farmers have turned to horticulture (Onjala 2001; Nguyo et al 2002).
26
Finally, about 35 thousand hectares are under small-scale irrigation schemes.
Although this categories includes some schemes supported by the government, the fastest
growing category is farmer-organized smallholder irrigation systems in which a group of
farmers share the cost of a pump and/or the distribution system. In this system, only a small
part of each farm, such as 0.25-0.50 hectares, is irrigated for high-value production, while
maize and other staple foods are grown on the rest of the farm (Ngigi 2002).
The rapid growth of smallholder irrigation systems has been accompanied by new
irrigation technologies. Small-scale drip irrigation systems have been introduced by
missionaries, improved by the Kenya Agricultural Research Institute, and disseminated by
local non-governmental organizations including the Fresh Produce Exporters Association of
Kenya (FPEAK). These range from a bucket system to cover 15 m2, a drum system to
irrigate 75 m2, and an �eight-acre� system to irrigate 450 m2. In addition, several types of
pedal (treadle) irrigation pumps costing less than US$ 80 have been introduced. ApproTEC,
a local non-governmental organization, reports that 24 thousand of these pumps are being
used by smallholders in Kenya and Tanzania, mainly for production of vegetables and other
high-value crops (ApproTEC 2003; Sijali and Okumu 2002).
According to the 2000 Rural Household Survey, described above, 12 percent of the
1498 farmers interviewed owned any irrigation equipment and 2 percent reported owning a
water pump. Since 94 percent of Kenyan crop farmers grow at least some fruits and
vegetables, it is clear that many farmers grow fruits and vegetables under rainfed conditions.
Irrigation is, however, much more common among commercial vegetable growers,
particularly among large-scale growers and those supplying export markets. For example,
according to the RHS, half of the farmers growing French beans own irrigation equipment

27
compared to just 10 percent among other farmers. In their survey of 120 farmers along the
Nairobi-Meru road (an area of very good market access), McCulloch and Ota (2003) find that
90 percent of smallholder growers of horticultural export crops had irrigation, compared to
just 36 percent of non-horticultural producers. Without irrigation, smallholders are not able
to produce a steady supply of vegetables throughout the year, making them less interesting to
full-time exporters. Instead, they sell their output to traders for domestic sales or to brief-
case (seasonal) exporters.
Seed The use of purchased seed varies across crops, depending on the quality and
cost of purchased seed as well as the ease of saving seed from the previous harvest. Large
commercial horticultural producers almost always use purchased seed or planting material, as
do many small and medium contract growers. The use of purchased seed is less common
among independent smallholders. Kimenye (1995) reports that imported vegetable seed is
expensive for smallholders, while locally-produced seeds are of poor quality. She reports
that lack of access to high-quality seed is an important constraint to smallholders.
Kenya has over a dozen seed companies, including both local and international
companies. Among the international seed companies represented in Kenya are Pioneer,
Panaar, Monsanto, and Seminis. The Kenya Seed Company is one of the largest and best-
known African seed companies, having fostered the dissemination of hybrid maize seed in
Kenya in the 1960s and 1970s. Formed as a private company in 1956, it became partly
government-owned after independence, though it operates much like a private company. In
1979, the company purchased another seed company specializing in horticultural and flower
seed. Today, it sells over 100 varieties of vegetables, legumes, and root crops under the
name Simlaw (Kenya Seed Company 2003). The largest vendor of French bean seed is

28
Regina Seeds, a subsidiary of Seminis, the largest supplier of fruit and vegetable seed in the
world. Regina distributes imported French bean seed and does not produce any locally. It is
estimated that 70 percent of the vegetable seed sold in Kenya is imported, the remaining 30
percent being produced locally (Regina Seeds 2003)
ECONOMICS OF HORTICULTURAL PRODUCTION
In order to examine the impact of horticultural production on farm income, it is useful
to examine the gross margins of fruit and vegetable production relative to the most common
alternative. The gross margin is defined as the value of output minus the cost of variable
purchased inputs such as seed, fertilizer, pesticides, and hired labor (the implicit cost of
family labor and land are not deducted).
In this section, we provide a gross margin analysis of French bean production and
maize-bean intercropping. French beans are one of the most important horticultural exports
produced by smallholders, and maize-bean intercropping was chosen as the basis of
comparison because it is the most common cropping system in Kenya and one used by less
commercially-oriented farmers11.
Table 5 shows the calculation of gross margins for maize-bean intercropping in
Kirinyaga District. Each hectare produces Ksh 21,600 of maize and Ksh 19,200 of beans, so
the total value of output is Ksh 40,800 per hectare per season (about US$ 510/ha) 12. After
subtracting the costs of land preparation, seed, fertilizer, and labor, the gross margin is Ksh
13,060 per hectare per season (US$ 163/ha). Kenyan farmers can often produce two maize-
bean crops per year, one in the long rainy season (March-July) and one starting in the short
11 It should be noted that maize-bean intercropping is also used by many commercially-oriented horticultural smallholders. Very few Kenyan smallholders are specialized in horticulture to the point of not growing some maize for own consumption. 12 The exchange rate was about 80 Ksh per U.S. dollar when these data were collected.

29
rainy season (October-November). The yields are lower in the second season because of the
lower rainfall. Thus, maize-bean intercropping generates gross margins of Ksh 20,000 to
25,000 per hectare per year (US$ 250-312/ha/year).
Table 5--Gross margin analysis for maize-bean intercropping
Quantity Price Value per crop
per hectacre Maize yield 1620 kg 13 Ksh/kg 21,600 Bean yield 540 kg 36 Ksh/kg 19,200 Gross value of output 40,800 Land preparation 15 person-days 100 Ksh/pers.day 3,705 Maize seed 20 kg 270 Ksh/2 kg 2,700 Bean seed 48 kg 30 Ksh/kg 1,440 Fertilizer 23:23:0 2 bags 1250 Ksh/bag 2,500 CAN 2 bags 950 Ksh/bag 1,900 Dust against maize borer 3 kg 150 Ksh/kg 450 Labor 187 person-days 80 Ksh/pers.day 15,000 Total variable cost 27,740 Gross margin 13,015 Source: Ministry of Agriculture & Rural Development, Kirinyaga District: 2002 Farm Management District guidelines. Note: Typically, maize/bean intercropping allows one or two harvests per year depending on rainfall.
These results should be interpreted with some caution, however. Yields, prices, and
costs vary widely across the country. In more favorable regions such as the Western
Highlands, maize yields are often in the range of 3-5 tons/ha. At 4 tons/ha (and assuming
other values are the same), the gross margin would be Ksh 43,460 per hectare (about US$
540/ha). Second, the returns to the farm household will generally be higher than the gross
margin, because will earn part or all of the �labor� budget, depending on how many of the
tasks they carry out themselves. Third, these estimates were based on guidelines from the
Ministry of Agriculture and Rural Development, but farmers typically use less fertilizer than
is recommended by the Ministry.
30
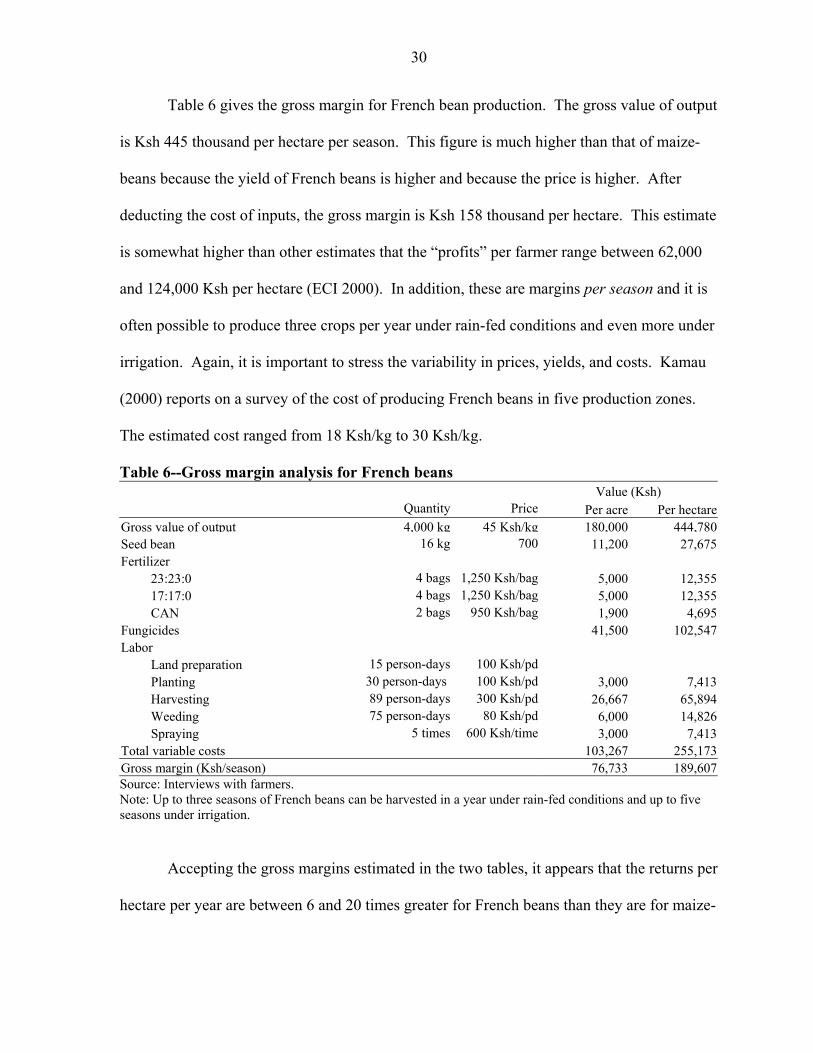
Table 6 gives the gross margin for French bean production. The gross value of output
is Ksh 445 thousand per hectare per season. This figure is much higher than that of maize-
beans because the yield of French beans is higher and because the price is higher. After
deducting the cost of inputs, the gross margin is Ksh 158 thousand per hectare. This estimate
is somewhat higher than other estimates that the �profits� per farmer range between 62,000
and 124,000 Ksh per hectare (ECI 2000). In addition, these are margins per season and it is
often possible to produce three crops per year under rain-fed conditions and even more under
irrigation. Again, it is important to stress the variability in prices, yields, and costs. Kamau
(2000) reports on a survey of the cost of producing French beans in five production zones.
The estimated cost ranged from 18 Ksh/kg to 30 Ksh/kg.
Table 6--Gross margin analysis for French beans Value (Ksh) Quantity Price Per acre Per hectareGross value of output 4,000 kg 45 Ksh/kg 180,000 444,780 Seed bean 16 kg 700 11,200 27,675 Fertilizer 23:23:0 4 bags 1,250 Ksh/bag 5,000 12,355 17:17:0 4 bags 1,250 Ksh/bag 5,000 12,355 CAN 2 bags 950 Ksh/bag 1,900 4,695 Fungicides 41,500 102,547 Labor Land preparation 15 person-days 100 Ksh/pd Planting 30 person-days 100 Ksh/pd 3,000 7,413 Harvesting 89 person-days 300 Ksh/pd 26,667 65,894 Weeding 75 person-days 80 Ksh/pd 6,000 14,826 Spraying 5 times 600 Ksh/time 3,000 7,413 Total variable costs 103,267 255,173 Gross margin (Ksh/season) 76,733 189,607 Source: Interviews with farmers. Note: Up to three seasons of French beans can be harvested in a year under rain-fed conditions and up to five seasons under irrigation.
Accepting the gross margins estimated in the two tables, it appears that the returns per
hectare per year are between 6 and 20 times greater for French beans than they are for maize-

31
bean intercropping. These results seem to imply that farmers should convert all their maize
to French bean production. In fact, the gross margin analysis omits some important factors.
• First, the price used in the analysis is based on what existing French beans growers receive. The price faced by farmers in more remote locations could be much lower or even zero if vegetable traders do not come to the area and it is costly for the farmer to get the crop to market.
• Second, the analysis does not take into account the implicit costs associated with family labor. Vegetable production is significantly more labor-intensive than maize-bean production. French bean production requires 1300 person-days per hectare per year, and chili, okra, tomatoes, onions, and brinjal require 540-690 person-days, but maize and beans require just 175 person-days (Scheltema 2002). Given the seasonality of labor demand and the need to grow food crops, few households have sufficient family labor to grow more than 0.20 hectares of vegetables. For example, in the Egerton/Tegemeo/MSU Rural Household Survey (described in Section 4), the average plot of French beans was 0.15 hectares and, of the 78 farmers growing French beans, the largest plot was 1.2 hectares. This is also true for other vegetable crops and, to a lesser degree, for fruits grown by smallholders.
• Third, the water requirements of French beans (and horticultural crops in general) are much greater than those of maize-bean intercropping. If irrigation is required, the average investment cost ranges from US$ 1000/hectare for a gravity-fed, open-canal system to US$3100/hectare for a pump-fed, piped-distribution system (Ngigi 2002).
• Fourth, the analysis does not take into account the financial costs associated with much larger up-front variable costs. Compared to maize-bean intercropping, the per-acre variable cost of tomato production is three times a high, while those of French bean production are ten times greater. If the farmer has sufficient liquidity or access to credit, then the interest costs should be included in the analysis. If not, then horticultural production is simply not feasible.
• Finally, the analysis does not take into account risk. Most fruits and vegetables are subject to more production risk than staple crops, due to attack from pest and/or poor weather, as well as greater marketing risk, due to its perishability.
In summary, the gross margin analysis shows that when the right conditions are
present in terms of rainfall, markets, family labor, and household ability to bear risk, French
bean production can be much more profitable than maize-bean intercropping. At the same
time, it is necessary to keep in mind that these conditions do not apply for all farmers.

32
4. CHARACTERISTICS OF FRUIT AND VEGETABLE GROWERS
To better understand the impact of horticultural production on small farmers in
Kenya, it is useful to examine the characteristics of the growers. For example, the impact of
horticulture on rural livelihoods will be more limited if fruits and vegetables are only grown
in one small area or by a small number of farmers. Similarly, the impact on poverty depends
on whether poor farmers are able to participate in the sector or whether richer, large-scale
growers dominate it.
A recent study compared the characteristics of smallholders producing horticultural
crops for the export market, farm workers on large horticultural farms, and smallholders not
involved in horticulture13. It found that export horticultural smallholders were significantly
better off than non-horticultural smallholders, even after controlling for household
characteristics such as age, education, ethnicity, and ownership of land. The authors suggest
that these farmers benefit directly from the higher income and indirectly through greater
access to credit and extension services (McCulloch and Ota 2002). As noted by the authors,
however, this study was based on a relatively small sample of 141 rural households in
selected zones near Mt. Kenya.
This section sheds light on the characteristics of horticultural growers using two
sources of information. First, we examine the results of the Rural Household Survey
(described in Section 3) regarding the characteristics of fruit and vegetable growers and the
contribution of this activity to household income. Second, to provide more concrete images
of the potential impact of participation in the horticultural sector, we describe a number of
case studies, based on interviews carried out by one of the authors.
13 Another component compared urban households working in the horticulture packing houses with other urban households.

33
RESULTS OF THE 2000 RURAL HOUSEHOLD SURVEY
According to the Rural Household Survey, carried out by Egerton College, Tegemeo
Institute, and Michigan State University, the average farm household has 6.8 members and
2.14 hectares of land. The level of schooling for the heads of household is relatively low: 6
years for male heads and 4 years for female heads (see Table 7).
Table 7--General characteristics of Kenyan farmers Average age of head of household (years) Proportion of households headed by women (percent) Average amount of schooling completed by male heads (years) Average amount of schooling completed by female heads (years)
53 14 6.4 3.7
Average cultivated area (hectares) Average sown area (hectares) Percent of farms with production in two seasons
1.80 2.14 65%
Land tenure Own land with title deed Own land without title deed Only work on rented land Only farmed on relative�s land Farm government or communal land
52% 35% 17% 19% 3%
Family structure Children below 15 yrs Household member aged >15 years ≤65 Household member aged > 65 years Total
2.69 3.83 0.26 6.80
Land preparation methods Exclusively manual Exclusively oxen Exclusively tractor Manual and Oxen Manual and tractor Tractor and oxen
55% 5% 3%
17% 19% 1%
Distance to a paved road Less than 1 km 17% 1 � 5 km 30% 5 � 10 25% 10 � 20 km 22% More than 20 km 6% Source: Egerton/Tegemeo/MSU Rural Household Survey 2000
The average farm is relatively small, with 1.8 hectares of land cultivated in the main
rainy season. About two-thirds (65 percent) of the farmers in the sample were able to
produce a crop in the short rainy season. Adding the areas cultivated in the main rainy
season and in the short rainy season, the average sown area is 2.14 hectares. Slightly more

34
than half own land with a title deed, while another third have land but no title. Most of the
remainder farm land rented from others or borrowed from relatives. With respect to
technology, over half prepare their plots by hand, 19 percent combine manual preparation
and rented tractors, and 17 percent combine manual preparation and the use of oxen (Table
7).
One measure of market access is the distance to a paved road. According to the Rural
Household Survey, somewhat less than half the agricultural households in Kenya live within
5 kilometers of a paved road, while 6 percent live more than 20 kilometers from a road
(Table 7).
In order to examine the patterns in fruit and vegetable production, we divide the
sample into different types of households, defined by per capita income, farm size, and
region. Table 8 shows the definitions used to create these categories. About two-thirds of
the farms have less than 2 hectares of sown area (adding cultivated area over the two
seasons), and less than 3 percent have more than 10 hectares. The poorest quintile of farms
earn less than 8950 Ksh/person/year (roughly US$ 120), while the richest quintile of farms
earn more than 65,150 Ksh/person/year (US$ 868).
Table 8--Definition of household categories Type of category Categories Definition Number of
households Percentage of
households Farm size <1 ha Less than 1 ha sown area 514 34.9 1-2 ha 1-2 hectares sown area 475 32.3 2-5 ha 2-5 hectares sown area 391 26.6 5-10 ha 5-10 hectares sown area 58 3.9 >10 ha More than 10 ha sown area 34 2.3 Income per capita Poorest Less than 8950 Ksh 295 19.8 2 8950 � 19,490 Ksh 294 20.3 3 19,490 � 33,200 Ksh 295 20.2 4 33,200 � 65,150 Ksh 294 20.2 Richest More than 65,150 Ksh 294 19.5 Province East/Central/Coast Lives in one of these provinces 465 31.6 Rift Valley Lives in Rift province 499 33.9 West Lives in West province 508 34.5 Source: Egerton/Tegemeo/MSU Rural Household Survey 2000

35
Table 9 provides a summary key indicators of the fruit and vegetable sector. The
survey results indicate that almost all farmers (98 percent) grow fruits and vegetables. On
average, they grow 3.5 different types of fruit and 3.3 types of vegetables. As a basis for
comparison, the average number of different types of crops grown is about 12. The average
value of fruit and vegetable production is Ksh 49 thousand per year (US$ 658), representing
slightly less than one quarter of the value of crop production. More than one-third (35
percent) of fruit and vegetable production is sold on the market, though the share is higher
for vegetables (49 percent) than for fruit (20 percent). Overall, fruits and vegetables
production is equivalent to about 18 percent of household income14.
14 The contribution of fruits and vegetables to household income is somewhat less because this percentage compares the gross value of output with net income. The survey data do not allow the calculation of net income for each crop.

36
Table 9--Fruit and vegetable production by income category Income quintile Poorest 2 3 4 Richest TotalPercent of farmers growing Fruits 75 89 93 95 93 89 Vegetables 78 87 93 96 97 90 Fruits and vegetables 92 99 100 100 100 98Average number of crops Fruits 2.6 3.3 3.7 4 4 3.5 Vegetables 2.3 2.7 3.1 3.9 4.4 3.3 Fruits and vegetables 4.9 6.0 6.8 8.0 8.4 6.8Avg value of production Fruits 4,280 9,314 11,761 21,452 75,394 24,418 Vegetables 3,525 7,874 11,086 29,163 73,295 24,965 Fruits and vegetables 7,805 17,188 22,848 50,615 148,689 49,383Value of production as % of total crop value Fruits 13 14 11 10 11 11 Vegetables 11 12 10 14 11 11 Fruits and vegetables 25 26 21 25 22 23Value of sales Fruits 1,047 2,631 3,137 3,980 13,585 4,872 Vegetables 1,131 2,531 3,737 11,982 41,537 12,171 Fruits and vegetables 2,178 5,163 6,874 15,962 55,123 17,043Sales as % of total crop sales Fruits 11 12 7 4 7 7 Vegetables 12 12 8 13 20 16 Fruits and vegetables 23 24 14 18 27 23Sales as % of production Fruits 24 28 27 19 18 20 Vegetables 32 32 34 41 57 49 Fruits and vegetables 28 30 30 32 37 35Value of production as % of household income Fruits 12 9 7 7 9 9 Vegetables 9 8 7 10 9 9 Fruits and vegetables 21 18 14 18 18 18Source: Egerton/Tegemeo/MSU Rural Household Survey 2000
Poor and rich farm households differ somewhat in their production patterns15. Poor
households are somewhat less likely to grow fruits and vegetables, but, even among the
15 Income per capita is calculated by combining estimates of crop income, livestock sales, animal product sales, household enterprise income, and income from wages and salaries. In the case of crop income, we include the imputed value of home production as well as the value of crop sales. In the case of both farm-size and income per capita, the categories are quintiles. In each case (except for wages and salaries), the costs are production are subtracted from the gross sales.

37
poorest quintile, 92 percent do. Similarly, the average number of different fruit and
vegetable crops is greater among the higher-income farm households. Even larger
differences appear in the value of fruit and vegetable production: the richest quintile of farm
households produces 18 times as much as the poorest quintile in value terms. However, this
merely reflects the greater agricultural production of high-income households. The value of
fruit and vegetable production as a percentage of total crop production does not vary
appreciably across income categories (21-26 percent). Nor does the importance of fruit and
vegetable production in overall income show a trend across income classes, remaining in the
range of 14-21 percent (see Table 9)
Given their larger production, it is not surprising that the higher-income farm
households market a larger share of their fruit and vegetable production. The percentage
rises from 28 percent among the poorest quintile to 37 percent among the richest quintile. In
fact, it is somewhat surprising that the share does not rise faster across income quintiles (see
Table 9).
Similar indicators for households in different farm-size categories16 are shown in
Table 10. Many of the patterns follow those found in the previous table: larger farms are
more likely to grow fruits and vegetables, they grow a wider variety of fruit and vegetable
crops, and the marketed share is higher for large farms than small. On the other hand, the
positive relationship between farm-size and the value of horticultural production is
surprisingly weak.
16 Farm size is calculated as the sum of the areas of the fields cultivated by the household, including land rented in and excluding land rented out. Double-cropped land is counted twice so it is, strictly speaking, a measure of sown area.

38
Table 10--Fruit and vegetable production by farm-size category Farm-size category <1 ha 1-2 ha 2-5 ha 5-10 ha >10 ha TotalPercent of farmers growing Fruits 88 88 92 91 91 89 Vegetables 86 92 92 97 100 90 Fruits and vegetables 97 98 99 100 100 98Average number of crops Fruits 3.2 3.5 3.7 4.1 3.7 3.5 Vegetables 2.8 3.3 3.7 4.6 4.6 3.3 Fruits and vegetables 6 6.8 7.4 8.6 8.3 6.8Avg value of production Fruits 20,157 22,485 30,879 31,953 28,684 24,418 Vegetables 14,881 20,654 38,528 48,578 41,363 24,965 Fruits and vegetables 35,039 43,139 69,407 80,531 70,047 49,383Value of production as % of total crop value Fruits 15 13 10 9 4 11 Vegetables 11 12 12 13 6 11 Fruits and vegetables 26 24 22 22 10 23Value of sales Fruits 2,338 3,516 7,453 18,385 9,403 4,872 Vegetables 5,822 9,714 19,995 30,814 20,691 12,171 Fruits and vegetables 8,159 13,230 27,448 49,199 30,094 17,043Sales as % of total crop sales Fruits 10 6 7 10 2 7 Vegetables 25 16 18 16 4 16 Fruits and vegetables 35 22 25 26 6 23Sales as % of production Fruits 12 16 24 58 33 20 Vegetables 39 47 52 63 50 49 Fruits and vegetables 23 31 40 61 43 35Value of production as % of household income Fruits 11 9 8 7 4 9 Vegetables 8 9 10 11 5 9 Fruits and vegetables 20 18 18 18 9 18Source: Egerton/Tegemeo/MSU Rural Household Survey 2000
Furthermore, the importance of fruit and vegetable production (as a percentage of crop sales
and as a percentage of household income) is actually greater among small farms than among
large ones. For example, fruit and vegetable production represents about 20 percent of
income among farms with less than 1 hectare compared to just 9 percent among those with
more than 10 hectares. This is because large farms tend to be unirrigated and found in semi-

39
arid regions less favorable to horticulture. In addition, because fruit and vegetable
production is labor intensive, it is better suited to farms with an abundant labor and small
plots.
Table 11 examines the same indicators for three regions: the East, Central, and Coast
provinces, the Rift Valley province, and the Western province. The East/Central/Coast
provinces are characterized by the highest value of fruit and vegetable production per farm,
two to three times as large as in the other two provinces. Not surprisingly, fruit and
vegetable production in this region plays a larger role in crop production and household
income than in the other two. In the Rift Valley, the average production levels are lower, but
the degree of commercialization is higher. Almost half the fruit and vegetable output in this
province is sold, according to the survey. The Rift Valley is also more oriented to vegetable
production, while the Western province tends to concentrate on fruit production.

40
Table 11--Fruit and vegetable production by province Province
East/Central
/CoastRift
Valley Western Total Percent of farmers growing Fruits 98 81 89 89 Vegetables 95 95 81 90 Fruits and vegetables 100 99 96 98 Average number of crops Fruits 4.5 2.6 3.6 3.5 Vegetables 4.3 3.7 2 3.3 Fruits and vegetables 8.7 6.3 5.6 6.8 Avg value of production Fruits 47,431 9,755 17,755 24,418 Vegetables 52,563 17,905 6,637 24,965 Fruits and vegetables 99,994 27,660 24,393 49,383 Value of production as % of total crop value Fruits 14 5 14 11 Vegetables 15 9 5 11 Fruits and vegetables 29 14 19 23 Value of sales Fruits 5,325 4,245 5,075 4,872 Vegetables 25,005 9,293 3,249 12,171 Fruits and vegetables 30,330 13,538 8,323 17,043 Sales as % of total crop sales Fruits 6 7 7 7 Vegetables 30 15 4 16 Fruits and vegetables 36 21 11 23 Sales as % of production Fruits 11 44 29 20 Vegetables 48 52 49 49 Fruits and vegetables 30 49 34 35 Value of production as % of household income Fruits 11 4 10 9 Vegetables 13 7 4 9 Fruits and vegetables 24 10 14 18 Source: Egerton/Tegemeo/MSU Rural Household Survey 2000
Since averages can hide wide variation across households, it is useful to examine the
variation in several key variables. Table 12 shows the distribution of fruit and vegetable
growers by the share of their fruit and vegetable output that they market. Almost one-quarter

41
has no sales of fruits and vegetables. An additional 20 percent less than 20 percent of their
total output. On the other hand, 23 percent of Kenyan farmers sell over half of their fruit and
vegetable output. The table also shows that the 6 percent of growers that market 80-100
percent of their output account for fully 44 percent of the total fruit and vegetable sales.
Table 12--Distribution of farmers by marketed share of fruit and vegetable production Sales as a percentage of fruit & vegetable production
Number of farmers
Percent of all farmers
Percent of the value of F&V
production
Percent of the value of F&V
sales
No sales 347 24 18 0 1 - 10 288 20 22 2 10 - 20 162 11 7 3 20 - 30 112 8 5 3 30 - 40 92 6 8 8 40 - 50 121 8 6 8 50 - 60 93 7 5 9 60 - 70 70 5 5 10 70 - 80 66 5 6 12 80 - 90 51 4 10 24 90 - 100 23 2 7 20 Total 1425 100 100 100 Source: Egerton/Tegemeo/MSU Rural Household Survey 2000
As mentioned above, most growers have relatively small sales of fruits and
vegetables, but a few farms have quite sizeable sales. Table 13 shows the distribution of
farmers according to their fruit and vegetable sales. The average value of sales is relatively
high, Ksh 17 thousand (US$ 226). On the other hand, more than half the farmers have sales
of less than 2,500 Ksh. About 7 percent of them have sales of more than 50,000 Ksh (US$
667). This group includes some quite large horticultural producers. Although they are a
small proportion of the growers, they account for 72 percent of the sales.

42
Table 13--Distribution of farmers by the value of fruit and vegetable sales Sales of fruits and vegetables (Ksh/year)
Number of farmers
Percent of all farmers
Percent of the value of F&V
sales No sales 394 27 0 1 - 500 167 11 0 500 - 1,000 110 7 0 1,000 - 2,500 208 14 1 2,500 - 5,000 142 10 2 5,000 - 10,000 131 9 4 10,000 - 50,000 218 15 21 Greater than 50,000 102 7 72 Total 1472 100 100 Source: Egerton/Tegemeo/MSU Rural Household Survey 2000
How much does fruit and vegetable production contribute to the incomes of growers?
Table 14 suggests that fruits and vegetables are merely a supplement to income for most
farmers, but that a significant minority of farmers relies on fruit and vegetables for a major
share of their income. More specifically, over two-thirds of the farmers in the survey rely on
fruit and vegetable production for less than 20 percent of income17. At the other extreme,
however, 8 percent of the farmers earn over half their income from fruit and vegetable
production.
Table 14--Distribution of farmers according to the value of fruit and vegetable production as a percentage of income
Value of fruit and vegetable production as a percentage of income
Number of farmers
Percent of all farmers
Percent of value of F&V
production
Percent of value of
F&V sales
0 38 3 0 0 0 - 10 648 45 11 11 10 - 20 304 21 13 11 20 - 30 160 11 11 10 30 - 40 107 7 9 9 40 - 50 51 4 12 15 50 - 60 48 3 10 14 60 - 70 25 2 10 15 70 - 80 19 1 7 5 80 - 90 19 1 5 3 >90 20 1 11 7 Total 1,439 100 100 100 Source: Egerton/Tegemeo/MSU Rural Household Survey 2000
17 Because it is difficult to attribute all production costs to different crops, these figures compare the gross value of fruit and vegetable production and net income, defined as gross revenue minus the cash costs of production.

43
We now turn our attention to the production and marketing patterns for specific fruit
and vegetable crops. Table 15 provides some indicators of the relative importance of each
fruit and vegetable crop to Kenyan farms18. The first column shows the percentage of
farmers growing each crop. Only bananas and sukuma wiki19 (greens) are grown by more
than half of Kenyan farmers (69 percent and 63 percent, respectively). Other crops grown by
at least 30 percent of the farmers include avocados, mangoes, pawpaw (papayas), Irish
potatoes, onions, pumpkin, and tomatoes. It may seem surprising that just 4 percent of the
smallholders in the survey reported grown French beans, since this commodity is the most
important vegetable export from Kenya. Since French bean production is concentrated in
several production zones, the margin of error associated with French bean production
estimates may be higher than for more widespread crops such as maize. It is useful to recall,
however, that there are close to four million small farmers in Kenya, so 4 percent would
represent around 150 thousand farmers. Since the local market for French beans is quite
limited, it is likely that many of these farmers are growing, at least in part, for the export
market.
18 The table shows only fruit and vegetable crops that are grown by at least 40 households (about 3 percent) in the 2000 Rural Household Survey. Minor crops are included in the two �Other� categories. 19 �Sukuma wiki� refers to collard greens, kale, and other greens. The literal translation from Swahili is �push the week�, in reference to its ability to stretch the food supply to the end of the week.

44
Table 15--Summary of measures of importance of each crop
Share of farms
growing Value of production Value of sales Share of
output sold
(percent) (Ksh/year)(percent of F&V total) (Ksh/year)
(percent of F&V total) (percent)
Bananas 69 6,223 12 3,166 15 51Avocado 35 8,276 16 1,032 5 12Mangoes 31 5,038 10 413 2 8Pawpaws 30 2,459 5 487 2 20Guava 27 279 1 30 0 11Lemons 15 347 1 40 0 12Oranges 15 922 2 300 1 33Passion fruit 14 306 1 66 0 22Lugard 14 340 1 16 0 5Matomoko 6 374 1 35 0 9Pineapples 5 167 0 70 0 42Mero 3 51 0 14 0 27Other fruit 6 620 1 530 3 85
Fruit sub-total 89 25,402 48 6,199 30 24Sukuma wiki 63 4,608 9 1,326 6 29
Irish potatoes 38 5,602 11 2,694 13 48Onions 35 1,961 4 934 5 48Pumpkin 31 414 1 74 0 18Tomatoes 30 4,533 9 3,371 16 74Ndigenous vegetables 29 899 2 91 0 10Cabbage 23 4,447 8 3,515 17 79Spinach 11 591 1 39 0 7Carrots 10 953 2 488 2 51Peppers 10 253 0 39 0 15Green peas 8 216 0 54 0 25Green grams 7 291 1 23 0 8Pumpkin leaves 7 26 0 1 0 4French beans 4 779 1 732 4 94Capsicum 4 326 1 252 1 77Other vegetables 7 1,196 2 731 4 61
Vegetable sub-total 90 27,095 52 14,364 70 53Fruit and vegetable total 98 52,497 100 20,563 100 39Source: Egerton/Tegemeo/MSU Rural Household Survey 2000

45
The average value of fruit and vegetable production among Kenyan farmers is about
Ksh 52 thousand (US$ 693), but this figure is heavily influenced by a small number of large
growers. The median value of fruit and vegetable production is just Ksh 14,096 (US$ 188).
The most important fruits and vegetables in value terms are avocados (16 percent of the fruit
and vegetable value), bananas (12 percent), Irish potatoes (11 percent), and mangoes (10
percent). Tomatoes, sukuma wiki, cabbage, and pawpaw are also important, each
representing at least 5 percent of the total value of fruit and vegetable production (see Table
15).
Fruit and vegetable sales average somewhat less than Ksh 21 thousand (US$ 274)
concentrated in a smaller number of crops. Four crops (cabbage, tomatoes, bananas, and
Irish potatoes) account for about 60 percent of the total value of fruit and vegetable sales (see
Table 15).
The degree of commercialization varies widely across commodities. Some are grown
almost exclusively for home consumption. For example, no more than 5 percent of the
pumpkin leaves and lugard are sold, and less than one-third of the pumpkins, peppers,
avocados, mangoes, pawpaws, and guava are. At the other extreme, more than 90 percent of
the French beans (green beans) are marketed. This is not surprising given that French beans
are the most important vegetable export from Kenya. Similarly, over half the output of
bananas, tomatoes, cabbage, carrots, and capsicum are marketed. Overall, 39 percent of the
volume of fruit and vegetable production is marketed, the percentage being much higher for
vegetables (53 percent) than for fruit (24 percent). It is important to recognize however that
this figure is weighted toward large farms that produce larger harvests. If we calculate the
percentage of fruits and vegetables sold for each household and take the average (with each

46
household having an equal weight), the result is 27 percent. In other words, a typical Kenyan
household might sell about one-quarter of its fruit and vegetable production, but almost 40
percent of the total value is marketed (see Table 15).
How does the importance of individual crops vary across different types of
households? As shown in Table 16, the proportion of households growing selected crops20
shows little variation across farm-size categories. Large farmers are slightly more likely to
grow fruits and vegetables, but the difference is small. For some crops, such as citrus,
tomatoes, pumpkin, and onions, large farmers are more likely to grow them than small ones.
For other crops, such as Irish potatoes, indigenous vegetables, bananas, avocados, and guava,
there is no consistent pattern.
Table 16--Percentage of farms growing each crop by farm-size category Farm-size category Crop <1 ha 1-2 ha 2-5 ha 5-10 ha >10 ha TotalBananas 70 69 71 73 64 70Avocado 39 33 36 22 30 36Mangoes 26 32 35 53 33 32Pawpaws 28 29 33 31 33 30Guava 25 29 31 22 27 28Oranges 11 15 19 33 33 16Lemons 11 14 19 36 21 15Lugard 15 16 13 9 9 15Passion fruit 16 13 15 5 18 15Other fruit 12 18 17 18 24 16 Sukuma wiki 56 63 71 67 73 63Irish potatoes 38 39 37 42 27 38Onions 32 34 37 56 52 35Pumpkin 27 26 35 55 64 31Indigenous vegetables 27 29 32 35 39 30Tomatoes 20 33 36 35 39 29Cabbage 17 23 28 40 24 23Other vegetables 35 42 46 55 55 41Source: Egerton/Tegemeo/MSU Rural Household Survey 2000.
20 Fewer crops are shown in this table than in the previous ones. Because we are disaggregating the results into different household categories, we have limited it to crops grown by at least 250 farms in the sample.

47
It is interesting to note that small farmers are just as likely to grow the main horticultural fruit
exports (avocados, and mangoes) as large farmers.
But farm-size is only a rough indicator of the income or wealth of a family. In Table
17, the same figures are presented by income quintile, and the differences across categories
are more marked.
Table 17--Percentage of farms growing each crop by income category Income quintile Crop Poorest 2 3 4 Richest TotalBananas 49 67 72 78 84 70Avocado 17 25 36 44 58 36Mangoes 21 32 34 39 33 32Pawpaws 22 32 35 37 25 30Guava 22 29 26 33 29 28Oranges 14 12 12 21 19 16Lemons 12 16 15 18 15 15Lugard 5 12 14 17 25 15Passion fruit 7 9 12 20 25 15Other fruit 7 13 15 19 25 16 Sukuma wiki 45 55 66 71 79 63Irish potatoes 22 28 38 44 59 38Onions 22 28 33 42 51 35Pumpkin 25 28 30 36 35 31Indigenous vegetables 27 34 33 30 23 30Tomatoes 20 24 28 37 36 29Cabbage 11 12 19 31 42 23Other vegetables 27 34 37 52 56 41Source: Egerton/Tegemeo/MSU Rural Household Survey 2000.
Avocadoes, mangoes, passion fruit, Irish potatoes, cabbage, and many other crops are more
likely to be grown by higher-income households than by poor households. For example, 42
percent of the richest income category grows cabbages, compared to just 11 percent of the
poorest category. Similarly, 58 percent of the richest farmers grow avocados, but just 17
percent of the poorest ones do.

48
Unfortunately, causality is difficult to determine in this case. It may be that high-
income households have more of the liquidity, access to credit, and appetite for risk that
horticultural production often requires. Alternatively, it may be that farmers (small and
large) who engage in horticulture have higher incomes because of the relatively profitability
of this sector. A third possibility is that the two variables (income and horticulture) are
correlated, but do not strongly influence each other. For example, it may be that households
that have good market access are more likely to grow fruits and vegetables and have higher
incomes for other reasons, such as off-farm employment.
Another measure of the importance of each crop is the value of production relative to
household income. Table 18 shows that small farms rely more heavily on fruit and vegetable
production for their income. The ratio falls from 26 percent among farms with less than 1
hectare to 10 percent among those with more than 10 hectares. This pattern holds true for
both fruits and vegetables, particularly for bananas, pawpaws, guava, and sukuma wiki.
Other crops show little or no consistent pattern.

49
Table 18--Fruit and vegetable production as a percentage of the total value of crop production by farm-size category
Farm-size category Crop <1 ha 1-2 ha 2-5 ha 5-10 ha >10 ha Total Bananas 3 3 3 1 1 3 Pawpaws 6 6 2 4 0 4 Guava 3 2 3 1 1 2 Mangoes 1 1 1 1 0 1 Lemons 0 0 0 0 0 0 Oranges 0 0 0 1 1 0 Avocado 0 0 0 0 0 0 Lugard 0 0 0 0 0 0 Passion fruit 0 0 0 0 0 0 Other fruit 0 0 0 0 0 0Fruit sub-total 15 13 10 9 4 11 Irish potatoes 2 2 2 2 1 2 Tomatoes 2 2 2 4 2 2 Sukuma wiki 3 2 4 1 1 3 Pumpkin 1 1 1 2 1 1 Cabbage 0 0 0 0 1 0 Onions 1 0 0 0 0 0 Indigenous vegetables 1 2 1 2 1 1 Other vegetables 2 2 2 4 2 2Vegetable sub-total 11 12 12 13 6 12Fruit & vegetable total 26 24 22 22 10 23Source: Egerton/Tegemeo/MSU Rural Household Survey 2000
If we look at the ratio for different crops across income categories, the overall
importance of fruits and vegetables is more-or-less constant. Bananas are much more
important in the income of poor households than in the income of higher-income households
(see Table 19). Pawpaws, onions, pumpkins, and tomatoes show similar but weaker patterns.
But other crops show the opposite pattern, being more important in the income of richer
farms. Examples include avocados, mangoes, and Irish potatoes.
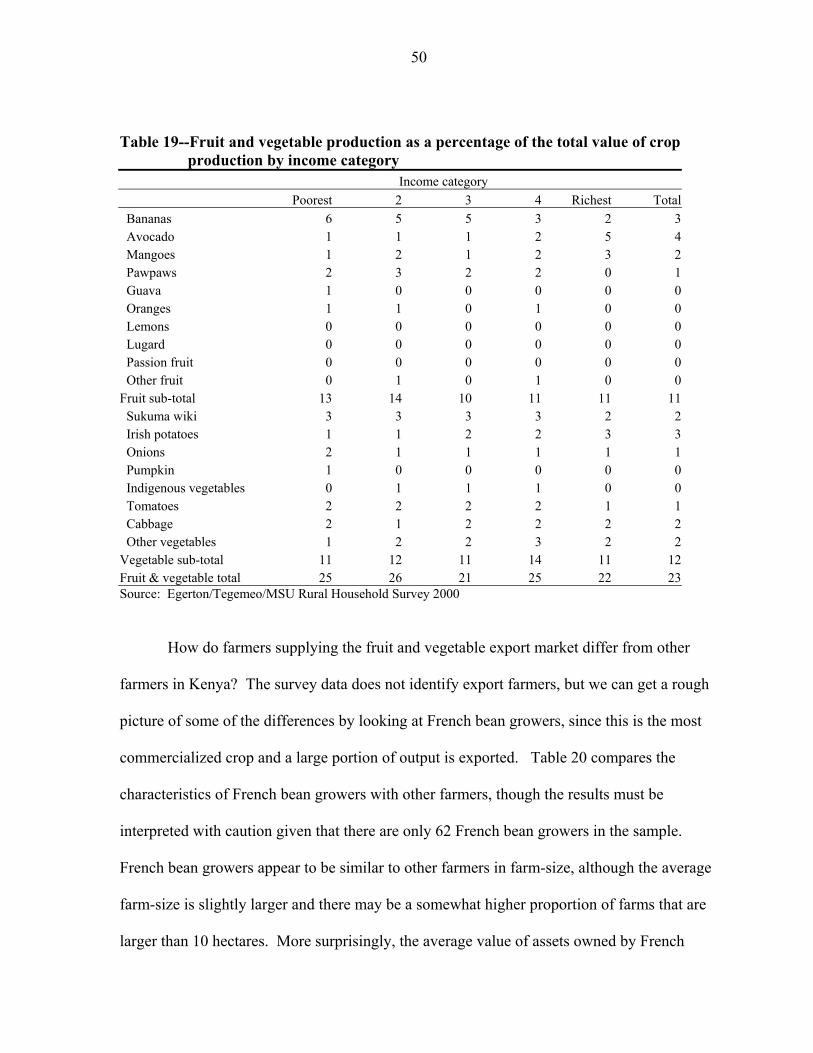
50
Table 19--Fruit and vegetable production as a percentage of the total value of crop production by income category
Income category Poorest 2 3 4 Richest Total Bananas 6 5 5 3 2 3 Avocado 1 1 1 2 5 4 Mangoes 1 2 1 2 3 2 Pawpaws 2 3 2 2 0 1 Guava 1 0 0 0 0 0 Oranges 1 1 0 1 0 0 Lemons 0 0 0 0 0 0 Lugard 0 0 0 0 0 0 Passion fruit 0 0 0 0 0 0 Other fruit 0 1 0 1 0 0Fruit sub-total 13 14 10 11 11 11 Sukuma wiki 3 3 3 3 2 2 Irish potatoes 1 1 2 2 3 3 Onions 2 1 1 1 1 1 Pumpkin 1 0 0 0 0 0 Indigenous vegetables 0 1 1 1 0 0 Tomatoes 2 2 2 2 1 1 Cabbage 2 1 2 2 2 2 Other vegetables 1 2 2 3 2 2Vegetable sub-total 11 12 11 14 11 12Fruit & vegetable total 25 26 21 25 22 23Source: Egerton/Tegemeo/MSU Rural Household Survey 2000
How do farmers supplying the fruit and vegetable export market differ from other
farmers in Kenya? The survey data does not identify export farmers, but we can get a rough
picture of some of the differences by looking at French bean growers, since this is the most
commercialized crop and a large portion of output is exported. Table 20 compares the
characteristics of French bean growers with other farmers, though the results must be
interpreted with caution given that there are only 62 French bean growers in the sample.
French bean growers appear to be similar to other farmers in farm-size, although the average
farm-size is slightly larger and there may be a somewhat higher proportion of farms that are
larger than 10 hectares. More surprisingly, the average value of assets owned by French
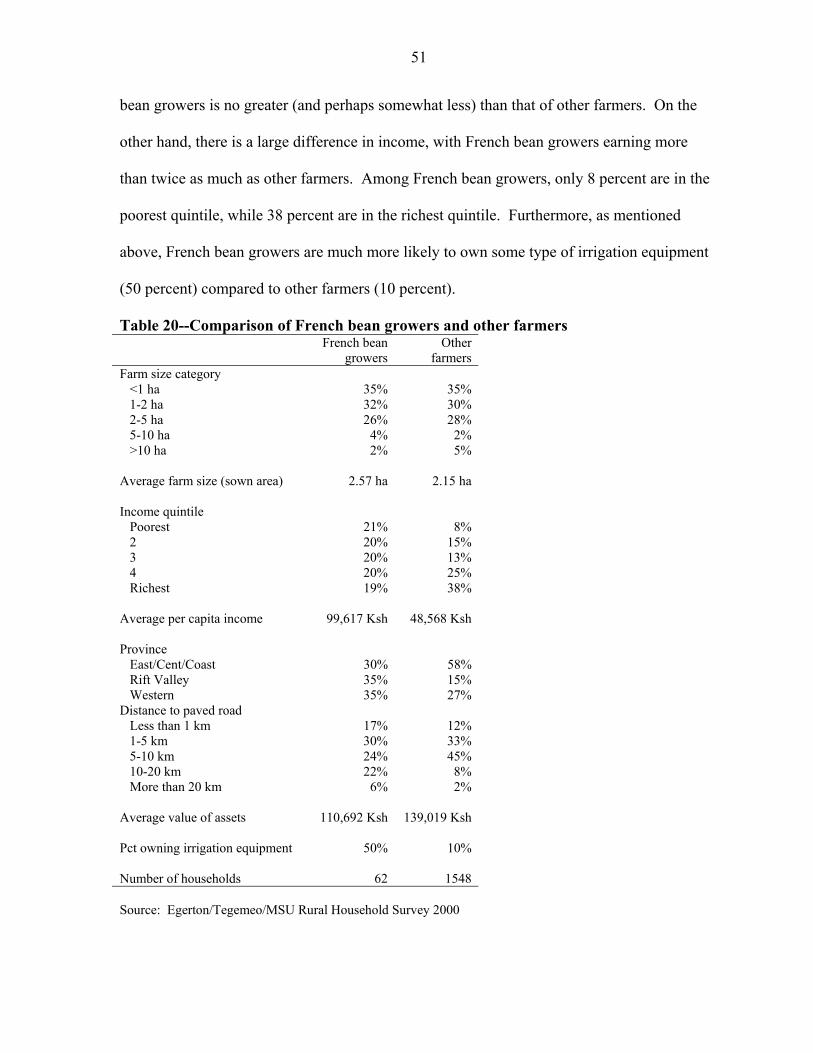
51
bean growers is no greater (and perhaps somewhat less) than that of other farmers. On the
other hand, there is a large difference in income, with French bean growers earning more
than twice as much as other farmers. Among French bean growers, only 8 percent are in the
poorest quintile, while 38 percent are in the richest quintile. Furthermore, as mentioned
above, French bean growers are much more likely to own some type of irrigation equipment
(50 percent) compared to other farmers (10 percent).
Table 20--Comparison of French bean growers and other farmers French bean
growers Other
farmers Farm size category <1 ha 35% 35% 1-2 ha 32% 30% 2-5 ha 26% 28% 5-10 ha 4% 2% >10 ha 2% 5% Average farm size (sown area) 2.57 ha 2.15 ha Income quintile Poorest 21% 8% 2 20% 15% 3 20% 13% 4 20% 25% Richest 19% 38% Average per capita income 99,617 Ksh 48,568 Ksh Province East/Cent/Coast 30% 58% Rift Valley 35% 15% Western 35% 27% Distance to paved road Less than 1 km 17% 12% 1-5 km 30% 33% 5-10 km 24% 45% 10-20 km 22% 8% More than 20 km 6% 2% Average value of assets 110,692 Ksh 139,019 Ksh Pct owning irrigation equipment 50% 10% Number of households 62 1548 Source: Egerton/Tegemeo/MSU Rural Household Survey 2000

52
In terms of location, French bean growers are much more likely to live in the East,
Central, and Coast provinces and much less likely to live more than 10 kilometers from a
paved road (see Table 20). French bean growers also appear to be concentrated in a few
locations. The survey sample is scattered across 24 districts, but over 70 percent of the
French bean growers in the sample are found in just three districts: Meru, Makueni, and
Vihiga21. Because of the small sample, it should not be inferred that these are the main
production zones for French beans, but the results do indicate that French bean production is
clustered.
CASE STUDIES
Survey data provides a comprehensive and balanced view of easily quantified
variables, but it does not capture the dynamic nature of the attempts by farmers to improve
their lives through by experimenting with different production methods, crops, and marketing
strategies. For this reason, it is useful to examine a number of case studies of Kenyan fruit
and vegetable growers. Information about these growers was gathered by the authors using
semi-structured interviews carried out in March and April 2002.
Case 1: Diversification from staples to vegetables
Asha Muthori is a middle-aged woman who owns a five-acre piece of land on the
banks of the Thiba River, a permanent river. She started growing horticultural crops in
1996 after observing that the neighbors that grew horticultural crops were better off than
those who did not. She also learned from the growers that returns from horticulture were
21 Meru is a high-rainfall district about 180 km northeast of Nairobi at the foot of Mount Kenya. Makueni is about 150 km southeast of Nairobi along the road to Mombassa, and rainfall varies with altitude. Vihiga is a high-rainfall district about 250 km northwest of Nairobi near Lake Victoria.
53
generally higher than those from intercropping maize and beans, as she had been doing until
then.
She started with a crop of tomatoes, which she sold to traders who resold in the main
wholesale market in Nairobi. Later, she started growing French beans and selling them to
brokers buying for major exporters. Last year, she joined the Kimuri Farmers Self-help
Group and sold her French beans to an exporter through the Group. She explained that sale
through the Group has a number of advantages. First, her output is too small to attract direct
deals with a major exporter. On her own therefore, she is constrained to sell to brokers at a
price that is lower than that offered by major exporters. As a group, however, members pool
their produce to achieve volumes that attract direct negotiations with major exporters. She
stated that exporters offer a more reliable market outlet than brokers do. In addition, the
group deposits each farmer�s payments directly in his/her personnel savings account, thus
offering better security than cash transactions. This also saves the farmer the cost of
traveling to the bank, which are usually located in major urban centers, to deposit the money.
At the same time, she pointed out a major weakness of selling through the Group.
The fact that produce from member-farmers is pooled and presented to the buyer as one lot
reduces the incentive to maintain quality control in production and handling. Some members
do not strictly follow the recommended production practices, and the low quality of their
output reduces the quality and price of the entire lot.
Asha stated that the well-being of her family has greatly improved since she started
growing commercial horticultural crops. In particular, she said that she used to have
difficulties paying her children�s school fees, so her children were frequently being sent away
from school. Since starting horticultural production, this is no longer a problem and her

54
children have been able to attend school without interruption. In addition, she said that she
used to be forced to sell all her maize and beans at harvest to generate cash for school fees.
This meant it was necessary to engage in causal wage labor to raise money for food. Now,
she is able to save some of her maize and bean harvest for own consumption. Finally, she
noted that she used some of the proceeds of the horticulture farming to buy a plot of land in
Mombassa , which she plans to develop.
When asked why other farmers in her area did not grow fruits and vegetables as a
commercial activity, she cited lack of capital, especially money required to acquire a water
pump. Currently, her only other crop is a three acres intercrop of maize and beans. She also
owns one dairy cow and a team (two) of plough oxen. She ranks horticulture as her most
important source of income, followed by dairy.
Case 2: A trader is unimpressed with vegetable production
Nancy Wanjiru is a middle-aged woman who ventured into commercial horticultural
farming two years ago. Before then, she was a small-scale trader dealing in cereals but
heavily dependent on hired transport to ship supplies from the production areas. It was
difficult for her to compete with larger traders because they could negotiate volume discounts
when buying and transport their product at lower per-unit costs. Because of her poor
competitive position, she was on the look out for a better source of income. She noticed that
her sister�s family, despite owning no land, was doing well by renting land and growing
commercial horticultural crops. Like her sister, Nancy does not own any land, but she rented
four acres and started with tomatoes and cabbages, which she sold to traders mainly serving
the city of Nairobi. Last season she produced two acres of French beans, which she pooled
with her sister�s, who is a member of �Kimuri Farmer�s Self-help Group�.

55
Ms. Wanjiru said that the well being of her family has not changed with her shift to
commercial horticultural farming and that she plans to shift back to trade business when her
land lease expires. She cited inadequate capital as the major reason for her lack of success
with horticulture. Without adequate working capital, she is not able to plant a crop of French
beans on a weekly basis, which is essential for a continuous flow of produce and thus, cash.
Further, the uncertainty of the continuity of land lease discourages her from investing in
irrigation infrastructure. During dry spells, she has to pay casual laborers to carry water from
Thiba River, which about a kilometer from her plot. She cites this as the major factor
constraining other farmers in her area from growing fruits and vegetables as a commercial
activity. Her only other crop production consists of intercropping maize and sweet potatoes.
Wanjiru cites lack of transparent in grading of the produce as a major marketing
problem. Instead of conducting grading at the produce collection center, the buyers collects
the whole produce delivered, grades it at his own pre-cooling center in the absence of the
farmer or his representative. The group only gets figures of the quantities assigned the
respective grades including the quantity rejected. There are no verifying mechanisms. She
recommended that the government can assist horticulture farmers by designing and enforcing
a more transparent grading system in which both parties (the farmers� representative and the
buyer) are involved.
Case 3: Tomatoes help pay for school fees
Joseph Githiga is a 32 years old farmers who started growing commercial horticulture
three years ago after he acquired an irrigation pump. Before that time, he intercropped maize
and bean and working as a casual laborer sorting tomatoes for other farmers. He bought the
pump out of savings from his causal labor and sale of maize and started growing French
beans. Last season he produced one acre of tomatoes which he sold at �Wakulima Market,�

56
the major wholesale market in Nairobi, using hired trucks to ship the produce. He continues
to grow maize and beans on a two-acre plot of leased land and he raises chickens, but
horticulture is now his main source of income.
Mr. Githiga explained that the well-being of his family has greatly improved since he
started growing commercial horticultural crops. In particular, his family now eats better, and
he pays his children�s fees comfortably. In addition, he has, out of the proceeds of the
horticulture farming, bought a 1.5 acre plot of land where he is planning to settle his family.
Current he lives on and cultivates a one acre section of his parent�s land, but he feels he
needs to move to his new piece of land to make room for his younger brother.
He cited high petrol prices as a major constraint to the profitability of his enterprise,
since he uses a petrol irrigation pump. Marketing problem is his other major hindrance in the
activity. He feels that the market fee charged by the city council of Nairobi is excessive. He
and other traders have held talks with the municipal officials in charge of the market and are
waiting for feedback. According to Mr. Githega, the main factor constraining other farmers
in the area from becoming involved in commercial horticulture is the lack of capital required
to buy a water pump.
Case 4: An accounts-clerk turns to passion fruit
Karimi is in his mid-thirties and started growing commercial horticulture in 1999.
Before then, he was an accounts-clerk with the city council of Nairobi. His major motivation
came from the observation that a friend who had resigned from Unilever-Kenya to grow
commercial passion fruit had improved his lot greatly. Karimi resigned his job and uprooted
his 0.25 acres of tea to plant passion fruit trees. There was a strong market demand in both
the local and export market. The export market offers a higher price, but it is very
demanding in terms of quality and only about 50% of his output is of export quality.
57
Karimi had a bad start: after only one season, his first crop of passion fruit was completely
destroyed by counterfeit fungicides. The production of passion fruits is constrained by muthu birds,
and protecting the fruit is very labor intensive. Since then, the crop has done better and the well-
being of his family has greatly improved. With the savings from passion fruit production, he bought a
one-eighth acre plot in Kirinyaga town, where he plans to put-up a residential rental house. He has
also been able to take his son to a better school.
He cited lack irrigation as the major factor constraining other farmers in his area from
growing fruits and vegetables as a commercial activity. During dry spells, he has to pay casual
laborers to manually carry water a bole-hole on the farm. With regard to passion fruit growing, which
is a fairly new activity in the area, he cited lack of knowledge about production methods, high costs
of fruit tree planting, the long waiting period before the first harvest (about six to nine months), and
labor-intensity as the major constraints. When asked how the government could assist horticultural
producers, he said that greater effort was needed to control the quality of agricultural chemicals and
regulate input stockists. He does not have any other agricultural enterprise.
Case 5: A long-time horticultural grower
Joyce Wambui and her husband have been growing commercial horticultural crops
since they started a family in 1981. They started with a tomato crop for sale. Last season
they cultivated a crop French bean. At the time of this interview, they were harvesting a crop
of sweet corn. In their own assessment, they feel that the horticultural activity have afforded
their family a relatively good livelihood. From the proceeds of the activity, they are able to
pay their children�s school fees. In addition, they have, bought a dairy cow and a pair of
oxen, and they have a brick-house under construction.
One major concern, which they explained is shared by many horticultural growers in
the area, is that they have started observing problems with the soils. They explained that
tomato and some varieties of French beans and even the traditional varieties of bananas have
58
been affected by a wilting disease. They were concerned that they may already be
experiencing the problem affecting Kibirigwi Irrigation scheme (see below). To deal with
this from, they explained that they have shifted from French bean and tomatoes to sweet
corn. Another problem experienced in the area is poor water�use management. During dry
spells, farmers down steam do not get sufficient water. To solve this problem the farmers in
the areas have formed the Kutus-Kiriti Water Furrow Farmers� Group. However, although
the group has designed a system of water use shifts, it has not been able to enforce the new
system. The group is also encouraging farmers to use pipes to extract water from the main
furrow instead using lateral furrows. This effort has been more successful, mainly because
the pipes help control the soil problem cited above.
Case 6: A horticultural farmers� group.
The Kathiriti-Kanjau Horticulture Growers is a registered farmers� self-help group. It
was founded in the year 2001 and has a membership of 27 farmers. This and other farmer
groups in the area were formed, in part, by the desire to eliminate brokers and permit direct
deals with the principal exporters. An official of the group explained that the growers
recognized that the major function of brokers is to assemble large lots for exporters. The
farmers realized they could achieve such lots by pooling their produce for collective handling
by prospective exporters. Such groups are common in the area. They, on behalf of member-
farmers, approach an exporter to seek contractual market arrangements. Such market
arrangements offer a more liable market outlet as well as high prices as compared to the
broker market. Through such arrangements, the exporter contracts the group to supply a
certain quantity of produce per week depending on the market season. The exporter supplies
the seed on credit with a promise to buy the entire produce. He recovers his cost from the
group�s sales proceeds.

59
The exporter also prescribes the recommended chemicals and production methods, as
well as requiring farmers to uphold certain sanitary condition. The group recognizes that
since member produce is pooled and marketed as one lot, there is an incentive for some
members not to strictly follow the prescribed practices. Poor quality crops produced by such
farmers downgrades the produce for the whole group with heavy losses for farmers adhering
to the prescribed practices. The group has therefore employed a field supervisor charged
with the responsibility of supervising and monitoring production practices to ensure that
farmer-members follow the prescribed methods. The supervisor was trained by the exported.
The group only met his transport cost to Nairobi and his/her subsistence. The exporter offers
free training.
With encouragement from the Department of the Social Services, under which the
group sought legal recognition, the group has implemented a savings and credit schemes. The
scheme currently provides members with credit to meet harvesting labor costs. The group is
also planning to issue dividends from any surplus savings.
The group cited poor market agreement as the major problem market constraining
collective marketing. The agreements achieved are usually asymmetrical with the buyer
having the upper hand. In particular, the group explained that exporters do not conduct
grading on the field. The current practice is for buyer to collect the whole produce delivered
and to grade it in the absence of the farmer representative. The group only receives
communication on the quantities meeting the respective grades. There was a general
concern that exporter may be using the grading to pass all market risks and uncertainties to
the farmer.

60
Summary
In spite of the variety of crops and experiences, there are some common themes that
come out of the case studies. First, success in horticultural production involves a continuous
series of experiments and adjustments. Rarely do farmers �get it right� the first time, and
often several crops are tried. Second, the capital cost of irrigation pumps and the institutional
issues of water management are perceived to be major constraints on horticultural
production. Third, farmer groups play an important role in reducing the transaction costs
between small farmers and exporters. These groups allow exporters to distribute inputs on
credit, to assemble the output, and to recover loan repayments with many small farmers.
Brokers sometimes play this role, but growers feel they are better off working through a
farmer group. And fourth, most of the farmers interviewed felt that commercial horticultural
production had made a significant contribution to the well-being of their families. In many
cases, the additional income is used to buy land and/or to pay school fees.
5. FRUIT AND VEGETABLE MARKETING
The success of the fruit and vegetable sector is largely based on the efficiency and
flexibility of the marketing system. This is partly because a large share of the potential
demand for fruits and vegetables is in urban areas and in foreign markets, so that the volume
of horticultural production is highly dependent on markets to link producers and
consumers22. In addition, the perishability of fruits and vegetables makes prices more
volatile and production more risky, thus increasing the potential gain from the exchange of
marketing information between producers and traders. Third, fruit and vegetable production
requires more labor, more purchased inputs, and more skill than do grains and legumes, 22 In contrast, the bulk of the market for staple foods in a developing country is typically in rural areas, so that the volume of production is less sensitive to the efficiency of the marketing system.

61
implying that the transmission of credit, inputs, and technical assistance is often necessary.
The second and third factors suggest that vertical coordination between producers and traders
is important in fruit and vegetable marketing, particularly when the producers are
smallholders.
This section describes the fruit and vegetable marketing system in Kenya. We begin
with a discussion of some of the marketing institutions and then describe the main
characteristics of different types of market channels. Because of the diversity of the sector,
however, we are only able to provide a brief outline
MARKET INSTITUTIONS
Unlike other major agricultural sub-sectors, where both external and domestic trade
has been under tight government controls, the marketing of horticultural products has
generally been free of direct government interventions. With the exception of onions, the
government has not been directly involved in the pricing or performance of physical
functions of horticultural marketing. The role of the government has been minimal and
mainly confined to regulatory and facilitative functions (Kimweli 1991). The remarkable
performance of the industry has been ascribed to this policy, which engendered autonomy in
production and marketing decisions thus fostering significant local private initiatives and
dynamism within the industry.
The Horticultural Crop Development Agency (HCDA) was established in 1967 under
an Act of Parliament. It is a government parastatal charged with the responsibility of
promoting the development of horticultural crops, licensing exporters, and disseminating
information on horticultural marketing. Initially, the HCDA was involved in the direct
export of onions and a few other horticultural commodities. In 1986, however, the

62
government decided to leave horticultural exports to the private sector, and the HCDA
withdrew from this activity.
Currently, HCDA is funded by a levy (12 cents per kilogram) on horticultural exports
and through support from various international organizations (Lambert 2002).
Unfortunately, the fact that HCDA is funded by a tax on exports creates an incentive for
exporters to under-state fruit and vegetable exporters, compromising perhaps the main task of
HCDA which is to gather and disseminate information about the sector. Djikstra (1997)
reports that the some farmers and exporters criticize the HCDA for failing to provide useful
information to farmers in exchange for the tax. One report suggests that HCDA �has played
little role in the past decade, staying safely on the sidelines� (Ebony Consulting International
2001).
Other government involvement in the industry includes provision of extension
services and promotion through research and development. The importance attached to the
industry is reflected in the fact that the Ministry of Agriculture and Rural Development
(MoARD) has a full-fledged Horticultural Division charged providing extension services to
producers. Further, Kenya Agricultural Research Institute (KARI), the national agricultural
research institute, has, as part of its research stations, a National Horticultural Research
Institute charged with research and development of horticultural crops.
The Kenya Plant Health Inspectiion Service (KEPHIS) became operational in 1997
with a staff of 287. One of KEPHIS�s tasks is to inspect imported and exported agricultural
commodities and to issue required phytosanitary certificates for export shipments. A team of
22 inspectors cover the fresh produce and flower sectors. KEPHIS is seeking recognition by
the European Union Commission as a �competent authority,� which would delegate most

63
inspection responsibilities to KEPHIS and facilitate the entry of Kenyan exports into the E.U.
Its role in the horticultural sector is likely to increase with the rise in sanitary and
phytosanitary requirements for exporting to the E.U. (see Jaffee 2003 for more detail).
The Fresh Produce Exporter Association of Kenya (FPEAK) is a non-governmental
organization formed in 1975, which currently has 80 members. Its activities include market
research, representing exporter interests to the government, liason with research and
regulatory organizations, support for smallholder outgrower schemes, and the drafting and
implementation of the Code of Practice for horticultural producers. FPEAK has been
supported by USAID (though funding has recently expired) and recieves income from a
small levy (5 cents per kilogram) on exports. Although FPEAK traditionally represented
small and medium exporters, larger exporters are beginning to join to deal with regulatory
issues and new European environmental regulations.
FPEAK, in collaboration with HCDA and others, have drafted a 70-page Code of
Practice for horticultural growers and exporters (FPEAK 1999). The Code is designed
satisfy European importers that Kenyan horticultural products are produced in an
environmentally-friendly way with due regard for worker health and safety. There is no legal
enforcement mechanism, but with European certification of the Code, it is likely that
importers will pressure exporters to adhere to the standards. Some have expressed concern
about the cost and feasibility of meeting and documenting compliance with the new Code.
(Harris et al. 2000; Ebony Consulting International 2001).
MARKET CHANNELS
Market channels vary widely depending on the commodity, the location of the final
consumer relative to the farmer, and the degree of processing. It is convenient to distinguish

64
between market channels to serve rural consumers, urban consumers, and the export market.
Figure 3 summarizes the main market channels for each type of consumer, but it is important
to recognize that this diagram necessarily simplifies the situation, since market channels vary
widely across commodities and regions. Some of this diversity is described in the following
sections.
Figure 3--Horticultural marketing channels
Source: Based on author�s interviews.
Retailers alongside major roads roadside
Retailers in rural market centers
Supermarket/green groceries /shops/hotels
Retail
Vendors
Producer
Commission agent calling at farm-gate
Urban wholesalers and retailers at designated agricultural assembly markets centers
Importer
Exporter
Wholesalers
Rural consumer Urban consumer
Processor

65
Market channels for rural consumers
Horticultural producers easily access nearby rural consumers through direct
marketing channels involving sales at the farm-gate or at rural market centers. The smallest
rural markets are informal and periodic, with one or two market days per week. These
markets are located close enough to production areas so that the produce is transported to
market by head-load and by bicycle. At these markets, transactions are often directly
between farmers and consumers.
Larger rural markets are registered and supported by the local government (county
councils). These are also periodic, though trade may take place on non-market days as well.
They are more likely to have permanent stalls where traders sell to consumers and other
traders. These larger markets draw farmers from greater distances, so the produce may be
brought to market on the top of mini-buses and by small trucks (Dijkstra 1997 and 1999).
Because of the range of agro-ecological conditions in Kenya, different regions
specialize in different types of fruits and vegetables. Thus, there is some long-distance rural-
rural trade in fruits and vegetables. These goods often pass through wholesalers in large
urban markets, giving rise to the phenomenon of urban-rural flows of produce.
Market channels for urban consumers
Produce is brought from rural to urban areas through a chain of intermediaries that
may include assemblers, brokers, wholesalers, and retailers. Produce is brought to the urban
markets by independent assemblers or by wholesalers agents who purchase directly from
farmers or gather produce from rural markets. Transportation may involve minibuses (for
small quantities) or trucks (for larger quantities). Because of the widely ranging agro-
ecological zones and the associated geographical distribution of production, long distance
traders and transporters play a very crucial role in moving fruits and vegetables to the urban
66
markets. For the same reason and because of the small sizes of farm production, commission
brokers, acting on behalf of large and long-distant traders, play an important role in searching
for supplies and organizing procurements into economical loads. Dijkstra (1999) shows that
farm-gate sales of potatoes to �collecting wholesalers� makes sense for the farmer because
the traders have lower marketing costs due to economies of scale. Nonetheless, farmers often
feel exploited by traders and express a strong desire to deal directly with the principal buyers,
with some forming into commodity-specific community based groups to organize collective
sales in order to by-pass the agent.
Horticultural cooperatives have been promoted by the government as a way to avoid
�exploitation� by traders. Although cooperatives are active in marketing coffee, cotton, and
dairy products, horticultural cooperatives are rare in Kenya. Attempts in the 1980s to
organize farmers into a Horticultural Cooperative Union were beset with serious
management difficulties leading to their abandonment. According Dijkstra (1997), farmers
do not trust cooperatives because, in the past, farmers were forced to market their output
through inefficient and sometimes corrupt cooperatives that were created and managed by the
government.
Generally, every major urban center in the country has two markets, a wholesale and
a retail market, at locations designated by the local government. The markets are
administered by urban councils of the local governments. The councils are charged with the
responsibility of providing the markets with necessary facilities, including concrete floors,
roofed sheds, display benches, security, running water and toilets as well as to enforcing
sanitation. To finance and maintain the facilities, the councils levy a cess from traders using
the market facilities. As shown in Figure 2, the council markets are the main market contact

67
points for distribution of horticultural commodities to urban areas. The state of the markets,
however, varies greatly with most experiencing a serious problem of congestions. The
authorities often have trouble separating the retail and wholesale functions, as retailers often
�invade� wholesale markets (Dijkstra 1997).
Over the years, roadside-market assemblies have developed as convenient target sites
for motorist, who stop for a snack or to buy fruits and vegetables to take home. Produce
commonly sold at roadside contact points includes pineapples, ripe bananas, oranges,
potatoes, green peas, and carrots. Green maize, boiled or roasted on the cob, is also a
common snack sold alongside major roads. Roadside-sellers procure suppliers either directly
at farm gates or from urban agricultural market assemblies. Some producers also retail own
produce at the roadsides.
Fruits and vegetable retailers comprise the principal linkage between the urban
markets and the final urban consumer. These are typically small-scale traders operating in
make-shift-sheds in high-density residential areas, on pavements in busy urban streets, or
hawking produce door-to-door in the residential areas. Such vending is common with most
other agricultural commodities as well as other general consumer products. It a major
component of a fast growing informal sector . However, the legal status of the activity is not
clearly defined. Major issues of concern are the congestion of urban streets and sidewalks
and the sanitary conditions under which produce is sold.
Market channels for processed fruits and vegetables
Studies of Kenya�s horticultural processing sub-sector show that the market for the
processed food products is highly segmented (Maritim 1994). The main processed
commodities include canned vegetables and fruits, jams and marmalades, dehydrated
vegetables, spices and food seasoning, and frozen products and juice concentrates. Canned

68
vegetables and fruit preserves are generally targeted to affluence consumers in Kenya.
According, they are distributed through supermarkets, specialty shops, hotels, and other
outlets catering to high-income consumers.
Juices and dehydrated vegetables, on the other hand, are target for a wider market
segment with different marketing strategies for the different market sub-segment. Low-
income groups are reached with smaller packages through shops and kiosks. Processor are
also devoting special marketing strategy towards the school children segment with small
packages and ease in dispensing of the content. Spices and food seasoning are generally
targeted for the high-income groups. Frozen products and juices concentrates are mainly
targeted for the export market.
Apart from large and medium processing entrepreneurs, observations in major urban
centers reveal that individual and village-based small-scale processors, principally producing
fruit juices, have recently emerged with the liberalization of the sub-sector. However, there
is little documentation of their operations. A study by RELMA (2001) concluded that local
processing of avocado is limited to cottage industries with potential opportunities in a wide
market segment.
Export market channels
Export channels vary widely, but they can be roughly classified according to the
degree of vertical integration. At one extreme is the verticallly integrated Del Monte, which
produces pineapples on its own plantation in Thika, processes the pineapples, arrange
shipping to Europe or other destinations, and even distributes the goods to supermarkets and
wholesalers in foreign markets. This system is not limited to canned pineapple, however.
69
Dolan and Humphrey (2000) find that, among the four largest fruit and vegetable exporters,
40 percent of the production was from their own farms (including own and leased land)23.
Another channel involves exporters who contract farmers to produce fruits and
vegetables for export. Dijkstra (1997) reports that almost all horticultural exporters rely to
some degree on contract farmers. The agreements between exporters and farmers are often
unwritten and are subject to frequent disputes. If the market price falls, the exporter may fail
to pick up the produce and try to source elsewhere. If the market price rises, farmers may
sell elsewhere and default on the agreement (Jaffee 1995; Kimenye 1995). When exporters
contract directly with farmers, they are often large or medium-scale farmers Among the four
largest fruit and vegetable exporters, about 40 percent of supplies are obtained from large-
scale commercial farms and only 18 percent from smallholders (Dolan and Humphrey 2000).
A third channel involves various types of intermediaries between the farmer and the
exporter. Small farmers and those that do not live in the main production zones often rely on
traders or brokers to assemble produce for resale. Sometimes a large farmer who has a
contract with an exporter will coordinate the production and marketing of the some of the
produce by smallholders living nearby. These are more likely to be spot market transactions.
A third type of intermediation is community-based organizations. For example, in the
production of French beans for export, farmers have created groups to ensure a minimum
level of production to attact exporters or traders. Through self-selection and peer-
monitoring, such groups also provide some assurance of quality and commitment. Exporters
use spot market purchases to fill in gaps between their regular supply (from own production
23 As noted earlier, however, exporter may wish to exaggerate their own-farm production to reassure importers.

70
and contracts) and their commitments to distributors and supermarkets overseas (Jaffee 1995;
Ebony Consulting International 2001).
In the early 1990s, there were about 200 licensed fresh produce exporters, but only 50
were full-time dedicated exporters. The other 150 were traders who enter the market as
opportunities arise (Jaffee 1995). The smallest and most transient of these are called
�briefcase exporters.� Few of the fruit and vegetable exporters are foreign companies. One
third of them are Kenyans of South Asian origin, who make use of kin connections to export
produce, particularly Asian vegetables, to the United Kingdom (Dijkstra 1997). Several
observers have noted that the export sector has become more concentrated over the 1990s.
This trend is a response to the increasing role of supermarkets as importers and the premium
they give for reliability of supply, consistency of quality, and documentation of production
conditions. Exporters are being required to monitor and document production practices
affecting food safety (such as chemical use) and, increasingly, worker conditions and
environmental impact. Furthermore, the trend toward pre-packaging and labeling exports so
they are ready for retail distribution increases the economies of scale in exporting (see
Kamau 2000; Dolan and Humphreys 2000; ECI 2001; and Jaffee 2003).
The complexity of export marketing is illustrated by Figure 4, which shows the
different channels used to export French beans as estimated by Ebony Consulting
International (2001). According to this report, 8-10 large-scale exporters with foreign
distribution capacity account for 75-80 percent of the export volume, while small and
medium-size exporters represent another 10-15 percent (Ebony Consulting International
2001).

71
Figure 4--Marketing channels of French beans
Source: Ebony Consulting International (2001)
Transport
Market
Exporter
Broker
Grower Small Growers(20-50,000?)
Large Contract Growers(100?)
Brokers(??)
5% -10% of total exports
Briefcase Exporters(50 exporters)
less than 5% of exports
Large vertically
integrated exporters
(8-10 exporters)
(75-80 % of exports)
Shipping
Importer
Small to Medium Contract Growers (4000)
small to medium
exporters (15-20
exporters)
10-15% of exports
Dedicated DistributorsWholesale Importers Distributors
Wholesale Markets Supermarkets
(pre pack and prepared Pack)
CHANNEL 1
BROKER CHANNEL
CHANNEL 2
SMALL TO MEDIUM EXPORTERS
CHANNEL 3
INTEGRATED LARGE EXPORTERS
Input
KENYAN GREEN BEAN SUBSECTOR MAP 2001
(19,500 Tonnes)

72
It should be noted that most exporters are involved in more than one type of
marketing channel simultaneously. For example, of the eight largest green bean exporters,
two rely primarily on own-production and contracts with large-scale farmers. Two others
rely mainly on contracts with smallholders. And the other six make use of a variety of
strategies for obtaining supplies (Ebony Consulting International 2001).
6. COMPARISON WITH CÔTE D�IVOIRE
BACKGROUND
As of 1999, Côte d'Ivoire was the main horticultural exporter in West Africa,
exporting US$ 140 million of fruits and vegetable in 1999. This placed Côte d'Ivoire at
approximately the same level as Kenya and second only to South Africa among sub-Saharan
African countries (FAOSTAT 2002). This section examines the development of the
horticultural sector in Côte d'Ivoire and the factors that contributed to the growth in this
sector. The goal is not to provide a comprehensive analysis of horticultural exports, but
rather to highlight the variety of experiences in horticultural development across African
countries, as well as to identify some similarities with the Kenyan case.
Over the first two decades of independence, Côte d'Ivoire was considered an African
success story. The country had maintained a high rate of economic growth (7.2 percent
annually in real terms over 1960-1975) based largely on agricultural exports produced by
small-scale farmers. The government successfully diversified its exports, with the
contribution of cocoa and coffee to agricultural export revenue falling from over 90 percent
in 1961 to 77 percent by 1975. Paradoxically, government support for the agricultural sector
led to structural transformation in which the share of the primary sector (crops, livestock,

73
forestry, and fisheries) in gross domestic product fell from 43 percent at independence to 28
percent in 1974 (Tuinder 1978: 322-323; FAOStat 2002).
As in Kenya and many other developing countries, however, the government
responded to the commodity price boom of the 1970s by embarking on a public expenditure
and investment spree that could not easily be scaled back when the boom subsided. In the
1980s, adverse trends in world prices and the accumulation of public debt forced the country
into a series of structural adjustment programs with the International Monetary Fund and the
World Bank (Widner 1993; Zartman and Delgado 1984). More recently, the reputation of
Côte d'Ivoire for political stability was undermined by a coup in 1999, allegations of rigged
elections in 2000, a coup attempt in 2001, and a armed rebelion in 2002 (Government of Côte
d'Ivoire 2003). Here, we focus on the challenges and opportunities related to horticultural
exports from Côte d'Ivoire up to the recent political problems.
EVOLUTION OF THE IVORIAN HORTICULTURAL SECTOR
Fruit and vegetables exports from the Côte d'Ivoire were worth almost US$ 127
million in 2000, somewhat less than Kenyan fruit and vegetable exports. However, Ivorian
exports have not grown as quickly, and they contribute less than 7 percent of the value of
agricultural exports (see Figure 5).

74
Figure 5--Value of Ivorian fruit and vegetable exports and share of agricultural export revenue
0
50
100
150
200
250
300
350
400
61 63 65 67 69 71 73 75 77 79 81 83 85 87 89 91 93 95 97 99
Val
ue o
f fru
it &
veg
etab
le e
xpor
ts
(mill
ion
US$
)
0%
5%
10%
15%
20%
25%
30%
35%
40%
45%
50%
Shar
e of
agr
icul
tura
l exp
ort r
even
ue
Nominal value of export
Real value of export
Source: FAOStat for agricultural statistics and U.S. Department of Commerce for U.S. consumer price index.
Unlike Kenya, where horticultural exports are relatively diversified, the horticultural
exports of Côte d'Ivoire are based largely on two commodities, pineapples and bananas, each
of these commodities has a long history in the country (see Figure 6). Bananas and plantains
have been grown in West Africa for centuries, and banana production for export in Côte
d'Ivoire began in 1933, when European settlers adopted the crop in response to low prices of
cocoa.

75
Figure 6--Trends in the composition of Ivoirian fruit and vegetable exports
Bananas
Pineapples
Canned pineapples
Other
0
50
100
150
200
250
300
350
400
61 63 65 67 69 71 73 75 77 79 81 83 85 87 89 91 93 95 97 99
Val
ue o
f fru
it &
veg
etab
le e
xpor
ts
(200
0 U
S$ m
illio
n)
Source: FAOStat for agricultural statistics and U.S. Department of Commerce for U.S. consumer price index.
Exports were quite modest, however, and Guinea was the dominant supplier of
bananas to France at the time (Sawadogo 1977: 119). During the 1950s, production of export
crops by African smallholders expanded in spite of policies favoring European growers. In
coffee and cocoa, African smallholders came to represent the bulk of production. The
banana and pineapple sectors, however, evolved toward a dualistic structure with both large-
scale and small-scale production. Because of the cost of transportation and the perishability
of the product, banana production for export was (and remains) concentrated along paved
roads near Abidjan. By the time of independence, banana exports were about 90 thousand
tons, representing about 5 percent of the value of agricultural exports.
Banana exports have benefited from the highly regulated European banana market.
France, the United Kingdom, and other European countries gave preferential access to
exports from African, Caribbean, and Pacific (ACP) countries, most of which were former

76
colonies24. In the case of bananas, this policy has given favorable treatment to exports from
Côte d'Ivoire, Cameroon, other African exporters, and a few Caribbean exporters at the
expense of lower-cost producers in Latin Amercia. The restrictions on European imports
made banana exports quite remunerative, since European prices were significantly higher
than world market prices, but import quotas limited the volume. In spite of a peak in 1974,
banana exports from Côte d'Ivoire over the period 1961-1989 averaged 120 thousand tons per
year, no greater than the level in the early 1960s.
The export of pineapple products also began during the colonial period, when two
processing plants were established with foreign investment. At independence, the export of
pineapple products was less than half the value of banana exports (2 percent of agricultural
exports). However, these exports grew steadily through the 1960s and 1970s so that, by the
early 1970s, the export value of pineapple had surpassed that of bananas. At this time, most
of the pineapple exports were in the form of canned pineapples and single-strength pineapple
juice. In the 1980s, however, Thailand expanded exports three-fold, increasing its market
share of the canned pineapple market to over 50 percent and pushing world prices down
(Loeillet 1997). Also during the 1980s, economic reforms in Côte d'Ivoire reduced subsidies
for many state enterprises and closed others, including CORFRUITEL, the parastatal in
charge of marketing fruit (Rouge and N�Goan 1997). As a result, Côte d'Ivoire exports of
canned pineapple and pineapple juice had practically disappeared by the late 1980s.
Much of the Ivorian pineapple production, however, switched over to fresh pineapple
export to Europe by sea-freight, using the same refrigerated freighters (�reefers�) used to
24 The 1957 Treaty of Rome established preferential access to markets in France, Greece, Italy, Portugal, Spain, and the United Kingdom for exporters from ACP countries. Exports from other countries, most notably in Latin American, were subject to a quota and 20 percent duty. Germany maintained a duty-free import policy. The other five member states maintained a 20 percent duty on banana exports from non-ACP countries. These disparate policies continued until 1993, as discussed below (Guyomard, Laroche, and Le Mouel 1999).

77
transport bananas. This move took advantage of the advantage of Côte d'Ivoire in terms of
its proximity to Europe, a factor much more important in the fresh pineapple trade than in the
market for canned pineapple. This market is not without its problems, however. In the late
1980s, Côte d'Ivoire began to lose market share to Central American and Caribbean fresh
pineapple exporters. After supplying close to 90 percent of the European market for fresh
pineapple in the mid-1980s, their market share fell to two-thirds in 1990 (Rouge and N�Goan
1997).
The 1990s brought several changes favorable to Ivorian fruit and vegetable exports.
First, in 1990s, the Office Centrale des Producteurs-Exportateurs d�Anana et de Bananes
(OCAB) was formed to represent the interests of exporters, set quality standards, and
facilitate communication. OCAB has reduced the number of �approved� exporters of fruit in
an attempt to maintain quality standards. It also organizes the charter of refrigerated ships to
transport bananas and pineapples to Europe.
Second, in 1993, after much debate, Europe harmonized its banana import policies to
make way for the single European market. Although the United States and Latin American
exporters pushed for a more liberalized system, as existed in Germany, the EU maintained
the system of preferences for ACP countries, extending it to all members of the European
Union. This expanded the size of the market to which Côte d'Ivoire and other ACP
producers had preferential access25.
25 Under the new regime announced in 1993, EU and ACP exporters were entitled to duty-free access to European markets up to 858 thousand tons, with each exporter receiving a quota. Other imports were subject to a 2.0 million tons and a duty of 100 ECU/ton tariff that applied to non-ACP exporters only. Above 2 million tons, banana imports were subject to duties of 750 ECU/ton for ACP bananas and 850ECU/ton for other bananas. A fund was established to assist ACP exporters in the transition. There were two challenges to the new rules under the General Agreement on Trade and Tariffs (GATT). In both cases, GATT panels ruled against the EU, but adoption of the panel decision was blocked by the EU and ACP countries. To appease Latin American nations, the EU negotiated concession to four of the five Latin American complaintants. This �Framework Agreement� expanded the quota to 2.2 million tons, increased the country-specific quotas of these

78
Third, the 50 percent devaluation of the CFA franc in January 1994, helped stimulate
the economy, particularly the export sectors.
The net effect of these three factors has been to reanimate fruit and vegetable exports
from Côte d'Ivoire. Banana exports grew from 95 thousand tons in 1990 to 215 thousand
tons in 1999, while fresh pineapple exports expanded from 135 thousand tons to 183
thousand tons over the same period (FAOStat 2003). Côte d'Ivoire became the second-largest
fresh pineapple exporter in the world after Costa Rica (Ti 2000). In addition, the export of
mangoes has grown rapidly, increasing seven-fold over the 1990s to reach US$ 5 million. As
of 2000, the total value of fruit and vegetable exports was US 127 million, of which 54
percent was bananas, 37 percent fresh pineapple, and 4 percent was mangoes.
In the last two years, two international agreements have been signed that will affect
Côte d'Ivoire horticultural exports. Under the �Everything but Arms� policy, implemented
by the EU in March 2001, duties and quotas on almost all goods from the poorest 48
countries (including almost all of sub-Saharan Africa) have been eliminated. Although the
policy excludes bananas, it will facilitate exports of other fruits and vegetables from Côte
d'Ivoire and other African countries. Quality and sanitary and phyto-sanitary barriers remain
a key constraint to horticultural exports.
Under pressure from the U.S. and Latin America, supported by WTO rulings, Europe
has reduced the preferential treatment of ACP countries in its banana imports and promises to
adopt a tariff-only system by 2006. As a result, Côte d'Ivoire and other ACP producers will
come under increasing competitive pressure from Ecuador and other low-cost Latin
American exporters (Dickson 2002; Lambert 2002).
countries, reduced the non-ACP duty, and allowed these countries to issue export licenses, effectively transferring the quota rents to the exporting country governments (see Dickson 2002 and Guyomard, Laroche, and Le Mouel 1999).

79
POVERTY IMPACT OF IVORIAN HORTICULTURAL EXPORTS
Who benefits from fruit and vegetable exports from Côte d'Ivoire? According to
Lambert (2002), the small-scale rainfed banana farms that used to dominate the sector have
given way to medium and large-scale irrigated farms of 100 to 1000 hectares, mostly owned
by Europeans and selling directly to French importers. In addition, exporters such as
Chiquita and the Compangie Fruitière are vertically integrated with their own plantations.
One factor behind this consolidation is the competitive pressure from non-ACP countries to
reduce the cost of production. Another factor is the increasingly strict marketing
requirements by European importers regarding the size, quality, and consistency of the fruit
and the use of pesticides and other chemicals in production. The implication is that most of
any positive impact in terms of poverty reduction would be through the employment of
workers on the plantations. It is estimated that there are 35 thousand people employed by the
banana and pineapple plantations.
In pineapple production, on the other hand, smallholders continue to dominate.
According to Rouge and N�Goan (1997), 70 percent of Ivorian pineapple exports are
produced by smallholders with 0.5 to 10 hectares. The remaining 30 percent is produced by
large plantations, including some owned by the vertically integrated banana companies such
as Compagnie Fruitière and Chiquita. One reason for the greater involvement of
smallholders in pineapple production compared to banana production is that the initial
investment cost of establishing a plot is estimated to be 3-4 times as great for bananas (Rouge
and N�Goan 1997).
Mangoes are the third most important horticultural export. They are produced by
smallholders in the north of the country, as well as by farmers in Burkina Faso and Mali who
export via Côte d'Ivoire (Lambert 2002). Thus, it is likely that a high proportion of the

80
mangoes are produced by poor households. Given the cost of getting mangoes to the coast
and then to Europe, the farm-gate price may be low, so it is not clear whether mango sales
are an important component of the income of growers.
FACTORS BEHIND THE IVORIAN SUCCESS
The success of the Ivorian fruit and vegetable sector is a qualified one. Fruit and
vegetable exports from Côte d'Ivoire have not grown as fast as those of Kenya, and the role
of smallholders is less important than in Kenya. On the other hand, Côte d'Ivoire is one of
the three largest exporters of fruits and vegetables in sub-Saharan Africa and it maintained
solid growth in the 1990s. Although smallholders play a less important role than in Kenya,
tens of thousands of rural households depend on the sector for their livelihoods, either as
farmers or agricultural laborers.
Several factors lie behind the success (albeit qualified) of fruit and vegetable exports
from Côte d'Ivoire. First, Côte d'Ivoire has long been known for its political stability. Until
the last few years, Côte d'Ivoire had a reputation for being the most politically stable country
in West Africa. President Felix Houphouet-Boigny served as president from independence in
1960 until his death in 1993. He was successful in promoting economic growth and
minimizing political turmoil until the 1980s when commodity prices fell. The advent of
multiparty democracy in 1990 is said to have created (or perhaps just exposed) ethnic and
religious divisions.
Second, President Houphouet-Boigny has, for the most part, supported agriculture-led
growth. He came to prominence representing the interests of African cocoa growers during
the colonial period. As president, he drew his support from the rural areas and maintained a
cocoa farm himself. Although agriculture was taxed directly through the policies of the

81
marketing boards and indirectly through over-valued exchange rates, investment in rural
infrastructure and agricultural research reflected the priority given to agriculture.
Third, Côte d'Ivoire has benefited from its proximity to European markets. Côte
d'Ivoire is just 8-10 days by sea freighter from Marseilles. Although it also benefits from
frequent air-connections with Paris, this is less important since most of the Ivorian fruit and
vegetable exports have been by sea-freight.
Fourth, the government has had relatively limited involvement in production and
marketing, particularly in the horticultural sector. Although the Ivorian agricultural policy
was more interventionist than that of Kenya, President Houphouet-Boigny had a more pro-
market orientation than most of its West African neighbors. In particular, Côte d'Ivoire
maintained close ties to France, while many of its neighbors rejected European involvement
and experimented with different variants of socialism.
7. CONCLUSIONS
As described in the introduction, this paper was motivated by three questions
regarding the development of the Kenyan fruit and vegetable sector, particularly the export
sector.
• Does the horticultural sector of Kenya and Côte d'Ivoire constitute a valid success story in African agriculture?
• What factors have contributed to the historical development of the horticultural sector in the two countries?
• What lessons can be drawn from these examples for policymakers in other African countries and for the international development organizations?
We now return to those questions as a way of organizing the conclusions.

82
IS HORTICULTURE A SUCCESS STORY?
Certainly, horticulture in Kenya can be considered a success in terms of export
growth. Fruit and vegetable exports have grown from US$ 2-3 million at independence to
over US$ 150 million in 1999. The sector has even grown as a percentage of agricultural
exports, rising from 3 percent of the total at independence to 17 percent today. Although
coffee and tea continue to dominate agricultural exports in Kenya, the growth of tourism and
horticulture have reduce the vulnerability of the Kenyan economy to price swings in those
two commodity markets.
It is more useful, though more difficult, to evaluate its success in terms of the impact
on the lives of Kenyan families, particularly the poor. The fact that smallholders produce
some 60 percent of the exported fruits and vegetables provides strong support for the idea
that horticultural development has been good for the rural poor. The results of McCulloch
and Ota (2002) suggest that farmers who participate in horticultural production earn higher
incomes than their neighbors who do not. And the case studies presented in this paper, in
spite of their non-systematic nature, seem to support the idea that when small farmers get
involved in horticultural production for export, their incomes rise and this translates into
more tangible improvements in standard of living such as being able to pay for school fees
and purchase land.
The data from the 2000 Rural Household Survey suggest that almost all farmers, large
and small, rich and poor, participate in some form of horticultural production. Better-off
farmers seem to grow a wider variety of fruits and vegetables, but the percentage
contribution of horticulture to income is fairly constant across income and farm-size
categories. Somewhat surprisingly, the horticultural production of large farmers is no more
commercially-oriented than that of small farmers. While higher income households tend to

83
be more commercially oriented, it would be a mistake to think of poor farmers (and small
farmers) as subsistence farmers. Even among the poorest 20 percent of Kenyan farmers, 41
percent of the fruit and vegetable output is marketed.
And the gross margin analysis indicates that, under certain conditions, horticultural
production can produce substantially higher returns per hectare than staple food crop
production. For example, one crop of French beans can generate gross margins more than
ten times greater than maize-bean intercropping.
What is the direct impact of horticultural exports on Kenyan smallholders? If
smallholders account for about 47 percent of fresh produce exports and the farm-gate price is
60 percent of the F.O.B. price, then the direct benefits of fruit and vegetable exports to
smallholders is about US$ 46 million. Estimates of the number of smallholders that
participate in horticultural exports vary widely. Jaffee (1995) estimates that 13-16 thousand
smallholders are involved in fresh produce export, while Swanberg (1995) cites a figure of
500 thousand. In their diagram of the French bean market channels, ECI (2001) shows 20-50
thousand small growers participating in French bean exports alone. If we assume the
smallholder French bean exporters in the survey by Kamau (2000) are typical of smallholder
exporters, this would imply about 108,000 smallholders in the export sector26. This figure
must be considered highly speculative since we do not know if the sample was representative
of smallholders producing export French beans, much less smallholders producing fresh
produce for export.
26 This calculation is based on US$ 46 million in total horticultural export revenue for smallholders, an average horticultural sales of about 32 thousand Ksh, and the June 1999 exchange rate of 70 Ksh/US$. Among those selling French beans in the 2000 Rural Household Survey, the average value of sales was just Ksh 14,000 or US$ 175, but these farms include those supplying the domestic market. The average value of horticultural sales in the survey carried out by McCulloch and Ota (2003) was 170 thousand shillings or over US$ 2000, but the average farmsize was 2.7 so it is not clear if the sample was limited to �smallholders.�

84
Although less visible, it is likely that the indirect benefits associated with horticultural
exports are greater than the direct benefits. First, the multiplier effect of injecting US$ 46
million annually into the rural sector generates benefits for other households and sectors who
produce goods purchased by export producers. Second, this analysis has focused on
smallholders producing for export, but it is important to recognize the employment effects of
horticultural exports extend beyond this. Del Monte alone employs several thousand workers
in its processing plants and estates. Third, the skills and institutional development stimulated
by the horticultural export sector also serve to development the domestic horticultural
market. Given the fact that 96 percent of fruit and vegetable production is consumed
domestically, even small improvements in yield, post-harvest methods, and marketing
efficiency in the domestic supply chain could have benefits to the economy that are large
relative to the direct benefits of horticultural exports.
It is less clear whether to consider the Ivorian horticultural sector a success story.
First, the sector has not grown in a consistent manner. In real terms, the value of fruit and
vegetable exports in 1999 was still somewhat below the levels it reached in the mid-1970s
and the mid-1980s. Second, the role of smallholders in the Ivorian fruit and vegetable sector
is more limited. Bananas, the largest horticultural export, are produced mainly on large-scale
farms and by vertically integrated multi-national companies. Certainly, there are thousands
of farm workers whose livelihoods are supported by the banana sector, but it is likely that the
benefits are less widely distributed among Ivorian households than it would be if banana
production were based on smallholder production. Third, it is not clear to what degree the
success of the Ivorian banana sector is based on European trade policies that discriminate
against Latin American producers. It is not clear whether current levels of banana exports

85
can be maintained when Europe removes these preferential policies, a change which is not
imminent but may be inevitable under World Trade Organization commitments.
Nonetheless, there are some positive signs in the Ivorian horticultural sector. First,
the sector was able to adjust to the loss of the canned pineapple exports by developing fresh
pineapple exports to Europe (Kenya attempted to launch fresh pineapple exports to Europe,
but it proved uneconomical). In addition, Ivorian horticultural exports showed healthy
growth (4.4 percent) over the 1990s, including expansion of smallholder crops such as
pineapple, mango, and papaya for export. Although it is difficult to foresee the impact of the
current political crisis in Côte d'Ivoire, it seems inevitable that the institutional and
commercial development necessary to expand horticultural exports will be set back more
than a few years.
WHAT FACTORS HAVE CONTRIBUTED TO THE SUCCESS?
Several factors have contributed to the success of the horticultural sector in Kenya
and, in a more limited way, Côte d'Ivoire.
Geography and climate Kenya is favored with an equatorial latitude and bimodal
rainfall that reduce seasonality, combined with a range of altitudes, allowing the production
of tropical fruits such as mangoes, pineapple, and avocados, as well as temperate vegetables
such as French beans. Furthermore, Nairobi and its airport are located in the western
highlands, an area endowed with good soils and a suitable climate for vegetable production.
Similarly, the areas of Côte d'Ivoire most appropriate for banana production are along
the cost, near the port of Abidjan. In addition, among countries with a humid-tropical
climate Côte d'Ivoire is one of the closest by sea to major European ports.

86
Transportation infrastructure. The cost and duration of transportation to major
markets in Europe is a critical factor in the success of the horticultural sector. Both Kenya
and Côte d'Ivoire serve as regional hubs for air traffic. The growth of the Kenyan tourism
industry and the consequent frequency of air connections with Europe has facilitated the
development of fresh produce exports to Europe via air-freight. In Côte d'Ivoire, much of the
horticultural export is by sea-freight, so investment and efficient management of the port in
Abidjan is of critical importance. Domestic transportation infrastructure is also an important
factor, since horticultural exports do not tolerate delays in getting to the airport. The Kenyan
horticultural sector benefits from an extensive road network in the highland areas. It is
estimated that much of the export vegetable production in Kenya takes place within 100
kilometers of the airport. Similarly, banana production in Côte d'Ivoire is concentrated along
paved roads near the port.
Limited direct government intervention in horticultural markets. Another factor is
that the Kenyan government has not intervened to any significant degree in horticultural
markets to buy, sell, export, or set prices. In Kenya, the Horticultural Crop Development
Authority was originally given authority to fix prices, regulate trade, operate processing
facilities, and market horticultural goods. Based on its unsuccessful experience, the
functions were pared back to regulation, market information, and advisory services27. State
enterprises were actively involved in various horticultural processing operations, often as part
of joint ventures with foreign companies. Most of the growth in horticultural exports,
however, has been in fresh produce. In any case, the horticultural sector was never as tightly
27 The HCDA maintained a monopoly on onion marketing and export briefly and later competed with private onion traders. In 1986, the government required HCDA to withdraw from direct marketing. It is probably not a coincidence that the only horticultural commodity the HCDA attempted to market is one of the least perishable vegetables.

87
controlled as the maize, coffee, and tea sectors were. In spite of the proliferation of state
enterprises, the investment climate in Kenya was good, at least compared to many other
African countries. This climate allowed investment in the horticultural sector by local and
international firms, most notably by Del Monte in the 1960s.
Similarly, Côte d'Ivoire is said to have followed an agriculture-led development
strategy and kept direct intervention in agricultural markets to a modest level. Probably the
area of greatest direct involvement in the horticultural sector was in the pineapple processing,
where joint ventures between private investors and various public institutions were the rule.
When the export of processed pineapple products collapsed in the late 1980s, even this form
of participation in horticulture disappeared. It is probably important not to exaggerate the
importance of the lack of direct government intervention in horticulture. Even during the
height of state intervention in agricultural markets in the late 1970s and early 1980s, few
African governments ventured into the risky area of fresh produce marketing.
Policies allowing private and international investment. Both Kenya and Côte
d'Ivoire have had relatively liberal policies regarding foreign investment and investment by
local businesses. In both countries, foreign investment has contributed to increasing the
capacity of horticultural production, processing, and export. In Kenya, Del Monte is the
largest example, but Dijkstra (1997) lists 20 other private processors of fruits and vegetables
in the country as of 1990. Lambert (2002) also stresses the importance of Kenya�s �open
skies� policy, under which exporters and shipping companies may charter planes in their own
name. In Côte d'Ivoire, Chiquita and Compagnie Fruitière have played a central role in
banana and fresh pineapple production and export.

88
Macroeconomic stability and realistic exchange rates. Both Kenya and Côte d'Ivoire
had reputations for political and macroeconomic stability in the 1960s and 1970s, which is
necessary to elicit long-term investments in productive capacity. Similarly, a realistic
exchange rate, which gives exporters the full value of the foreign exchange they generate, is
critical factor in stimulating exports, including horticultural exports. Although both countries
experienced economic problems in the 1980s, the level of inflation and the extent of
exchange rate over-valuation was modest compared to that experienced by some of their
neighbors, including Tanzania, Uganda, and Ghana. The 1994 devaluation of the CFA franc
provided important stimulus to horticultural exports (among others) in Côte d'Ivoire,
contributing to the healthy 4.4 percent growth rate in fruit and vegetable exports over 1990-
99.
Institutional innovation. Horticultural development requres a continuous process of
institutional innovation at two levels. First, institutions are needed to address sector-wide
externalities and coordination problems. For example, the adoption of a common code of
practice, the exchange of market information, and funding of research and extension are
activities that benefit the sector as a whole but cannot easily be carried out by an individual
firm. Second, marketing institutions are needed to improve vertical coordination between
farmers and trader/processors. This may include various types of contract farming, farmer
credit groups, marketing cooperatives, or farmer associations.
The Kenyan government has allowed and (in some cases) promoted the development
of a wide range of private marketing institutions such as the Fresh Produce Exporters
Association of Kenya (FPEAK), local producer associations, self-help groups, and so on. In
addition, it has allowed experimentation with a wide range of institutional arrangements
89
between farmers and buyers. In spite of early attempts to oblige processors to work with
smallholders, greater leeway is now given for the most economical arrangement to evolve in
response to market signals. Over the decades, Kenyan participants in the horticultural sector
have accumulated considerable experience in managing the relationship between growers and
buyers. Today, contract farming may be more widely used in Kenya than anywhere else in
Africa, though conflicts between farmers and buyers are an almost universal feature of these
schemes. One source of conflict is the fact that after a buyer provides the assistance needed
by smallholders (in the form of seed, inputs, and credit) he faces the risk that other buyers
will come and �poach� the harvest and the loan will not be repaid. Alternatively, if the
market price falls, the buyer may refuse to honor its commitment or use grading as a pretext
for refusing shipment. Arbitrary and non-transparent.grading procedures is a common
complaint among contract growers.
In Côte d'Ivoire, the government has created a series of institutions to coordinate
horticultural exports with varying success. In the 1960s, small-scale horticultural producers
formed an export cooperative. In 1976, this was replaced by SICROFEL, a marketing board
with a monopoly on horticultural exports. This approach failed due to high costs,
bureaucratic procedures, and corruption. It was replaced in 1978 by COFRUITEL, a
producer organization with greater participation by exporters but without a legal export
monopoly (Hormann and Weitor 1980). More recently, the government created the
Organisation Centrale de l�Ananas et de la Banane to coordinate the sector and provide
information and other public goods. One of the biggest coordination tasks that the Ivorian
horticultural sector faces is matching the supply of bananas and pineapples at the port with

90
the arrival of ships to transport them. Another is developing a strategy to address mounting
concerns among importers regarding food safety, the environment, and working conditions.
Domestic demand. In Kenya, tourism expanded the domestic demand for high-
quality fruits and vegetables. As hotels and restaurants established supply chains to supply
this produce, they gave Kenyan farmers more experience with horticultural production and
indirectly strengthened the infrastructure and logistical skills of traders, all of which
facilitated the development of the horticultural export sector. Similarly, the domestic
demand for Asian vegetable gave Kenyans experience in growing and marketing Asian
vegetables. These factors facilitated the development of market channels to supply fruits and
vegetables to Asian and European consumers overseas. Although less well documented, the
large French population in Côte d'Ivoire before and after independence may have facilitated
the development of the export fruit sector there.
International commercial links. The presence of the Asian community in Kenya has
undoubtedly contributed to horticultural crop development. Before the 1970s, the Asian
community created a demand for Asian vegetables, providing smallholders with valuable
experience in these crops which would later be useful in serving the UK market. In addition,
the presence of the Asian community made it easier to penetrate the UK market, first with
Asian vegetables and later with French beans and other fresh produce. In the case of Côte
d'Ivoire, multinational corporations (Chiquita and Compagnie Fruitière) offer a different
solution to the problem of coordinating African supply and European demand. By vertically
integrating production, processing, and distribution, the flow of information and credit is
facilitated.

91
WHAT ARE THE LESSONS FOR OTHER AFRICAN COUNTRIES?
Clearly, some of the factors mentioned in the previous section are out of the control
of public policy and investment. Little can be done to alter the geographic and climatic
features of a country. Nor is it practical to alter the ethnic composition of a country to allow
greater links with similar groups in Europe. On the other hand, most of the other factors
carry lessons that are applicable for other countries.
Geography and climate. Although government policy has no control over these
factors, similar conditions exist in Uganda, Rwanda, Burundi, and parts of Tanzania. Côte
d'Ivoire does not have the same range of altitude, but rainfall varies widely between the semi-
arid north and wetter south. In this respect, it is similar to other coastal West African nations,
most notably Ghana and Cameroon.
Stability. Political and economic stability matter. Stability provides investors with
the confidence that they will be able to reap the benefits of long-term investments. Although
both Kenya and Côte d'Ivoire have had leaders whose tenure spanned decades, political
stability should not be defined in terms of the duration of a given regime, but rather in terms
of the durability of policies and economic institutions over time.
Non-intervention. The tendency of the Kenyan and Ivorian governments not to
intervene directly in horticultural production and marketing is clearly an approach that can be
(and is) emulated by other countries. The fresh fruit and vegetable sector is simply too
diverse, too risky, and too fast-changing for state enterprises or marketing boards to play a
constructive role. Kenya�s earlier experience in promoting joint ventures between foreign
companies and state enterprises is almost uniformly unsuccessful and serves as a counter-
example. The most successful processed horticulture operation in Kenya has been Del
Monte, which did not involve a partnership with a state enterprise.

92
Investment in agricultural research and extension. Both Kenya and Côte d'Ivoire
have invested in horticultural research, developing institutions that have their roots in the
colonial period. Although the contribution of horticultural research to the Kenyan and
Ivorian horticultural sectors is not well documented, studies of the benefits of agricultural
research almost invariably show high rates of return. The fact that horticulture often involves
new crops or new varieties to satisfy a export market only increases the need for research and
extension efforts. Disease control and post-harvest processing are also particularly important
in the case of horticultural research. And new sanitary and phyto-sanitary requirements by
importing countries create a demand for research into ways to reduce or eliminate pesticide
residues and prevent the spread of horticultural pests.
Market exchange rate. Exchange rate policy is particularly important for
horticultural exports. A market exchange rate provides greater incentives to produce
exports (including horticultural exports). Furthermore, a liberalized market for foreign
currency facilitates the purchase of imported equipment and inputs for production. This is
more important for horticulture than for field crops because of the need for imported seed,
agricultural chemicals, and specialized equipment. The positive response of Ivorian fruit
exports to the 1994 devaluation of the CFA franc demonstrates this point.
Promoting institutional innovation. The Kenyan experience demonstrates the
importance of allowing a variety of private institutions and marketing arrangements to
develop. The early experience of Del Monte in Kenya shows that it takes more than
experience and technical skills to survive in horticulture. It is necessary to continually
experiment, innovate, and adapt to changing environments. The horticultural sector in Kenya
is characterized by a wide array of institutional arrangements including smallholders selling

93
in spot markets, personalized relationships with traders, implicit contract, explicit contracts,
farmer organizations, medium- and large-scale farming, and vertically integrated producer-
exporters. Many commodity channels involve various scales of production and several types
of farmer-buyer linkages. The government can play a role in facilitating institutional
innovation through the provision of market information, extension services, mediation of
disputes, and the establishment of standards.
Linking smallholders to high-value urban and export markets. Linking small
farmers to high-value urban and export markets is an important strategy for raising rural
incomes and reducing poverty. Such a strategy may also be critical for maintaining export
competitiveness, at least for some labor-intensive crops that require careful husbandry. How
can the government promote smallholder involvement? First, it should avoid leasing land at
concessionary rates, subsidizing credit for mechanization, and providing tax incentives for
agricultural investment, all of which subsidize the formation of large-scale capital-intensive
farms. In some sectors, these farms will be more competitive anyway, but there is no
rationale for favoring these farms through public policy. Second, the government should
avoid counter-productive attempts to impose cooperative production, contract farming,
nucleus estate production, or any other specific marketing system. Efficient market
institutions should evolve out of experiments with different forms. Third, contract farming
shows some promise for delivering improved technology, credit, and information to farmers,
but such schemes only make sense with a crop that involves new technology, an uncertain
market, a large initial investment, and/or specialized husbandry. Even in these cases,
contract farming schemes often collapse when other buyers come to �poach� at harvest,
allowing farmers to avoid repaying loans. The government can, however, facilitate linkages

94
between farmers and exporters or other buyers by helping to organize farmer groups,
establishing ground-rules for farmer-buyer contracts, dissemination of lessons learned from
successful contract schemes, establishing small-claims courts to address contract disputes,
gathering and disseminating information about the past performance of buyers and farmers,
and providing certification services to reduce the transactions costs faced by buyers trying to
purchase from many small farmers.
Air transport sector. The importance of air-freight costs in the competitiveness of
export horticulture indicates has implications for policy. The aviation industry is heavily
protected in most parts of the world, with regulations controlling access by foreign carriers.
Africa is no exception with its plethora of small and uneconomic national airlines. Adopting
an open skies policy might endanger some of these national airlines, but it would probably
introduce greater competition and reduce the cost of air freight. This would have a positive
impact on the export of fresh produce and other high-value commodities.
Ethnic minorities. The positive contribution of the Asian traders to Kenya�s
horticultural development has lessons for other developing countries. Ethnic minority
trading communities are a common feature across the world, from the Chinese in Malaysia to
the Lebanese in West Africa. Given the suspicion and resentment that inevitably occurs on
the part of the majority, special efforts are needed by the government to provide equal
treatment under the law.
Investment in irrigation. Although public and private investment in irrigation has
facilitated the growth of the horticultural sector, the implications must be drawn carefully.
Large-scale public irrigation projects in Kenya and elsewhere in Africa have often proven to
be uneconomic and unsustainable. Problems have arisen from the high cost of irrigation, the

95
lack of adequate feasibility analysis, and problems in managing and maintaining the system
after completion. In the past ten years, most of the investment and increases in capacity in
Kenyan irrigation have been carried in the private sector, by large-scale commercial farms
and by groups of smallholders. The case studies discussed earlier provided several examples
of farms that started horticultural production when they obtained a pump. This finding
highlights the need for a competitive market for agricultural equipment, including water
pumps. Given the externality issues associated with irrigation, the government has a role to
play in facilitating the formation of water-user groups to regulate water use, organize
maintenance, and resolve disputes. In addition, the government can fund research and
dissemination activities to stimulate innovation, particularly in micro-irrigation technology.
Contract enforcement. Although disputes in contract farming arrangements will
never be avoided completely, the experience of Kenya (and other countries) indicates that
there may be a role for the government in enforcing contracts between buyers and growers,
or at least in mediating the disputes between them. Developing new institutional
arrangement that would facilitate the enforcement of contracts would contribute significantly
to the more-widespread use of contract farming and would expand the participation of small
farmers in high-value horticultural production and export. Although the costs of enforcing
each contract may be prohibitively high, there may be scope for better record-keeping to
identify and exclude farmers that have violated contracts in the past. In the short run, this
would protect the interests of buyers, but in the long run it would increase the availability of
credit and other forms of assistance for farmers.
Clearly, the development of export horticulture depends in part on geography,
historical accident, and agro-climatic factors. Because of these factors, some countries do

96
not have the potential for large-scale horticultural development even with the best policies
and investment. Many of the factors that have contributed to the success of the horticultural
sectors in Kenya and Côte d'Ivoire are, however, subject to influence through policy,
regulation, and public investment. Furthermore, most of the lessons derived from the
Kenyan and Ivorian examples make sense for the development of commercial agriculture,
regardless of whether or not horticulture is involved.
97
REFERENCES
ApproTEC. 2003. Micro-irrigation technologies.
http://www.approtec.org/tech_irrigate.shtml. Accessed April 2003.
Dickson, A. 2002. The EU banana regime: History and interests. Report commissioned by Banana Link for Euroban. (http://www.bananalink.org.uk/trade_war/trade_war_main3.htm). Accessed April 2003
Dijkstra, T. 1997. Trading the fruits of the land: Horticultural marketing channels in Kenya. Aldershot, U.K.: Ashgate Press.
Dijkstra, T. 1999. Horticultural marketing in Kenya: Why potato farmers need collecting wholesalers. In Agricultural Marketing in Tropical Africa � Contributions from the Netherlands, ed. van der Laan, H.L., T. Dijkstra, and A. van Tilburg. African Studies Centre Research Series 15/1999. Aldershot, U.K.: Ashgate Press.
Dolan, C., J. Humphrey, and C. Harris-Pascal. 1999. Horticultural commodity chains: The impact of the UK market on the African fresh vegetable industry. IDS Working Paper No. 96. Sussex, U.K.: Institute for Development Studies. Sussex.
Dolan, C. and J. Humphrey. 2000. Governance and trade in fresh vegetables: The impact of UK supermarkets on the African horticultural industry. Journal of Development Studies 37 (2): 147-176.
Ebony Consulting International. 2001. The Kenyan green bean subsector. Report prepared for the Department for International Development (DfID), Nairobi, Kenya.
Evans, R.K. 1999? From small farms to supermarkets. Nairobi, Kenya: Homegrown Ltd. Partnership for Rural Development in sub-Saharan Africa.
FAOStat. 2002. Food and Agriculture Organization Statistical Database. http://apps.fao.org. Accessed April 2003. Rome, Italy: FAO.
Fresh Produce Exporters Association of Kenya (FPEAK). 1999. Code of Practice � 2d edition Fresh Produce Exporters Association of Kenya, Nairobi, 1999.
Garcia Alvarez-Coque, J.M. and R.M. Bautista. 1994. Sources of EC horticultural import growth from developing countries. Agricultural Economics 10: 125-141.
Government of Côte d'Ivoire. 2003. Côte d'Ivoire seeks international support to secure lasting peace. Washington Post Advertising Supplement. January 24, 2003.

98
Guyomard, H., C. Laroche, and C. Le Mouel. 1999. An economic assessment of the Common Market Organization for bananas in the European Union. Agricultural Economics 20 (2): 105-120.
Harris, C., P.V. Hegarty, M. Kherallah, C. Mukindia, J. Ngige, P. Sterns, and J. Tatter. 2001. The impacts of standards on the food sector of Kenya. Report prepared by the Institute for Food and Agricultural Standards, Michigan State University, for the U.S. Agency for International Development. East Lansing, Michigan.
Hills, M.F.(1956) Cream Country: The story of the Kenya co-operative creameries limited. KCC, Nairobi.
Hormann, D. and L. Wietor. 1980. Export-oriented horticulture in developing countries � Ivory Coast. Working Paper No. 26. Institute for Horticultural Economics. Hannover, Federal Republic of Germany: University of Hannover.
Jaffee, S. 1994. Contract farming in the shadow of competitive markets: The experience of Kenyan horticulture. In Living under contract: Contract farming and agrarian transformation in Sub-Saharan Africa, ed. Little, P. and M. Watts. Madison, Wisc., USA: University of Wisconsin Press.
Jaffee, S. 1995. The many faces of success: The development of Kenyan horticultural exports. In Marketing Africa�s high-value foods, ed. Jaffee, S. and J. Morton. Washington, D.C.: World Bank.
Jaffee, S. 2003. From challenge to opportunity: The transformation of the Kenyan fresh vegetable trade in the context of emerging food safety and other standards. PREM Trade Unit. Washington, D.C.: World Bank.
Kabutha, C. and C. Mutero. 2002. From government to farmer-managed smallholder rice schemes: The unresolved case of the Mwea Irrigation Scheme. In The changing face of irrigation in Kenya: Opportunities for anticipating change in eastern and southern Africa, ed. Blank, H.G., C. M. Mutero and H. Murray-Rust. Colombo, Sri Lanka: International Water Management Institute.
Kamau, M. 2000. The way forward in export oriented small-holder horticulture. Background paper for a Stakeholder Consultation Meeting, Norfolk Hotel, Nairobi. February 8.
Kenya Seed Company. 2003. About us. http://www.kenyaseed.com/profile.htm. Accessed April 16, 2003.
Kimenye, L. 1995. Kenya�s experience promoting smallholder production of flowers and vegetables for European markets. African Rural and Urban Studies 2 (2-3): 121-141.
Lambert, A.M. 2002. A scoping study for detailed case studies of trade facilitation/export promotion projects for non-traditional agricultural products in sub-Saharan Africa. Report prepared for the Africa Region (AFTR2). Washington, D.C.: World Bank.

99
Loeillet, D. 1997. Panorama du marché mondial de l�ananas: L�importance de l�Europe. Proceedings of the 2nd International Pineapple Symposium. Acta Horticulturae 425.
McCulloch, N. and M. Ota. 2002. Export horticulture and poverty in Kenya. Working Paper 174. Sussex, U.K.: Institute for Development Studies.
Ngigi, S. 2002. Review of irrigation development in Kenya. In The changing face of irrigation in Kenya: Opportunities for anticipating change in eastern and southern Africa, ed. Blank, H.G., C. M. Mutero and H. Murray-Rust. Colombo, Sri Lanka: International Water Management Institute.
Nguyo, W., B. Kaunga, and M. Bezuneh. 2002. Alleviating poverty and food insecurity: The case of the Mwea Irrigation Scheme in Kenya. Broadening Access and Strengthening Input Market Input Systems. Washington, D.C.: U.S. Agency for International Development.
Onjala, J. 2001. Water pricing options options in Kenya: Cases of Mwea and West Kano Irrigation Schemes. Working Paper 01.9. Copenhagen, Denmark: Centre for Development Research. (http://www.cdr.dk/working_papers/wp-01-9.pdf). Accessed April 2003.
Winter-Nelson, A. 1995. A history of agricultural policy in Kenya. In Agricultural Policy in Kenya: Applications of the Policy Analysis Matrix, ed. Pearson, S. R, E. Monke, G. Argwings-Kodhek, A. Winter-Nelson, S. Pagiola, and F. Avillez. Ithaca, NY: Cornell University.
Regina Seed. 2003. Personal communication from Peter Francombe, Regina Seed, Nairobi. April 16, 2003.
Rouge and N�Goan.1997. L�ananas en Afrique de l�ouest et du centre. Proceedings of the 2nd International Pineapple Symposium. Acta Horticulturae 425.
Rougé, B. and M. N�Goan. 1997. L�anana en Afrique de l�ouest et du centre. Acta Horticulturae 425: 75-82.
Sawadogo, A. 1977. L�agriculture en Côte d'Ivoire Presse Universitaire de France, Paris.
Scheltema, W. 2002. Smallholder management of irrigation in Kenya. In The changing face of irrigation in Kenya: Opportunities for anticipating change in eastern and southern Africa, ed. Blank, H.G., C. M. Mutero and H. Murray-Rust. Colombo, Sri Lanka: International Water Management Institute.
Sijali, I. and R. Okumu. 2002. New irrigation technologies. In The changing face of irrigation in Kenya: Opportunities for anticipating change in eastern and southern Africa, ed. Blank, H.G., C.M. Mutero and H.Murray-Rust. Colombo, Sri Lanka: International Water Management Institute.

100
Stevens, C. and J. Kennan. 1999. Will Africa�s participation in horticultural chains survive liberalization. IDS Working Paper No. 106. Sussex, U.K.: Institute for Development Studies..
Swanberg, K. 1995. Horticultural exports from Kenya. Horticultural Trade Journal 3: 3-5.
Thiru, A. 2000. International trade in fruits and vegetables: Opportunities and constraints for Kenya, Presented at the Technical Workshop on Fruit and Vegetable Standards and Grades. Naro Moro River Lodge. August 15-17.
Ti, T.C. 2000. The global pineapple economy. Acta Horticulturae 529: 49-50.
Tuinder, B. A. den. 1978. Ivory Coast: The challenge of success. A World Bank country Economics Report. Baltimore, M.D.: Johns Hopkins University Press.
World Bank. 2002. World Development Indicators CD-ROM. Washington, D.C.: World Bank.
Zartman, I.W. and C. Delgado. 1984. Introduction. In The Political Economy of Ivory Coast. ed. I.W. Zartman and C. Delgado. New York, N.Y, Praeger.

EPTD DISCUSSION PAPERS
LIST OF EPTD DISCUSSION PAPERS
01 Sustainable Agricultural Development Strategies in Fragile Lands, by Sara J. Scherr and Peter B.R. Hazell, June 1994.
02 Confronting the Environmental Consequences of the Green Revolution in Asia, by Prabhu L. Pingali and Mark W. Rosegrant, August 1994.
03 Infrastructure and Technology Constraints to Agricultural Development in the Humid and Subhumid Tropics of Africa, by Dunstan S.C. Spencer, August 1994.
04 Water Markets in Pakistan: Participation and Productivity, by Ruth Meinzen-Dick and Martha Sullins, September 1994.
05 The Impact of Technical Change in Agriculture on Human Fertility: District-level Evidence From India, by Stephen A. Vosti, Julie Witcover, and Michael Lipton, October 1994.
06 Reforming Water Allocation Policy Through Markets in Tradable Water Rights: Lessons from Chile, Mexico, and California, by Mark W. Rosegrant and Renato Gazri S, October 1994.
07 Total Factor Productivity and Sources of Long-Term Growth in Indian Agriculture, by Mark W. Rosegrant and Robert E. Evenson, April 1995.
08 Farm-Nonfarm Growth Linkages in Zambia, by Peter B.R. Hazell and Behjat Hoijati, April 1995.
09 Livestock and Deforestation in Central America in the 1980s and 1990s: A Policy Perspective, by David Kaimowitz (Interamerican Institute for Cooperation on Agriculture. June 1995.
10 Effects of the Structural Adjustment Program on Agricultural Production and Resource Use in Egypt, by Peter B.R. Hazell, Nicostrato Perez, Gamal Siam, and Ibrahim Soliman, August 1995.
11 Local Organizations for Natural Resource Management: Lessons from Theoretical and Empirical Literature, by Lise Nordvig Rasmussen and Ruth Meinzen-Dick, August 1995.
EPTD DISCUSSION PAPERS
12 Quality-Equivalent and Cost-Adjusted Measurement of International Competitiveness in Japanese Rice Markets, by Shoichi Ito, Mark W. Rosegrant, and Mercedita C. Agcaoili-Sombilla, August 1995.
13 Role of Inputs, Institutions, and Technical Innovations in Stimulating Growth in Chinese Agriculture, by Shenggen Fan and Philip G. Pardey, September 1995.
14 Investments in African Agricultural Research, by Philip G. Pardey, Johannes Roseboom, and Nienke Beintema, October 1995.
15 Role of Terms of Trade in Indian Agricultural Growth: A National and State Level Analysis, by Peter B.R. Hazell, V.N. Misra, and Behjat Hoijati, December 1995.
16 Policies and Markets for Non-Timber Tree Products, by Peter A. Dewees and Sara J. Scherr, March 1996.
17 Determinants of Farmers� Indigenous Soil and Water Conservation Investments in India�s Semi-Arid Tropics, by John Pender and John Kerr, August 1996.
18 Summary of a Productive Partnership: The Benefits from U.S. Participation in the CGIAR, by Philip G. Pardey, Julian M. Alston, Jason E. Christian, and Shenggen Fan, October 1996.
19 Crop Genetic Resource Policy: Towards a Research Agenda, by Brian D. Wright, October 1996.
20 Sustainable Development of Rainfed Agriculture in India, by John M. Kerr, November 1996.
21 Impact of Market and Population Pressure on Production, Incomes and Natural Resources in the Dryland Savannas of West Africa: Bioeconomic Modeling at the Village Level, by Bruno Barbier, November 1996.
22 Why Do Projections on China�s Future Food Supply and Demand Differ? by Shenggen Fan and Mercedita Agcaoili-Sombilla, March 1997.
23 Agroecological Aspects of Evaluating Agricultural R&D, by Stanley Wood and Philip G. Pardey, March 1997.
24 Population Pressure, Land Tenure, and Tree Resource Management in Uganda, by Frank Place and Keijiro Otsuka, March 1997.

EPTD DISCUSSION PAPERS
25 Should India Invest More in Less-favored Areas? by Shenggen Fan and Peter Hazell, April 1997.
26 Population Pressure and the Microeconomy of Land Management in Hills and Mountains of Developing Countries, by Scott R. Templeton and Sara J. Scherr, April 1997.
27 Population Land Tenure and Natural Resource Management: The Case of Customary Land Area in Malawi, by Frank Place and Keijiro Otsuka, April 1997.
28 Water Resources Development in Africa: A Review and Synthesis of Issues, Potentials, and Strategies for the Future, by Mark W. Rosegrant and Nicostrato D. Perez, September 1997.
29 Financing Agricultural R&D in Rich Countries: What�s Happening and Why? by Julian M. Alston, Philip G. Pardey, and Vincent H. Smith, September 1997.
30 How Fast Have China�s Agricultural Production and Productivity Really Been Growing? by Shenggen Fan, September 1997.
31 Does Land Tenure Insecurity Discourage Tree Planting? Evolution of Customary Land Tenure and Agroforestry Management in Sumatra, by Keijiro Otsuka, S. Suyanto, and Thomas P. Tomich, December 1997.
32 Natural Resource Management in the Hillsides of Honduras: Bioeconomic Modeling at the Micro-Watershed Level, by Bruno Barbier and Gilles Bergeron, January 1998.
33 Government Spending, Growth, and Poverty: An Analysis of Interlinkages in Rural India, by Shenggen Fan, Peter Hazell, and Sukhadeo Thorat, March 1998. Revised December 1998.
34 Coalitions and the Organization of Multiple-Stakeholder Action: A Case Study of Agricultural Research and Extension in Rajasthan, India, by Ruth Alsop, April 1998.
35 Dynamics in the Creation and Depreciation of Knowledge and the Returns to Research, by Julian Alston, Barbara Craig, and Philip Pardey, July, 1998.
36 Educating Agricultural Researchers: A Review of the Role of African Universities, by Nienke M. Beintema, Philip G. Pardey, and Johannes Roseboom, August 1998.
EPTD DISCUSSION PAPERS
37 The Changing Organizational Basis of African Agricultural Research, by Johannes Roseboom, Philip G. Pardey, and Nienke M. Beintema, November 1998.
38 Research Returns Redux: A Meta-Analysis of the Returns to Agricultural R&D, by Julian M. Alston, Michele C. Marra, Philip G. Pardey, and T.J. Wyatt, November 1998.
39 Technological Change, Technical and Allocative Efficiency in Chinese Agriculture: The Case of Rice Production in Jiangsu, by Shenggen Fan, January 1999.
40 The Substance of Interaction: Design and Policy Implications of NGO-Government Projects in India, by Ruth Alsop with Ved Arya, January 1999.
41 Strategies for Sustainable Agricultural Development in the East African Highlands, by John Pender, Frank Place, and Simeon Ehui, April 1999.
42 Cost Aspects of African Agricultural Research, by Philip G. Pardey, Johannes Roseboom, Nienke M. Beintema, and Connie Chan-Kang, April 1999.
43 Are Returns to Public Investment Lower in Less-favored Rural Areas? An Empirical Analysis of India, by Shenggen Fan and Peter Hazell, May 1999.
44 Spatial Aspects of the Design and Targeting of Agricultural Development Strategies, by Stanley Wood, Kate Sebastian, Freddy Nachtergaele, Daniel Nielsen, and Aiguo Dai, May 1999.
45 Pathways of Development in the Hillsides of Honduras: Causes and Implications for Agricultural Production, Poverty, and Sustainable Resource Use, by John Pender, Sara J. Scherr, and Guadalupe Durón, May 1999.
46 Determinants of Land Use Change: Evidence from a Community Study in Honduras, by Gilles Bergeron and John Pender, July 1999.
47 Impact on Food Security and Rural Development of Reallocating Water from Agriculture, by Mark W. Rosegrant and Claudia Ringler, August 1999.
48 Rural Population Growth, Agricultural Change and Natural Resource Management in Developing Countries: A Review of Hypotheses and Some Evidence from Honduras, by John Pender, August 1999.

EPTD DISCUSSION PAPERS
49 Organizational Development and Natural Resource Management: Evidence from Central Honduras, by John Pender and Sara J. Scherr, November 1999.
50 Estimating Crop-Specific Production Technologies in Chinese Agriculture: A Generalized Maximum Entropy Approach, by Xiaobo Zhang and Shenggen Fan, September 1999.
51 Dynamic Implications of Patenting for Crop Genetic Resources, by Bonwoo Koo and Brian D. Wright, October 1999.
52 Costing the Ex Situ Conservation of Genetic Resources: Maize and Wheat at CIMMYT, by Philip G. Pardey, Bonwoo Koo, Brian D. Wright, M. Eric van Dusen, Bent Skovmand, and Suketoshi Taba, October 1999.
53 Past and Future Sources of Growth for China, by Shenggen Fan, Xiaobo Zhang, and Sherman Robinson, October 1999.
54 The Timing of Evaluation of Genebank Accessions and the Effects of Biotechnology, by Bonwoo Koo and Brian D. Wright, October 1999.
55 New Approaches to Crop Yield Insurance in Developing Countries, by Jerry Skees, Peter Hazell, and Mario Miranda, November 1999.
56 Impact of Agricultural Research on Poverty Alleviation: Conceptual Framework with Illustrations from the Literature, by John Kerr and Shashi Kolavalli, December 1999.
57 Could Futures Markets Help Growers Better Manage Coffee Price Risks in Costa Rica? by Peter Hazell, January 2000.
58 Industrialization, Urbanization, and Land Use in China, by Xiaobo Zhang, Tim Mount, and Richard Boisvert, January 2000.
59 Water Rights and Multiple Water Uses: Framework and Application to Kirindi Oya Irrigation System, Sri Lanka, by Ruth Meinzen-Dick and Margaretha Bakker, March 2000.
60 Community natural Resource Management: The Case of Woodlots in Northern Ethiopia, by Berhanu Gebremedhin, John Pender and Girmay Tesfaye, April 2000.

EPTD DISCUSSION PAPERS
61 What Affects Organization and Collective Action for Managing Resources? Evidence from Canal Irrigation Systems in India, by Ruth Meinzen-Dick, K.V. Raju, and Ashok Gulati, June 2000.
62 The Effects of the U.S. Plant Variety Protection Act on Wheat Genetic Improvement, by Julian M. Alston and Raymond J. Venner, May 2000.
63 Integrated Economic-Hydrologic Water Modeling at the Basin Scale: The Maipo River Basin, by M. W. Rosegrant, C. Ringler, DC McKinney, X. Cai, A. Keller, and G. Donoso, May 2000.
64 Irrigation and Water Resources in Latin America and he Caribbean: Challenges and Strategies, by Claudia Ringler, Mark W. Rosegrant, and Michael S. Paisner, June 2000.
65 The Role of Trees for Sustainable Management of Less-favored Lands: The Case of Eucalyptus in Ethiopia, by Pamela Jagger & John Pender, June 2000.
66 Growth and Poverty in Rural China: The Role of Public Investments, by Shenggen Fan, Linxiu Zhang, and Xiaobo Zhang, June 2000.
67 Small-Scale Farms in the Western Brazilian Amazon: Can They Benefit from Carbon Trade? by Chantal Carpentier, Steve Vosti, and Julie Witcover, September 2000.
68 An Evaluation of Dryland Watershed Development Projects in India, by John Kerr, Ganesh Pangare, Vasudha Lokur Pangare, and P.J. George, October 2000.
69 Consumption Effects of Genetic Modification: What If Consumers Are Right? by Konstantinos Giannakas and Murray Fulton, November 2000.
70 South-North Trade, Intellectual Property Jurisdictions, and Freedom to Operate in Agricultural Research on Staple Crops, by Eran Binenbaum, Carol Nottenburg, Philip G. Pardey, Brian D. Wright, and Patricia Zambrano, December 2000.
71 Public Investment and Regional Inequality in Rural China, by Xiaobo Zhang and Shenggen Fan, December 2000.
72 Does Efficient Water Management Matter? Physical and Economic Efficiency of Water Use in the River Basin, by Ximing Cai, Claudia Ringler, and Mark W. Rosegrant, March 2001.

EPTD DISCUSSION PAPERS
73 Monitoring Systems for Managing Natural Resources: Economics, Indicators and Environmental Externalities in a Costa Rican Watershed, by Peter Hazell, Ujjayant Chakravorty, John Dixon, and Rafael Celis, March 2001.
74 Does Quanxi Matter to NonFarm Employment? by Xiaobo Zhang and Guo Li, June 2001.
75 The Effect of Environmental Variability on Livestock and Land-Use Management: The Borana Plateau, Southern Ethiopia, by Nancy McCarthy, Abdul Kamara, and Michael Kirk, June 2001.
76 Market Imperfections and Land Productivity in the Ethiopian Highlands, by Stein Holden, Bekele Shiferaw, and John Pender, August 2001.
77 Strategies for Sustainable Agricultural Development in the Ethiopian Highlands, by John Pender, Berhanu Gebremedhin, Samuel Benin, and Simeon Ehui, August 2001.
78 Managing Droughts in the Low-Rainfall Areas of the Middle East and North Africa: Policy Issues, by Peter Hazell, Peter Oram, Nabil Chaherli, September 2001.
79 Accessing Other People�s Technology: Do Non-Profit Agencies Need It? How To Obtain It, by Carol Nottenburg, Philip G. Pardey, and Brian D. Wright, September 2001.
80 The Economics of Intellectual Property Rights Under Imperfect Enforcement: Developing Countries, Biotechnology, and the TRIPS Agreement, by Konstantinos Giannakas, September 2001.
81 Land Lease Markets and Agricultural Efficiency: Theory and Evidence from Ethiopia, by John Pender and Marcel Fafchamps, October 2001.
82 The Demand for Crop Genetic Resources: International Use of the U.S. National Plant Germplasm System, by M. Smale, K. Day-Rubenstein, A. Zohrabian, and T. Hodgkin, October 2001.
83 How Agricultural Research Affects Urban Poverty in Developing Countries: The Case of China, by Shenggen Fan, Cheng Fang, and Xiaobo Zhang, October 2001.
84 How Productive is Infrastructure? New Approach and Evidence From Rural India, by Xiaobo Zhang and Shenggen Fan, October 2001.

EPTD DISCUSSION PAPERS
85 Development Pathways and Land Management in Uganda: Causes and Implications, by John Pender, Pamela Jagger, Ephraim Nkonya, and Dick Sserunkuuma, December 2001.
86 Sustainability Analysis for Irrigation Water Management: Concepts, Methodology, and Application to the Aral Sea Region, by Ximing Cai, Daene C. McKinney, and Mark W. Rosegrant, December 2001.
87 The Payoffs to Agricultural Biotechnology: An Assessment of the Evidence, by Michele C. Marra, Philip G. Pardey, and Julian M. Alston, January 2002.
88 Economics of Patenting a Research Tool, by Bonwoo Koo and Brian D. Wright, January 2002.
89 Assessing the Impact of Agricultural Research On Poverty Using the Sustainable Livelihoods Framework, by Michelle Adato and Ruth Meinzen-Dick, March 2002.
90 The Role of Rainfed Agriculture in the Future of Global Food Production, by Mark Rosegrant, Ximing Cai, Sarah Cline, and Naoko Nakagawa, March 2002.
91 Why TVEs Have Contributed to Interregional Imbalances in China, by Junichi Ito, March 2002.
92 Strategies for Stimulating Poverty Alleviating Growth in the Rural Nonfarm Economy in Developing Countries, by Steven Haggblade, Peter Hazell, and Thomas Reardon, July 2002.
93 Local Governance and Public Goods Provisions in Rural China, by Xiaobo Zhang, Shenggen Fan, Linxiu Zhang, and Jikun Huang, July 2002.
94 Agricultural Research and Urban Poverty in India, by Shenggen Fan, September 2002.
95 Assessing and Attributing the Benefits from Varietal Improvement Research: Evidence from Embrapa, Brazil, by Philip G. Pardey, Julian M. Alston, Connie Chan-Kang, Eduardo C. Magalhães, and Stephen A. Vosti, August 2002.
96 India�s Plant Variety and Farmers� Rights Legislation: Potential Impact on Stakeholders Access to Genetic Resources, by Anitha Ramanna, January 2003.
97 Maize in Eastern and Southern Africa: Seeds of Success in Retrospect, by Melinda Smale and Thom Jayne, January 2003.

EPTD DISCUSSION PAPERS
98 Alternative Growth Scenarios for Ugandan Coffee to 2020, by Liangzhi You and Simon Bolwig, February 2003.
99 Public Spending in Developing Countries: Trends, Determination, and Impact, by Shenggen Fan and Neetha Rao, March 2003.
100 The Economics of Generating and Maintaining Plant Variety Rights in China, by Bonwoo Koo, Philip G. Pardey, Keming Qian, and Yi Zhang, February 2003.
101 Impacts of Programs and Organizations on the Adoption of Sustainable Land Management Technologies in Uganda, Pamela Jagger and John Pender, March 2003.
102 Productivity and Land Enhancing Technologies in Northern Ethiopia: Health, Public Investments, and Sequential Adoption, Lire Ersado, Gregory Amacher, and Jeffrey Alwang, April 2003.
103 Animal Health and the Role of Communities: An Example of Trypanasomosis Control Options in Uganda, by Nancy McCarthy, John McDermott, and Paul Coleman, May 2003.
104 Determinantes de Estrategias Comunitarias de Subsistencia y el uso de Prácticas Conservacionistas de Producción Agrícola en las Zonas de Ladera en Honduras, Hans G.P. Jansen, Angel Rodríguez, Amy Damon, y John Pender, Juno 2003.
105 Determinants of Cereal Diversity in Communities and on Household Farms of the Northern Ethiopian Highlands, by Samuel Benin, Berhanu Gebremedhin, Melinda Smale, John Pender, and Simeon Ehui, June 2003.
106 Demand for Rainfall-Based Index Insurance: A Case Study from Morocco, by Nancy McCarthy, July 2003.
107 Woodlot Devolution in Northern Ethiopia: Opportunities for Empowerment, Smallholder Income Diversification, and Sustainable Land Management, by Pamela Jagger, John Pender, and Berhanu Gebremedhin, September 2003.
108 Conservation Farming in Zambia, by Steven Haggblade and Gelsom Tembo, October 2003.
109 National and International Agricultural Research and Rural Poverty: The Case of Rice Research in India and China, by Shenggen Fan, Connie Chan-Kang, Keming Qian, and K. Krishnaiah, September 2003.

EPTD DISCUSSION PAPERS
110 Rice Research, Technological Progress, and Impacts on the Poor: The Bangladesh Case (Summary Report), by Mahabub Hossain, David Lewis, Manik L. Bose, and Alamgir Chowdhury, October 2003.
111 Impacts of Agricultural Research on Poverty: Findings of an Integrated Economic and Social Analysis, by Ruth Meinzen-Dick, Michelle Adato, Lawrence Haddad, and Peter Hazell, October 2003.
112 An Integrated Economic and Social Analysis to Assess the Impact of Vegetable and Fishpond Technologies on Poverty in Rural Bangladesh, by Kelly Hallman, David Lewis, and Suraiya Begum, October 2003.
113 Public-Private Partnerships in Agricultural Research: An Analysis of Challenges Facing Industry and the Consultative Group on International Agricultural Research, by David J. Spielman and Klaus von Grebmer, January 2004.
114 The Emergence and Spreading of an Improved Traditional Soil and Water Conservation Practice in Burkina Faso, by Daniel Kaboré and Chris Reij, February 2004.
115 Improved Fallows in Kenya: History, Farmer Practice, and Impacts, by Frank Place, Steve Franzel, Qureish Noordin, Bashir Jama, February 2004.
116 To Reach The Poor � Results From The ISNAR-IFPRI Next Harvest Study On Genetically Modified Crops, Public Research, and Policy Implications, by Atanas Atanassov, Ahmed Bahieldin, Johan Brink, Moises Burachik, Joel I. Cohen, Vibha Dhawan, Reynaldo V. Ebora, José Falck-Zepeda, Luis Herrera-Estrella, John Komen, Fee Chon Low, Emeka Omaliko, Benjamin Odhiambo, Hector Quemada, Yufa Peng, Maria Jose Sampaio, Idah Sithole-Niang, Ana Sittenfeld, Melinda Smale, Sutrisno, Ruud Valyasevi, Yusuf Zafar, and Patricia Zambrano, March 2004
117 Agri-Environmental Policies In A Transitional Economy: The Value of Agricultural Biodiversity in Hungarian Home Gardens, by Ekin Birol, Melinda Smale, And Ágnes Gyovai, April 2004.
118 New Challenges in the Cassava Transformation in Nigeria and Ghana, by Felix Nweke, June 2004.
119 International Exchange of Genetic Resources, the Role of Information and Implications for Ownership: The Case of the U.S. National Plant Germplasm System, by Kelly Day Rubenstein And Melinda Smale, July 2004.