Embed Size (px)
Citation preview
Horticultural Productivity and Postharvest Management
2
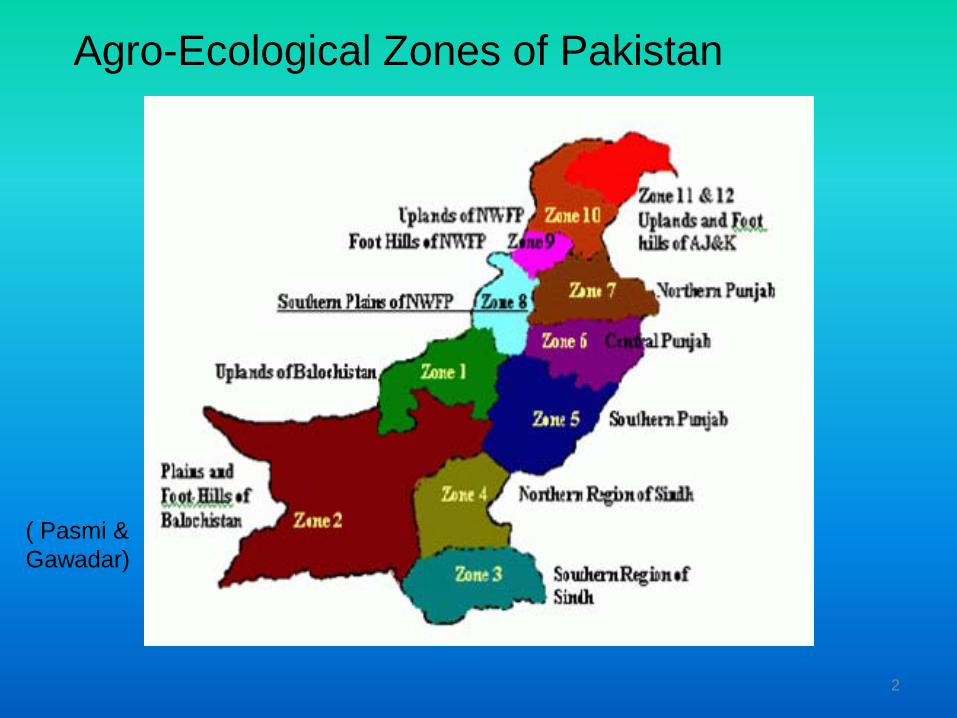
Agro-Ecological Zones of Pakistan
( Pasmi & Gawadar)
3
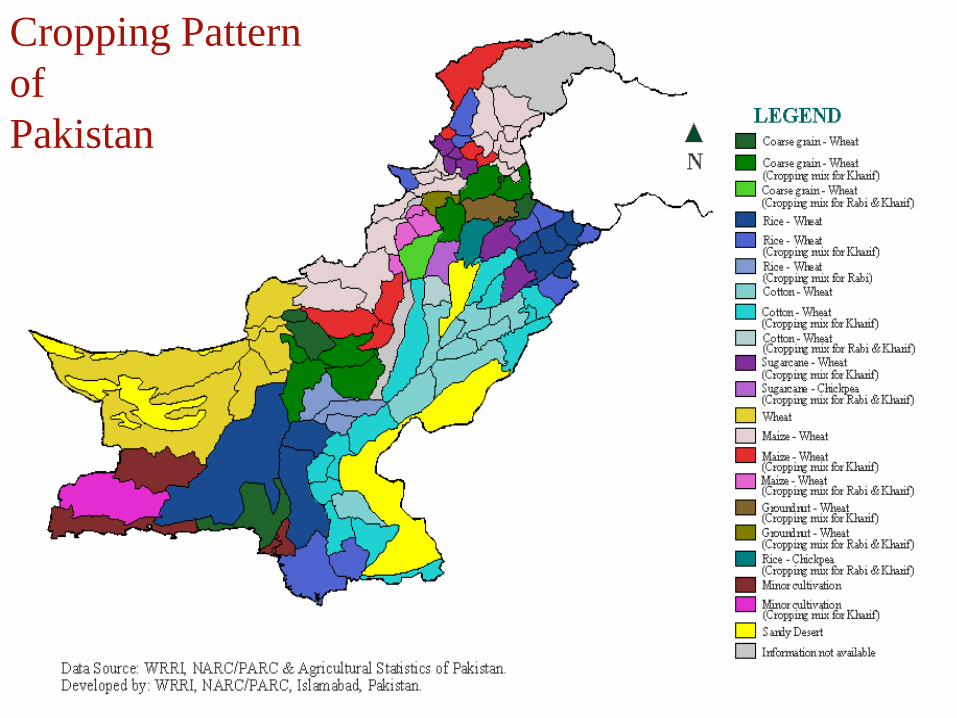
Cropping Pattern of Pakistan
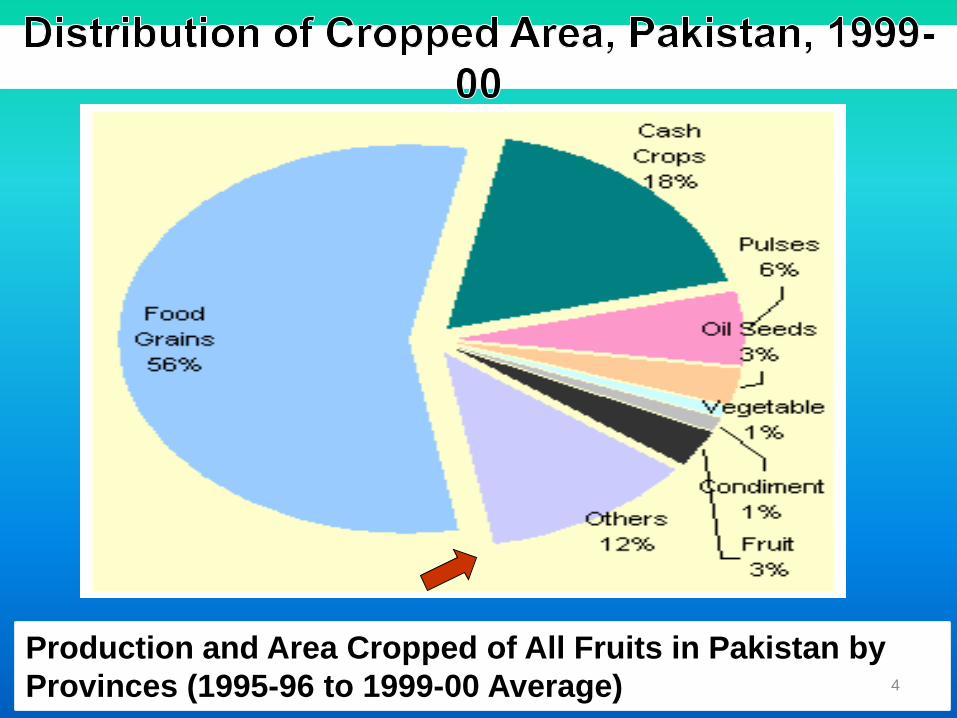
Production and Area Cropped of All Fruits in Pakistan by Provinces (1995-96 to 1999-00 Average) 4
5
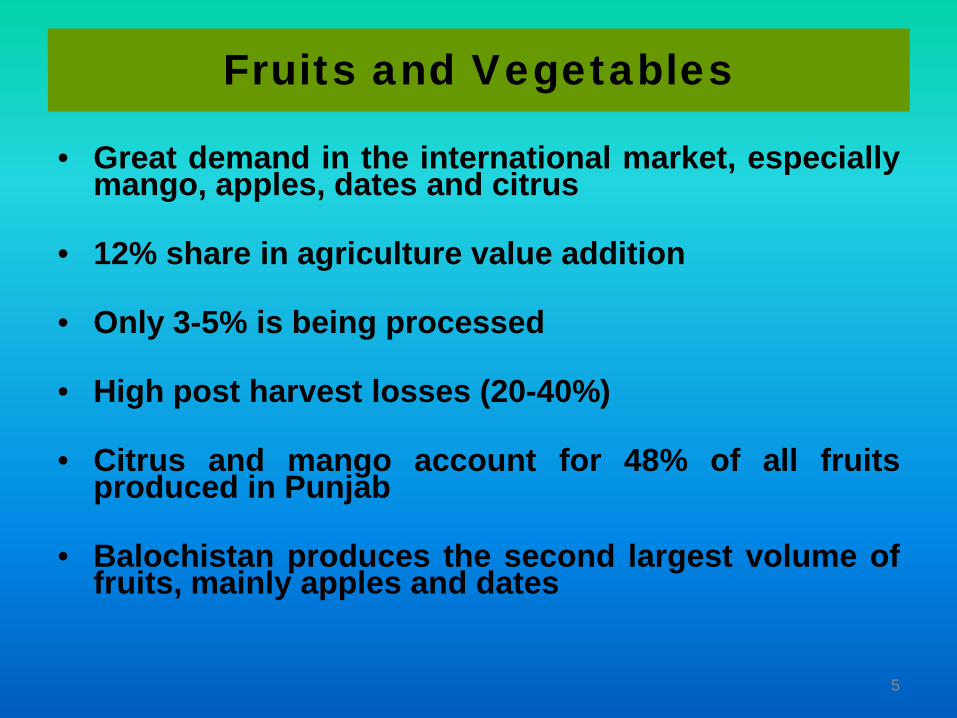
Fruits and Vegetables
• Great demand in the international market, especiallymango, apples, dates and citrus
• 12% share in agriculture value addition
• Only 3-5% is being processed
• High post harvest losses (20-40%)
• Citrus and mango account for 48% of all fruitsproduced in Punjab
• Balochistan produces the second largest volume offruits, mainly apples and dates
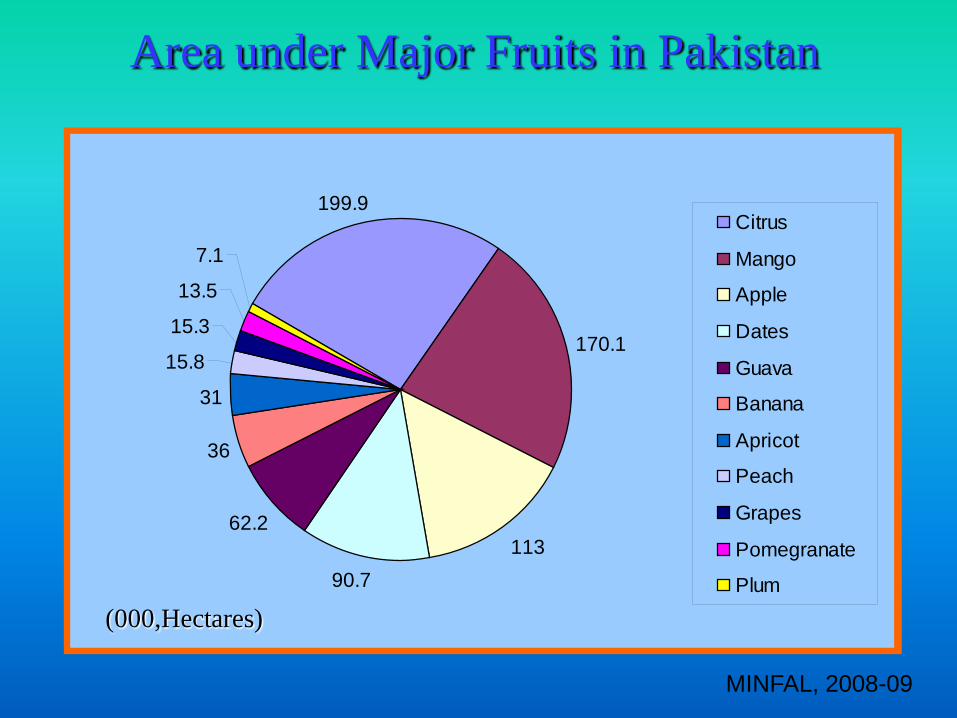
Area under Major Fruits in Pakistan
199.9
170.1
11390.7
62.2
36
31
15.8
15.3
13.5
7.1Citrus
Mango
Apple
Dates
Guava
Banana
Apricot
Peach
Grapes
Pomegranate
Plum
(000,Hectares)
MINFAL, 2008-09
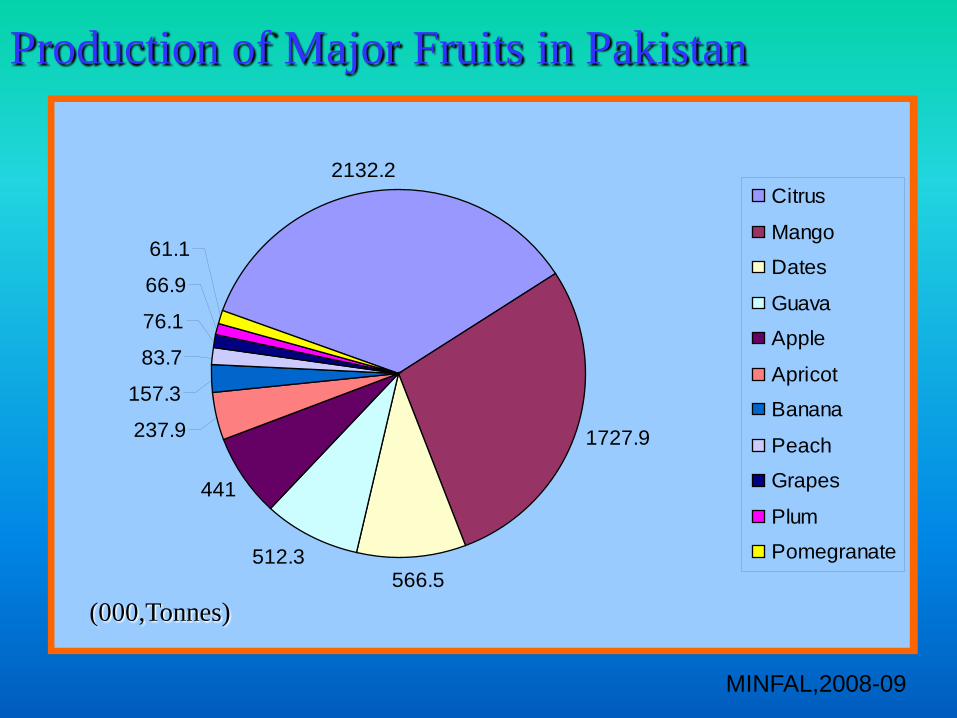
Production of Major Fruits in Pakistan
2132.2
1727.9
566.5512.3
441
237.9
157.3
83.7
76.1
66.9
61.1
Citrus
Mango
Dates
Guava
Apple
Apricot
Banana
Peach
Grapes
Plum
Pomegranate
(000,Tonnes)
MINFAL,2008-09
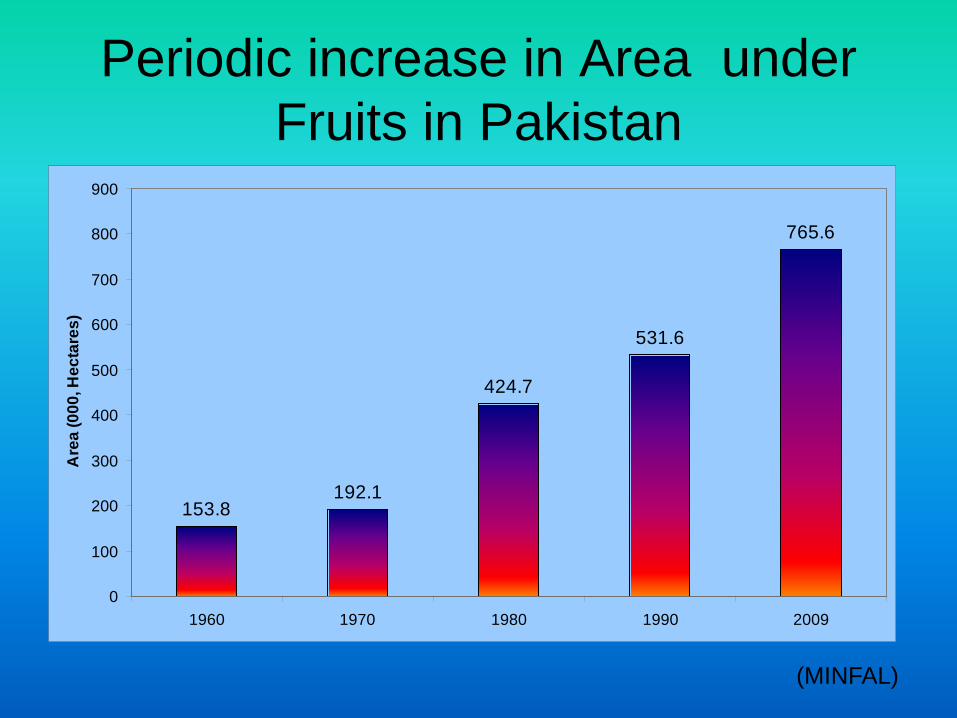
Periodic increase in Area under Fruits in Pakistan
153.8192.1
424.7
531.6
765.6
0
100
200
300
400
500
600
700
800
900
1960 1970 1980 1990 2009
Are
a (0
00, H
ecta
res)
(MINFAL)
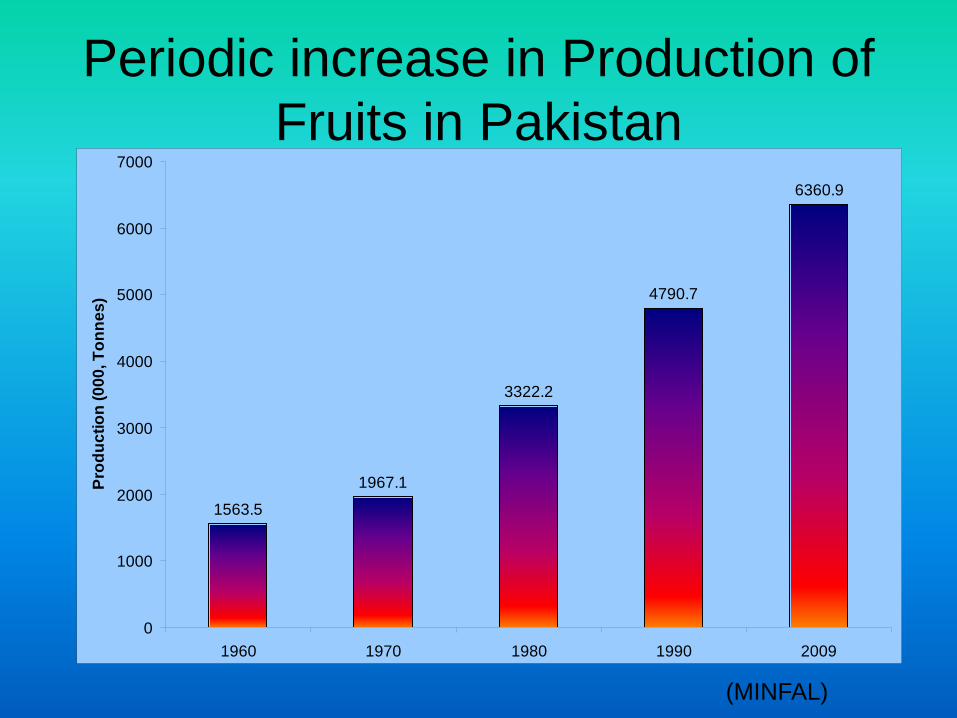
Periodic increase in Production of Fruits in Pakistan
1563.5
1967.1
3322.2
4790.7
6360.9
0
1000
2000
3000
4000
5000
6000
7000
1960 1970 1980 1990 2009
Prod
uctio
n (0
00, T
onne
s)
(MINFAL)
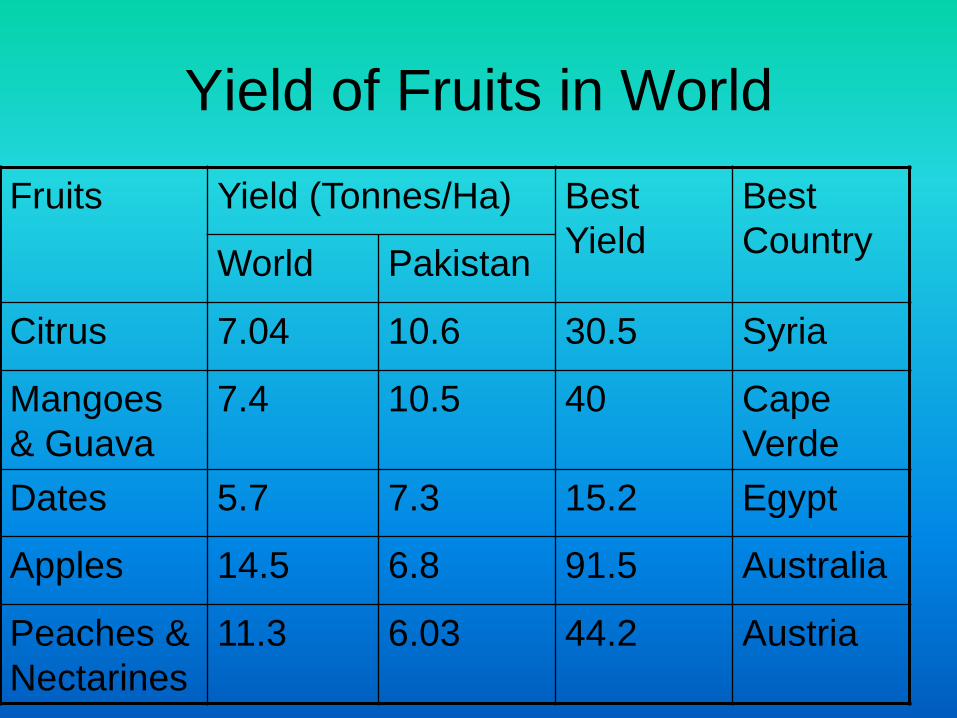
Yield of Fruits in World
Fruits Yield (Tonnes/Ha) Best Yield
Best CountryWorld Pakistan
Citrus 7.04 10.6 30.5 Syria
Mangoes & Guava
7.4 10.5 40 Cape Verde
Dates 5.7 7.3 15.2 Egypt
Apples 14.5 6.8 91.5 Australia
Peaches & Nectarines
11.3 6.03 44.2 Austria
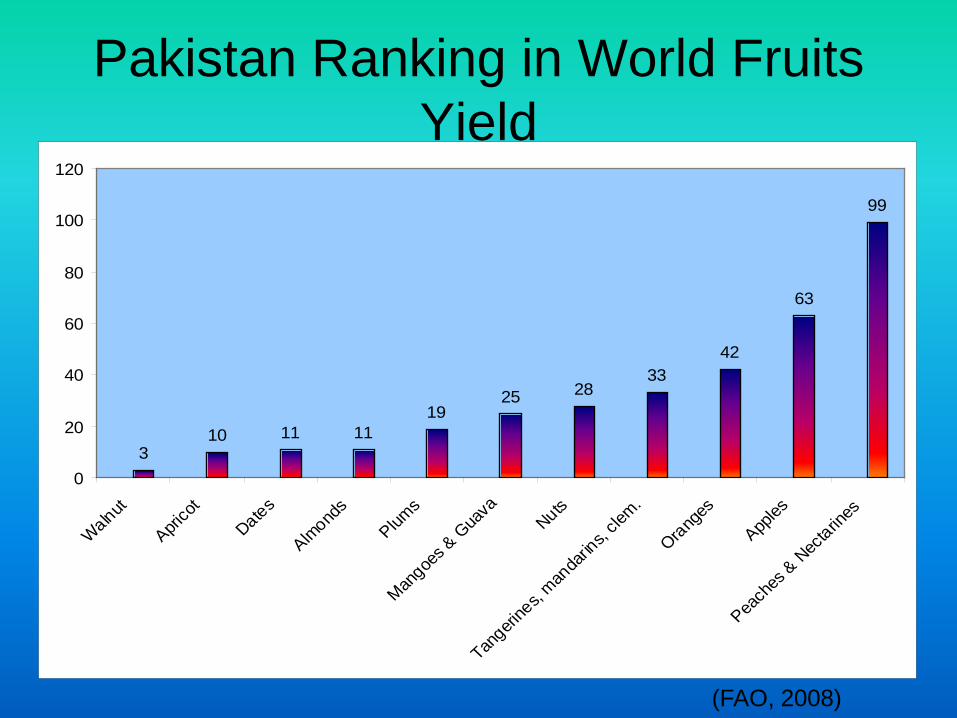
Pakistan Ranking in World Fruits Yield
310 11 11
1925 28
3342
63
99
0
20
40
60
80
100
120
Walnut
Aprico
tDates
Almond
sPlum
s
Mangoe
s & G
uava
Nuts
Tangeri
nes,
manda
rins,
clem.
Oranges
Apples
Peach
es & N
ectarin
es
(FAO, 2008)

VEGETABLES
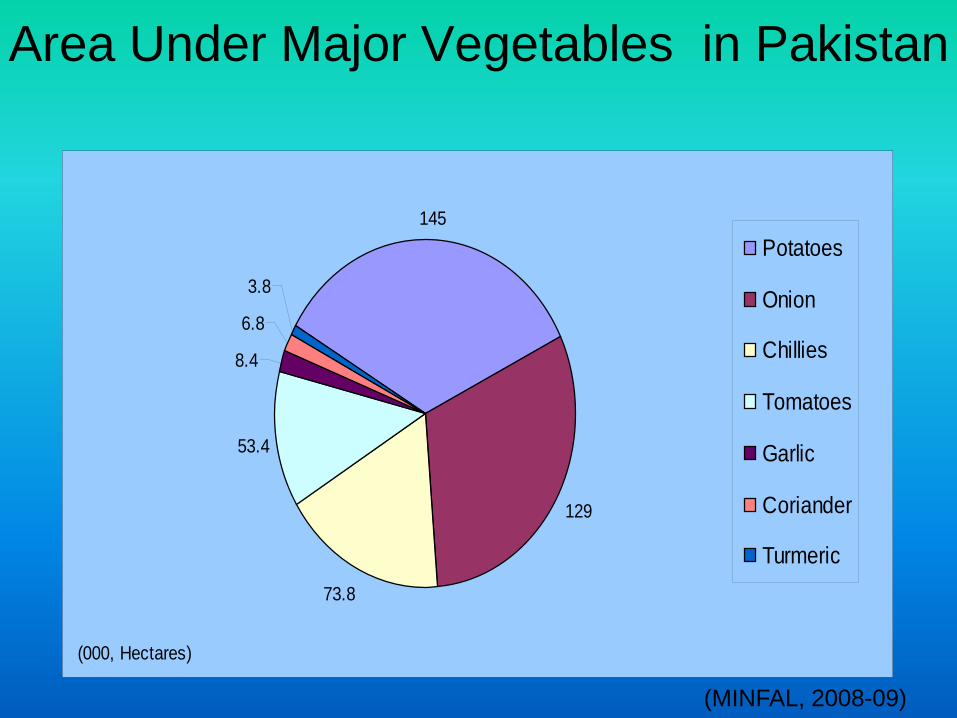
Area Under Major Vegetables in Pakistan
145
129
73.8
53.4
8.4
6.8
3.8
Potatoes
Onion
Chillies
Tomatoes
Garlic
Coriander
Turmeric
(000, Hectares)
(MINFAL, 2008-09)
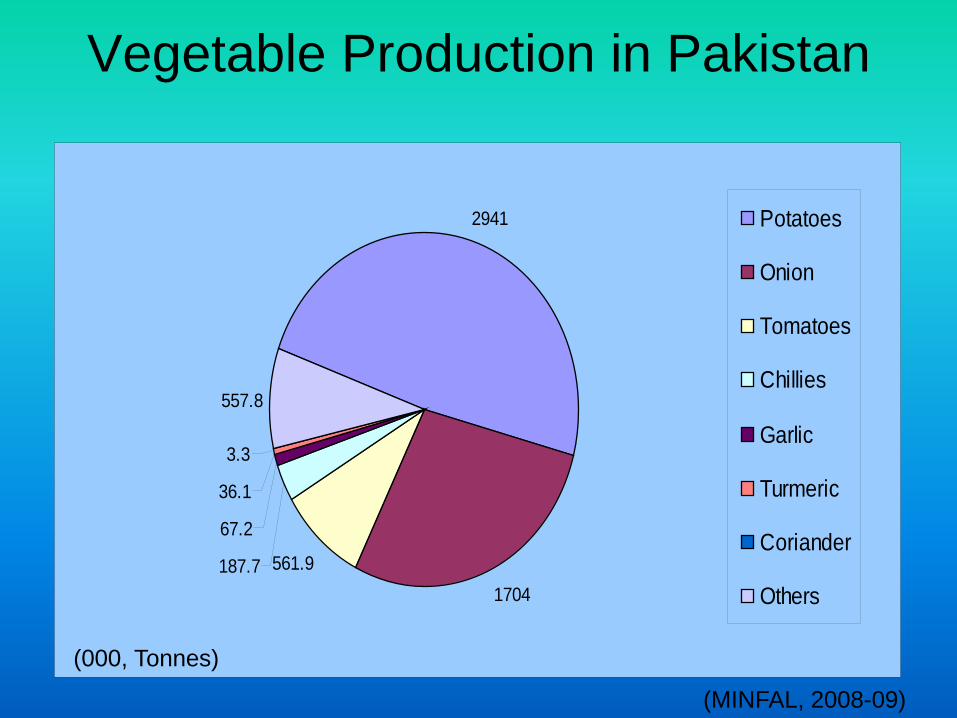
Vegetable Production in Pakistan
2941
1704561.9187.7
67.2
36.1
3.3
557.8
Potatoes
Onion
Tomatoes
Chillies
Garlic
Turmeric
Coriander
Others
(MINFAL, 2008-09)
(000, Tonnes)
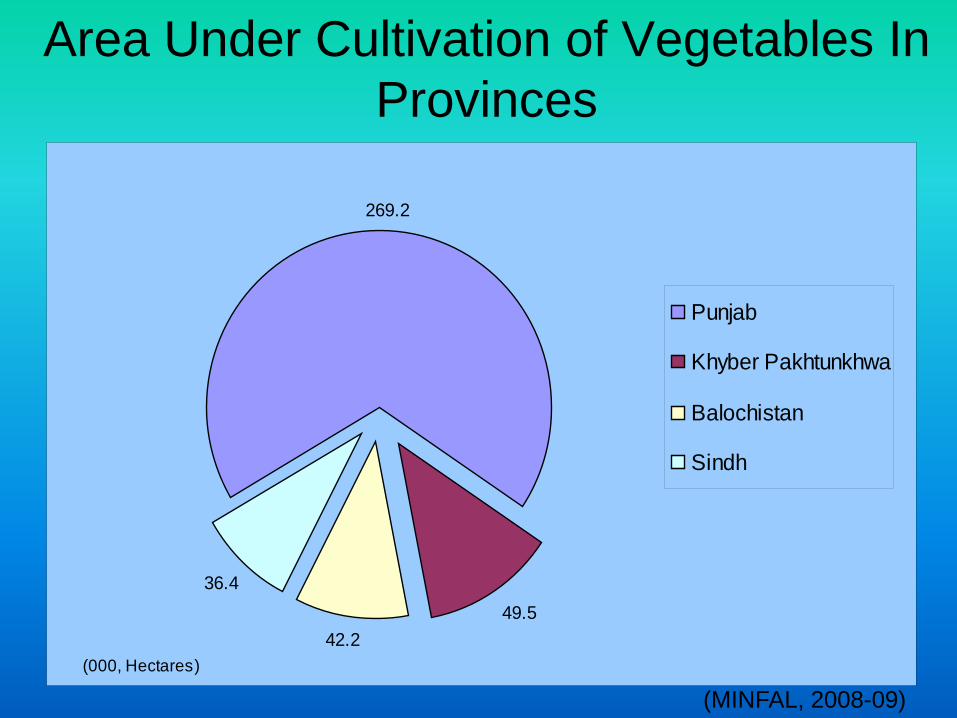
Area Under Cultivation of Vegetables In Provinces
269.2
49.542.2
36.4
Punjab
Khyber Pakhtunkhwa
Balochistan
Sindh
(000, Hectares)
(MINFAL, 2008-09)
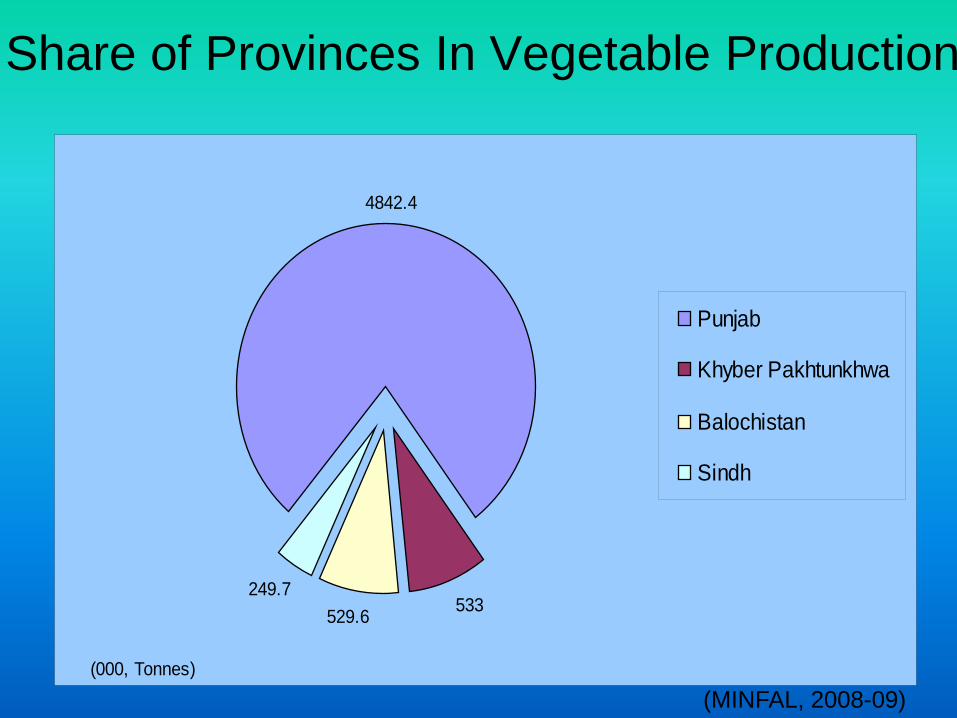
Share of Provinces In Vegetable Production
4842.4
533529.6249.7
Punjab
Khyber Pakhtunkhwa
Balochistan
Sindh
(000, Tonnes)
(MINFAL, 2008-09)
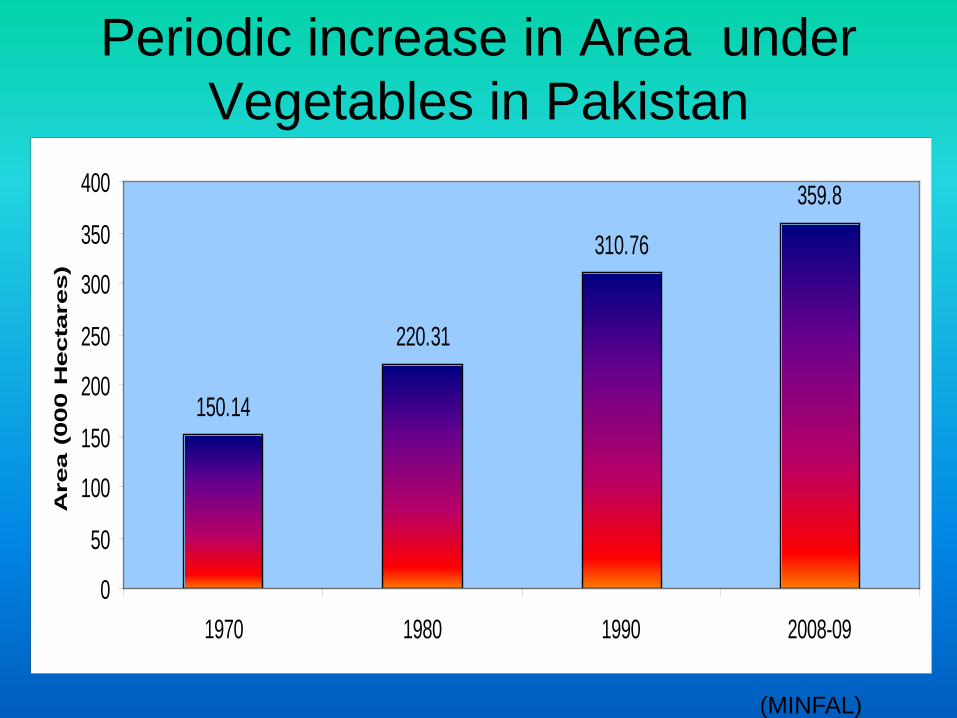
Periodic increase in Area under Vegetables in Pakistan
(MINFAL)
150.14
220.31
310.76
359.8
0
50
100
150
200
250
300
350
400
1970 1980 1990 2008-09
Are
a (
000 H
ecta
res)
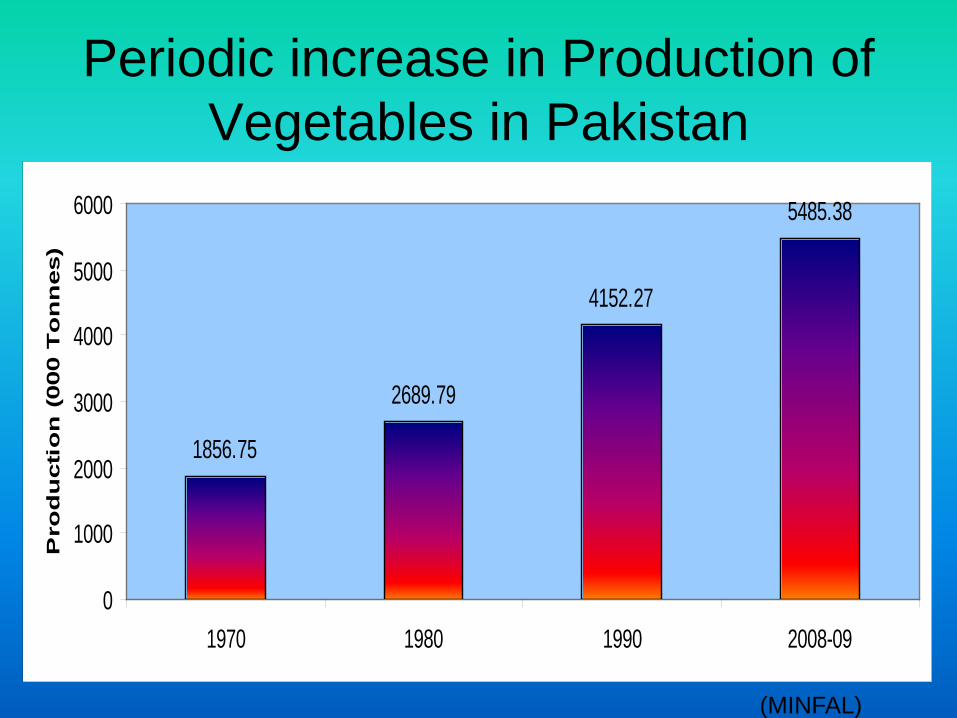
Periodic increase in Production of Vegetables in Pakistan
(MINFAL)
1856.75
2689.79
4152.27
5485.38
0
1000
2000
3000
4000
5000
6000
1970 1980 1990 2008-09
Pro
du
cti
on
(000 T
on
nes)
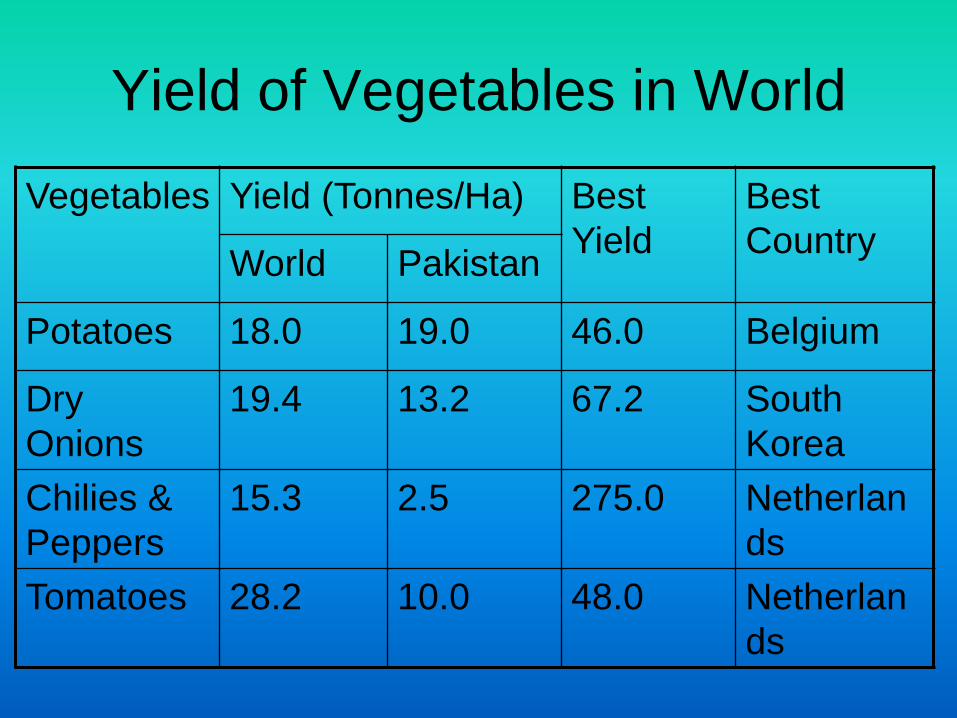
Yield of Vegetables in World
Vegetables Yield (Tonnes/Ha) Best Yield
Best CountryWorld Pakistan
Potatoes 18.0 19.0 46.0 Belgium
Dry Onions
19.4 13.2 67.2 South Korea
Chilies & Peppers
15.3 2.5 275.0 Netherlands
Tomatoes 28.2 10.0 48.0 Netherlands
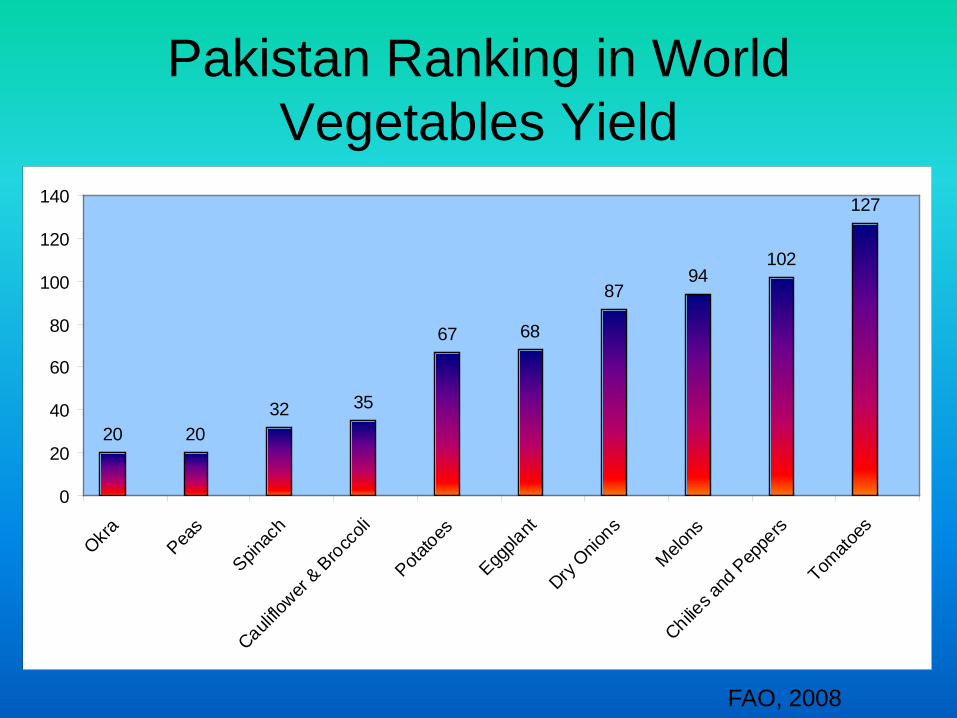
Pakistan Ranking in World Vegetables Yield
20 2032 35
67 68
8794
102
127
0
20
40
60
80
100
120
140
Okra Peas
Spinac
h
Cauliflo
wer & Brocc
oli
Potatoes
Eggpla
nt
Dry Onio
ns
Melons
Chilies a
nd P
eppe
rs
Tomato
es
FAO, 2008

FLORICULTURE
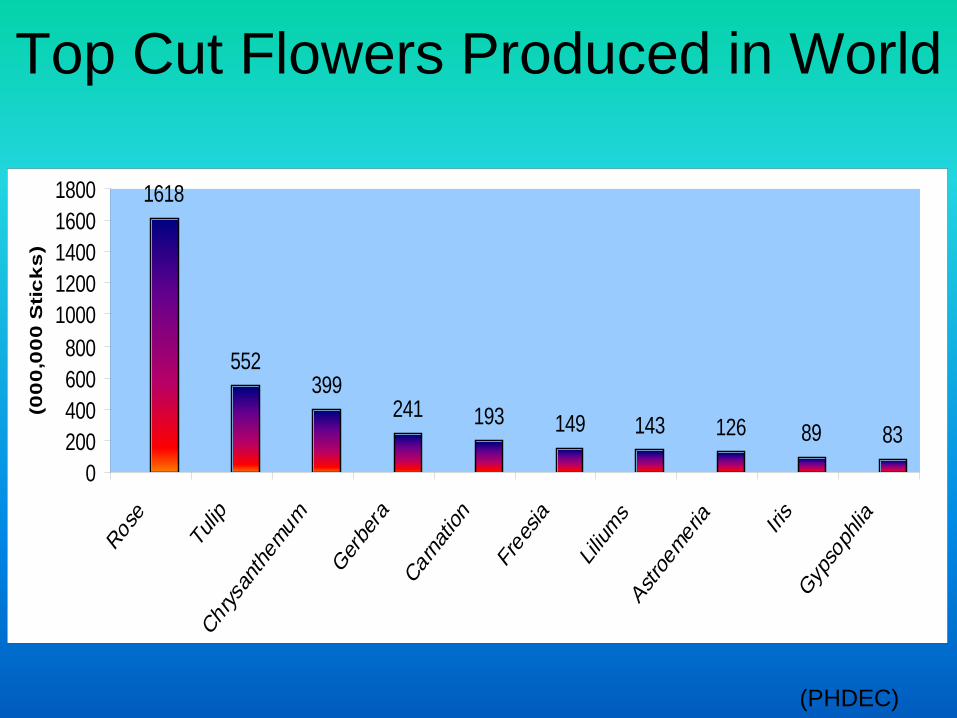
Top Cut Flowers Produced in World
1618
552399
241 193 149 143 126 89 830
200400600800
10001200140016001800
Rose
Tulip
Chrys
anthe
mum
Gerbe
ra
Carna
tion
Free
sia
Lilium
s
Astroe
meria Iris
Gypso
phlia
(00
0,0
00
Sti
ck
s)
(PHDEC)
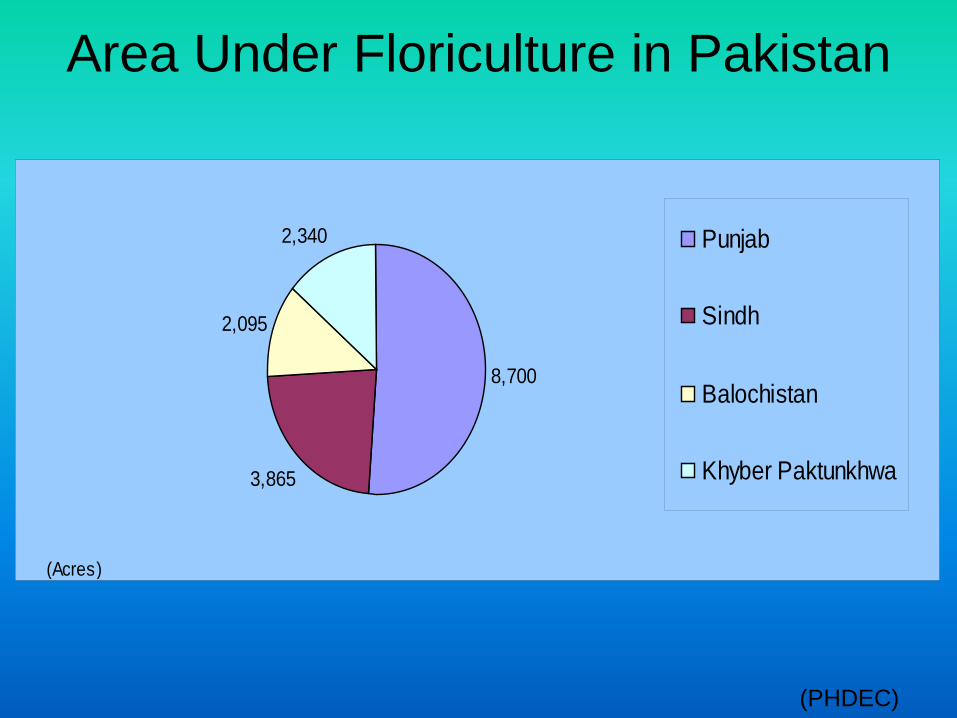
Area Under Floriculture in Pakistan
8,700
3,865
2,095
2,340 Punjab
Sindh
Balochistan
Khyber Paktunkhwa
(Acres)
(PHDEC)
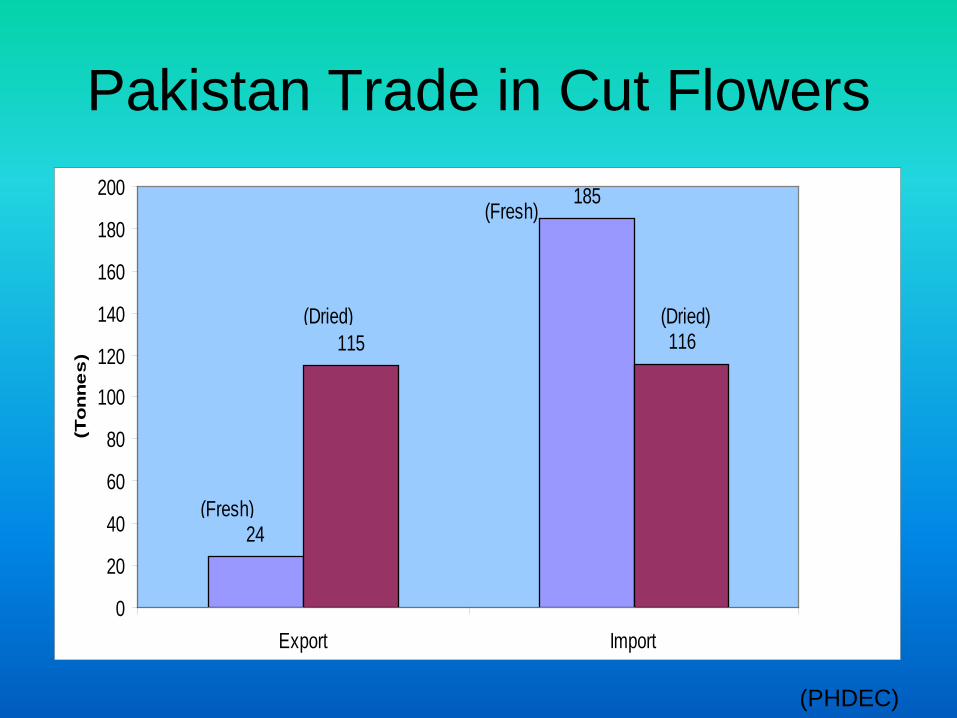
Pakistan Trade in Cut Flowers
24
185
115 116
0
20
40
60
80
100
120
140
160
180
200
Export Import
(To
nn
es
)
(Fresh)
(Dried)
(Fresh)
(Dried)
(PHDEC)
POSTHARVEST MANAGEMENT
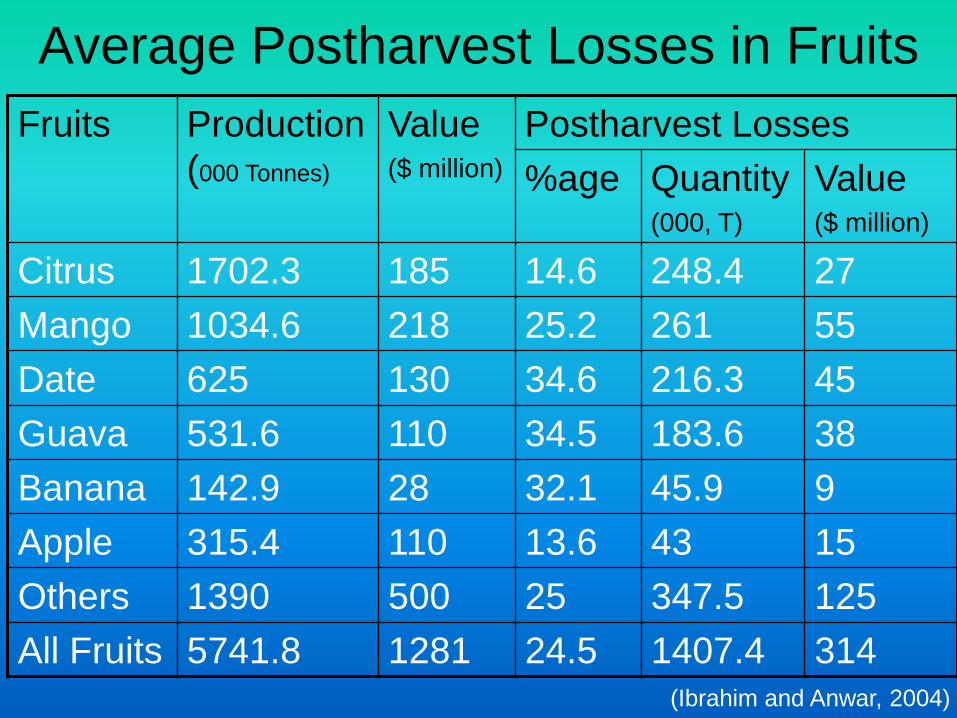
Average Postharvest Losses in FruitsFruits Production
(000 Tonnes)
Value($ million)
Postharvest Losses%age Quantity
(000, T)Value($ million)
Citrus 1702.3 185 14.6 248.4 27Mango 1034.6 218 25.2 261 55Date 625 130 34.6 216.3 45Guava 531.6 110 34.5 183.6 38Banana 142.9 28 32.1 45.9 9Apple 315.4 110 13.6 43 15Others 1390 500 25 347.5 125All Fruits 5741.8 1281 24.5 1407.4 314
(Ibrahim and Anwar, 2004)
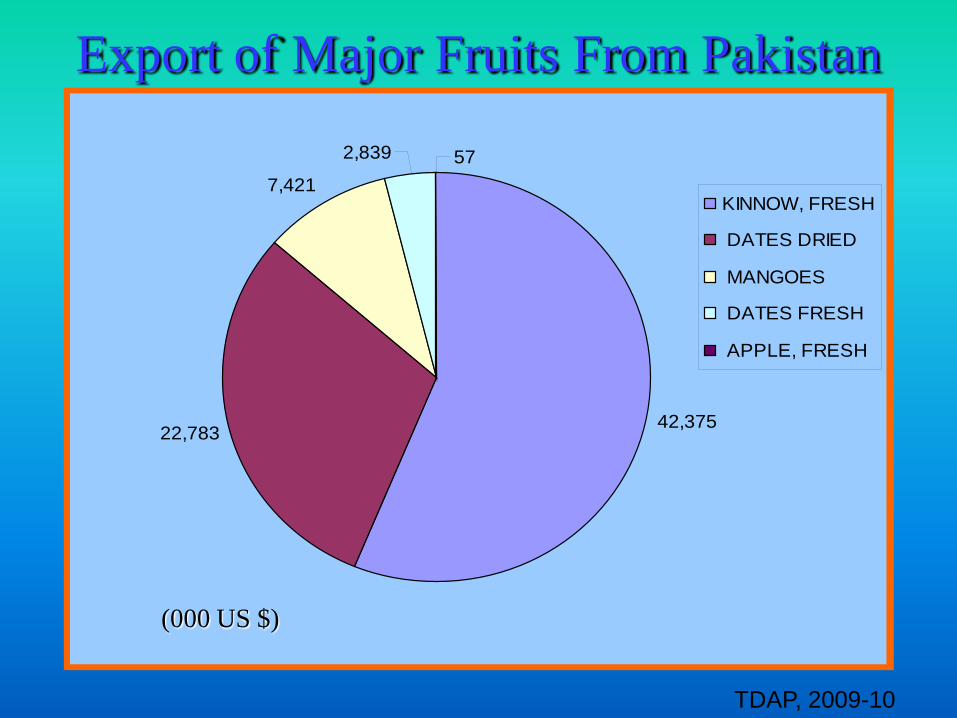
Export of Major Fruits From Pakistan
42,37522,783
7,421
2,839 57
KINNOW, FRESH
DATES DRIED
MANGOES
DATES FRESH
APPLE, FRESH
(000 US $)
TDAP, 2009-10
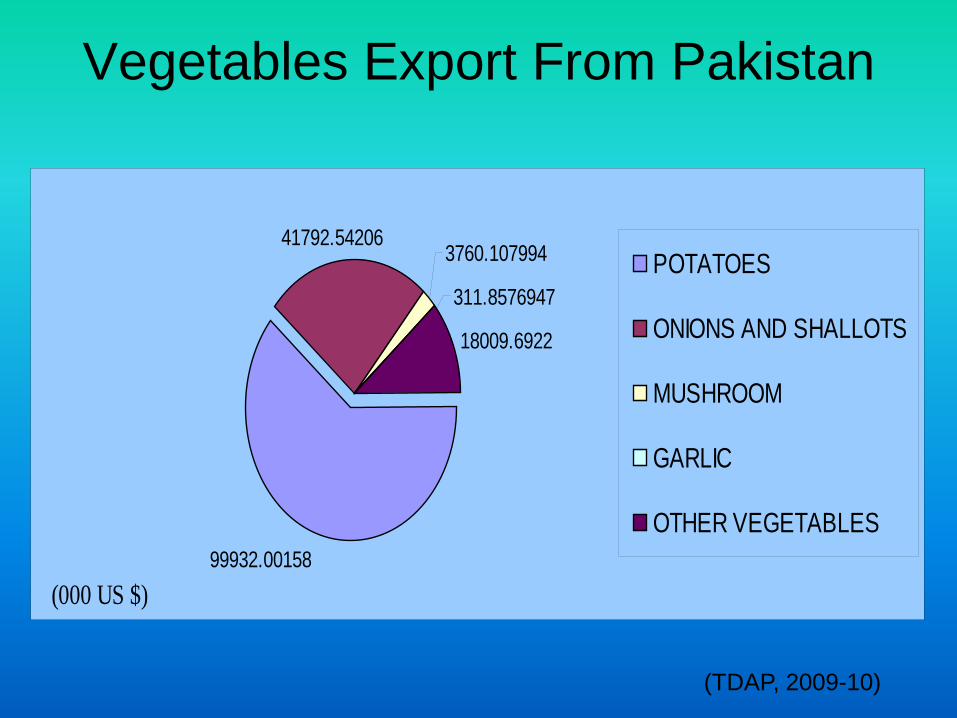
Vegetables Export From Pakistan
99932.00158
41792.542063760.107994
311.8576947
18009.6922
POTATOES
ONIONS AND SHALLOTS
MUSHROOM
GARLIC
OTHER VEGETABLES
(000 US $)
(TDAP, 2009-10)
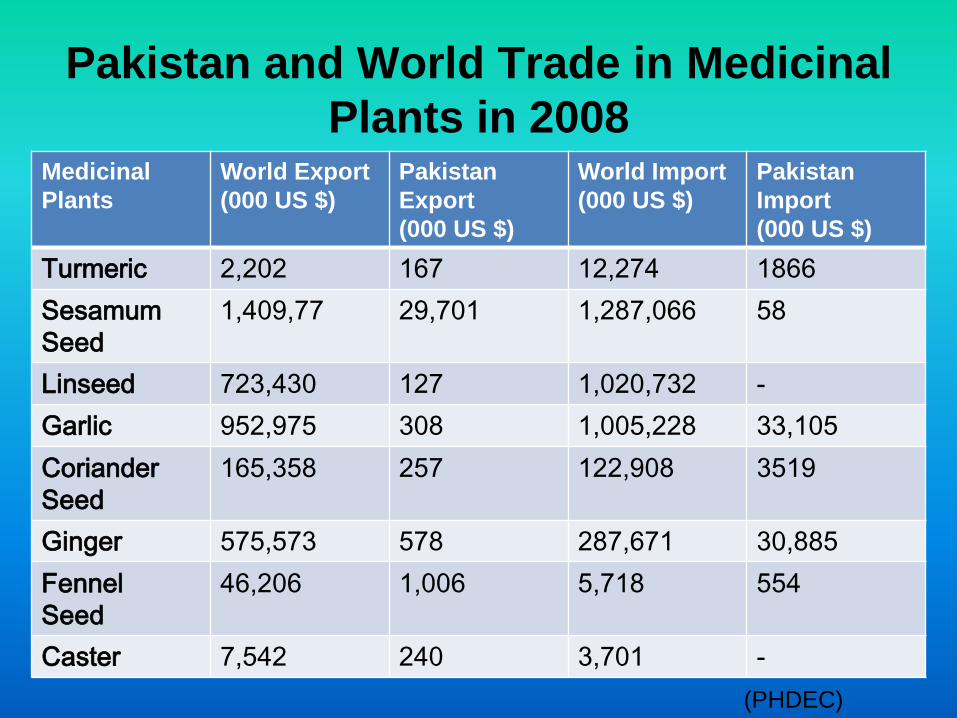
Pakistan and World Trade in Medicinal Plants in 2008
MedicinalPlants
World Export(000 US $)
Pakistan Export (000 US $)
World Import(000 US $)
Pakistan Import(000 US $)
Turmeric 2,202 167 12,274 1866SesamumSeed
1,409,77 29,701 1,287,066 58
Linseed 723,430 127 1,020,732 -Garlic 952,975 308 1,005,228 33,105CorianderSeed
165,358 257 122,908 3519
Ginger 575,573 578 287,671 30,885FennelSeed
46,206 1,006 5,718 554
Caster 7,542 240 3,701 -(PHDEC)
30
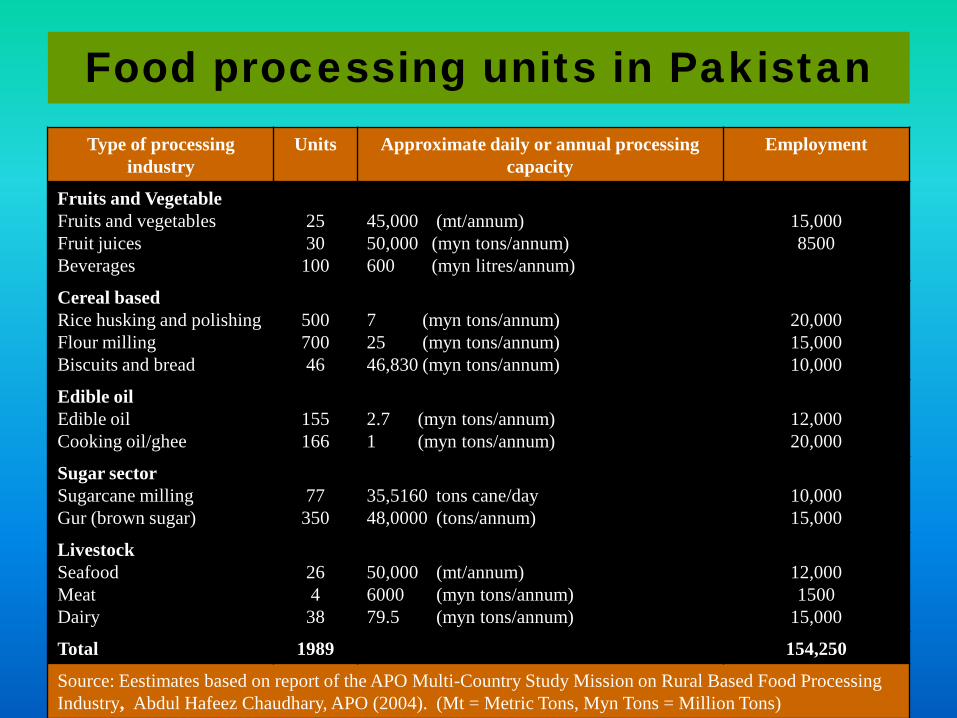
Food processing units in Pakistan Type of processing
industryUnits Approximate daily or annual processing
capacityEmployment
Fruits and VegetableFruits and vegetablesFruit juicesBeverages
2530
100
45,000 (mt/annum)50,000 (myn tons/annum)600 (myn litres/annum)
15,0008500
Cereal basedRice husking and polishingFlour millingBiscuits and bread
50070046
7 (myn tons/annum)25 (myn tons/annum)46,830 (myn tons/annum)
20,00015,00010,000
Edible oilEdible oilCooking oil/ghee
155166
2.7 (myn tons/annum)1 (myn tons/annum)
12,00020,000
Sugar sectorSugarcane millingGur (brown sugar)
77350
35,5160 tons cane/day48,0000 (tons/annum)
10,00015,000
LivestockSeafoodMeatDairy
26438
50,000 (mt/annum)6000 (myn tons/annum)79.5 (myn tons/annum)
12,0001500
15,000
Total 1989 154,250
Source: Eestimates based on report of the APO Multi-Country Study Mission on Rural Based Food Processing Industry, Abdul Hafeez Chaudhary, APO (2004). (Mt = Metric Tons, Myn Tons = Million Tons)
Issues
• Orchard Management• Nursery production system• Long term research/breeding programs• Seed and Environment Control Systems• Emphasis on minor/major fruits??• Production technology issues• Postharvest/Marketing
32
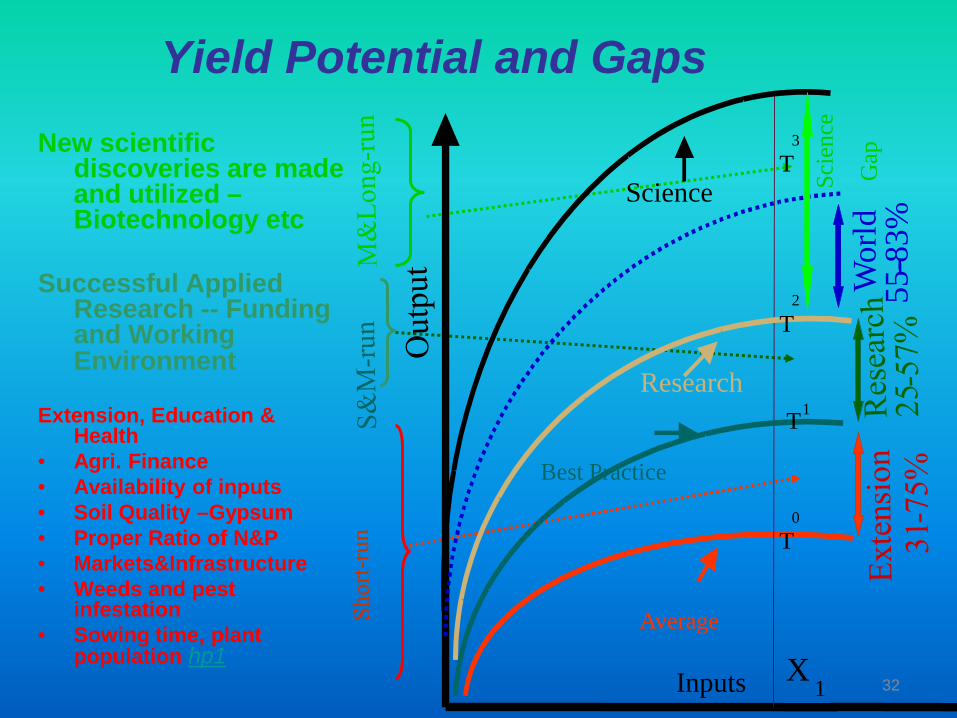
Yield Potential and GapsNew scientific
discoveries are made and utilized –Biotechnology etc
Successful Applied Research -- Funding and Working Environment
Extension, Education & Health
• Agri. Finance• Availability of inputs• Soil Quality –Gypsum• Proper Ratio of N&P• Markets&Infrastructure• Weeds and pest
infestation• Sowing time, plant
population hp1Average
T1
T2
T3
Scie
nce
Gap
X1
Research
Science
Best Practice
T0
Wor
ld55
- -83%
Inputs
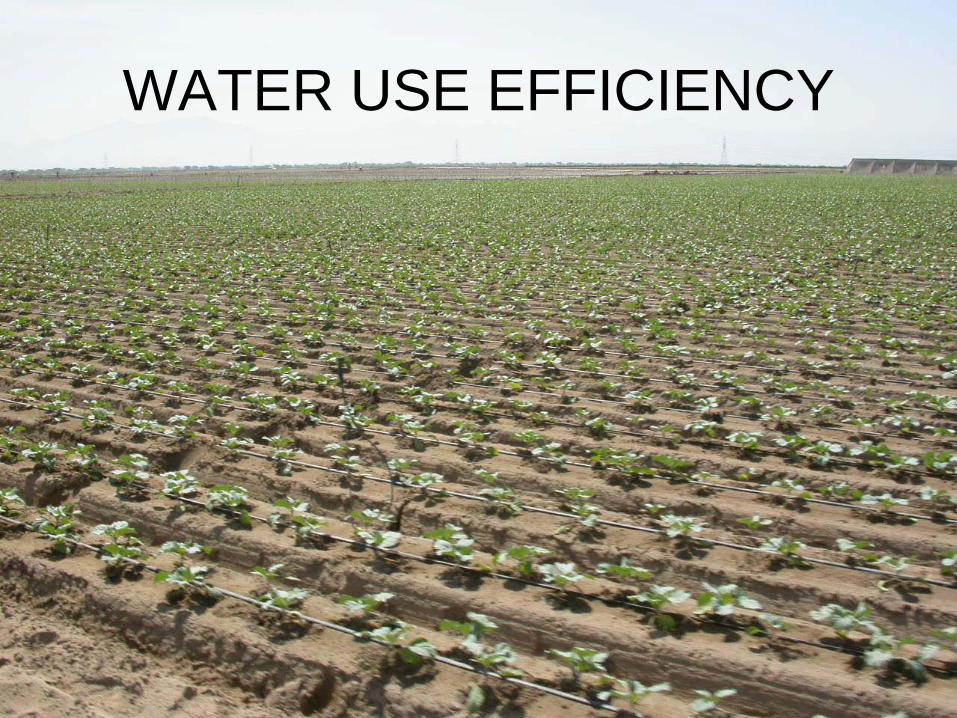
WATER USE EFFICIENCY
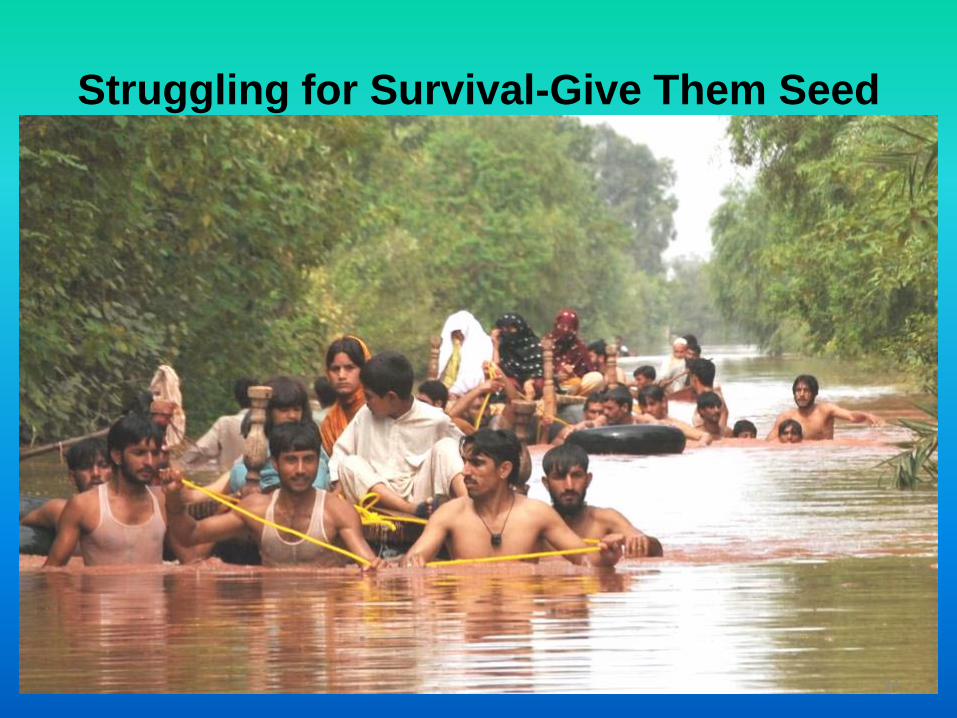
Struggling for Survival-Give Them Seed
34

THANK YOU