Embed Size (px)
Citation preview

Technical Report No. 15-07
Arctic Grayling and Burbot Studies at the Fort Knox Mine, 2015 by Alvin G. Ott, Parker T. Bradley, and Heather L. Scannell
Burbot and Arctic Grayling, May 2015 Photograph by Alvin G. Ott
October 2015 Alaska Department of Fish and Game Division of Habitat

The Alaska Department of Fish and Game (ADF&G) administers all programs and activities free from discrimination based on race, color, national origin, age, sex, religion, marital status, pregnancy, parenthood, or disability. The department administers all programs and activities in compliance with Title VI of the Civil Rights Act of 1964, Section 504 of the Rehabilitation Act of 1973, Title II of the Americans with Disabilities Act of 1990, the Age Discrimination Act of 1975, and Title IX of the Education Amendments of 1972.
If you believe you have been discriminated against in any program, activity, or facility please write:
●ADF&G ADA Coordinator, P.O. Box 115526, Juneau, AK 99811-5526
●U.S. Fish and Wildlife Service, 4401 N. Fairfax Drive, MS 2042, Arlington, VA 22203
●Office of Equal Opportunity, U.S. Department of Interior, 1849 C Street NW MS 5230, Washington DC 20240
The department’s ADA Coordinator can be reached via phone at the following numbers:
●(VOICE) 907-465-6077
●(Statewide Telecommunication Device for the Deaf) 1-800-478-3648
●(Juneau TDD) 907-465-3646
●(FAX) 907-465-6078
For information on alternative formats and questions on this publication, please contact the following:
●ADF&G, Division of Habitat, 1300 College Road, Fairbanks, AK 99701 (907)459-7289.

ARCTIC GRAYLING AND BURBOT STUDIES AT THE FORT KNOX MINE, 2015
By
Alvin G. Ott, Parker T. Bradley, and Heather L. Scannell
David E. Rogers Director
Division of Habitat Alaska Department of Fish and Game

Symbols and Abbreviations The following symbols and abbreviations, and others approved for the Système International d'Unités (SI), are used without definition in reports by the Divisions of Habitat, Sport Fish and of Commercial Fisheries. All others, including deviations from definitions listed below, are noted in the text at first mention, as well as in the titles or footnotes of tables, and in figure or figure captions.
Weights and measures (metric) centimeter cm deciliter dL gram g hectare ha kilogram kg kilometer km liter L meter m milliliter mL millimeter mm Weights and measures (English) cubic feet per second ft3/s foot ft gallon gal inch in mile mi nautical mile nmi ounce oz pound lb quart qt yard yd Time and temperature day d degrees Celsius °C degrees Fahrenheit °F degrees kelvin K hour h minute min second s Physics and chemistry all atomic symbols alternating current AC ampere A calorie cal direct current DC hertz Hz horsepower hp hydrogen ion activity pH (negative log of) parts per million ppm parts per thousand ppt, ‰ volts V watts W
General Alaska Administrative Code AAC all commonly accepted abbreviations e.g., Mr., Mrs.,
AM, PM, etc. all commonly accepted professional titles e.g., Dr., Ph.D., R.N., etc. at @ compass directions:
east E north N south S west W
copyright corporate suffixes:
Company Co. Corporation Corp. Incorporated Inc. Limited Ltd.
District of Columbia D.C. et alii (and others) et al. et cetera (and so forth) etc. exempli gratia (for example) e.g. Federal Information Code FIC id est (that is) i.e. latitude or longitude lat. or long. monetary symbols (U.S.) $, ¢ months (tables and figures): first three letters Jan,...,Dec registered trademark trademark United States (adjective) U.S. United States of America (noun) USA U.S.C. United States
Code U.S. state use two-letter
abbreviations (e.g., AK, WA)
Measures (fisheries) fork length FL mideye-to-fork MEF mideye-to-tail-fork METF standard length SL total length TL Mathematics, statistics all standard mathematical signs, symbols and abbreviations alternate hypothesis HA base of natural logarithm e catch per unit effort CPUE coefficient of variation CV common test statistics (F, t, χ2, etc.) confidence interval CI correlation coefficient (multiple) R correlation coefficient (simple) r covariance cov degree (angular ) ° degrees of freedom df expected value E greater than > greater than or equal to ≥ harvest per unit effort HPUE less than < less than or equal to ≤ logarithm (natural) ln logarithm (base 10) log logarithm (specify base) log2, etc. minute (angular) ' not significant NS null hypothesis HO percent % probability P probability of a type I error (rejection of the null hypothesis when true) α probability of a type II error (acceptance of the null hypothesis when false) β second (angular) " standard deviation SD standard error SE variance population Var sample var

Table of Contents
Table of Contents ................................................................................................................. i List of Tables ...................................................................................................................... ii List of Figures ..................................................................................................................... ii Acknowledgements ............................................................................................................ iii Executive Summary ........................................................................................................... iv
Water Quality ................................................................................................................. iv
Arctic Grayling Stilling Basin ....................................................................................... iv
Arctic Grayling Water Supply Reservoir ....................................................................... iv
Burbot Water Supply Reservoir ..................................................................................... iv
Introduction ......................................................................................................................... 6 Methods............................................................................................................................. 10
Water Quality ................................................................................................................ 10
Fish ................................................................................................................................ 10
Results and Discussion ..................................................................................................... 12 Water Supply Reservoir, Water Quality ....................................................................... 12
Stilling Basin, Arctic Grayling ..................................................................................... 16
Water Supply Reservoir, Arctic Grayling ..................................................................... 18
Arctic Grayling Spawning (Timing, Temperature, and Fry Presence)..................... 18
Arctic Grayling Catches and Metrics ....................................................................... 20
Water Supply Reservoir, Burbot ................................................................................... 24
Conclusion ........................................................................................................................ 26 Literature Cited ................................................................................................................. 27 Appendix 1. A Summary of Mine Development with Emphasis on Biological Factors . 30 Appendix 2. Water Quality Data, April 2015 .................................................................. 35 Appendix 3. Arctic Grayling Population Estimates in the WSR. .................................... 36 Appendix 4. Arctic Grayling Growth in the WSR. .......................................................... 37 Appendix 5. Burbot Population Estimates in the WSR. .................................................. 37

ii
List of Tables 1. Winter water use from the WSR, 1997 to 2015 (October 1 to April 30). ...................... 8
List of Figures 1. Aerial photograph of the Fort Knox Gold Mine WSR, tailing facility, and pit ............. 6 2. Fort Knox WSR water quality sample sites, April 2015 (red dots). ............................ 11 3. Winter dissolved oxygen concentrations in the WSR in April, 2015. ......................... 12 4. Average, maximum, and minimum dissolved oxygen at Site 2 during late winter. .... 13 5. Water quality sampling sites and approximate locations of the old Fish Creek .......... 14 6. Stilling basin located immediately below the spillway, looking east (April 2015). .... 16 7. Length frequency distribution of Arctic grayling in the stilling basin in June 2015. .. 17 8. Catch per unit of effort (catch/day) of Arctic grayling in the wetland complex. ......... 19 9. Peak daily water temperatures in Pond F outlet channel in spring 2015. .................... 19 10. Average size (± 1SD) of Arctic grayling fry in the wetland complex. ...................... 20 11. Estimates of the Arctic grayling population in the WSR. .......................................... 21 12. Number of new fish ≥ 200 mm that entered the population ...................................... 21 13. Length frequency distribution of Arctic grayling in 1995 and in 2015. .................... 22 14. Growth of marked Arctic grayling before the WSR (1994) ...................................... 23 15. Length frequency of burbot in the developed wetlands and WSR in spring 2014. ... 24 16. Catch per unit of effort (fish/trap day) of burbot in the WSR ................................... 24 17. Catch per unit of effort (fish/trap day) of large burbot in the WSR .......................... 25 18. Burbot population estimates in the WSR. .................................................................. 25
iii
Acknowledgements We thank Fairbanks Gold Mining Inc. (FGMI) (Bartly Kleven, Mark Huffington, Jennifer
Pyecha, and Dave Stewart) for their continued support of our work to monitor fish and
wildlife resources in the water supply reservoir, tributaries, and developed wetlands.
Bartly Kleven and Dave Stewart (FGMI) provided constructive review of our report.
iv
Executive Summary Water Quality
●Winter dissolved oxygen (DO) was collected in April 2015 and DO concentrations were some of the highest seen since sampling began in 1998. Higher DOs appear directly related to the discharge of non-contact mine water to the water supply reservoir (page 12)
Arctic Grayling Stilling Basin
●Limited sampling was done in 2015. Eleven Arctic grayling were caught in the stilling basin (page 16)
Arctic Grayling Water Supply Reservoir
●In spring 2015, Arctic grayling spawning probably began around May 7 when peak water temperatures reached 4.0oC and by May 12 nearly all female Arctic grayling were ripe or spent (page 19)
●Fry were collected on June 19 and again on July 23, 2015. Fry averaged 57.3 mm long by July 23. Average growth from June 19 to July 23 was 27.6 mm (about 0.8 mm/day) (page 20)
●The spring 2014 population estimate for Arctic grayling ≥ 200 mm long was 5,841 fish (95% CI 5,235-6,446) (page 21)
●Some recruitment of Arctic grayling was observed in spring 2015, but only 21 new fish between 200 and 240 mm in length were captured and marked (page 21)
●The highest average annual growth by size class since 2009 occurred in 2014 (page 22)
Burbot Water Supply Reservoir
●We caught 161 burbot in the WSR and developed wetlands that ranged from 114 to 850 mm long - 26 of those fish were larger than 400 mm and 3 had been seen in spring 2014 (page 24)
●The estimated population of large burbot (> 400 mm) in the WSR was 175 (95% CI 44-305) for spring 2014 (page 25)

6
Introduction Fairbanks Gold Mining Incorporated (FGMI) began construction of the Fort Knox hard-
rock gold mine in March 1995. The mine is located in the headwaters of the Fish Creek
drainage about 25 km northeast of Fairbanks, Alaska (Figure 1). The project included an
open-pit mine, mill, tailing impoundment, water supply reservoir (WSR), and related
facilities. Construction of the WSR dam and spillway was completed in July 1996. In
2007, permits were issued for the construction, operation, and closure of a valley fill heap
leach facility located in Walter Creek upstream of the tailing pond. Ore was processed
through the mill as well as through the Walter Creek valley fill heap leach in 2015.
Exploration drilling continued in the vicinity of the existing open pit.
Figure 1. Aerial photograph of the Fort Knox Gold Mine WSR, tailing facility, and pit – water supply reservoir in lower part of photo and the tailing dam and impoundment in the upper Fish Creek valley, photograph provided by FGMI.

7
Rehabilitation, to the extent practicable, has been concurrent with mining activities and
natural revegetation of some disturbed habitats has been rapid. Wetland construction
between the tailing dam and WSR began in summer 1998. A channel connecting Ponds
D and E was built in summer 2001.
In-channel excavation, drainage rock placement, and channel reconstruction work to
mitigate aufeis in Last Chance Creek was conducted in fall 2001 and again in fall 2008.
Repair work on dikes separating Ponds D and E and the channel connecting the ponds
was completed in summer 2002. Buell and Moody (2005) provided recommendations for
additional work to enhance fish and wildlife habitats between the tailing dam and WSR.
Ponding of water for the WSR began in November 1995. Water surface elevation varied
in 1996 and 1997 due to water use and winter seepage below the freshwater dam. The
WSR reached the projected maximum water surface elevation of 1,021 feet on September
29, 1998, after a major rainfall event. When full, the WSR contains about 3,363 acre-feet
(1.1 billion gallons) of water. Water levels have remained fairly constant since 1998,
except in the winter in certain years when large amounts were removed (Table 1). In late
April 2015 there was surface flow over the spillway. Winter water use in 2014/2015 was
about 104 acre-feet (about 3% of the water available).
In spring 2015, FGMI initiated a discharge of non-contact water from dewatering wells
around the open pit. The discharge was authorized by a permit issued by the Alaska
Department of Environmental Conservation. The discharge began in mid-March and has
been continuous except for a few shutdowns. The water from the discharge appeared to
have a beneficial effect by increasing the dissolved oxygen in the WSR in late winter.
A chronology of events from 2011 to 2015 with emphasis on biological factors is
presented in Appendix 1. The chronology for previous years (1992 to 2010) can be found
in Technical Report No. 10-5 titled “Arctic grayling and burbot studies at the Fort Knox
Mine, 2010” (Ott and Morris, 2010).

8
Table 1. Winter water use from the WSR, 1997 to 2015 (October 1 to April 30).
Fish research prior to construction of the Fort Knox mine and related facilities began in
1992 and water quality sampling started in summer 1997. Technical Reports (Weber
Scannell and Ott 1993, Weber Scannell and Ott 1994, Ott et al. 1995, Ott and Weber
Scannell 1996, Ott and Townsend 1997, Ott and Weber Scannell 1998, Ott and Morris
1999, Ott and Morris 2000, Ott and Morris 2001, Ott and Morris 2002a and b, Ott and
Morris 2003, Ott and Morris 2005a and, b, Ott and Morris 2006, Ott and Morris 2007, Ott
and Morris 2009a and b, Ott and Morris 2010, Ott and Morris 2011, Ott et al. 2012, Ott et
al. 2013, and Ott et al. 2014) summarizing field work can be found on the Alaska
Department of Fish and Game, Division of Habitat’s Web Page:
http://www.adfg.alaska.gov/index.cfm?adfg=habitat_publications.main.
Year (October 1 to April 30)
Acre-Feet of Water Removed
Percent of Water Removed
1997/1998 660 19.61998/1999 605 18.01999/2000 577 17.22000/2001 1,464 43.52001/2002 320 9.52002/2003 337 10.02003/2004 279 8.32004/2005 716 21.32005/2006 659 19.62006/2007 299 8.92007/2008 1,176 35.02008/2009 817 24.32009/2010 1,167 34.72010/2011 187 5.62011/2012 59 1.82012/2013 1,837 54.62013/2014 1,399 41.62014/2015 104 3.1
9
Populations of Arctic grayling (Thymallus arcticus) and burbot (Lota lota) exist in the
WSR, and both Arctic grayling and burbot inhabit the stilling basin below the WSR.
Arctic grayling spawning occurs predominantly in the wetland complex between the
WSR and the tailing dam. Burbot spawning as documented by using radio telemetry
likely occurs in Solo Bay where Solo Creek enters the WSR. Recruitment of Arctic
grayling to the stilling basin is from the WSR, but no tagged burbot from the WSR have
been caught in the stilling basin. Our report summarizes fish and water quality data
collected during 2015 and discusses these findings in relation to previous work.
10
Methods
Water Quality
In 2015, water quality sampling was conducted on April 8 and 9 when the WSR was ice
covered (Figure 2). Temperature (oC), dissolved oxygen (DO) concentration (mg/L), DO
percent saturation (barometrically corrected), pH, specific conductance (uS/cm),
oxidation reduction potential (ORP), and depth (m) were measured with a Hydrolab®
Minisonde®5 water quality multiprobe connected to a Surveyor® 4 digital display unit.
The multiprobe sensors were calibrated to suggested specifications prior to use. The
LDO sensor was calibrated using a saturated air method. Conductivity, ORP, and pH
sensors were calibrated with fresh standard solutions. Winter water quality
measurements were made at 1 m depth intervals from the surface to the bottom.
We also measured DO concentrations, DO percent saturation, and temperature in the
wetland complex and in the non-contact water being discharged to the old Fish Creek
channel using a YSI 85. The DO sensor was freshly calibrated on site just prior to data
collection.
Temperature probes were placed in the Pond F outlet channel and in the outlet of the old
Fish Creek channel. The temperature probe in Pond F outlet was pulled on July 23, 2015.
Fish
Fish sampling methods included visual observations, fyke nets, angling, and hoop traps.
One fyke net sampling site in the developed wetlands located just upstream of the WSR
was used in spring 2015 (Figure 2). The fyke net was fished from May 4 until May 8,
then again from May 10 until May 13. Arctic grayling were sampled by angling in the
stilling basin, in Pond F in the wetland complex, and burbot were captured in the WSR
using baited hoop traps. Hoop traps for burbot were fished from May 13 to 25 in the
WSR. Arctic grayling fry were caught with a drift net in the wetland complex on June 19
and July 23.
Arctic grayling were measured to fork length (nearest mm), inspected for tags and
spawning condition, and released. Burbot were measured to total length (nearest mm),
11
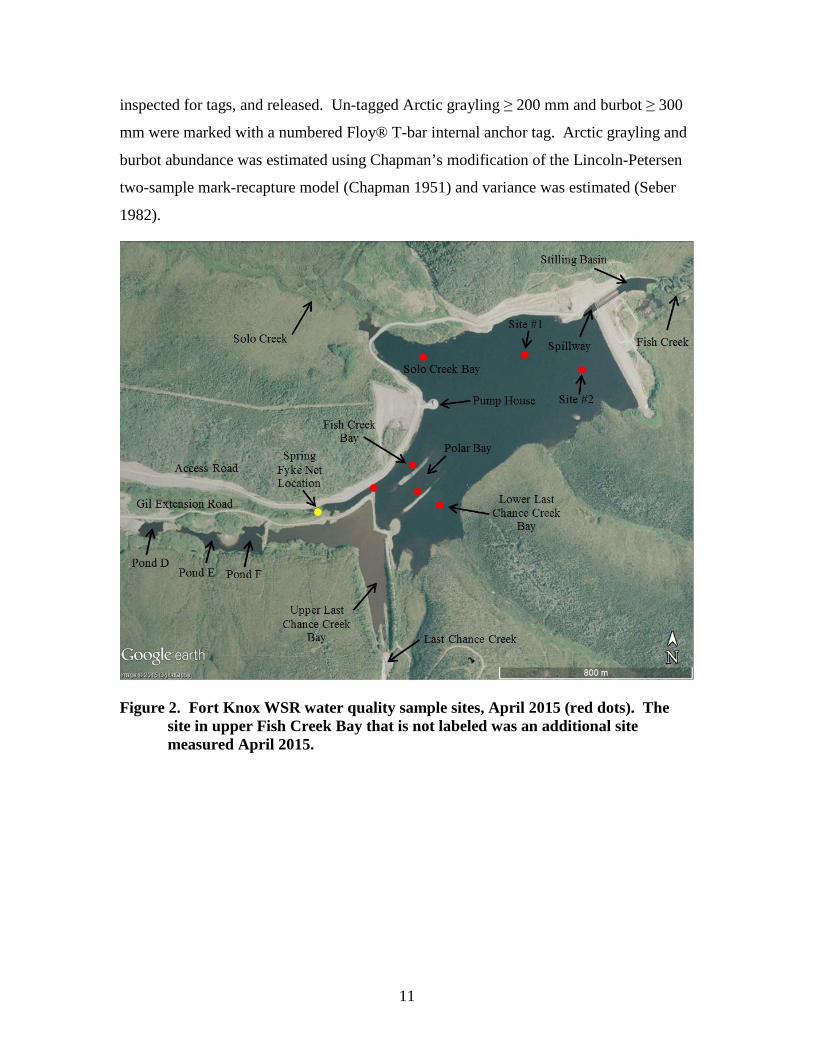
inspected for tags, and released. Un-tagged Arctic grayling ≥ 200 mm and burbot ≥ 300
mm were marked with a numbered Floy® T-bar internal anchor tag. Arctic grayling and
burbot abundance was estimated using Chapman’s modification of the Lincoln-Petersen
two-sample mark-recapture model (Chapman 1951) and variance was estimated (Seber
1982).
Figure 2. Fort Knox WSR water quality sample sites, April 2015 (red dots). The site in upper Fish Creek Bay that is not labeled was an additional site measured April 2015.

12
Results and Discussion
Water Supply Reservoir, Water Quality
Water quality data were collected prior to breakup on April 8 and 9, 2015 (Appendix 2).
Average ice thickness on the WSR was about 1 m. The water surface elevation was at
the ice surface across the reservoir with the exception of Polar Bay which had 0.10 m of
overflow above the ice and Last Chance Bay where the water level was 0.05 m below the
ice. Water temperature ranged from 0.14oC to 2.62oC and generally increased with depth
with minor cooling observed at depths greater than 6 m in Solo Bay, Site 1, and Site 2.
All locations had a similar temperature profile with depth, except for Fish Creek Bay
which was much cooler.
Dissolved oxygen concentrations were extremely high relative to other years, particularly
in Fish Creek Bay, Polar Bay, and Last Chance Bay (Figure 3). At these locations, DO
concentrations usually are the lowest in the WSR averaging 1.7-2.4 mg/L, and rarely
exceeding 4 mg/L. However, this year Fish Creek Bay had the highest average DO
concentration at 7.2 mg/L, followed by Polar Bay at 5.6 mg/L.
Figure 3. Winter dissolved oxygen concentrations in the WSR in April, 2015.
As a result of these high DO concentrations, an additional sample location was added at
the inlet to Fish Creek Bay (Figure 2). One measurement was taken at 1.5 m in depth and

13
DO concentration was 9.88 mg/L suggesting that Fish Creek was the primary source of
DO for these locations in the upper WSR. DO concentrations also were higher than
average in Solo Bay, Site 1, and Site 2. At all locations, DO concentration generally
decreased with depth, except for Fish Creek Bay which increased with depth.
Temperature specific DO saturation followed the same pattern as DO concentration with
exceptionally high levels in the upper WSR. The inlet of Fish Creek Bay DO saturation
measured at 71.5% which was the highest value in the WSR.
Specific conductance was similar throughout most of reservoir in the top 7 m of the water
column, at which time it began increasing with depth. Fish Creek Bay had the highest
specific conductance values which increased with depth beginning at the surface. ORP
was similar at most sites and highest in Polar Bay and Site 2. ORP was nearly constant
with depth in the upper layers at each site but dropped dramatically once the layer where
DO concentration less than 1 mg/L was reached.
Average winter water column DO at Site 2 was above the 12 year average for the WSR
and second highest on record (Figure 4). Many years, Solo Creek likely is the primary
source of DO in the WSR. This year, however, Fish Creek appears to be the significant
source of DO in the upper WSR and contributed, along with Solo Creek, to the higher
DO concentrations at Site 2.
Figure 4. Average, maximum, and minimum dissolved oxygen at Site 2 during late winter.

14
On March 4, 2015, the mine began discharging non-contact ground water from pit
dewatering wells via a pipeline down the valley with the discharge located about 1.6 km
upstream from Pond F outlet (Figure 5). FGMI also pumped water from the pump house
on the WSR to ensure that portion of the line did not freeze. The discharge into the Fish
Creek drainage was about 258 gpm. Water quality data, particularly DO concentrations
in Fish Creek Bay and Fish Creek suggest that the water being discharged may be
responsible for the improvement in water quality (DO) in the WSR. On April 17, 2015,
we collected water quality data at three locations in the wetland complex to further
investigate the discharge of non-contact water and the water quality coming from the Fish
Creek drainage. The creek at sample site #1 was mostly open with some ice cover below
the sample site. The DO concentration was 11.53 mg/L, percent saturation was 87.2%,
and temperature was 3.6oC.
Figure 5. Water quality sampling sites and approximate locations of the old Fish
Creek channel and wetland complex channels.
Discharge Point
Sample Site #1
Sample Site #2
Sample Site #3
Spring Fyke Net Location
Old Fish Creek Channel
Wetland Complex

15
Further downstream in the old Fish Creek channel, but just above the point of confluence
with pond F outlet, was sample site #2. There was not a well-defined channel, rather the
water was spread out and shallow. There were approximately 2-3 inches of ice with a
few inches of water underneath. The DO concentration was 14.05 mg/L, percent
saturation was 96.6%, and water temperature was 0.35ºC. The increase in DO
concentration and percent saturation is likely a result of the decrease of water temperature
which allows the water to hold more DO.
Sample site #3 was at the lower end of Pond F just upstream of the road. Pond F was still
ice covered, but the outlet was open and flowing through the culvert. The DO
concentration was 7.08 mg/L, percent saturation was 49.1%, and temperature was 0.3ºC.
These DO concentrations in Pond F outlet were higher than expected. Higher DOs likely
are a result of a lack of aufeis formation this past winter which left more water directly
exposed to the air.

16
Stilling Basin, Arctic Grayling
The stilling basin, located immediately downstream of the WSR spillway, is fed by
groundwater, seepage flow, and surface flow (Figure 6). A narrow notch in the spillway
was designed to accommodate surface water discharge from the WSR during winter
without forming aufeis. Aufeis in the spillway has never been observed since it was
constructed. In spring 2015, water was flowing over the spillway.
Figure 6. Stilling basin located immediately below the spillway, looking east (April 2015).
Limited Arctic grayling sampling using angling was conducted on June 19, 2015. We
fished for 60 min catching 11 Arctic grayling ranging from 111 to 273 mm fork length.
The length frequency distribution for Arctic grayling caught in the stilling basin is
presented in Figure 7. Multiple age classes are present in the stilling basin.

17
Figure 7. Length frequency distribution of Arctic grayling in the stilling basin in June 2015.

18
Water Supply Reservoir, Arctic Grayling
Arctic grayling were found throughout the Fish Creek drainage prior to construction of
the WSR. However, fish were concentrated in flooded mine cuts in Last Chance Creek.
The population appeared stunted: fish larger than 220 mm were rare; average annual
growth was 9 mm; and size at maturity was small (148 mm for males, 165 mm for
females). Successful spawning was limited to inlets and outlets of the flooded mine cuts
and upper Last Chance Creek. Flooding of the WSR inundated the inlets and outlets of
mine cuts, thus eliminating this spawning habitat. Since flooding of the WSR, aufeis in
Last Chance Creek has been substantial. Since 1998, we have only observed successful
spawning by Arctic grayling in Last Chance Creek in 2004 and 2005.
Very few fry were captured or observed (< 10 fish) from 1996 through 1998 in the WSR
and Last Chance Creek. In spring 1999, FGMI constructed an outlet channel to connect
the developed wetland complex with the WSR (Figure 2). The outlet channel was
constructed to bypass a perched pipe and provide fish access to potential spawning and
rearing habitat in the wetland complex. Arctic grayling have successfully spawned in the
wetland complex every year since 1999. However, substantial aufeis and resultant cold
water temperatures in the wetland complex, in addition to beaver dams, substantially
limited availability of, and access to spawning habitat in 2002, 2006, and 2007.
Arctic Grayling Spawning (Timing, Temperature, and Fry Presence)
In spring 2015, we fished one fyke net in the developed wetlands just upstream of the
WSR. Aufeis in the wetland complex was minimal and beaver dams in Ponds D, E, and
F had not been rebuilt. Arctic grayling had access to most of the wetland complex for
spawning in spring 2015.
The fyke net was set on May 4 and fished through May 8. The fyke was closed over the
weekend and reset on May 10 and fished until May 13. The peak catch of Arctic grayling
occurred on May 8 when we caught 307 fish (Figure 8). Peak movement of fish into the
wetland complex probably occurred on May 9 and 10 when the fyke net was not fishing.
Therefore, we sampled fish by angling in Pond F on May 12, 13, and 15, capturing 174

19
Arctic grayling. Of the 37 total spent females captured in our spring sampling, 36 were
caught by angling in Pond F. As seen in previous years of sampling, spent fish appear to
stay in the ponds and begin to feed to regain their condition. Generally very few spent
females are caught in the fyke nets even in those years where we reset the fyke net to
catch fish leaving the wetland complex.
Figure 8. Catch per unit of effort (catch/day) of Arctic grayling in the wetland complex.
In spring 2015, Arctic grayling spawning probably began around May 7 when peak water
temperatures reached 4.0oC and by May 12 nearly all female Arctic grayling were ripe or
spent (Figure 9). Although ice cover on the ponds decreased during sampling, there was
still ice present when the fyke net was pulled.
Figure 9. Peak daily water temperatures in Pond F outlet channel in spring 2015.

20
Arctic grayling fry were collected in the wetland complex immediately downstream of
the culvert in Pond F outlet channel. Fry were collected on June 19 and again on July 23
(Figure 10). Fry averaged 57.3 mm long by July 23. Average growth from June 19 to
July 23 was 27.6 mm (about 0.8 mm/day).
Figure 10. Average size (± 1SD) of Arctic grayling fry in the wetland complex.
Arctic Grayling Catches and Metrics
In spring 2015, the fyke net was set on May 4 and based on a catch of 149 Arctic grayling
on May 5, it was assumed that fish had already entered the wetland complex even though
the ponds were still ice covered. We also captured 174 Arctic grayling by angling in
Pond F.
The abundance of Arctic grayling was estimated in the WSR using spring 2014 as the
mark event and spring 2015 as the recapture event. In spring 2014, there were 1,690
marks when newly tagged and recaptured fish were combined. In spring 2015, 759
Arctic grayling > 240 mm were captured, and of those, 219 were recaptures. For the
2014 estimated Arctic grayling population, length frequency distributions from 2014 and
2015 were compared to eliminate those fish handled in 2015 that would have been too
small (< 200 mm) to mark in spring 2014. We had an additional 21 fish caught that were
< 240 mm long and these fish were not included in the population estimate.
21
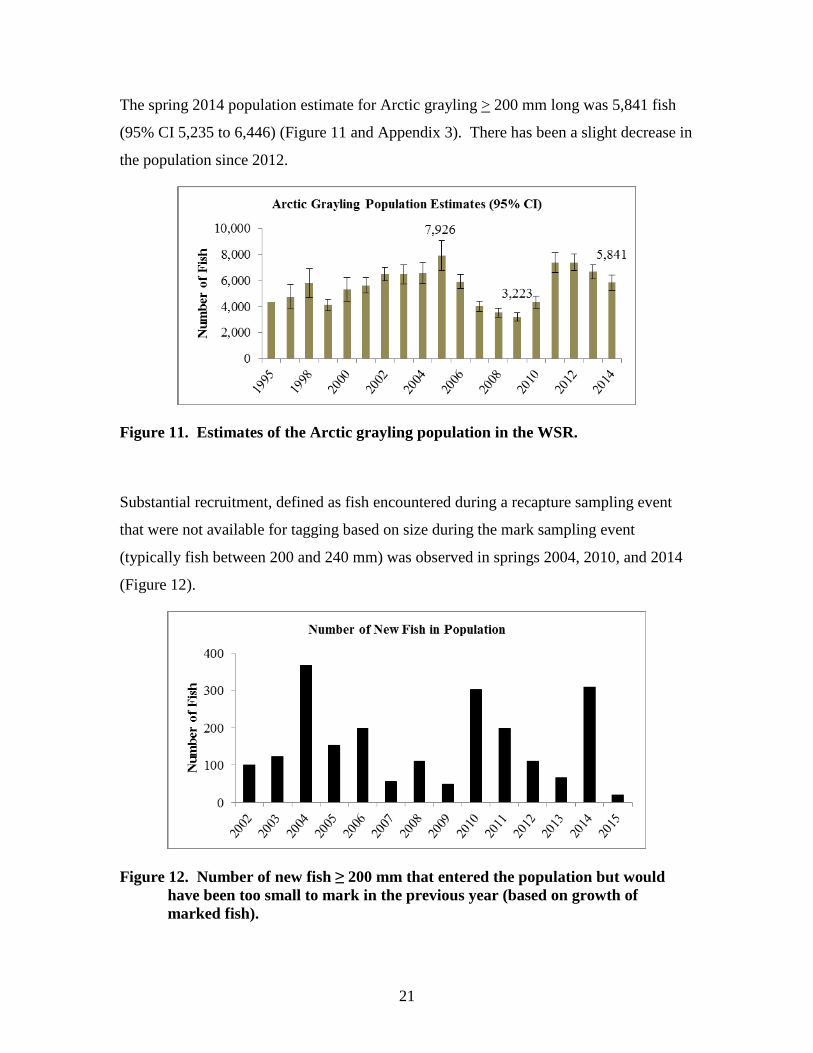
The spring 2014 population estimate for Arctic grayling > 200 mm long was 5,841 fish
(95% CI 5,235 to 6,446) (Figure 11 and Appendix 3). There has been a slight decrease in
the population since 2012.
Figure 11. Estimates of the Arctic grayling population in the WSR.
Substantial recruitment, defined as fish encountered during a recapture sampling event
that were not available for tagging based on size during the mark sampling event
(typically fish between 200 and 240 mm) was observed in springs 2004, 2010, and 2014
(Figure 12).
Figure 12. Number of new fish ≥ 200 mm that entered the population but would have been too small to mark in the previous year (based on growth of marked fish).

22
The length frequency distribution of Arctic grayling captured in 2015 by angling and
with a fyke net is presented in Figure 13. The fyke net is set in the spring at the mouth of
the creek to target mature Arctic grayling moving upstream to spawning habitats. Thus
the catch of small fish (i.e., non-spawners) in some years is low and may not be
representative of how many small fish are present in the WSR. The length frequency
distribution of Arctic grayling in 1995 also is presented in Figure 13 for comparison. The
1995 data set were obtained before construction of the freshwater dam and reflects the
stunted condition of the population at that time. The current population is composed of
much larger fish.
Figure 13. Length frequency distribution of Arctic grayling in 1995 and in 2015.
Average growth of Arctic grayling prior to development of the WSR ranged from 3 to 17
mm per year (Figure 14 and Appendix 4). After the WSR was flooded in 1995, annual
growth for fish increased substantially. Average growth in summer 2014 was higher than
in 2013. From 2009 to 2014, the highest growth rates seen occurred in 2009 and 2014.

23
Figure 14. Growth of marked Arctic grayling before the WSR (1994) and from 2009 to 2014.
24
Water Supply Reservoir, Burbot
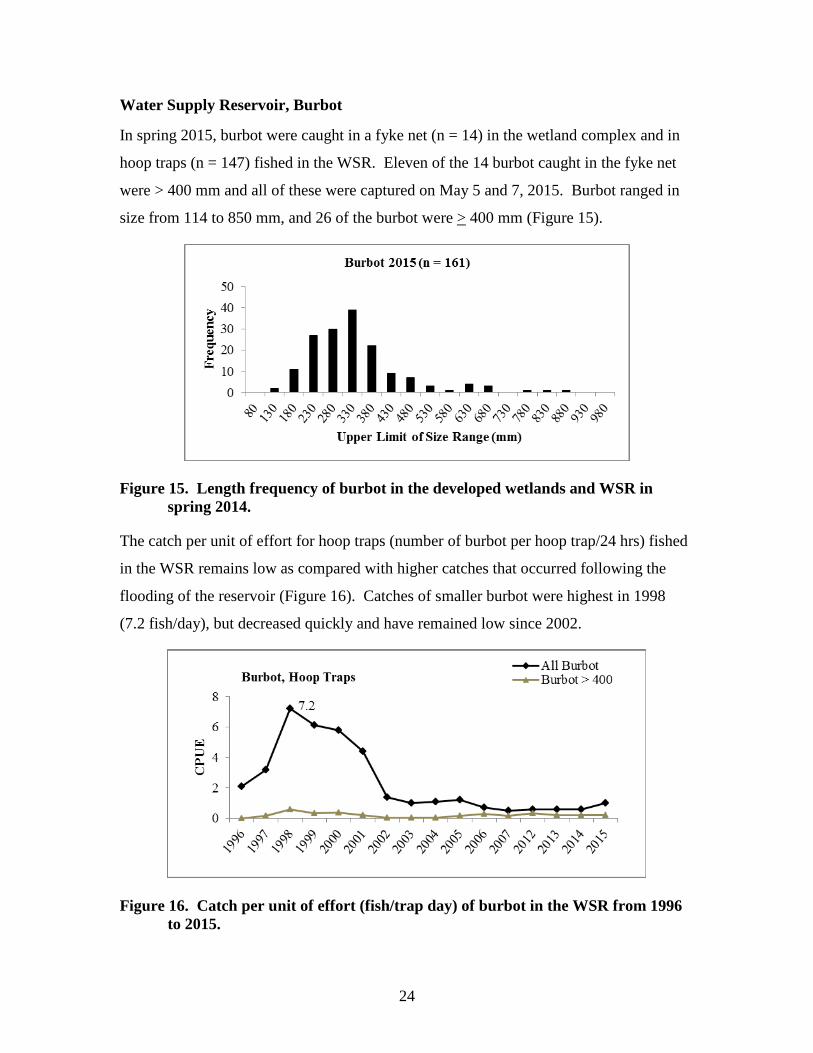
In spring 2015, burbot were caught in a fyke net (n = 14) in the wetland complex and in
hoop traps (n = 147) fished in the WSR. Eleven of the 14 burbot caught in the fyke net
were > 400 mm and all of these were captured on May 5 and 7, 2015. Burbot ranged in
size from 114 to 850 mm, and 26 of the burbot were > 400 mm (Figure 15).
Figure 15. Length frequency of burbot in the developed wetlands and WSR in spring 2014.
The catch per unit of effort for hoop traps (number of burbot per hoop trap/24 hrs) fished
in the WSR remains low as compared with higher catches that occurred following the
flooding of the reservoir (Figure 16). Catches of smaller burbot were highest in 1998
(7.2 fish/day), but decreased quickly and have remained low since 2002.
Figure 16. Catch per unit of effort (fish/trap day) of burbot in the WSR from 1996 to 2015.

25
Catches of large burbot (> 400 mm) followed a similar pattern with catches increasing
after the WSR was flooded, then decreased for several years, but have been stable the last
three years (Figure 17).
Figure 17. Catch per unit of effort (fish/trap day) of large burbot in the WSR from 1996 to 2015.
In spring 2014, we marked or recaptured 25 burbot > 400 mm. We caught 26 burbot >
400 mm in spring 2015 with only three recaptured fish from spring 2014. Our estimated
population of large burbot for spring 2014 was 175 (95% CI 44-305) (Figure 18,
Appendix 5). Growth rates of the three large burbot ranged from 25 to 56 mm and
averaged 38 mm per year.
Figure 18. Burbot population estimates in the WSR.

26
Conclusion Populations of Arctic grayling and burbot have been established in the Fort Knox WSR.
The post-mining goal for the Arctic grayling population was set at 800 to 1,600 fish >
200 mm (FGMI 1993). Our spring 2014 estimated population for Arctic grayling > 200
mm was 5,841 fish which is a slight decrease from the estimated 2013 population. A
goal for the burbot population was not set prior to construction, but a small population of
fish larger than 400 mm is present in the WSR.
We plan to continue to work cooperatively with FGMI to collect data on fish resources
and water quality in the WSR and to implement rehabilitation projects designed to
increase fish and aquatic habitat values and terrestrial habitats. Active management of
beaver populations within the developed wetlands and WSR appears to remain a critical
component to the productive capacity of the wetland complex for Arctic grayling.

27
Literature Cited Buell, J.W. and C.A. Moody. 2005. Re-assessment of functions and values for wetlands
and aquatic features associated with the Fort Knox gold mine, Fairbanks, Alaska as of July, 2004. Prepared for Fairbanks Gold Mining, Inc. 50 pp.
Chapman, D.G. 1951. Some practices of the hypergeometric distribution with applications to zoological censuses. University of California Publications in Statistics. 1:131-160.
Ott, A.G., W.A. Morris, H.L. Scannell, and P.T. Bradley. 2014. Arctic grayling and burbot studies at the Fort Knox mine, 2014. Alaska Department of Fish and Game Tech. Rept. 14-08. Division of Habitat. Juneau. 27 pp.
Ott, A.G., W.A. Morris, H.L. Scannell, and P.T. Bradley. 2013. Arctic grayling and burbot studies at the Fort Knox mine, 2013. Alaska Department of Fish and Game Tech. Rept. 13-05. Division of Habitat. Juneau. 29 pp.
Ott, A.G., W.A. Morris, and H.L. Scannell. 2012. Arctic grayling and burbot studies at the Fort Knox mine, 2012. Alaska Department of Fish and Game Tech. Rept. 12-09. Division of Habitat. Juneau. 23 pp.
Ott, A.G. and W.A. Morris. 2011. Arctic grayling and burbot studies at the Fort Knox mine, 2011. Alaska Department of Fish and Game Tech. Rept. 10-06. Division of Habitat. Juneau. 27 pp.
Ott, A.G. and W.A. Morris. 2010. Arctic grayling and burbot studies at the Fort Knox mine, 2010. Alaska Department of Fish and Game Tech. Rept. 10-05. Division of Habitat. Juneau. 58 pp.
Ott, A.G. and W.A. Morris. 2009a. Arctic grayling and burbot studies at the Fork Knox mine, 2009. Alaska Department of Fish and Game Tech. Rept. 09-05. Division of Habitat. Juneau. 60 pp.
Ott, A.G. and W.A. Morris. 2009b. Arctic grayling and burbot studies at the Fork Knox mine, 2008. Alaska Department of Fish and Game Tech. Rept. 09-01. Division of Habitat. Juneau. 60 pp.
Ott, A.G. and W.A. Morris. 2007. Arctic grayling and burbot studies at the Fork Knox mine, 2007. Alaska Department of Natural Resources Tech. Rept. 07-01. Office of Habitat Management and Permitting. Juneau. 31 pp.
Ott, A.G. and W.A. Morris. 2006. Arctic grayling and burbot studies at the Fork Knox mine, 2006. Alaska Department of Natural Resources Tech. Rept. 06-05. Office of Habitat Management and Permitting. Juneau. 31 pp.
Ott, A.G. and W.A. Morris. 2005b. Arctic grayling and burbot studies at the Fork Knox mine, 2005. Alaska Department of Natural Resources Tech. Rept. 05-06. Office of Habitat Management and Permitting. Juneau. 33 pp.

28
Literature Cited (continued)
Ott, A.G. and W.A. Morris. 2005a. Arctic grayling and burbot studies at the Fork Knox mine, 2004. Alaska Department of Natural Resources Tech. Rept. 05-01. Office of Habitat Management and Permitting. Juneau. 49 pp.
Ott, A.G. and W.A. Morris. 2003. Arctic grayling and burbot studies at the Fork Knox mine, 2003. Alaska Department of Natural Resources Tech. Rept. 03-09. Office of Habitat Management and Permitting. Juneau. 43 pp.
Ott, A.G. and W.A. Morris. 2002b. Arctic grayling and burbot studies in the Fork Knox water supply reservoir, stilling basin, and developed wetlands, 2002. Alaska Department of Fish and Game Tech. Rept. 02-06. Habitat and Restoration Division. Juneau. 65 pp.
Ott, A.G. and W.A. Morris. 2002a. Arctic grayling and burbot studies in the Fork Knox water supply reservoir and developed wetlands, 2001. Alaska Department of Fish and Game Tech. Rept. 02-1. Habitat and Restoration Division. Juneau. 46 pp.
Ott, A.G. and W.A. Morris. 2001. Arctic grayling and burbot studies in the Fort Knox water supply reservoir and developed wetlands. Alaska Department of Fish and Game Tech. Rept. 01-2. Habitat and Restoration Division. Juneau. 51 pp.
Ott, A.G. and W.A. Morris. 2000. Fish use of the Fort Knox water supply reservoir and developed wetlands. Alaska Department of Fish and Game Tech. Rept. 00-1. Habitat and Restoration Division. Juneau. 40 pp.
Ott, A.G. and W.A. Morris. 1999. Fish use of the Fort Knox water supply reservoir 1995-1998. Alaska Department of Fish and Game Tech. Rept. 99-2. Habitat and Restoration Division. Juneau. 28 pp.
Ott, A.G. and P. Weber Scannell. 1998. Fisheries use and water quality in the Fort Knox mine water supply reservoir. Alaska Department of Fish and Game Tech. Rept. 98-1. Habitat and Restoration Division. Juneau. 39 pp.
Ott, A.G. and A.H. Townsend. 1997. Fisheries use of the Fort Knox water supply reservoir 1996. Alaska Department of Fish and Game Tech. Rept. 97-2. Habitat and Restoration Division. Juneau. 69 pp.
Ott, A.G. and P. Weber Scannell. 1996. Baseline fish and aquatic habitat data for Fort Knox mine 1992 to 1995. Alaska Department of Fish and Game Tech. Rept. 96-5. Habitat and Restoration Division. Juneau. 165 pp.
Ott, A.G., P. Weber Scannell, and A.H. Townsend. 1995. Aquatic habitat and fisheries studies upper Fish Creek, 1992-1995. Alaska Department of Fish and Game Tech. Rept. 95-4. Habitat and Restoration Division. Juneau. 61 pp.

29
Literature Cited (concluded) Seber, G.A.F. 1982. The estimation of animal abundance. Charles Griffin & Company
LTD.
Weber Scannell, P. and A.G. Ott. 1994. Aquatic habitat of Fish Creek before development of the Fort Knox gold mine 1992-1993. Alaska Department of Fish and Game Tech. Rept. 94-5. Habitat and Restoration Division. Juneau. 79 pp.
Weber Scannell, P. and A.G. Ott. 1993. Aquatic habitat study, upper Fish Creek drainage, with an emphasis on Arctic grayling (Thymallus arcticus): baseline studies 1992. Alaska Department of Fish and Game Tech. Rept. 93-4. Habitat and Restoration Division. Juneau. 76 pp.

30
Appendix 1. A Summary of Mine Development with Emphasis on Biological Factors 2011
●on February 9, 2011, ADF&G provided input to ADNR on the environmental audit to be conducted in summer 2011. We identified several possible fish and wildlife enhancement projects originally recommended by Buell and Moody (2005). ●on March 4, 2011, the ACOE issued a permit (POA-1992-574-M19) authorizing construction of the modified dam raise and expansion of the Tailing Storage Facility (TSF). ●in April and May several Plan of Operations amendments were issued by ADNR for work associated with the TSF, waste rock dumps, powerline, topsoil storage, and dewatering. ●on May 2, 2011, ADF&G provided input to ADNR on the reclamation and closure plan for Fort Knox. Emphasis was on maintaining the existing developed wetland complex downstream of the TSF. ●our spring sample event for Arctic grayling and burbot ran from May 9 to 24. We caught 1,194 Arctic grayling and 117 burbot in a fyke net set in the WSR. ●the estimated spring 2010 Arctic grayling population was 4,346 fish > 200 mm long and was an increase from the 2009 estimate of 3,223. Recruitment of new fish in spring 2011 was strong with 198 new fish < 230 mm marked. ●Arctic grayling spawned in the wetland complex from Pond D downstream. Beavers had not rebuilt the dams in the wetland complex. ●a constructed osprey nesting platform adjacent to the main pump house in the WSR was occupied in spring 2011 – one chick was seen in August. An active raven nest was observed on the rock cut near the freshwater dam. ●water began flowing over the spillway on May 27, water had not reached the spillway since winter 2009/2010. ●on June 2, 2011, ADF&G provided written comments on the Ft. Knox and True North environmental audit proposals. ●on July 19, 2011, FGMI pumped about 10,440 gallons of water from the “801 Pond” downstream – environmental staff were notified and pumping was immediately stopped – water from the “801 Pond” is supposed to be pumped back into sump below the TSF ●on August 4, 2011, ADNR informed us of planned changes at Fort Knox including expansion of the heap leach facility from 160 to 300 million tons, the need for a ADEC permit to discharge non-contact water, and the long-term need for a permit and water treatment plant for closure.

31
Appendix 1 (continued) 2011
●on September 13, 2011, ADNR approved the drilling of two monitoring wells in the headwaters of Victoria Creek. The purpose of these monitoring wells is to ensure water in Victoria Creek is not impacted by the increased elevation of tailings in the Pearl Creek drainage. ●on September 28, 2011, we met with FGMI to discuss plans to discharge non-contact water from the Fort Knox pit to the WSR.
2012
●our spring sample event (Arctic grayling and burbot) began on May 7 and ended on May 30. The estimated spring 2011 Arctic grayling population was 7,378 fish > 200 mm long which was an increase of 3,032 from the 2010 estimate. Recruitment of new fish in spring 2012 was strong with 111 new fish < 230 mm marked. ●we caught 140 burbot (175 to 950 mm long) in spring 2012 in hoop traps and fyke nets. ●Arctic grayling spawned throughout the wetland complex, including the upper portion of Channel C, in spring 2012. Beavers had not rebuilt the dams in the wetland complex. ●a constructed osprey nesting platform adjacent to the main pump house in the WSR was occupied in spring 2012. ●water was flowing over the spillway when we began sampling in the spring of 2012 – water was still overflowing in late October. ●on July 13, 2012, ADF&G provided input to ADEC on the APDES draft permit for discharge of non-contact water. The discharge point has been changed to the old Fish Creek channel just downstream of Ponds A and B. The ADEC permit was issued on August 15, 2012. ●on September 27, 2012, ADF&G confirmed that a culvert in the road down the Fish Creek valley had been removed. In our trip report to FGMI, we recommended some additional civil work to ensure that the discharge water stays on the north side of the valley.
2013
●on February 20, 2013, FGMI received a Notice of Violation from the ACOE for the unauthorized discharge of fill material into 0.28 acres of wetlands ●on March 1, 2013, ADF&G informed FGMI that their 2012 Annual Report was extremely well done and FGMI’s report was distributed to all habitat offices in the state ●on March 11, 2013, the ACOE issued an After-the-Fact authorization covering the 0.28 acres of wetland fill

32
Appendix 1 (continued) 2013
●on April 25, 2013, water quality data (temperature, dissolved oxygen, etc.) were collected in the WSR under ice cover ●on May 4, 2013, the ADNR transmitted comments on the December 2012 reclamation and closure plan ●our spring sample event (Arctic grayling and burbot) began on May 20 and ended on June 10. The estimated spring 2012 Arctic grayling population was 7,404 fish >200 mm long. Recruitment of new fish in spring 2013 was strong with 114 new fish <230 mm marked ●we caught 96 burbot (89 to 697 mm long) in spring 2013 in hoop traps and fyke nets ●Arctic grayling spawned throughout the wetland complex, including the upper portion of Channel C, in spring 2013. Beavers had rebuilt the dams in the wetland complex, but the dams were notched to allow fish passage ●a constructed osprey nesting platform adjacent to the main pump house in the WSR was occupied in spring 2013 ●water was not flowing over the spillway when we began sampling, but by May 27 water had begun to flow out of the WSR and over the spillway ●on June 25, 2013, we observed Arctic grayling fry (numerous) in the upper portion of Channel C, very few fry were observed in Pond F and the Pond F outlet ●on October 14, 2013, ADF&G submitted comments on the Fort Knox 2013 reclamation plan – eight recommendations were made ●on November 27, 2013, ADF&G distributed the Fork Knox technical report for work done in 2013
2014
●in early April emails were exchanged to determine when Fish Creek was removed from the list of impaired waterbodies – it was listed on the 1992 list but was removed from the 1994 listing because FGMI had bought out all the existing placer operations and was planning on building the freshwater dam ●in mid-April, 2014, the decision was made to not collect winter water quality due to unsafe ice conditions and overflow ●in spring 2014, we fished a fyke net in the developed wetlands just upstream of the WSR from April 29 until May 9 and then again from May 12 to 15. Arctic grayling spawned throughout the wetland complex in spring 2014 –the only beaver dam present was in the upper end of C Channel ●Our estimated population of Arctic grayling (> 200 mm) for spring 2013 was 6,675 – a slight reduction from the 2011 and 2012 estimates ●Our estimated population of large burbot (> 400 mm) for spring 2013 was 80 – a substantial reduction from the spring 2012 estimate of 193 ●on September 29, 2014, FGMI notified state agencies that the new Environmental Superintendent was Bartly Kleven

33
Appendix 1 (continued) 2014
●on September 4, 2014, we were notified that the road across Solo Creek had failed – FGMI will determine a proper fix – this is the second time the road has failed at the culvert crossing ●on September 26, 2014, the developed wetlands and lower Last Chance Creek were inspected, no beaver dams were observed in Ponds D and F and in lower Last Chance Creek (dams had been removed by FGMI during summer) ●in October FGMI and ADFG discussed a draft design for the Solo Creek culvert replacement, conducted a field inspection, and are continuing discussions to decide what remedial work will be done ●on October 28, 2014, ADF&G distributed the Fork Knox technical report for work done in 2014 ●on November 12, 2014, FGMI submitted a permit application to replace the Solo Creek culvert. ADF&G had several questions regarding the culvert design specifications and FGMI addressed these questions and a permit was issued on November 20, 2014 to install the new 10 foot diameter pipe
2015
●on March 2, 2015, we conducted a field visit to observe the discharge point for non-contact mine water to the old Fish Creek channel which except for breakup and periods of heavy rain is dry ●FGMI initiated the discharge of non-contact water (about 250 gallons per minute) in mid-March and the discharge has been continuous except for a few shutdowns. The discharge was authorized by a permit issued by the ADEC ●on April 8 and 9, we collected water quality data in the WSR which was ice covered, high DO concentrations were found in Fish Creek Bay ●on April 17, we collected water quality data in the old Fish Creek channel downstream from where the non-contact mine water was being discharged and found very high DOs in the water – leading us to conclude that the discharge of non-contact mine water resulted in increased DOs in the WSR ●in early May, we field inspected the culvert replacement in Solo Creek and concluded that it had been installed in accordance with the Fish Habitat Permit ●in spring 2015, we fished a fyke net in the developed wetlands just upstream of the WSR from May 4 to 8 and then again from May 10 to 13. Arctic grayling spawned throughout the wetland complex in spring 2015 ●our estimated population of Arctic grayling (> 200 mm) for spring 2014 was 5,841 – a slight reduction from the 2011 and 2012 estimates ●our estimated population of large burbot (> 400 mm) for spring 2014 was 175 – a substantial increase from the spring 2013, but with a large 95% CI ●on June 19 and July 23, we collected Arctic grayling fry in the wetland complex, average size on June 19 was 29.7 mm and on July 23 it was 57.3 mm

34
Appendix 1 (concluded) 2015
●on June 19, we inspected the Last Chance culvert in the Gil Causeway, material at the east end of the pipe has slumped and the road was blocked with cones and flagging ●on October 28, 2015, ADF&G distributed the Fork Knox technical report for work done in 2015
35
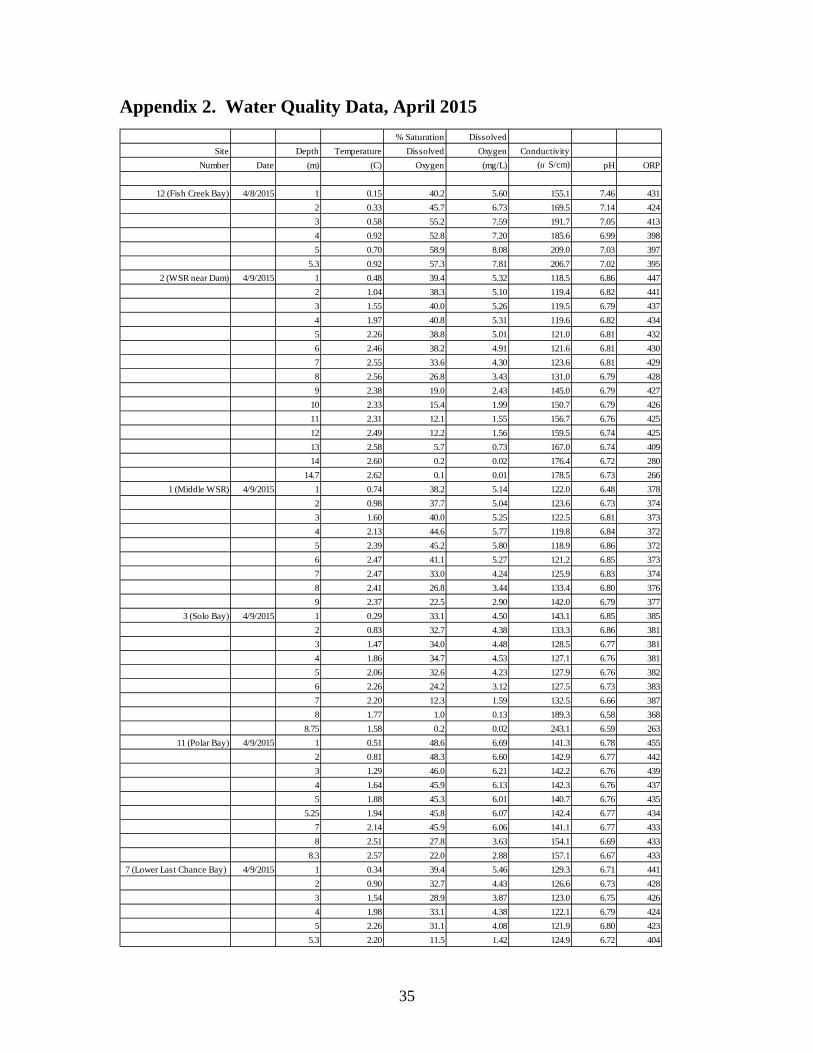
Appendix 2. Water Quality Data, April 2015
% Saturation DissolvedSite Depth Temperature Dissolved Oxygen Conductivity
Number Date (m) (C) Oxygen (mg/L) (u S/cm) pH ORP
12 (Fish Creek Bay) 4/8/2015 1 0.15 40.2 5.60 155.1 7.46 4312 0.33 45.7 6.73 169.5 7.14 4243 0.58 55.2 7.59 191.7 7.05 4134 0.92 52.8 7.20 185.6 6.99 3985 0.70 58.9 8.08 209.0 7.03 397
5.3 0.92 57.3 7.81 206.7 7.02 3952 (WSR near Dam) 4/9/2015 1 0.48 39.4 5.32 118.5 6.86 447
2 1.04 38.3 5.10 119.4 6.82 4413 1.55 40.0 5.26 119.5 6.79 4374 1.97 40.8 5.31 119.6 6.82 4345 2.26 38.8 5.01 121.0 6.81 4326 2.46 38.2 4.91 121.6 6.81 4307 2.55 33.6 4.30 123.6 6.81 4298 2.56 26.8 3.43 131.0 6.79 4289 2.38 19.0 2.43 145.0 6.79 427
10 2.33 15.4 1.99 150.7 6.79 42611 2.31 12.1 1.55 156.7 6.76 42512 2.49 12.2 1.56 159.5 6.74 42513 2.58 5.7 0.73 167.0 6.74 40914 2.60 0.2 0.02 176.4 6.72 280
14.7 2.62 0.1 0.01 178.5 6.73 2661 (Middle WSR) 4/9/2015 1 0.74 38.2 5.14 122.0 6.48 378
2 0.98 37.7 5.04 123.6 6.73 3743 1.60 40.0 5.25 122.5 6.81 3734 2.13 44.6 5.77 119.8 6.84 3725 2.39 45.2 5.80 118.9 6.86 3726 2.47 41.1 5.27 121.2 6.85 3737 2.47 33.0 4.24 125.9 6.83 3748 2.41 26.8 3.44 133.4 6.80 3769 2.37 22.5 2.90 142.0 6.79 377
3 (Solo Bay) 4/9/2015 1 0.29 33.1 4.50 143.1 6.85 3852 0.83 32.7 4.38 133.3 6.86 3813 1.47 34.0 4.48 128.5 6.77 3814 1.86 34.7 4.53 127.1 6.76 3815 2.06 32.6 4.23 127.9 6.76 3826 2.26 24.2 3.12 127.5 6.73 3837 2.20 12.3 1.59 132.5 6.66 3878 1.77 1.0 0.13 189.3 6.58 368
8.75 1.58 0.2 0.02 243.1 6.59 26311 (Polar Bay) 4/9/2015 1 0.51 48.6 6.69 141.3 6.78 455
2 0.81 48.3 6.60 142.9 6.77 4423 1.29 46.0 6.21 142.2 6.76 4394 1.64 45.9 6.13 142.3 6.76 4375 1.88 45.3 6.01 140.7 6.76 435
5.25 1.94 45.8 6.07 142.4 6.77 4347 2.14 45.9 6.06 141.1 6.77 4338 2.51 27.8 3.63 154.1 6.69 433
8.3 2.57 22.0 2.88 157.1 6.67 4337 (Lower Last Chance Bay) 4/9/2015 1 0.34 39.4 5.46 129.3 6.71 441
2 0.90 32.7 4.43 126.6 6.73 4283 1.54 28.9 3.87 123.0 6.75 4264 1.98 33.1 4.38 122.1 6.79 4245 2.26 31.1 4.08 121.9 6.80 423
5.3 2.20 11.5 1.42 124.9 6.72 404

36
Appendix 3. Arctic Grayling Population Estimates in the WSR.
________________________________________________________________________ Minimum Size Estimated of Fish in Size of 95% Confidence Year Estimate (mm) Population Interval ________________________________________________________________________ 19951 150 4,358 19962 150 4,748 3,824-5,672 19963 150 3,475 2,552-4,398 19984 200 5,800 4,705-6,895 19994 200 4,123 3,698-4,548 20004 200 5,326 4,400-6,253 20014 200 5,623 5,030-6,217 20024 200 6,503 6,001-7,005 20034 200 6,495 5,760-7,231 20044 200 6,614 5,808-7,420 20054 200 7,926 6,759-9,094 20064 200 5,930 5,382-6,478 20074 200 4,027 3,620-4,433 20084 200 3,545 3,191-3,900 20094 200 3,223 2,896-3,550 20104 200 4,346 3,870-4,823 20114 200 7,378 6,616-8,141 20124 200 7,404 6,775-8,033 20134 200 6,675 6,217-7,333 20144 200 5,841 5,235-6,446 ________________________________________________________________________ 1We used estimates from the ponds and creeks for the Arctic grayling population; a
confidence interval was not applicable to the data set. 2The 1996 estimate was made with a capture and recapture event in summer 1996. 3Gear type for the population estimate was a boat-mounted electroshocker with both
capture and recapture events in fall 1996. 4The 1998 through 2014 population estimates were made using a mark event in spring of
the year of the estimate, but the recapture event was in spring of the following year.

37
Appendix 4. Arctic Grayling Growth in the WSR.
Appendix 5. Burbot Population Estimates in the WSR.
________________________________________________________________________ Minimum Size Estimated of Fish in Size of 95% Confidence Year Estimate (mm) Population Interval ________________________________________________________________________ 2001 400 134 58-210 2002 400 131 63-199 2003 400 102 57-147 2004 400 86 44-128 2005 400 143 96-191 2012 400 193 95-290 2013 400 80 44-117 2014 400 175 44-305 ________________________________________________________________________
2014 to 2015 growth grayling (n=330)Upper Limit (mm) Average Maximum Minimumand Sample Size (mm) (mm) (mm)
210 (n=2) 48 62 33220 (n=4) 40 54 30
230 (n=15) 38 55 18240 (n=13) 29 43 9250 (n=27) 25 42 12260 (n=29) 23 42 2270 (n=37) 21 34 9280 (n=37) 16 31 6290 (n=25) 16 28 2300 (n=14) 18 26 5310 (n=6) 13 19 4320 (n=5) 15 25 4330 (n=2) 8 8 7340 (n=0)350 (n=3) 7 11 3