Embed Size (px)
Citation preview
क� द्र�य भू�म �ल बो
जल संसाधन, नद� �वकास और गंगा सरं�ण मतंाला
भारत सरकार Central Ground Water Board
Ministry of Water Resources, River Development and Ganga Rejuvenation
Government of India
Report on
AQUIFER MAPPING In Parts of Golapara, Kamrup and Bapeta
Districts,Assam
उ�र� पूव� �ेत, गवुाहाट�
North Eastern Region, Guwahati
Draft Report
AQUIFER MAPPING REPORT- 2012-14 1 | P a g e
Govt. of India Central Ground Water Board
Ministry of Water Resources, River Development & Ganga Rejuvenation
FLOOD PLAIN AQUIFER MAPPING IN
PARTS OF GOALPARA, KAMRUP AND BAPETA DISTRICTS, ASSAM
(AAP 2012-13 & 2013-14)
North Eastern Region Guwahati
March- 2016
For Official Use Only
AQUIFER MAPPING REPORT- 2012-14 2 | P a g e
AQUIFER MAPPING IN PARTS OF GOALPARA, KAMRUP AND BARPETA DISTRICTS, ASSAM
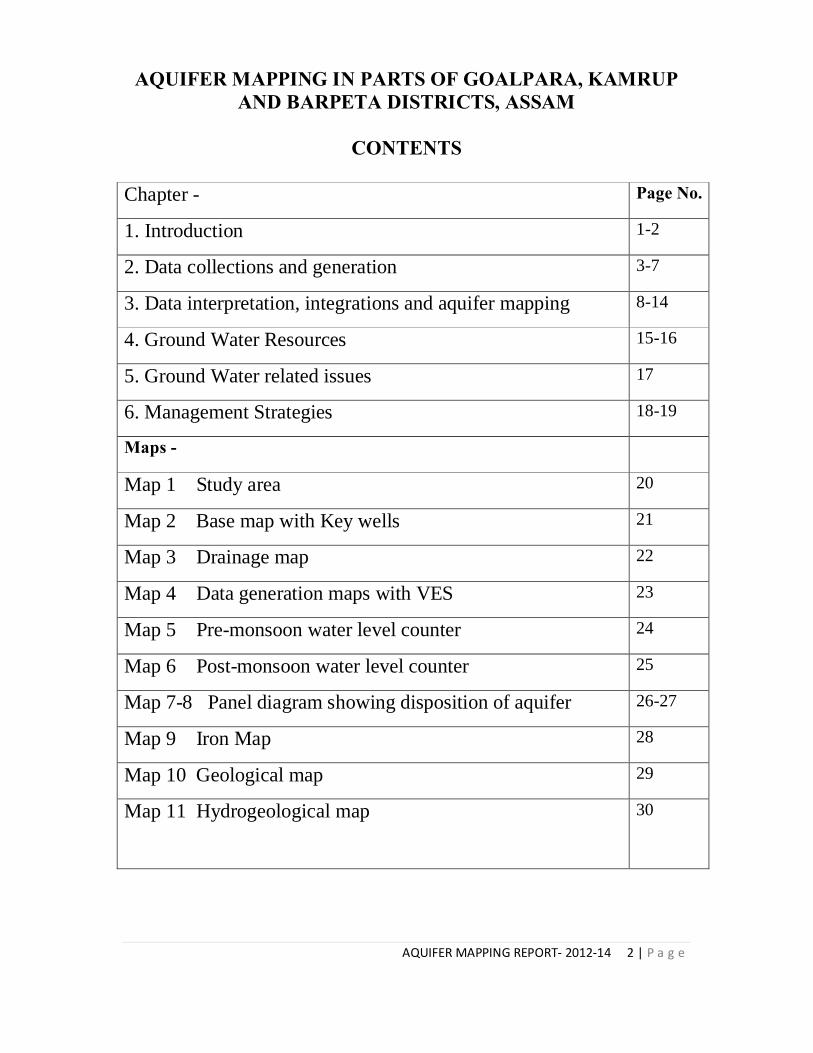
CONTENTS
Chapter - Page No.
1. Introduction 1-2
2. Data collections and generation 3-7
3. Data interpretation, integrations and aquifer mapping 8-14
4. Ground Water Resources 15-16
5. Ground Water related issues 17
6. Management Strategies 18-19
Maps -
Map 1 Study area 20
Map 2 Base map with Key wells 21
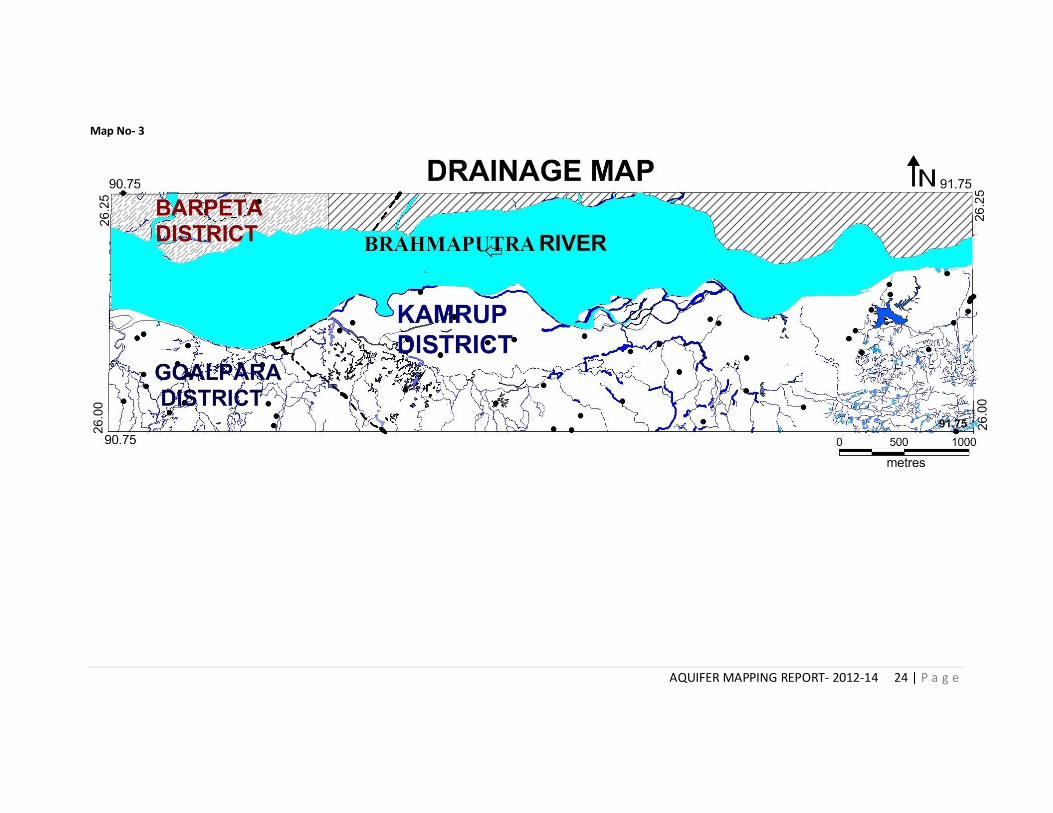
Map 3 Drainage map 22
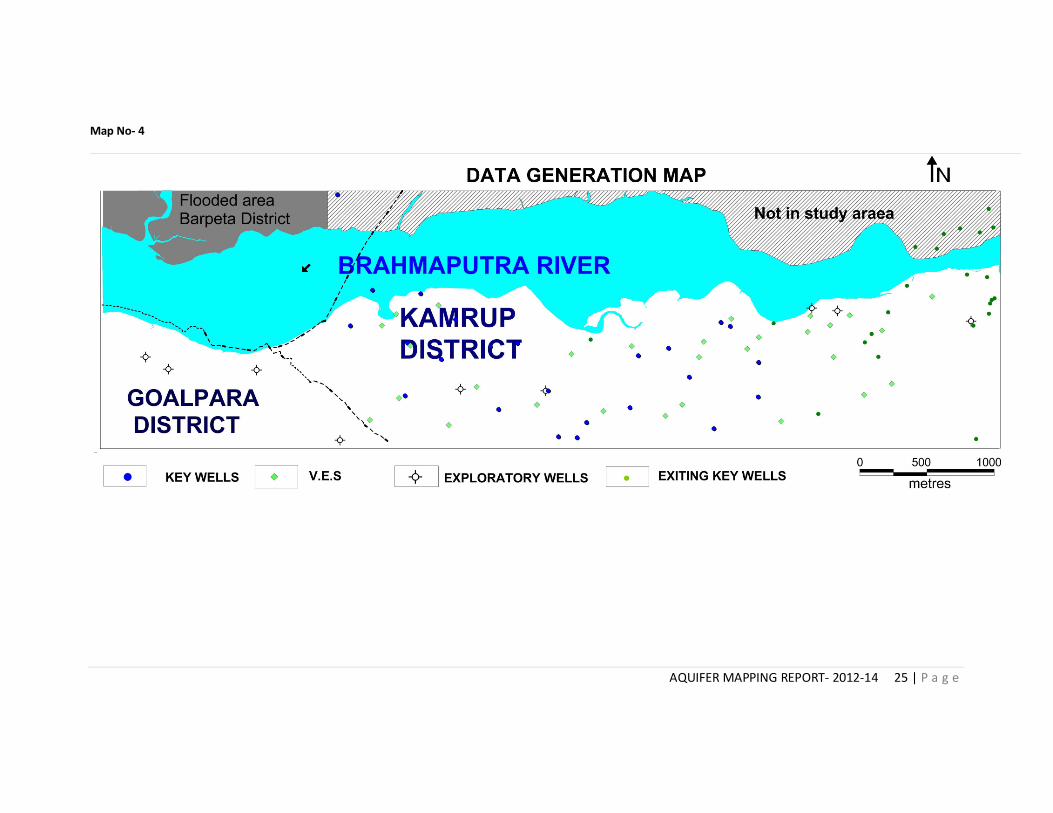
Map 4 Data generation maps with VES 23
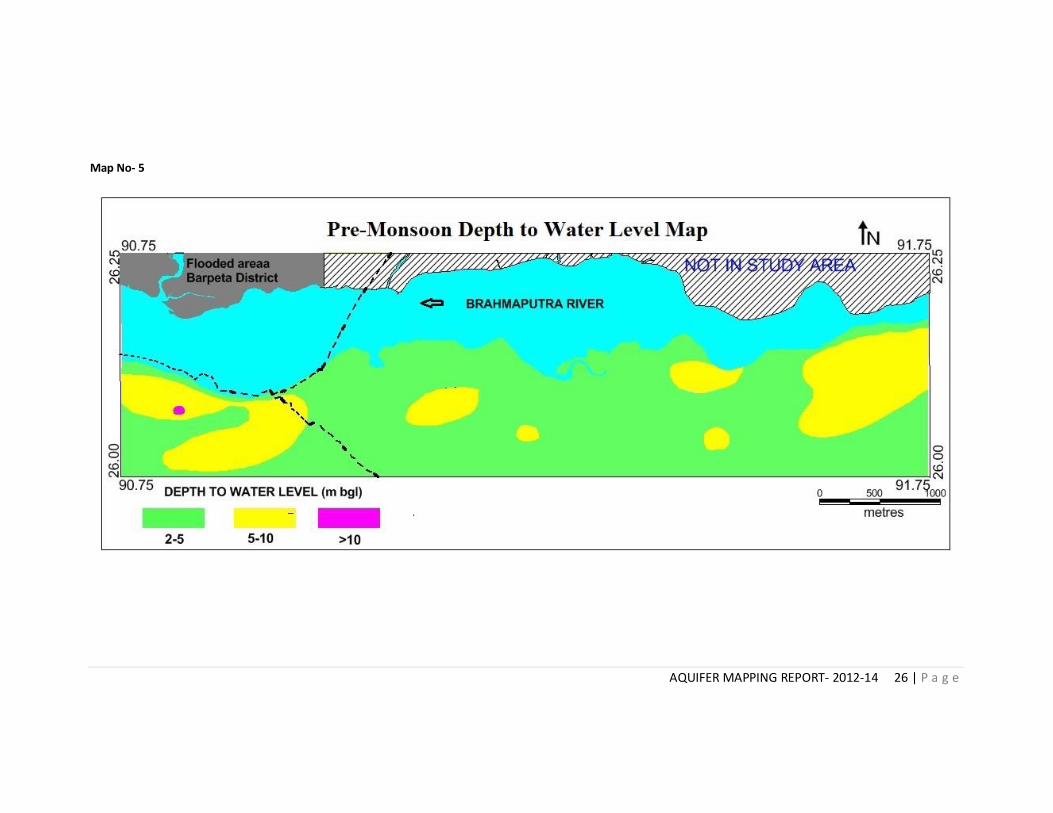
Map 5 Pre-monsoon water level counter 24
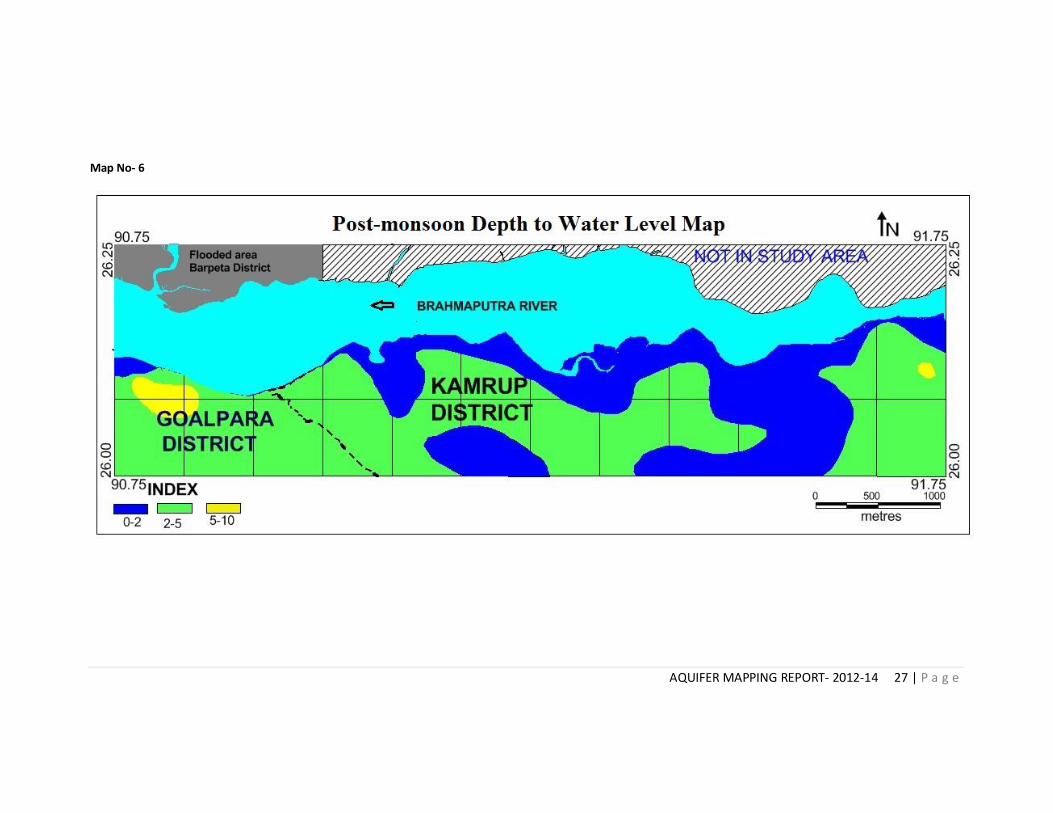
Map 6 Post-monsoon water level counter 25
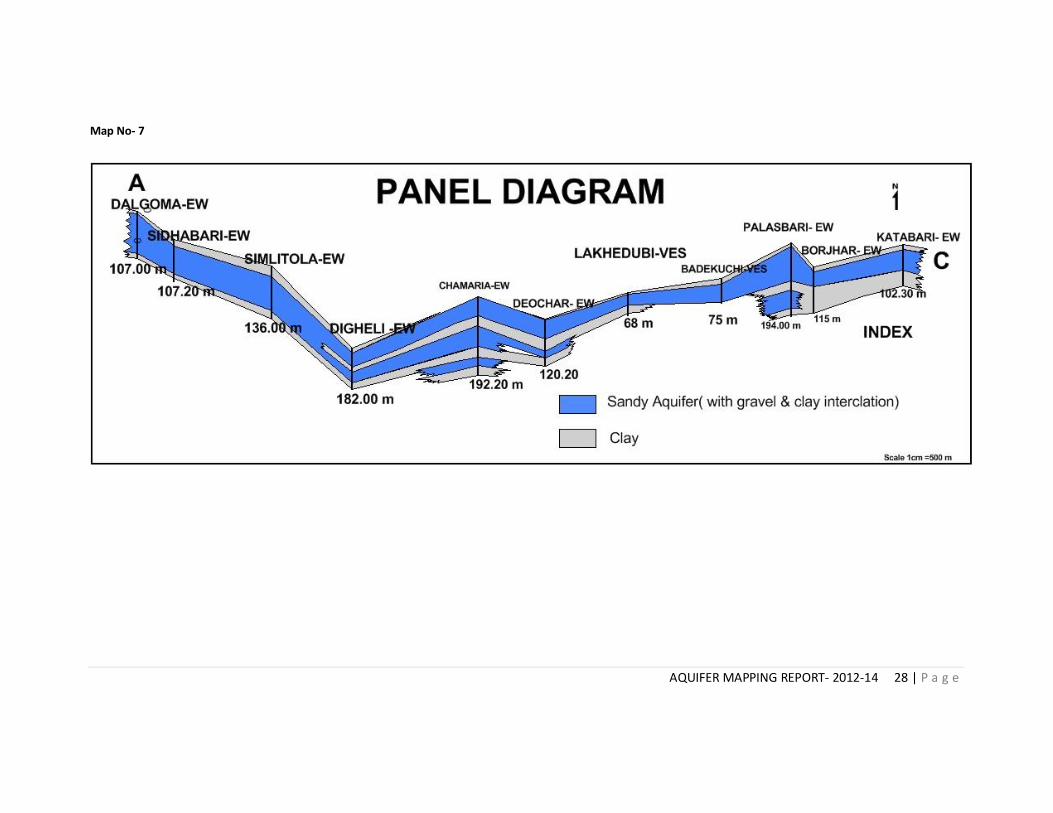
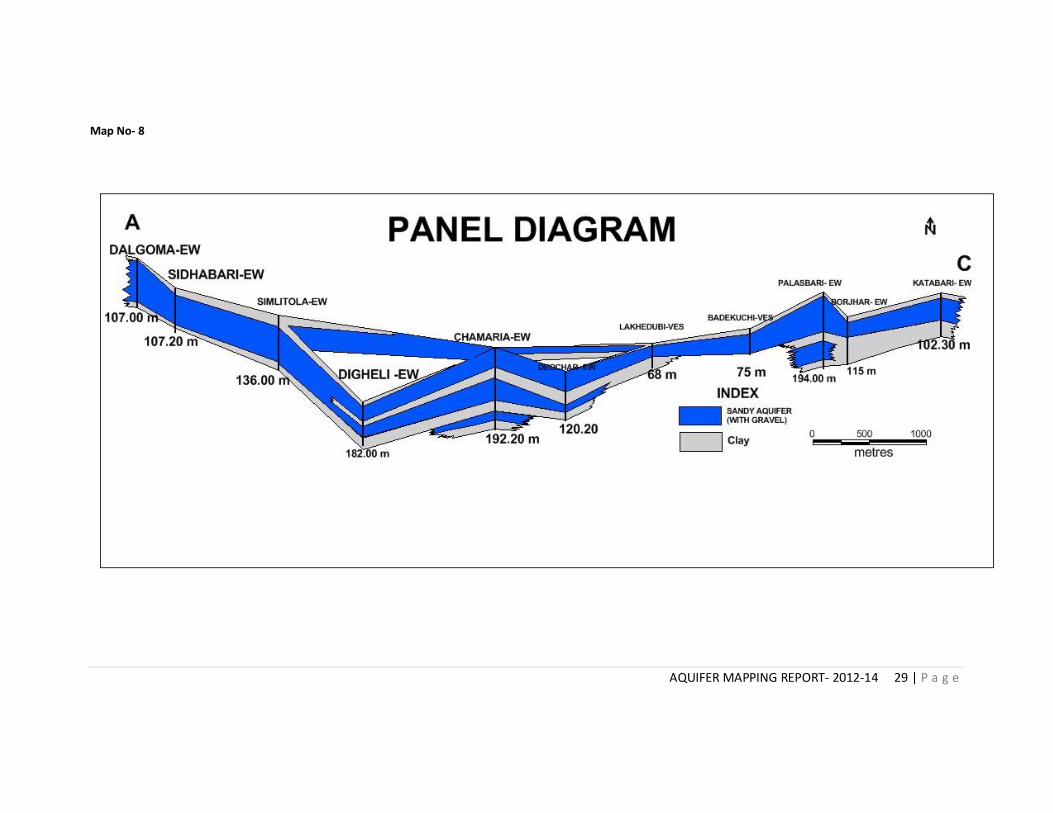
Map 7-8 Panel diagram showing disposition of aquifer 26-27
Map 9 Iron Map 28
Map 10 Geological map 29
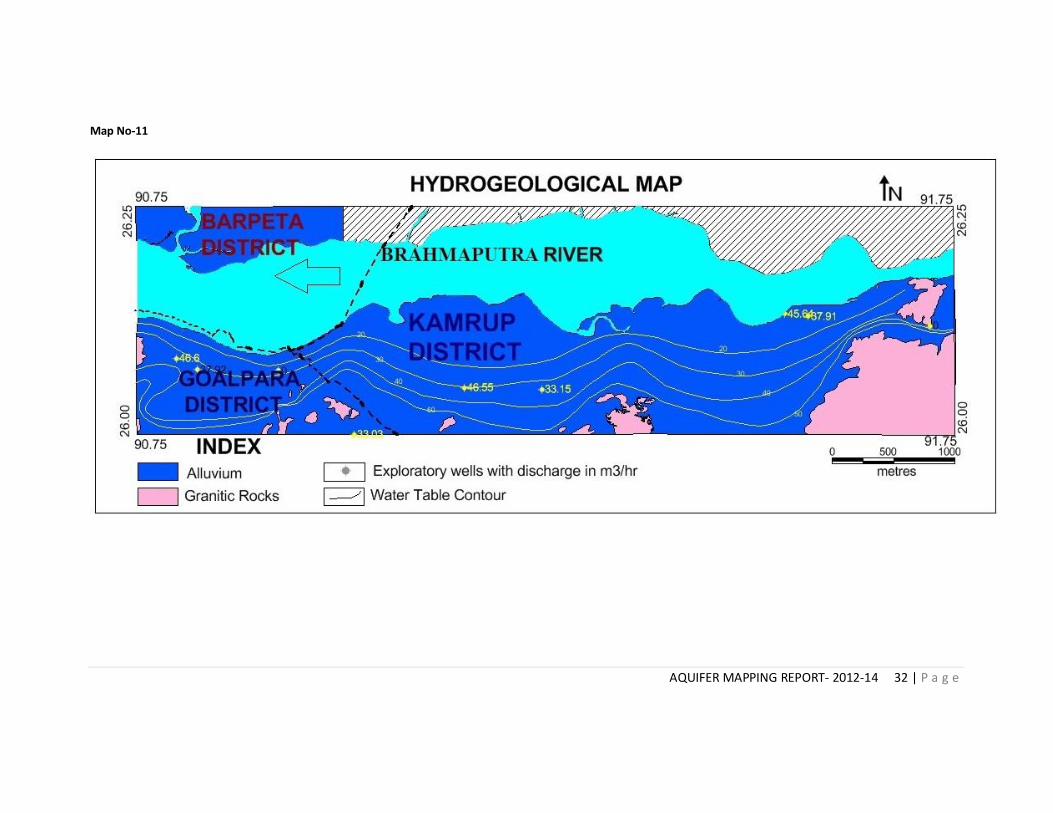
Map 11 Hydrogeological map
30
AQUIFER MAPPING REPORT- 2012-14 3 | P a g e
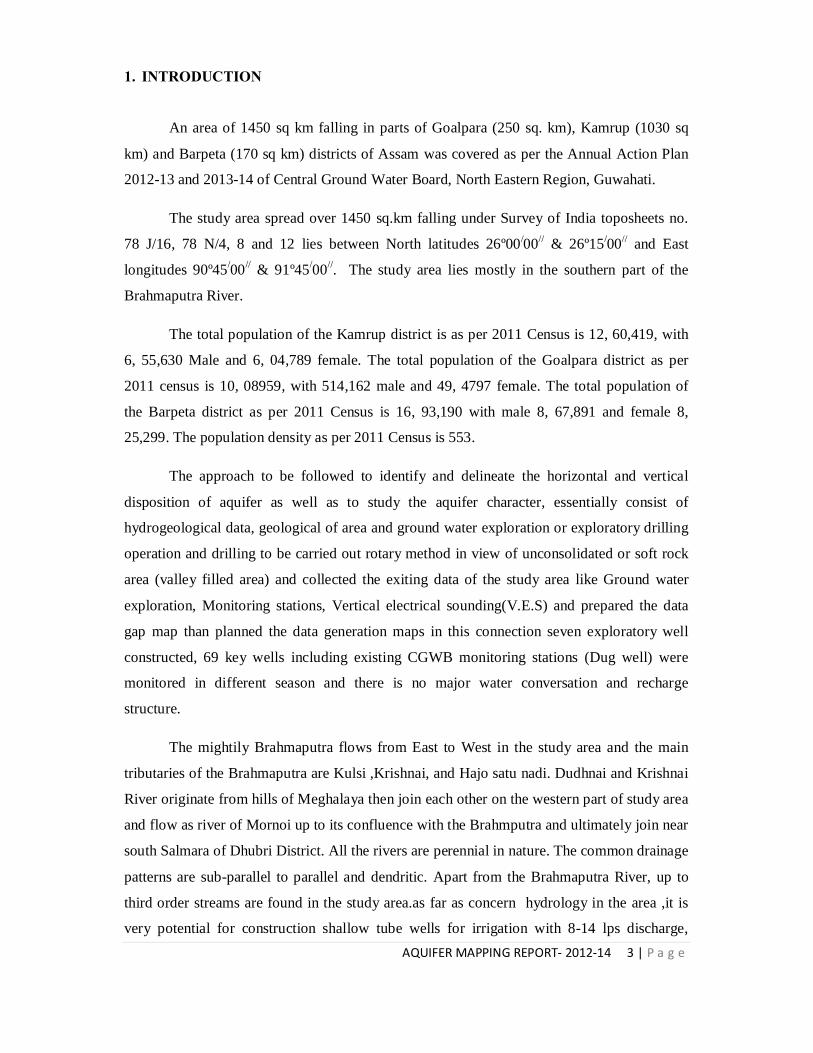
1. INTRODUCTION
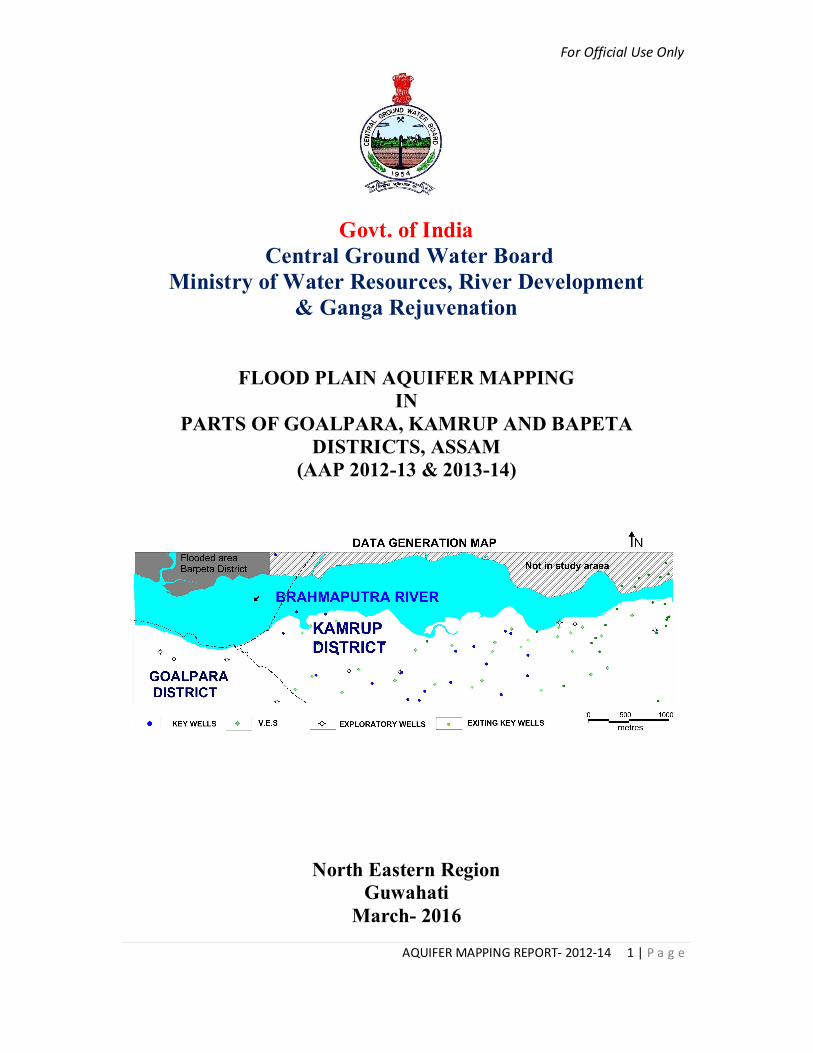
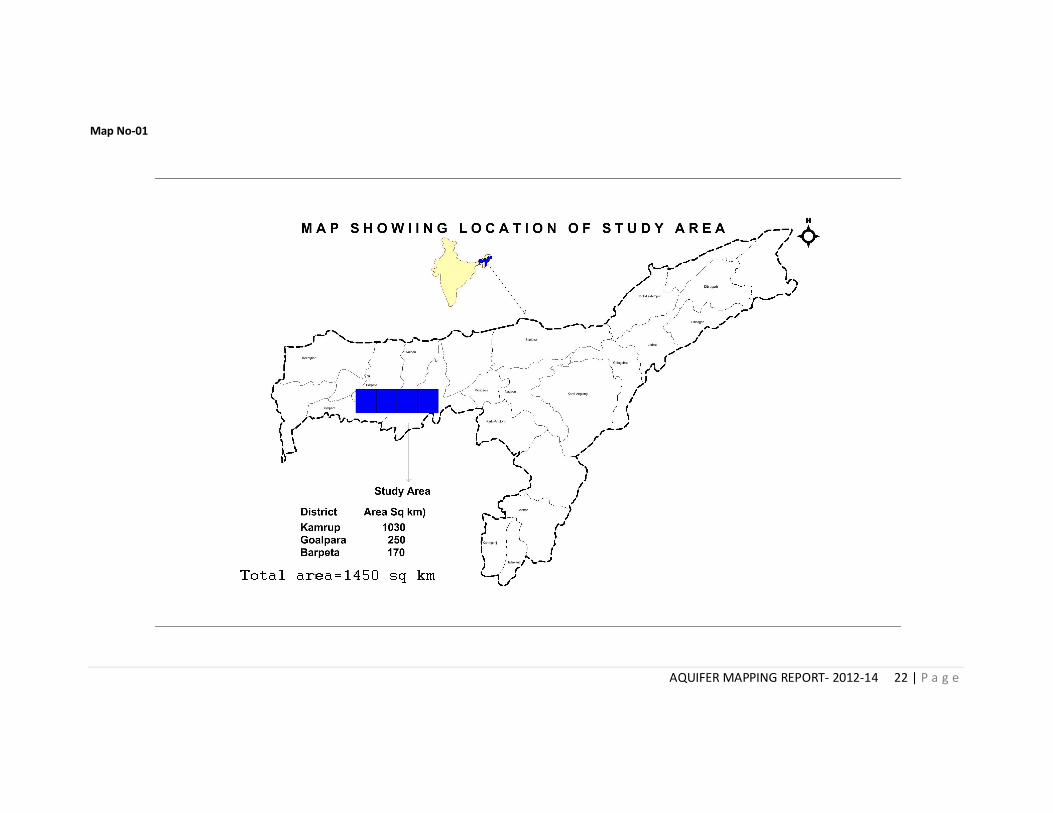
An area of 1450 sq km falling in parts of Goalpara (250 sq. km), Kamrup (1030 sq
km) and Barpeta (170 sq km) districts of Assam was covered as per the Annual Action Plan
2012-13 and 2013-14 of Central Ground Water Board, North Eastern Region, Guwahati.
The study area spread over 1450 sq.km falling under Survey of India toposheets no.
78 J/16, 78 N/4, 8 and 12 lies between North latitudes 26º00/00// & 26º15/00// and East
longitudes 90º45/00// & 91º45/00//. The study area lies mostly in the southern part of the
Brahmaputra River.
The total population of the Kamrup district is as per 2011 Census is 12, 60,419, with
6, 55,630 Male and 6, 04,789 female. The total population of the Goalpara district as per
2011 census is 10, 08959, with 514,162 male and 49, 4797 female. The total population of
the Barpeta district as per 2011 Census is 16, 93,190 with male 8, 67,891 and female 8,
25,299. The population density as per 2011 Census is 553.
The approach to be followed to identify and delineate the horizontal and vertical
disposition of aquifer as well as to study the aquifer character, essentially consist of
hydrogeological data, geological of area and ground water exploration or exploratory drilling
operation and drilling to be carried out rotary method in view of unconsolidated or soft rock
area (valley filled area) and collected the exiting data of the study area like Ground water
exploration, Monitoring stations, Vertical electrical sounding(V.E.S) and prepared the data
gap map than planned the data generation maps in this connection seven exploratory well
constructed, 69 key wells including existing CGWB monitoring stations (Dug well) were
monitored in different season and there is no major water conversation and recharge
structure.
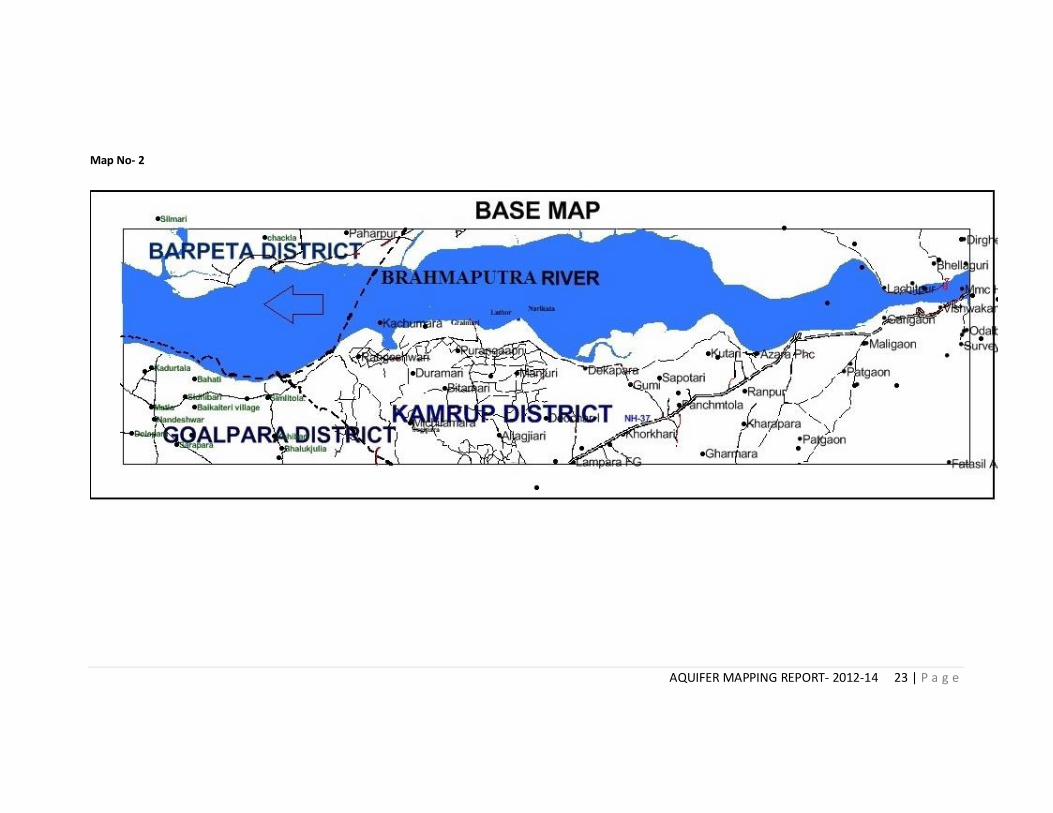
The mightily Brahmaputra flows from East to West in the study area and the main
tributaries of the Brahmaputra are Kulsi ,Krishnai, and Hajo satu nadi. Dudhnai and Krishnai
River originate from hills of Meghalaya then join each other on the western part of study area
and flow as river of Mornoi up to its confluence with the Brahmputra and ultimately join near
south Salmara of Dhubri District. All the rivers are perennial in nature. The common drainage
patterns are sub-parallel to parallel and dendritic. Apart from the Brahmaputra River, up to
third order streams are found in the study area.as far as concern hydrology in the area ,it is
very potential for construction shallow tube wells for irrigation with 8-14 lps discharge,
AQUIFER MAPPING REPORT- 2012-14 4 | P a g e
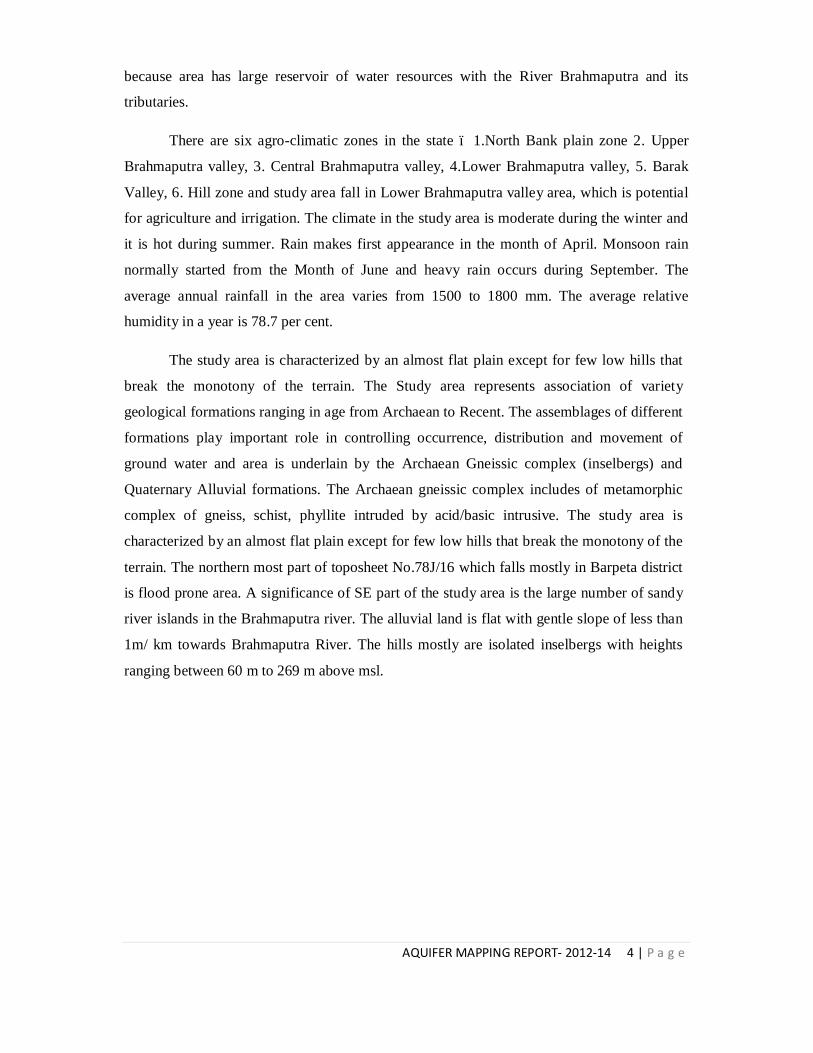
because area has large reservoir of water resources with the River Brahmaputra and its
tributaries.
There are six agro-climatic zones in the state – 1.North Bank plain zone 2. Upper
Brahmaputra valley, 3. Central Brahmaputra valley, 4.Lower Brahmaputra valley, 5. Barak
Valley, 6. Hill zone and study area fall in Lower Brahmaputra valley area, which is potential
for agriculture and irrigation. The climate in the study area is moderate during the winter and
it is hot during summer. Rain makes first appearance in the month of April. Monsoon rain
normally started from the Month of June and heavy rain occurs during September. The
average annual rainfall in the area varies from 1500 to 1800 mm. The average relative
humidity in a year is 78.7 per cent.
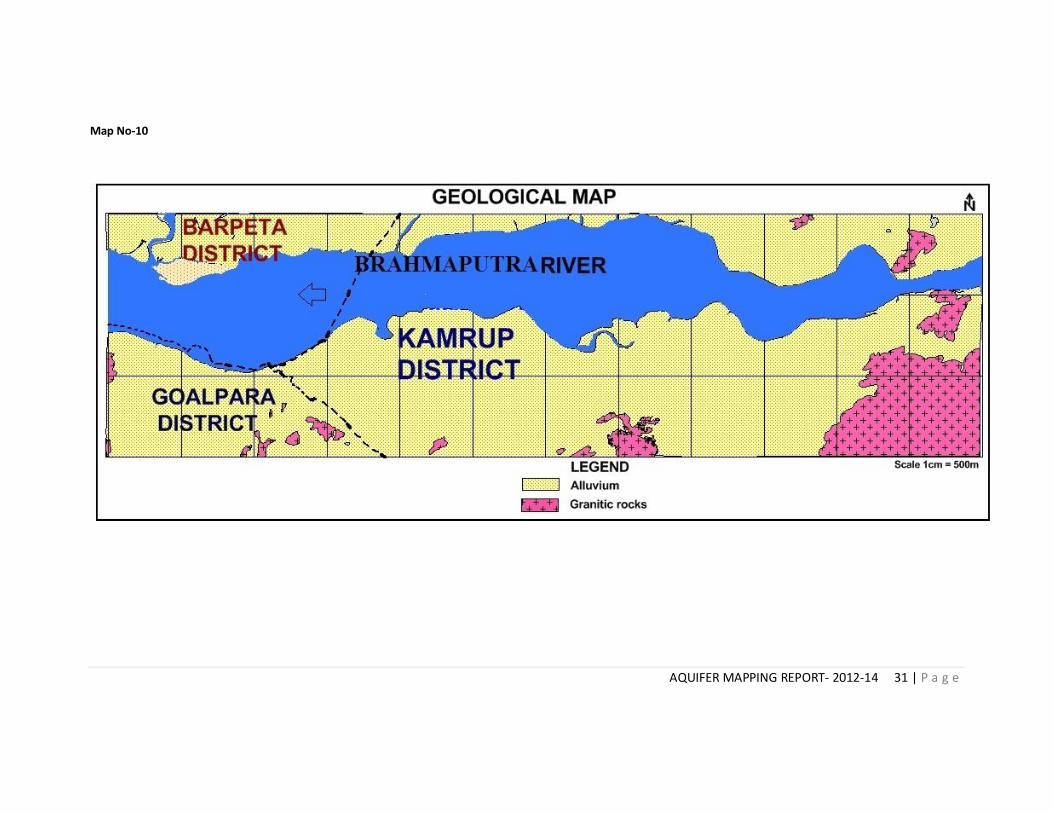
The study area is characterized by an almost flat plain except for few low hills that
break the monotony of the terrain. The Study area represents association of variety
geological formations ranging in age from Archaean to Recent. The assemblages of different
formations play important role in controlling occurrence, distribution and movement of
ground water and area is underlain by the Archaean Gneissic complex (inselbergs) and
Quaternary Alluvial formations. The Archaean gneissic complex includes of metamorphic
complex of gneiss, schist, phyllite intruded by acid/basic intrusive. The study area is
characterized by an almost flat plain except for few low hills that break the monotony of the
terrain. The northern most part of toposheet No.78J/16 which falls mostly in Barpeta district
is flood prone area. A significance of SE part of the study area is the large number of sandy
river islands in the Brahmaputra river. The alluvial land is flat with gentle slope of less than
1m/ km towards Brahmaputra River. The hills mostly are isolated inselbergs with heights
ranging between 60 m to 269 m above msl.
AQUIFER MAPPING REPORT- 2012-14 5 | P a g e
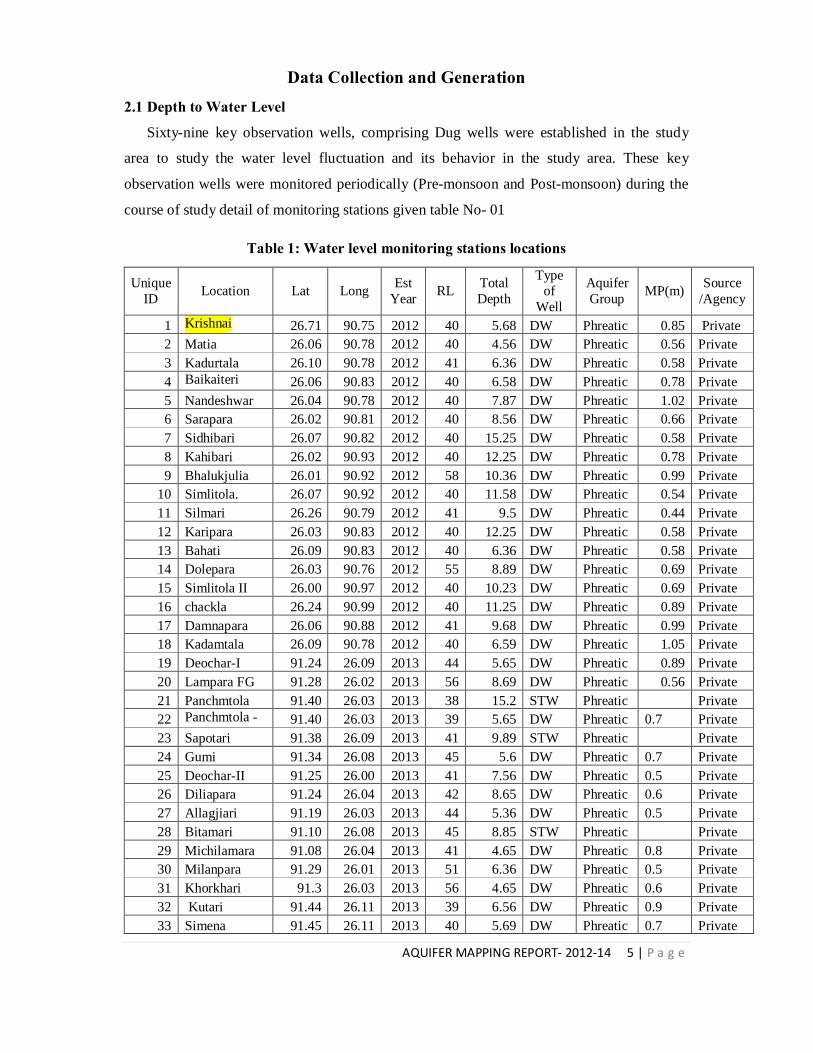
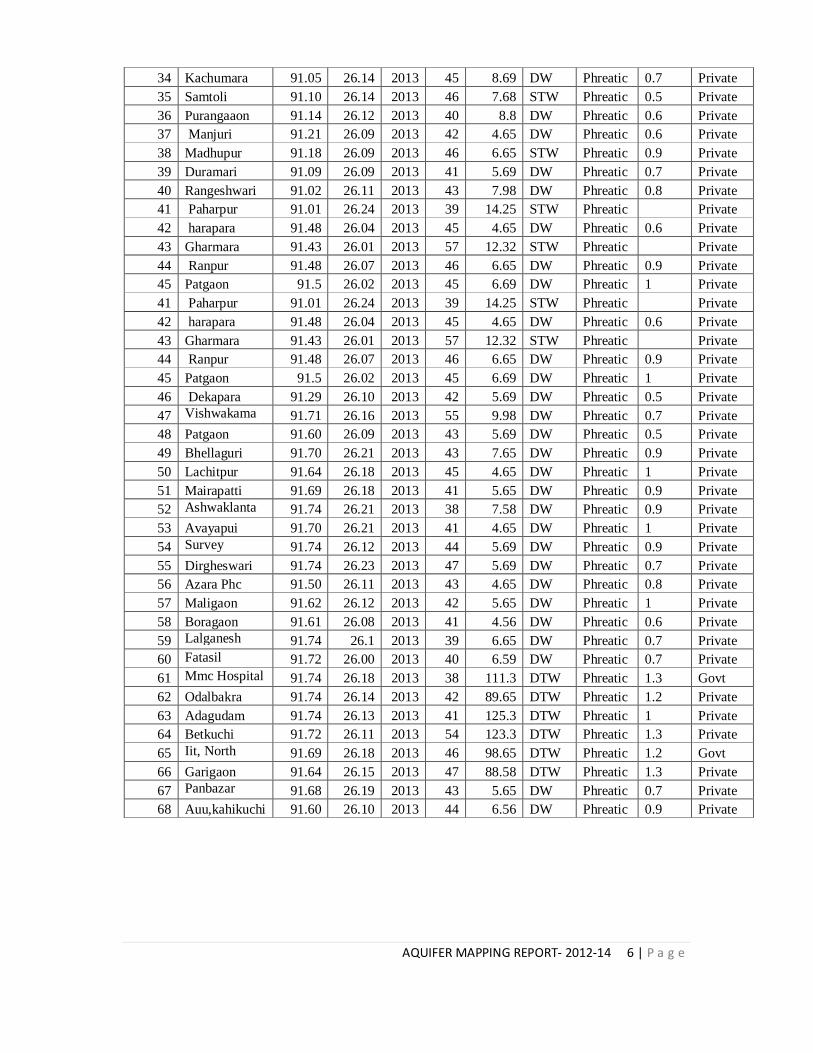
Data Collection and Generation 2.1 Depth to Water Level
Sixty-nine key observation wells, comprising Dug wells were established in the study
area to study the water level fluctuation and its behavior in the study area. These key
observation wells were monitored periodically (Pre-monsoon and Post-monsoon) during the
course of study detail of monitoring stations given table No- 01
Table 1: Water level monitoring stations locations
Unique ID Location Lat Long Est
Year RL Total Depth
Type of
Well
Aquifer Group MP(m) Source
/Agency
1 Krishnai Village
26.71 90.75 2012 40 5.68 DW Phreatic 0.85 Private 2 Matia 26.06 90.78 2012 40 4.56 DW Phreatic 0.56 Private 3 Kadurtala 26.10 90.78 2012 41 6.36 DW Phreatic 0.58 Private 4 Baikaiteri
village 26.06 90.83 2012 40 6.58 DW Phreatic 0.78 Private
5 Nandeshwar 26.04 90.78 2012 40 7.87 DW Phreatic 1.02 Private 6 Sarapara 26.02 90.81 2012 40 8.56 DW Phreatic 0.66 Private 7 Sidhibari 26.07 90.82 2012 40 15.25 DW Phreatic 0.58 Private 8 Kahibari 26.02 90.93 2012 40 12.25 DW Phreatic 0.78 Private 9 Bhalukjulia 26.01 90.92 2012 58 10.36 DW Phreatic 0.99 Private
10 Simlitola. 26.07 90.92 2012 40 11.58 DW Phreatic 0.54 Private 11 Silmari 26.26 90.79 2012 41 9.5 DW Phreatic 0.44 Private 12 Karipara 26.03 90.83 2012 40 12.25 DW Phreatic 0.58 Private 13 Bahati 26.09 90.83 2012 40 6.36 DW Phreatic 0.58 Private 14 Dolepara 26.03 90.76 2012 55 8.89 DW Phreatic 0.69 Private 15 Simlitola II 26.00 90.97 2012 40 10.23 DW Phreatic 0.69 Private 16 chackla 26.24 90.99 2012 40 11.25 DW Phreatic 0.89 Private 17 Damnapara 26.06 90.88 2012 41 9.68 DW Phreatic 0.99 Private 18 Kadamtala 26.09 90.78 2012 40 6.59 DW Phreatic 1.05 Private 19 Deochar-I 91.24 26.09 2013 44 5.65 DW Phreatic 0.89 Private 20 Lampara FG 91.28 26.02 2013 56 8.69 DW Phreatic 0.56 Private 21 Panchmtola 91.40 26.03 2013 38 15.2 STW Phreatic Private 22 Panchmtola -
FG 91.40 26.03 2013 39 5.65 DW Phreatic 0.7 Private
23 Sapotari 91.38 26.09 2013 41 9.89 STW Phreatic Private 24 Gumi 91.34 26.08 2013 45 5.6 DW Phreatic 0.7 Private 25 Deochar-II 91.25 26.00 2013 41 7.56 DW Phreatic 0.5 Private 26 Diliapara 91.24 26.04 2013 42 8.65 DW Phreatic 0.6 Private 27 Allagjiari 91.19 26.03 2013 44 5.36 DW Phreatic 0.5 Private 28 Bitamari 91.10 26.08 2013 45 8.85 STW Phreatic Private 29 Michilamara 91.08 26.04 2013 41 4.65 DW Phreatic 0.8 Private 30 Milanpara 91.29 26.01 2013 51 6.36 DW Phreatic 0.5 Private 31 Khorkhari 91.3 26.03 2013 56 4.65 DW Phreatic 0.6 Private 32 Kutari 91.44 26.11 2013 39 6.56 DW Phreatic 0.9 Private 33 Simena 91.45 26.11 2013 40 5.69 DW Phreatic 0.7 Private
AQUIFER MAPPING REPORT- 2012-14 6 | P a g e
34 Kachumara 91.05 26.14 2013 45 8.69 DW Phreatic 0.7 Private 35 Samtoli 91.10 26.14 2013 46 7.68 STW Phreatic 0.5 Private 36 Purangaaon 91.14 26.12 2013 40 8.8 DW Phreatic 0.6 Private 37 Manjuri 91.21 26.09 2013 42 4.65 DW Phreatic 0.6 Private 38 Madhupur 91.18 26.09 2013 46 6.65 STW Phreatic 0.9 Private 39 Duramari 91.09 26.09 2013 41 5.69 DW Phreatic 0.7 Private 40 Rangeshwari 91.02 26.11 2013 43 7.98 DW Phreatic 0.8 Private 41 Paharpur 91.01 26.24 2013 39 14.25 STW Phreatic Private 42 harapara 91.48 26.04 2013 45 4.65 DW Phreatic 0.6 Private 43 Gharmara 91.43 26.01 2013 57 12.32 STW Phreatic Private 44 Ranpur 91.48 26.07 2013 46 6.65 DW Phreatic 0.9 Private 45 Patgaon 91.5 26.02 2013 45 6.69 DW Phreatic 1 Private 41 Paharpur 91.01 26.24 2013 39 14.25 STW Phreatic Private 42 harapara 91.48 26.04 2013 45 4.65 DW Phreatic 0.6 Private 43 Gharmara 91.43 26.01 2013 57 12.32 STW Phreatic Private 44 Ranpur 91.48 26.07 2013 46 6.65 DW Phreatic 0.9 Private 45 Patgaon 91.5 26.02 2013 45 6.69 DW Phreatic 1 Private 46 Dekapara 91.29 26.10 2013 42 5.69 DW Phreatic 0.5 Private 47 Vishwakama
Temple 91.71 26.16 2013 55 9.98 DW Phreatic 0.7 Private
48 Patgaon 91.60 26.09 2013 43 5.69 DW Phreatic 0.5 Private 49 Bhellaguri 91.70 26.21 2013 43 7.65 DW Phreatic 0.9 Private 50 Lachitpur 91.64 26.18 2013 45 4.65 DW Phreatic 1 Private 51 Mairapatti 91.69 26.18 2013 41 5.65 DW Phreatic 0.9 Private 52 Ashwaklanta
Temple 91.74 26.21 2013 38 7.58 DW Phreatic 0.9 Private
53 Avayapui 91.70 26.21 2013 41 4.65 DW Phreatic 1 Private 54 Survey
Odalbakra 91.74 26.12 2013 44 5.69 DW Phreatic 0.9 Private
55 Dirgheswari 91.74 26.23 2013 47 5.69 DW Phreatic 0.7 Private 56 Azara Phc 91.50 26.11 2013 43 4.65 DW Phreatic 0.8 Private 57 Maligaon 91.62 26.12 2013 42 5.65 DW Phreatic 1 Private 58 Boragaon 91.61 26.08 2013 41 4.56 DW Phreatic 0.6 Private 59 Lalganesh
Chariali 91.74 26.1 2013 39 6.65 DW Phreatic 0.7 Private
60 Fatasil Ambari
91.72 26.00 2013 40 6.59 DW Phreatic 0.7 Private 61 Mmc Hospital
Panbazar 91.74 26.18 2013 38 111.3 DTW Phreatic 1.3 Govt
62 Odalbakra 91.74 26.14 2013 42 89.65 DTW Phreatic 1.2 Private 63 Adagudam 91.74 26.13 2013 41 125.3 DTW Phreatic 1 Private 64 Betkuchi 91.72 26.11 2013 54 123.3 DTW Phreatic 1.3 Private 65 Iit, North
Guwahati 91.69 26.18 2013 46 98.65 DTW Phreatic 1.2 Govt
66 Garigaon 91.64 26.15 2013 47 88.58 DTW Phreatic 1.3 Private 67 Panbazar
Circuit House 91.68 26.19 2013 43 5.65 DW Phreatic 0.7 Private
68 Auu,kahikuchi 91.60 26.10 2013 44 6.56 DW Phreatic 0.9 Private
AQUIFER MAPPING REPORT- 2012-14 7 | P a g e
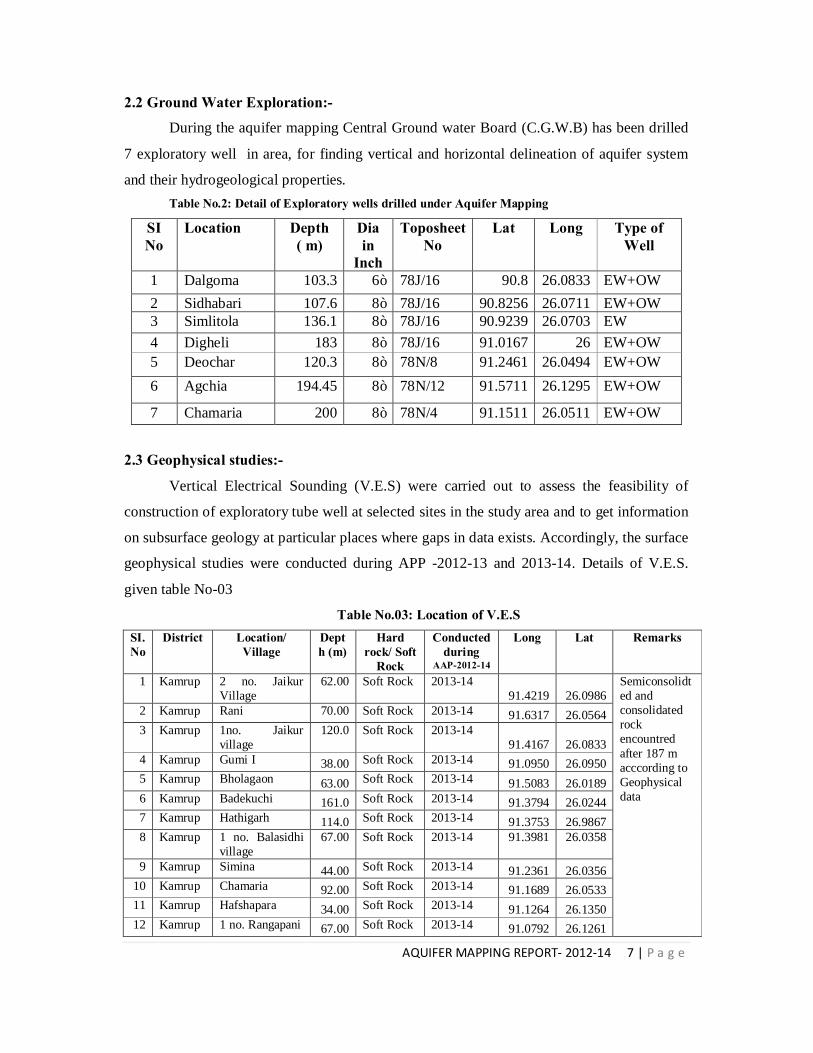
2.2 Ground Water Exploration:-
During the aquifer mapping Central Ground water Board (C.G.W.B) has been drilled
7 exploratory well in area, for finding vertical and horizontal delineation of aquifer system
and their hydrogeological properties. Table No.2: Detail of Exploratory wells drilled under Aquifer Mapping
SI No
Location Depth ( m)
Dia in
Inch
Toposheet No
Lat Long Type of Well
1 Dalgoma 103.3 6” 78J/16 90.8 26.0833 EW+OW 2 Sidhabari 107.6 8” 78J/16 90.8256 26.0711 EW+OW 3 Simlitola 136.1 8” 78J/16 90.9239 26.0703 EW 4 Digheli 183 8” 78J/16 91.0167 26 EW+OW 5 Deochar 120.3 8” 78N/8 91.2461 26.0494 EW+OW 6 Agchia 194.45 8” 78N/12 91.5711 26.1295 EW+OW
7 Chamaria 200 8” 78N/4 91.1511 26.0511 EW+OW
2.3 Geophysical studies:- Vertical Electrical Sounding (V.E.S) were carried out to assess the feasibility of
construction of exploratory tube well at selected sites in the study area and to get information
on subsurface geology at particular places where gaps in data exists. Accordingly, the surface
geophysical studies were conducted during APP -2012-13 and 2013-14. Details of V.E.S.
given table No-03
Table No.03: Location of V.E.S SI. No
District Location/ Village
Depth (m)
Hard rock/ Soft
Rock
Conducted during
AAP-2012-14
Long Lat Remarks
1 Kamrup 2 no. Jaikur Village
62.00 Soft Rock 2013-14 91.4219 26.0986
Semiconsolidted and consolidated rock encountred after 187 m acccording to Geophysical data
2 Kamrup Rani 70.00 Soft Rock 2013-14 91.6317 26.0564 3 Kamrup 1no. Jaikur
village 120.0 Soft Rock 2013-14
91.4167 26.0833 4 Kamrup Gumi I 38.00 Soft Rock 2013-14 91.0950 26.0950 5 Kamrup Bholagaon 63.00 Soft Rock 2013-14 91.5083 26.0189 6 Kamrup Badekuchi 161.0 Soft Rock 2013-14 91.3794 26.0244 7 Kamrup Hathigarh 114.0 Soft Rock 2013-14 91.3753 26.9867 8 Kamrup 1 no. Balasidhi
village 67.00 Soft Rock 2013-14 91.3981 26.0358
9 Kamrup Simina 44.00 Soft Rock 2013-14 91.2361 26.0356 10 Kamrup Chamaria 92.00 Soft Rock 2013-14 91.1689 26.0533 11 Kamrup Hafshapara 34.00 Soft Rock 2013-14 91.1264 26.1350 12 Kamrup 1 no. Rangapani 67.00 Soft Rock 2013-14 91.0792 26.1261
AQUIFER MAPPING REPORT- 2012-14 8 | P a g e
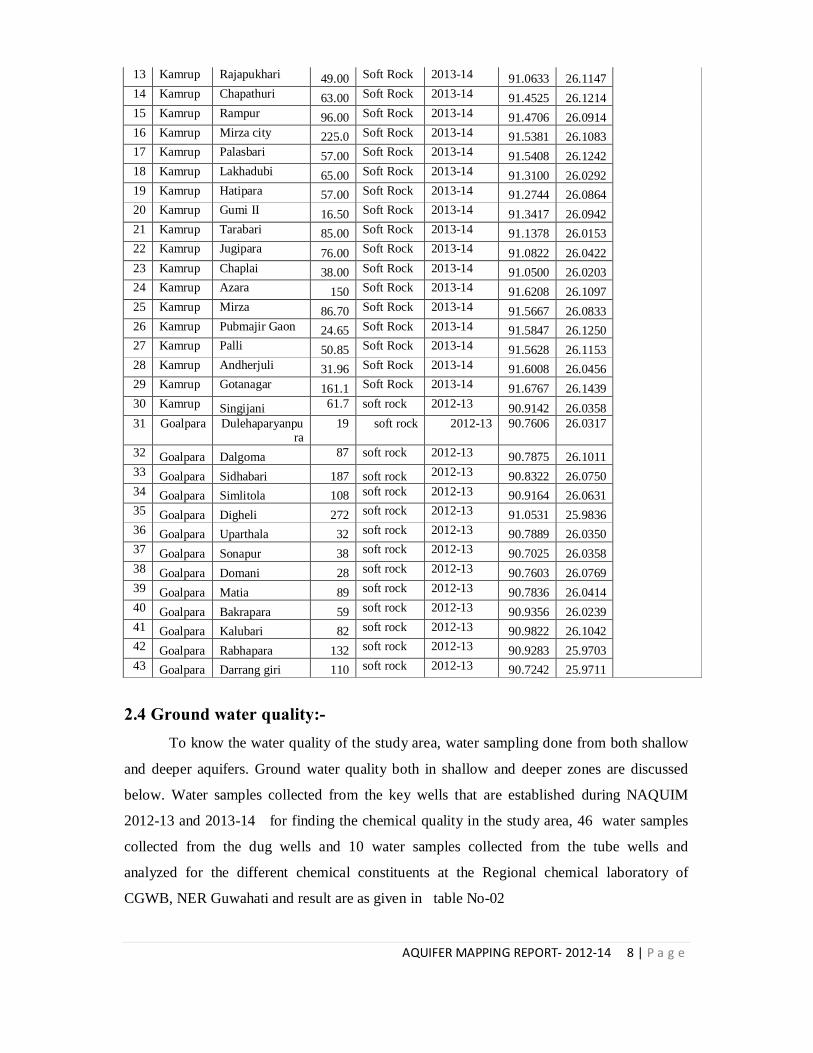
13 Kamrup Rajapukhari 49.00 Soft Rock 2013-14 91.0633 26.1147 14 Kamrup Chapathuri 63.00 Soft Rock 2013-14 91.4525 26.1214 15 Kamrup Rampur 96.00 Soft Rock 2013-14 91.4706 26.0914 16 Kamrup Mirza city 225.0 Soft Rock 2013-14 91.5381 26.1083 17 Kamrup Palasbari 57.00 Soft Rock 2013-14 91.5408 26.1242 18 Kamrup Lakhadubi 65.00 Soft Rock 2013-14 91.3100 26.0292 19 Kamrup Hatipara 57.00 Soft Rock 2013-14 91.2744 26.0864 20 Kamrup Gumi II 16.50 Soft Rock 2013-14 91.3417 26.0942 21 Kamrup Tarabari 85.00 Soft Rock 2013-14 91.1378 26.0153 22 Kamrup Jugipara 76.00 Soft Rock 2013-14 91.0822 26.0422 23 Kamrup Chaplai 38.00 Soft Rock 2013-14 91.0500 26.0203 24 Kamrup Azara 150 Soft Rock 2013-14 91.6208 26.1097 25 Kamrup Mirza 86.70 Soft Rock 2013-14 91.5667 26.0833 26 Kamrup Pubmajir Gaon 24.65 Soft Rock 2013-14 91.5847 26.1250 27 Kamrup Palli 50.85 Soft Rock 2013-14 91.5628 26.1153 28 Kamrup Andherjuli 31.96 Soft Rock 2013-14 91.6008 26.0456 29 Kamrup Gotanagar 161.1 Soft Rock 2013-14 91.6767 26.1439 30 Kamrup Singijani 61.7 soft rock 2012-13 90.9142 26.0358 31 Goalpara Dulehaparyanpu
ra 19 soft rock 2012-13 90.7606 26.0317
32 Goalpara Dalgoma 87 soft rock 2012-13 90.7875 26.1011 33 Goalpara Sidhabari 187 soft rock 2012-13 90.8322 26.0750 34 Goalpara Simlitola 108 soft rock 2012-13 90.9164 26.0631 35 Goalpara Digheli 272 soft rock 2012-13 91.0531 25.9836 36 Goalpara Uparthala 32 soft rock 2012-13 90.7889 26.0350 37 Goalpara Sonapur 38 soft rock 2012-13 90.7025 26.0358 38 Goalpara Domani 28 soft rock 2012-13 90.7603 26.0769 39 Goalpara Matia 89 soft rock 2012-13 90.7836 26.0414 40 Goalpara Bakrapara 59 soft rock 2012-13 90.9356 26.0239 41 Goalpara Kalubari 82 soft rock 2012-13 90.9822 26.1042 42 Goalpara Rabhapara 132 soft rock 2012-13 90.9283 25.9703 43 Goalpara Darrang giri 110 soft rock 2012-13 90.7242 25.9711
2.4 Ground water quality:- To know the water quality of the study area, water sampling done from both shallow
and deeper aquifers. Ground water quality both in shallow and deeper zones are discussed
below. Water samples collected from the key wells that are established during NAQUIM
2012-13 and 2013-14 for finding the chemical quality in the study area, 46 water samples
collected from the dug wells and 10 water samples collected from the tube wells and
analyzed for the different chemical constituents at the Regional chemical laboratory of
CGWB, NER Guwahati and result are as given in table No-02
AQUIFER MAPPING REPORT- 2012-14 9 | P a g e
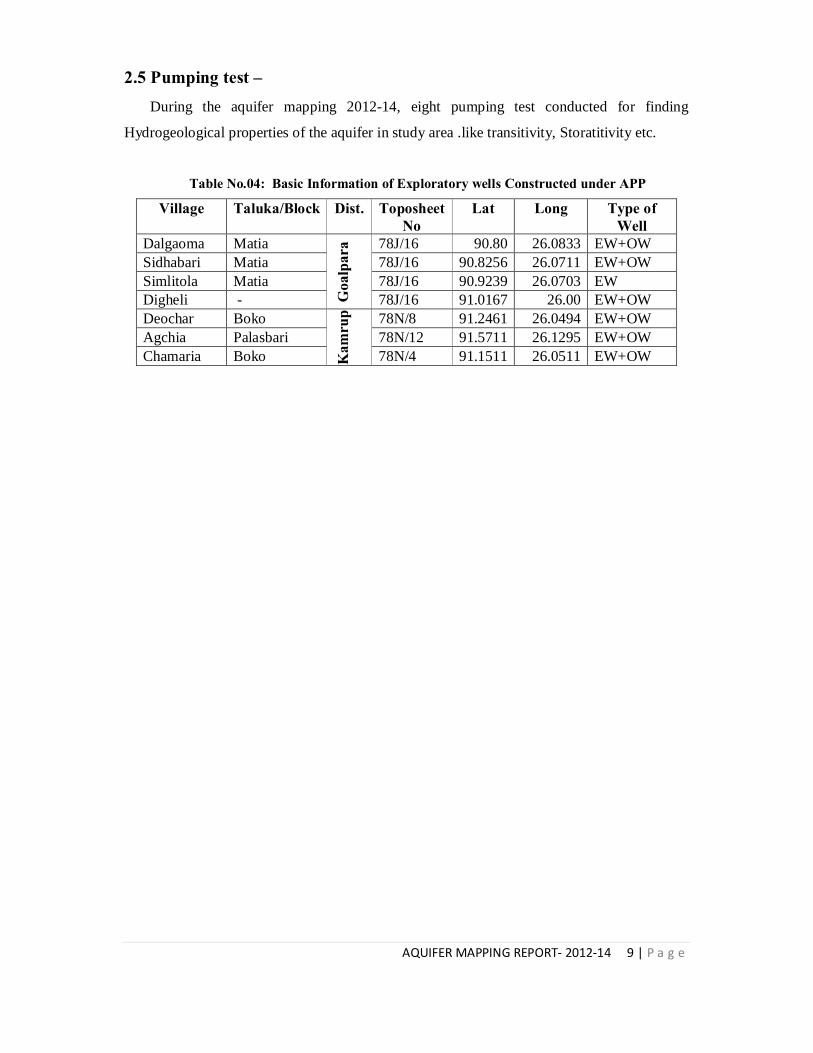
2.5 Pumping test – During the aquifer mapping 2012-14, eight pumping test conducted for finding
Hydrogeological properties of the aquifer in study area .like transitivity, Storatitivity etc.
Table No.04: Basic Information of Exploratory wells Constructed under APP
Village Taluka/Block Dist. Toposheet No
Lat Long Type of Well
Dalgaoma Matia
Goa
lpar
a 78J/16 90.80 26.0833 EW+OW Sidhabari Matia 78J/16 90.8256 26.0711 EW+OW Simlitola Matia 78J/16 90.9239 26.0703 EW Digheli - 78J/16 91.0167 26.00 EW+OW Deochar Boko
Kam
rup 78N/8 91.2461 26.0494 EW+OW
Agchia Palasbari 78N/12 91.5711 26.1295 EW+OW Chamaria Boko 78N/4 91.1511 26.0511 EW+OW
AQUIFER MAPPING REPORT- 2012-14 10 | P a g e
3. Data Interpretation, Integration and Aquifer Mapping- 3.1 Depth to Water Level -
Sixty-nine key wells have been monitored during the aquifer mapping and water level
(W.L.) ranges from 0.50 to 4.64 m bgl during post-monsoon and water level ranges from 1.00
to 7.85 m bgl during pre-monsoon. In major part of the study area, seasonal fluctuation varies
from 0.22 m at Maligaon to 4.12 m at Azara. Prepared the pre-monsoon and post-monsoon
contour map, most of the key wells W.L. data and water level contour maps are showing
water level varies between 2 to 5 m bgl in the study area except inselbergs area. The details
of key wells have given in table no 01.
3.2 Ground Water Exploration:-
It can be deciphered from the litholog of different exploratory wells drilled by
C.G.W.B. that EW show in regional scale mono aquifer system occur in the area. The aquifer
is comprised mainly of medium to coarse sand. This sandy aquifer is having gravel and clay
intercalations in places. In some places due to the presence of clay intercalations, 2 to 4
granular zones occur in the study area. Separations of two or more granular zones by clay
beds often misguide to classify the aquifers into a multiple aquifer system. However, these
clay beds are mostly in lensoid shape and they pinches out within a short distance. Thickness
of the saturated zone varies from 50 to 100 m within a depth range of 160m. The isopach map
of this aquifer shows that isopach value increases towards north of the study area i.e., towards
the Brahmaputra flood plain. Eight pumping has conducted during the aquifer mapping in
area, details of pumping test given below. The deep tube wells constructed by CGWB show
yield of 33 to 46 m3/hr for a drawdown of 2.46 to 7.46 m (maximum drawdown observed
near inselbergs). Details of aquifer parameter given table no 02.
3.3 Geophysical studies:-
Forty-three Vertical Electrical Sounding (V.E.S.) under surface geophysical studies
conducted during APP -2012-13 and 2013-14. By Mr. S.K Pali-Sc-C and Mr.P.P.Dookia
STA Geophysicist, According to the results of interpretation of V.E.S curves, correlation of
the data with hydrogeological details of exploratory boreholes and taking into account the
apparent resistivity following conclusions have been drawn in respects of parts of Kamrup
distt.:
AQUIFER MAPPING REPORT- 2012-14 11 | P a g e
1. The top soil with resistivity in the range of 100 and 270 Ohm with thickness within
10m comprises top soil with clays / hard clays etc.. 2. The underlying layers below the top soil in the depth below the top soil layer with
varying resistivity within 100 Ohm m in general is indicative of sandy formation
intercalated with clays / hard clays etc. Comparatively high resistivity above 100 Ohm
m is indicative of the hard clay/semi-consolidated or consolidated formation. 3. The inferences for bottom portion are drawn on the basis of interpreted results of
surface resistivity surveys, apparent resistivity pertaining to extreme portion of VES
curves and hydrogeological data.
The VES locations are shown in Map No-05.During the survey H, HK, HA type VES
curves were obtained. The inferences drawn on the basis of interpreted results could not be
obtained for deeper formation due to the limitations of unavailability of large and straight
stretch for current electrode separation. Interpreted results of VES and inferences with respect
to possible sub-surface geology.
AQUIFER MAPPING REPORT- 2012-14 12 | P a g e
3.4 Aquifer Geometry:-
The main objective of the study is to delineate the horizontal and vertical disposition
of aquifer as well as to study the aquifer character. In this connection 69 key wells including
existing CGWB monitoring stations (Dug well & Tube well) were monitored in different
season. Locations of the monitoring stations were shown in Map No-02 & 05. To know the
aquifer disposition in the study area, exploratory wells data, V.E.S. data available with
CGWB and some data of state departments, Govt. of Assam were utilized.
CGWB has drilled 16 EWs within a depth range of 94 to 220 m. A thin layer of
discontinuous clay beds occur at surface all over the alluvial deposit ranging in thickness
from 5 to 10 m. The tube wells drilled in alluvial deposits show alternate thick beds of sand,
gravel and thin beds of clay.
It can be deciphered from the lithologs of different exploratory wells drilled by
C.G.W.B. that EW show that in regional scale mono aquifer system occur in the area. The
aquifer is comprised mainly of medium to coarse sand. This sandy aquifer is having gravel
and clay intercalations in places to place. In some places due to the presence of clay
intercalations 2 to 4 granular zones occur in the study area. Separations of two or more
granular zones by clay beds often misguide to classify the aquifers into a multiple aquifer
system. However, these clay beds are mostly in lensoid shape and they pinches out within a
short distance. Thickness of the saturated zone varies from 50 to 100 m within a depth range
of 160m. The isopach map of this aquifer shows that isopach value increases towards north of
the study area i.e., towards the Brahmaputra flood plain. The deep tube wells constructed by
C.G.W.B. show yield of 33 to 46 m3/hr for a drawdown of 2.46 to 7.46 m (maximum
drawdown observed near inselbergs).
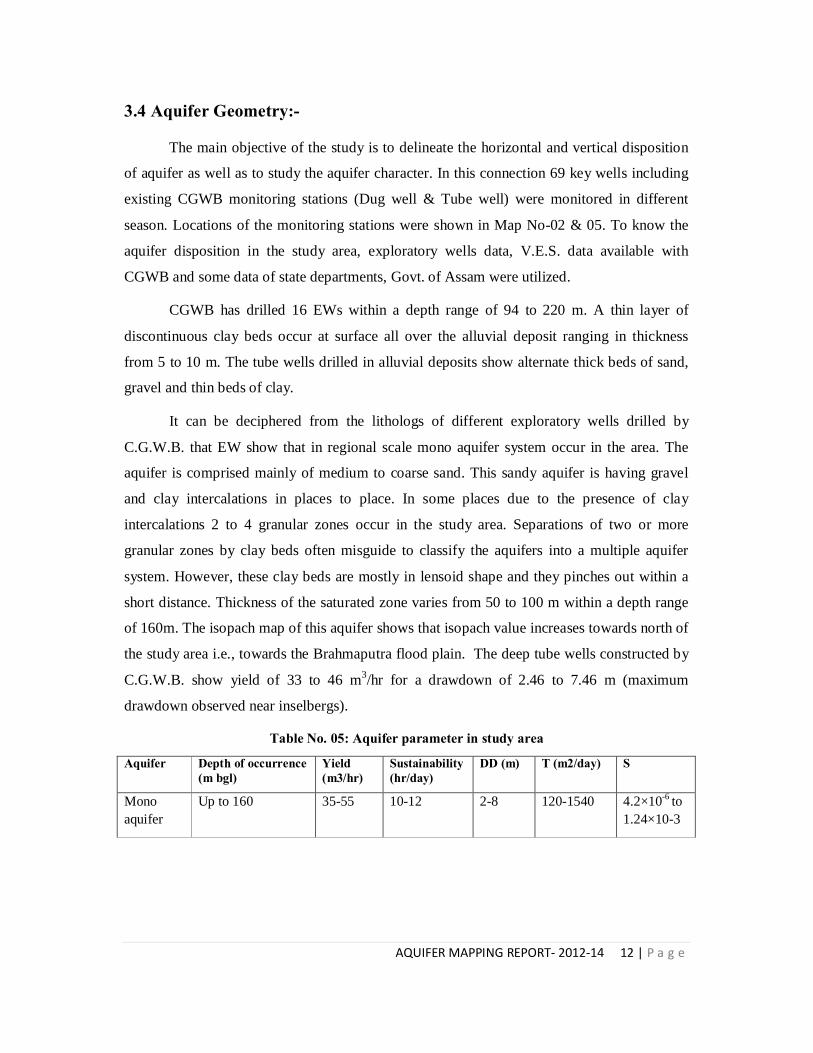
Table No. 05: Aquifer parameter in study area
Aquifer Depth of occurrence (m bgl)
Yield (m3/hr)
Sustainability(hr/day)
DD (m) T (m2/day) S
Mono aquifer
Up to 160 35-55 10-12 2-8 120-1540 4.2×10⁻⁶ to 1.24×10⁻³
AQUIFER MAPPING REPORT- 2012-14 13 | P a g e
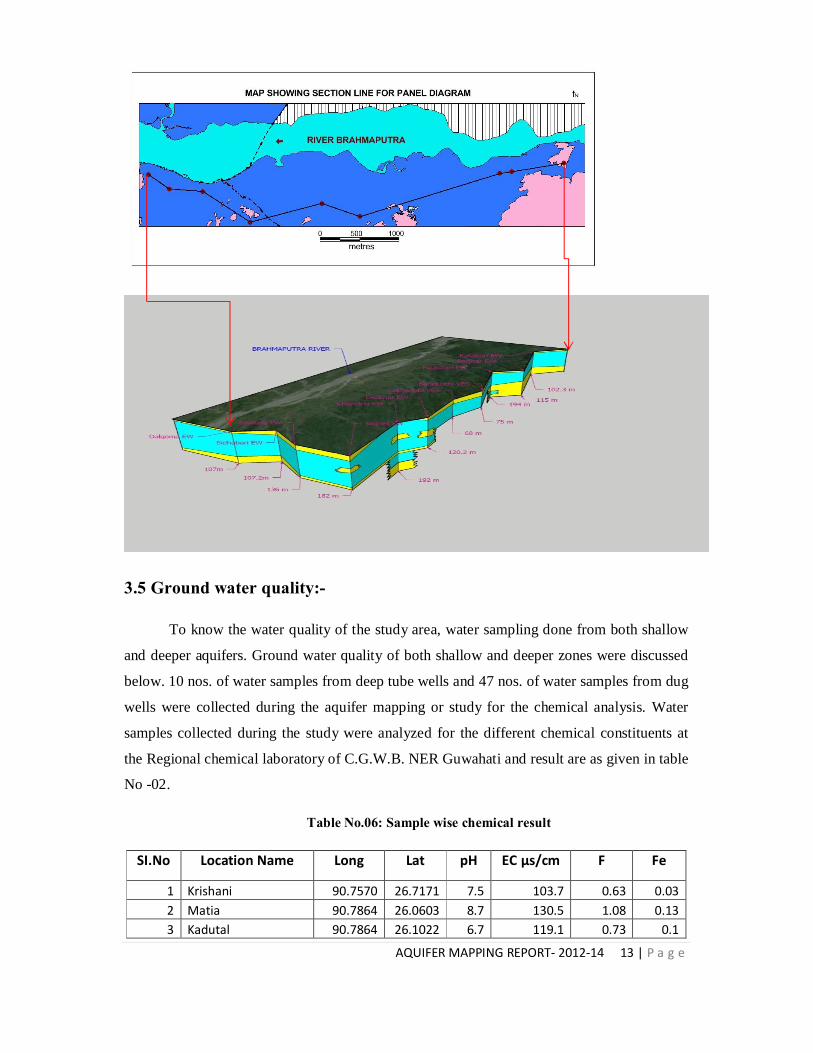
3.5 Ground water quality:-
To know the water quality of the study area, water sampling done from both shallow
and deeper aquifers. Ground water quality of both shallow and deeper zones were discussed
below. 10 nos. of water samples from deep tube wells and 47 nos. of water samples from dug
wells were collected during the aquifer mapping or study for the chemical analysis. Water
samples collected during the study were analyzed for the different chemical constituents at
the Regional chemical laboratory of C.G.W.B. NER Guwahati and result are as given in table
No -02.
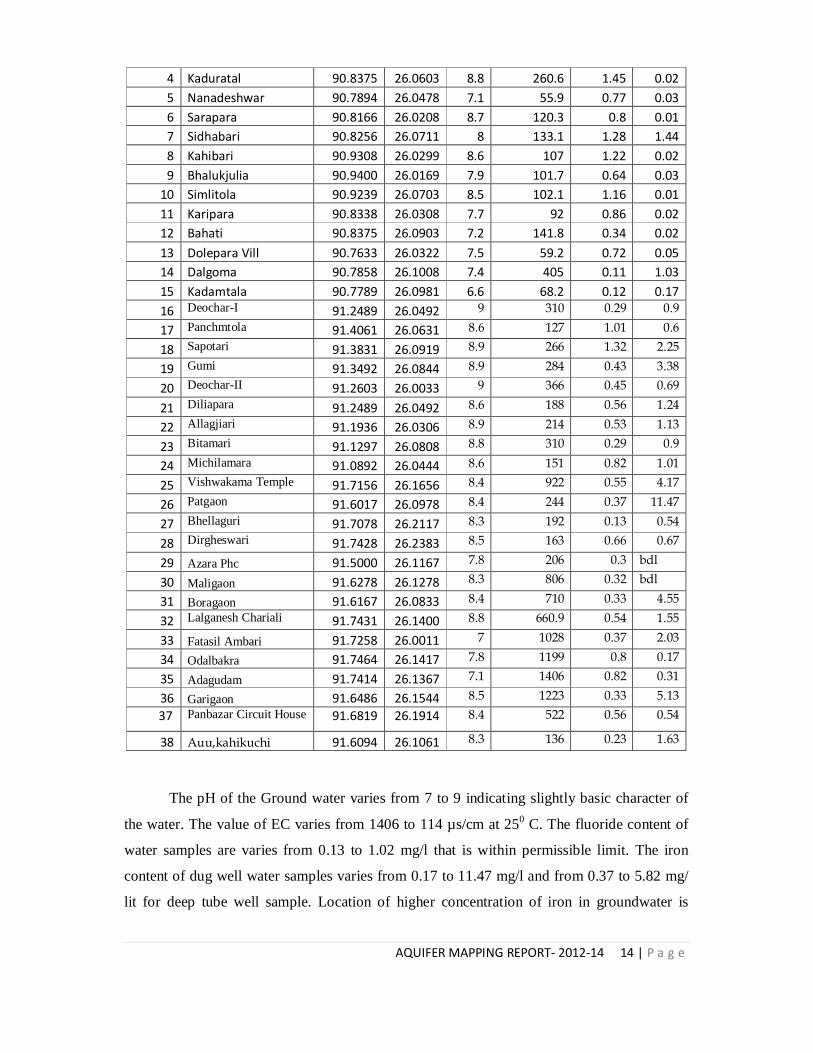
Table No.06: Sample wise chemical result
SI.No Location Name Long Lat pH EC µs/cm F Fe
1 Krishani 90.7570 26.7171 7.5 103.7 0.63 0.03 2 Matia 90.7864 26.0603 8.7 130.5 1.08 0.13 3 Kadutal 90.7864 26.1022 6.7 119.1 0.73 0.1
AQUIFER MAPPING REPORT- 2012-14 14 | P a g e
4 Kaduratal 90.8375 26.0603 8.8 260.6 1.45 0.02 5 Nanadeshwar 90.7894 26.0478 7.1 55.9 0.77 0.03 6 Sarapara 90.8166 26.0208 8.7 120.3 0.8 0.01 7 Sidhabari 90.8256 26.0711 8 133.1 1.28 1.44 8 Kahibari 90.9308 26.0299 8.6 107 1.22 0.02 9 Bhalukjulia 90.9400 26.0169 7.9 101.7 0.64 0.03
10 Simlitola 90.9239 26.0703 8.5 102.1 1.16 0.01 11 Karipara 90.8338 26.0308 7.7 92 0.86 0.02 12 Bahati 90.8375 26.0903 7.2 141.8 0.34 0.02 13 Dolepara Vill 90.7633 26.0322 7.5 59.2 0.72 0.05 14 Dalgoma 90.7858 26.1008 7.4 405 0.11 1.03 15 Kadamtala 90.7789 26.0981 6.6 68.2 0.12 0.17 16 Deochar-I 91.2489 26.0492 9 310 0.29 0.9
17 Panchmtola 91.4061 26.0631 8.6 127 1.01 0.6
18 Sapotari 91.3831 26.0919 8.9 266 1.32 2.25
19 Gumi 91.3492 26.0844 8.9 284 0.43 3.38
20 Deochar-II 91.2603 26.0033 9 366 0.45 0.69
21 Diliapara 91.2489 26.0492 8.6 188 0.56 1.24
22 Allagjiari 91.1936 26.0306 8.9 214 0.53 1.13
23 Bitamari 91.1297 26.0808 8.8 310 0.29 0.9
24 Michilamara 91.0892 26.0444 8.6 151 0.82 1.01
25 Vishwakama Temple 91.7156 26.1656 8.4 922 0.55 4.17
26 Patgaon 91.6017 26.0978 8.4 244 0.37 11.47
27 Bhellaguri 91.7078 26.2117 8.3 192 0.13 0.54
28 Dirgheswari 91.7428 26.2383 8.5 163 0.66 0.67
29 Azara Phc 91.5000 26.1167 7.8 206 0.3 bdl
30 Maligaon 91.6278 26.1278 8.3 806 0.32 bdl
31 Boragaon 91.6167 26.0833 8.4 710 0.33 4.55
32 Lalganesh Chariali 91.7431 26.1400 8.8 660.9 0.54 1.55
33 Fatasil Ambari 91.7258 26.0011 7 1028 0.37 2.03
34 Odalbakra 91.7464 26.1417 7.8 1199 0.8 0.17
35 Adagudam 91.7414 26.1367 7.1 1406 0.82 0.31
36 Garigaon 91.6486 26.1544 8.5 1223 0.33 5.13 37 Panbazar Circuit House 91.6819 26.1914 8.4 522 0.56 0.54
38 Auu,kahikuchi 91.6094 26.1061 8.3 136 0.23 1.63
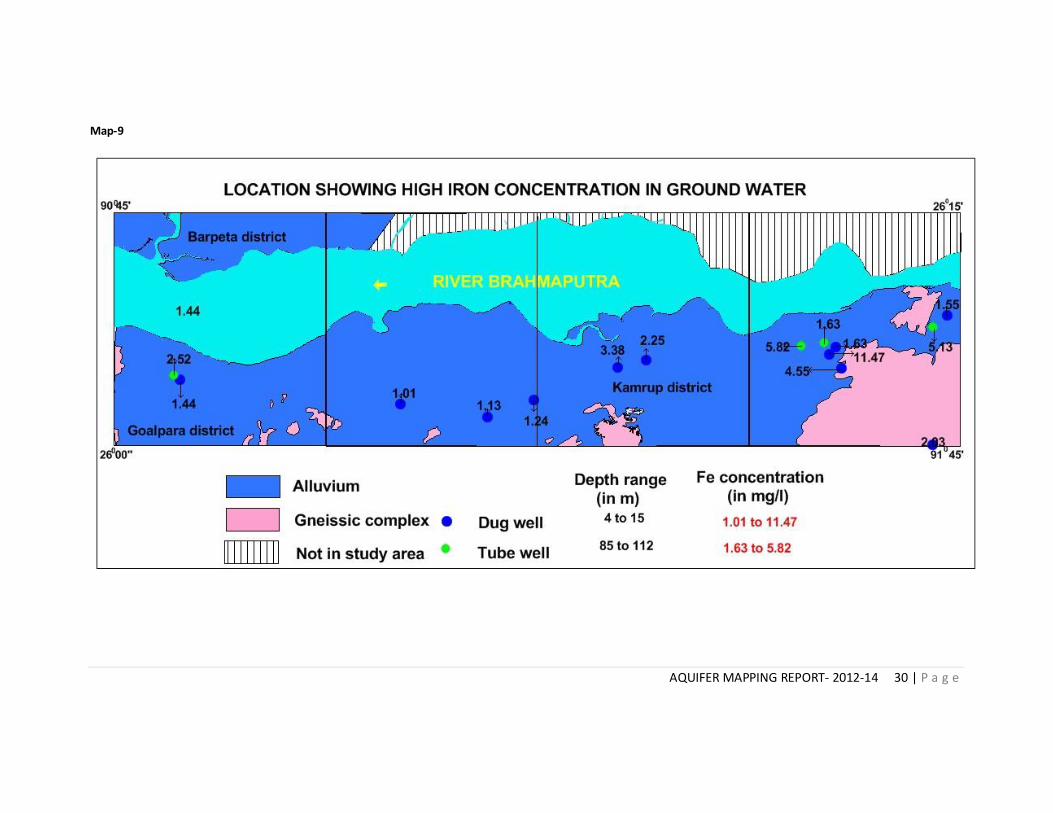
The pH of the Ground water varies from 7 to 9 indicating slightly basic character of
the water. The value of EC varies from 1406 to 114 µs/cm at 250 C. The fluoride content of
water samples are varies from 0.13 to 1.02 mg/l that is within permissible limit. The iron
content of dug well water samples varies from 0.17 to 11.47 mg/l and from 0.37 to 5.82 mg/
lit for deep tube well sample. Location of higher concentration of iron in groundwater is
AQUIFER MAPPING REPORT- 2012-14 15 | P a g e
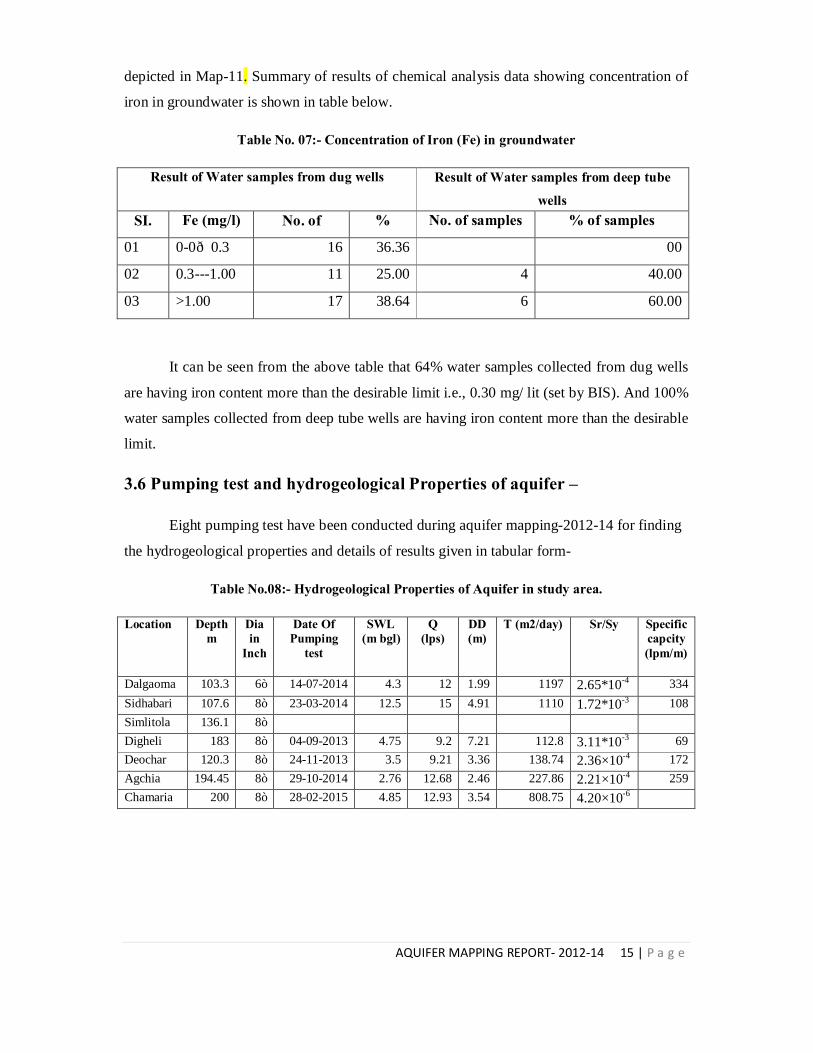
depicted in Map-11. Summary of results of chemical analysis data showing concentration of
iron in groundwater is shown in table below.
Table No. 07:- Concentration of Iron (Fe) in groundwater
Result of Water samples from dug wells Result of Water samples from deep tube wells
SI. No
Fe (mg/l) No. of samples
% No. of samples % of samples
01 0-0—0.3 16 36.36 00
02 0.3---1.00 11 25.00 4 40.00
03 >1.00 17 38.64 6 60.00
It can be seen from the above table that 64% water samples collected from dug wells
are having iron content more than the desirable limit i.e., 0.30 mg/ lit (set by BIS). And 100%
water samples collected from deep tube wells are having iron content more than the desirable
limit.
3.6 Pumping test and hydrogeological Properties of aquifer –
Eight pumping test have been conducted during aquifer mapping-2012-14 for finding
the hydrogeological properties and details of results given in tabular form-
Table No.08:- Hydrogeological Properties of Aquifer in study area.
Location Depth m
Dia in
Inch
Date Of Pumping
test
SWL (m bgl)
Q (lps)
DD (m)
T (m2/day) Sr/Sy Specific capcity (lpm/m)
Dalgaoma 103.3 6” 14-07-2014 4.3 12 1.99 1197 2.65*10-4 334 Sidhabari 107.6 8” 23-03-2014 12.5 15 4.91 1110 1.72*10-3 108 Simlitola 136.1 8” Digheli 183 8” 04-09-2013 4.75 9.2 7.21 112.8 3.11*10-3 69 Deochar 120.3 8” 24-11-2013 3.5 9.21 3.36 138.74 2.36×10⁻⁴ 172 Agchia 194.45 8” 29-10-2014 2.76 12.68 2.46 227.86 2.21×10⁻⁴ 259 Chamaria 200 8” 28-02-2015 4.85 12.93 3.54 808.75 4.20×10⁻⁶
AQUIFER MAPPING REPORT- 2012-14 16 | P a g e
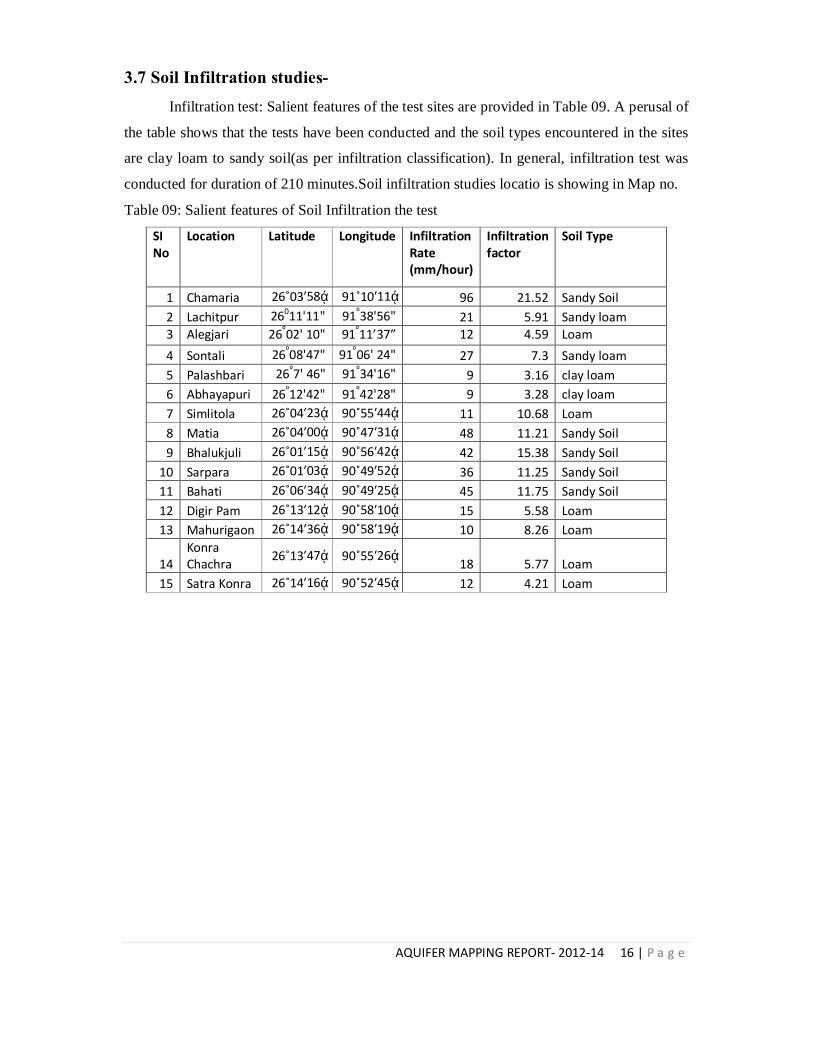
3.7 Soil Infiltration studies- Infiltration test: Salient features of the test sites are provided in Table 09. A perusal of
the table shows that the tests have been conducted and the soil types encountered in the sites
are clay loam to sandy soil(as per infiltration classification). In general, infiltration test was
conducted for duration of 210 minutes.Soil infiltration studies locatio is showing in Map no.
Table 09: Salient features of Soil Infiltration the test
SI No
Location Latitude Longitude Infiltration Rate (mm/hour)
Infiltration factor
Soil Type
1 Chamaria 26˚03ʹ58ʺ 91˚10ʹ11ʺ 96 21.52 Sandy Soil 2 Lachitpur 26011'11" 91⁰38'56" 21 5.91 Sandy loam 3 Alegjari 26⁰02' 10" 91⁰11’37” 12 4.59 Loam 4 Sontali 26⁰08'47" 91⁰06' 24" 27 7.3 Sandy loam 5 Palashbari 26⁰7' 46" 91⁰34'16" 9 3.16 clay loam 6 Abhayapuri 26⁰12'42" 91⁰42'28" 9 3.28 clay loam 7 Simlitola 26˚04ʹ23ʺ 90˚55ʹ44ʺ 11 10.68 Loam 8 Matia 26˚04ʹ00ʺ 90˚47ʹ31ʺ 48 11.21 Sandy Soil 9 Bhalukjuli 26˚01ʹ15ʺ 90˚56ʹ42ʺ 42 15.38 Sandy Soil
10 Sarpara 26˚01ʹ03ʺ 90˚49ʹ52ʺ 36 11.25 Sandy Soil 11 Bahati 26˚06ʹ34ʺ 90˚49ʹ25ʺ 45 11.75 Sandy Soil 12 Digir Pam 26˚13ʹ12ʺ 90˚58ʹ10ʺ 15 5.58 Loam 13 Mahurigaon 26˚14ʹ36ʺ 90˚58ʹ19ʺ 10 8.26 Loam
14 Konra Chachra 26˚13ʹ47ʺ 90˚55ʹ26ʺ 18 5.77 Loam
15 Satra Konra 26˚14ʹ16ʺ 90˚52ʹ45ʺ 12 4.21 Loam
AQUIFER MAPPING REPORT- 2012-14 17 | P a g e
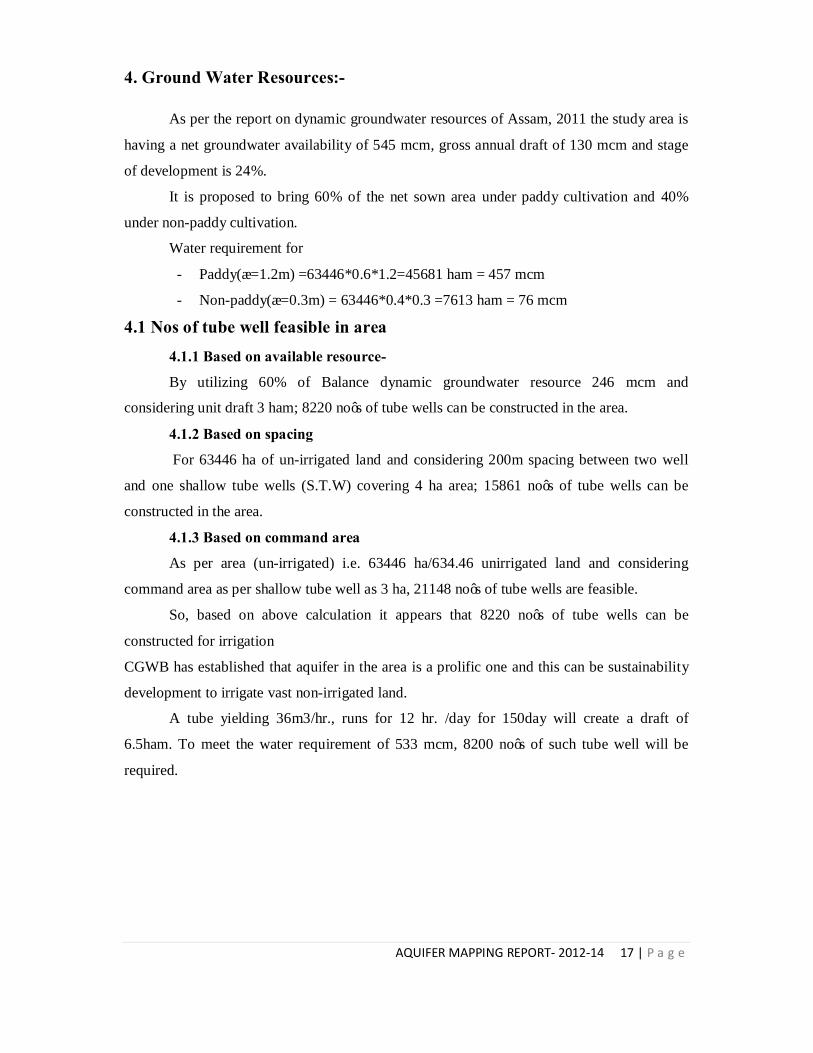
4. Ground Water Resources:-
As per the report on dynamic groundwater resources of Assam, 2011 the study area is
having a net groundwater availability of 545 mcm, gross annual draft of 130 mcm and stage
of development is 24%.
It is proposed to bring 60% of the net sown area under paddy cultivation and 40%
under non-paddy cultivation.
Water requirement for
- Paddy(∆=1.2m) =63446*0.6*1.2=45681 ham = 457 mcm
- Non-paddy(∆=0.3m) = 63446*0.4*0.3 =7613 ham = 76 mcm
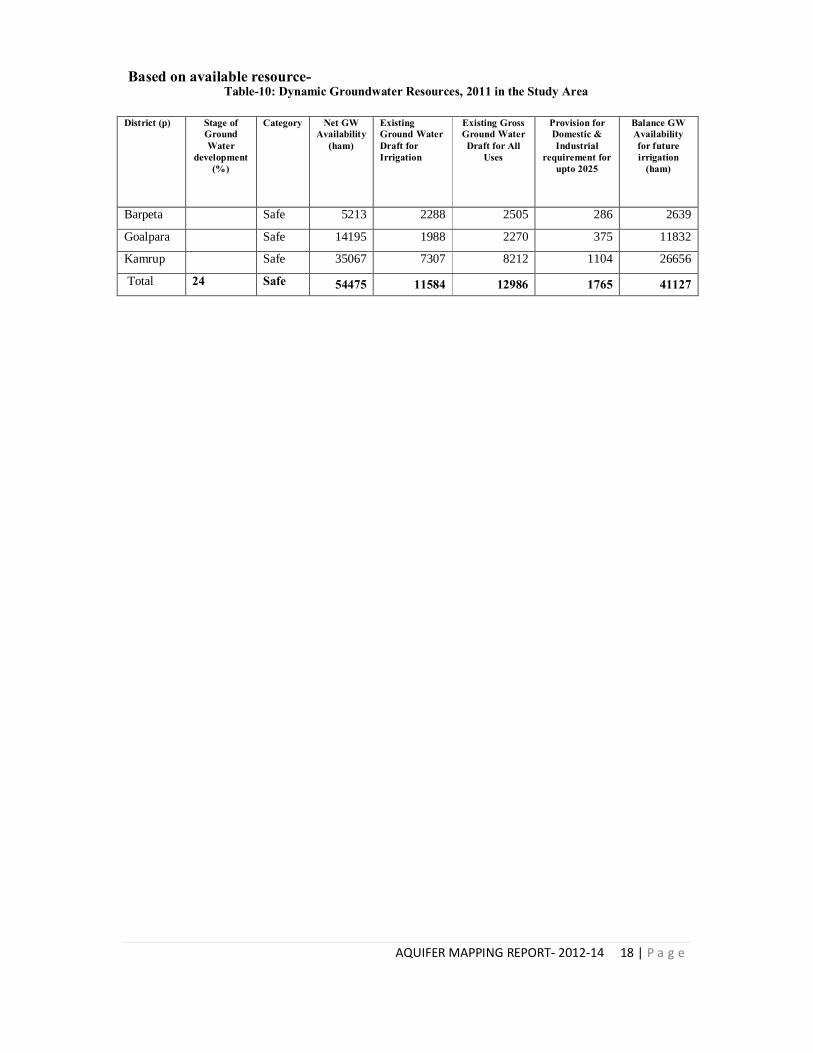
4.1 Nos of tube well feasible in area 4.1.1 Based on available resource- By utilizing 60% of Balance dynamic groundwater resource 246 mcm and
considering unit draft 3 ham; 8220 no’s of tube wells can be constructed in the area.
4.1.2 Based on spacing
For 63446 ha of un-irrigated land and considering 200m spacing between two well
and one shallow tube wells (S.T.W) covering 4 ha area; 15861 no’s of tube wells can be
constructed in the area.
4.1.3 Based on command area As per area (un-irrigated) i.e. 63446 ha/634.46 unirrigated land and considering
command area as per shallow tube well as 3 ha, 21148 no’s of tube wells are feasible.
So, based on above calculation it appears that 8220 no’s of tube wells can be
constructed for irrigation
CGWB has established that aquifer in the area is a prolific one and this can be sustainability
development to irrigate vast non-irrigated land.
A tube yielding 36m3/hr., runs for 12 hr. /day for 150day will create a draft of
6.5ham. To meet the water requirement of 533 mcm, 8200 no’s of such tube well will be
required.
AQUIFER MAPPING REPORT- 2012-14 18 | P a g e
Based on available resource- Table-10: Dynamic Groundwater Resources, 2011 in the Study Area
District (p) Stage of
Ground Water
development (%)
Category Net GW Availability
(ham)
Existing Ground Water Draft for Irrigation
Existing Gross Ground Water Draft for All
Uses
Provision for Domestic & Industrial
requirement for upto 2025
Balance GW Availability for future irrigation
(ham)
Barpeta Safe 5213 2288 2505 286 2639
Goalpara Safe 14195 1988 2270 375 11832
Kamrup Safe 35067 7307 8212 1104 26656
Total 24 Safe 54475 11584 12986 1765 41127
AQUIFER MAPPING REPORT- 2012-14 19 | P a g e
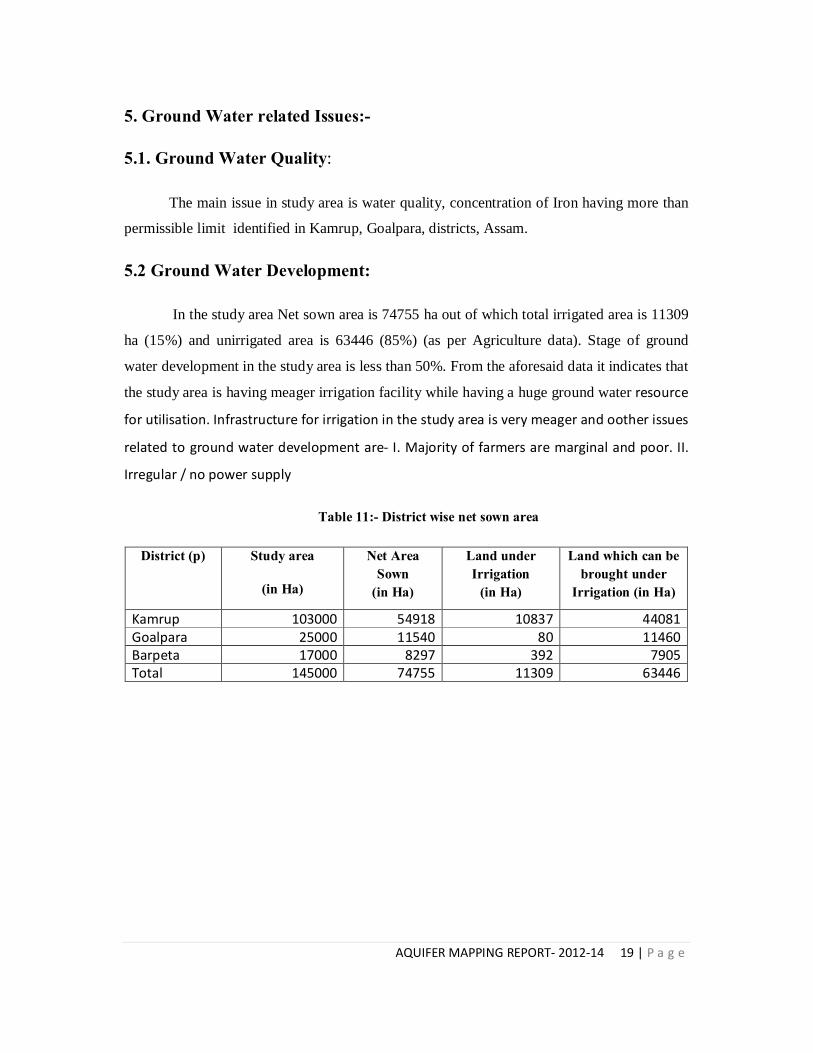
5. Ground Water related Issues:-
5.1. Ground Water Quality:
The main issue in study area is water quality, concentration of Iron having more than
permissible limit identified in Kamrup, Goalpara, districts, Assam.
5.2 Ground Water Development:
In the study area Net sown area is 74755 ha out of which total irrigated area is 11309
ha (15%) and unirrigated area is 63446 (85%) (as per Agriculture data). Stage of ground
water development in the study area is less than 50%. From the aforesaid data it indicates that
the study area is having meager irrigation facility while having a huge ground water resource
for utilisation. Infrastructure for irrigation in the study area is very meager and oother issues
related to ground water development are- I. Majority of farmers are marginal and poor. II.
Irregular / no power supply
Table 11:- District wise net sown area
District (p) Study area
(in Ha)
Net Area Sown
(in Ha)
Land under Irrigation
(in Ha)
Land which can be brought under
Irrigation (in Ha)
Kamrup 103000 54918 10837 44081 Goalpara 25000 11540 80 11460 Barpeta 17000 8297 392 7905 Total 145000 74755 11309 63446
AQUIFER MAPPING REPORT- 2012-14 20 | P a g e
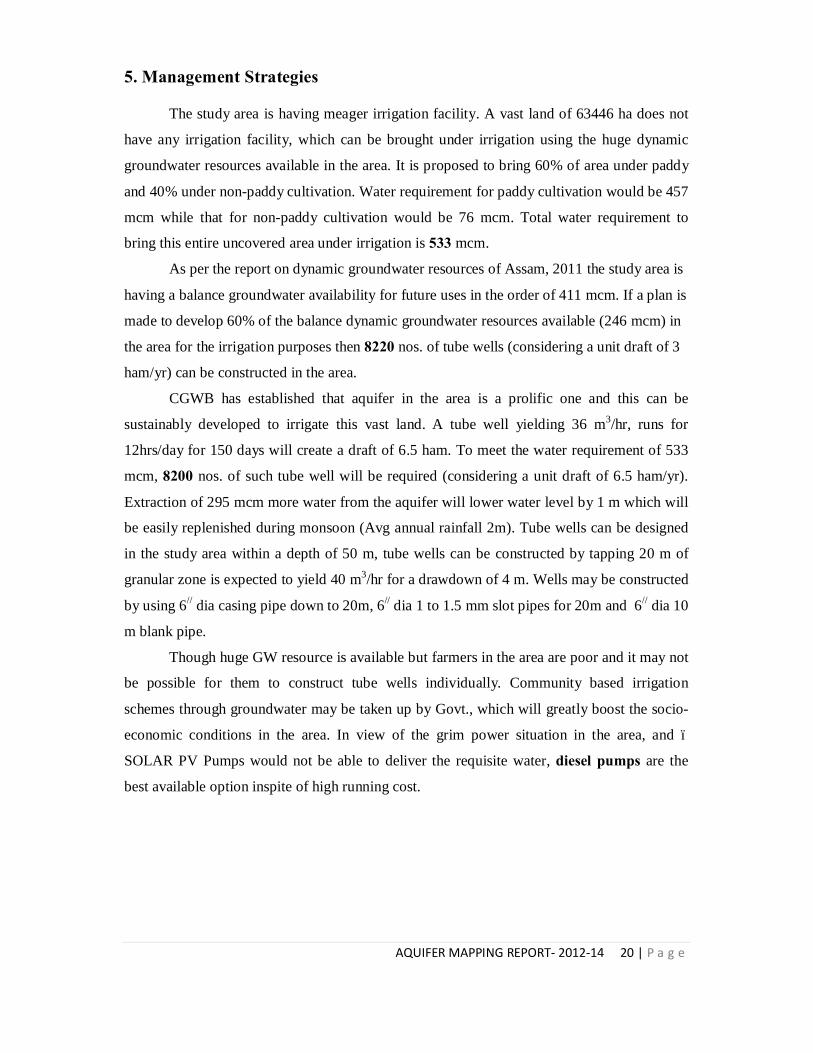
5. Management Strategies
The study area is having meager irrigation facility. A vast land of 63446 ha does not
have any irrigation facility, which can be brought under irrigation using the huge dynamic
groundwater resources available in the area. It is proposed to bring 60% of area under paddy
and 40% under non-paddy cultivation. Water requirement for paddy cultivation would be 457
mcm while that for non-paddy cultivation would be 76 mcm. Total water requirement to
bring this entire uncovered area under irrigation is 533 mcm.
As per the report on dynamic groundwater resources of Assam, 2011 the study area is
having a balance groundwater availability for future uses in the order of 411 mcm. If a plan is
made to develop 60% of the balance dynamic groundwater resources available (246 mcm) in
the area for the irrigation purposes then 8220 nos. of tube wells (considering a unit draft of 3
ham/yr) can be constructed in the area.
CGWB has established that aquifer in the area is a prolific one and this can be
sustainably developed to irrigate this vast land. A tube well yielding 36 m3/hr, runs for
12hrs/day for 150 days will create a draft of 6.5 ham. To meet the water requirement of 533
mcm, 8200 nos. of such tube well will be required (considering a unit draft of 6.5 ham/yr).
Extraction of 295 mcm more water from the aquifer will lower water level by 1 m which will
be easily replenished during monsoon (Avg annual rainfall 2m). Tube wells can be designed
in the study area within a depth of 50 m, tube wells can be constructed by tapping 20 m of
granular zone is expected to yield 40 m3/hr for a drawdown of 4 m. Wells may be constructed
by using 6// dia casing pipe down to 20m, 6// dia 1 to 1.5 mm slot pipes for 20m and 6// dia 10
m blank pipe.
Though huge GW resource is available but farmers in the area are poor and it may not
be possible for them to construct tube wells individually. Community based irrigation
schemes through groundwater may be taken up by Govt., which will greatly boost the socio-
economic conditions in the area. In view of the grim power situation in the area, and –
SOLAR PV Pumps would not be able to deliver the requisite water, diesel pumps are the
best available option inspite of high running cost.
AQUIFER MAPPING REPORT- 2012-14 21 | P a g e
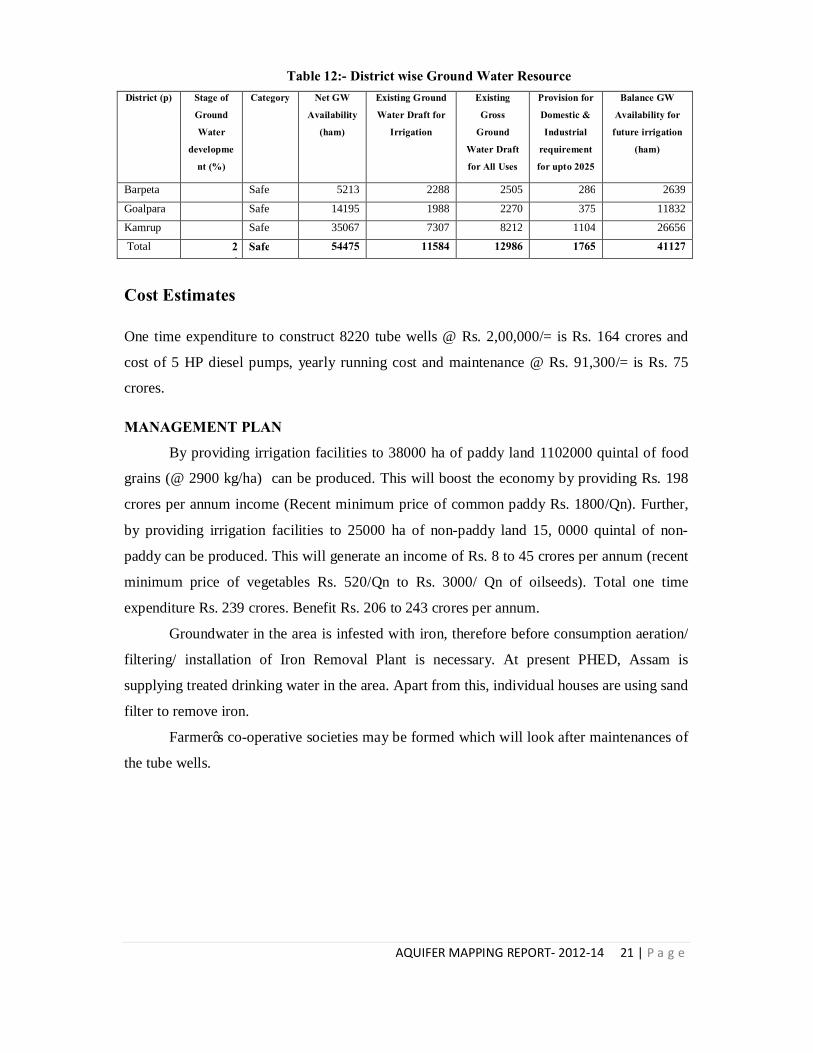
Table 12:- District wise Ground Water Resource District (p) Stage of
Ground
Water
developme
nt (%)
Category Net GW
Availability
(ham)
Existing Ground
Water Draft for
Irrigation
Existing
Gross
Ground
Water Draft
for All Uses
Provision for
Domestic &
Industrial
requirement
for upto 2025
Balance GW
Availability for
future irrigation
(ham)
Barpeta
Safe 5213 2288 2505 286 2639
Goalpara
Safe 14195 1988 2270 375 11832 Kamrup
Safe 35067 7307 8212 1104 26656
Total 24
Safe 54475 11584 12986 1765 41127
Cost Estimates
One time expenditure to construct 8220 tube wells @ Rs. 2,00,000/= is Rs. 164 crores and
cost of 5 HP diesel pumps, yearly running cost and maintenance @ Rs. 91,300/= is Rs. 75
crores.
MANAGEMENT PLAN By providing irrigation facilities to 38000 ha of paddy land 1102000 quintal of food
grains (@ 2900 kg/ha) can be produced. This will boost the economy by providing Rs. 198
crores per annum income (Recent minimum price of common paddy Rs. 1800/Qn). Further,
by providing irrigation facilities to 25000 ha of non-paddy land 15, 0000 quintal of non-
paddy can be produced. This will generate an income of Rs. 8 to 45 crores per annum (recent
minimum price of vegetables Rs. 520/Qn to Rs. 3000/ Qn of oilseeds). Total one time
expenditure Rs. 239 crores. Benefit Rs. 206 to 243 crores per annum.
Groundwater in the area is infested with iron, therefore before consumption aeration/
filtering/ installation of Iron Removal Plant is necessary. At present PHED, Assam is
supplying treated drinking water in the area. Apart from this, individual houses are using sand
filter to remove iron.
Farmer’s co-operative societies may be formed which will look after maintenances of
the tube wells.
AQUIFER MAPPING REPORT- 2012-14 22 | P a g e
Map No-01
AQUIFER MAPPING REPORT- 2012-14 23 | P a g e
Map No- 2
AQUIFER MAPPING REPORT- 2012-14 24 | P a g e
Map No- 3
AQUIFER MAPPING REPORT- 2012-14 25 | P a g e
Map No- 4
AQUIFER MAPPING REPORT- 2012-14 26 | P a g e
Map No- 5
AQUIFER MAPPING REPORT- 2012-14 27 | P a g e
Map No- 6
AQUIFER MAPPING REPORT- 2012-14 28 | P a g e
Map No- 7
AQUIFER MAPPING REPORT- 2012-14 29 | P a g e
Map No- 8
AQUIFER MAPPING REPORT- 2012-14 30 | P a g e
Map-9
AQUIFER MAPPING REPORT- 2012-14 31 | P a g e
Map No-10
AQUIFER MAPPING REPORT- 2012-14 32 | P a g e
Map No-11
AQUIFER MAPPING REPORT- 2012-14 33 | P a g e

AQUIFER MAPPING REPORT- 2012-14 34 | P a g e