Embed Size (px)
Citation preview
www.zillow.com/research/
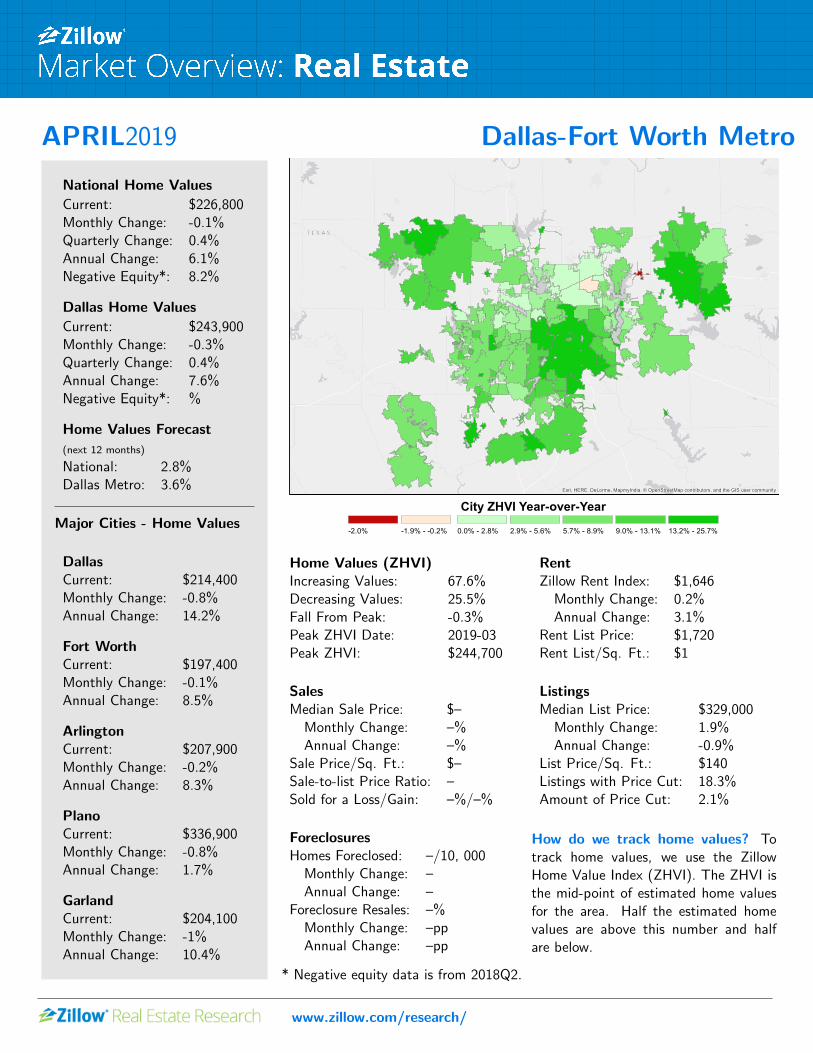
APRIL2019 Dallas-Fort Worth Metro
National Home Values
Current: $226,800Monthly Change: -0.1%Quarterly Change: 0.4%Annual Change: 6.1%Negative Equity*: 8.2%
Dallas Home Values
Current: $243,900Monthly Change: -0.3%Quarterly Change: 0.4%Annual Change: 7.6%Negative Equity*: %
Home Values Forecast
(next 12 months)
National: 2.8%Dallas Metro: 3.6%
Major Cities - Home Values
DallasCurrent: $214,400Monthly Change: -0.8%Annual Change: 14.2%
Fort WorthCurrent: $197,400Monthly Change: -0.1%Annual Change: 8.5%
ArlingtonCurrent: $207,900Monthly Change: -0.2%Annual Change: 8.3%
PlanoCurrent: $336,900Monthly Change: -0.8%Annual Change: 1.7%
GarlandCurrent: $204,100Monthly Change: -1%Annual Change: 10.4%
Esri, HERE, DeLorme, MapmyIndia, © OpenStreetMap contributors, and the GIS user community
City ZHVI Year-over-Year-2.0% -1.9% - -0.2% 0.0% - 2.8% 2.9% - 5.6% 5.7% - 8.9% 9.0% - 13.1% 13.2% - 25.7%
Home Values (ZHVI)Increasing Values: 67.6%Decreasing Values: 25.5%Fall From Peak: -0.3%Peak ZHVI Date: 2019-03Peak ZHVI: $244,700
RentZillow Rent Index: $1,646
Monthly Change: 0.2%Annual Change: 3.1%
Rent List Price: $1,720Rent List/Sq. Ft.: $1
SalesMedian Sale Price: $–
Monthly Change: –%Annual Change: –%
Sale Price/Sq. Ft.: $–Sale-to-list Price Ratio: –Sold for a Loss/Gain: –%/–%
ListingsMedian List Price: $329,000
Monthly Change: 1.9%Annual Change: -0.9%
List Price/Sq. Ft.: $140Listings with Price Cut: 18.3%Amount of Price Cut: 2.1%
ForeclosuresHomes Foreclosed: –/10, 000
Monthly Change: –Annual Change: –
Foreclosure Resales: –%Monthly Change: –ppAnnual Change: –pp
How do we track home values? Totrack home values, we use the ZillowHome Value Index (ZHVI). The ZHVI isthe mid-point of estimated home valuesfor the area. Half the estimated homevalues are above this number and halfare below.
* Negative equity data is from 2018Q2.
APRIL2019
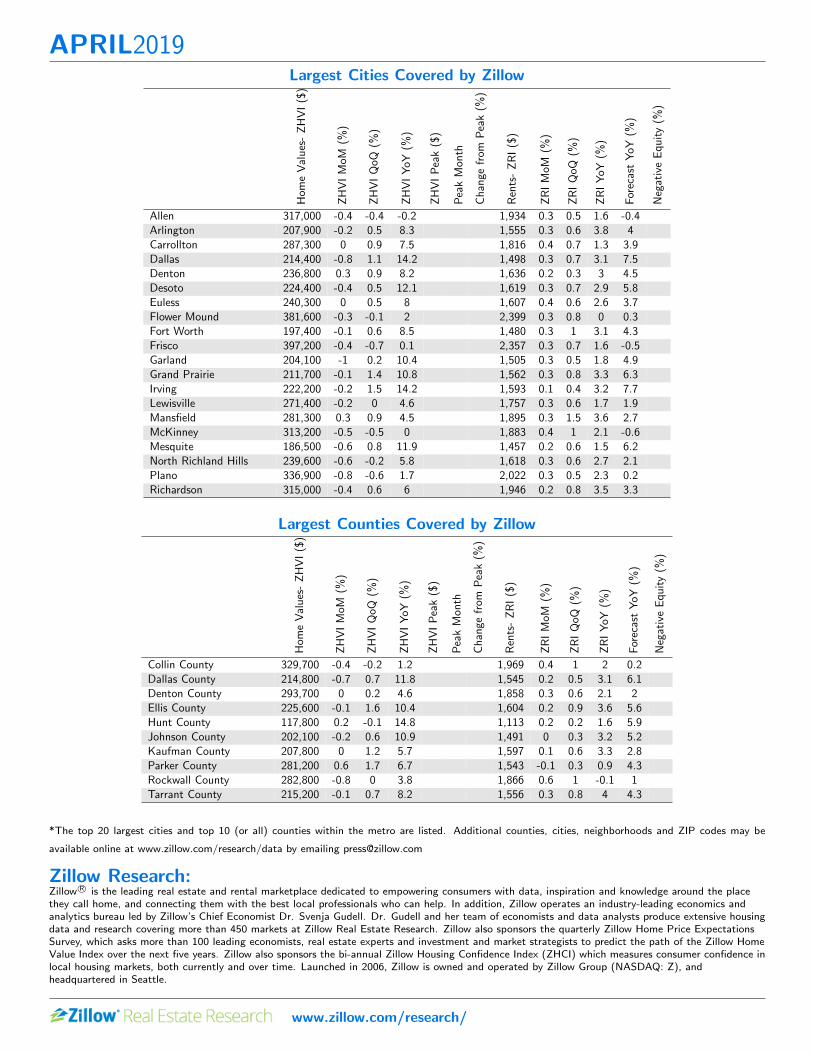
*The top 20 largest cities and top 10 (or all) counties within the metro are listed. Additional counties, cities, neighborhoods and ZIP codes may be
available online at www.zillow.com/research/data by emailing [email protected]
Zillow Research:Zillow R© is the leading real estate and rental marketplace dedicated to empowering consumers with data, inspiration and knowledge around the placethey call home, and connecting them with the best local professionals who can help. In addition, Zillow operates an industry-leading economics andanalytics bureau led by Zillow’s Chief Economist Dr. Svenja Gudell. Dr. Gudell and her team of economists and data analysts produce extensive housingdata and research covering more than 450 markets at Zillow Real Estate Research. Zillow also sponsors the quarterly Zillow Home Price ExpectationsSurvey, which asks more than 100 leading economists, real estate experts and investment and market strategists to predict the path of the Zillow HomeValue Index over the next five years. Zillow also sponsors the bi-annual Zillow Housing Confidence Index (ZHCI) which measures consumer confidence inlocal housing markets, both currently and over time. Launched in 2006, Zillow is owned and operated by Zillow Group (NASDAQ: Z), andheadquartered in Seattle.
www.zillow.com/research/
Largest Cities Covered by Zillow
Hom
eV
alu
es-
ZH
VI
($)
ZH
VI
MoM
(%)
ZH
VI
QoQ
(%)
ZH
VI
YoY
(%)
ZH
VI
Pea
k($
)
Pea
kM
onth
Ch
ange
from
Pea
k(%
)
Ren
ts-
ZR
I($
)
ZR
IM
oM(%
)
ZR
IQ
oQ(%
)
ZR
IY
oY(%
)
For
ecas
tY
oY(%
)
Neg
ativ
eE
qu
ity
(%)
Allen 317,000 -0.4 -0.4 -0.2 1,934 0.3 0.5 1.6 -0.4Arlington 207,900 -0.2 0.5 8.3 1,555 0.3 0.6 3.8 4Carrollton 287,300 0 0.9 7.5 1,816 0.4 0.7 1.3 3.9Dallas 214,400 -0.8 1.1 14.2 1,498 0.3 0.7 3.1 7.5Denton 236,800 0.3 0.9 8.2 1,636 0.2 0.3 3 4.5Desoto 224,400 -0.4 0.5 12.1 1,619 0.3 0.7 2.9 5.8Euless 240,300 0 0.5 8 1,607 0.4 0.6 2.6 3.7Flower Mound 381,600 -0.3 -0.1 2 2,399 0.3 0.8 0 0.3Fort Worth 197,400 -0.1 0.6 8.5 1,480 0.3 1 3.1 4.3Frisco 397,200 -0.4 -0.7 0.1 2,357 0.3 0.7 1.6 -0.5Garland 204,100 -1 0.2 10.4 1,505 0.3 0.5 1.8 4.9Grand Prairie 211,700 -0.1 1.4 10.8 1,562 0.3 0.8 3.3 6.3Irving 222,200 -0.2 1.5 14.2 1,593 0.1 0.4 3.2 7.7Lewisville 271,400 -0.2 0 4.6 1,757 0.3 0.6 1.7 1.9Mansfield 281,300 0.3 0.9 4.5 1,895 0.3 1.5 3.6 2.7McKinney 313,200 -0.5 -0.5 0 1,883 0.4 1 2.1 -0.6Mesquite 186,500 -0.6 0.8 11.9 1,457 0.2 0.6 1.5 6.2North Richland Hills 239,600 -0.6 -0.2 5.8 1,618 0.3 0.6 2.7 2.1Plano 336,900 -0.8 -0.6 1.7 2,022 0.3 0.5 2.3 0.2Richardson 315,000 -0.4 0.6 6 1,946 0.2 0.8 3.5 3.3
Largest Counties Covered by Zillow
Hom
eV
alu
es-
ZH
VI
($)
ZH
VI
MoM
(%)
ZH
VI
QoQ
(%)
ZH
VI
YoY
(%)
ZH
VI
Pea
k($
)
Pea
kM
onth
Ch
ange
from
Pea
k(%
)
Ren
ts-
ZR
I($
)
ZR
IM
oM(%
)
ZR
IQ
oQ(%
)
ZR
IY
oY(%
)
For
ecas
tY
oY(%
)
Neg
ativ
eE
qu
ity
(%)
Collin County 329,700 -0.4 -0.2 1.2 1,969 0.4 1 2 0.2Dallas County 214,800 -0.7 0.7 11.8 1,545 0.2 0.5 3.1 6.1Denton County 293,700 0 0.2 4.6 1,858 0.3 0.6 2.1 2Ellis County 225,600 -0.1 1.6 10.4 1,604 0.2 0.9 3.6 5.6Hunt County 117,800 0.2 -0.1 14.8 1,113 0.2 0.2 1.6 5.9Johnson County 202,100 -0.2 0.6 10.9 1,491 0 0.3 3.2 5.2Kaufman County 207,800 0 1.2 5.7 1,597 0.1 0.6 3.3 2.8Parker County 281,200 0.6 1.7 6.7 1,543 -0.1 0.3 0.9 4.3Rockwall County 282,800 -0.8 0 3.8 1,866 0.6 1 -0.1 1Tarrant County 215,200 -0.1 0.7 8.2 1,556 0.3 0.8 4 4.3