Embed Size (px)
DESCRIPTION
THE METRO AREA IMPACT OF HOME BUILDING IN FIVE KENTUCKY COUNTIES IN THE CINCINNATI METRO AREA. Presented by Elliot F. Eisenberg, Ph.D. National Association of Home Builders June 13, 2007 Erlanger, KY. LOCAL ECONOMIC IMPACT. Construction phase Jobs Materials - PowerPoint PPT Presentation
Citation preview

Presented
by
Elliot F. Eisenberg, Ph.D.National Association of Home
Builders
June 13, 2007Erlanger, KY
THE METRO AREA IMPACT OF HOME BUILDING IN
FIVE KENTUCKY COUNTIES IN THE CINCINNATI METRO AREA

LOCAL ECONOMIC IMPACT• Construction phase
– Jobs– Materials– Local fees, taxes, contributions
• Ripple or feed-back from construction– Wages spent in local economy
• Occupancy phase– Earnings spent in local economy

• Conventional Wisdom is that more jobs produce homes
• But, new homes produce more jobs too!

VALUE OF CONSTRUCTION
SERVICES PROVIDED AT CLOSING
PERMIT/HOOK-UP/IMPACT FEES
(Info Obtained From Local Sources)
INCOME FOR LOCAL RESIDENTS
TAX/FEE REVENUEFOR LOCAL GOVERNMENTS
CONSTRUCTION PHASE
INPUTS:
OUTPUTS:
MODEL OF THE LOCAL ECONOMY

LOCAL INCOME & TAXESFROM PHASE I
LOCAL INCOME & TAXES
SPENDING ONLOCAL GOODS AND SERVICES
Consumer Expenditure Survey(U.S. Bureau of Labor Statistics)
MODEL OF THE LOCAL ECONOMY
RIPPLE PHASEINPUTS:
OUTPUTS:

INCOME OF HOUSEHOLDOCCUPYING NEW HOUSING UNIT
LOCAL INCOME & TAXES
SPENDING ONLOCAL GOODS AND SERVICES
PROPERTY TAX PAYMENTS
MODEL OF THE LOCAL ECONOMY
OCCUPANCY PHASE
INPUTS:
OUTPUTS:

The Cincinnati-Middletown MSA

The Cincinnati-Middletown MSA Multiplier
Only CapturesSpending that Stays in the MSA
Includes:Banking, Car Repair, Dry CleaningDay Care Services, Legal ServicesNewspaper Delivery, and Restaurants
But not:Auto Manufacturing, Mattress Manufacturing, Movie Production, and Travel Agency Services
History of the Model• Over 450 eco. impact analyses performed
Users of the model include:
Boone County Kentucky Habitat for Humanity, InternationalMI State Housing Development Authority Michigan State University Missouri Housing Development CommissionMontana State UnivesityUniv. of FloridaUniv. of MassachusettsWest Virginia Housing Development Fund…

Assumptions of the Model
• Average house price Single Family
Multifamily
Average house price: $268,710$125,999
Average raw lot cost: $17,333 $7,420
Permit/Impact fees: $2,887 $1,250
Annual prop. taxes: $2,950 $1,358

Economic Impact of Single Family Home Building
• Construction phase
• Ripple effect from construction phase
• Occupancy phase
• Ten year total

FIRST YEAR IMPACT: SF Construction2,349 SF Homes
INCLUDING:
3,589 Jobs in Construction 771 Jobs in Wholesale & Retail Trade 447 Jobs in Business and Professional Services
Local Income Local Taxes Local Jobs$260,883,000 $15,860,000 5,062

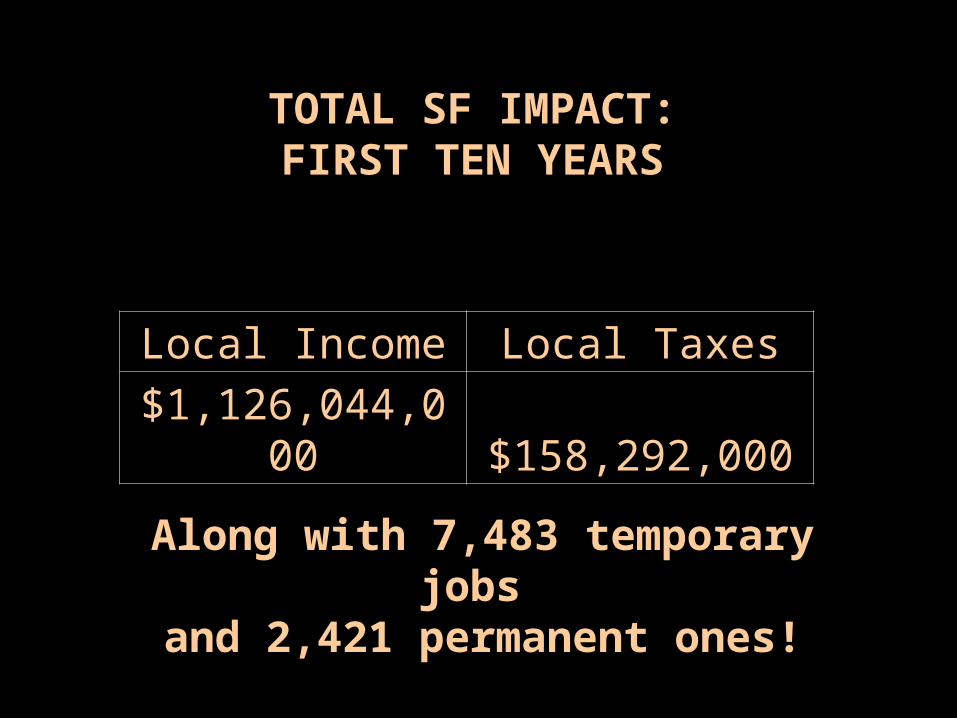
Local Income Local Taxes Local Job$119,318,000 $9,812,000 2,421
FIRST YEAR IMPACT: SF Ripple
INCLUDING:
557 Jobs in Wholesale and Retail Trade 374 Jobs in Local Government289 Jobs in Health, Education & Social Services

ONGOING SF ANNUAL EFFECT
Local Income Local Taxes Local Jobs$78,515,000 $13,960,000 1,705
INCLUDING:
395 Jobs in Wholesale and Retail Trade 267 Jobs in Local Government 199 Jobs in Health, Education & Social Services
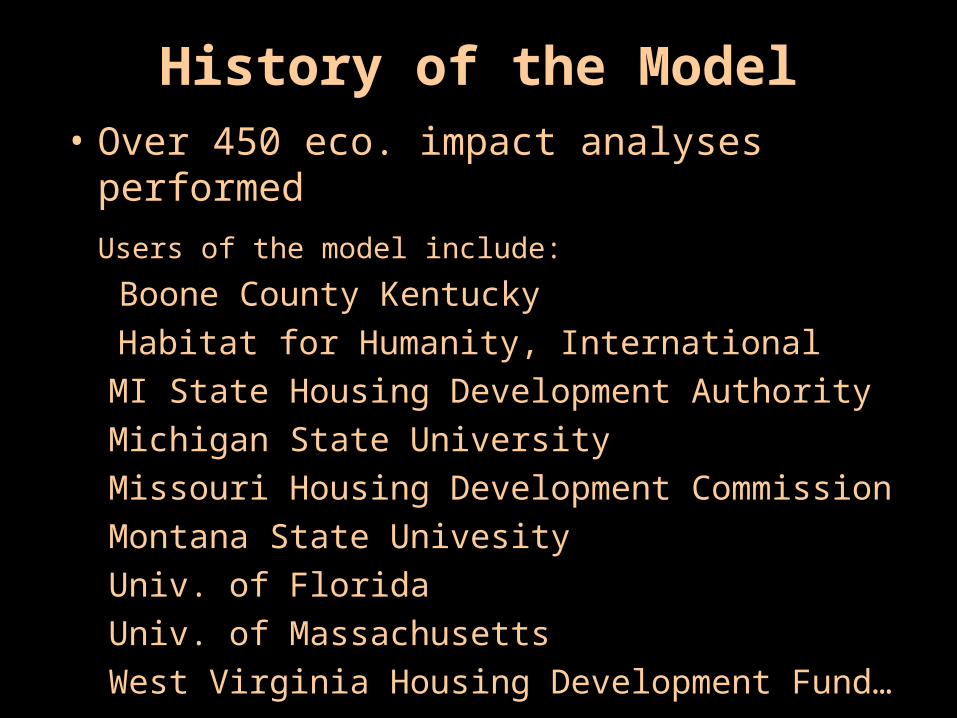
TOTAL SF IMPACT:FIRST TEN YEARS
Local Income Local Taxes
$1,126,044,000 $158,292,000
Along with 7,483 temporary jobs
and 2,421 permanent ones!

FIRST YEAR IMPACT: MF Construction452 MF Homes
INCLUDING:
442 Jobs in Construction 61 Jobs in Business and Professional Services 51 Jobs in Wholesale & Retail Trade
Local Income Local Taxes Local Jobs$26,415,000 $1,461,000 573
Local Income Local Taxes Local Job$11,947,000 $988,000 242
FIRST YEAR IMPACT: MF Ripple
INCLUDING:
56 Jobs in Wholesale and Retail Trade 35 Jobs in Local Government 29 Jobs in Health, Education & Social Services

ONGOING MF ANNUAL EFFECT
Local Income Local Taxes Local Jobs$17,498,000 $2,199,000 323
INCLUDING:
68 Jobs in Wholesale and Retail Trade 39 Jobs in Local Government 39 Jobs in Health, Education & Social Services

TOTAL MF IMPACT:FIRST TEN YEARS
Local Income Local Taxes
$204,593,000 $23,339,000
Along with 815 temporary jobs and 323 permanent ones!
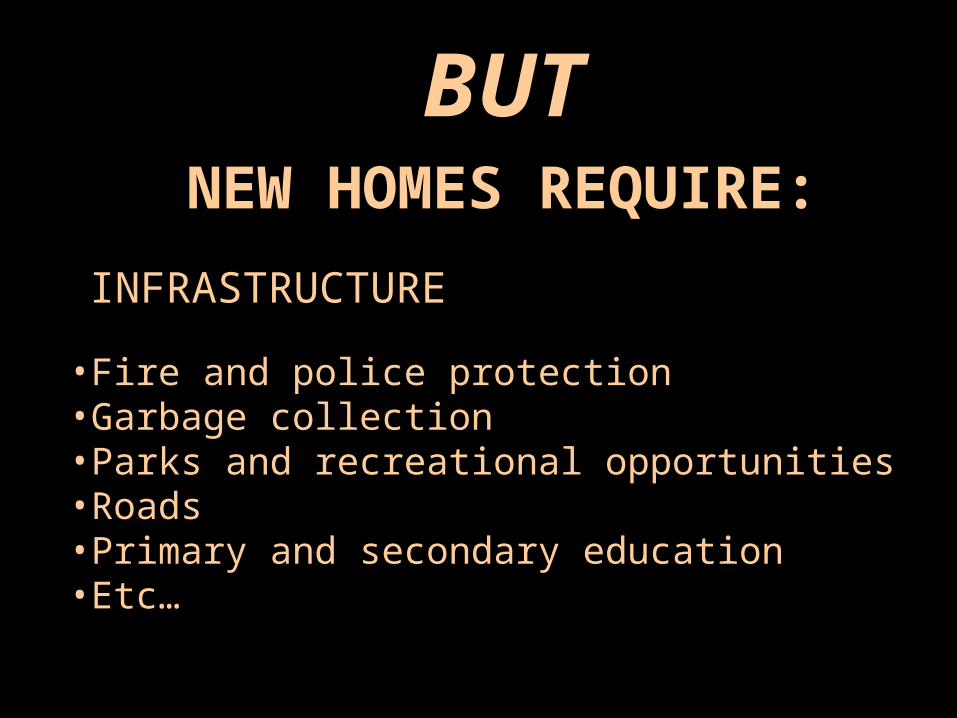
BUTNEW HOMES REQUIRE:
•Fire and police protection•Garbage collection•Parks and recreational opportunities•Roads•Primary and secondary education •Etc…
INFRASTRUCTURE
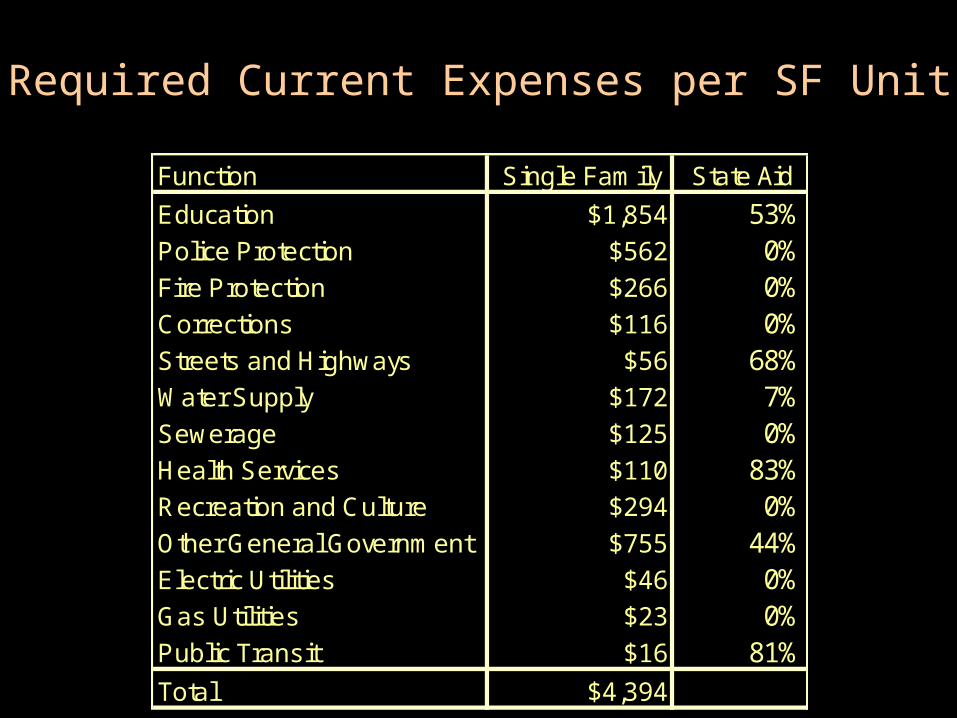
Required Current Expenses per SF Unit
Function Single Family State Aid
Education $1,854 53%Police Protection $562 0%Fire Protection $266 0%Corrections $116 0%Streets and Highways $56 68%Water Supply $172 7%Sewerage $125 0%Health Services $110 83%Recreation and Culture $294 0%Other General Government $755 44%Electric Utilities $46 0%Gas Utilities $23 0%Public Transit $16 81%Total $4,394

Required Current Expenses per MF Unit
Function Multifamily State Aid
Education $1,078 53%Police Protection $418 0%Fire Protection $198 0%Corrections $86 0%Streets and Highways $39 68%Water Supply $90 7%Sewerage $65 0%Health Services $82 83%Recreation and Culture $219 0%Other General Government $562 44%Electric Utilities $34 0%Gas Utilities $17 0%Public Transit $12 81%Total $2,900

Required Capital per SF Unit
Function Single Family
Schools $6,101
Hospitals $77
Other Buildings $3,788
Highways and Streets $1,928
Conservation & dev. $68
Sewer Systems $2,755
Water Supply $5,368
Other structures $5,397
Equipment $236
Total $25,717
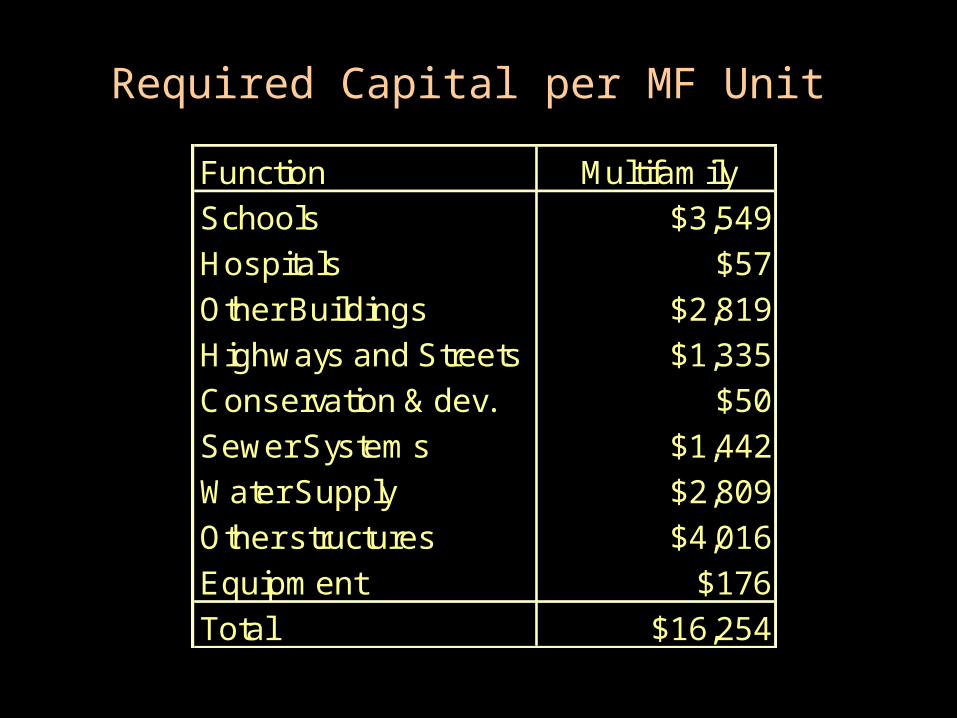
Required Capital per MF Unit
Function Multifamily
Schools $3,549
Hospitals $57
Other Buildings $2,819
Highways and Streets $1,335
Conservation & dev. $50
Sewer Systems $1,442
Water Supply $2,809
Other structures $4,016
Equipment $176
Total $16,254

Does new construction pay for itself?
The benefits of construction
&
The costs of construction
Now that we know:

• By the 2nd year economic impacts offset fiscal costs• By the end of the 13th year the debt is fully paid off • In the 13th year, net is $4,388,256 and is $4,526,406 thereafter
Yes it does!
Current Operating Investment Debt at Interest Net
Year Expenses Revenue Surplus Start of Year Year End On Debt Income
1 5,816,000 36,200,748 30,384,748 67,756,000 40,353,081 2,981,828 -40,353,081
2 11,632,000 16,158,406 4,526,406 0 37,602,546 1,775,872 2,750,535
3 11,632,000 16,158,406 4,526,406 0 34,730,965 1,654,825 2,871,581
4 11,632,000 16,158,406 4,526,406 0 31,733,010 1,528,452 2,997,955
5 11,632,000 16,158,406 4,526,406 0 28,603,120 1,396,517 3,129,890
6 11,632,000 16,158,406 4,526,406 0 25,335,489 1,258,776 3,267,631
7 11,632,000 16,158,406 4,526,406 0 21,924,055 1,114,973 3,411,434
8 11,632,000 16,158,406 4,526,406 0 18,362,490 964,841 3,561,565
9 11,632,000 16,158,406 4,526,406 0 14,644,186 808,103 3,718,304
10 11,632,000 16,158,406 4,526,406 0 10,762,246 644,466 3,881,940
11 11,632,000 16,158,406 4,526,406 633,000 7,342,468 473,628 3,419,778
12 11,632,000 16,158,406 4,526,406 0 3,139,191 323,130 4,203,277
13 11,632,000 16,158,406 4,526,406 0 0 138,151 4,388,256
14 11,632,000 16,158,406 4,526,406 0 0 0 4,526,406
15 11,632,000 16,158,406 4,526,406 0 0 0 4,526,406
For all 2,349 SF and 452 MF units--

Over 15 years, every 2,349 SF and 452 MF units generate a cumulative $262.4 million in revenue for local governments—but only $252.1 million in costs
Costs Compared to Revenue: All 2,349 SF and 452 MF Units
0
50
100
150
200
250
300
1 2 3 4 5 6 7 8 9 10 11 12 13 14 15
Year
$Millions
Cumulative Cost
Cumulative Revenue

Almost done, just a bit more
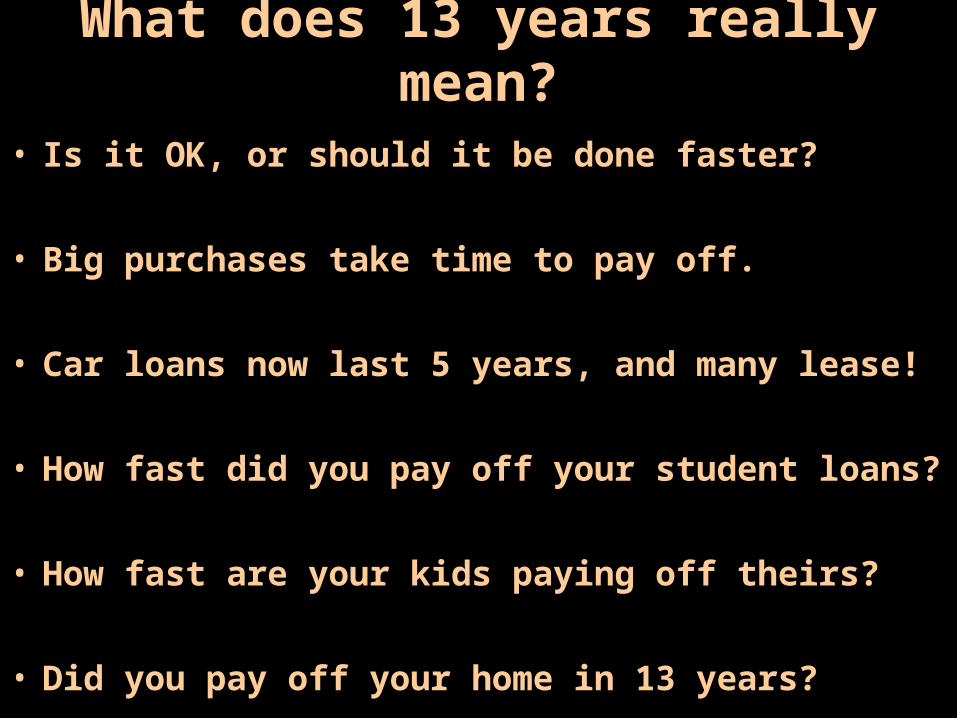
What does 13 years really mean?
• Is it OK, or should it be done faster?
• Big purchases take time to pay off.
• Car loans now last 5 years, and many lease!
• How fast did you pay off your student loans?
• How fast are your kids paying off theirs?
• Did you pay off your home in 13 years?

A Closer Look at Primary and Secondary
Ed.
• 12.6% attend Private Schools• 1.7% are Home schooled• 0.4 school age children / MF unit• 0.6 school age children / SF unit • State aid is $1.3 billion or 53% of
budget

How Large Are Non Property Tax Revenues
• SF property taxes are $2,950/yearBut, yearly revenue is $5,943/unit per year, which is 101% more.
• MF property taxes are $1,358/yearBut, yearly revenue is $4,865/unit per year, which is 258% more.
• Clearly, property taxes are not the whole story!

Elliot F. Eisenberg, Ph.D.
Call: 202.266.8398Fax: 202.266.8426
1201 15th Street NWWashington, DC 20005-2800
QUESTIONS?