Embed Size (px)
Citation preview
www.zillow.com/research/
APRIL2019 San Jose Metro
National Home Values
Current: $226,800Monthly Change: -0.1%Quarterly Change: 0.4%Annual Change: 6.1%Negative Equity*: 8.2%
San Jose Home Values
Current: $1,193,600Monthly Change: -1.4%Quarterly Change: -4.4%Annual Change: -2.7%Negative Equity*: 1.5%
Home Values Forecast
(next 12 months)
National: 2.8%San Jose Metro: –%
Major Cities - Home Values
San JoseCurrent: $1,039,700Monthly Change: -1.4%Annual Change: -1.1%
SunnyvaleCurrent: $1,713,500Monthly Change: -1.5%Annual Change: -8.2%
Santa ClaraCurrent: $1,305,100Monthly Change: -1.6%Annual Change: -5.5%
Mountain ViewCurrent: $1,825,500Monthly Change: -1%Annual Change: -2.3%
MilpitasCurrent: $1,051,100Monthly Change: -1.6%Annual Change: -2.6%
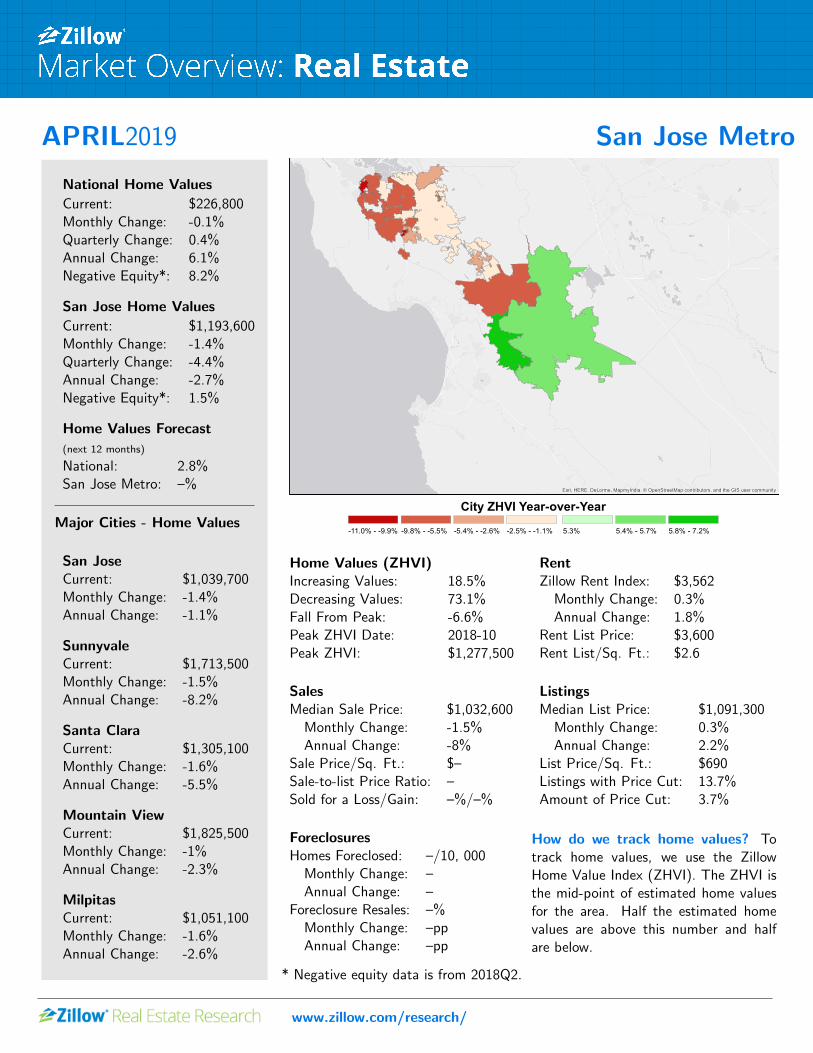
Esri, HERE, DeLorme, MapmyIndia, © OpenStreetMap contributors, and the GIS user community
City ZHVI Year-over-Year-11.0% - -9.9% -9.8% - -5.5% -5.4% - -2.6% -2.5% - -1.1% 5.3% 5.4% - 5.7% 5.8% - 7.2%
Home Values (ZHVI)Increasing Values: 18.5%Decreasing Values: 73.1%Fall From Peak: -6.6%Peak ZHVI Date: 2018-10Peak ZHVI: $1,277,500
RentZillow Rent Index: $3,562Monthly Change: 0.3%Annual Change: 1.8%
Rent List Price: $3,600Rent List/Sq. Ft.: $2.6
SalesMedian Sale Price: $1,032,600Monthly Change: -1.5%Annual Change: -8%
Sale Price/Sq. Ft.: $–Sale-to-list Price Ratio: –Sold for a Loss/Gain: –%/–%
ListingsMedian List Price: $1,091,300Monthly Change: 0.3%Annual Change: 2.2%
List Price/Sq. Ft.: $690Listings with Price Cut: 13.7%Amount of Price Cut: 3.7%
ForeclosuresHomes Foreclosed: –/10, 000Monthly Change: –Annual Change: –
Foreclosure Resales: –%Monthly Change: –ppAnnual Change: –pp
How do we track home values? Totrack home values, we use the ZillowHome Value Index (ZHVI). The ZHVI isthe mid-point of estimated home valuesfor the area. Half the estimated homevalues are above this number and halfare below.
* Negative equity data is from 2018Q2.
APRIL2019
*The top 20 largest cities and top 10 (or all) counties within the metro are listed. Additional counties, cities, neighborhoods and ZIP codes may be
available online at www.zillow.com/research/data by emailing [email protected]
Zillow Research:Zillow R© is the leading real estate and rental marketplace dedicated to empowering consumers with data, inspiration and knowledge around the placethey call home, and connecting them with the best local professionals who can help. In addition, Zillow operates an industry-leading economics andanalytics bureau led by Zillow’s Chief Economist Dr. Svenja Gudell. Dr. Gudell and her team of economists and data analysts produce extensive housingdata and research covering more than 450 markets at Zillow Real Estate Research. Zillow also sponsors the quarterly Zillow Home Price ExpectationsSurvey, which asks more than 100 leading economists, real estate experts and investment and market strategists to predict the path of the Zillow HomeValue Index over the next five years. Zillow also sponsors the bi-annual Zillow Housing Confidence Index (ZHCI) which measures consumer confidence inlocal housing markets, both currently and over time. Launched in 2006, Zillow is owned and operated by Zillow Group (NASDAQ: Z), andheadquartered in Seattle.
www.zillow.com/research/
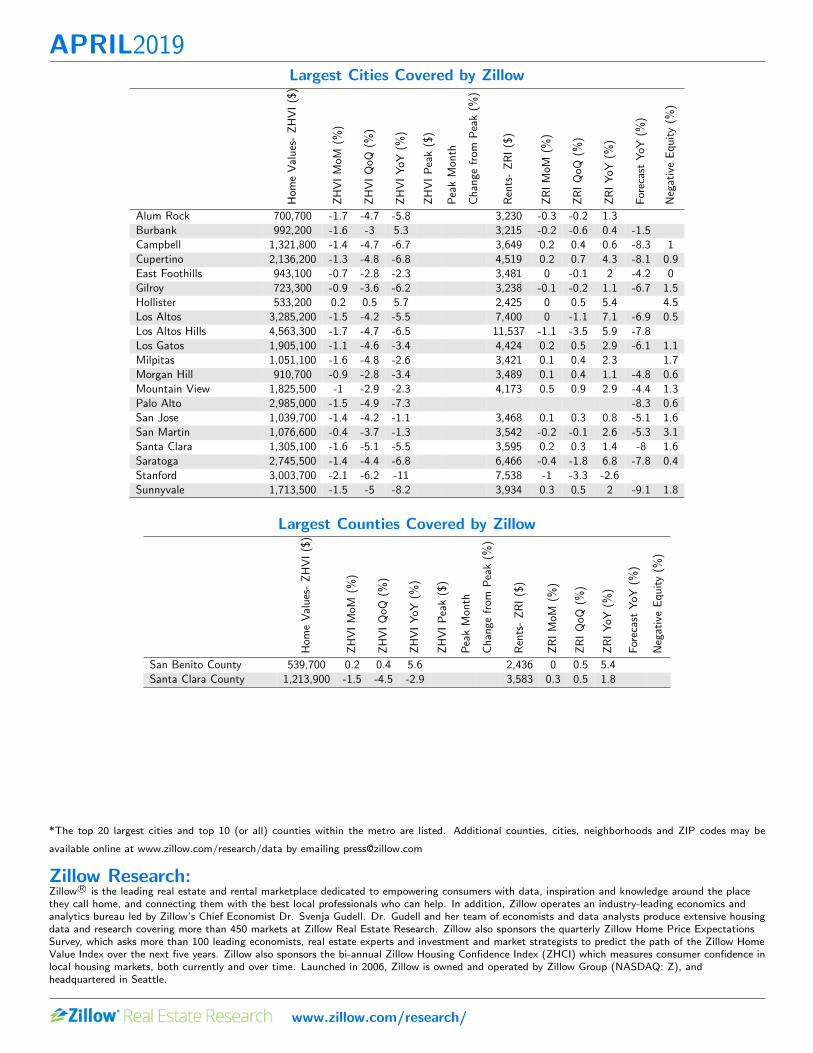
Largest Cities Covered by Zillow
Hom
eValues-ZHVI($)
ZHVIMoM
(%)
ZHVIQoQ
(%)
ZHVIYoY
(%)
ZHVIPeak($)
PeakMon
th
Change
from
Peak(%
)
Rents-ZRI($)
ZRIMoM
(%)
ZRIQoQ
(%)
ZRIYoY
(%)
ForecastYoY
(%)
NegativeEquity(%
)
Alum Rock 700,700 -1.7 -4.7 -5.8 3,230 -0.3 -0.2 1.3Burbank 992,200 -1.6 -3 5.3 3,215 -0.2 -0.6 0.4 -1.5Campbell 1,321,800 -1.4 -4.7 -6.7 3,649 0.2 0.4 0.6 -8.3 1Cupertino 2,136,200 -1.3 -4.8 -6.8 4,519 0.2 0.7 4.3 -8.1 0.9East Foothills 943,100 -0.7 -2.8 -2.3 3,481 0 -0.1 2 -4.2 0Gilroy 723,300 -0.9 -3.6 -6.2 3,238 -0.1 -0.2 1.1 -6.7 1.5Hollister 533,200 0.2 0.5 5.7 2,425 0 0.5 5.4 4.5Los Altos 3,285,200 -1.5 -4.2 -5.5 7,400 0 -1.1 7.1 -6.9 0.5Los Altos Hills 4,563,300 -1.7 -4.7 -6.5 11,537 -1.1 -3.5 5.9 -7.8Los Gatos 1,905,100 -1.1 -4.6 -3.4 4,424 0.2 0.5 2.9 -6.1 1.1Milpitas 1,051,100 -1.6 -4.8 -2.6 3,421 0.1 0.4 2.3 1.7Morgan Hill 910,700 -0.9 -2.8 -3.4 3,489 0.1 0.4 1.1 -4.8 0.6Mountain View 1,825,500 -1 -2.9 -2.3 4,173 0.5 0.9 2.9 -4.4 1.3Palo Alto 2,985,000 -1.5 -4.9 -7.3 -8.3 0.6San Jose 1,039,700 -1.4 -4.2 -1.1 3,468 0.1 0.3 0.8 -5.1 1.6San Martin 1,076,600 -0.4 -3.7 -1.3 3,542 -0.2 -0.1 2.6 -5.3 3.1Santa Clara 1,305,100 -1.6 -5.1 -5.5 3,595 0.2 0.3 1.4 -8 1.6Saratoga 2,745,500 -1.4 -4.4 -6.8 6,466 -0.4 -1.8 6.8 -7.8 0.4Stanford 3,003,700 -2.1 -6.2 -11 7,538 -1 -3.3 -2.6Sunnyvale 1,713,500 -1.5 -5 -8.2 3,934 0.3 0.5 2 -9.1 1.8
Largest Counties Covered by Zillow
Hom
eValues-ZHVI($)
ZHVIMoM
(%)
ZHVIQoQ
(%)
ZHVIYoY
(%)
ZHVIPeak($)
PeakMon
th
Change
from
Peak(%
)
Rents-ZRI($)
ZRIMoM
(%)
ZRIQoQ
(%)
ZRIYoY
(%)
ForecastYoY
(%)
NegativeEquity(%
)San Benito County 539,700 0.2 0.4 5.6 2,436 0 0.5 5.4Santa Clara County 1,213,900 -1.5 -4.5 -2.9 3,583 0.3 0.5 1.8