Embed Size (px)
Citation preview
Ordinary Meeting of Council 29 May 2017 334
File: FI-914.05.001 Doc: IC17/248
ITEM 18 APRIL 2017 FINANCIALS The April 2017 financial results are positive compared to phased budget across the key indicators. The Operating Result (pre capital) is favourable by $6.0M and the Funds Result shows a favourable variance compared to the phased budget of $3.0M.
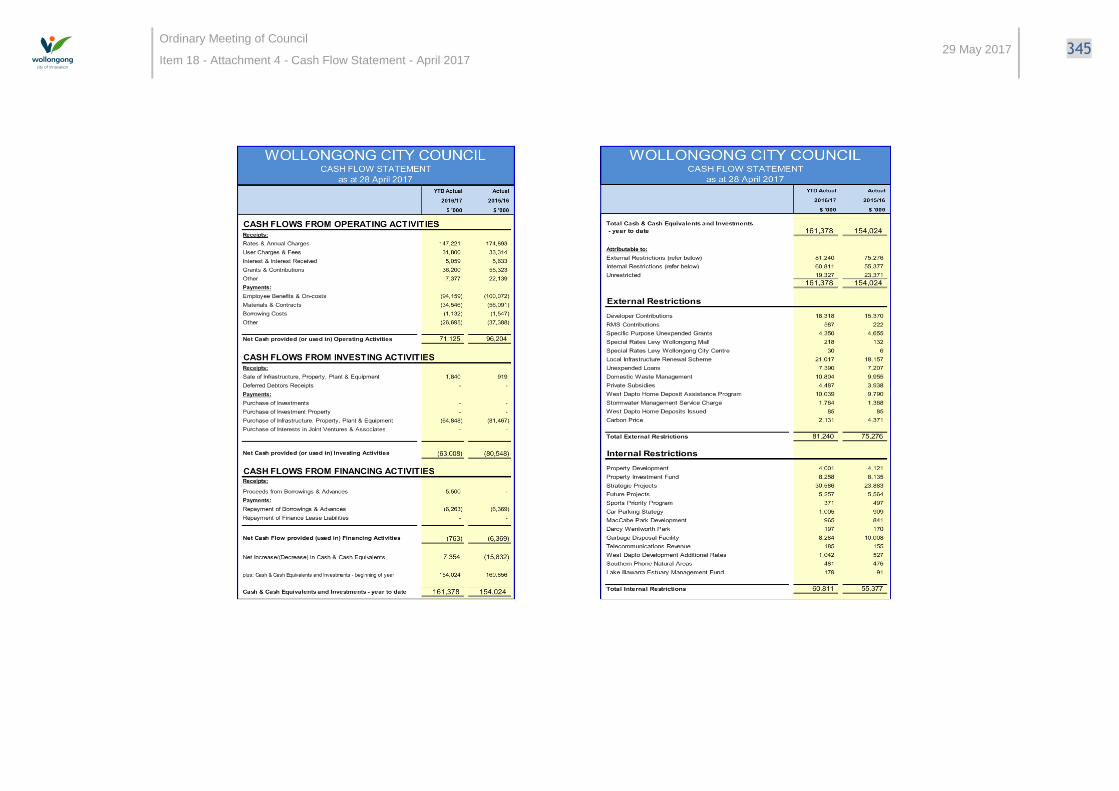
The Cash Flow Statement at the end of the period indicates that there is sufficient cash to support external restrictions.
Council has expended $57.7M on its capital works program representing 65% of the annual budget. The year to date budget is $60.4M (or 68% of the annual budget).
The financial statements and associated variances include the adjustments proposed at the March Quarterly Review.
RECOMMENDATION
1 The financials be received and noted.
2 Proposed changes in the Capital Works Program be approved.
REPORT AUTHORISATIONS
Report of: Brian Jenkins, Manager Finance Authorised by: Kerry Hunt, Director Corporate and Community Services - Creative, Engaged and
Innovative City (Acting)
ATTACHMENTS
1 Income and Expenses Statement - April 2017 2 Capital Project Report - April 2017 3 Balance Sheet - April 2017 4 Cash Flow Statement - April 2017
BACKGROUND
This report presents the Income and Expense Statement, Balance Sheet and Cash Flow Statement for April 2017. Council’s current budget has a Net Funding (cash) deficit of $1.9M, an Operating Surplus [Pre Capital] of $11.3M and a capital expenditure of $88.4M. The current annual Net Funding budget includes a transfer to reserve of $2.6M that relates to the 2015-16 year end positive funds result and $4.9M that relates to positive results at the Quarterly Reviews in the current year.
At the end of April, Council remains on target to achieve the forecast annual results.
The following table provides a summary view of the organisation’s overall financial results for the year to date.

Ordinary Meeting of Council 29 May 2017 335
Financial Performance
The April 2017 Operating Result [pre capital] shows a positive variance compared to budget of $6.0M. The Operating Result, which includes capital grants and contributions, has a greater positive variance of $7.5M due to higher than anticipated city wide developer contributions and timing of grant funded works.
The Operating Result includes non-cash or restricted variations such as lower depreciation ($1.2M), lower externally funded operational projects expenditure ($1.5M) and the loss on disposal of assets ($0.1M). This has resulted in a variation in Funds Available from Operations of $3.2M.
Funds Result
The Total Funds result includes the funds component of the Operating Result in addition to lower capital expenditure that is largely offset by a similar movement in funding.
Capital Budget
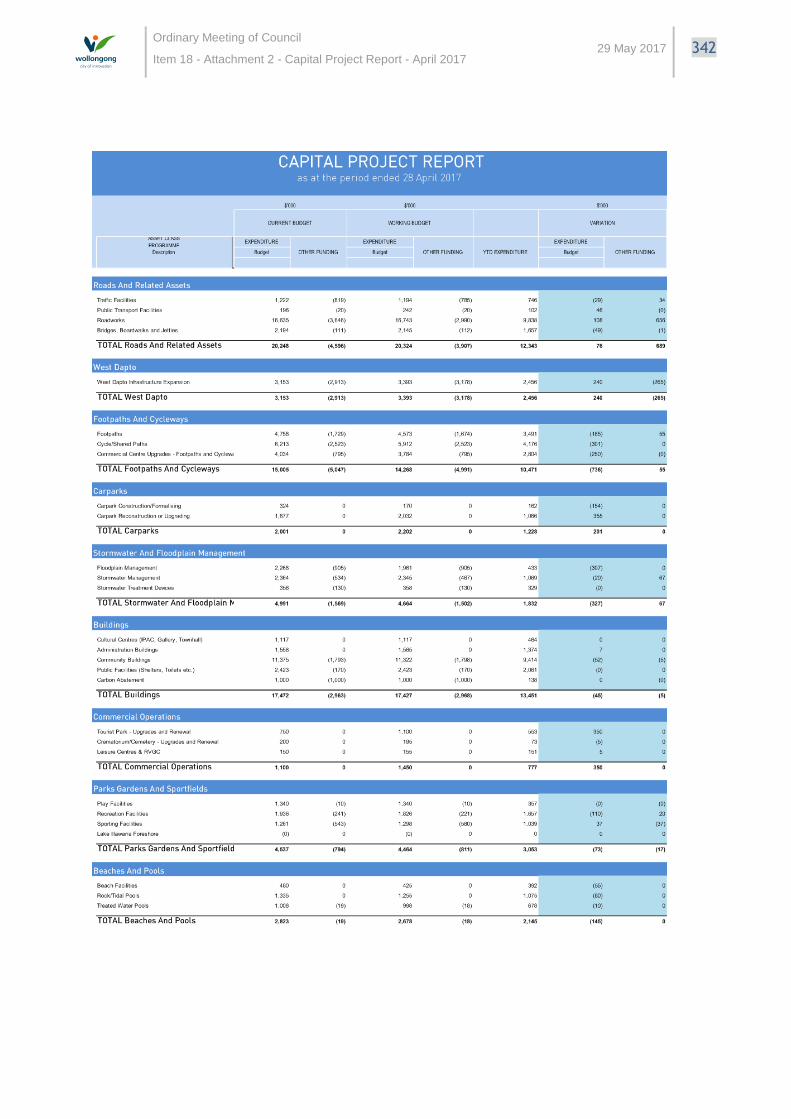
As at 28 April 2017, Council had expended $57.7M or 65% of the approved annual capital budget of $88.4M.
The April monthly report proposes a minor decrease of $0.03M in the capital works program although there has been a decrease of $2.8M in works able to be completed that have externally or internally restricted funding. The reallocation of funds from operations to capital will allow the Capital Program to remain at present levels and bring forward renewal and the completion of other works currently programed into next year.
If approved through the March Quarterly Review at Council’s meeting on May 29, the proposed increase in the Capital Program of $2.8M will be funded from decreases in operational expenditure. It is intended that the impacts of this variation over the two-year period 2016-17 and 2017- 18 will be reviewed and presented with the final budget review and adoption for 2017-18 in June this year.
Liquidity
Council’s cash and investments decreased during April 2017 to holdings of $161.3M compared to $171.2M at the end of March 2017. This reflects normal trends for this time of the year.
Original Revised YTD YTD
Budget Budget Forecast Actual Variation
KEY MOVEMENTS 1-Jul 28-Apr 28-Apr 28-Apr
Operating Revenue $M 262.0 267.3 221.8 222.1 0.4
Operating Costs $M (262.1) (256.0) (209.5) (203.8) 5.6
Operating Result [Pre Capital] $M (0.0) 11.3 12.3 18.3 6.0
Capital Grants & Contributions $M 32.9 12.0 7.7 9.3 1.5
Operating Result $M 32.9 23.3 20.1 27.6 7.5
Funds Available from Operations $M 61.8 65.4 56.1 59.3 3.2
Capital Works 101.6 88.4 60.4 57.7 2.7
Contributed Assets - - - - -
Transfer to Restricted Cash - 9.7 9.7 9.7 -
Borrowings Repaid $M 7.3 7.3 6.0 6.0 -
Funded from:
- Operational Funds $M 61.8 58.1 56.1 59.3 3.2
- Other Funding $M 47.1 38.1 28.9 26.0 (2.8)
Total Funds Surplus/(Deficit) $M (0.1) (1.9) 8.9 11.9 3.0
FORECAST POSITION

Ordinary Meeting of Council 29 May 2017 336
The Available Funds position excludes restricted cash. External restrictions are funds that must be spent for a specific purpose and cannot be used by Council for general operations. Internal restrictions are funds that Council has determined will be used for a specific future purpose.
The Available Funds forecast that was revised during the December Quarterly Review is within Council’s Financial Strategy target of 3.5% to 5.5% of Operational Revenue [pre capital] and is between $9.2M and $14.4M for the year ending 30 June 2017. The actual Available Funds at 28 April 2017 are impacted by the progress of planned expenditure and increased revenue to date.
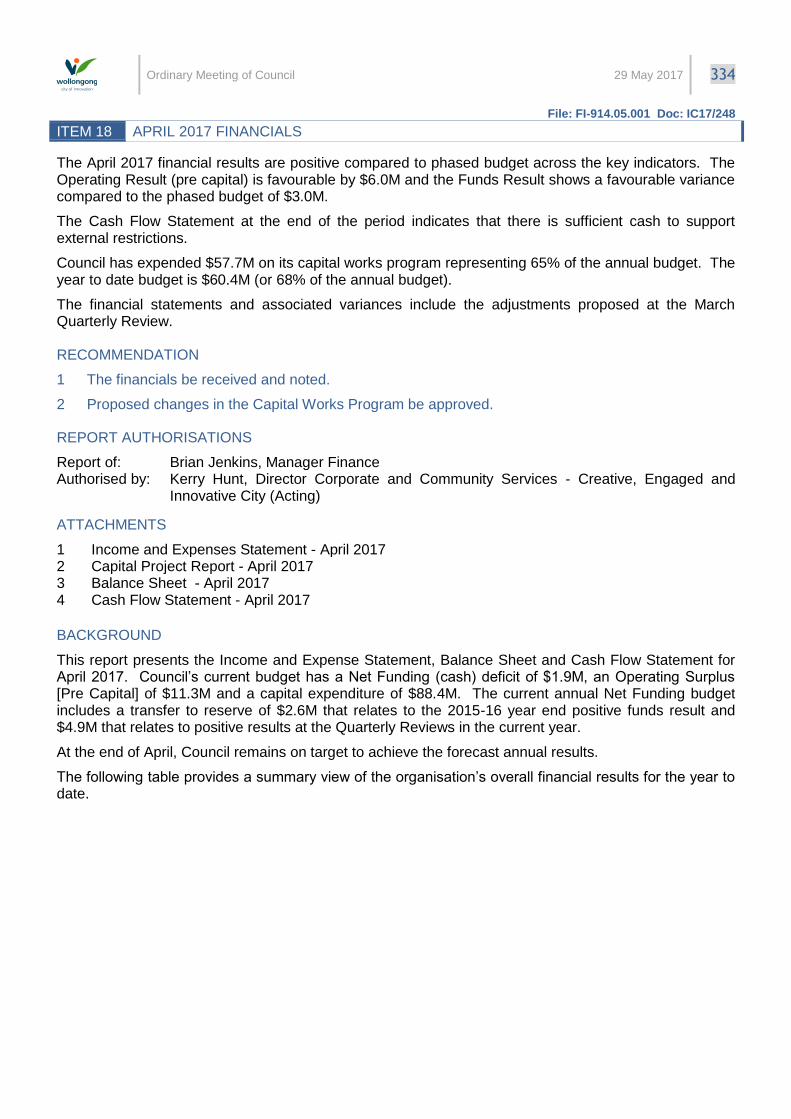
The Unrestricted Current Ratio measures the cash/liquidity position of an organisation. This ratio is intended to disclose the ability of an organisation to satisfy payment obligations in the short term from the unrestricted activities of Council. Council’s current ratio is above the Local Government Benchmark of >2:1, however, the strategy is to maximise the use of available funds for asset renewal by targeting a lean Unrestricted Current Ratio.
$M $M $M $M $M
Total Cash and Investments 154.0 133.7 137.8 143.6 161.3
Less Restrictions:
External 75.3 88.8 74.5 75.0 81.3
Internal 55.3 37.6 52.2 57.9 60.9
Total Restrictions 130.6 126.4 126.7 132.9 142.1
Available Cash 23.5 7.3 11.1 10.7 19.2
Adjusted for :
Current payables (34.9) (23.6) (23.5) (23.0) (22.3)
Receivables 22.9 23.0 25.3 25.1 25.5
Other 2.9 4.6 - 4.1
Net Payables & Receivables (9.1) 4.0 1.8 2.0 7.2
Available Funds 14.4 11.3 12.9 12.8 26.4
CASH, INVESTMENTS & AVAILABLE FUNDS
Actual
2015/16
Original
Budget
2016/17
December
QR
2016/17
March
QR
2016/17
Actual
Ytd
April
2017
Ordinary Meeting of Council 29 May 2017 337
Receivables
Receivables are the amount of money owed to Council or funds that Council has paid in advance. At April 2017, receivables totalled $25.5M, compared to receivables of $22.2M at April 2016. Fluctuations relate to the timing of rates payments which are accrued before the actual payments are due.
Payables
Payables (the amount of money owed to suppliers) of $22.3M were owed at April 2017 compared to payables of $22.2M in April 2016. The difference in payables relate to goods and services and capital projects delivered but not yet paid for, timing of the receipt of rating income and timing of the Financial Assistance Grant payments.
Debt
Council continues to have financial strength in its low level of borrowing. The industry measure of debt commitment is the Debt Service Ratio that measures the proportion of revenues that is required to meet annual loan repayments.
Council’s Financial Strategy includes provision for additional borrowing in the future and Council will consider borrowing opportunities from time to time to bring forward the completion of capital projects where immediate funding is not available. Council currently has borrowings through an interest free loan and the subsidised Local Government Infrastructure Renewal Scheme (LIRS). In 2009-10, Council borrowed $26M interest free to assist in the delivery of the West Dapto Access Plan. Council has also been successful in securing subsidies for loans under the three rounds of the LIRS program and has entered into loans of $20M in 2012-13 for Round 1, $4.3M in 2013-14 for Round 2 and $15M for Round 3. The LIRS program provides a loan subsidy of 4% for Round 1 and 3% for the subsequent rounds. Loan funds have been used to accelerate the Citywide Footpaths, Shared Path Renewal, Missing Links Construction Program, building refurbishment works for Berkeley Community Centre, Corrimal Library and Community Centre, Thirroul Pavilion and Kiosk and to support the West Dapto Access – Fowlers Road project respectively. Council was advised of eligibility for further subsidy under Round 3 and an additional amount of $5.5M was drawn down earlier this year that will also be used to support the West Dapto Access – Fowlers Road project.
J A S O N D J F M A M J
Monthly Result 2.50 2.09 1.91 2.12 2.10 2.00 2.42 2.40 2.41 2.44 - -
Target 1.52 1.52 1.52 1.52 1.52 1.52 1.52 1.52 1.52 1.52 1.52 1.52
-
0.50
1.00
1.50
2.00
2.50
3.00
Rati
o
Unrestricted Current Ratio
Ordinary Meeting of Council 29 May 2017 338
Council’s Debt Service Ratio forecast for 2016-17 is approximately 3.5%, which is still below Council’s target of 4% and remains low in comparison to the Local Government’s benchmark ratio of <10%. It is noted that non-cash interest expense relating to the amortisation of the income recognised on the West Dapto Access Plan Loan is not included when calculating the Debt Service Ratio.
Assets
The Balance Sheet shows that $2.5B of assets are controlled and managed by Council for the community as at 28 April 2017. The 2016-17 capital works program includes projects such as the West Dapto Access strategy, civil asset renewals including roads, car parks and buildings and purchase of library books. At the end of April, capital expenditure amounted to $57.7M.
PLANNING AND POLICY IMPACT
This report contributes to the delivery of Wollongong 2022 goal ‘We are a connected and engaged community’. It specifically delivers on the following:
Community Strategic Plan Delivery Program 2012-17 Annual Plan 2016-17
Strategy 5 Year Action Annual Deliverables
4.4.5 Finances are managed effectively to ensure long term financial sustainability
4.4.5.1 Effective and transparent financial management systems are in place
Provide accurate and timely financial reports monthly, quarterly and via the annual financial statement
CONCLUSION
The results for April 2017 are generally within projections over a range of financial indicators and it is expected that Council will achieve the forecast annual results.

Ordinary Meeting of Council
Item 18 - Attachment 1 - Income and Expenses Statement - April 2017 29 May 2017 339

Ordinary Meeting of Council
Item 18 - Attachment 2 - Capital Project Report - April 2017 29 May 2017 340

Ordinary Meeting of Council
Item 18 - Attachment 2 - Capital Project Report - April 2017 29 May 2017 341
Ordinary Meeting of Council
Item 18 - Attachment 2 - Capital Project Report - April 2017 29 May 2017 342

Ordinary Meeting of Council
Item 18 - Attachment 2 - Capital Project Report - April 2017 29 May 2017 343

Ordinary Meeting of Council
Item 18 - Attachment 3 - Balance Sheet - April 2017 29 May 2017 344
Ordinary Meeting of Council
Item 18 - Attachment 4 - Cash Flow Statement - April 2017 29 May 2017 345