Embed Size (px)
Citation preview
Port Macquarie-Hastings Reserves
Review
UTS CRICOS PROVIDER CODE 00099F
Institute for Public Policy and Governance Centre for Local Government

© University of Technology Sydney: Institute for Public Policy and Governance, 2017 UTS CRICOS Provider Code: 00099F
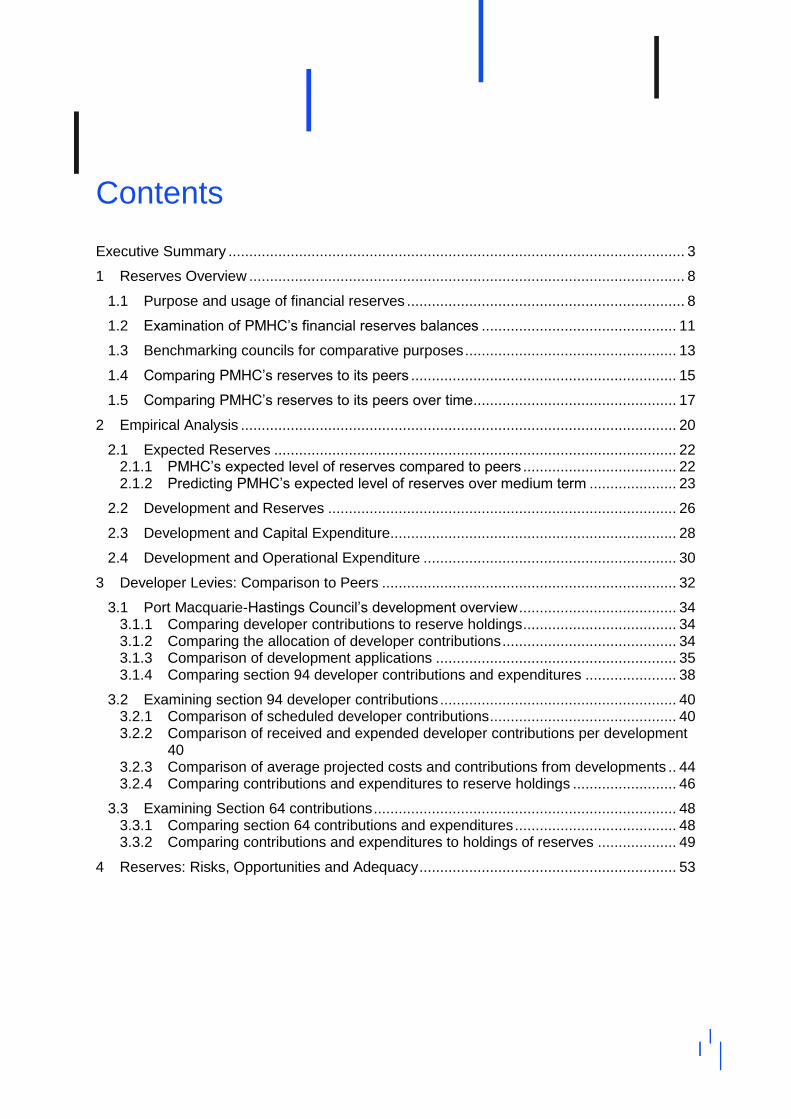
Contents
Executive Summary .............................................................................................................. 3
1 Reserves Overview ......................................................................................................... 8
1.1 Purpose and usage of financial reserves ................................................................... 8
1.2 Examination of PMHC’s financial reserves balances ............................................... 11
1.3 Benchmarking councils for comparative purposes ................................................... 13
1.4 Comparing PMHC’s reserves to its peers ................................................................ 15
1.5 Comparing PMHC’s reserves to its peers over time................................................. 17
2 Empirical Analysis ......................................................................................................... 20
2.1 Expected Reserves ................................................................................................. 22 2.1.1 PMHC’s expected level of reserves compared to peers ..................................... 22 2.1.2 Predicting PMHC’s expected level of reserves over medium term ..................... 23
2.2 Development and Reserves .................................................................................... 26
2.3 Development and Capital Expenditure..................................................................... 28
2.4 Development and Operational Expenditure ............................................................. 30
3 Developer Levies: Comparison to Peers ....................................................................... 32
3.1 Port Macquarie-Hastings Council’s development overview ...................................... 34 3.1.1 Comparing developer contributions to reserve holdings ..................................... 34 3.1.2 Comparing the allocation of developer contributions .......................................... 34 3.1.3 Comparison of development applications .......................................................... 35 3.1.4 Comparing section 94 developer contributions and expenditures ...................... 38
3.2 Examining section 94 developer contributions ......................................................... 40 3.2.1 Comparison of scheduled developer contributions ............................................. 40 3.2.2 Comparison of received and expended developer contributions per development 40 3.2.3 Comparison of average projected costs and contributions from developments .. 44 3.2.4 Comparing contributions and expenditures to reserve holdings ......................... 46
3.3 Examining Section 64 contributions ......................................................................... 48 3.3.1 Comparing section 64 contributions and expenditures ....................................... 48 3.3.2 Comparing contributions and expenditures to holdings of reserves ................... 49
4 Reserves: Risks, Opportunities and Adequacy .............................................................. 53
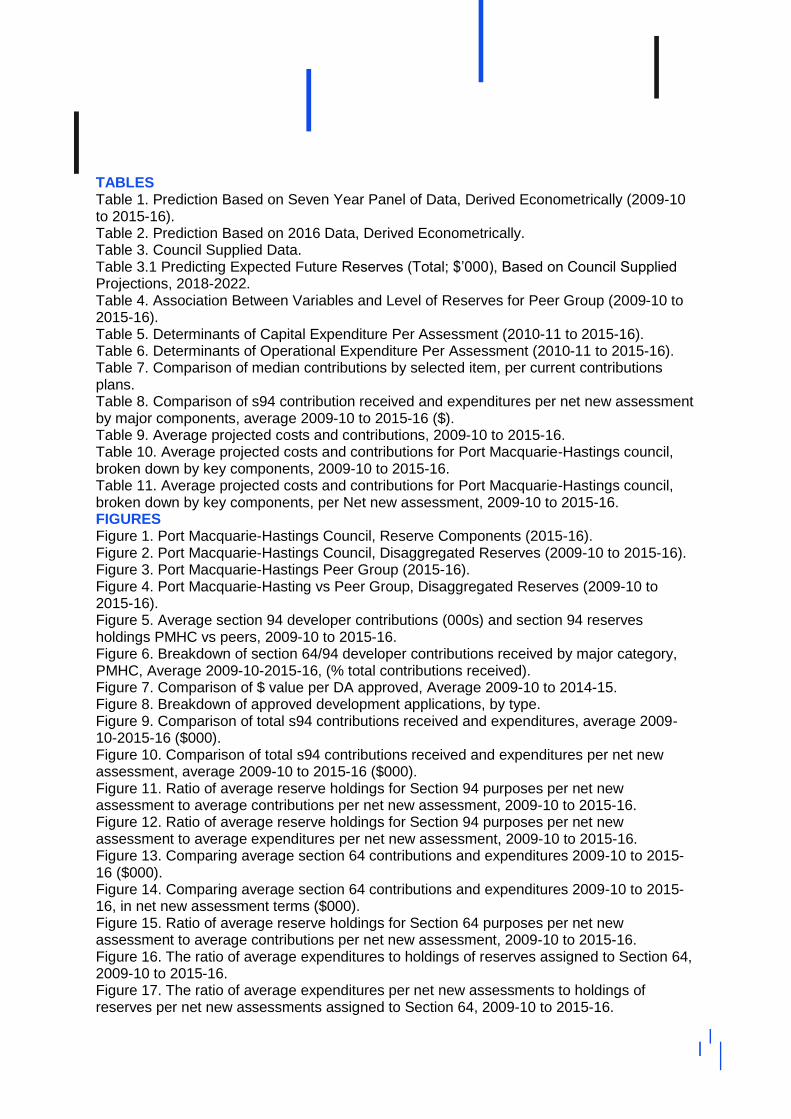
TABLES Table 1. Prediction Based on Seven Year Panel of Data, Derived Econometrically (2009-10 to 2015-16). Table 2. Prediction Based on 2016 Data, Derived Econometrically. Table 3. Council Supplied Data. Table 3.1 Predicting Expected Future Reserves (Total; $’000), Based on Council Supplied Projections, 2018-2022. Table 4. Association Between Variables and Level of Reserves for Peer Group (2009-10 to 2015-16). Table 5. Determinants of Capital Expenditure Per Assessment (2010-11 to 2015-16). Table 6. Determinants of Operational Expenditure Per Assessment (2010-11 to 2015-16). Table 7. Comparison of median contributions by selected item, per current contributions plans. Table 8. Comparison of s94 contribution received and expenditures per net new assessment by major components, average 2009-10 to 2015-16 ($). Table 9. Average projected costs and contributions, 2009-10 to 2015-16. Table 10. Average projected costs and contributions for Port Macquarie-Hastings council, broken down by key components, 2009-10 to 2015-16. Table 11. Average projected costs and contributions for Port Macquarie-Hastings council, broken down by key components, per Net new assessment, 2009-10 to 2015-16. FIGURES Figure 1. Port Macquarie-Hastings Council, Reserve Components (2015-16). Figure 2. Port Macquarie-Hastings Council, Disaggregated Reserves (2009-10 to 2015-16). Figure 3. Port Macquarie-Hastings Peer Group (2015-16). Figure 4. Port Macquarie-Hasting vs Peer Group, Disaggregated Reserves (2009-10 to 2015-16). Figure 5. Average section 94 developer contributions (000s) and section 94 reserves holdings PMHC vs peers, 2009-10 to 2015-16. Figure 6. Breakdown of section 64/94 developer contributions received by major category, PMHC, Average 2009-10-2015-16, (% total contributions received). Figure 7. Comparison of $ value per DA approved, Average 2009-10 to 2014-15. Figure 8. Breakdown of approved development applications, by type. Figure 9. Comparison of total s94 contributions received and expenditures, average 2009-10-2015-16 ($000). Figure 10. Comparison of total s94 contributions received and expenditures per net new assessment, average 2009-10 to 2015-16 ($000). Figure 11. Ratio of average reserve holdings for Section 94 purposes per net new assessment to average contributions per net new assessment, 2009-10 to 2015-16. Figure 12. Ratio of average reserve holdings for Section 94 purposes per net new assessment to average expenditures per net new assessment, 2009-10 to 2015-16. Figure 13. Comparing average section 64 contributions and expenditures 2009-10 to 2015-16 ($000). Figure 14. Comparing average section 64 contributions and expenditures 2009-10 to 2015-16, in net new assessment terms ($000). Figure 15. Ratio of average reserve holdings for Section 64 purposes per net new assessment to average contributions per net new assessment, 2009-10 to 2015-16. Figure 16. The ratio of average expenditures to holdings of reserves assigned to Section 64, 2009-10 to 2015-16. Figure 17. The ratio of average expenditures per net new assessments to holdings of reserves per net new assessments assigned to Section 64, 2009-10 to 2015-16.
EXECUTIVE SUMMARY PORT-MACQUARIE-HASTING RESERVES REVIEW
UTS: IPPG
3
Port Macquarie-Hastings Reserves Review
Executive Summary
UTS:IPPG has been engaged to conduct an external independent review of Port Macquarie-Hastings council’s internal and external financial reserves, in response to Council’s Resolution 09.05 from its Ordinary Council Meeting held on 19 April 2017.
The objectives that Councillors have set from this Resolution are as follows:
To review the extent to which Council’s reserve balances are appropriate in consideration of the size and breadth of the organisation (including benchmarking to similar sized Councils) and various legislation and Council resolutions that apply.
In consideration of the externally restricted reserves provide comment on the following:
o Whether the Section 64/94 Development Contributions Plans are up to date.
o Whether the charges in the Plans are adequate to fund the infrastructure identified.
o Whether the Council is maximising its use of development contributions revenue in funding the forward works program.
Determine whether further opportunities exist to use reserve balances as a means of funding (including opportunities for borrowing against these reserves and the impact of such a strategy) for other projects not currently funded in the works program.
Request the General Manager provide updates on the progress of the financial reserves review to the Finance, Corporate Services and Information Technology Portfolio and to all Councillors via appropriate briefings, prior to a final report being tabled at a future meeting of Council.
Undertake public education that explains why the financial reserves have been established, how they receive income and how they relate to Council’s longer-term plans, including future projects that the reserves are likely to be allocated towards.
In addition to the objectives set by Council Resolution 09.05, UTS:IPPG was also engaged to examine the financial implications (namely with respect to financial reserve requirements and holdings, as well as to operational and capital expenditures) related to growth in development, with a view to aid in Council’s long term planning and general financial sustainability.

EXECUTIVE SUMMARY PORT-MACQUARIE-HASTING RESERVES REVIEW
UTS: IPPG
4
Port Macquarie-Hastings Reserves Review
In order to address the objectives of Councillors and request for analysis, UTS:IPPG set the following aims in preparing this report:
To advise Council of its legislative and reporting requirements and opportunities with respect to its usage of its financial reserves.
To test the adequacy of Council’s current level of financial reserves and to project Council’s required level of financial reserves over the medium term.
To examine the association between growth in development and the level of actual and required financial reserves.
To examine the association between growth in development and the level of expenditures.
To determine the adequacy of Council’s developer contributions.
In preparing this report, UTS:IPPG has consulted the financial statements of Port Macquarie-Hastings Council and its peers for the period 2009-10 to 2015-16 relating to the level of financial reserves held, and the records of revenues and expenditures relating to developer contributions. In undertaking this analysis, we also examined the Developer Contributions Plans for Council and its peers, as well as being provided access to various Council-supplied resources.
UTS:IPPG performed empirical analysis from the financial reserves, expenditure and developer contributions data, as well as employing an econometric model which has generated estimates and informed our determinations, among other things, with respect to adequacy of Council’s financial reserves.
The key findings resulting from the analysis conducted by UTS:IPPG are as follows:
With respect to the adequacy of reserves:
• Our model predicts that at present the current aggregate level of financial reserves held by Port Macquarie-Hastings Council are greater than the expected level with respect to its peers1.
• Our model predicts that the current levels of total reserves are broadly in line with the expected future requirements for Port Macquarie-Hastings Council, according to Council supplied data up to 20222.
• Our model predicts that additional development, in the form of growth in assessable properties, results in higher expected levels of reserves:
o a one tenth percentage point increase to the growth rate of assessable properties is associated with an increase to the aggregate level of reserves by around $36.50 per assessment.
1 Note that there is an implicit assumption that peers carry adequate reserves and that Council has a lower proportion of internally restricted reserves than its peers 2 Readers, however, should be mindful of the standard error and the need for capital spending over this period

EXECUTIVE SUMMARY PORT-MACQUARIE-HASTING RESERVES REVIEW
UTS: IPPG
5
Port Macquarie-Hastings Reserves Review
With respect to expenditure:
• Growth in development is associated with an increase in per assessment capital expenditure.
o Namely, a one-tenth percentage increase in the growth rate of assessable properties is associated with a 1.01 per cent increase in per assessment capital expenditure, other things being equal.
• Growth in development is associated with a decrease in per assessment operating expenditure.
o Namely, a one-tenth percentage increase in growth rate of assessable properties is associated with a 0.5 per cent decrease in operating expenditure per assessment, other things being equal.
• For any given increase in development, the expected increase in per assessment capital expenditure is around twice the magnitude of the expected decrease in per assessment operating expenditure.
With respect to the adequacy of Council’s developer contributions:
• Compared to similar peers, Port Macquarie-Hastings Council is charging broadly consistent Section 94 developer levies for roughly equivalent properties overall, despite some variation between charges based on categories.
o Some relatively minor potential opportunities for review may be for Port Macquarie-Hastings Council to consider if contributions for parking and ‘other’ Section 94 purposes may be revised slightly upwards in order to reflect similar expenditure-determined levies comparable to its peers.
o Port Macquarie-Hastings Council does not currently levy charges for drainage works and may wish to review if it may be appropriate, in line with its peers that do levy for this purpose.
• We have found that Port Macquarie-Hastings Council has regularly projected that Section 94 projects were underfunded, particularly with respect to roads and traffic, and open space works.
o It would appear that this is being addressed, as contributions with respect to roads and traffic, and open space works, exceed expenditures on average.
• Compared to similar peers and its expenditures, Port Macquarie-Hastings Council is charging relatively high Section 64 developer levies.
• With respect to its infrastructure commitments, and the share of all development expenditures, Section 64 contributions are relatively low, compared to its peers.
Based on our analysis, this report indicates that Council’s reserves balances are currently adequate, however it is the view of UTS:IPPG that there is little room for complacency with these balances. We provide estimates in Section 2 of the minimum required level of reserves for the medium term and encourage Council to ensure that it maintains its healthy balance of reserves, informed by these estimates, going forward.
EXECUTIVE SUMMARY PORT-MACQUARIE-HASTING RESERVES REVIEW
UTS: IPPG
6
Port Macquarie-Hastings Reserves Review
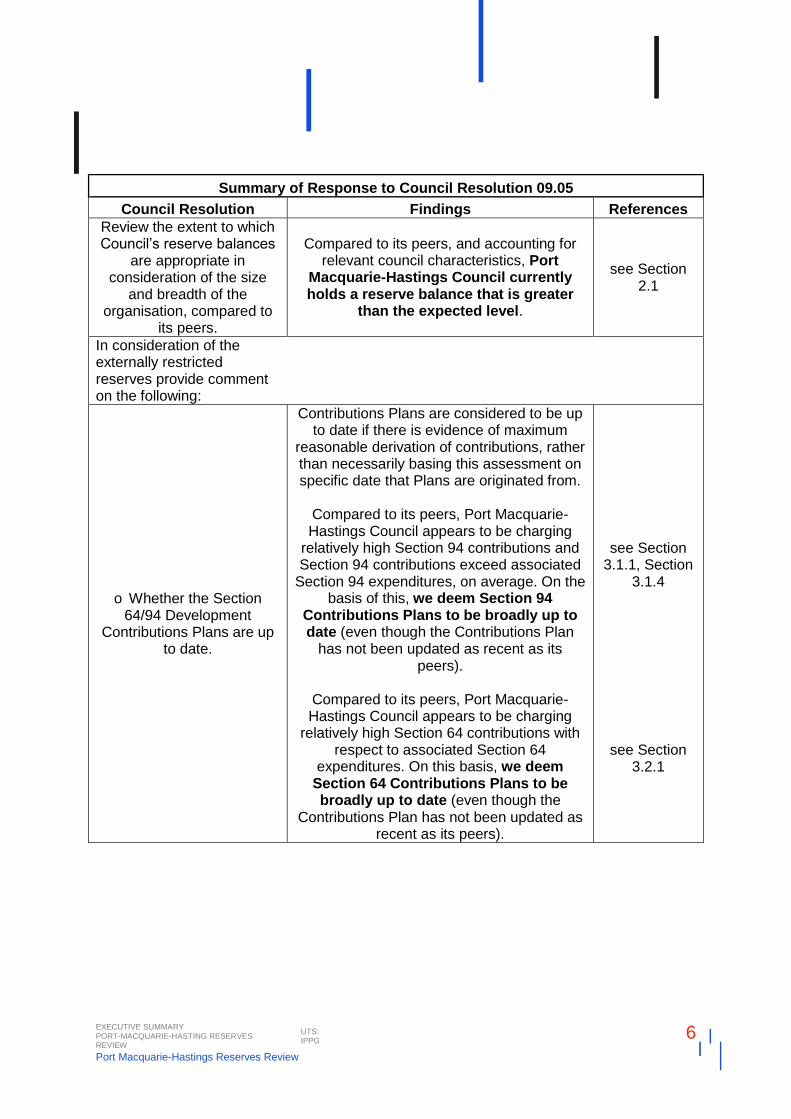
Summary of Response to Council Resolution 09.05
Council Resolution Findings References
Review the extent to which Council’s reserve balances
are appropriate in consideration of the size
and breadth of the organisation, compared to
its peers.
Compared to its peers, and accounting for relevant council characteristics, Port
Macquarie-Hastings Council currently holds a reserve balance that is greater
than the expected level.
see Section 2.1
In consideration of the externally restricted reserves provide comment on the following:
o Whether the Section 64/94 Development
Contributions Plans are up to date.
Contributions Plans are considered to be up to date if there is evidence of maximum
reasonable derivation of contributions, rather than necessarily basing this assessment on specific date that Plans are originated from.
Compared to its peers, Port Macquarie-Hastings Council appears to be charging
relatively high Section 94 contributions and Section 94 contributions exceed associated
Section 94 expenditures, on average. On the basis of this, we deem Section 94
Contributions Plans to be broadly up to date (even though the Contributions Plan
has not been updated as recent as its peers).
Compared to its peers, Port Macquarie-Hastings Council appears to be charging
relatively high Section 64 contributions with respect to associated Section 64
expenditures. On this basis, we deem Section 64 Contributions Plans to be broadly up to date (even though the
Contributions Plan has not been updated as recent as its peers).
see Section 3.1.1, Section
3.1.4
see Section 3.2.1
EXECUTIVE SUMMARY PORT-MACQUARIE-HASTING RESERVES REVIEW
UTS: IPPG
7
Port Macquarie-Hastings Reserves Review
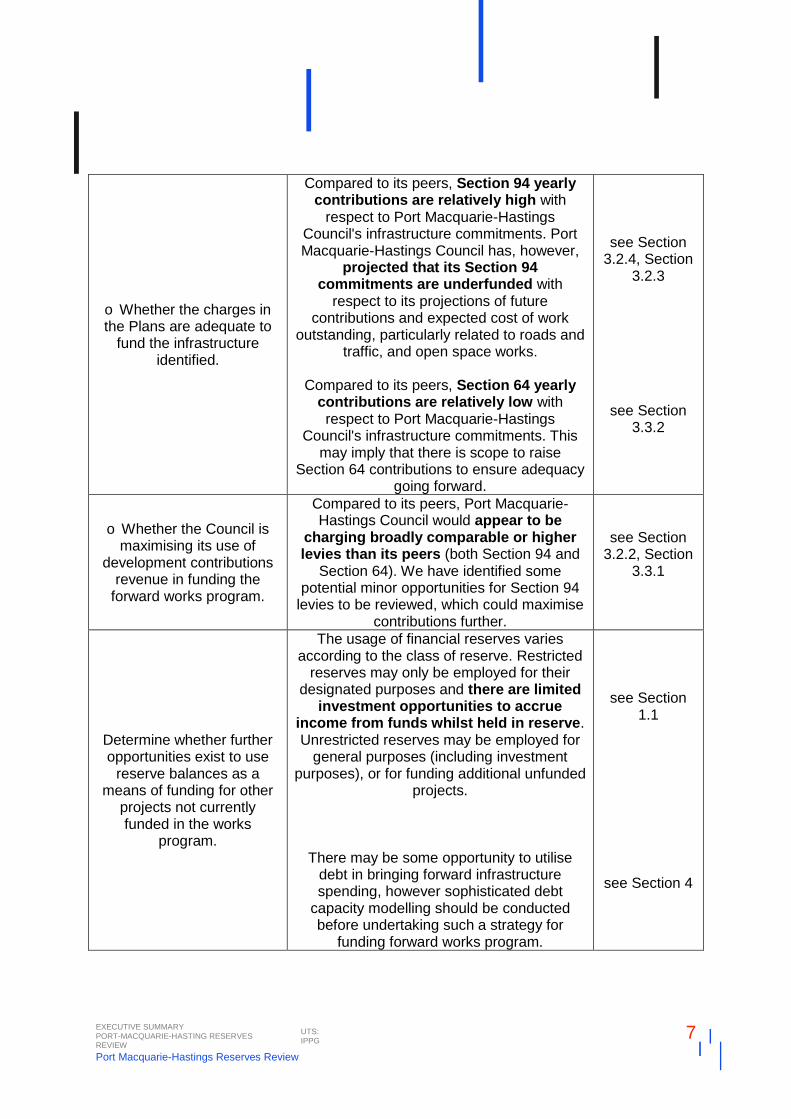
o Whether the charges in the Plans are adequate to
fund the infrastructure identified.
Compared to its peers, Section 94 yearly contributions are relatively high with
respect to Port Macquarie-Hastings Council's infrastructure commitments. Port Macquarie-Hastings Council has, however,
projected that its Section 94 commitments are underfunded with
respect to its projections of future contributions and expected cost of work
outstanding, particularly related to roads and traffic, and open space works.
Compared to its peers, Section 64 yearly
contributions are relatively low with respect to Port Macquarie-Hastings
Council's infrastructure commitments. This may imply that there is scope to raise
Section 64 contributions to ensure adequacy going forward.
see Section 3.2.4, Section
3.2.3
see Section 3.3.2
o Whether the Council is maximising its use of
development contributions revenue in funding the
forward works program.
Compared to its peers, Port Macquarie-Hastings Council would appear to be
charging broadly comparable or higher levies than its peers (both Section 94 and
Section 64). We have identified some potential minor opportunities for Section 94
levies to be reviewed, which could maximise contributions further.
see Section 3.2.2, Section
3.3.1
Determine whether further opportunities exist to use
reserve balances as a means of funding for other
projects not currently funded in the works
program.
The usage of financial reserves varies according to the class of reserve. Restricted
reserves may only be employed for their designated purposes and there are limited
investment opportunities to accrue income from funds whilst held in reserve. Unrestricted reserves may be employed for
general purposes (including investment purposes), or for funding additional unfunded
projects.
There may be some opportunity to utilise debt in bringing forward infrastructure spending, however sophisticated debt
capacity modelling should be conducted before undertaking such a strategy for
funding forward works program.
see Section 1.1
see Section 4
RESERVES OVERVIEW PORT-MACQUARIE-HASTING RESERVES REVIEW
UTS: IPPG
8
Port Macquarie-Hastings Reserves Review
1 Reserves Overview
In this Section, we provide a cursory outline of the purpose of financial reserves for local governments in New South Wales. We then discuss the required reporting, usage, opportunities and risks pertaining to financial reserves of Council. Next, we compare the quantum of reserves currently held, and over recent years, by PMHC to its peers (as well as discussing the selection of peers in Section 1.3), which provides a foundation for the empirical analysis that is featured, in particular, in Section 2.
1.1 Purpose and usage of financial reserves
First, we provide a discussion of the purpose of financial reserves, which are made up of the following:
Externally restricted reserves
Mostly monies raised to fund infrastructure
Internally restricted reserves
Funds approved by council resolutions for non-recurrent (largely discretionary) expenditures
Unrestricted reserves Monies that can be used for general or capital expenditure
Councils are required under the Office of Local Government Code of Accounting Practice to report reserves balances in the Annual Financial Statements (principally in Note 6c). In this Note, the details of the changes in balances are reported – namely, the total of transfers to and from respective classes of reserves balances.
A particularly large category of externally restricted reserves (making up around half of this balance) is that held for unexpended developer contributions, intended for the provision of services and amenities in accordance with Contributions Plans. With this in mind, we discuss the adequacy of developer contributions specifically in Section 3. In the remainder of Section 1 and in Section 2, we discuss generally with respect to the total balances of reserves. In part, this is motivated by an understanding that internally restricted and unrestricted reserves may be allocated to fund shortfalls in externally restricted reserves if necessary (though not vice versa).
Given that external reserves are accumulated primarily for the purpose of funding infrastructure requirements, Council has limited discretionary use of such funds, however it may manage the level of external reserves on hand by balancing its needs prudently (and adjusting, for instance, its developer contributions accordingly) and ensuring that the timing of expenditures are matched with an adequate balance or incoming funds. Holding an adequate supply of externally restricted reserves is necessary in order to ensure coverage of funds for infrastructure commitments when these fall due (however shortfalls may generally be funded by other reserves classes or from recurrent expenditure). For this reason, Council should ensure that at least the minimum quantum of required reserves are held, taking into account the relevant characteristics of Council – estimates for which we generate for PMHC in Section 2.
Internally restricted reserves may be related to discretionary undertakings as resolved by Council. As a result, while these funds are ‘restricted’ for the purposes that have been
RESERVES OVERVIEW PORT-MACQUARIE-HASTING RESERVES REVIEW
UTS: IPPG
9
Port Macquarie-Hastings Reserves Review
dedicated, Council may, for instance, have the opportunity to defer or cancel projects if it faces a shortfall in reserves (say, if costs of projects exceeds reserves held).
Unrestricted reserves are fully discretionary and may be deployed how Council sees fit (except for purely investment purposes, as discussed below). Examples of the usage of unrestricted reserves may be in response to operating position needs (such as for reduced operating deficits) in addition to being a source of funds for unfunded infrastructure commitments.
An excessive surplus of funds held in reserve may suggest that opportunity cost is incurred (with respect to alternative uses of this funding). For instance, if reserves are held rather than employed in infrastructure delivery for an extended period this would imply that there is a loss in potential social benefits to the community. On the other hand, reserve balances do not give rise to depreciation expense and because the receipt of some funds to these reserve balances represent income on the income statement, it therefore enhances Council’s operating position. Moreover, some reserve balances may earn interest and investment returns, which, among other things, improves interest and investment income, further improving its operating position. Inadequate reserves on hand, say, when infrastructure commitments fall due, would result in potential financial risk to council – because such expenditures may need to be funded from recurrent income, potentially introducing liquidity constraints.
Because council must accumulate a substantial quantum of funds in order to adequately cover its infrastructure commitments, in particular, it is necessary that Council effectively manage its portfolio of reserve funds. While Council is restricted in its use of reserves for investment purposes under regulations associated with the ‘investment order’ (Section 625) of the Local Government Act 19933, receipts from projects may be invested and subsequently drawn upon to meet construction costs when due. In particular, while the Act ensures that council may ‘only invest money that is not required by council for any purpose for the time being’, the source of investment in which council may invest has been regulated somewhat following the GFC (Global Financial Crisis).
Since July 2008 the NSW Government has prevented investment in securities of prime, high grade or upper-medium grade (Moodys, S&P, Fitch rating agencies) and is instead restricted to the following:
• Any public funds or securities issued or guaranteed by any State/Territory or Federal Government
• Debentures and securities issued by a council
• Mortgage of land (restricted to first mortgages over land with a Loan to Value ratio of 60% or less)
• Interest-bearing deposits with, or any debentures or bonds issued by, an authorised deposit-taking institution under the Commonwealth Banking Act 1959 (ie essentially banks and credit unions)
• Bills of exchange of under 200 day maturity
• Deposits with the Local Government Financial Services Pty Ltd
• Deposits with the NSW Treasury.
3 see Gazettes No 152 of 24.11.2000, p 12041; No 94 of 29.7.2005, p 3977; No 97 of 15.8.2008, p 7638 and No 160 of 24.12.2008, p 13140.
RESERVES OVERVIEW PORT-MACQUARIE-HASTING RESERVES REVIEW
UTS: IPPG
10
Port Macquarie-Hastings Reserves Review
PMHC may wish to review the returns earned on its current reserve holdings and allocate funds accordingly, so long as it meets the legislative restrictions as noted above. Nonetheless, these constraints mean that possible returns are somewhat limited, with special permission required by the Minister for alternative investment purposes. However, there is some provision for council to seek investment in alternative sources (for instance, Manly, Mosman and Pittwater councils were approved to purchase shares in Kimbriki Environmental Enterprises Pty Limited under Gazette no. 160 by then Minister for Local Government in December 2008).
RESERVES OVERVIEW PORT-MACQUARIE-HASTING RESERVES REVIEW
UTS: IPPG
11
Port Macquarie-Hastings Reserves Review
1.2 Examination of PMHC’s financial reserves balances
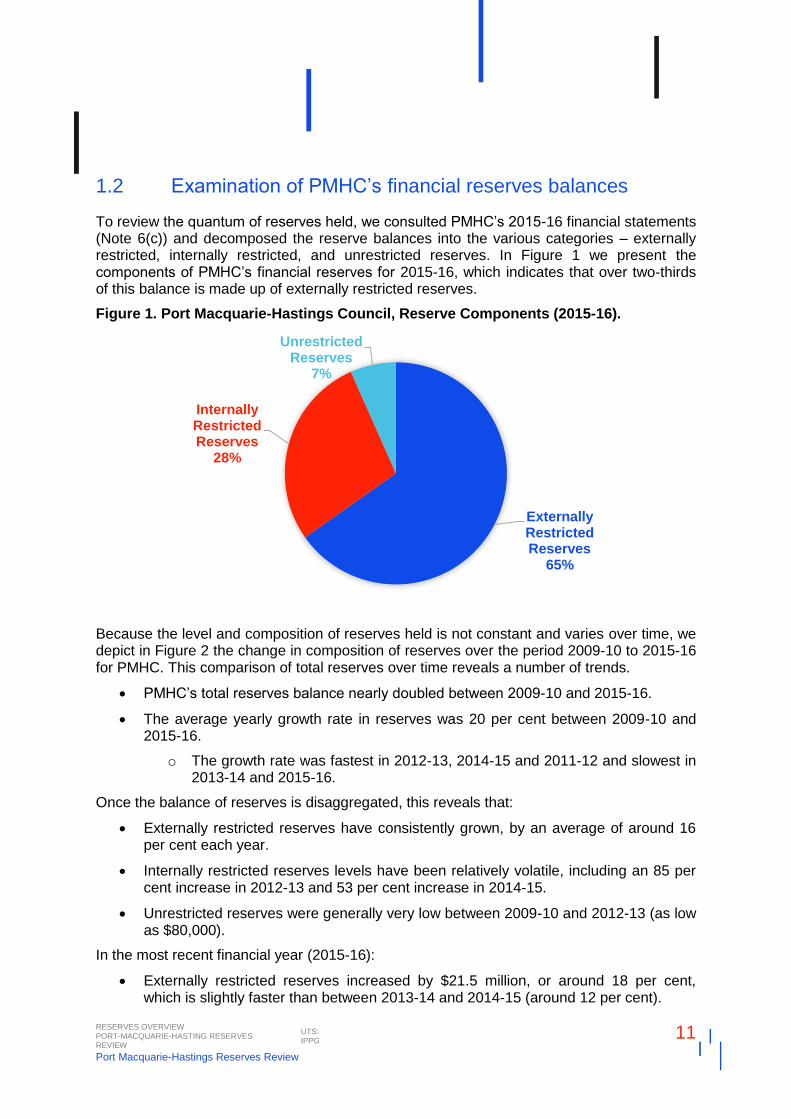
To review the quantum of reserves held, we consulted PMHC’s 2015-16 financial statements (Note 6(c)) and decomposed the reserve balances into the various categories – externally restricted, internally restricted, and unrestricted reserves. In Figure 1 we present the components of PMHC’s financial reserves for 2015-16, which indicates that over two-thirds of this balance is made up of externally restricted reserves.
Figure 1. Port Macquarie-Hastings Council, Reserve Components (2015-16).
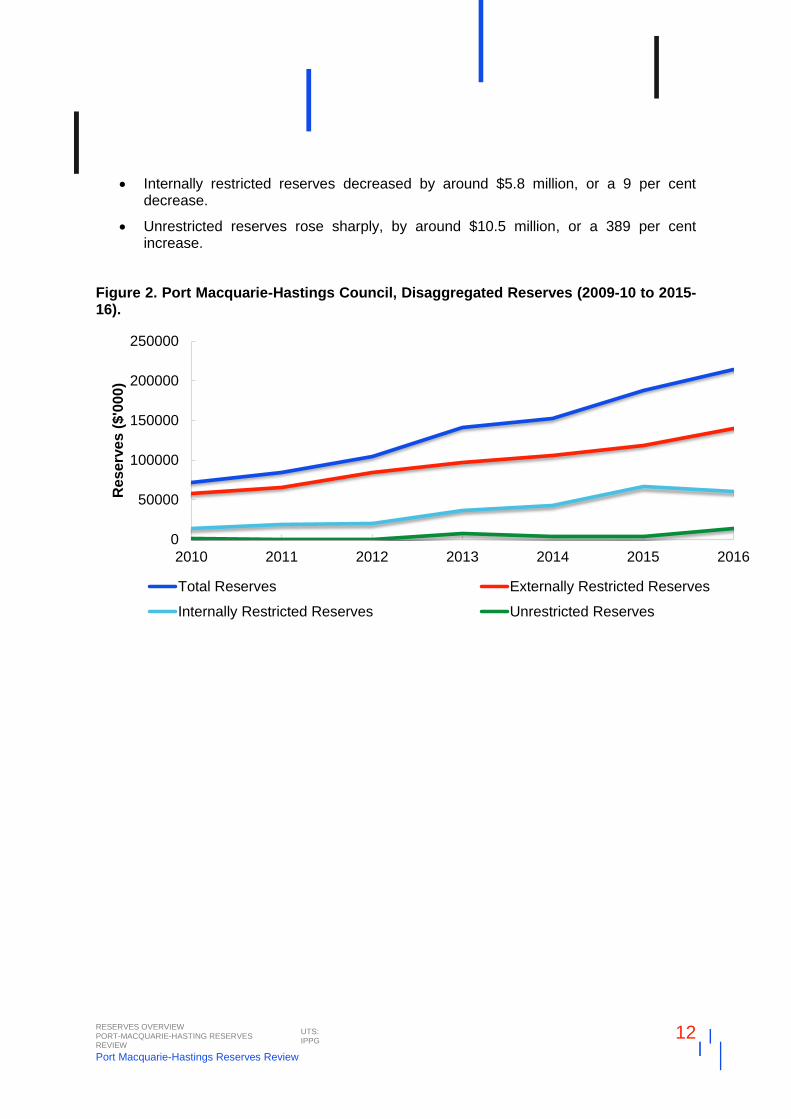
Because the level and composition of reserves held is not constant and varies over time, we depict in Figure 2 the change in composition of reserves over the period 2009-10 to 2015-16 for PMHC. This comparison of total reserves over time reveals a number of trends.
PMHC’s total reserves balance nearly doubled between 2009-10 and 2015-16.
The average yearly growth rate in reserves was 20 per cent between 2009-10 and 2015-16.
o The growth rate was fastest in 2012-13, 2014-15 and 2011-12 and slowest in 2013-14 and 2015-16.
Once the balance of reserves is disaggregated, this reveals that:
Externally restricted reserves have consistently grown, by an average of around 16 per cent each year.
Internally restricted reserves levels have been relatively volatile, including an 85 per cent increase in 2012-13 and 53 per cent increase in 2014-15.
Unrestricted reserves were generally very low between 2009-10 and 2012-13 (as low as $80,000).
In the most recent financial year (2015-16):
Externally restricted reserves increased by $21.5 million, or around 18 per cent, which is slightly faster than between 2013-14 and 2014-15 (around 12 per cent).
Externally Restricted Reserves
65%
Internally Restricted Reserves
28%
Unrestricted Reserves
7%
RESERVES OVERVIEW PORT-MACQUARIE-HASTING RESERVES REVIEW
UTS: IPPG
12
Port Macquarie-Hastings Reserves Review
Internally restricted reserves decreased by around $5.8 million, or a 9 per cent decrease.
Unrestricted reserves rose sharply, by around $10.5 million, or a 389 per cent increase.
Figure 2. Port Macquarie-Hastings Council, Disaggregated Reserves (2009-10 to 2015-16).
0
50000
100000
150000
200000
250000
2010 2011 2012 2013 2014 2015 2016
Re
se
rve
s (
$'0
00
)
Total Reserves Externally Restricted Reserves
Internally Restricted Reserves Unrestricted Reserves
RESERVES OVERVIEW PORT-MACQUARIE-HASTING RESERVES REVIEW
UTS: IPPG
13
Port Macquarie-Hastings Reserves Review
1.3 Benchmarking councils for comparative purposes
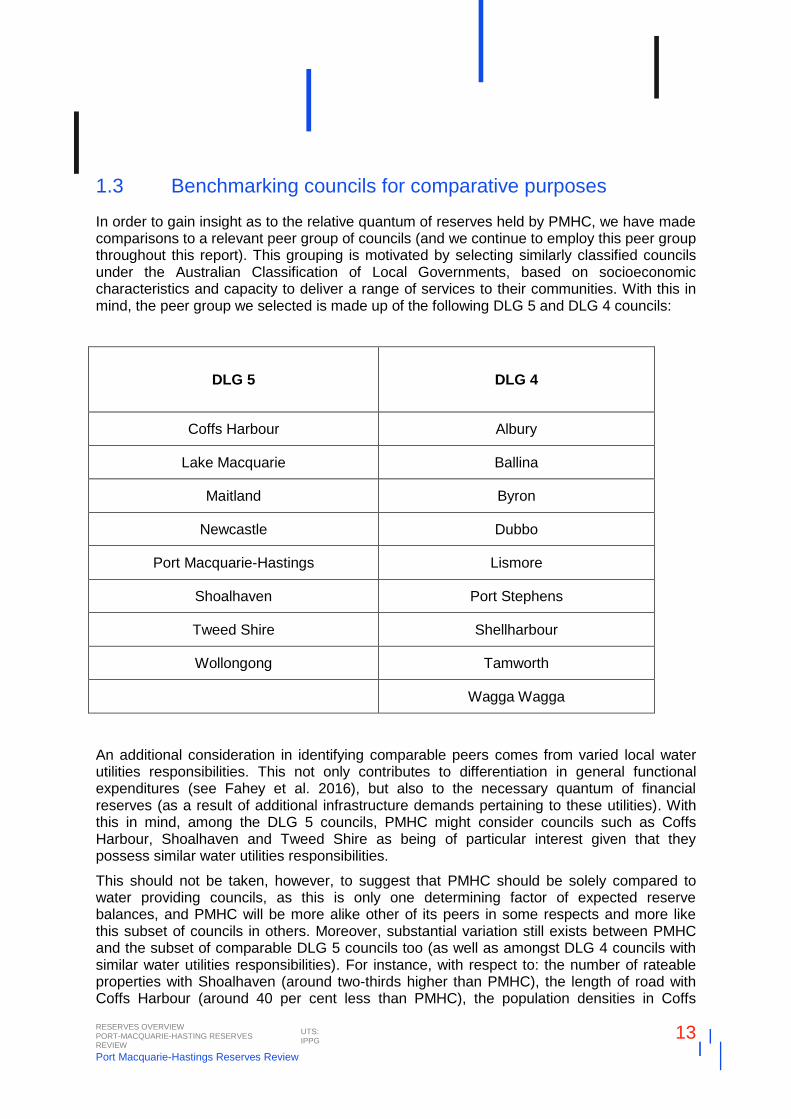
In order to gain insight as to the relative quantum of reserves held by PMHC, we have made comparisons to a relevant peer group of councils (and we continue to employ this peer group throughout this report). This grouping is motivated by selecting similarly classified councils under the Australian Classification of Local Governments, based on socioeconomic characteristics and capacity to deliver a range of services to their communities. With this in mind, the peer group we selected is made up of the following DLG 5 and DLG 4 councils:
DLG 5 DLG 4
Coffs Harbour Albury
Lake Macquarie Ballina
Maitland Byron
Newcastle Dubbo
Port Macquarie-Hastings Lismore
Shoalhaven Port Stephens
Tweed Shire Shellharbour
Wollongong Tamworth
Wagga Wagga
An additional consideration in identifying comparable peers comes from varied local water utilities responsibilities. This not only contributes to differentiation in general functional expenditures (see Fahey et al. 2016), but also to the necessary quantum of financial reserves (as a result of additional infrastructure demands pertaining to these utilities). With this in mind, among the DLG 5 councils, PMHC might consider councils such as Coffs Harbour, Shoalhaven and Tweed Shire as being of particular interest given that they possess similar water utilities responsibilities.
This should not be taken, however, to suggest that PMHC should be solely compared to water providing councils, as this is only one determining factor of expected reserve balances, and PMHC will be more alike other of its peers in some respects and more like this subset of councils in others. Moreover, substantial variation still exists between PMHC and the subset of comparable DLG 5 councils too (as well as amongst DLG 4 councils with similar water utilities responsibilities). For instance, with respect to: the number of rateable properties with Shoalhaven (around two-thirds higher than PMHC), the length of road with Coffs Harbour (around 40 per cent less than PMHC), the population densities in Coffs
RESERVES OVERVIEW PORT-MACQUARIE-HASTING RESERVES REVIEW
UTS: IPPG
14
Port Macquarie-Hastings Reserves Review
Harbour (nearly three times higher than PMHC) and Tweed Shire (well over three times higher than PMHC). Moreover, councils invariably possess diverse infrastructure demands (nature, scale and timing), infrastructure backlogs, and development activity which cannot necessarily be captured in a single comparison measure.
In short, no two councils are identical for the purpose of comparison of reserves. As a result, attempting to benchmark financial reserves to one specific council is inadvisable. Instead, it is our view that comparisons should generally be made across the peer group (rather than one particular council), and where necessary, employing suitable controls for water utilities councils, as we do in our econometric methods employed in Section 2.
RESERVES OVERVIEW PORT-MACQUARIE-HASTING RESERVES REVIEW
UTS: IPPG
15
Port Macquarie-Hastings Reserves Review
1.4 Comparing PMHC’s reserves to its peers
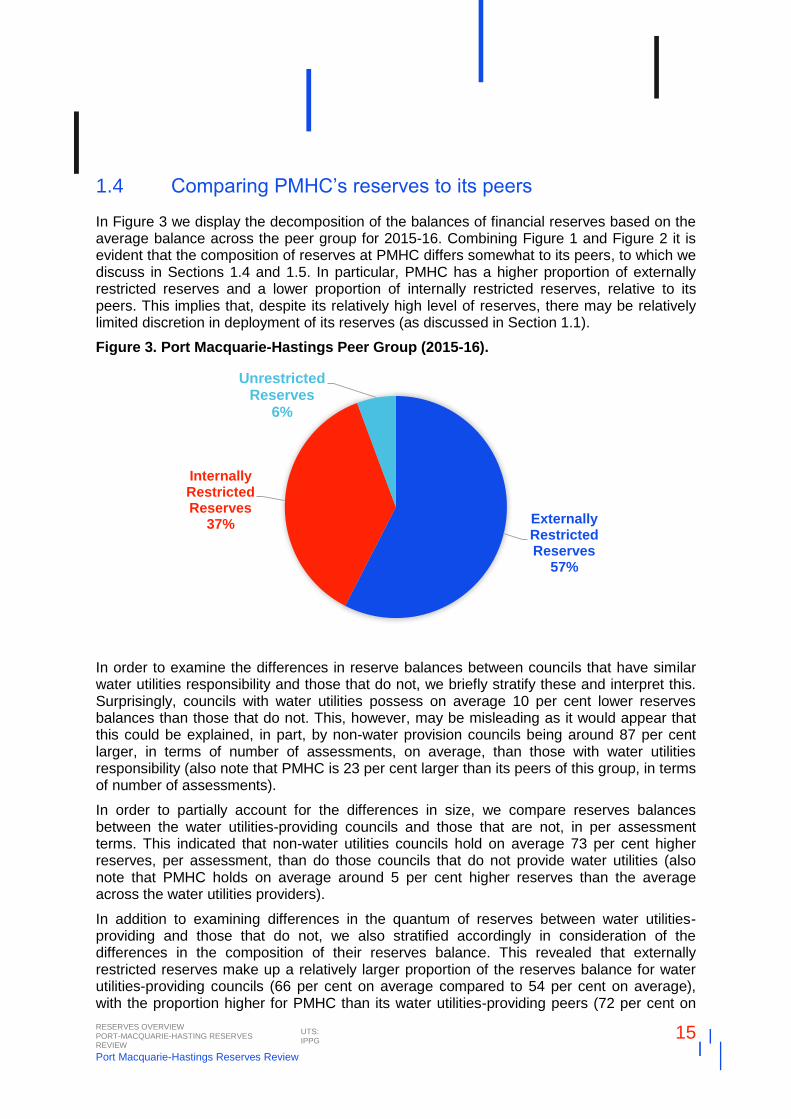
In Figure 3 we display the decomposition of the balances of financial reserves based on the average balance across the peer group for 2015-16. Combining Figure 1 and Figure 2 it is evident that the composition of reserves at PMHC differs somewhat to its peers, to which we discuss in Sections 1.4 and 1.5. In particular, PMHC has a higher proportion of externally restricted reserves and a lower proportion of internally restricted reserves, relative to its peers. This implies that, despite its relatively high level of reserves, there may be relatively limited discretion in deployment of its reserves (as discussed in Section 1.1).
Figure 3. Port Macquarie-Hastings Peer Group (2015-16).
In order to examine the differences in reserve balances between councils that have similar water utilities responsibility and those that do not, we briefly stratify these and interpret this. Surprisingly, councils with water utilities possess on average 10 per cent lower reserves balances than those that do not. This, however, may be misleading as it would appear that this could be explained, in part, by non-water provision councils being around 87 per cent larger, in terms of number of assessments, on average, than those with water utilities responsibility (also note that PMHC is 23 per cent larger than its peers of this group, in terms of number of assessments).
In order to partially account for the differences in size, we compare reserves balances between the water utilities-providing councils and those that are not, in per assessment terms. This indicated that non-water utilities councils hold on average 73 per cent higher reserves, per assessment, than do those councils that do not provide water utilities (also note that PMHC holds on average around 5 per cent higher reserves than the average across the water utilities providers).
In addition to examining differences in the quantum of reserves between water utilities-providing and those that do not, we also stratified accordingly in consideration of the differences in the composition of their reserves balance. This revealed that externally restricted reserves make up a relatively larger proportion of the reserves balance for water utilities-providing councils (66 per cent on average compared to 54 per cent on average), with the proportion higher for PMHC than its water utilities-providing peers (72 per cent on
Externally Restricted Reserves
57%
Internally Restricted Reserves
37%
Unrestricted Reserves
6%
RESERVES OVERVIEW PORT-MACQUARIE-HASTING RESERVES REVIEW
UTS: IPPG
16
Port Macquarie-Hastings Reserves Review
average compared to 66 per cent on average). Conversely, the proportion of internally restricted reserves makes up a relatively larger proportion of the reserves balance for councils that do not provide water utilities (38 per cent on average compared to 28 per cent on average), with PMHC’s proportion of its reserves balance in internally restricted reserves lower than its water utilities-providing peers (26 per cent on average compared to 28 per cent on average). The residual proportion made up of unrestricted reserves is similar on average between the water utilities providers and those that do not (6 per cent on average compared to 7 per cent on average), though the proportion of unrestricted reserves held by PMHC is lower than the water utilities providers group (3 per cent on average compared to 6 per cent).
RESERVES OVERVIEW PORT-MACQUARIE-HASTING RESERVES REVIEW
UTS: IPPG
17
Port Macquarie-Hastings Reserves Review
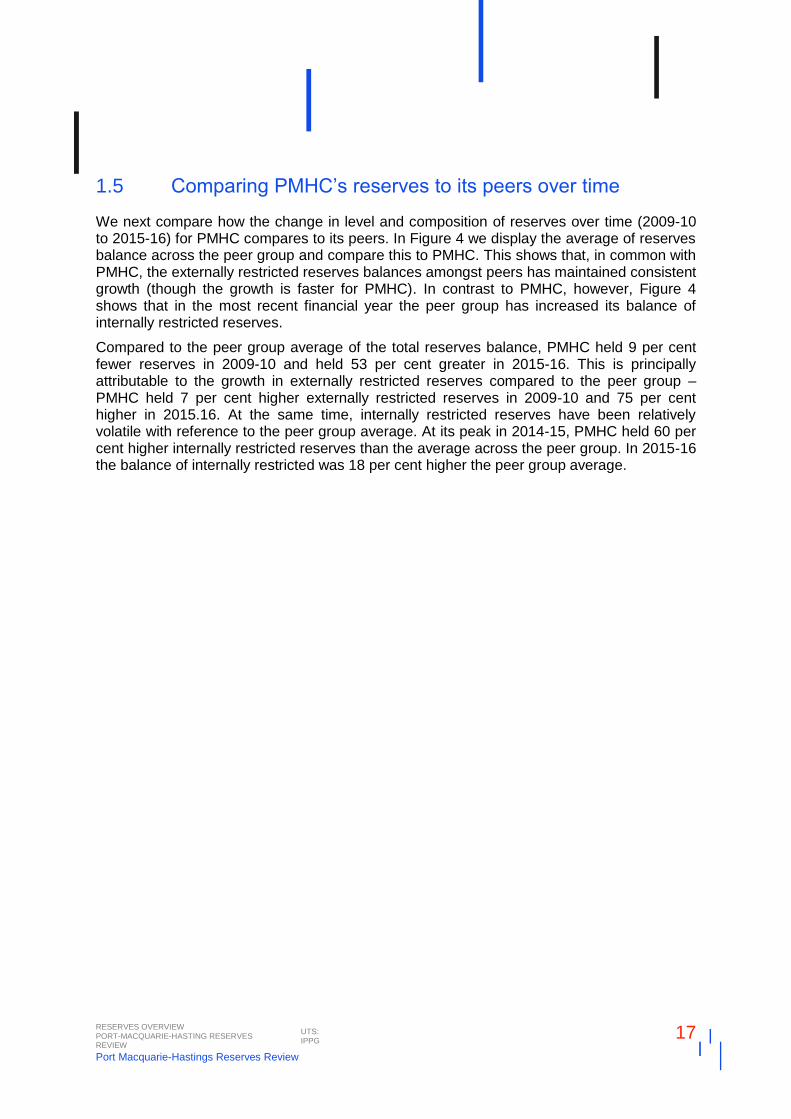
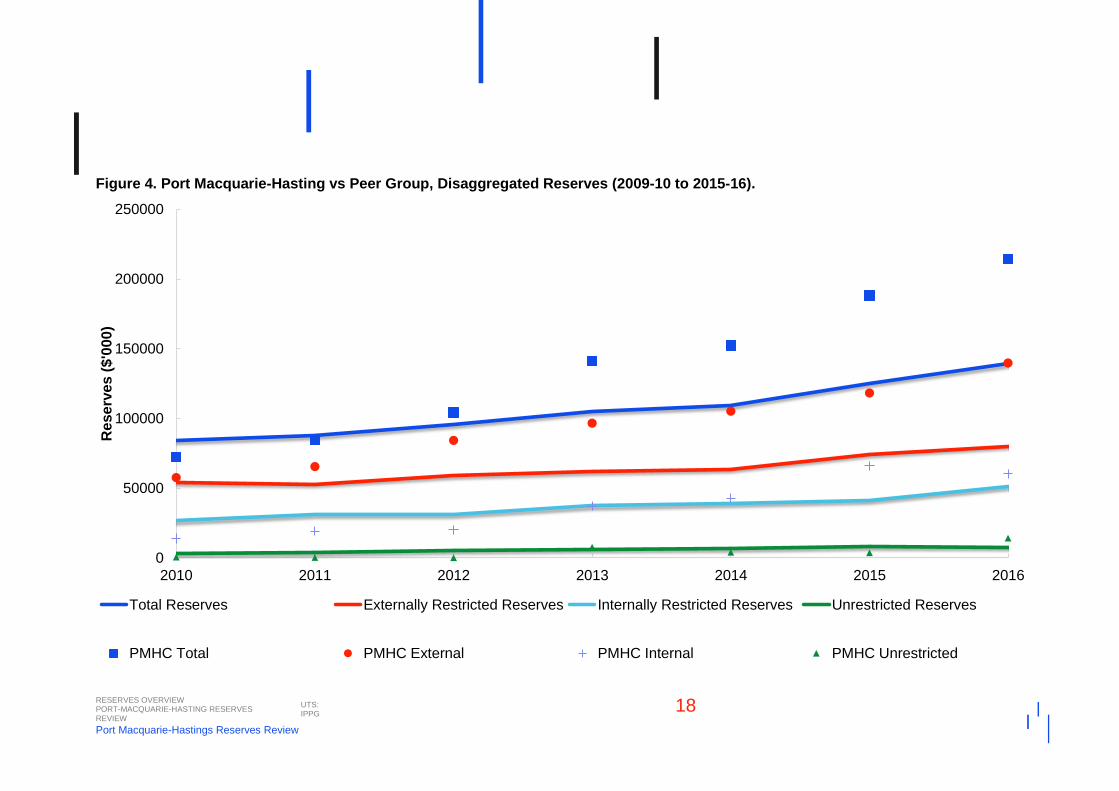
1.5 Comparing PMHC’s reserves to its peers over time
We next compare how the change in level and composition of reserves over time (2009-10 to 2015-16) for PMHC compares to its peers. In Figure 4 we display the average of reserves balance across the peer group and compare this to PMHC. This shows that, in common with PMHC, the externally restricted reserves balances amongst peers has maintained consistent growth (though the growth is faster for PMHC). In contrast to PMHC, however, Figure 4 shows that in the most recent financial year the peer group has increased its balance of internally restricted reserves.
Compared to the peer group average of the total reserves balance, PMHC held 9 per cent fewer reserves in 2009-10 and held 53 per cent greater in 2015-16. This is principally attributable to the growth in externally restricted reserves compared to the peer group – PMHC held 7 per cent higher externally restricted reserves in 2009-10 and 75 per cent higher in 2015.16. At the same time, internally restricted reserves have been relatively volatile with reference to the peer group average. At its peak in 2014-15, PMHC held 60 per cent higher internally restricted reserves than the average across the peer group. In 2015-16 the balance of internally restricted was 18 per cent higher the peer group average.
RESERVES OVERVIEW PORT-MACQUARIE-HASTING RESERVES REVIEW
UTS: IPPG
18
Port Macquarie-Hastings Reserves Review
Figure 4. Port Macquarie-Hasting vs Peer Group, Disaggregated Reserves (2009-10 to 2015-16).
0
50000
100000
150000
200000
250000
2010 2011 2012 2013 2014 2015 2016
Re
se
rve
s (
$'0
00
)
Total Reserves Externally Restricted Reserves Internally Restricted Reserves Unrestricted Reserves
PMHC Total PMHC External PMHC Internal PMHC Unrestricted
RESERVES OVERVIEW PORT-MACQUARIE-HASTING RESERVES REVIEW
UTS: IPPG
19
Port Macquarie-Hastings Reserves Review
While Section 1 has provided an indication of the quantum of reserves for PMHC with respect to its peers, in order to determine adequacy more generally we must econometrically model the expected reserve balances against the observed levels. With this in mind, in Section 2 we more fully evaluate the adequacy of reserves and perform this empirical analysis. Moreover, an implicit limitation of the analyses in Section 1.2 to Section 1.5 is that we cannot fully examine PMHC’s reserves balance with respect to its peers here since we cannot simultaneously account for multiple explanatory factors using the simple methods we have employed here. For this reason, the econometric method we employ in Section 2 addresses this limitation.
EMPIRICAL ANALYSIS PORT-MACQUARIE-HASTING RESERVES REVIEW
UTS: IPPG
20
Port Macquarie-Hastings Reserves Review
2 Empirical Analysis
In order to construct the econometric models for this report, we collected data from three sources: (i) audited financial statements of the seventeen relevant peers (as set out in Section 1.2) over seven years (2009-10 to 2015-2016 financial years inclusive), (ii) Office of Local Government Time Series Data, and (iii) Australian Bureau of Statistics Data by Region.
The objective of this task was to answer four important questions as identified in the project aims (p i):
• How does the quantum of reserves compare with relevant peers? (see Section 2.1)
• How does the association between growth in development and growth in reserves compare with peers? (see Section 2.2)
• How does capital expenditure per assessment respond to key council characteristics across peer group? (see Section 2.3)
• How does operational expenditure per assessment respond to key council characteristics across peer group? (see Section 2.4)
In order to provide answers to these questions we set out to produce econometric estimates to inform each of the above. To ensure robustness in our modelling specification, and to take account of the various explanatory factors that may be relevant to the reserves levels for councils, we included variables that we consider to be key characteristics of local government. This includes: size of council (number of residential, business and farm assessments), length of roads, population density, growth rate in assessments (which is associated with the realisation of development approvals4), and stock of infrastructure, property, plant and equipment. The specification of model parameters we employed is consistent with the explanatory factors that are generally employed for size sensitive models in local government econometric studies (see, for instance, Drew et al. 2015; Drew and Dollery, 2015).
In Sections 2.1 to 2.4, we outline the results arising from a number of econometric analyses. Throughout, we provide our results as well as brief discussions as to the implications of these results for PMHC, particularly based on its growth rate assumptions presented in the Resourcing Strategy. While each of these Sections addresses particular questions, we stress that viewed together they offer a more full interpretation for PMHC’s finances.
This is because we first establish the adequacy of PMHC’s reserve balances with respect to the peer group. This informs predictions of the minimum reserve balances that PMHC may wish to carry over the medium term to account for its projected growth rates (other things being equal). While Section 2.1, then, is focused on providing predictions relating to PMHC, in Section 2.2 we explain which variables tend to influence on the expected reserve levels across the peer group. Because we would expect growth in assessments (that is, the realisation of development activity) to influence on Council finances, we next examine how capital and operational expenditures are impacted in Sections 2.3 and 2.4.
4 Clearly there are some development approvals that don’t result in a new assessable property – hence our assertion of an association rather than a direct relationship.
EMPIRICAL ANALYSIS PORT-MACQUARIE-HASTING RESERVES REVIEW
UTS: IPPG
21
Port Macquarie-Hastings Reserves Review
While interpreting the respective results that we present in this Section, we make reference throughout to, in particular, the level of ‘expected’ reserves rather than explicitly nominating this as ‘required’ reserves per se. This is because our model design allows us to statistically predict what the expected value of reserves may be, given a set of characteristics, based on the observations of the peer group.
Loosely speaking, this relates to the level that we would deem to be required, or adequate, if all potential explanatory factors could be accounted for and a sufficiently large repeated sample was captured. Because our model is statistically driven, we attempt to make inferences from the sample we have selected. We then interpret the conditional average of reserves from the model to imply the required level of reserves, given a set of factors and all else being equal. Importantly, to this point, there is an implicit assumption with respect to the behaviour of the peer group – namely that across the peer group, at least some councils carry adequate reserves in the first place if we are to fully interpret expected reserves to be equivalent to ‘required’ reserves. That is, if most or all councils carried insufficient or excessive reserves then our ‘expected’ reserves from the model would be biased accordingly. Similarly, because we have employed a fixed-effects panel model specification, we implicitly make an assumption that council behaviour is constant over time.
Second, all econometric estimations are associated with potential standard error and therefore we report this alongside each of our estimates. This is to reiterate that in the process of producing estimations with statistical models of this nature, invariably our results are subject to a degree of variation with probabilistic bands of likely values. In essence, this suggests some caution may need to be exercised when decision making is based upon a single point estimate, without consideration of the associated standard error.
EMPIRICAL ANALYSIS PORT-MACQUARIE-HASTING RESERVES REVIEW
UTS: IPPG
22
Port Macquarie-Hastings Reserves Review
2.1 Expected Reserves
In order to review the quantum of reserves held by PMHC compared to its peers, in Section 2.1.1 we compare PMHC’s actual reserves held to the level predicted by our model for the years 2009-10 to 2015-16. In Section 2.1.2 we predict what expected reserves levels may be in the years 2017-18 to 2021-22 and compare this to PMHC’s current level of reserves.
2.1.1 PMHC’s expected level of reserves compared to peers
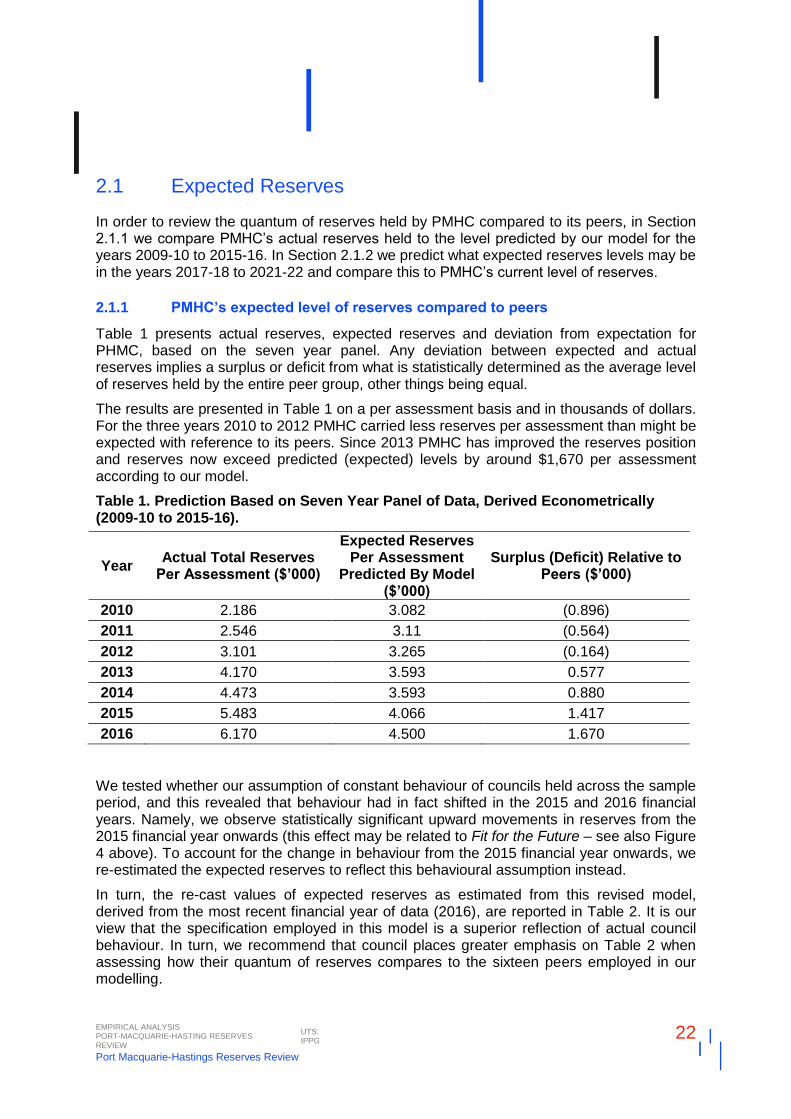
Table 1 presents actual reserves, expected reserves and deviation from expectation for PHMC, based on the seven year panel. Any deviation between expected and actual reserves implies a surplus or deficit from what is statistically determined as the average level of reserves held by the entire peer group, other things being equal.
The results are presented in Table 1 on a per assessment basis and in thousands of dollars. For the three years 2010 to 2012 PMHC carried less reserves per assessment than might be expected with reference to its peers. Since 2013 PMHC has improved the reserves position and reserves now exceed predicted (expected) levels by around $1,670 per assessment according to our model.
Table 1. Prediction Based on Seven Year Panel of Data, Derived Econometrically (2009-10 to 2015-16).
Year Actual Total Reserves
Per Assessment ($’000)
Expected Reserves Per Assessment
Predicted By Model ($’000)
Surplus (Deficit) Relative to Peers ($’000)
2010 2.186 3.082 (0.896)
2011 2.546 3.11 (0.564)
2012 3.101 3.265 (0.164)
2013 4.170 3.593 0.577
2014 4.473 3.593 0.880
2015 5.483 4.066 1.417
2016 6.170 4.500 1.670
We tested whether our assumption of constant behaviour of councils held across the sample period, and this revealed that behaviour had in fact shifted in the 2015 and 2016 financial years. Namely, we observe statistically significant upward movements in reserves from the 2015 financial year onwards (this effect may be related to Fit for the Future – see also Figure 4 above). To account for the change in behaviour from the 2015 financial year onwards, we re-estimated the expected reserves to reflect this behavioural assumption instead.
In turn, the re-cast values of expected reserves as estimated from this revised model, derived from the most recent financial year of data (2016), are reported in Table 2. It is our view that the specification employed in this model is a superior reflection of actual council behaviour. In turn, we recommend that council places greater emphasis on Table 2 when assessing how their quantum of reserves compares to the sixteen peers employed in our modelling.
EMPIRICAL ANALYSIS PORT-MACQUARIE-HASTING RESERVES REVIEW
UTS: IPPG
23
Port Macquarie-Hastings Reserves Review
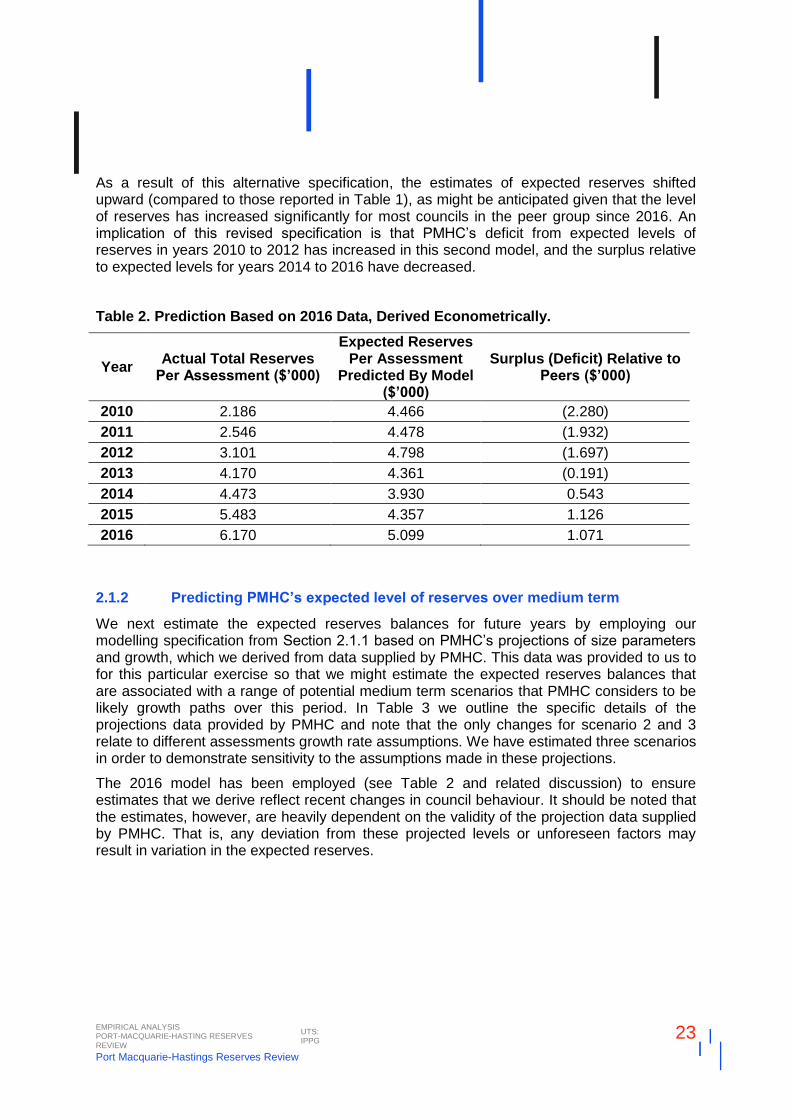
As a result of this alternative specification, the estimates of expected reserves shifted upward (compared to those reported in Table 1), as might be anticipated given that the level of reserves has increased significantly for most councils in the peer group since 2016. An implication of this revised specification is that PMHC’s deficit from expected levels of reserves in years 2010 to 2012 has increased in this second model, and the surplus relative to expected levels for years 2014 to 2016 have decreased.
Table 2. Prediction Based on 2016 Data, Derived Econometrically.
Year Actual Total Reserves
Per Assessment ($’000)
Expected Reserves Per Assessment
Predicted By Model ($’000)
Surplus (Deficit) Relative to Peers ($’000)
2010 2.186 4.466 (2.280)
2011 2.546 4.478 (1.932)
2012 3.101 4.798 (1.697)
2013 4.170 4.361 (0.191)
2014 4.473 3.930 0.543
2015 5.483 4.357 1.126
2016 6.170 5.099 1.071
2.1.2 Predicting PMHC’s expected level of reserves over medium term
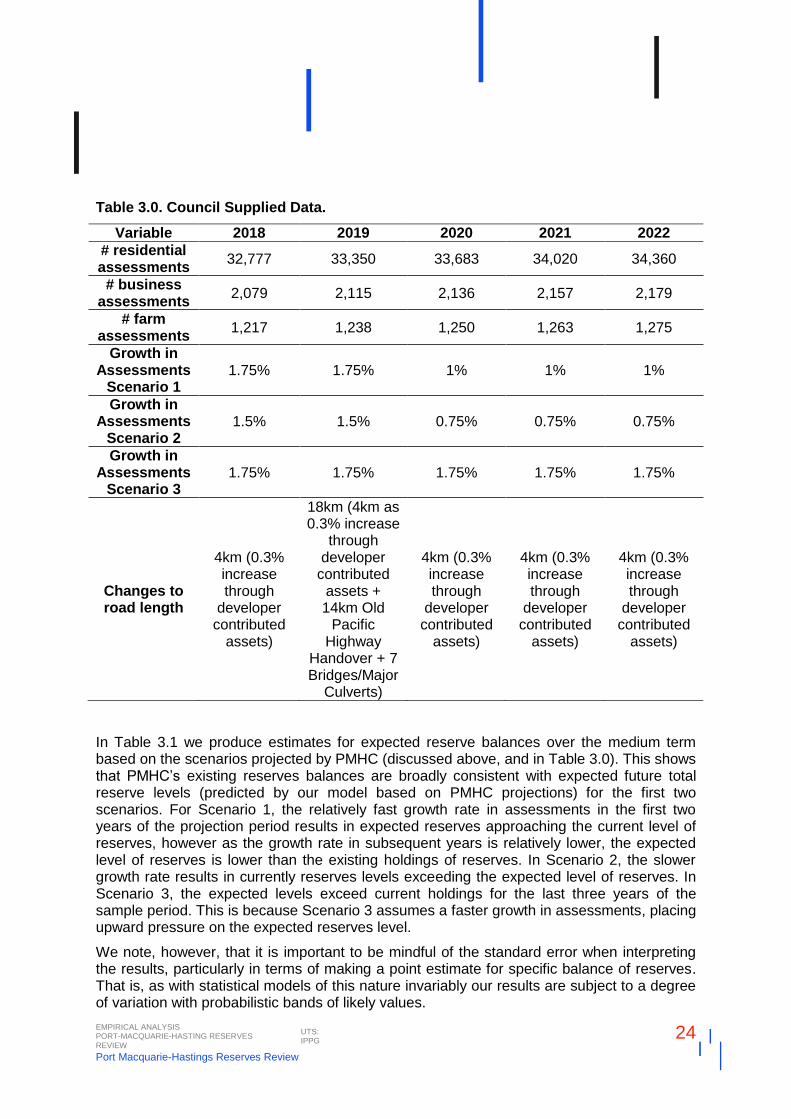
We next estimate the expected reserves balances for future years by employing our modelling specification from Section 2.1.1 based on PMHC’s projections of size parameters and growth, which we derived from data supplied by PMHC. This data was provided to us to for this particular exercise so that we might estimate the expected reserves balances that are associated with a range of potential medium term scenarios that PMHC considers to be likely growth paths over this period. In Table 3 we outline the specific details of the projections data provided by PMHC and note that the only changes for scenario 2 and 3 relate to different assessments growth rate assumptions. We have estimated three scenarios in order to demonstrate sensitivity to the assumptions made in these projections.
The 2016 model has been employed (see Table 2 and related discussion) to ensure estimates that we derive reflect recent changes in council behaviour. It should be noted that the estimates, however, are heavily dependent on the validity of the projection data supplied by PMHC. That is, any deviation from these projected levels or unforeseen factors may result in variation in the expected reserves.
EMPIRICAL ANALYSIS PORT-MACQUARIE-HASTING RESERVES REVIEW
UTS: IPPG
24
Port Macquarie-Hastings Reserves Review
Table 3.0. Council Supplied Data.
Variable 2018 2019 2020 2021 2022
# residential assessments
32,777 33,350 33,683 34,020 34,360
# business assessments
2,079 2,115 2,136 2,157 2,179
# farm assessments
1,217 1,238 1,250 1,263 1,275
Growth in Assessments
Scenario 1 1.75% 1.75% 1% 1% 1%
Growth in Assessments
Scenario 2 1.5% 1.5% 0.75% 0.75% 0.75%
Growth in Assessments
Scenario 3 1.75% 1.75% 1.75% 1.75% 1.75%
Changes to road length
4km (0.3% increase through
developer contributed
assets)
18km (4km as 0.3% increase
through developer
contributed assets + 14km Old
Pacific Highway
Handover + 7 Bridges/Major
Culverts)
4km (0.3% increase through
developer contributed
assets)
4km (0.3% increase through
developer contributed
assets)
4km (0.3% increase through
developer contributed
assets)
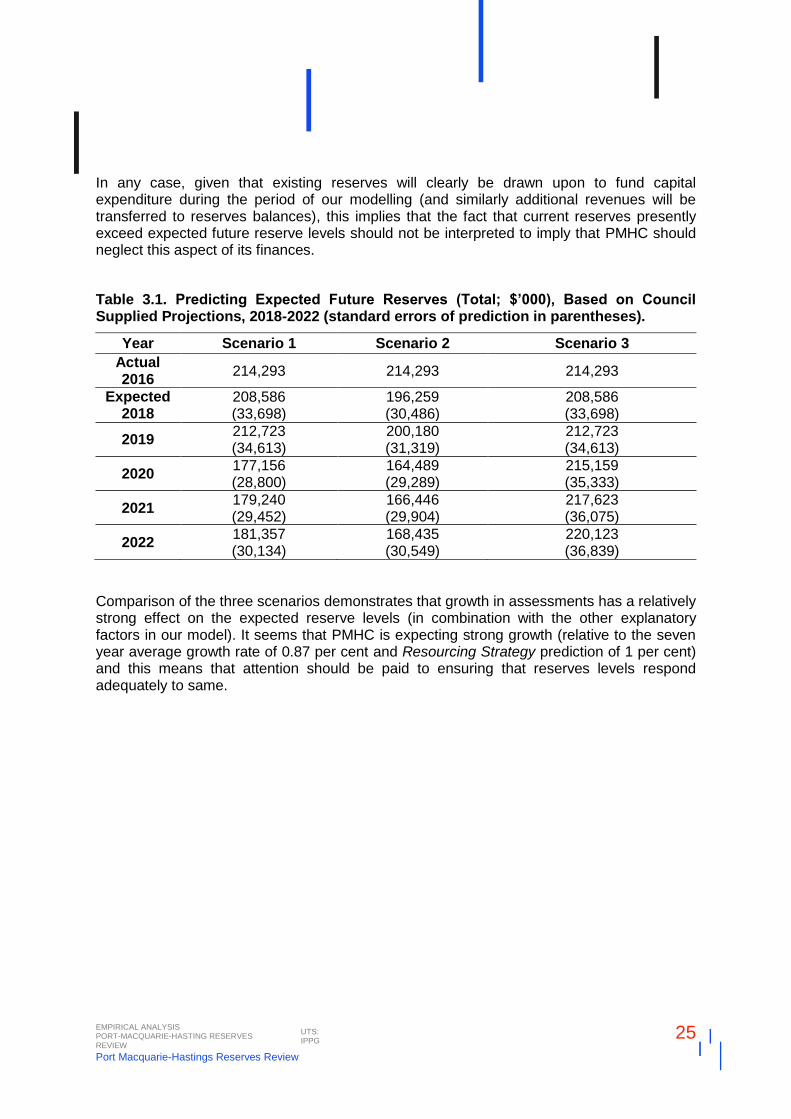
In Table 3.1 we produce estimates for expected reserve balances over the medium term based on the scenarios projected by PMHC (discussed above, and in Table 3.0). This shows that PMHC’s existing reserves balances are broadly consistent with expected future total reserve levels (predicted by our model based on PMHC projections) for the first two scenarios. For Scenario 1, the relatively fast growth rate in assessments in the first two years of the projection period results in expected reserves approaching the current level of reserves, however as the growth rate in subsequent years is relatively lower, the expected level of reserves is lower than the existing holdings of reserves. In Scenario 2, the slower growth rate results in currently reserves levels exceeding the expected level of reserves. In Scenario 3, the expected levels exceed current holdings for the last three years of the sample period. This is because Scenario 3 assumes a faster growth in assessments, placing upward pressure on the expected reserves level.
We note, however, that it is important to be mindful of the standard error when interpreting the results, particularly in terms of making a point estimate for specific balance of reserves. That is, as with statistical models of this nature invariably our results are subject to a degree of variation with probabilistic bands of likely values.
EMPIRICAL ANALYSIS PORT-MACQUARIE-HASTING RESERVES REVIEW
UTS: IPPG
25
Port Macquarie-Hastings Reserves Review
In any case, given that existing reserves will clearly be drawn upon to fund capital expenditure during the period of our modelling (and similarly additional revenues will be transferred to reserves balances), this implies that the fact that current reserves presently exceed expected future reserve levels should not be interpreted to imply that PMHC should neglect this aspect of its finances.
Table 3.1. Predicting Expected Future Reserves (Total; $’000), Based on Council Supplied Projections, 2018-2022 (standard errors of prediction in parentheses).
Year Scenario 1 Scenario 2 Scenario 3
Actual 2016
214,293 214,293 214,293
Expected 2018
208,586 (33,698)
196,259 (30,486)
208,586 (33,698)
2019 212,723 (34,613)
200,180 (31,319)
212,723 (34,613)
2020 177,156 (28,800)
164,489 (29,289)
215,159 (35,333)
2021 179,240 (29,452)
166,446 (29,904)
217,623 (36,075)
2022 181,357 (30,134)
168,435 (30,549)
220,123 (36,839)
Comparison of the three scenarios demonstrates that growth in assessments has a relatively strong effect on the expected reserve levels (in combination with the other explanatory factors in our model). It seems that PMHC is expecting strong growth (relative to the seven year average growth rate of 0.87 per cent and Resourcing Strategy prediction of 1 per cent) and this means that attention should be paid to ensuring that reserves levels respond adequately to same.
EMPIRICAL ANALYSIS PORT-MACQUARIE-HASTING RESERVES REVIEW
UTS: IPPG
26
Port Macquarie-Hastings Reserves Review
2.2 Development and Reserves
The model employed to answer Council’s first question can be used to identify which determining factors are most important in driving the observed levels of reserves (over the peer group for the seven years of data).
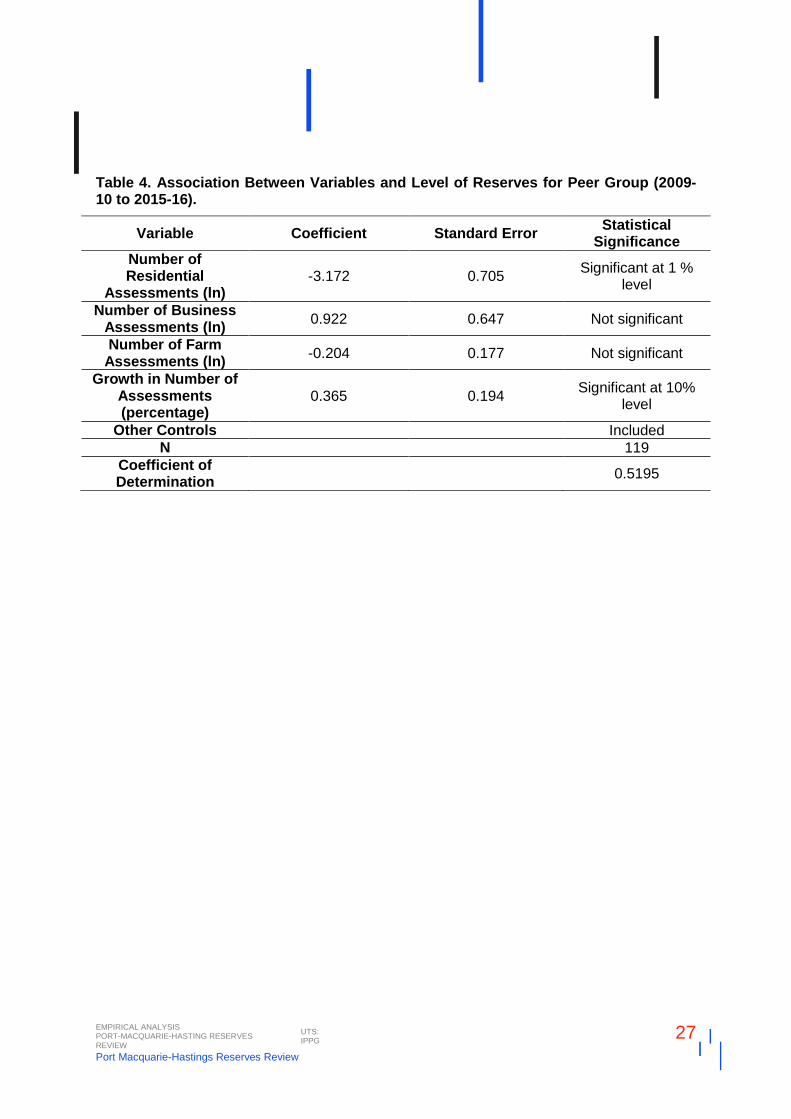
Table 4 details the coefficient of each variable of interest, the respective standard error and the level of statistical significance. It might be noted that the model has very high explanatory power (for a panel regression) as evidenced by the coefficient of determination.
Two variables are statistically significant: (i) number of residential assessments, and (ii) growth in number assessments (in percentage terms).
The first result suggests that the average response of the peer group to a 1 per cent increase in the number of residential assessments is a reduction in reserves of around $31.72 per assessment. Otherwise stated, looking across the peer group, as councils become larger they tend to carry less reserves. Thus, it would be reasonable for PMHC to carry relatively less reserves (on a per assessment basis) than its smaller peers, if the only concern was to ensure consistency with the peer group.
The second statistically significant result suggests that as the growth rate of assessments increases, the average response of councils is to increase the level of reserves. Specifically, a one tenth of a percentage point increase to growth rate is associated with an increase to total reserves of around $36.50 per assessment5. Thus, if PMHC were to increase the growth rate above historical levels to achieve the 1 per cent growth rate nominated in the Resourcing Strategy document then it would need to increase reserves by around $47 per assessment in order to ensure levels of reserves were consistent with the peer group.
It is best to refer to the Tables 1, 2, 3.1 when considering the cumulative effects of changes to council size on expected reserve levels. Thus, Table 4 is provided purely for the purposes of identifying which variables tend to influence on the expected reserve levels across the peer group (and over the seven year panel).
5 Note that Port Macquarie-Hastings had an average growth rate of just 0.87% over the last seven years
EMPIRICAL ANALYSIS PORT-MACQUARIE-HASTING RESERVES REVIEW
UTS: IPPG
27
Port Macquarie-Hastings Reserves Review
Table 4. Association Between Variables and Level of Reserves for Peer Group (2009-10 to 2015-16).
Variable Coefficient Standard Error Statistical
Significance
Number of Residential
Assessments (ln) -3.172 0.705
Significant at 1 % level
Number of Business Assessments (ln)
0.922 0.647 Not significant
Number of Farm Assessments (ln)
-0.204 0.177 Not significant
Growth in Number of Assessments (percentage)
0.365 0.194 Significant at 10%
level
Other Controls Included
N 119
Coefficient of Determination
0.5195
EMPIRICAL ANALYSIS PORT-MACQUARIE-HASTING RESERVES REVIEW
UTS: IPPG
28
Port Macquarie-Hastings Reserves Review
2.3 Development and Capital Expenditure
We have thus far predicted the expected level of reserves (according to peer group over seven years, see Section 2.1) and also identified the main drivers of changes in expected reserves (number of residential assessments and growth rate of assessments, see Section 2.2). We now turn to the other side of the ledger and examine the determinants of per assessment capital expenditure.
Compared to its identified water utilities-providing peers, PMHC’s capital expenditure is on average 20 per cent lower, in per assessment terms. Compared to the entire peer group, PMHC’s capital expenditure is on average 3 per cent higher, in per assessment terms. PMHC has experienced relatively significant increases in capital expenditure, in per assessment terms, in recent years. Namely, in 2014-15 and 2015-16 capital expenditure per assessment increased by an average of 61 per cent (compared to an average of 12.9 per cent across the peer group over the same time period).
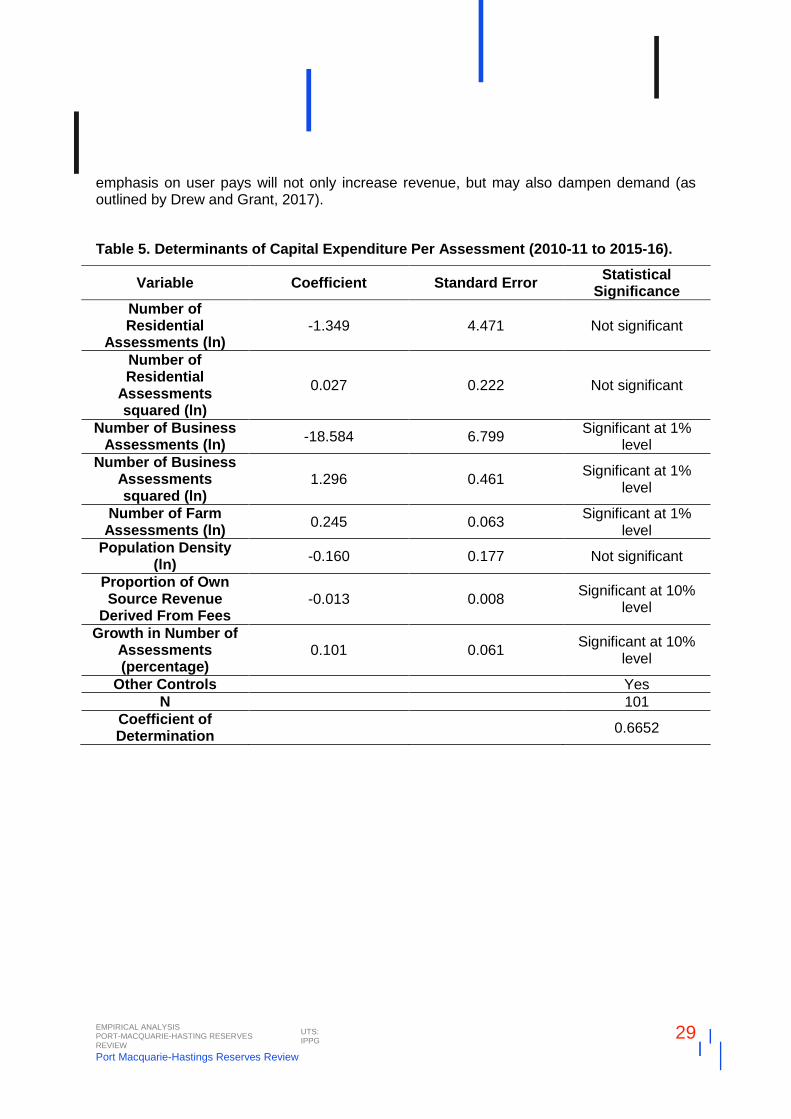
Table 5 presents results of a six year panel (ABS data was not available for some regressors for 2010, and we thus had to truncate our panel by one year) for the seventeen councils. The econometric model employed is consistent with models used to estimate the determinants of expenditure in a number of scholarly publications (see for instance, Drew et al. 2014; Drew et al. 2016; Drew and Dollery, 2014). Moreover, the model has very high explanatory power as indicated by the coefficient of determination reported in Table 5.
The size of council (with respect to number of residential assessments) was not found to be a statistically significant determinant of per assessment capital expenditure. However, the number of business assessments is significant at the 1 per cent level (and is of a quadratic nature). The turning point (a local minima) suggested by our results is at approximately 1,299 assessments. This means that per assessment capital expenditure tends to reduce as the number of business assessments approaches the turning point, after which time increases to per assessment capital expenditure might be expected.
PMHC had 2,071 business assessments in 2016 – which suggests that Council faces relatively higher per assessment capital expenditure (for business) than its smaller peers. The number of farm assessments is also statistically significant. Notably population density is not statistically significant, suggesting that high density and in-fill development should not be pursued on the basis that it might reduce overall capital costs for council, though there may be alternate reasons for preferring this type of development.
Not surprisingly there is a statistically significant association between rate of growth in assessments and per assessment capital expenditure. Our results suggest that a one-tenth percentage increase in assessment growth rate is associated with a 1.01 per cent increase in per assessment capital expenditure. Thus, the evidence suggests that if PMHC were to accelerate the growth rate to the levels suggested in the Resourcing Strategy (which is 0.13 per cent above the seven year historical average) then it might expect a response in the order of an additional $25 per assessment of capital expenditure (or around $868,000 gross), other things being equal.
The proportion of own source revenue derived from fees and the per assessment capital expenditure is statistically significant at the 10% level. Our analysis suggests that a one per cent increase in the proportion of revenue derived from fees is associated with a 1.3 per cent decrease in capital expenditure per assessment, other things being equal. This suggests that PMHC’s strategy (detailed in the Resourcing Strategy document) of placing greater
EMPIRICAL ANALYSIS PORT-MACQUARIE-HASTING RESERVES REVIEW
UTS: IPPG
29
Port Macquarie-Hastings Reserves Review
emphasis on user pays will not only increase revenue, but may also dampen demand (as outlined by Drew and Grant, 2017).
Table 5. Determinants of Capital Expenditure Per Assessment (2010-11 to 2015-16).
Variable Coefficient Standard Error Statistical
Significance
Number of Residential
Assessments (ln) -1.349 4.471 Not significant
Number of Residential
Assessments squared (ln)
0.027 0.222 Not significant
Number of Business Assessments (ln)
-18.584 6.799 Significant at 1%
level
Number of Business Assessments squared (ln)
1.296 0.461 Significant at 1%
level
Number of Farm Assessments (ln)
0.245 0.063 Significant at 1%
level
Population Density (ln)
-0.160 0.177 Not significant
Proportion of Own Source Revenue
Derived From Fees -0.013 0.008
Significant at 10% level
Growth in Number of Assessments (percentage)
0.101 0.061 Significant at 10%
level
Other Controls Yes
N 101
Coefficient of Determination
0.6652
EMPIRICAL ANALYSIS PORT-MACQUARIE-HASTING RESERVES REVIEW
UTS: IPPG
30
Port Macquarie-Hastings Reserves Review
2.4 Development and Operational Expenditure
There is a large literature that examines the association between local government size and operational expenditure, going back many decades (Drew and Grant, 2017). It is generally held that some local government functions exhibit economies of scale (reduction in total average cost with increased production), although it should be noted that the response is generally small and only occurs for a handful of services (see, Fahey et al. 2016).
Compared to its water utilities-providing peers, PMHC’s operating expenditure is on average 24 per cent lower, in per assessment terms. Compared to its entire peer group, PMHC’s operating expenditure is 10 per cent lower on average, in per assessment terms. Over the same period, PMHC’s operating expenditure per assessment has increased faster than the average across the period group. Namely, PMHC experienced an average yearly growth rate of 6 per cent in operating expenditure per assessment, compared to 3 per cent across the entire peer group over the same period.
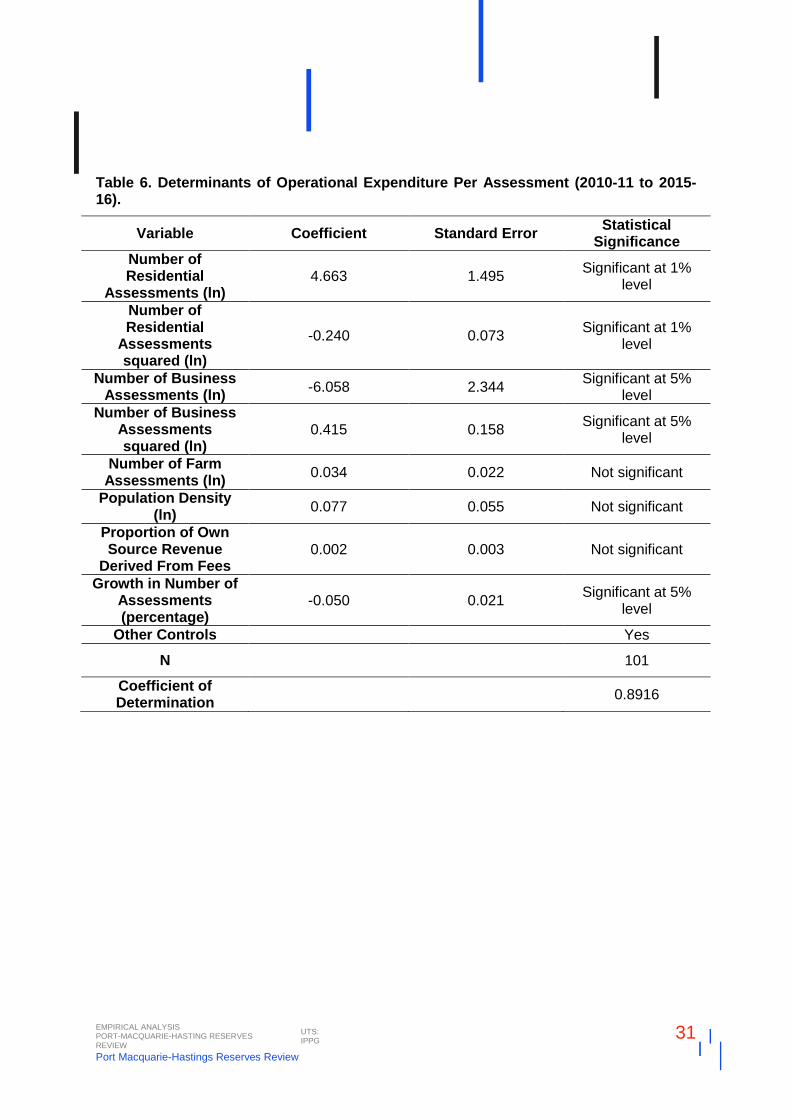
Our analysis examines the response of operational expenditure in aggregate to determinants attested to in the literature, for the seventeen councils over the last six financial years (this is necessary because sub-cohorts of councils may not exhibit the same associations as occurs for analyses based on the entire state). Our model predicts a local maxima at the level of 16,557 residential assessments:
What this means is that per assessment operating expenditure decreases as council size increases beyond 16,557 residential assessments has been reached (PMHC has 31,425 residential assessments in 2016). Otherwise stated, the size of PMHC’s residential assessments is consistent with capture of economies of scale. Moreover, the model predicts a local minima for business at around 1,478 assessments – this also suggests that PMHC is in the domain of economies of scale for this assessment category.
In addition, a one-tenth per cent increase in growth rate is associated with a 0.5 per cent decrease in expenditure per assessment, other things being equal. This is consistent with the observed economies of scale (for residential and business assessments) detailed above.
Notably, population density is not statistically significant for operational expenditure per assessment (that is, there is no evidence of economies of density). Nor is the proportion of own source revenue derived from fees statistically significant (which means that the only benefit from having a greater emphasis on fee revenue (with respect to operational expenditure) would seem to be an increase in revenue).
EMPIRICAL ANALYSIS PORT-MACQUARIE-HASTING RESERVES REVIEW
UTS: IPPG
31
Port Macquarie-Hastings Reserves Review
Table 6. Determinants of Operational Expenditure Per Assessment (2010-11 to 2015-16).
Variable Coefficient Standard Error Statistical
Significance
Number of Residential
Assessments (ln) 4.663 1.495
Significant at 1% level
Number of Residential
Assessments squared (ln)
-0.240 0.073 Significant at 1%
level
Number of Business Assessments (ln)
-6.058 2.344 Significant at 5%
level
Number of Business Assessments squared (ln)
0.415 0.158 Significant at 5%
level
Number of Farm Assessments (ln)
0.034 0.022 Not significant
Population Density (ln)
0.077 0.055 Not significant
Proportion of Own Source Revenue
Derived From Fees 0.002 0.003 Not significant
Growth in Number of Assessments (percentage)
-0.050 0.021 Significant at 5%
level
Other Controls Yes
N 101
Coefficient of Determination
0.8916
DEVELOPER LEVIES: COMPARISON TO PEERS PORT-MACQUARIE-HASTING RESERVES REVIEW
UTS: IPPG
32
Port Macquarie-Hastings Reserves Review
3 Developer Levies: Comparison to Peers
A significant proportion of the external reserves held by Council are made up by developer contributions (Section 94 and Section 64). The receipt of contributions is reflected as income from continuing operations (Note 3(f) of the financial statements and the income statement), improves council’s operating position – especially since the quantum of contributions typically exceeds related expenditures in most years (see below), or if not yet received, as restricted receivables (Note 7 of the financial statements) – which improves council’s balance sheet.
The received contributions are then held as a restricted asset (as reserves). Upon completion of relevant works (typically capital works) this is recognised as an asset under Restricted infrastructure, property, plant and equipment (Note 9(b) – including when work is in progress). This increases council’s depreciable asset base and in turn increases council’s future obligations related to depreciation expenditures.
Throughout Sections 3.1 to 3.3 we typically employ financial data from Note 17 (Statement of Developer Contributions) from the Annual Financial Statements, and then values are typically averaged over the period 2009-10 to 2015-16 to ensure that there is no year selection bias in our analysis. We are principally concerned with examining the following:
Whether PMHC’s contributions are contemporary.
Whether PMHC’s contributions are being maximised.
Whether PMHC’s contributions are adequate to fund its infrastructure commitments.
In order to address the first of these, we examine how PMHC’s Section 94 contributions compare to its peers, in aggregate (see Section 3.1.1, Section 3.1.4) and disaggregated by function (see Section 3.2.1, Section 3.2.2). We consider Section 94 contributions to be contemporary if PMHC’s contributions are: i) comparable to peers, and ii) expenditures do not exceed contributions in any area.
In order to address whether PMHC’s contributions are being maximised we disaggregate contributions by function in order to identify if scope exists for contributions to be increased in order to either match expenditures or to match the contributions rates that comparable peers are charging (see Section 3.2.1, Section 3.2.2). We also consider the capacity for development by a brief examination of PMHC’s development applications profile (see Section 3.1.3).
In order to address the adequacy of PMHC’s contributions with respect to infrastructure commitments we examine how contributions compare to reserve holdings (which approximate the infrastructure committed to by PMHC) (see Section 3.2.4). In addition, we also compare the projected future contributions, expected cost of works outstanding and projected over/under funding based on estimates published in annual financial statements (see Section 3.2.3).
We separately examine whether PMHC’s Section 64 contributions are contemporary, being maximised and are adequate. This is treated separately to Section 94 largely because of different reporting for our analysis purposes as well as there being varied comparable peers
DEVELOPER LEVIES: COMPARISON TO PEERS PORT-MACQUARIE-HASTING RESERVES REVIEW
UTS: IPPG
33
Port Macquarie-Hastings Reserves Review
for PMHC between Section 94 and Section 64 contributions. Our analysis regarding Section 64 is generally found in Section 3.3.1 and Section 3.3.2, as well as briefly in Section 3.1.2.
DEVELOPER LEVIES: COMPARISON TO PEERS PORT-MACQUARIE-HASTING RESERVES REVIEW
UTS: IPPG
34
Port Macquarie-Hastings Reserves Review
3.1 Port Macquarie-Hastings Council’s development overview
In Section 1 we compared the overall quantum of reserves for PMHC with its peers. In addition, we discussed and reached determinations with respect to overall reserves adequacy in Section 2.1. Here we examine more closely the adequacy of developer contributions, which is an important component of the reserves balances. In Section 3.1 and Section 3.2 we generally review Section 94 developer contributions and in Section 3.3 we review Section 64 contributions.
3.1.1 Comparing developer contributions to reserve holdings
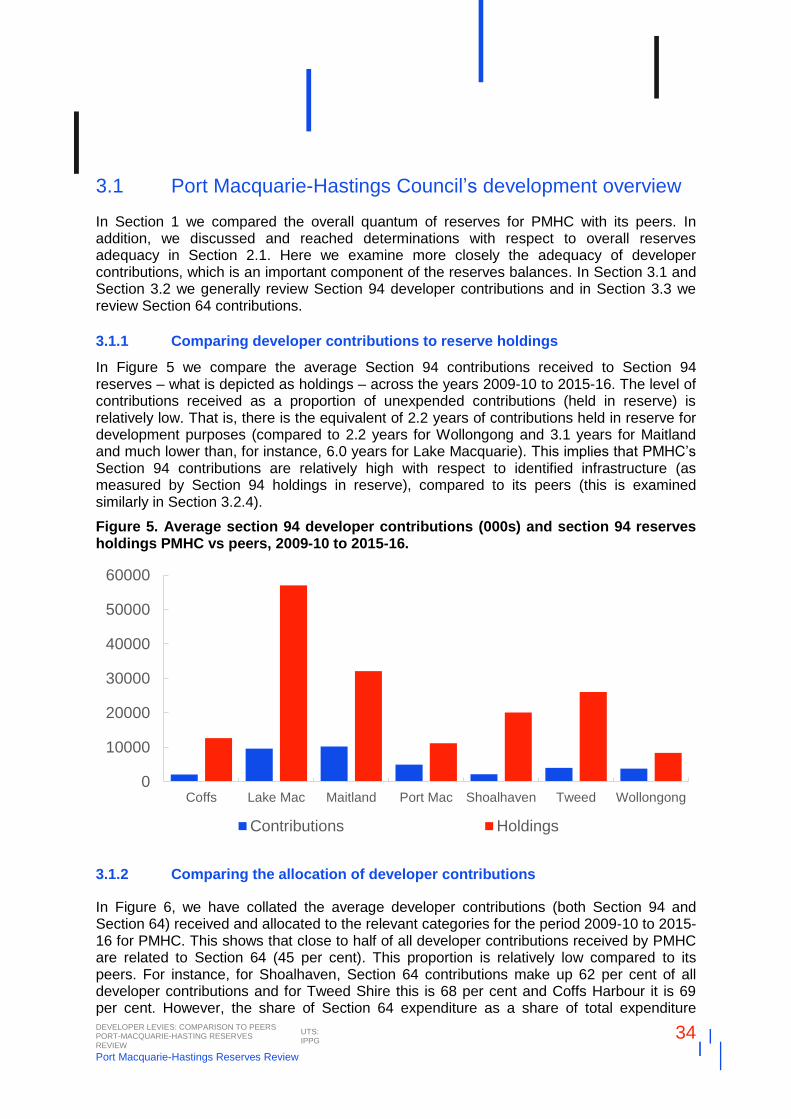
In Figure 5 we compare the average Section 94 contributions received to Section 94 reserves – what is depicted as holdings – across the years 2009-10 to 2015-16. The level of contributions received as a proportion of unexpended contributions (held in reserve) is relatively low. That is, there is the equivalent of 2.2 years of contributions held in reserve for development purposes (compared to 2.2 years for Wollongong and 3.1 years for Maitland and much lower than, for instance, 6.0 years for Lake Macquarie). This implies that PMHC’s Section 94 contributions are relatively high with respect to identified infrastructure (as measured by Section 94 holdings in reserve), compared to its peers (this is examined similarly in Section 3.2.4).
Figure 5. Average section 94 developer contributions (000s) and section 94 reserves holdings PMHC vs peers, 2009-10 to 2015-16.
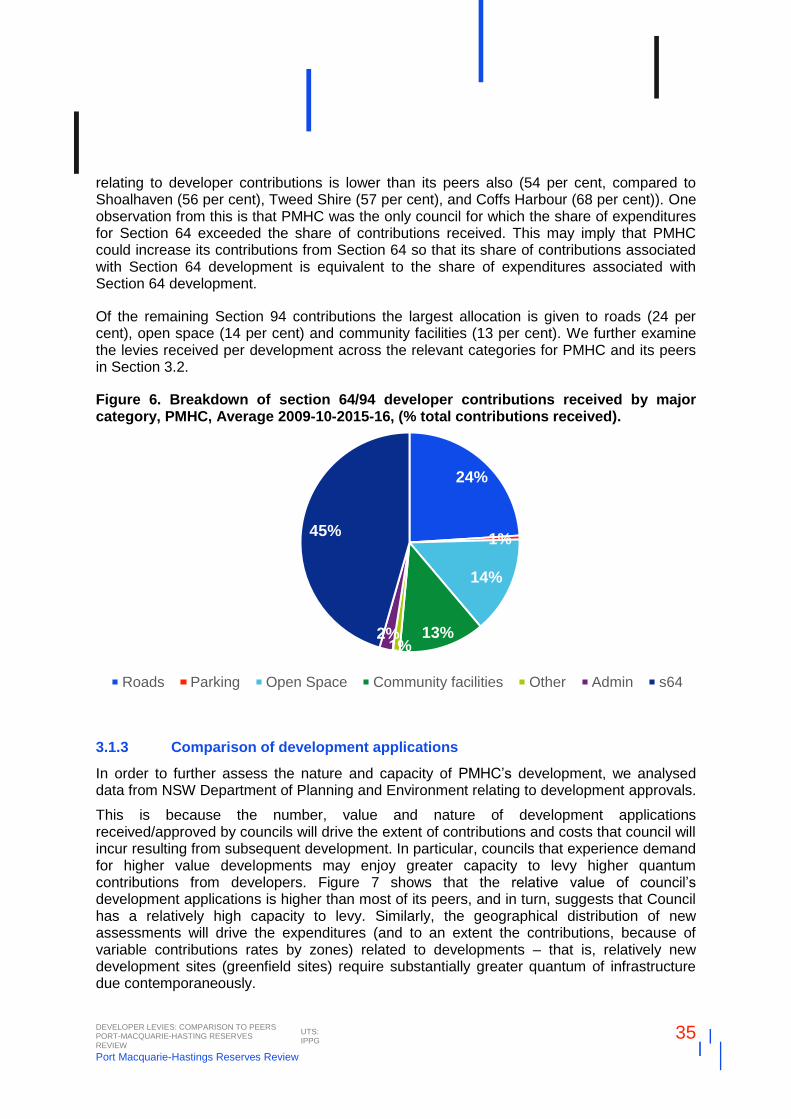
3.1.2 Comparing the allocation of developer contributions
In Figure 6, we have collated the average developer contributions (both Section 94 and Section 64) received and allocated to the relevant categories for the period 2009-10 to 2015-16 for PMHC. This shows that close to half of all developer contributions received by PMHC are related to Section 64 (45 per cent). This proportion is relatively low compared to its peers. For instance, for Shoalhaven, Section 64 contributions make up 62 per cent of all developer contributions and for Tweed Shire this is 68 per cent and Coffs Harbour it is 69 per cent. However, the share of Section 64 expenditure as a share of total expenditure
0
10000
20000
30000
40000
50000
60000
Coffs Lake Mac Maitland Port Mac Shoalhaven Tweed Wollongong
Contributions Holdings
DEVELOPER LEVIES: COMPARISON TO PEERS PORT-MACQUARIE-HASTING RESERVES REVIEW
UTS: IPPG
35
Port Macquarie-Hastings Reserves Review
relating to developer contributions is lower than its peers also (54 per cent, compared to Shoalhaven (56 per cent), Tweed Shire (57 per cent), and Coffs Harbour (68 per cent)). One observation from this is that PMHC was the only council for which the share of expenditures for Section 64 exceeded the share of contributions received. This may imply that PMHC could increase its contributions from Section 64 so that its share of contributions associated with Section 64 development is equivalent to the share of expenditures associated with Section 64 development.
Of the remaining Section 94 contributions the largest allocation is given to roads (24 per cent), open space (14 per cent) and community facilities (13 per cent). We further examine the levies received per development across the relevant categories for PMHC and its peers in Section 3.2.
Figure 6. Breakdown of section 64/94 developer contributions received by major category, PMHC, Average 2009-10-2015-16, (% total contributions received).
3.1.3 Comparison of development applications
In order to further assess the nature and capacity of PMHC’s development, we analysed data from NSW Department of Planning and Environment relating to development approvals.
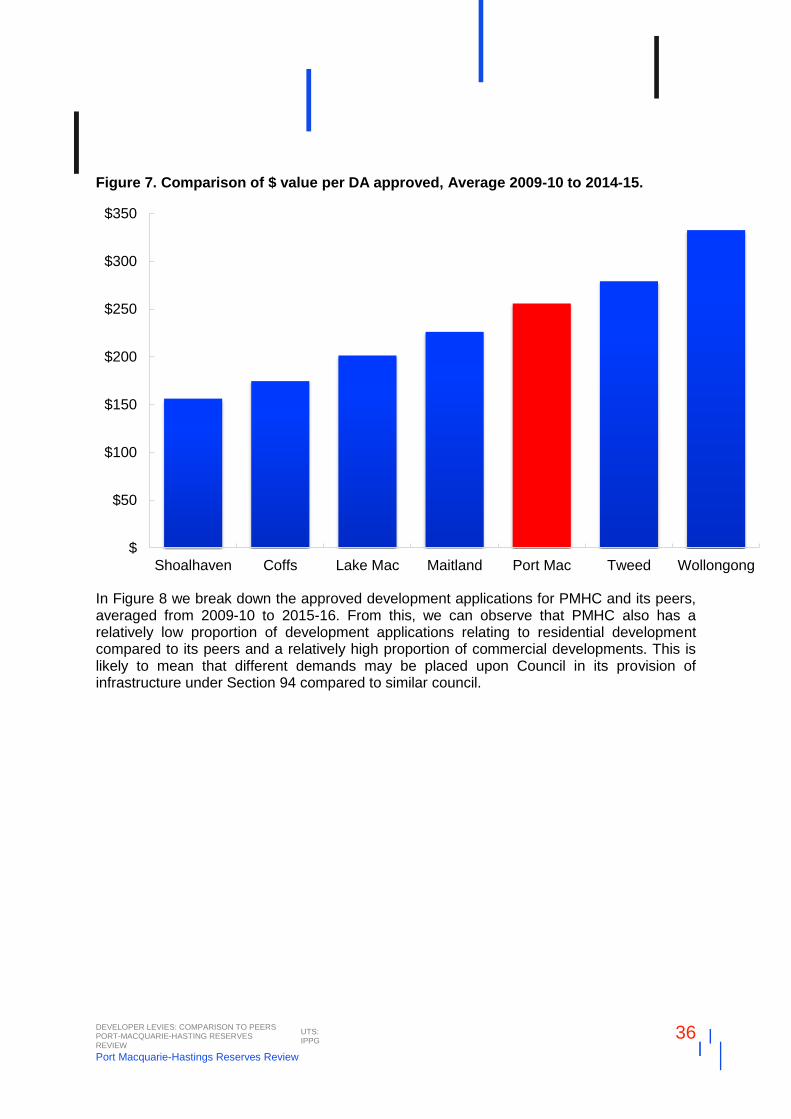
This is because the number, value and nature of development applications received/approved by councils will drive the extent of contributions and costs that council will incur resulting from subsequent development. In particular, councils that experience demand for higher value developments may enjoy greater capacity to levy higher quantum contributions from developers. Figure 7 shows that the relative value of council’s development applications is higher than most of its peers, and in turn, suggests that Council has a relatively high capacity to levy. Similarly, the geographical distribution of new assessments will drive the expenditures (and to an extent the contributions, because of variable contributions rates by zones) related to developments – that is, relatively new development sites (greenfield sites) require substantially greater quantum of infrastructure due contemporaneously.
24%
1%
14%
13% 1%
2%
45%
Roads Parking Open Space Community facilities Other Admin s64
DEVELOPER LEVIES: COMPARISON TO PEERS PORT-MACQUARIE-HASTING RESERVES REVIEW
UTS: IPPG
36
Port Macquarie-Hastings Reserves Review
Figure 7. Comparison of $ value per DA approved, Average 2009-10 to 2014-15.
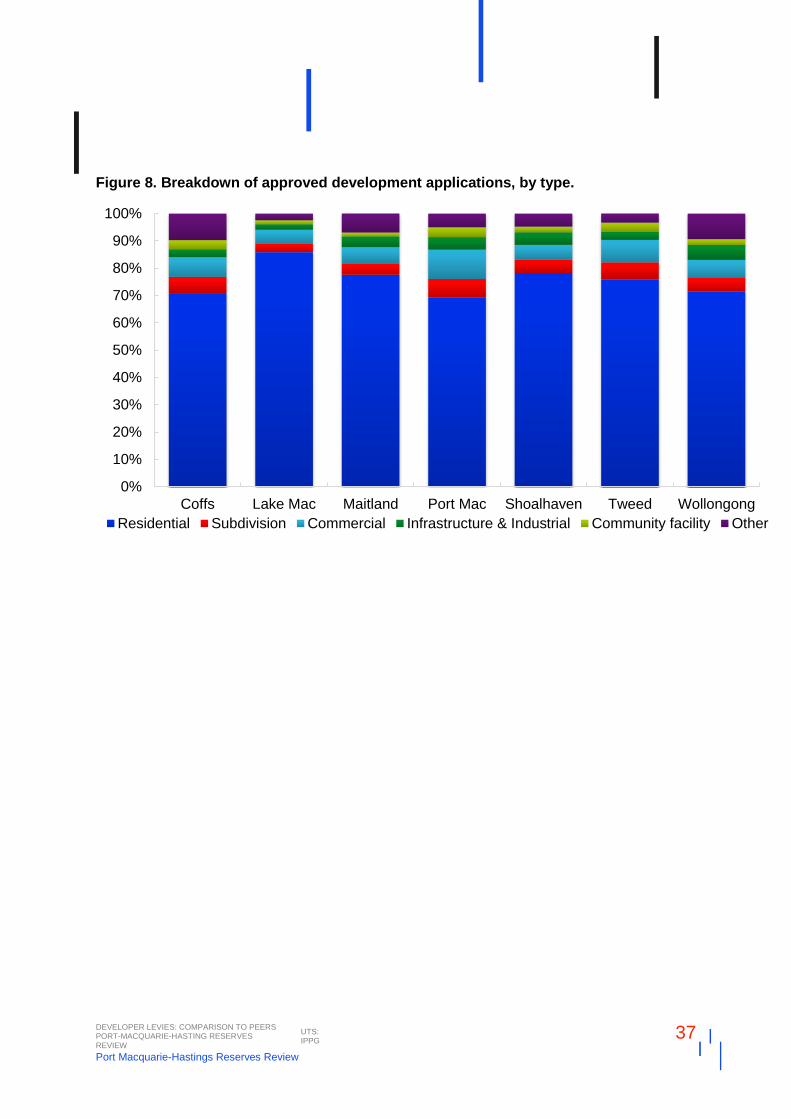
In Figure 8 we break down the approved development applications for PMHC and its peers, averaged from 2009-10 to 2015-16. From this, we can observe that PMHC also has a relatively low proportion of development applications relating to residential development compared to its peers and a relatively high proportion of commercial developments. This is likely to mean that different demands may be placed upon Council in its provision of infrastructure under Section 94 compared to similar council.
$
$50
$100
$150
$200
$250
$300
$350
Shoalhaven Coffs Lake Mac Maitland Port Mac Tweed Wollongong
DEVELOPER LEVIES: COMPARISON TO PEERS PORT-MACQUARIE-HASTING RESERVES REVIEW
UTS: IPPG
37
Port Macquarie-Hastings Reserves Review
Figure 8. Breakdown of approved development applications, by type.
0%
10%
20%
30%
40%
50%
60%
70%
80%
90%
100%
Coffs Lake Mac Maitland Port Mac Shoalhaven Tweed Wollongong
Residential Subdivision Commercial Infrastructure & Industrial Community facility Other
DEVELOPER LEVIES: COMPARISON TO PEERS PORT-MACQUARIE-HASTING RESERVES REVIEW
UTS: IPPG
38
Port Macquarie-Hastings Reserves Review
3.1.4 Comparing section 94 developer contributions and expenditures
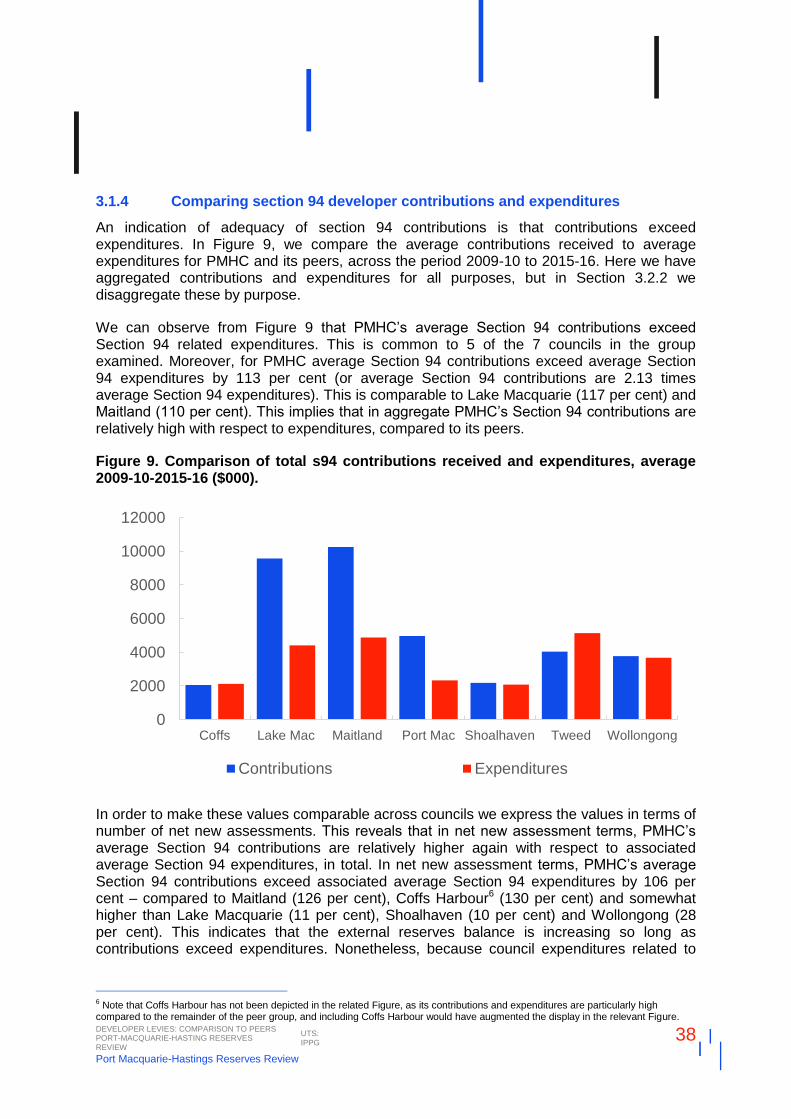
An indication of adequacy of section 94 contributions is that contributions exceed expenditures. In Figure 9, we compare the average contributions received to average expenditures for PMHC and its peers, across the period 2009-10 to 2015-16. Here we have aggregated contributions and expenditures for all purposes, but in Section 3.2.2 we disaggregate these by purpose.
We can observe from Figure 9 that PMHC’s average Section 94 contributions exceed Section 94 related expenditures. This is common to 5 of the 7 councils in the group examined. Moreover, for PMHC average Section 94 contributions exceed average Section 94 expenditures by 113 per cent (or average Section 94 contributions are 2.13 times average Section 94 expenditures). This is comparable to Lake Macquarie (117 per cent) and Maitland (110 per cent). This implies that in aggregate PMHC’s Section 94 contributions are relatively high with respect to expenditures, compared to its peers.
Figure 9. Comparison of total s94 contributions received and expenditures, average 2009-10-2015-16 ($000).
In order to make these values comparable across councils we express the values in terms of number of net new assessments. This reveals that in net new assessment terms, PMHC’s average Section 94 contributions are relatively higher again with respect to associated average Section 94 expenditures, in total. In net new assessment terms, PMHC’s average Section 94 contributions exceed associated average Section 94 expenditures by 106 per cent – compared to Maitland (126 per cent), Coffs Harbour6 (130 per cent) and somewhat higher than Lake Macquarie (11 per cent), Shoalhaven (10 per cent) and Wollongong (28 per cent). This indicates that the external reserves balance is increasing so long as contributions exceed expenditures. Nonetheless, because council expenditures related to
6 Note that Coffs Harbour has not been depicted in the related Figure, as its contributions and expenditures are particularly high compared to the remainder of the peer group, and including Coffs Harbour would have augmented the display in the relevant Figure.
0
2000
4000
6000
8000
10000
12000
Coffs Lake Mac Maitland Port Mac Shoalhaven Tweed Wollongong
Contributions Expenditures
DEVELOPER LEVIES: COMPARISON TO PEERS PORT-MACQUARIE-HASTING RESERVES REVIEW
UTS: IPPG
39
Port Macquarie-Hastings Reserves Review
developments may be somewhat lumpy – that is, very large infrequent expenditures may be incurred when substantive development costs fall due – this may be perfectly justified.
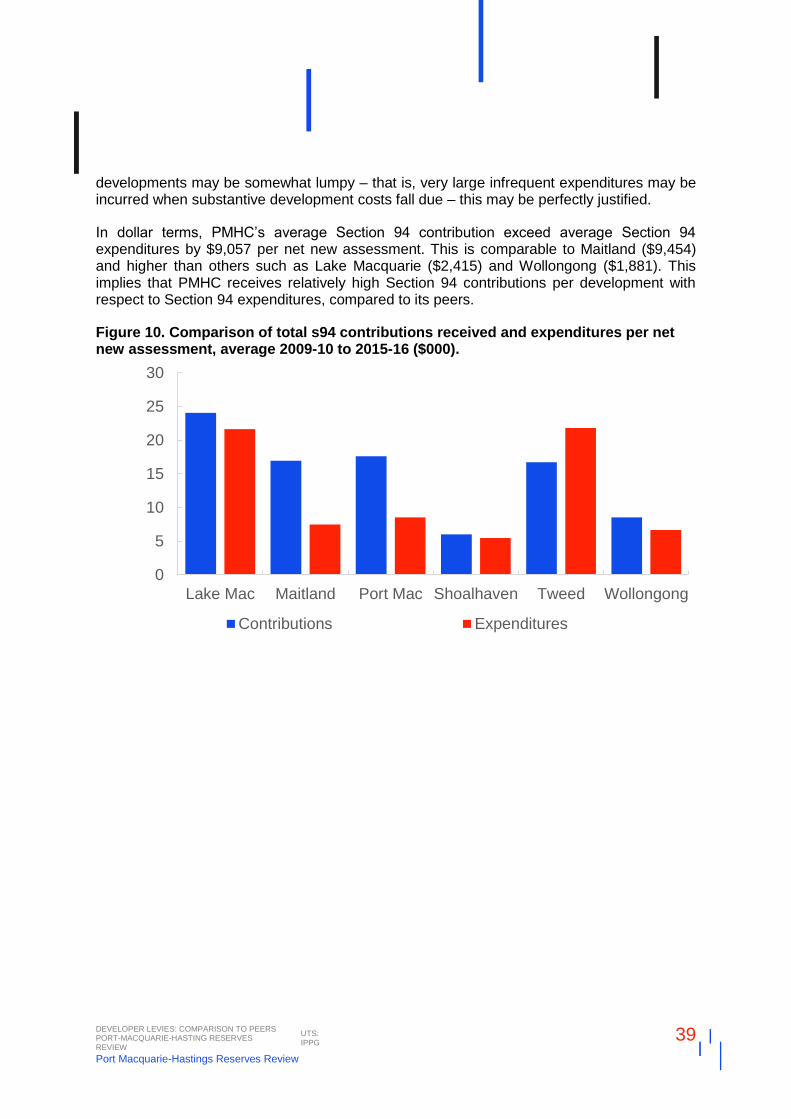
In dollar terms, PMHC’s average Section 94 contribution exceed average Section 94 expenditures by $9,057 per net new assessment. This is comparable to Maitland ($9,454) and higher than others such as Lake Macquarie ($2,415) and Wollongong ($1,881). This implies that PMHC receives relatively high Section 94 contributions per development with respect to Section 94 expenditures, compared to its peers.
Figure 10. Comparison of total s94 contributions received and expenditures per net new assessment, average 2009-10 to 2015-16 ($000).
0
5
10
15
20
25
30
Lake Mac Maitland Port Mac Shoalhaven Tweed Wollongong
Contributions Expenditures
DEVELOPER LEVIES: COMPARISON TO PEERS PORT-MACQUARIE-HASTING RESERVES REVIEW
UTS: IPPG
40
Port Macquarie-Hastings Reserves Review
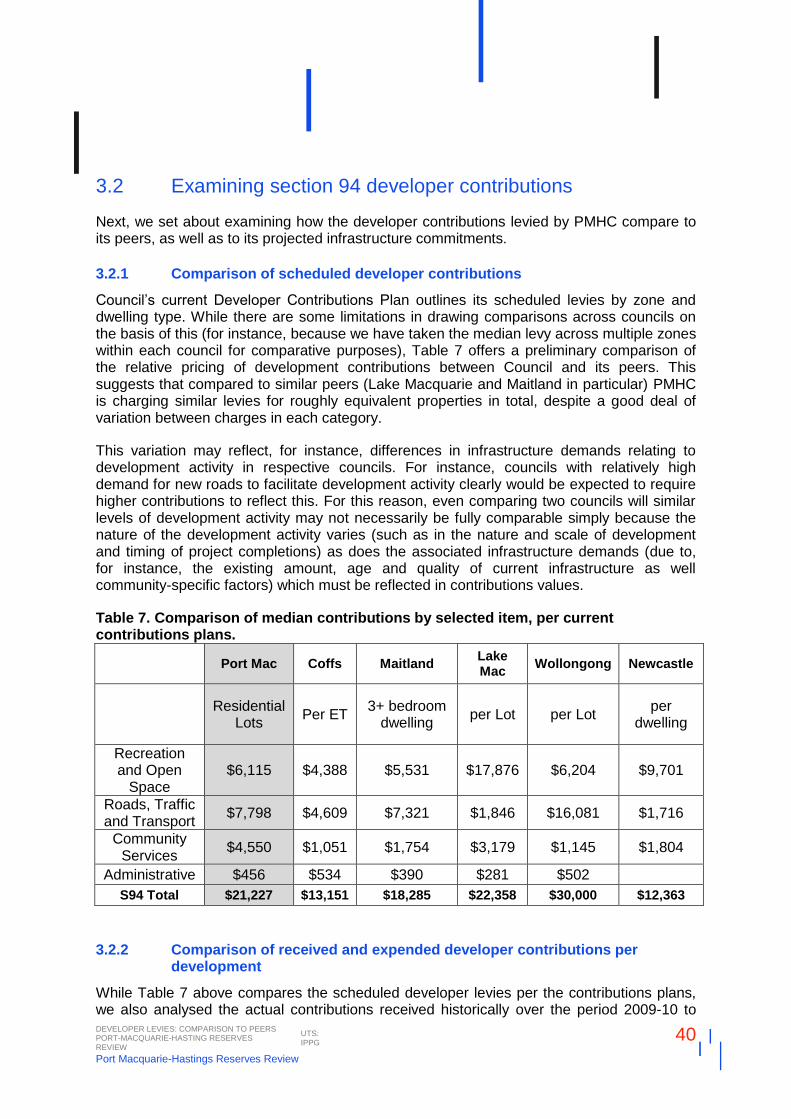
3.2 Examining section 94 developer contributions
Next, we set about examining how the developer contributions levied by PMHC compare to its peers, as well as to its projected infrastructure commitments.
3.2.1 Comparison of scheduled developer contributions
Council’s current Developer Contributions Plan outlines its scheduled levies by zone and dwelling type. While there are some limitations in drawing comparisons across councils on the basis of this (for instance, because we have taken the median levy across multiple zones within each council for comparative purposes), Table 7 offers a preliminary comparison of the relative pricing of development contributions between Council and its peers. This suggests that compared to similar peers (Lake Macquarie and Maitland in particular) PMHC is charging similar levies for roughly equivalent properties in total, despite a good deal of variation between charges in each category.
This variation may reflect, for instance, differences in infrastructure demands relating to development activity in respective councils. For instance, councils with relatively high demand for new roads to facilitate development activity clearly would be expected to require higher contributions to reflect this. For this reason, even comparing two councils will similar levels of development activity may not necessarily be fully comparable simply because the nature of the development activity varies (such as in the nature and scale of development and timing of project completions) as does the associated infrastructure demands (due to, for instance, the existing amount, age and quality of current infrastructure as well community-specific factors) which must be reflected in contributions values.
Table 7. Comparison of median contributions by selected item, per current contributions plans.
Port Mac Coffs Maitland Lake Mac
Wollongong Newcastle
Residential
Lots Per ET
3+ bedroom dwelling
per Lot per Lot per
dwelling
Recreation and Open
Space $6,115 $4,388 $5,531 $17,876 $6,204 $9,701
Roads, Traffic and Transport
$7,798 $4,609 $7,321 $1,846 $16,081 $1,716
Community Services
$4,550 $1,051 $1,754 $3,179 $1,145 $1,804
Administrative $456 $534 $390 $281 $502
S94 Total $21,227 $13,151 $18,285 $22,358 $30,000 $12,363
3.2.2 Comparison of received and expended developer contributions per development
While Table 7 above compares the scheduled developer levies per the contributions plans, we also analysed the actual contributions received historically over the period 2009-10 to
DEVELOPER LEVIES: COMPARISON TO PEERS PORT-MACQUARIE-HASTING RESERVES REVIEW
UTS: IPPG
41
Port Macquarie-Hastings Reserves Review
2015-16 (per Note 17/Note 3(f) of the annual financial statements; see, Table 8). Because the financial statement reporting contains relatively consistent line items, and is allocated to actual receipts rather than scheduled contributions, this makes this an effective source to compare contributions and expenditures between Council and its peers across generally comparable parameters.
Based on this, PMHC’s contributions received for each new assessment is approximately $17,605 on average (compared to its current median scheduled residential lot contribution of $21,227).
For PMHC to maximise contributions it should regularly evaluate whether opportunities exist to levy higher amounts for contributions, particularly where expenses are likely to exceed the levies scheduled on their contributions plans. Another consideration for councils seeking to maximise developer contributions is to evaluate whether its Contributions Plan is up to date. This schedule may be updated, for instance, in response to substantive changes in development activity in an area, or to update pricing if it is deemed inadequate to meet the development ‘nexus’. There are potential risks associated with updates to Contributions Plans however. Principal among these is the potential to deter demand from price-sensitive and mobile developers, in response to upward revisions of Contributions Plans. A good practice generally is to ensure that Contributions Plans remain contemporary to peers. For PMHC, the Contributions Plan schedule is relatively older than its peers, which may suggest that revisions could be considered.
That said, given the potential risks incumbent to revisions to Contributions Plans, it is necessary to benchmark current levies and expenditures to determine if: i) expenditures do not regularly exceed contributions, and ii) that levies remain comparable to peers (even if the Contributions Plan itself has not updated).
With this in mind, we compiled Table 8 to compare the average contributions and expenditures for PMHC and its peers across the period 2009-10 to 2015-16, based on values reported in Note 17 of the Annual Financial Statements.
Examination of Table 8 reveals that the contributions in each category exceed expenditures, except for the ‘other’ category. Compared to Lake Macquarie, PMHC generally levies a lower contribution, which is roughly commensurate with variation in expenditures. Compared to Maitland, levies are greater for community facilities and other contributions, but lower for parking and open space. PMHC is encouraged to utilise the details provided in Table 8 to aid in consideration of adequacy of their current contributions levies.
We provide some suggestions for PMHC’s consideration, from Table 8:
PMHC does not levy or record expenditures relating to Section 94 drainage, however this is common practice amongst PMHC’s peers. This may represent a potential opportunity for PMHC to levy charges for drainage if sufficient nexus can be demonstrated.
Contributions associated with roads and traffic would appear to be maximised given that its charges are relatively high compared to peers as well as with respect to expenditures (highest amongst the peers).
DEVELOPER LEVIES: COMPARISON TO PEERS PORT-MACQUARIE-HASTING RESERVES REVIEW
UTS: IPPG
42
Port Macquarie-Hastings Reserves Review
Contributions associated with parking does exceed expenditures relating to this, however this covers cost by just 15 per cent, however some peers of PMHC charge levies that are over four times higher than expenditures in this respect (such as Coffs Harbour). If PMHC applied this same pricing, levies for parking would increase to $865 (an increase of $629).
o Based on PMHC’s expected growth in assessments of around 1 per cent, this would imply an increase in contributions of around $220,636 if this were employed for 2017-18.
Contributions associated with open space would appear to be maximised given that its charges are relatively high with respect to expenditures (around 2.8 times, compared to Maitland (2.6 times) and Shoalhaven (2.5 times) and somewhat higher than the remainder of the peer group).
Contributions associated with community facilities would appear to be broadly maximised given that its charges are comparable to its peers, with respect to expenditures (around 1.5 times higher, in line with Tweed Shire (1.5 times) and Lake Macquarie (1.5 times). While Maitland (5.8 times) and Wollongong (14.4 times) charge much higher contributions relative to expenditures, it would not be advisable for PMHC to attempt to replicate this, unless an appropriate nexus can be justified.
Contributions associated with ‘other’ expenditures (including administration levies) are not sufficient to cover expenditure on average. In particular, expenditures in this category are 2.2 times higher than contributions levied. If PMHC were to raise contributions to meet expenditures, ‘other’ contributions plus administration levies would increase to $668 (an increase of $359). It should be noted that amongst the peers, it is uncommon to see other contributions exceeding expenditures. If PMHC were to attempt to replicate Maitland’s pricing (contributions on average 24 per cent higher than expenditures) then it may consider an increase in contributions to $828 (an increase of $519).
o Based on PMHC’s expected growth in assessments of around 1 per cent, this would imply an increase in contributions of around $125,928 (for an increase in contributions to meet expenditures) or $182,051 (for an increase in contributions to replicate Maitland) if this were employed for 2017-18.
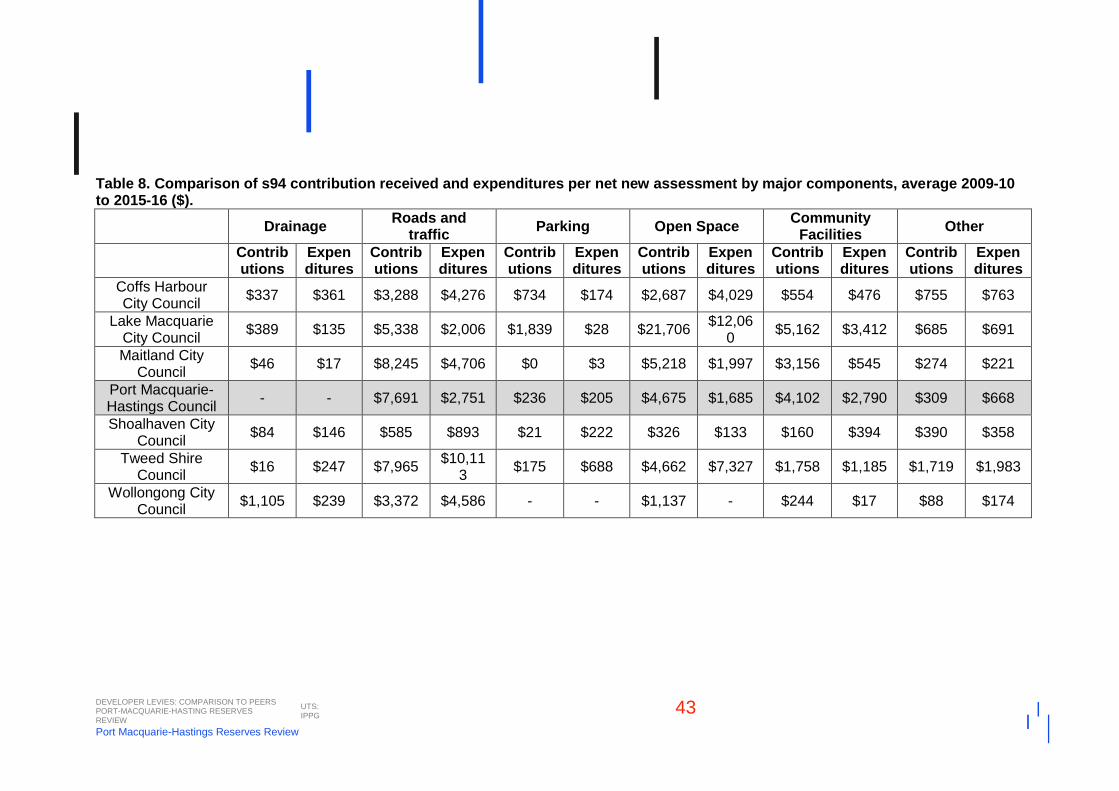
DEVELOPER LEVIES: COMPARISON TO PEERS PORT-MACQUARIE-HASTING RESERVES REVIEW
UTS: IPPG
43
Port Macquarie-Hastings Reserves Review
Table 8. Comparison of s94 contribution received and expenditures per net new assessment by major components, average 2009-10 to 2015-16 ($).
Drainage
Roads and traffic
Parking Open Space Community
Facilities Other
Contributions
Expenditures
Contributions
Expenditures
Contributions
Expenditures
Contributions
Expenditures
Contributions
Expenditures
Contributions
Expenditures
Coffs Harbour City Council
$337 $361 $3,288 $4,276 $734 $174 $2,687 $4,029 $554 $476 $755 $763
Lake Macquarie City Council
$389 $135 $5,338 $2,006 $1,839 $28 $21,706 $12,06
0 $5,162 $3,412 $685 $691
Maitland City Council
$46 $17 $8,245 $4,706 $0 $3 $5,218 $1,997 $3,156 $545 $274 $221
Port Macquarie-Hastings Council
- - $7,691 $2,751 $236 $205 $4,675 $1,685 $4,102 $2,790 $309 $668
Shoalhaven City Council
$84 $146 $585 $893 $21 $222 $326 $133 $160 $394 $390 $358
Tweed Shire Council
$16 $247 $7,965 $10,11
3 $175 $688 $4,662 $7,327 $1,758 $1,185 $1,719 $1,983
Wollongong City Council
$1,105 $239 $3,372 $4,586 - - $1,137 - $244 $17 $88 $174
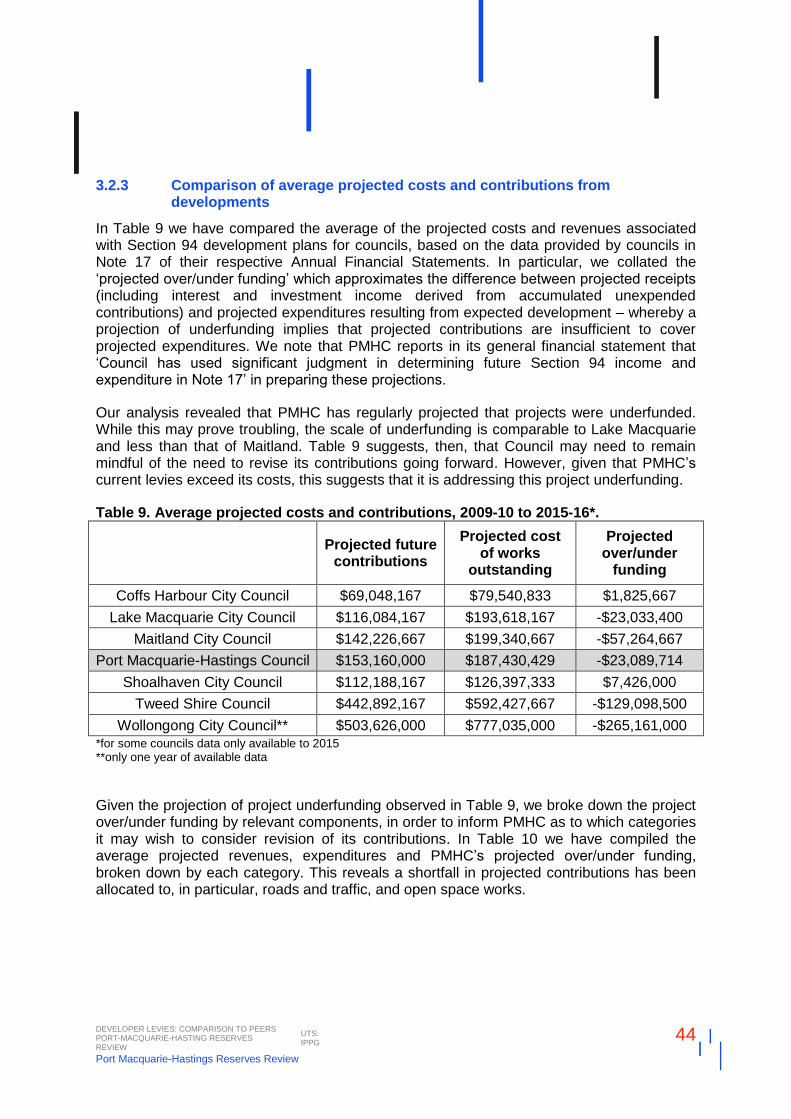
DEVELOPER LEVIES: COMPARISON TO PEERS PORT-MACQUARIE-HASTING RESERVES REVIEW
UTS: IPPG
44
Port Macquarie-Hastings Reserves Review
3.2.3 Comparison of average projected costs and contributions from developments
In Table 9 we have compared the average of the projected costs and revenues associated with Section 94 development plans for councils, based on the data provided by councils in Note 17 of their respective Annual Financial Statements. In particular, we collated the ‘projected over/under funding’ which approximates the difference between projected receipts (including interest and investment income derived from accumulated unexpended contributions) and projected expenditures resulting from expected development – whereby a projection of underfunding implies that projected contributions are insufficient to cover projected expenditures. We note that PMHC reports in its general financial statement that ‘Council has used significant judgment in determining future Section 94 income and expenditure in Note 17’ in preparing these projections.
Our analysis revealed that PMHC has regularly projected that projects were underfunded. While this may prove troubling, the scale of underfunding is comparable to Lake Macquarie and less than that of Maitland. Table 9 suggests, then, that Council may need to remain mindful of the need to revise its contributions going forward. However, given that PMHC’s current levies exceed its costs, this suggests that it is addressing this project underfunding.
Table 9. Average projected costs and contributions, 2009-10 to 2015-16*.
Projected future
contributions
Projected cost of works
outstanding
Projected over/under
funding
Coffs Harbour City Council $69,048,167 $79,540,833 $1,825,667
Lake Macquarie City Council $116,084,167 $193,618,167 -$23,033,400
Maitland City Council $142,226,667 $199,340,667 -$57,264,667
Port Macquarie-Hastings Council $153,160,000 $187,430,429 -$23,089,714
Shoalhaven City Council $112,188,167 $126,397,333 $7,426,000
Tweed Shire Council $442,892,167 $592,427,667 -$129,098,500
Wollongong City Council** $503,626,000 $777,035,000 -$265,161,000 *for some councils data only available to 2015 **only one year of available data
Given the projection of project underfunding observed in Table 9, we broke down the project over/under funding by relevant components, in order to inform PMHC as to which categories it may wish to consider revision of its contributions. In Table 10 we have compiled the average projected revenues, expenditures and PMHC’s projected over/under funding, broken down by each category. This reveals a shortfall in projected contributions has been allocated to, in particular, roads and traffic, and open space works.
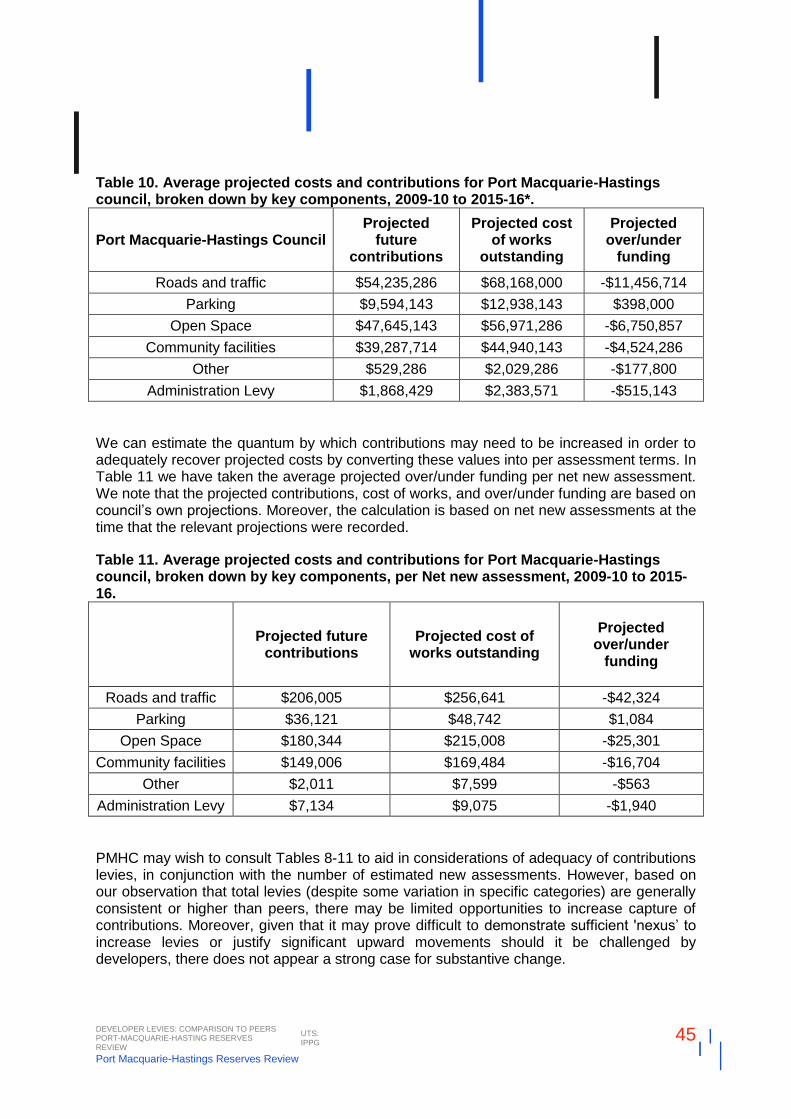
DEVELOPER LEVIES: COMPARISON TO PEERS PORT-MACQUARIE-HASTING RESERVES REVIEW
UTS: IPPG
45
Port Macquarie-Hastings Reserves Review
Table 10. Average projected costs and contributions for Port Macquarie-Hastings council, broken down by key components, 2009-10 to 2015-16*.
Port Macquarie-Hastings Council Projected
future contributions
Projected cost of works
outstanding
Projected over/under
funding
Roads and traffic $54,235,286 $68,168,000 -$11,456,714
Parking $9,594,143 $12,938,143 $398,000
Open Space $47,645,143 $56,971,286 -$6,750,857
Community facilities $39,287,714 $44,940,143 -$4,524,286
Other $529,286 $2,029,286 -$177,800
Administration Levy $1,868,429 $2,383,571 -$515,143
We can estimate the quantum by which contributions may need to be increased in order to adequately recover projected costs by converting these values into per assessment terms. In Table 11 we have taken the average projected over/under funding per net new assessment. We note that the projected contributions, cost of works, and over/under funding are based on council’s own projections. Moreover, the calculation is based on net new assessments at the time that the relevant projections were recorded.
Table 11. Average projected costs and contributions for Port Macquarie-Hastings council, broken down by key components, per Net new assessment, 2009-10 to 2015-16.
Projected future
contributions Projected cost of
works outstanding
Projected over/under
funding
Roads and traffic $206,005 $256,641 -$42,324
Parking $36,121 $48,742 $1,084
Open Space $180,344 $215,008 -$25,301
Community facilities $149,006 $169,484 -$16,704
Other $2,011 $7,599 -$563
Administration Levy $7,134 $9,075 -$1,940
PMHC may wish to consult Tables 8-11 to aid in considerations of adequacy of contributions levies, in conjunction with the number of estimated new assessments. However, based on our observation that total levies (despite some variation in specific categories) are generally consistent or higher than peers, there may be limited opportunities to increase capture of contributions. Moreover, given that it may prove difficult to demonstrate sufficient 'nexus’ to increase levies or justify significant upward movements should it be challenged by developers, there does not appear a strong case for substantive change.
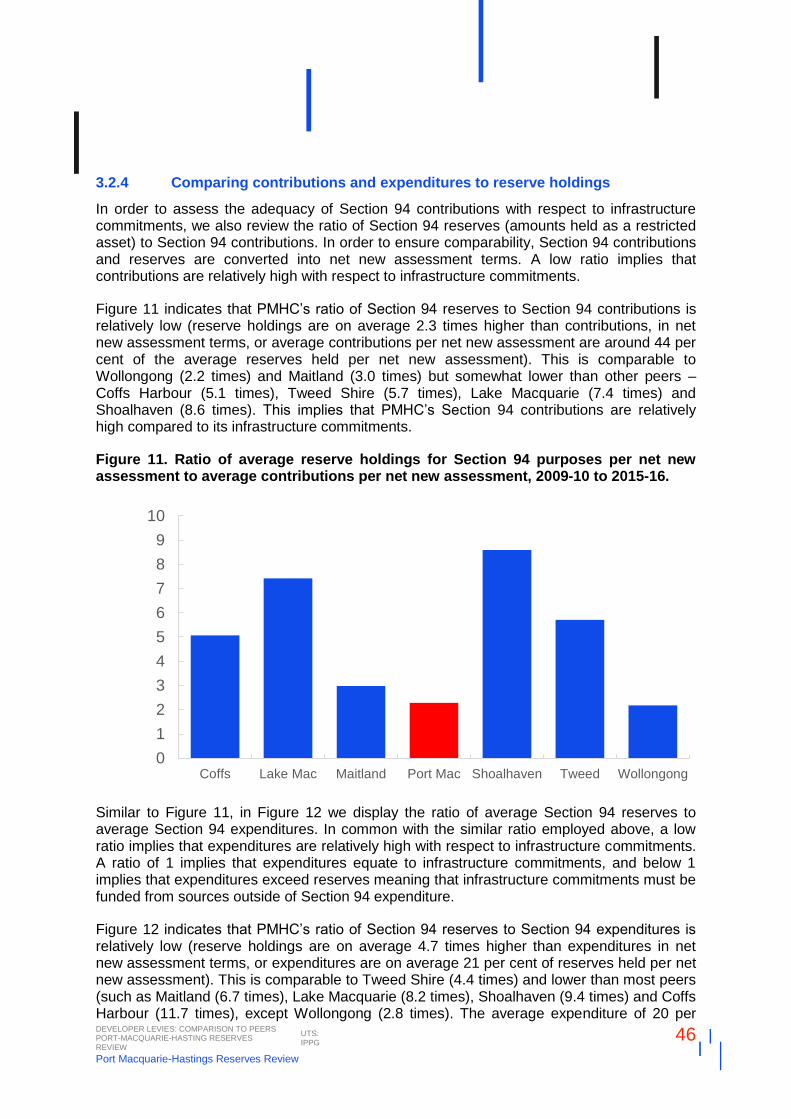
DEVELOPER LEVIES: COMPARISON TO PEERS PORT-MACQUARIE-HASTING RESERVES REVIEW
UTS: IPPG
46
Port Macquarie-Hastings Reserves Review
3.2.4 Comparing contributions and expenditures to reserve holdings
In order to assess the adequacy of Section 94 contributions with respect to infrastructure commitments, we also review the ratio of Section 94 reserves (amounts held as a restricted asset) to Section 94 contributions. In order to ensure comparability, Section 94 contributions and reserves are converted into net new assessment terms. A low ratio implies that contributions are relatively high with respect to infrastructure commitments.
Figure 11 indicates that PMHC’s ratio of Section 94 reserves to Section 94 contributions is relatively low (reserve holdings are on average 2.3 times higher than contributions, in net new assessment terms, or average contributions per net new assessment are around 44 per cent of the average reserves held per net new assessment). This is comparable to Wollongong (2.2 times) and Maitland (3.0 times) but somewhat lower than other peers – Coffs Harbour (5.1 times), Tweed Shire (5.7 times), Lake Macquarie (7.4 times) and Shoalhaven (8.6 times). This implies that PMHC’s Section 94 contributions are relatively high compared to its infrastructure commitments.
Figure 11. Ratio of average reserve holdings for Section 94 purposes per net new assessment to average contributions per net new assessment, 2009-10 to 2015-16.
Similar to Figure 11, in Figure 12 we display the ratio of average Section 94 reserves to average Section 94 expenditures. In common with the similar ratio employed above, a low ratio implies that expenditures are relatively high with respect to infrastructure commitments. A ratio of 1 implies that expenditures equate to infrastructure commitments, and below 1 implies that expenditures exceed reserves meaning that infrastructure commitments must be funded from sources outside of Section 94 expenditure.
Figure 12 indicates that PMHC’s ratio of Section 94 reserves to Section 94 expenditures is relatively low (reserve holdings are on average 4.7 times higher than expenditures in net new assessment terms, or expenditures are on average 21 per cent of reserves held per net new assessment). This is comparable to Tweed Shire (4.4 times) and lower than most peers (such as Maitland (6.7 times), Lake Macquarie (8.2 times), Shoalhaven (9.4 times) and Coffs Harbour (11.7 times), except Wollongong (2.8 times). The average expenditure of 20 per
0
1
2
3
4
5
6
7
8
9
10
Coffs Lake Mac Maitland Port Mac Shoalhaven Tweed Wollongong
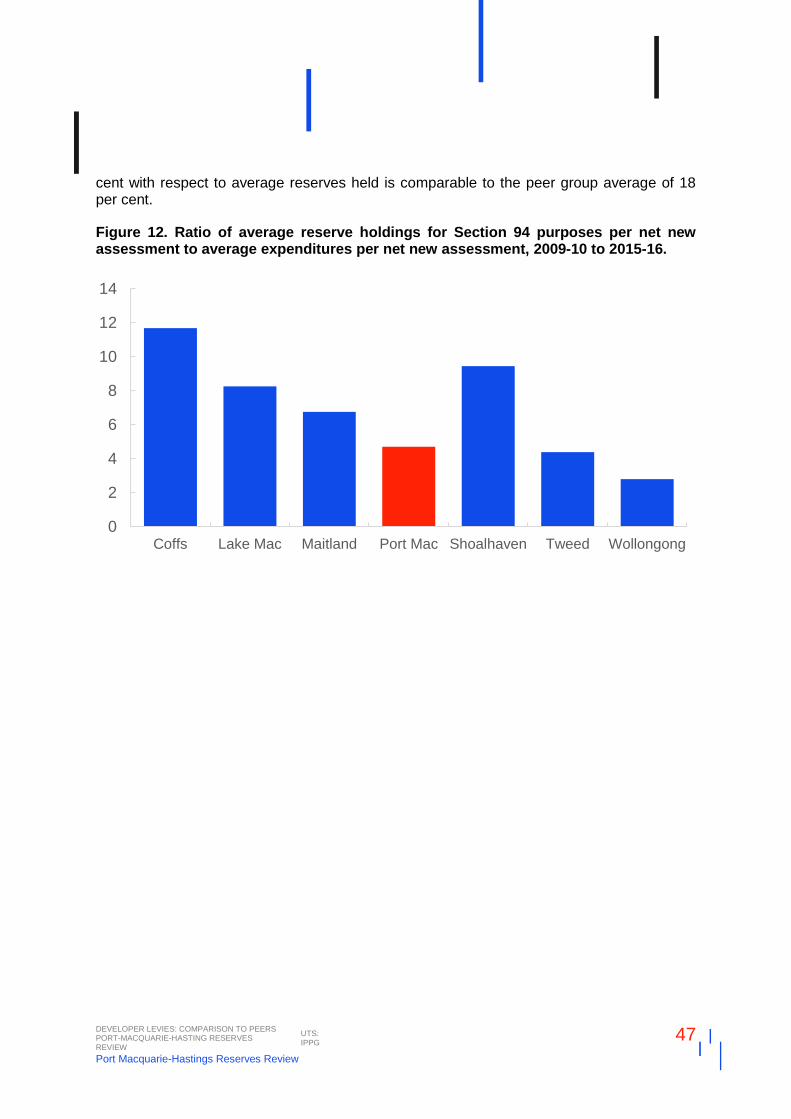
DEVELOPER LEVIES: COMPARISON TO PEERS PORT-MACQUARIE-HASTING RESERVES REVIEW
UTS: IPPG
47
Port Macquarie-Hastings Reserves Review
cent with respect to average reserves held is comparable to the peer group average of 18 per cent.
Figure 12. Ratio of average reserve holdings for Section 94 purposes per net new assessment to average expenditures per net new assessment, 2009-10 to 2015-16.
0
2
4
6
8
10
12
14
Coffs Lake Mac Maitland Port Mac Shoalhaven Tweed Wollongong
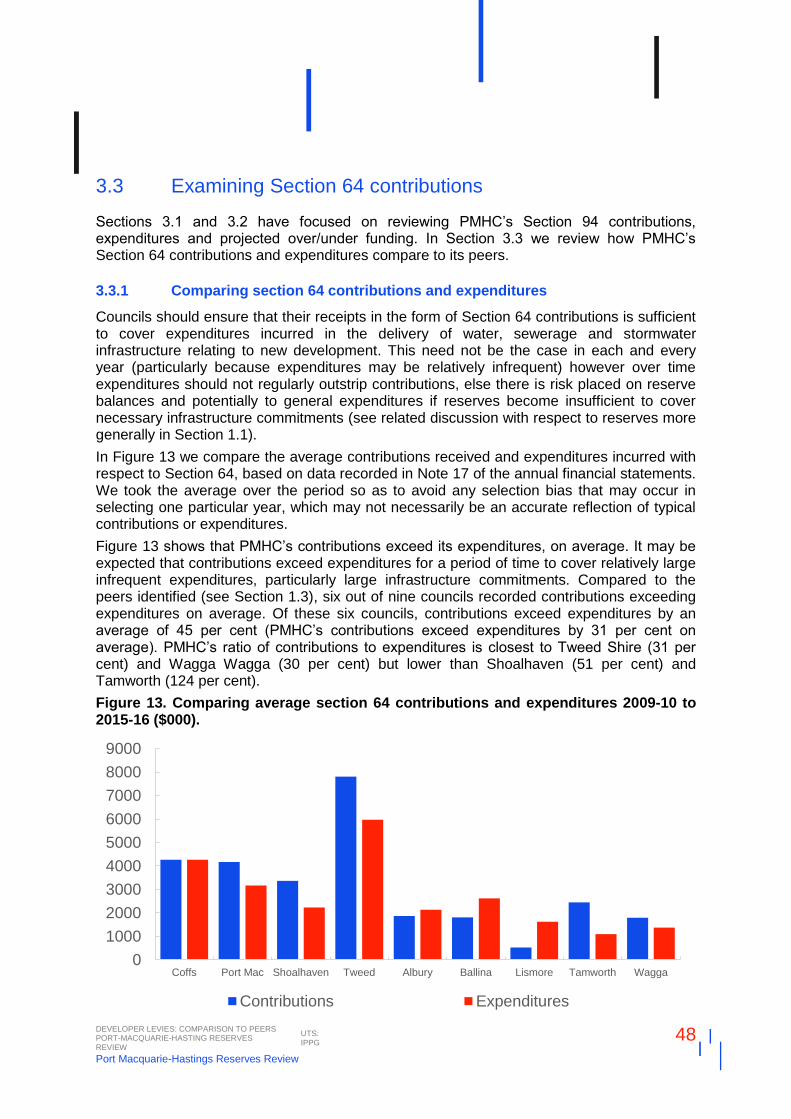
DEVELOPER LEVIES: COMPARISON TO PEERS PORT-MACQUARIE-HASTING RESERVES REVIEW
UTS: IPPG
48
Port Macquarie-Hastings Reserves Review
3.3 Examining Section 64 contributions
Sections 3.1 and 3.2 have focused on reviewing PMHC’s Section 94 contributions, expenditures and projected over/under funding. In Section 3.3 we review how PMHC’s Section 64 contributions and expenditures compare to its peers.
3.3.1 Comparing section 64 contributions and expenditures
Councils should ensure that their receipts in the form of Section 64 contributions is sufficient to cover expenditures incurred in the delivery of water, sewerage and stormwater infrastructure relating to new development. This need not be the case in each and every year (particularly because expenditures may be relatively infrequent) however over time expenditures should not regularly outstrip contributions, else there is risk placed on reserve balances and potentially to general expenditures if reserves become insufficient to cover necessary infrastructure commitments (see related discussion with respect to reserves more generally in Section 1.1).
In Figure 13 we compare the average contributions received and expenditures incurred with respect to Section 64, based on data recorded in Note 17 of the annual financial statements. We took the average over the period so as to avoid any selection bias that may occur in selecting one particular year, which may not necessarily be an accurate reflection of typical contributions or expenditures.
Figure 13 shows that PMHC’s contributions exceed its expenditures, on average. It may be expected that contributions exceed expenditures for a period of time to cover relatively large infrequent expenditures, particularly large infrastructure commitments. Compared to the peers identified (see Section 1.3), six out of nine councils recorded contributions exceeding expenditures on average. Of these six councils, contributions exceed expenditures by an average of 45 per cent (PMHC’s contributions exceed expenditures by 31 per cent on average). PMHC’s ratio of contributions to expenditures is closest to Tweed Shire (31 per cent) and Wagga Wagga (30 per cent) but lower than Shoalhaven (51 per cent) and Tamworth (124 per cent).
Figure 13. Comparing average section 64 contributions and expenditures 2009-10 to 2015-16 ($000).
0
1000
2000
3000
4000
5000
6000
7000
8000
9000
Coffs Port Mac Shoalhaven Tweed Albury Ballina Lismore Tamworth Wagga
Contributions Expenditures
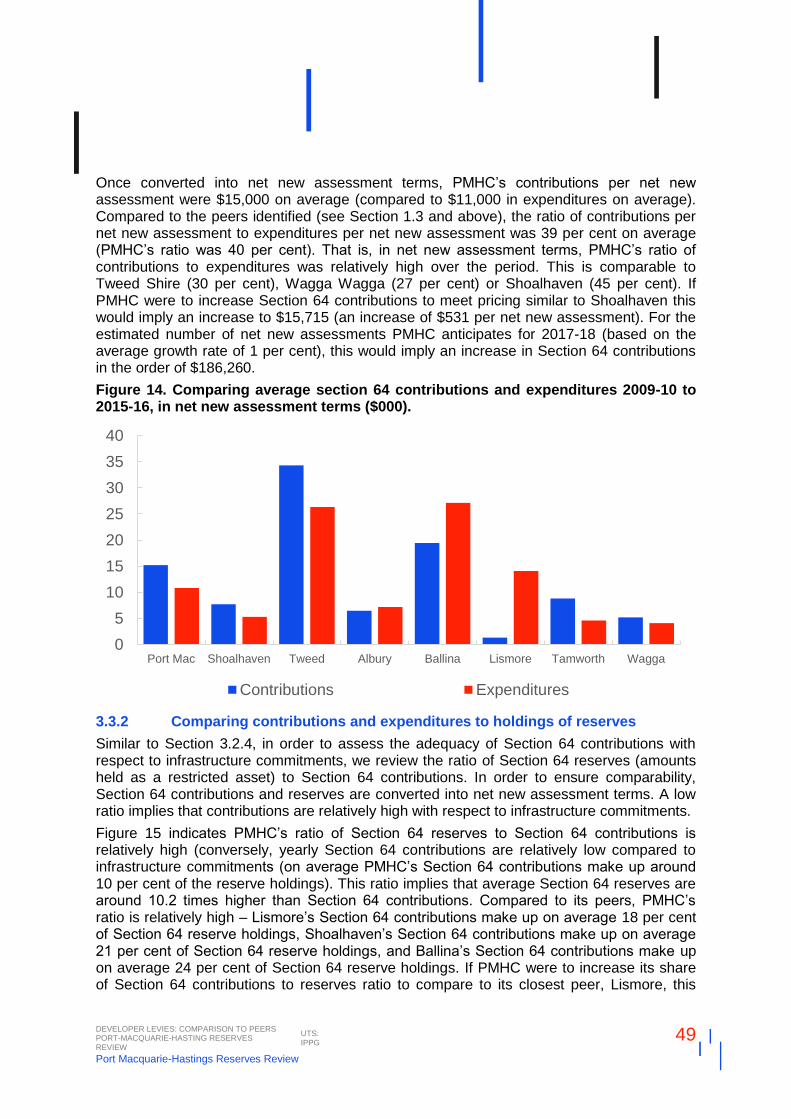
DEVELOPER LEVIES: COMPARISON TO PEERS PORT-MACQUARIE-HASTING RESERVES REVIEW
UTS: IPPG
49
Port Macquarie-Hastings Reserves Review
Once converted into net new assessment terms, PMHC’s contributions per net new assessment were $15,000 on average (compared to $11,000 in expenditures on average). Compared to the peers identified (see Section 1.3 and above), the ratio of contributions per net new assessment to expenditures per net new assessment was 39 per cent on average (PMHC’s ratio was 40 per cent). That is, in net new assessment terms, PMHC’s ratio of contributions to expenditures was relatively high over the period. This is comparable to Tweed Shire (30 per cent), Wagga Wagga (27 per cent) or Shoalhaven (45 per cent). If PMHC were to increase Section 64 contributions to meet pricing similar to Shoalhaven this would imply an increase to $15,715 (an increase of $531 per net new assessment). For the estimated number of net new assessments PMHC anticipates for 2017-18 (based on the average growth rate of 1 per cent), this would imply an increase in Section 64 contributions in the order of $186,260.
Figure 14. Comparing average section 64 contributions and expenditures 2009-10 to 2015-16, in net new assessment terms ($000).
3.3.2 Comparing contributions and expenditures to holdings of reserves
Similar to Section 3.2.4, in order to assess the adequacy of Section 64 contributions with respect to infrastructure commitments, we review the ratio of Section 64 reserves (amounts held as a restricted asset) to Section 64 contributions. In order to ensure comparability, Section 64 contributions and reserves are converted into net new assessment terms. A low ratio implies that contributions are relatively high with respect to infrastructure commitments.
Figure 15 indicates PMHC’s ratio of Section 64 reserves to Section 64 contributions is relatively high (conversely, yearly Section 64 contributions are relatively low compared to infrastructure commitments (on average PMHC’s Section 64 contributions make up around 10 per cent of the reserve holdings). This ratio implies that average Section 64 reserves are around 10.2 times higher than Section 64 contributions. Compared to its peers, PMHC’s ratio is relatively high – Lismore’s Section 64 contributions make up on average 18 per cent of Section 64 reserve holdings, Shoalhaven’s Section 64 contributions make up on average 21 per cent of Section 64 reserve holdings, and Ballina’s Section 64 contributions make up on average 24 per cent of Section 64 reserve holdings. If PMHC were to increase its share of Section 64 contributions to reserves ratio to compare to its closest peer, Lismore, this
0
5
10
15
20
25
30
35
40
Port Mac Shoalhaven Tweed Albury Ballina Lismore Tamworth Wagga
Contributions Expenditures
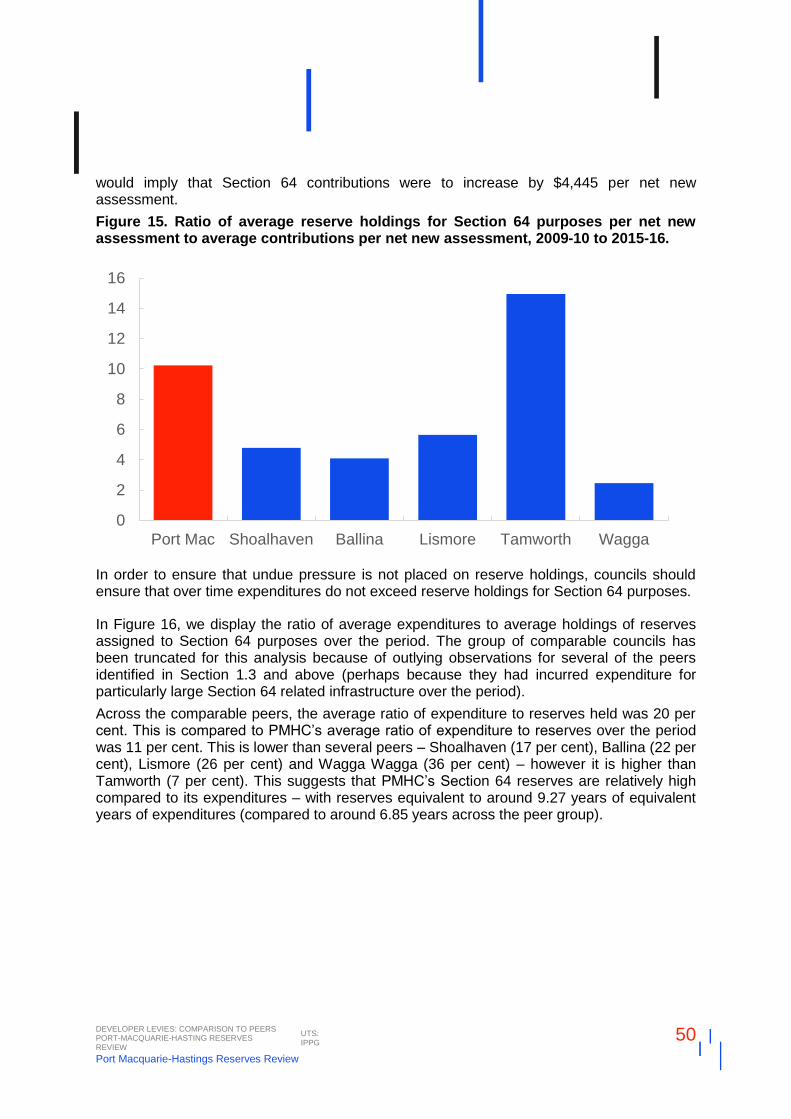
DEVELOPER LEVIES: COMPARISON TO PEERS PORT-MACQUARIE-HASTING RESERVES REVIEW
UTS: IPPG
50
Port Macquarie-Hastings Reserves Review
would imply that Section 64 contributions were to increase by $4,445 per net new assessment.
Figure 15. Ratio of average reserve holdings for Section 64 purposes per net new assessment to average contributions per net new assessment, 2009-10 to 2015-16.
In order to ensure that undue pressure is not placed on reserve holdings, councils should ensure that over time expenditures do not exceed reserve holdings for Section 64 purposes.
In Figure 16, we display the ratio of average expenditures to average holdings of reserves assigned to Section 64 purposes over the period. The group of comparable councils has been truncated for this analysis because of outlying observations for several of the peers identified in Section 1.3 and above (perhaps because they had incurred expenditure for particularly large Section 64 related infrastructure over the period).
Across the comparable peers, the average ratio of expenditure to reserves held was 20 per cent. This is compared to PMHC’s average ratio of expenditure to reserves over the period was 11 per cent. This is lower than several peers – Shoalhaven (17 per cent), Ballina (22 per cent), Lismore (26 per cent) and Wagga Wagga (36 per cent) – however it is higher than Tamworth (7 per cent). This suggests that PMHC’s Section 64 reserves are relatively high compared to its expenditures – with reserves equivalent to around 9.27 years of equivalent years of expenditures (compared to around 6.85 years across the peer group).
0
2
4
6
8
10
12
14
16
Port Mac Shoalhaven Ballina Lismore Tamworth Wagga
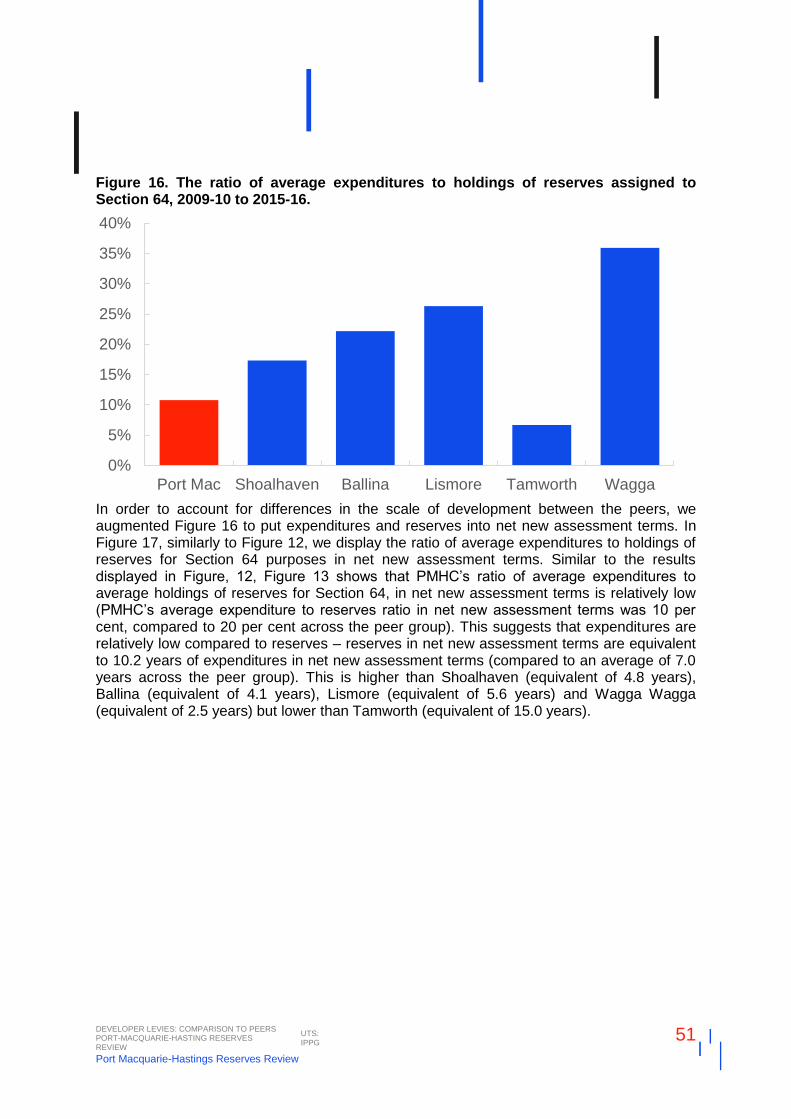
DEVELOPER LEVIES: COMPARISON TO PEERS PORT-MACQUARIE-HASTING RESERVES REVIEW
UTS: IPPG
51
Port Macquarie-Hastings Reserves Review
Figure 16. The ratio of average expenditures to holdings of reserves assigned to Section 64, 2009-10 to 2015-16.
In order to account for differences in the scale of development between the peers, we augmented Figure 16 to put expenditures and reserves into net new assessment terms. In Figure 17, similarly to Figure 12, we display the ratio of average expenditures to holdings of reserves for Section 64 purposes in net new assessment terms. Similar to the results displayed in Figure, 12, Figure 13 shows that PMHC’s ratio of average expenditures to average holdings of reserves for Section 64, in net new assessment terms is relatively low (PMHC’s average expenditure to reserves ratio in net new assessment terms was 10 per cent, compared to 20 per cent across the peer group). This suggests that expenditures are relatively low compared to reserves – reserves in net new assessment terms are equivalent to 10.2 years of expenditures in net new assessment terms (compared to an average of 7.0 years across the peer group). This is higher than Shoalhaven (equivalent of 4.8 years), Ballina (equivalent of 4.1 years), Lismore (equivalent of 5.6 years) and Wagga Wagga (equivalent of 2.5 years) but lower than Tamworth (equivalent of 15.0 years).
0%
5%
10%
15%
20%
25%
30%
35%
40%
Port Mac Shoalhaven Ballina Lismore Tamworth Wagga
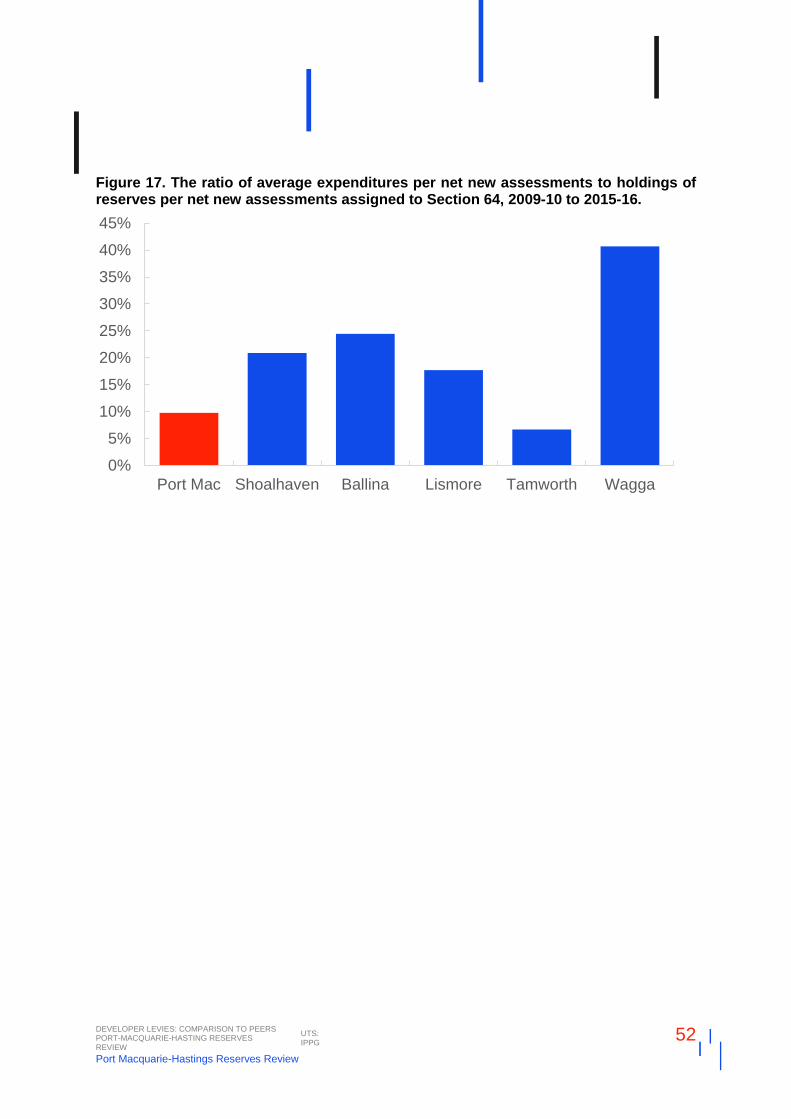
DEVELOPER LEVIES: COMPARISON TO PEERS PORT-MACQUARIE-HASTING RESERVES REVIEW
UTS: IPPG
52
Port Macquarie-Hastings Reserves Review
Figure 17. The ratio of average expenditures per net new assessments to holdings of reserves per net new assessments assigned to Section 64, 2009-10 to 2015-16.
0%
5%
10%
15%
20%
25%
30%
35%
40%
45%
Port Mac Shoalhaven Ballina Lismore Tamworth Wagga
RESERVES: RISKS, OPPORTUNITIES AND ADEQUACY PORT-MACQUARIE-HASTING RESERVES REVIEW
UTS: IPPG 53
Port Macquarie-Hastings Reserves Review
4 Reserves: Risks, Opportunities and Adequacy
The current levels of reserves (in aggregate) are higher than might be expected (relative to peers), however PMHC seems to be predicting accelerated growth rates over the medium term (relative to historical levels). This means that the expected levels of reserves will likely increase (see Section 2.2). For PMHC to ensure its reserves remain sufficient it will be necessary to exercise prudence in relation to capital expenditure, as this may draw down on the currently adequate levels of reserves. At the same time, our analysis identified a relatively close association between increased capital expenditure with increased growth in assessments (see Section 2.3). This implies that it is likely that PMHC will continue to face increasing pressure on capital expenditure to meet its expected growth, despite capital expenditures already experiencing relatively high increases in recent years (in 2014-15 and 2015-16, see Section 2.3). In short, PMHC should review its capital expenditure plans to ensure its commitments would not see its expenditures exceed the expected reserves levels that were predicted for the medium term (see Section 2.1.2).
We recognise that PMHC is under some pressure to address infrastructure backlogs, along with maintenance and renewal shortfalls7, however, it needs to be acknowledged that aggressive efforts to do so will have deleterious consequences for operating results and liquidity8 (in particular). Specifically, capitalised expenditure not only reduces available funds but also exerts additional pressure on the (bellwether) financial ratio – the operating ratio (and associated operating position). Indeed, the Resourcing Strategy 2017-2021 projects budget shortfalls for each year over the long term financial plan (LTFP, 2017-18 to 2026-27) planned case (Scenario 2; p. 14), suggesting a need for continued prudence in expending of reserves (not only because parts of the reserves will be eroded by operating deficits, but also because any capital expenditure will further exacerbate projected deficits).
We also bring to PMHC’s attention that recent efforts in relation to depreciation ‘improvements …. made to better record useful lives and depreciation of assets…resulting in savings to depreciation of approximately $3.4m between 2013-14 and 2014-15’ (Resourcing Strategy 2017-2021, p. 25) do potentially pose downside future financial risks. That is, ‘extending the useful life of an asset to decrease depreciation expense, decreases income at some future date, either through extended depreciation or a smaller gain on disposal’ (Marquardt and Wiedman, 2004, p. 469). Therefore, efforts of late to adjust depreciation schedules (which may be both prudent and justifiable) will have an effect on the outer years (and beyond) thus suggesting, once again, the need for heightened prudence with respect to spending of reserves.
We suggest that there may be some opportunity to utilise debt in bringing forward infrastructure spending. This is because PMHC may have capacity to take on additional debt when measured against the Debt Service Cover ratio (see, Resourcing Strategy 2017-2021,
7 The Resourcing Strategy 2017-2021 (pp. 19-20) notes that Council will not meet the infrastructure backlog ratio ‘in any year covered by the LTFP [long term financial plan]; that for the asset maintenance ratio ‘it is unlikely that the benchmark …will be reached unless additional revenue is injected’; and that for the buildings and infrastructure ratio ‘it is difficult for Council to meet as Council is in a growth area that requires both new and renewal expenditure’. 8 The Resourcing Strategy 2017-201 (pp. 15-16) notes that for the Operating Performance ratio under the planned case ‘Council does not achieve its goal of meeting or being close to meeting this ratio until 2025-26’; and that for the Unrestricted Current Ratio ‘this ratio is met in 2017-18…it is not met again until 2023-24’.
RESERVES: RISKS, OPPORTUNITIES AND ADEQUACY PORT-MACQUARIE-HASTING RESERVES REVIEW
UTS: IPPG 54
Port Macquarie-Hastings Reserves Review
p. 17) however there are a number of caveats. First, there is a good deal of evidence to suggest that debt ratios (such as the ratio cited) are inadequate measures of debt capacity (to measure capacity adequately econometric analysis which includes all relevant regressors must be conducted – see, for example, Levine et al. (2013) or Hildreth and Miller (2002)). Second, a commonly cited argument in favour of debt – that of intergenerational equity – conveniently ignores the fact that the current generation of ratepayers received assets largely without encumbrance (Drew and Grant, 2017). Third, if debt is taken on to bring forward infrastructure spending then this will also necessarily bring forward additional depreciation expenditure. Fourth, the debt, of course, must be repaid, thus essentially constraining future cash flows. In sum, debt is far from a ‘silver bullet’ solution to Council’s infrastructure challenges and may, in fact, give rise to even more difficulties into the future.
Among our other observations with respect to PMHC’s general financial health, we note PMHC’s efforts to pursue a user pays focus on non-public goods and services (which as we demonstrate not only increases revenue but may dampen demand), efforts to review service levels, attention to rationalising assets and attempts at constraining growth in full time equivalent staff. We would also suggest that council reviews the level of subsidium provided for merit goods (reducing same where possible, notifying donors and recipients of the level provided to send an adequate price signal, and giving serious consideration to introducing variable levels of subsidium according to need). These matters do affect reserve balances over time, but are also part of wider efforts to enhance financial sustainability (which might be a subject of a future review for Council).
Finally, as part of this report, we have examined whether opportunities exist for increasing developer levies (in particular). Our analysis in Section 3 would suggest few opportunities for doing so, given that total levies are consistent (if not higher) than peers, though we offer some suggestions in this regard for PMHC’s review. Nonetheless, a regular review of levies are an essential tool for PMHC to ensure adequate funds for future needs – however, PMHC should be mindful that it may struggle to justify upward movements should it be challenged by developers.
RESERVES: RISKS, OPPORTUNITIES AND ADEQUACY PORT-MACQUARIE-HASTING RESERVES REVIEW
UTS: IPPG 55
Port Macquarie-Hastings Reserves Review
Appendix A: References
Australian Bureau of Statistics (ABS). (2017). Data by Region. ABS: Canberra.
Drew, J., and Dollery, B. (2014). Estimating The Impact of the Proposed Greater Sydney Metropolitan Amalgamations on Municipal Financial Sustainability. Public Money & Management, 34(4), 281-288.
Drew, J. and Dollery, B. (2015) How High Should They Jump? An Empirical Method for Setting Municipal Financial Ratio Performance Benchmarks. Australian Journal of Public Administration, 75(1): 53-64.
Drew, J. and Grant, B. (2017). ‘Introduction to Australian Local Government Economics and Finance’ in Local Government in Australia: History, Theory and Public Policy. Springer Palgrave, Singapore.
Drew, J., Kortt, M. and Dollery, B. (2015). No Aladdin’s Cave in New South Wales? Local Government Amalgamation, Scale Economies and Data Envelopment Specification. Administration & Society, DOI: 10.1177/0095399715581045.
Drew J, Kortt MA, Dollery B (2014). Economies of scale and local government expenditure: Evidence from Australia. Administration & Society, 46(6): 632-653.
Drew, J., Kortt, M. and B. Dollery. (2016). Did the Big Stick Work? An Empirical Assessment of Scale Economies and the Queensland Forced Amalgamation Program, Local Government Studies, 42(1): 1-15.
Fahey, G., Drew, J. and Dollery, B. (2016). Merger Myths: A Functional Analysis of Economies of Scale in New South Wales Municipalities. Public Finance and Management.
Hildreth, W. and Miller, G. (2002). Debt and Local Economy: Problems in Benchmarking Local Government Debt Affordability. Public Budgeting & Finance, Winter 2002.
Levine, H., Justice, J. and Scorsone, E. (2013). Handbook of Local Government Fiscal Health. Jones & Bartlett Learning: Burlington MA.
Marquardt, C. and Wiedman, C. (2004), How Are Earnings managed? An Examination of Specific Accruals. Contemporary Accounting Research, 21, 2, pp. 461-491.
Office of Local Govrenment. (2017). Time Series Data. Available at: https://www.olg.nsw.gov.au/public/my-local-council/yourcouncil-website
Port Macquarie-Hastings Council (2017). Resourcing Strategy 2017-2021. Port Macquarie-Hastings Council.