Embed Size (px)
Citation preview
Pillar 3 Disclosures Quarter ended 28 February 2018
APRA Basel III
17 April 2018This report has been prepared by Bank of Queensland Limited (Bank or BOQ) to meet its disclosure requirements under the Australian Prudential Regulation Authority’s (APRA) Prudential Standard APS 330: Public Disclosure. It has been prepared using 28 February 2018 data.
Key pointsThe Bank’s capital management strategy aims to ensure adequate capital levels are maintained to protect deposit holders. The Bank’s capital is measured and managed in line with Prudential Standards issued by APRA. The capital management plan is updated annually and submitted to the Board for approval. The approval process is designed to ensure the plan is consistent with the overall business plan and for managing capital levels on an ongoing basis.
The Board has set the Common Equity Tier 1 Capital target range to be between 8.0% and 9.5% and the Total Capital range to be between 11.5% and 14.5%.
As at 28 February 2018:
• Common Equity Tier 1 Capital Ratio was 9.4% (9.0% as at 30 November 2017); and
• Total Capital Ratio was 12.8% (12.0% as at 30 November 2017).
Contents
Capital Structure 3
Table 1: Capital Disclosure Template 4
Reconciliation between the Consolidated Balance Sheet and the Regulatory Balance Sheet 8
Entities excluded from the Regulatory Scope of Consolidation 10
Table 2: Main Features of Capital Instruments 11
Table 3: Capital Adequacy 12
Table 4: Credit Risk 13
Table 5: Securitisation Exposures 15
Table 20: Liquidity Coverage Ratio 16
Bank of Queensland Limited, Basel III Pillar 3 Disclosures
Bank of Queensland Limited and its Controlled Entities2
For the Quarter Ended 28 February 2018
ABN 32 009 656 740 AFSL No. 244616
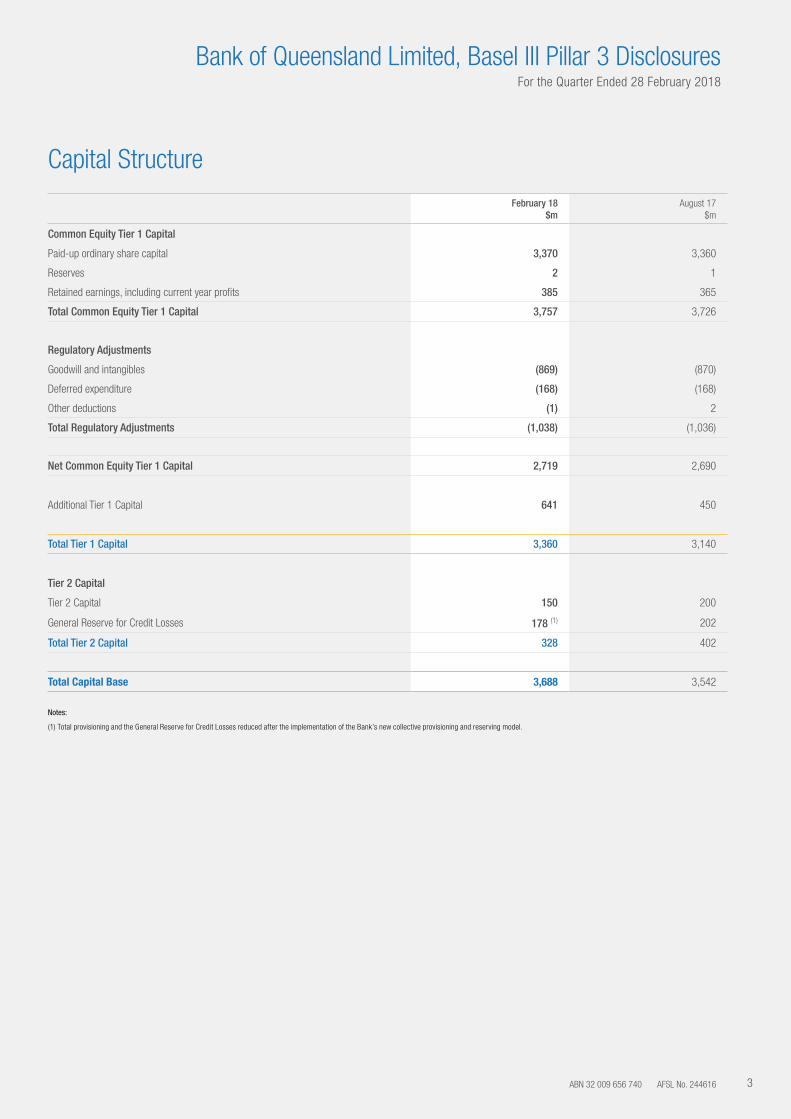
Capital Structure
February 18$m
August 17$m
Common Equity Tier 1 Capital
Paid-up ordinary share capital 3,370 3,360
Reserves 2 1
Retained earnings, including current year profits 385 365
Total Common Equity Tier 1 Capital 3,757 3,726
Regulatory Adjustments
Goodwill and intangibles (869) (870)
Deferred expenditure (168) (168)
Other deductions (1) 2
Total Regulatory Adjustments (1,038) (1,036)
Net Common Equity Tier 1 Capital 2,719 2,690
Additional Tier 1 Capital 641 450
Total Tier 1 Capital 3,360 3,140
Tier 2 Capital
Tier 2 Capital 150 200
General Reserve for Credit Losses 178 (1) 202
Total Tier 2 Capital 328 402
Total Capital Base 3,688 3,542
Notes:
(1) Total provisioning and the General Reserve for Credit Losses reduced after the implementation of the Bank’s new collective provisioning and reserving model.
Bank of Queensland Limited, Basel III Pillar 3 Disclosures
3
For the Quarter Ended 28 February 2018
Bank of Queensland Limited, Basel III Pillar 3 Disclosures
Bank of Queensland Limited and its Controlled Entities4
For the Quarter Ended 28 February 2018
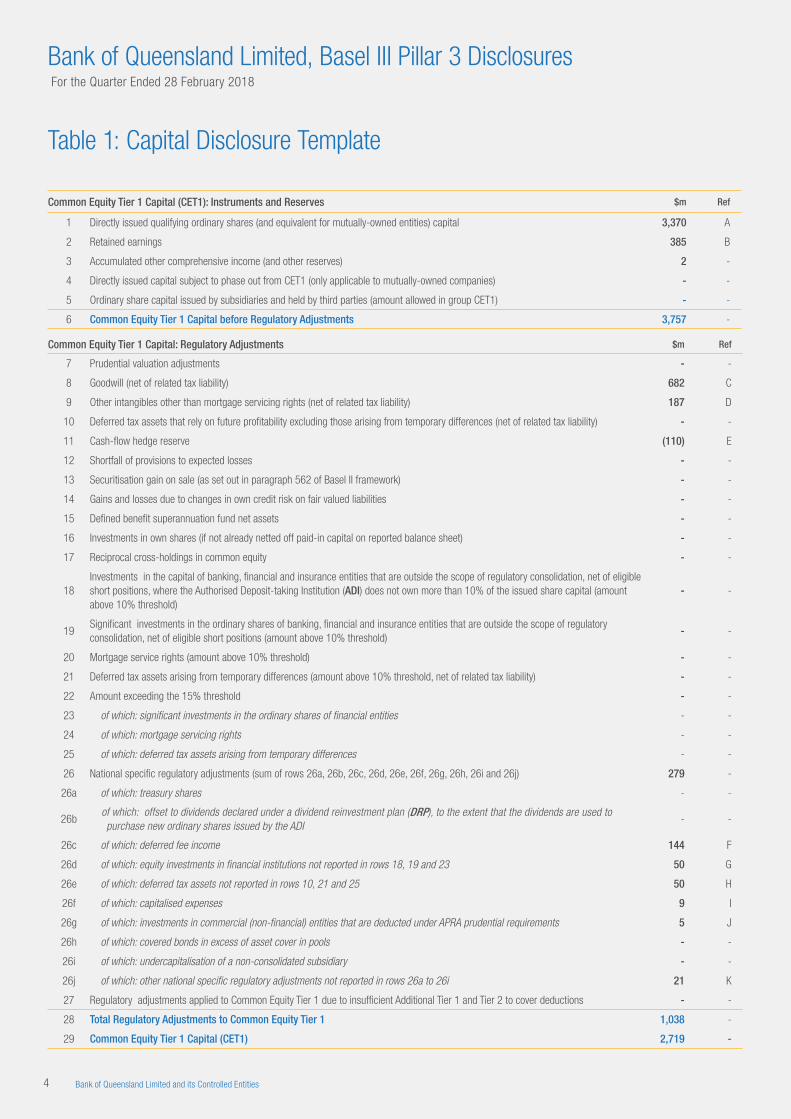
Table 1: Capital Disclosure Template
Common Equity Tier 1 Capital (CET1): Instruments and Reserves $m Ref
1 Directly issued qualifying ordinary shares (and equivalent for mutually-owned entities) capital 3,370 A
2 Retained earnings 385 B
3 Accumulated other comprehensive income (and other reserves) 2 -
4 Directly issued capital subject to phase out from CET1 (only applicable to mutually-owned companies) - -
5 Ordinary share capital issued by subsidiaries and held by third parties (amount allowed in group CET1) - -
6 Common Equity Tier 1 Capital before Regulatory Adjustments 3,757 -
Common Equity Tier 1 Capital: Regulatory Adjustments $m Ref
7 Prudential valuation adjustments - -
8 Goodwill (net of related tax liability) 682 C
9 Other intangibles other than mortgage servicing rights (net of related tax liability) 187 D
10 Deferred tax assets that rely on future profitability excluding those arising from temporary differences (net of related tax liability) - -
11 Cash-flow hedge reserve (110) E
12 Shortfall of provisions to expected losses - -
13 Securitisation gain on sale (as set out in paragraph 562 of Basel II framework) - -
14 Gains and losses due to changes in own credit risk on fair valued liabilities - -
15 Defined benefit superannuation fund net assets - -
16 Investments in own shares (if not already netted off paid-in capital on reported balance sheet) - -
17 Reciprocal cross-holdings in common equity - -
18Investments in the capital of banking, financial and insurance entities that are outside the scope of regulatory consolidation, net of eligible short positions, where the Authorised Deposit-taking Institution (ADI) does not own more than 10% of the issued share capital (amount above 10% threshold)
- -
19Significant investments in the ordinary shares of banking, financial and insurance entities that are outside the scope of regulatory consolidation, net of eligible short positions (amount above 10% threshold)
- -
20 Mortgage service rights (amount above 10% threshold) - -
21 Deferred tax assets arising from temporary differences (amount above 10% threshold, net of related tax liability) - -
22 Amount exceeding the 15% threshold - -
23 of which: significant investments in the ordinary shares of financial entities - -
24 of which: mortgage servicing rights - -
25 of which: deferred tax assets arising from temporary differences - -
26 National specific regulatory adjustments (sum of rows 26a, 26b, 26c, 26d, 26e, 26f, 26g, 26h, 26i and 26j) 279 -
26a of which: treasury shares - -
26b of which: offset to dividends declared under a dividend reinvestment plan (DRP), to the extent that the dividends are used to
purchase new ordinary shares issued by the ADI- -
26c of which: deferred fee income 144 F
26d of which: equity investments in financial institutions not reported in rows 18, 19 and 23 50 G
26e of which: deferred tax assets not reported in rows 10, 21 and 25 50 H
26f of which: capitalised expenses 9 I
26g of which: investments in commercial (non-financial) entities that are deducted under APRA prudential requirements 5 J
26h of which: covered bonds in excess of asset cover in pools - -
26i of which: undercapitalisation of a non-consolidated subsidiary - -
26j of which: other national specific regulatory adjustments not reported in rows 26a to 26i 21 K
27 Regulatory adjustments applied to Common Equity Tier 1 due to insufficient Additional Tier 1 and Tier 2 to cover deductions - -
28 Total Regulatory Adjustments to Common Equity Tier 1 1,038 -
29 Common Equity Tier 1 Capital (CET1) 2,719 -
ABN 32 009 656 740 AFSL No. 244616
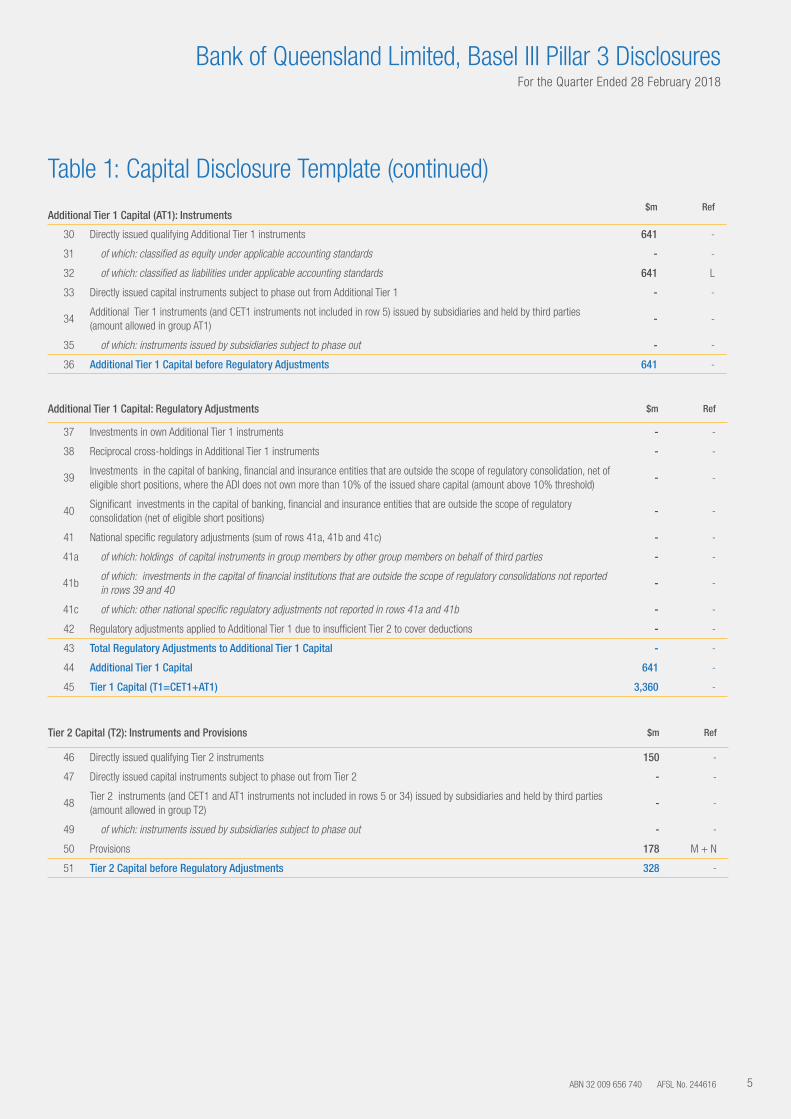
Table 1: Capital Disclosure Template (continued)
Additional Tier 1 Capital (AT1): Instruments$m Ref
30 Directly issued qualifying Additional Tier 1 instruments 641 -
31 of which: classified as equity under applicable accounting standards - -
32 of which: classified as liabilities under applicable accounting standards 641 L
33 Directly issued capital instruments subject to phase out from Additional Tier 1 - -
34Additional Tier 1 instruments (and CET1 instruments not included in row 5) issued by subsidiaries and held by third parties (amount allowed in group AT1)
- -
35 of which: instruments issued by subsidiaries subject to phase out - -
36 Additional Tier 1 Capital before Regulatory Adjustments 641 -
Additional Tier 1 Capital: Regulatory Adjustments $m Ref
37 Investments in own Additional Tier 1 instruments - -
38 Reciprocal cross-holdings in Additional Tier 1 instruments - -
39Investments in the capital of banking, financial and insurance entities that are outside the scope of regulatory consolidation, net of eligible short positions, where the ADI does not own more than 10% of the issued share capital (amount above 10% threshold)
- -
40Significant investments in the capital of banking, financial and insurance entities that are outside the scope of regulatory consolidation (net of eligible short positions)
- -
41 National specific regulatory adjustments (sum of rows 41a, 41b and 41c) - -
41a of which: holdings of capital instruments in group members by other group members on behalf of third parties - -
41b of which: investments in the capital of financial institutions that are outside the scope of regulatory consolidations not reported in rows 39 and 40
- -
41c of which: other national specific regulatory adjustments not reported in rows 41a and 41b - -
42 Regulatory adjustments applied to Additional Tier 1 due to insufficient Tier 2 to cover deductions - -
43 Total Regulatory Adjustments to Additional Tier 1 Capital - -
44 Additional Tier 1 Capital 641 -
45 Tier 1 Capital (T1=CET1+AT1) 3,360 -
Tier 2 Capital (T2): Instruments and Provisions $m Ref
46 Directly issued qualifying Tier 2 instruments 150 -
47 Directly issued capital instruments subject to phase out from Tier 2 - -
48Tier 2 instruments (and CET1 and AT1 instruments not included in rows 5 or 34) issued by subsidiaries and held by third parties (amount allowed in group T2)
- -
49 of which: instruments issued by subsidiaries subject to phase out - -
50 Provisions 178 M + N
51 Tier 2 Capital before Regulatory Adjustments 328 -
Bank of Queensland Limited, Basel III Pillar 3 Disclosures
5
For the Quarter Ended 28 February 2018
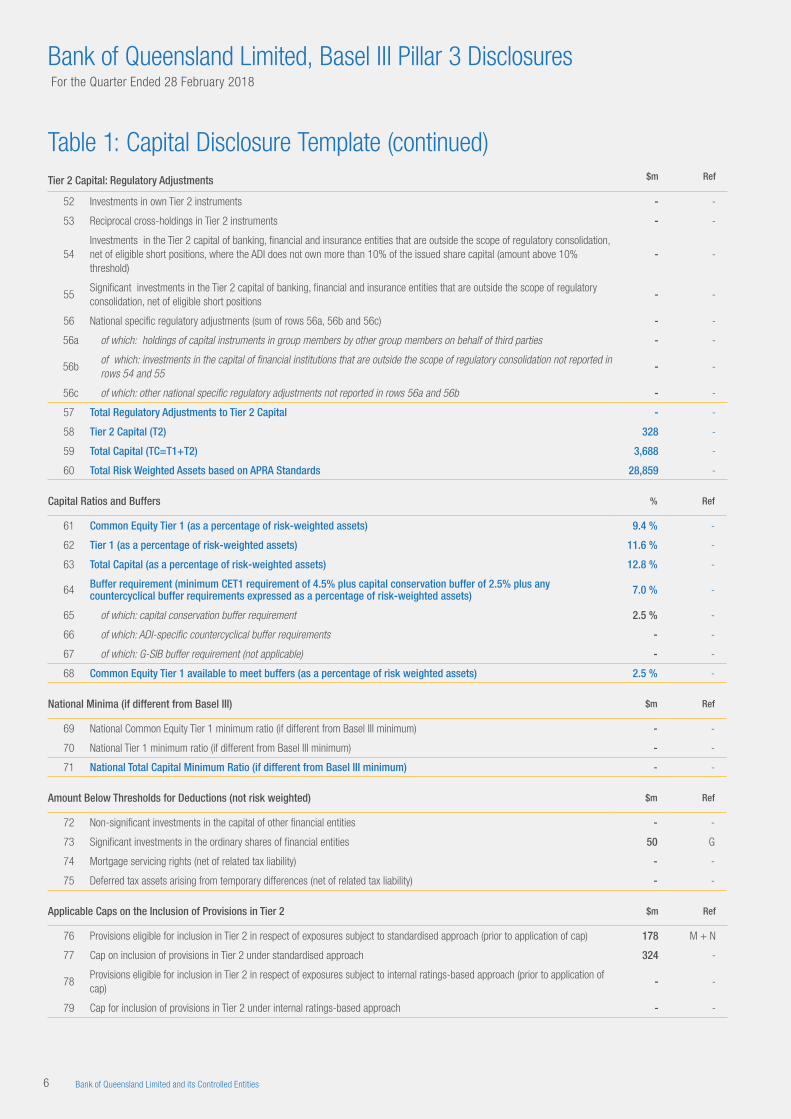
Table 1: Capital Disclosure Template (continued)Tier 2 Capital: Regulatory Adjustments $m Ref
52 Investments in own Tier 2 instruments - -
53 Reciprocal cross-holdings in Tier 2 instruments - -
54Investments in the Tier 2 capital of banking, financial and insurance entities that are outside the scope of regulatory consolidation, net of eligible short positions, where the ADI does not own more than 10% of the issued share capital (amount above 10% threshold)
- -
55Significant investments in the Tier 2 capital of banking, financial and insurance entities that are outside the scope of regulatory consolidation, net of eligible short positions
- -
56 National specific regulatory adjustments (sum of rows 56a, 56b and 56c) - -
56a of which: holdings of capital instruments in group members by other group members on behalf of third parties - -
56b of which: investments in the capital of financial institutions that are outside the scope of regulatory consolidation not reported in rows 54 and 55
- -
56c of which: other national specific regulatory adjustments not reported in rows 56a and 56b - -
57 Total Regulatory Adjustments to Tier 2 Capital - -
58 Tier 2 Capital (T2) 328 -
59 Total Capital (TC=T1+T2) 3,688 -
60 Total Risk Weighted Assets based on APRA Standards 28,859 -
Capital Ratios and Buffers % Ref
61 Common Equity Tier 1 (as a percentage of risk-weighted assets) 9.4 % -
62 Tier 1 (as a percentage of risk-weighted assets) 11.6 % -
63 Total Capital (as a percentage of risk-weighted assets) 12.8 % -
64 Buffer requirement (minimum CET1 requirement of 4.5% plus capital conservation buffer of 2.5% plus any countercyclical buffer requirements expressed as a percentage of risk-weighted assets) 7.0 % -
65 of which: capital conservation buffer requirement 2.5 % -
66 of which: ADI-specific countercyclical buffer requirements - -
67 of which: G-SIB buffer requirement (not applicable) - -
68 Common Equity Tier 1 available to meet buffers (as a percentage of risk weighted assets) 2.5 % -
National Minima (if different from Basel III) $m Ref
69 National Common Equity Tier 1 minimum ratio (if different from Basel III minimum) - -
70 National Tier 1 minimum ratio (if different from Basel III minimum) - -
71 National Total Capital Minimum Ratio (if different from Basel III minimum) - -
Amount Below Thresholds for Deductions (not risk weighted) $m Ref
72 Non-significant investments in the capital of other financial entities - -
73 Significant investments in the ordinary shares of financial entities 50 G
74 Mortgage servicing rights (net of related tax liability) - -
75 Deferred tax assets arising from temporary differences (net of related tax liability) - -
Applicable Caps on the Inclusion of Provisions in Tier 2 $m Ref
76 Provisions eligible for inclusion in Tier 2 in respect of exposures subject to standardised approach (prior to application of cap) 178 M + N
77 Cap on inclusion of provisions in Tier 2 under standardised approach 324 -
78Provisions eligible for inclusion in Tier 2 in respect of exposures subject to internal ratings-based approach (prior to application of cap)
- -
79 Cap for inclusion of provisions in Tier 2 under internal ratings-based approach - -
Bank of Queensland Limited, Basel III Pillar 3 Disclosures
Bank of Queensland Limited and its Controlled Entities6
For the Quarter Ended 28 February 2018
ABN 32 009 656 740 AFSL No. 244616
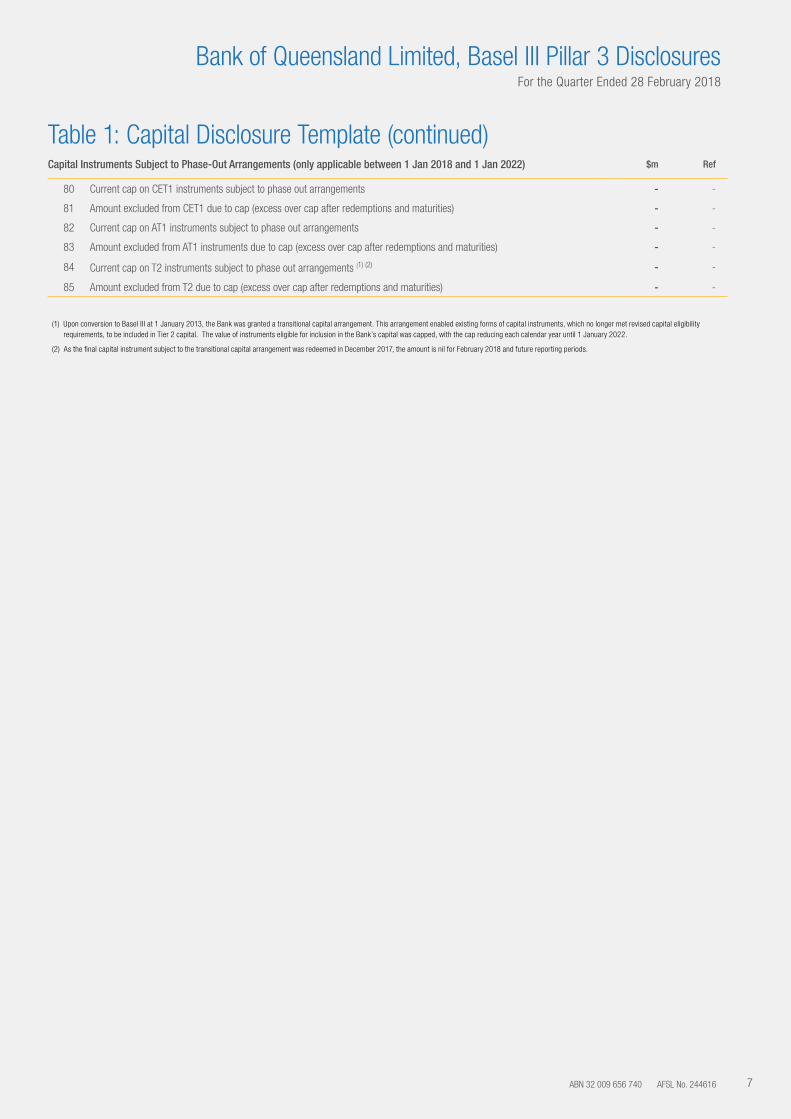
Table 1: Capital Disclosure Template (continued)Capital Instruments Subject to Phase-Out Arrangements (only applicable between 1 Jan 2018 and 1 Jan 2022) $m Ref
80 Current cap on CET1 instruments subject to phase out arrangements - -
81 Amount excluded from CET1 due to cap (excess over cap after redemptions and maturities) - -
82 Current cap on AT1 instruments subject to phase out arrangements - -
83 Amount excluded from AT1 instruments due to cap (excess over cap after redemptions and maturities) - -
84 Current cap on T2 instruments subject to phase out arrangements (1) (2) - -
85 Amount excluded from T2 due to cap (excess over cap after redemptions and maturities) - -
(1) Upon conversion to Basel III at 1 January 2013, the Bank was granted a transitional capital arrangement. This arrangement enabled existing forms of capital instruments, which no longer met revised capital eligibility requirements, to be included in Tier 2 capital. The value of instruments eligible for inclusion in the Bank’s capital was capped, with the cap reducing each calendar year until 1 January 2022.
(2) As the final capital instrument subject to the transitional capital arrangement was redeemed in December 2017, the amount is nil for February 2018 and future reporting periods.
Bank of Queensland Limited, Basel III Pillar 3 Disclosures
7
For the Quarter Ended 28 February 2018
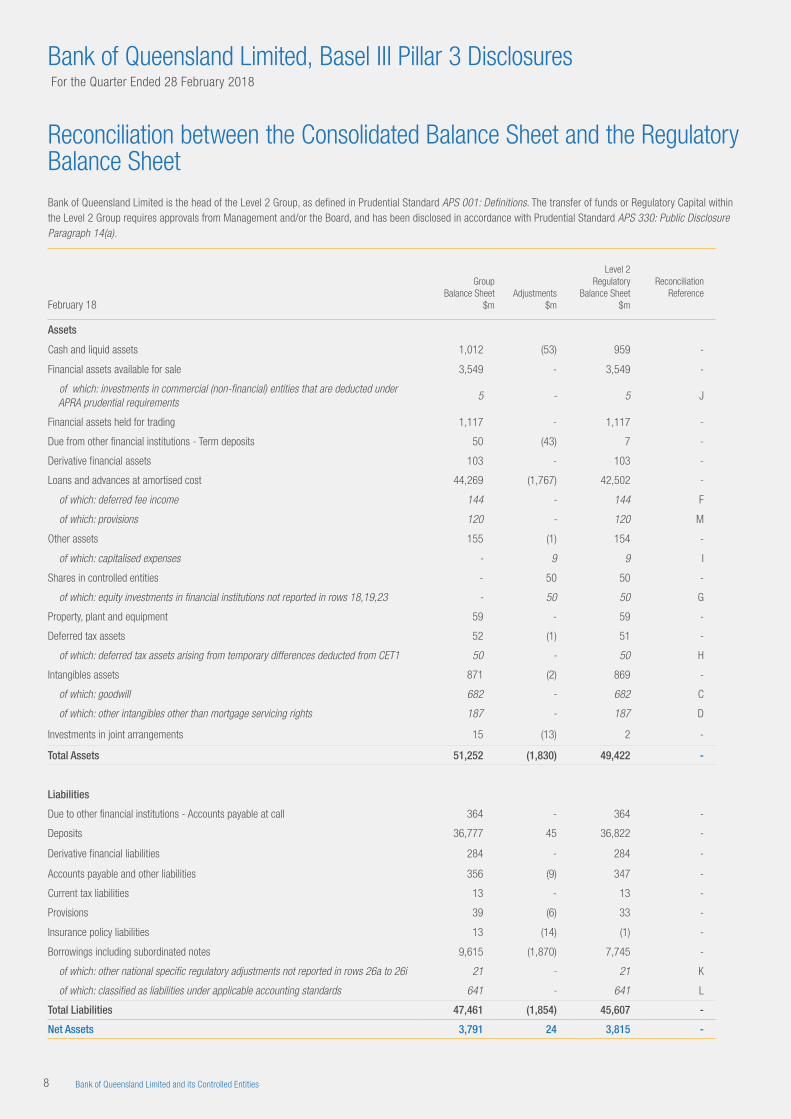
Reconciliation between the Consolidated Balance Sheet and the Regulatory Balance SheetBank of Queensland Limited is the head of the Level 2 Group, as defined in Prudential Standard APS 001: Definitions. The transfer of funds or Regulatory Capital within the Level 2 Group requires approvals from Management and/or the Board, and has been disclosed in accordance with Prudential Standard APS 330: Public Disclosure Paragraph 14(a).
February 18
Group Balance Sheet
$mAdjustments
$m
Level 2 Regulatory
Balance Sheet$m
Reconciliation Reference
Assets
Cash and liquid assets 1,012 (53) 959 -
Financial assets available for sale 3,549 - 3,549 -
of which: investments in commercial (non-financial) entities that are deducted under APRA prudential requirements
5 - 5 J
Financial assets held for trading 1,117 - 1,117 -
Due from other financial institutions - Term deposits 50 (43) 7 -
Derivative financial assets 103 - 103 -
Loans and advances at amortised cost 44,269 (1,767) 42,502 -
of which: deferred fee income 144 - 144 F
of which: provisions 120 - 120 M
Other assets 155 (1) 154 -
of which: capitalised expenses - 9 9 I
Shares in controlled entities - 50 50 -
of which: equity investments in financial institutions not reported in rows 18,19,23 - 50 50 G
Property, plant and equipment 59 - 59 -
Deferred tax assets 52 (1) 51 -
of which: deferred tax assets arising from temporary differences deducted from CET1 50 - 50 H
Intangibles assets 871 (2) 869 -
of which: goodwill 682 - 682 C
of which: other intangibles other than mortgage servicing rights 187 - 187 D
Investments in joint arrangements 15 (13) 2 -
Total Assets 51,252 (1,830) 49,422 -
Liabilities
Due to other financial institutions - Accounts payable at call 364 - 364 -
Deposits 36,777 45 36,822 -
Derivative financial liabilities 284 - 284 -
Accounts payable and other liabilities 356 (9) 347 -
Current tax liabilities 13 - 13 -
Provisions 39 (6) 33 -
Insurance policy liabilities 13 (14) (1) -
Borrowings including subordinated notes 9,615 (1,870) 7,745 -
of which: other national specific regulatory adjustments not reported in rows 26a to 26i 21 - 21 K
of which: classified as liabilities under applicable accounting standards 641 - 641 L
Total Liabilities 47,461 (1,854) 45,607 -
Net Assets 3,791 24 3,815 -
Bank of Queensland Limited, Basel III Pillar 3 Disclosures
Bank of Queensland Limited and its Controlled Entities8
For the Quarter Ended 28 February 2018
ABN 32 009 656 740 AFSL No. 244616
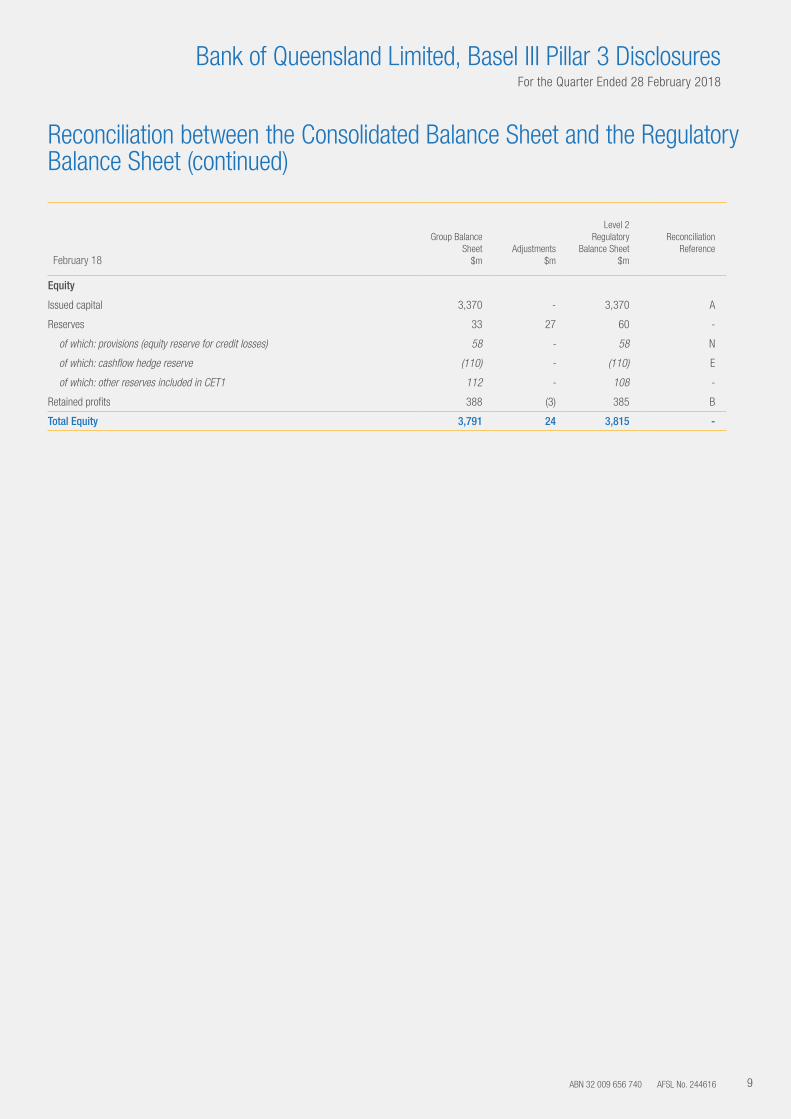
Reconciliation between the Consolidated Balance Sheet and the Regulatory Balance Sheet (continued)
February 18
Group Balance Sheet
$mAdjustments
$m
Level 2 Regulatory
Balance Sheet$m
Reconciliation Reference
Equity
Issued capital 3,370 - 3,370 A
Reserves 33 27 60 -
of which: provisions (equity reserve for credit losses) 58 - 58 N
of which: cashflow hedge reserve (110) - (110) E
of which: other reserves included in CET1 112 - 108 -
Retained profits 388 (3) 385 B
Total Equity 3,791 24 3,815 -
Bank of Queensland Limited, Basel III Pillar 3 Disclosures
9
For the Quarter Ended 28 February 2018
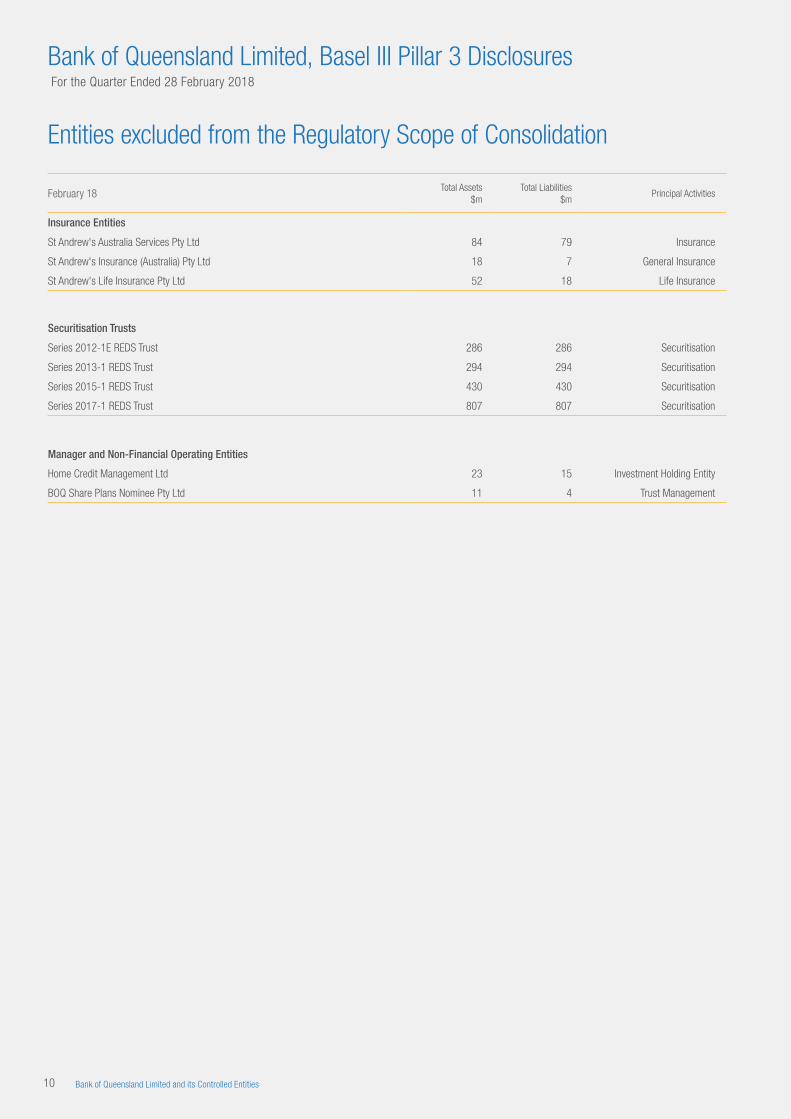
Entities excluded from the Regulatory Scope of Consolidation
February 18Total Assets
$mTotal Liabilities
$mPrincipal Activities
Insurance Entities
St Andrew's Australia Services Pty Ltd 84 79 Insurance
St Andrew's Insurance (Australia) Pty Ltd 18 7 General Insurance
St Andrew's Life Insurance Pty Ltd 52 18 Life Insurance
Securitisation Trusts
Series 2012-1E REDS Trust 286 286 Securitisation
Series 2013-1 REDS Trust 294 294 Securitisation
Series 2015-1 REDS Trust 430 430 Securitisation
Series 2017-1 REDS Trust 807 807 Securitisation
Manager and Non-Financial Operating Entities
Home Credit Management Ltd 23 15 Investment Holding Entity
BOQ Share Plans Nominee Pty Ltd 11 4 Trust Management
Bank of Queensland Limited, Basel III Pillar 3 Disclosures
Bank of Queensland Limited and its Controlled Entities10
For the Quarter Ended 28 February 2018
ABN 32 009 656 740 AFSL No. 244616
Table 2: Main Features of Capital InstrumentsThe bank’s main features of capital instruments are updated on an ongoing basis and are available at the Regulatory Disclosures section of the Bank’s website at the following address http://www.boq.com.au/regulatory_disclosures.htm
Bank of Queensland Limited, Basel III Pillar 3 Disclosures
11
For the Quarter Ended 28 February 2018
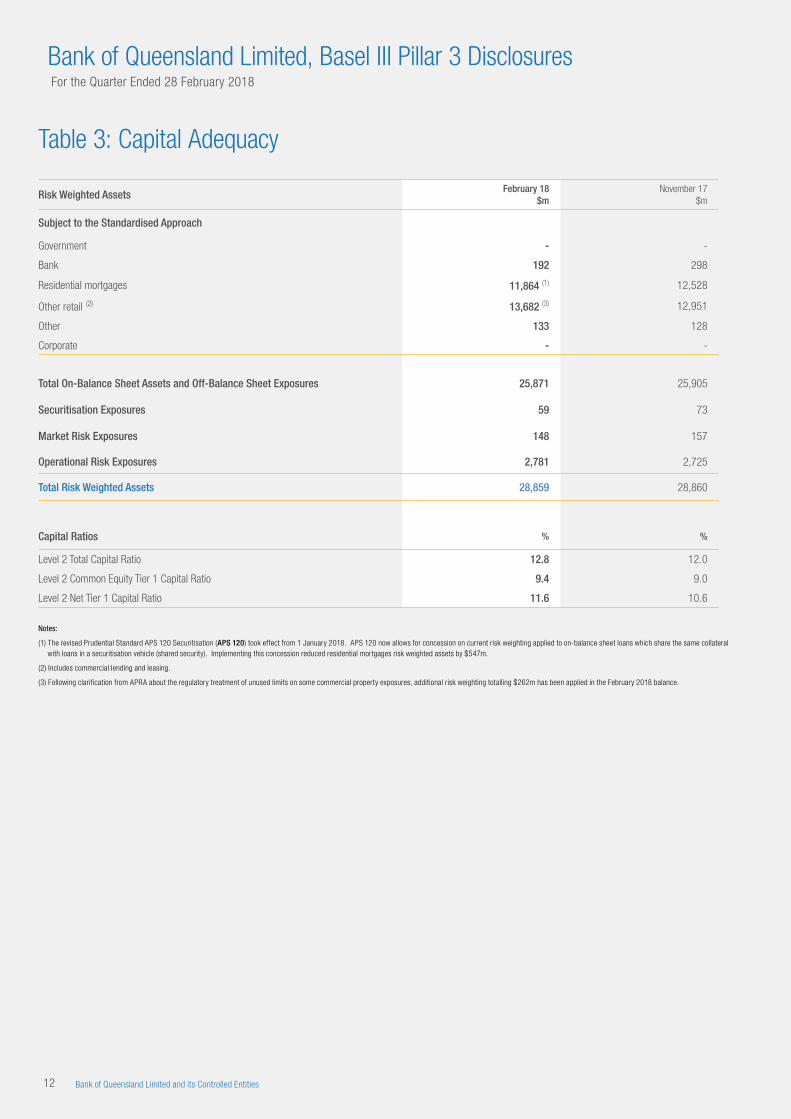
Table 3: Capital Adequacy
Risk Weighted Assets February 18$m
November 17$m
Subject to the Standardised Approach
Government - -
Bank 192 298
Residential mortgages 11,864 (1) 12,528
Other retail (2) 13,682 (3) 12,951
Other 133 128
Corporate - -
Total On-Balance Sheet Assets and Off-Balance Sheet Exposures 25,871 25,905
Securitisation Exposures 59 73
Market Risk Exposures 148 157
Operational Risk Exposures 2,781 2,725
Total Risk Weighted Assets 28,859 28,860
Capital Ratios % %
Level 2 Total Capital Ratio 12.8 12.0
Level 2 Common Equity Tier 1 Capital Ratio 9.4 9.0
Level 2 Net Tier 1 Capital Ratio 11.6 10.6
Notes:
(1) The revised Prudential Standard APS 120 Securitisation (APS 120) took effect from 1 January 2018. APS 120 now allows for concession on current risk weighting applied to on-balance sheet loans which share the same collateral with loans in a securitisation vehicle (shared security). Implementing this concession reduced residential mortgages risk weighted assets by $547m.
(2) Includes commercial lending and leasing.
(3) Following clarification from APRA about the regulatory treatment of unused limits on some commercial property exposures, additional risk weighting totalling $262m has been applied in the February 2018 balance.
Bank of Queensland Limited, Basel III Pillar 3 Disclosures
Bank of Queensland Limited and its Controlled Entities12
For the Quarter Ended 28 February 2018
ABN 32 009 656 740 AFSL No. 244616
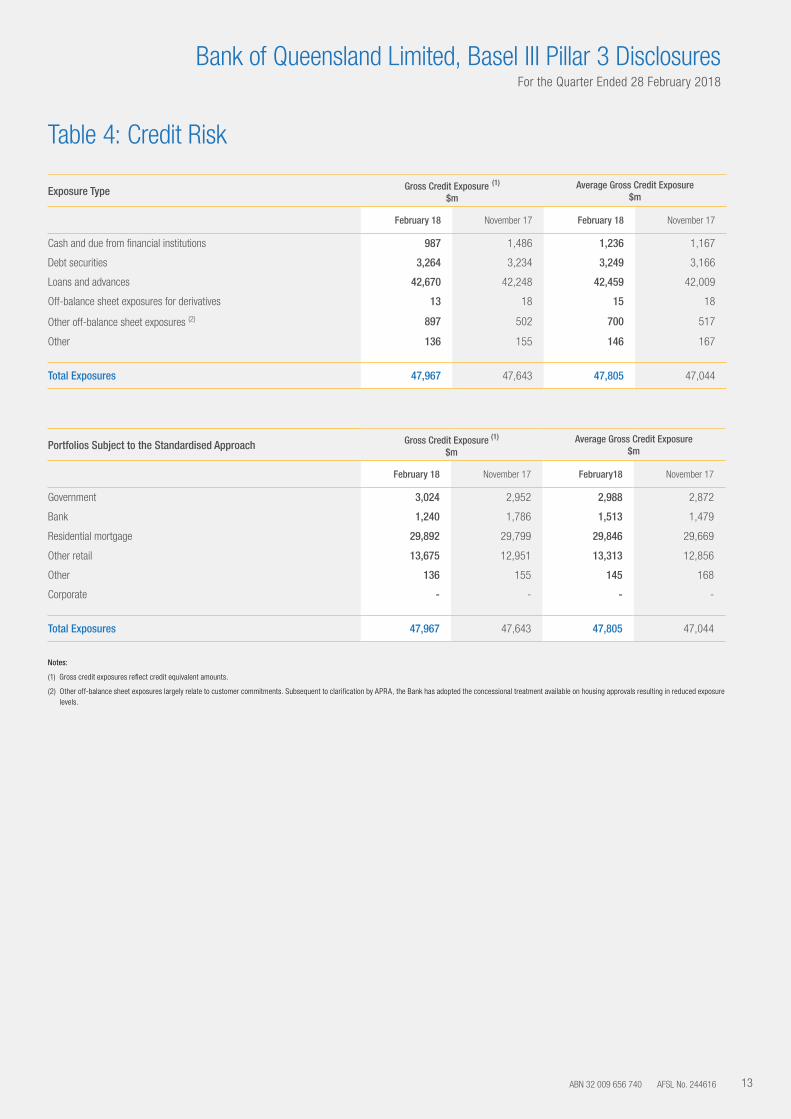
Table 4: Credit Risk
Exposure Type Gross Credit Exposure (1) $m
Average Gross Credit Exposure$m
February 18 November 17 February 18 November 17
Cash and due from financial institutions 987 1,486 1,236 1,167
Debt securities 3,264 3,234 3,249 3,166
Loans and advances 42,670 42,248 42,459 42,009
Off-balance sheet exposures for derivatives 13 18 15 18
Other off-balance sheet exposures (2) 897 502 700 517
Other 136 155 146 167
Total Exposures 47,967 47,643 47,805 47,044
Portfolios Subject to the Standardised Approach Gross Credit Exposure (1) $m
Average Gross Credit Exposure$m
February 18 November 17 February18 November 17
Government 3,024 2,952 2,988 2,872
Bank 1,240 1,786 1,513 1,479
Residential mortgage 29,892 29,799 29,846 29,669
Other retail 13,675 12,951 13,313 12,856
Other 136 155 145 168
Corporate - - - -
Total Exposures 47,967 47,643 47,805 47,044
Notes:
(1) Gross credit exposures reflect credit equivalent amounts.
(2) Other off-balance sheet exposures largely relate to customer commitments. Subsequent to clarification by APRA, the Bank has adopted the concessional treatment available on housing approvals resulting in reduced exposure levels.
Bank of Queensland Limited, Basel III Pillar 3 Disclosures
13
For the Quarter Ended 28 February 2018
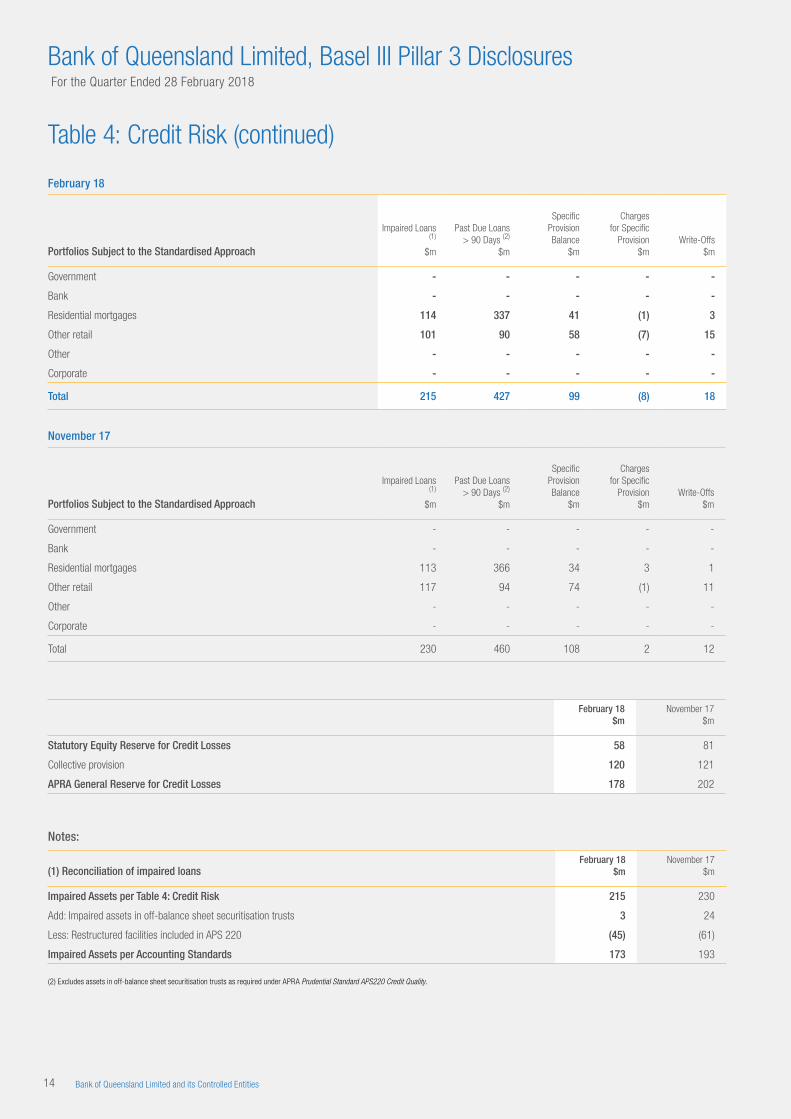
Table 4: Credit Risk (continued)
February 18
Portfolios Subject to the Standardised Approach
Impaired Loans (1)
$m
Past Due Loans > 90 Days (2)
$m
Specific Provision Balance
$m
Charges for Specific
Provision$m
Write-Offs$m
Government - - - - -
Bank - - - - -
Residential mortgages 114 337 41 (1) 3
Other retail 101 90 58 (7) 15
Other - - - - -
Corporate - - - - -
Total 215 427 99 (8) 18
November 17
Portfolios Subject to the Standardised Approach
Impaired Loans (1)
$m
Past Due Loans > 90 Days (2)
$m
Specific Provision Balance
$m
Charges for Specific
Provision$m
Write-Offs$m
Government - - - - -
Bank - - - - -
Residential mortgages 113 366 34 3 1
Other retail 117 94 74 (1) 11
Other - - - - -
Corporate - - - - -
Total 230 460 108 2 12
February 18$m
November 17 $m
Statutory Equity Reserve for Credit Losses 58 81
Collective provision 120 121
APRA General Reserve for Credit Losses 178 202
Notes:
(1) Reconciliation of impaired loansFebruary 18
$mNovember 17
$m
Impaired Assets per Table 4: Credit Risk 215 230
Add: Impaired assets in off-balance sheet securitisation trusts 3 24
Less: Restructured facilities included in APS 220 (45) (61)
Impaired Assets per Accounting Standards 173 193
(2) Excludes assets in off-balance sheet securitisation trusts as required under APRA Prudential Standard APS220 Credit Quality.
Bank of Queensland Limited, Basel III Pillar 3 Disclosures
Bank of Queensland Limited and its Controlled Entities14
For the Quarter Ended 28 February 2018
ABN 32 009 656 740 AFSL No. 244616
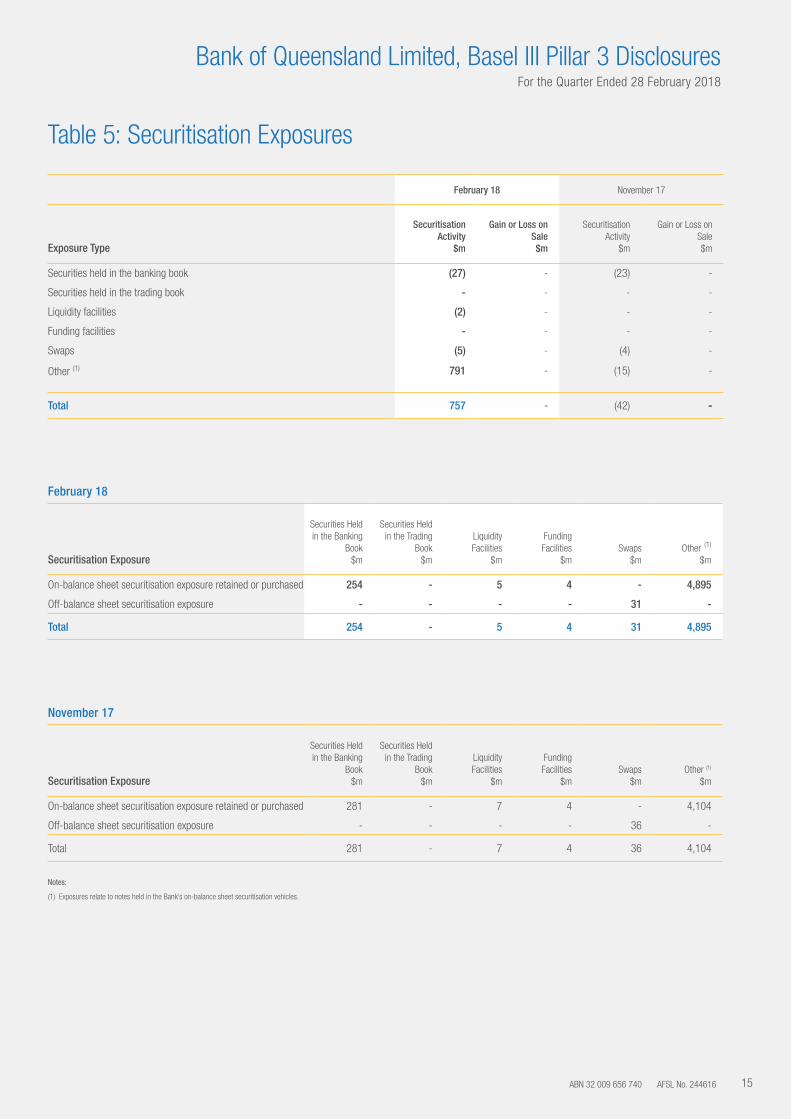
Table 5: Securitisation Exposures
February 18 November 17
Exposure Type
Securitisation Activity
$m
Gain or Loss on Sale$m
Securitisation Activity
$m
Gain or Loss on Sale$m
Securities held in the banking book (27) - (23) -
Securities held in the trading book - - - -
Liquidity facilities (2) - - -
Funding facilities - - - -
Swaps (5) - (4) -
Other (1) 791 - (15) -
Total 757 - (42) -
February 18
Securitisation Exposure
Securities Held in the Banking
Book$m
Securities Held in the Trading
Book$m
Liquidity Facilities
$m
Funding Facilities
$mSwaps
$mOther (1)
$m
On-balance sheet securitisation exposure retained or purchased 254 - 5 4 - 4,895
Off-balance sheet securitisation exposure - - - - 31 -
Total 254 - 5 4 31 4,895
November 17
Securitisation Exposure
Securities Held in the Banking
Book$m
Securities Held in the Trading
Book$m
Liquidity Facilities
$m
Funding Facilities
$mSwaps
$mOther (1)
$m
On-balance sheet securitisation exposure retained or purchased 281 - 7 4 - 4,104
Off-balance sheet securitisation exposure - - - - 36 -
Total 281 - 7 4 36 4,104
Notes:
(1) Exposures relate to notes held in the Bank’s on-balance sheet securitisation vehicles.
Bank of Queensland Limited, Basel III Pillar 3 Disclosures
15
For the Quarter Ended 28 February 2018
Table 20: Liquidity Coverage Ratio
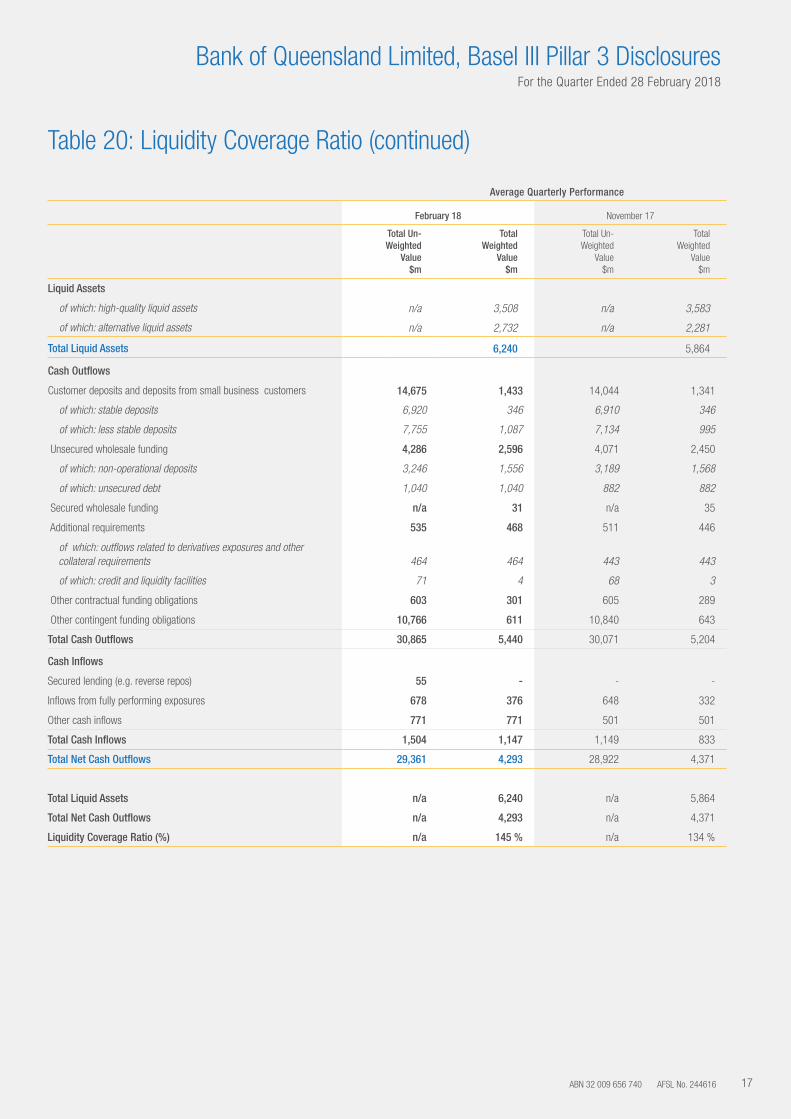
APRA requires ADIs to maintain a minimum 100% Liquidity Coverage Ratio (LCR). The LCR requires sufficient High Quality Liquid Assets (HQLA) to meet net cash outflows over a 30 day period, under a regulator defined liquidity stress scenario. BOQ manages its LCR on a daily basis with a buffer above the regulatory minimum and in line with the BOQ prescribed risk appetite and management ranges. BOQ’s average LCR was slightly elevated over the February 2018 quarter at 145% (30 November 2017 quarter: 134%) due to low maturities over the months of December and January. The following table presents detailed information in respect of the average LCR composition for the two quarters.
BOQ maintains a portfolio of high quality, diversified liquid assets to facilitate balance sheet liquidity and meet its internal and regulatory requirements. Liquid assets comprise HQLA (cash, Australian Commonwealth Government and semi-government securities) and alternate liquid assets covered by the Committed Liquidity Facility (CLF) from the Reserve Bank of Australia. Assets eligible for the CLF include senior unsecured bank debt, covered bonds and residential mortgage backed securities that are eligible for repurchase with the Reserve Bank of Australia.
BOQ has a stable, diversified and resilient deposit and funding base that mitigates the chance of a liquidity stress event across various funding market conditions. BOQ utilises a range of funding tools including customer deposits, securitisation, short term and long term wholesale debt instruments. BOQ has increased long-term wholesale issuance in the period as part of its overall funding strategy to lengthen tenor and add to its stable funding base. Bank lending is predominantly funded from stable funding sources; short term wholesale funding is primarily used to manage timing mismatches and fund liquid assets.
The liquid assets composition has remained relatively stable over the year with the allocation to HQLA over net cash outflows for the February 2018 quarter averaging 82% (30 November 2017 quarter: 82%).
BOQ does not have significant derivative exposures or currency exposures that could adversely affect its LCR.
Bank of Queensland Limited, Basel III Pillar 3 Disclosures
Bank of Queensland Limited and its Controlled Entities16
For the Quarter Ended 28 February 2018
ABN 32 009 656 740 AFSL No. 244616
Table 20: Liquidity Coverage Ratio (continued)
Average Quarterly Performance
February 18 November 17
Total Un-Weighted
Value$m
Total Weighted
Value$m
Total Un-Weighted
Value$m
Total Weighted
Value$m
Liquid Assets
of which: high-quality liquid assets n/a 3,508 n/a 3,583
of which: alternative liquid assets n/a 2,732 n/a 2,281
Total Liquid Assets 6,240 5,864
Cash Outflows
Customer deposits and deposits from small business customers 14,675 1,433 14,044 1,341
of which: stable deposits 6,920 346 6,910 346
of which: less stable deposits 7,755 1,087 7,134 995
Unsecured wholesale funding 4,286 2,596 4,071 2,450
of which: non-operational deposits 3,246 1,556 3,189 1,568
of which: unsecured debt 1,040 1,040 882 882
Secured wholesale funding n/a 31 n/a 35
Additional requirements 535 468 511 446
of which: outflows related to derivatives exposures and other collateral requirements 464 464 443 443
of which: credit and liquidity facilities 71 4 68 3
Other contractual funding obligations 603 301 605 289
Other contingent funding obligations 10,766 611 10,840 643
Total Cash Outflows 30,865 5,440 30,071 5,204
Cash Inflows
Secured lending (e.g. reverse repos) 55 - - -
Inflows from fully performing exposures 678 376 648 332
Other cash inflows 771 771 501 501
Total Cash Inflows 1,504 1,147 1,149 833
Total Net Cash Outflows 29,361 4,293 28,922 4,371
Total Liquid Assets n/a 6,240 n/a 5,864
Total Net Cash Outflows n/a 4,293 n/a 4,371
Liquidity Coverage Ratio (%) n/a 145 % n/a 134 %
Bank of Queensland Limited, Basel III Pillar 3 Disclosures
17
For the Quarter Ended 28 February 2018