Embed Size (px)
Citation preview

2019 BASEL III PILLAR 3 DISCLOSURE
AS AT 30 JUNE 2019
APS 330: PUBLIC DISCLOSURE

1
Important notice This document has been prepared by Australia and New Zealand Banking Group Limited (ANZ) to meet its disclosure obligations under the Australian Prudential Regulation Authority (APRA) ADI Prudential Standard (APS) 330: Public Disclosure.
ANZ Basel III Pillar 3 Disclosure June 2019
2
Table 3 Capital adequacy - Capital Ratios and Risk Weighted Assets1
Jun 19 Mar 19 Dec 18 Risk Weighted Assets (RWA) $M $M $M
Subject to Advanced Internal Rating Based (IRB) approach Corporate 128,949 127,989 127,973 Sovereign 7,560 7,016 6,986 Bank 14,915 15,511 15,709 Residential Mortgage 101,452 101,469 101,320 Qualifying Revolving Retail 5,522 5,795 5,890 Other Retail 27,451 28,029 28,715
Credit risk weighted assets subject to Advanced IRB approach 285,849 285,809 286,593
Credit Risk Specialised Lending exposures subject to slotting approach1 36,384 35,696 34,032
Subject to Standardised approach Corporate 11,819 12,252 13,943 Residential Mortgage 335 331 336 Other Retail 78 81 84
Credit risk weighted assets subject to Standardised approach 12,232 12,664 14,363
Credit Valuation Adjustment and Qualifying Central Counterparties 6,489 6,217 7,629
Credit risk weighted assets relating to securitisation exposures 1,851 1,558 1,616 Other assets 3,307 3,579 3,437
Total credit risk weighted assets 346,112 345,523 347,670
Market risk weighted assets 5,292 5,790 5,797 Operational risk weighted assets 37,789 37,733 38,019 Interest rate risk in the banking book (IRRBB) risk weighted assets 7,150 7,245 6,957
Total Risk Weighted Assets 396,343 396,291 398,443
Capital ratios (%)
Level 2 Common Equity Tier 1 capital ratio 11.8% 11.5% 11.3% Level 2 Tier 1 capital ratio 13.8% 13.4% 13.1% Level 2 Total capital ratio 15.5% 15.3% 15.0%
Credit Risk Weighted Assets (CRWA) Total CRWA increased $0.6 billion (0.2%) from March 2019 to $346.1 billion at Jun 2019. This was driven by an increase in Corporates under the Advanced IRB approach with CRWA increasing $1.0 billion predominantly from portfolio growth in the Institutional Business. Market Risk, Operational Risk and IRRBB Risk Weighted Assets (RWA) Traded Market Risk RWA decreased $0.5 billion (8.6%) over the quarter due to reduction in Stress VaR.
1 Specialised Lending exposures subject to supervisory slotting approach are those where the main servicing and repayment is from the asset being financed, and includes specified commercial property development/investment lending and project finance.
ANZ Basel III Pillar 3 Disclosure June 2019
3
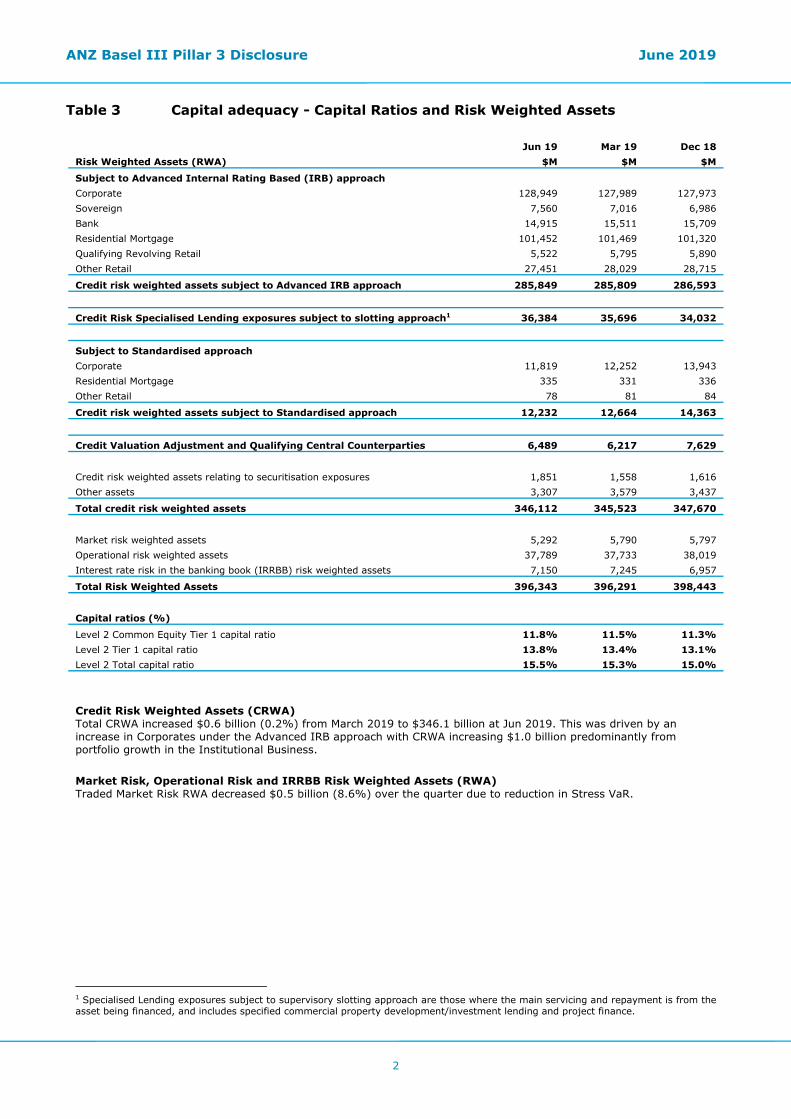
Table 4 Credit risk exposures Exposure at Default in Table 4 represents credit exposure net of offsets for credit risk mitigation such as guarantees, credit derivatives, netting and financial collateral. It includes Advanced IRB, Specialised Lending and Standardised exposures, however does not include Securitisation, Equities or Other Assets exposures.
Table 4(a) part (i): Period end and average Exposure at Default 2
Jun 19
Advanced IRB approach
Risk Weighted
Assets $M
Exposure at Default
$M
Average Exposure at Default for
three months $M
Individual provision
charge for three months
$M
Write-offs for three
months $M
Corporate 128,949 261,582 259,794 50 46 Sovereign 7,560 155,094 152,377 - - Bank 14,915 52,608 53,819 - - Residential Mortgage 101,452 376,173 377,843 40 34 Qualifying Revolving Retail 5,522 17,092 17,341 52 65 Other Retail 27,451 37,592 38,067 106 127
Total Advanced IRB approach 285,849 900,141 899,241 248 272
Specialised Lending 36,384 43,402 43,032 - -
Standardised approach
Corporate 11,819 13,106 13,313 9 7 Residential Mortgage 335 720 718 1 - Other Retail 78 77 79 - 3
Total Standardised approach 12,232 13,903 14,110 10 10
Credit Valuation Adjustment and Qualifying Central Counterparties 6,489 13,740 13,135 - -
Total 340,954 971,186 969,518 258 282
2 Average Exposure at Default for quarter is calculated as the simple average of the balances at the start and the end of each three month period.
ANZ Basel III Pillar 3 Disclosure June 2019
4
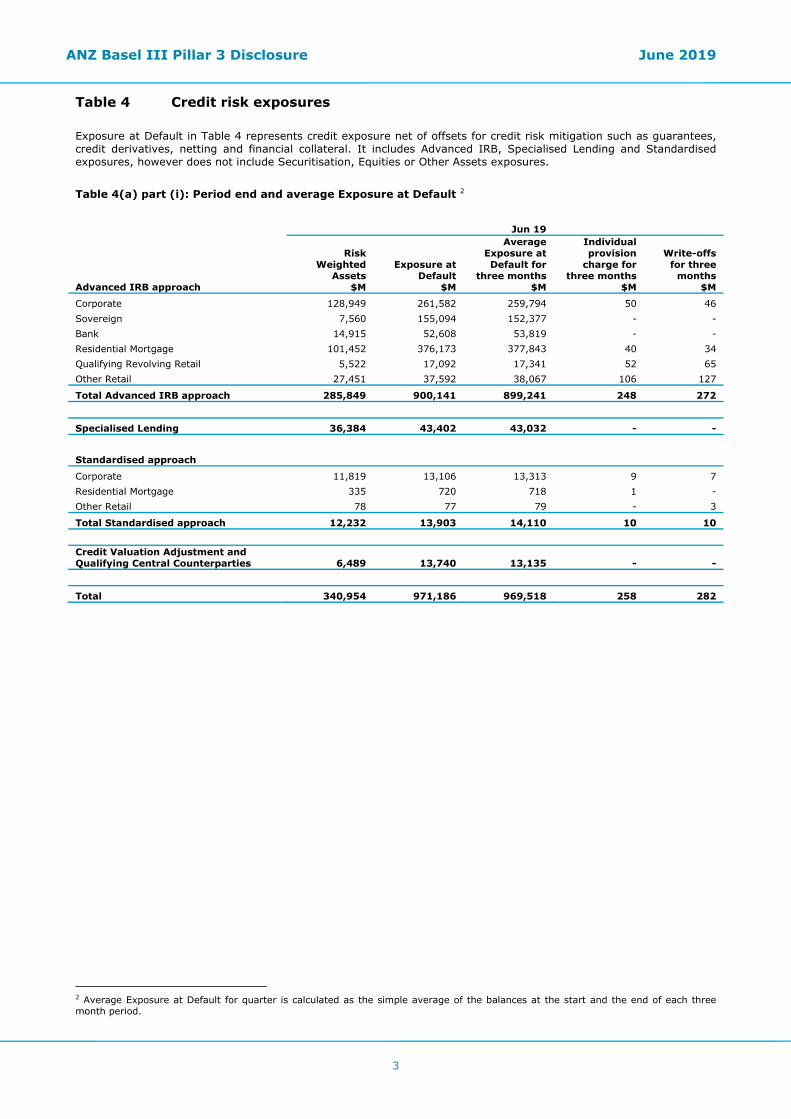
Table 4(a) part (i): Period end and average Exposure at Default (continued)
Mar 19
Advanced IRB approach
Risk Weighted
Assets $M
Exposure at Default
$M
Average Exposure at Default for
three months $M
Individual provision
charge for three months
$M
Write-offs for three
months $M
Corporate 127,989 258,005 257,614 35 24 Sovereign 7,016 149,660 155,854 - - Bank 15,511 55,029 53,058 - - Residential Mortgage 101,469 379,512 379,899 31 28 Qualifying Revolving Retail 5,795 17,589 17,825 38 61 Other Retail 28,029 38,542 38,936 96 121
Total Advanced IRB approach 285,809 898,337 903,186 200 234
Specialised Lending 35,696 42,661 41,675 - 2
Standardised approach
Corporate 12,252 13,519 14,295 (6) 2 Residential Mortgage 331 716 717 (1) 1 Other Retail 81 80 82 1 1
Total Standardised approach 12,664 14,315 15,094 (6) 4
Credit Valuation Adjustment and Qualifying Central Counterparties 6,217 12,530 12,629 - -
Total 340,386 967,843 972,584 194 240
Dec 18
Advanced IRB approach
Risk Weighted
Assets $M
Exposure at Default
$M
Average Exposure at Default for
three months $M
Individual provision
charge for three months
$M
Write-offs for three
months $M
Corporate 127,973 257,223 251,424 16 44 Sovereign 6,986 162,047 153,808 - - Bank 15,709 51,086 51,225 - - Residential Mortgage 101,320 380,286 378,430 14 22 Qualifying Revolving Retail 5,890 18,061 18,254 47 62 Other Retail 28,715 39,330 39,575 101 111
Total Advanced IRB approach 286,593 908,033 892,716 178 239
Specialised Lending 34,032 40,689 40,076 1 -
Standardised approach
Corporate 13,943 15,071 15,068 7 17 Residential Mortgage 336 717 711 - - Other Retail 84 83 85 - 2
Total Standardised approach 14,363 15,871 15,864 7 19
Credit Valuation Adjustment and Qualifying Central Counterparties 7,629 12,727 12,065 - -
Total 342,617 977,320 960,721 186 258
ANZ Basel III Pillar 3 Disclosure June 2019
5
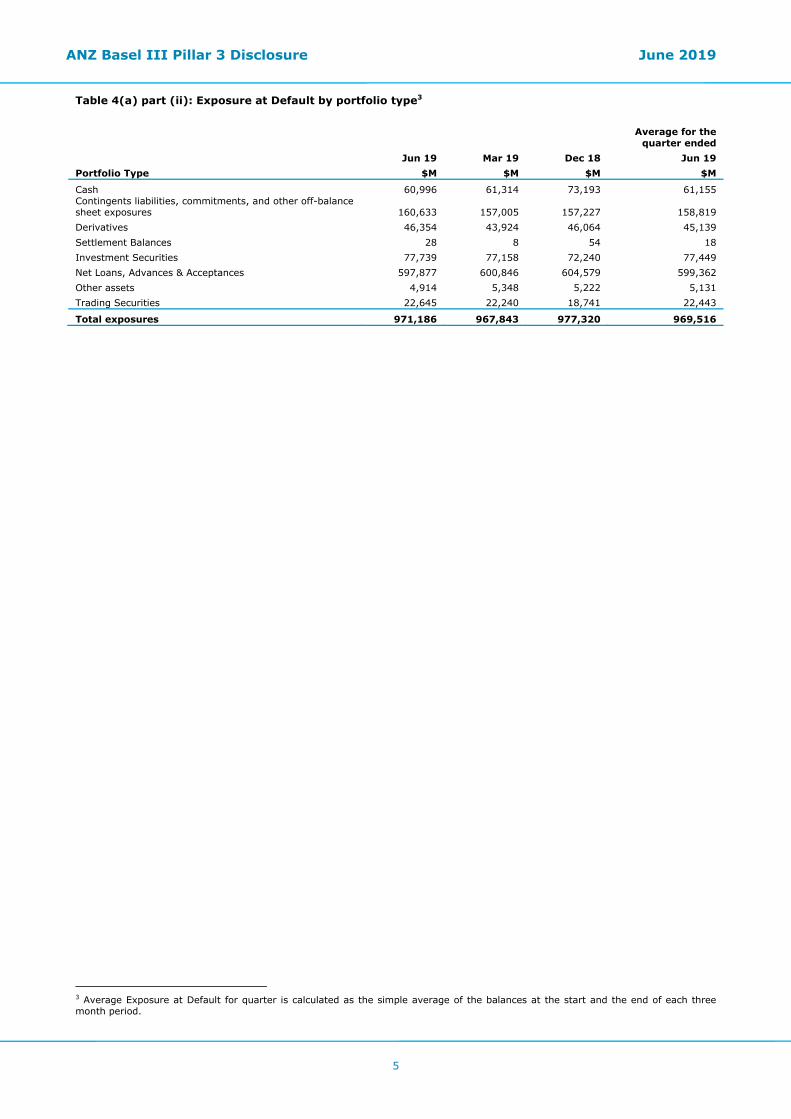
Table 4(a) part (ii): Exposure at Default by portfolio type3
Average for the quarter ended
Jun 19 Mar 19 Dec 18 Jun 19 Portfolio Type $M $M $M $M
Cash 60,996 61,314 73,193 61,155 Contingents liabilities, commitments, and other off-balance sheet exposures 160,633 157,005 157,227 158,819 Derivatives 46,354 43,924 46,064 45,139 Settlement Balances 28 8 54 18 Investment Securities 77,739 77,158 72,240 77,449 Net Loans, Advances & Acceptances 597,877 600,846 604,579 599,362 Other assets 4,914 5,348 5,222 5,131 Trading Securities 22,645 22,240 18,741 22,443
Total exposures 971,186 967,843 977,320 969,516
3 Average Exposure at Default for quarter is calculated as the simple average of the balances at the start and the end of each three month period.
ANZ Basel III Pillar 3 Disclosure June 2019
6
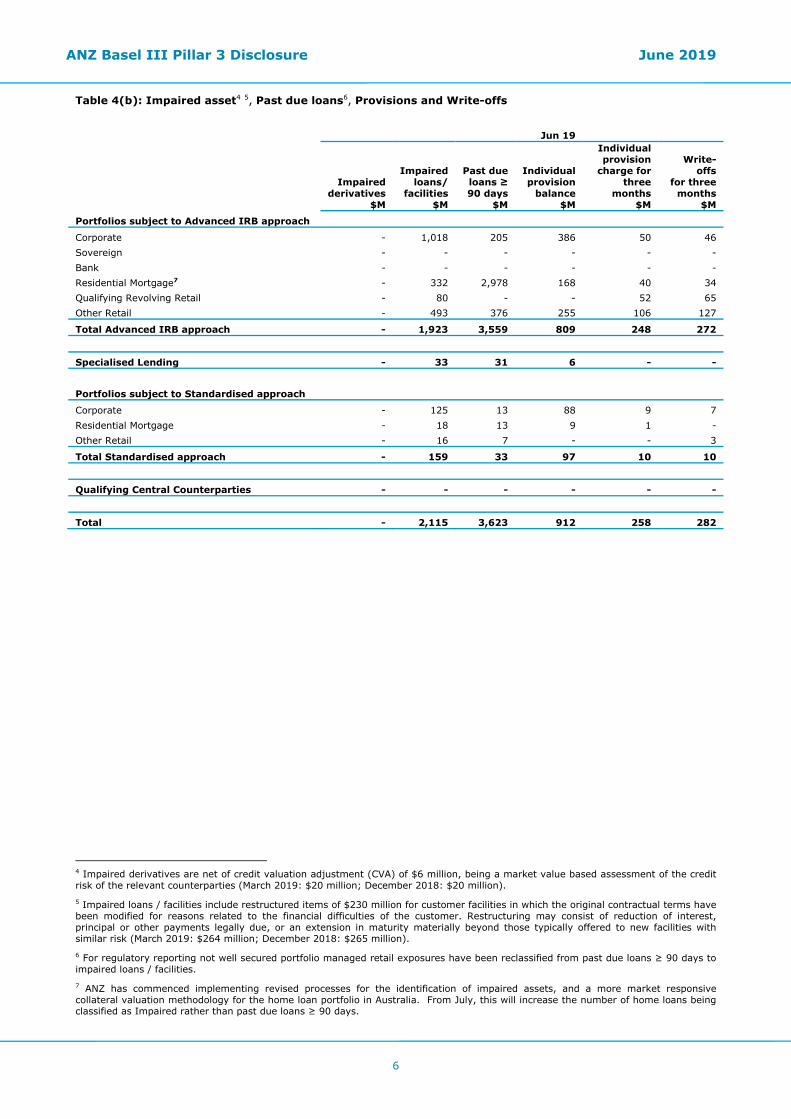
Table 4(b): Impaired asset4 5, Past due loans6, Provisions and Write-offs
Jun 19
Impaired derivatives
$M
Impaired loans/
facilities $M
Past due loans ≥ 90 days
$M
Individual provision
balance $M
Individual provision
charge for three
months $M
Write-offs
for three months
$M
Portfolios subject to Advanced IRB approach
Corporate - 1,018 205 386 50 46 Sovereign - - - - - - Bank - - - - - - Residential Mortgage7 - 332 2,978 168 40 34 Qualifying Revolving Retail - 80 - - 52 65 Other Retail - 493 376 255 106 127
Total Advanced IRB approach - 1,923 3,559 809 248 272
Specialised Lending - 33 31 6 - -
Portfolios subject to Standardised approach
Corporate - 125 13 88 9 7 Residential Mortgage - 18 13 9 1 - Other Retail - 16 7 - - 3
Total Standardised approach - 159 33 97 10 10
Qualifying Central Counterparties - - - - - -
Total - 2,115 3,623 912 258 282
4 Impaired derivatives are net of credit valuation adjustment (CVA) of $6 million, being a market value based assessment of the credit risk of the relevant counterparties (March 2019: $20 million; December 2018: $20 million). 5 Impaired loans / facilities include restructured items of $230 million for customer facilities in which the original contractual terms have been modified for reasons related to the financial difficulties of the customer. Restructuring may consist of reduction of interest, principal or other payments legally due, or an extension in maturity materially beyond those typically offered to new facilities with similar risk (March 2019: $264 million; December 2018: $265 million). 6 For regulatory reporting not well secured portfolio managed retail exposures have been reclassified from past due loans ≥ 90 days to impaired loans / facilities. 7 ANZ has commenced implementing revised processes for the identification of impaired assets, and a more market responsive collateral valuation methodology for the home loan portfolio in Australia. From July, this will increase the number of home loans being classified as Impaired rather than past due loans ≥ 90 days.
ANZ Basel III Pillar 3 Disclosure June 2019
7
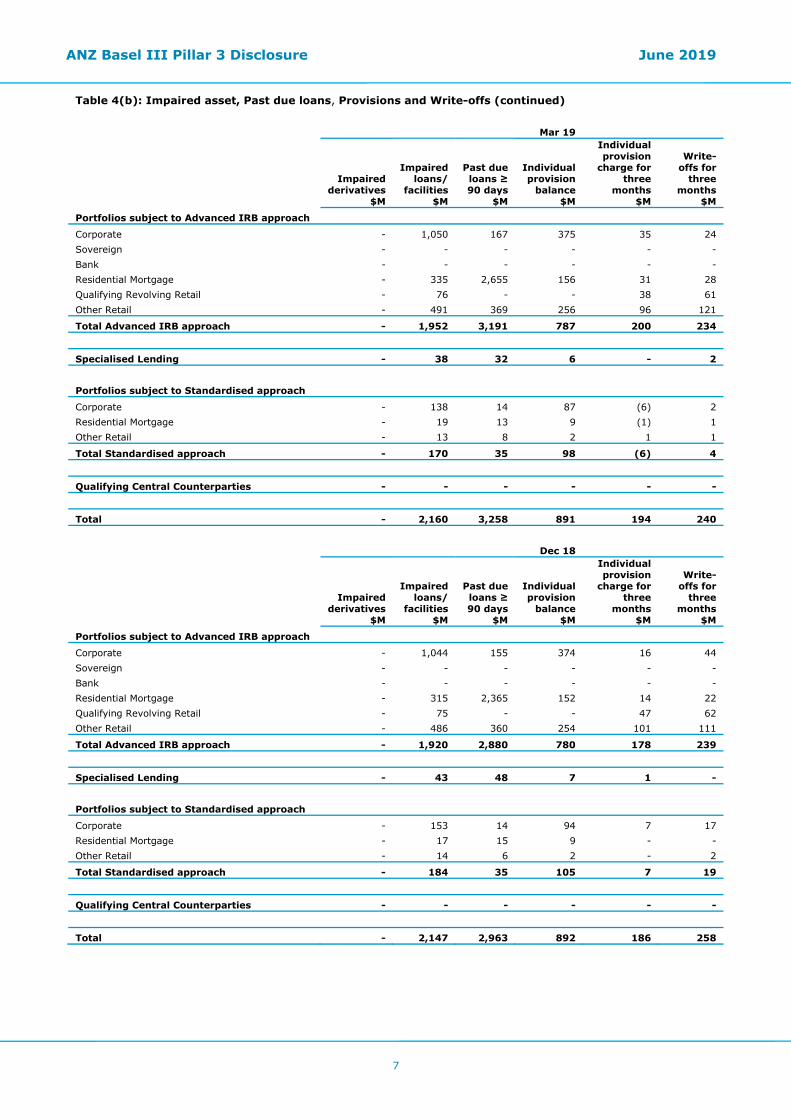
Table 4(b): Impaired asset, Past due loans, Provisions and Write-offs (continued) Mar 19
Impaired derivatives
$M
Impaired loans/
facilities $M
Past due loans ≥ 90 days
$M
Individual provision
balance $M
Individual provision
charge for three
months $M
Write-offs for
three months
$M
Portfolios subject to Advanced IRB approach
Corporate - 1,050 167 375 35 24 Sovereign - - - - - - Bank - - - - - - Residential Mortgage - 335 2,655 156 31 28 Qualifying Revolving Retail - 76 - - 38 61 Other Retail - 491 369 256 96 121
Total Advanced IRB approach - 1,952 3,191 787 200 234
Specialised Lending - 38 32 6 - 2
Portfolios subject to Standardised approach
Corporate - 138 14 87 (6) 2 Residential Mortgage - 19 13 9 (1) 1 Other Retail - 13 8 2 1 1
Total Standardised approach - 170 35 98 (6) 4
Qualifying Central Counterparties - - - - - -
Total - 2,160 3,258 891 194 240
Dec 18
Impaired derivatives
$M
Impaired loans/
facilities $M
Past due loans ≥ 90 days
$M
Individual provision
balance $M
Individual provision
charge for three
months $M
Write-offs for
three months
$M
Portfolios subject to Advanced IRB approach
Corporate - 1,044 155 374 16 44 Sovereign - - - - - - Bank - - - - - - Residential Mortgage - 315 2,365 152 14 22 Qualifying Revolving Retail - 75 - - 47 62 Other Retail - 486 360 254 101 111
Total Advanced IRB approach - 1,920 2,880 780 178 239
Specialised Lending - 43 48 7 1 -
Portfolios subject to Standardised approach
Corporate - 153 14 94 7 17 Residential Mortgage - 17 15 9 - - Other Retail - 14 6 2 - 2
Total Standardised approach - 184 35 105 7 19
Qualifying Central Counterparties - - - - - -
Total - 2,147 2,963 892 186 258
ANZ Basel III Pillar 3 Disclosure June 2019
8
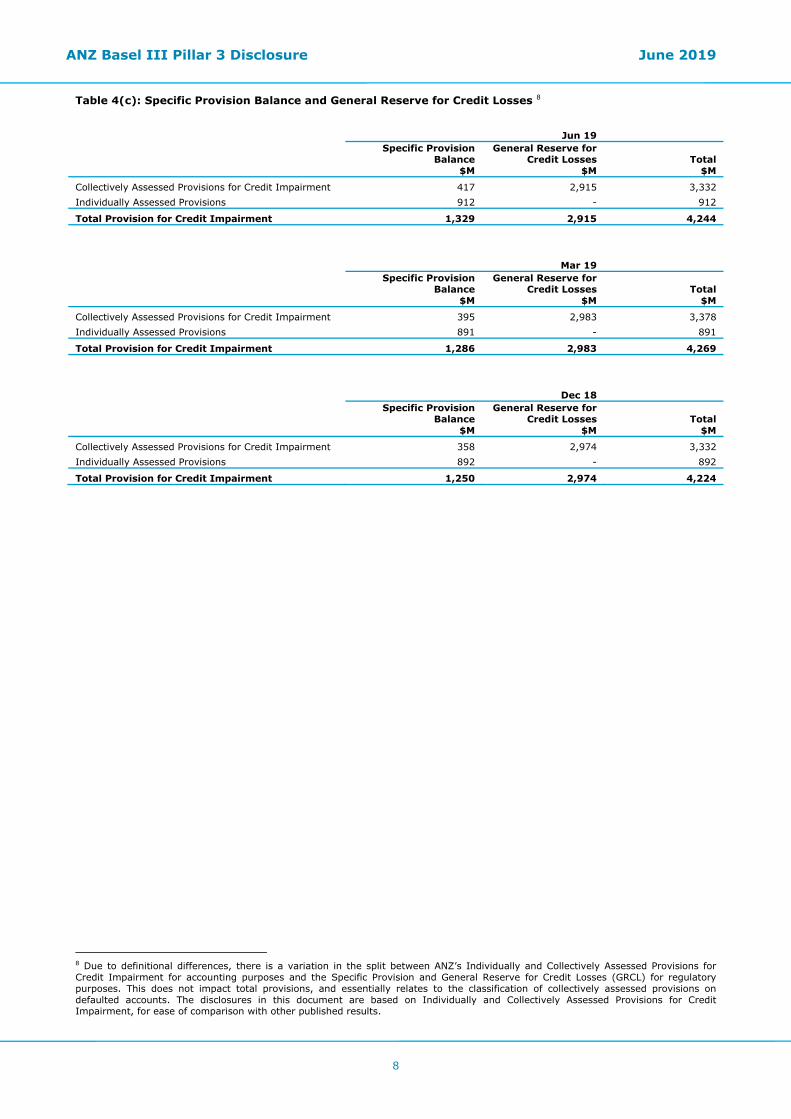
Table 4(c): Specific Provision Balance and General Reserve for Credit Losses 8
Jun 19
Specific Provision Balance
$M
General Reserve for Credit Losses
$M Total
$M
Collectively Assessed Provisions for Credit Impairment 417 2,915 3,332 Individually Assessed Provisions 912 - 912
Total Provision for Credit Impairment 1,329 2,915 4,244
Mar 19
Specific Provision Balance
$M
General Reserve for Credit Losses
$M Total
$M
Collectively Assessed Provisions for Credit Impairment 395 2,983 3,378 Individually Assessed Provisions 891 - 891
Total Provision for Credit Impairment 1,286 2,983 4,269
Dec 18
Specific Provision Balance
$M
General Reserve for Credit Losses
$M Total
$M
Collectively Assessed Provisions for Credit Impairment 358 2,974 3,332 Individually Assessed Provisions 892 - 892
Total Provision for Credit Impairment 1,250 2,974 4,224
8 Due to definitional differences, there is a variation in the split between ANZ’s Individually and Collectively Assessed Provisions for Credit Impairment for accounting purposes and the Specific Provision and General Reserve for Credit Losses (GRCL) for regulatory purposes. This does not impact total provisions, and essentially relates to the classification of collectively assessed provisions on defaulted accounts. The disclosures in this document are based on Individually and Collectively Assessed Provisions for Credit Impairment, for ease of comparison with other published results.
ANZ Basel III Pillar 3 Disclosure June 2019
9
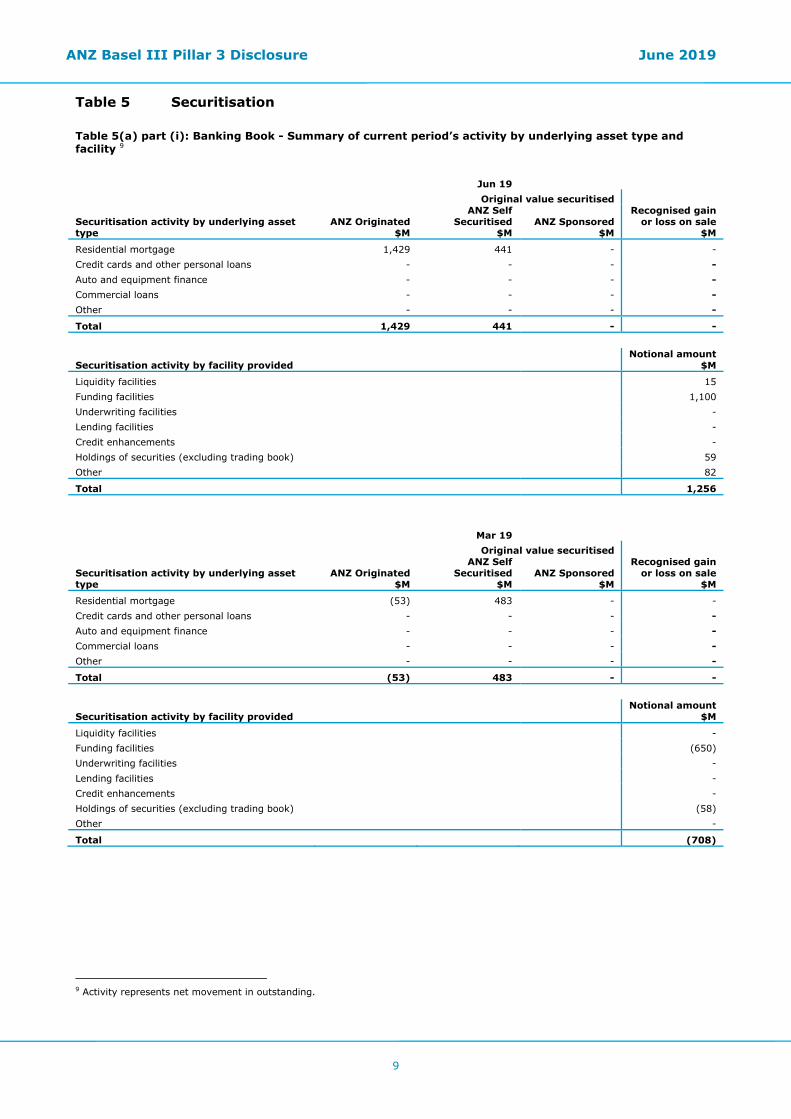
Table 5 Securitisation Table 5(a) part (i): Banking Book - Summary of current period’s activity by underlying asset type and facility 9
Jun 19 Original value securitised
Securitisation activity by underlying asset type
ANZ Originated $M
ANZ Self Securitised
$M ANZ Sponsored
$M
Recognised gain or loss on sale
$M
Residential mortgage 1,429 441 - - Credit cards and other personal loans - - - - Auto and equipment finance - - - - Commercial loans - - - - Other - - - -
Total 1,429 441 - -
Securitisation activity by facility provided Notional amount
$M
Liquidity facilities 15 Funding facilities 1,100 Underwriting facilities - Lending facilities - Credit enhancements - Holdings of securities (excluding trading book) 59 Other 82
Total 1,256
Mar 19 Original value securitised
Securitisation activity by underlying asset type
ANZ Originated $M
ANZ Self Securitised
$M ANZ Sponsored
$M
Recognised gain or loss on sale
$M
Residential mortgage (53) 483 - - Credit cards and other personal loans - - - - Auto and equipment finance - - - - Commercial loans - - - - Other - - - -
Total (53) 483 - -
Securitisation activity by facility provided Notional amount
$M
Liquidity facilities - Funding facilities (650) Underwriting facilities - Lending facilities - Credit enhancements - Holdings of securities (excluding trading book) (58) Other -
Total (708)
9 Activity represents net movement in outstanding.
ANZ Basel III Pillar 3 Disclosure June 2019
10
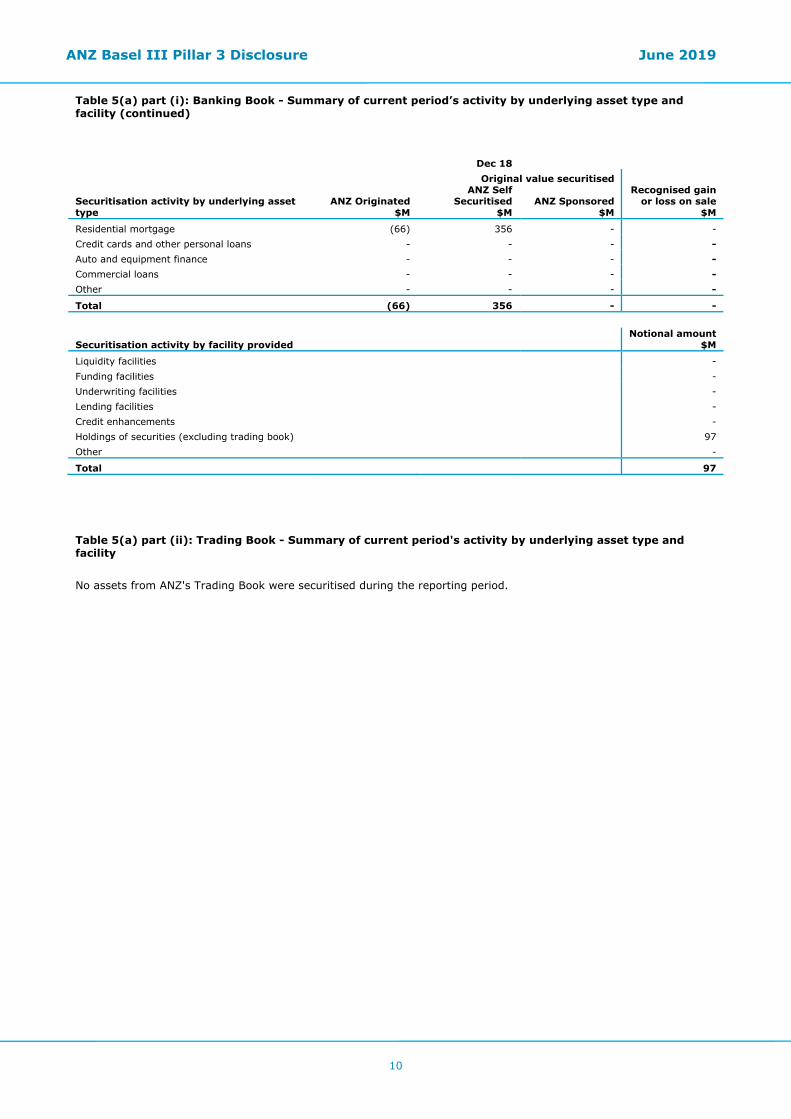
Table 5(a) part (i): Banking Book - Summary of current period’s activity by underlying asset type and facility (continued)
Dec 18 Original value securitised
Securitisation activity by underlying asset type
ANZ Originated $M
ANZ Self Securitised
$M ANZ Sponsored
$M
Recognised gain or loss on sale
$M
Residential mortgage (66) 356 - - Credit cards and other personal loans - - - - Auto and equipment finance - - - - Commercial loans - - - - Other - - - -
Total (66) 356 - -
Securitisation activity by facility provided Notional amount
$M
Liquidity facilities - Funding facilities - Underwriting facilities - Lending facilities - Credit enhancements - Holdings of securities (excluding trading book) 97 Other -
Total 97
Table 5(a) part (ii): Trading Book - Summary of current period's activity by underlying asset type and facility
No assets from ANZ's Trading Book were securitised during the reporting period.
ANZ Basel III Pillar 3 Disclosure June 2019
11
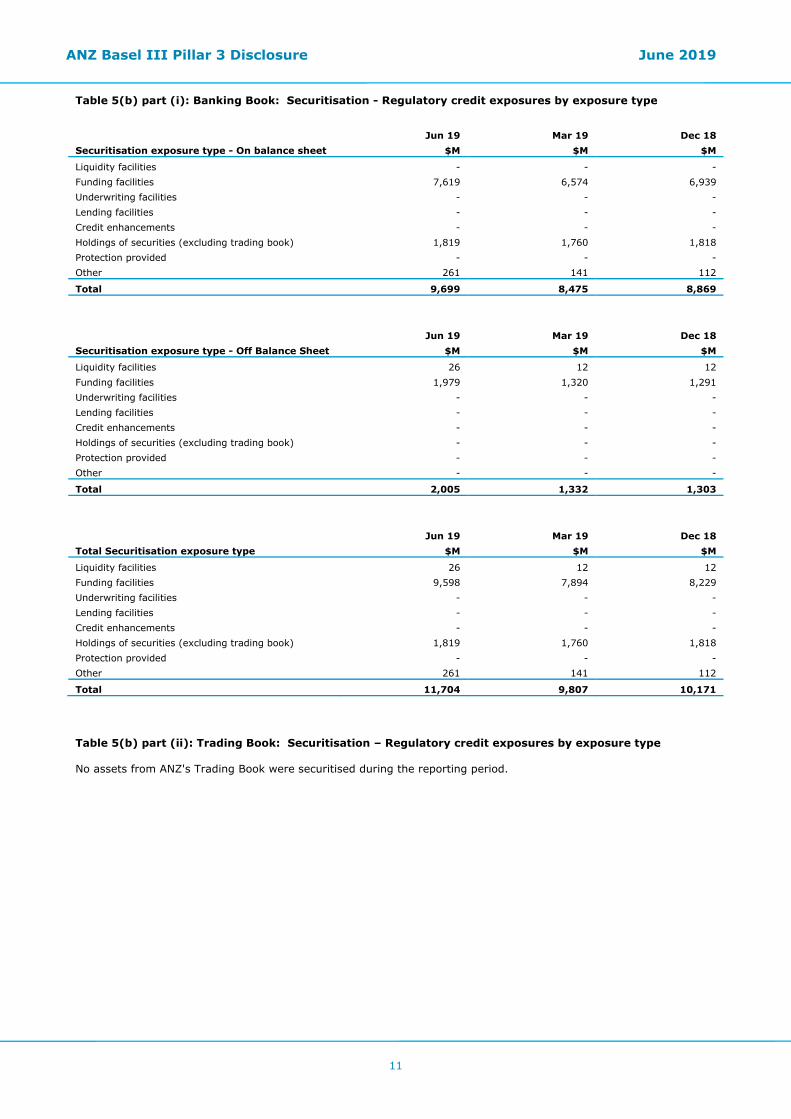
Table 5(b) part (i): Banking Book: Securitisation - Regulatory credit exposures by exposure type
Jun 19 Mar 19 Dec 18 Securitisation exposure type - On balance sheet $M $M $M
Liquidity facilities - - - Funding facilities 7,619 6,574 6,939 Underwriting facilities - - - Lending facilities - - - Credit enhancements - - - Holdings of securities (excluding trading book) 1,819 1,760 1,818 Protection provided - - - Other 261 141 112
Total 9,699 8,475 8,869
Jun 19 Mar 19 Dec 18 Securitisation exposure type - Off Balance Sheet $M $M $M
Liquidity facilities 26 12 12 Funding facilities 1,979 1,320 1,291 Underwriting facilities - - - Lending facilities - - - Credit enhancements - - - Holdings of securities (excluding trading book) - - - Protection provided - - - Other - - -
Total 2,005 1,332 1,303
Jun 19 Mar 19 Dec 18 Total Securitisation exposure type $M $M $M
Liquidity facilities 26 12 12 Funding facilities 9,598 7,894 8,229 Underwriting facilities - - - Lending facilities - - - Credit enhancements - - - Holdings of securities (excluding trading book) 1,819 1,760 1,818 Protection provided - - - Other 261 141 112
Total 11,704 9,807 10,171
Table 5(b) part (ii): Trading Book: Securitisation – Regulatory credit exposures by exposure type No assets from ANZ's Trading Book were securitised during the reporting period.
ANZ Basel III Pillar 3 Disclosure June 2019
12
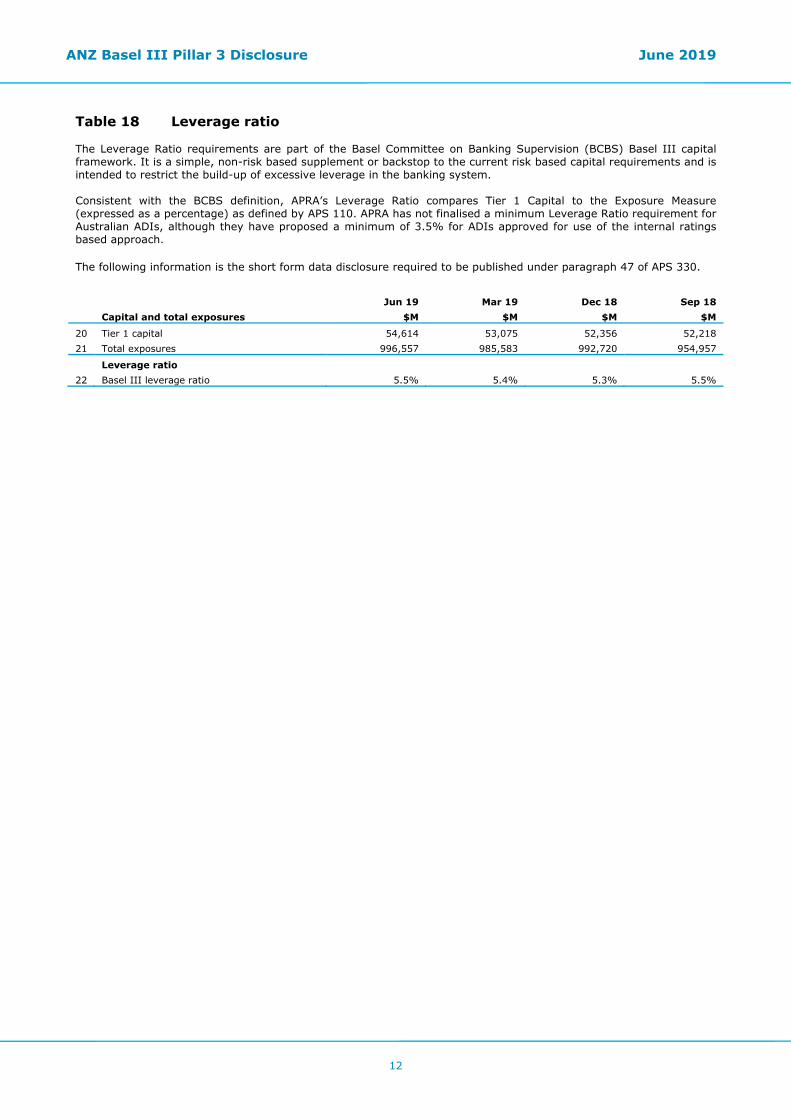
Table 18 Leverage ratio The Leverage Ratio requirements are part of the Basel Committee on Banking Supervision (BCBS) Basel III capital framework. It is a simple, non-risk based supplement or backstop to the current risk based capital requirements and is intended to restrict the build-up of excessive leverage in the banking system. Consistent with the BCBS definition, APRA’s Leverage Ratio compares Tier 1 Capital to the Exposure Measure (expressed as a percentage) as defined by APS 110. APRA has not finalised a minimum Leverage Ratio requirement for Australian ADIs, although they have proposed a minimum of 3.5% for ADIs approved for use of the internal ratings based approach. The following information is the short form data disclosure required to be published under paragraph 47 of APS 330.
Jun 19 Mar 19 Dec 18 Sep 18 Capital and total exposures $M $M $M $M
20 Tier 1 capital 54,614 53,075 52,356 52,218 21 Total exposures 996,557 985,583 992,720 954,957
Leverage ratio 22 Basel III leverage ratio 5.5% 5.4% 5.3% 5.5%
ANZ Basel III Pillar 3 Disclosure June 2019
13
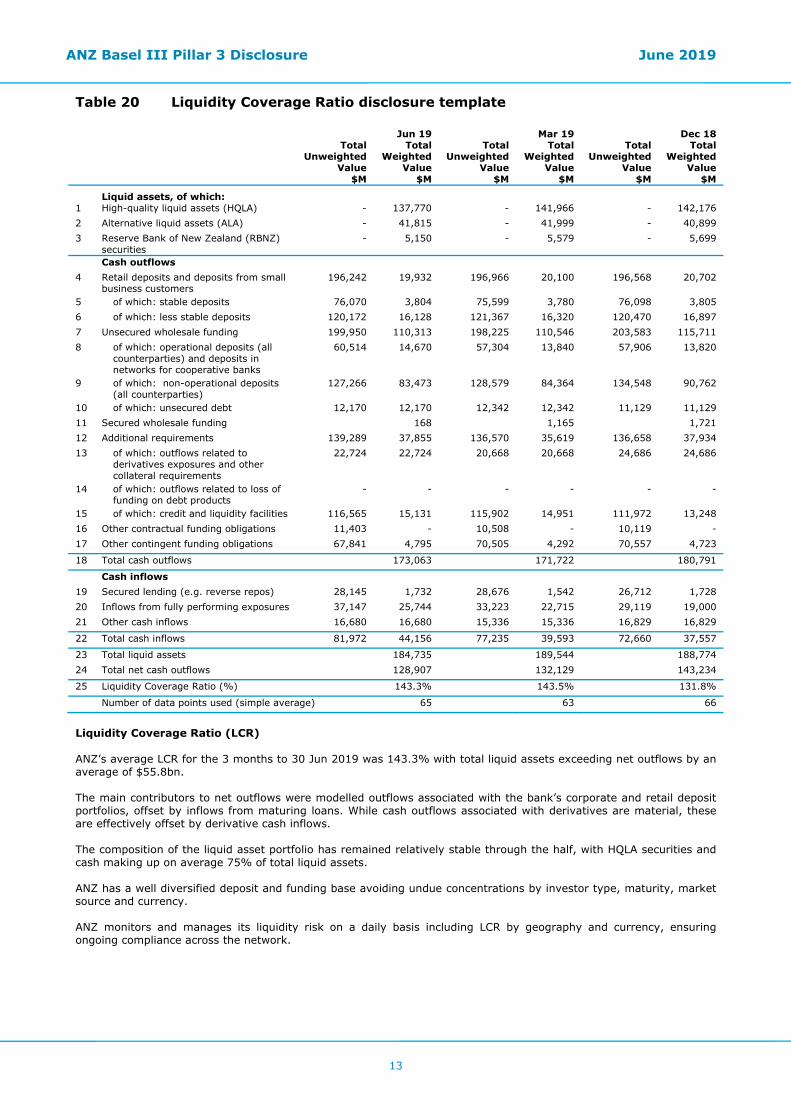
Table 20 Liquidity Coverage Ratio disclosure template Jun 19 Mar 19 Dec 18
Total Unweighted
Value $M
Total Weighted
Value $M
Total Unweighted
Value $M
Total Weighted
Value $M
Total Unweighted
Value $M
Total Weighted
Value $M
Liquid assets, of which: 1 High-quality liquid assets (HQLA) - 137,770 - 141,966 - 142,176 2 Alternative liquid assets (ALA) - 41,815 - 41,999 - 40,899 3 Reserve Bank of New Zealand (RBNZ)
securities - 5,150 - 5,579 - 5,699
Cash outflows 4 Retail deposits and deposits from small
business customers 196,242 19,932 196,966 20,100 196,568 20,702
5 of which: stable deposits 76,070 3,804 75,599 3,780 76,098 3,805 6 of which: less stable deposits 120,172 16,128 121,367 16,320 120,470 16,897 7 Unsecured wholesale funding 199,950 110,313 198,225 110,546 203,583 115,711 8 of which: operational deposits (all
counterparties) and deposits in networks for cooperative banks
60,514 14,670 57,304 13,840 57,906 13,820
9 of which: non-operational deposits (all counterparties)
127,266 83,473 128,579 84,364 134,548 90,762
10 of which: unsecured debt 12,170 12,170 12,342 12,342 11,129 11,129 11 Secured wholesale funding 168 1,165 1,721 12 Additional requirements 139,289 37,855 136,570 35,619 136,658 37,934 13 of which: outflows related to
derivatives exposures and other collateral requirements
22,724 22,724 20,668 20,668 24,686 24,686
14 of which: outflows related to loss of funding on debt products
- - - - - -
15 of which: credit and liquidity facilities 116,565 15,131 115,902 14,951 111,972 13,248 16 Other contractual funding obligations 11,403 - 10,508 - 10,119 - 17 Other contingent funding obligations 67,841 4,795 70,505 4,292 70,557 4,723
18 Total cash outflows 173,063 171,722 180,791
Cash inflows 19 Secured lending (e.g. reverse repos) 28,145 1,732 28,676 1,542 26,712 1,728 20 Inflows from fully performing exposures 37,147 25,744 33,223 22,715 29,119 19,000 21 Other cash inflows 16,680 16,680 15,336 15,336 16,829 16,829
22 Total cash inflows 81,972 44,156 77,235 39,593 72,660 37,557
23 Total liquid assets 184,735 189,544 188,774 24 Total net cash outflows 128,907 132,129 143,234
25 Liquidity Coverage Ratio (%) 143.3% 143.5% 131.8%
Number of data points used (simple average) 65 63 66
Liquidity Coverage Ratio (LCR) ANZ’s average LCR for the 3 months to 30 Jun 2019 was 143.3% with total liquid assets exceeding net outflows by an average of $55.8bn. The main contributors to net outflows were modelled outflows associated with the bank’s corporate and retail deposit portfolios, offset by inflows from maturing loans. While cash outflows associated with derivatives are material, these are effectively offset by derivative cash inflows. The composition of the liquid asset portfolio has remained relatively stable through the half, with HQLA securities and cash making up on average 75% of total liquid assets. ANZ has a well diversified deposit and funding base avoiding undue concentrations by investor type, maturity, market source and currency. ANZ monitors and manages its liquidity risk on a daily basis including LCR by geography and currency, ensuring ongoing compliance across the network.
ANZ Basel III Pillar 3 Disclosure June 2019
14
Glossary ADI Authorised Deposit-taking Institution. Basel III Credit Valuation Adjustment (CVA) capital charge
CVA charge is an additional capital requirement under Basel III for bilateral derivative exposures. Derivatives not cleared through a central exchange/counterparty are subject to this additional capital charge and also receive normal CRWA treatment under Basel II principles.
Collectively Assessed Provision for Credit Impairment
Collectively assessed provisions for credit impairment represent the Expected Credit Loss (ECL) calculated in accordance with AASB 9 Financial Instruments (AASB 9). These incorporate forward looking information and do not require an actual loss event to have occurred for an impairment provision to be recognised.
Credit exposure The aggregate of all claims, commitments and contingent liabilities arising from on- and off-balance sheet transactions (in the banking book and trading book) with the counterparty or group of related counterparties.
Credit risk The risk of financial loss resulting from the failure of ANZ’s customers and
counterparties to honour or perform fully the terms of a loan or contract. Credit Valuation Adjustment (CVA)
Over the life of a derivative instrument, ANZ uses a CVA model to adjust fair value to take into account the impact of counterparty credit quality. The methodology calculates the present value of expected losses over the life of the financial instrument as a function of probability of default, loss given default, expected credit risk exposure and an asset correlation factor. Impaired derivatives are also subject to a CVA.
Days past due The number of days a credit obligation is overdue, commencing on the date that the
arrears or excess occurs and accruing for each completed calendar day thereafter. Exposure at Default (EAD) Exposure At Default is defined as the expected facility exposure at the date of default. Impaired assets (IA) Facilities are classified as impaired when there is doubt as to whether the contractual
amounts due, including interest and other payments, will be met in a timely manner. Impaired assets include impaired facilities, and impaired derivatives. Impaired derivatives have a credit valuation adjustment (CVA), which is a market assessment of the credit risk of the relevant counterparties.
Impaired loans (IL) Impaired loans comprise of drawn facilities where the customer’s status is defined as
impaired. Individual provision charge (IPC)
Individual provision charge is the amount of expected credit losses on financial instruments assessed for impairment on an individual basis (as opposed to on a collective basis). It takes into account expected cash flows over the lives of those financial instruments.
Individually Assessed Provisions for Credit Impairment
Individually assessed provisions for credit impairment are calculated in accordance with AASB 9 Financial Instruments (AASB 9). They are assessed on a case-by-case basis for all individually managed impaired assets taking into consideration factors such as the realisable value of security (or other credit mitigants), the likely return available upon liquidation or bankruptcy, legal uncertainties, estimated costs involved in recovery, the market price of the exposure in secondary markets and the amount and timing of expected receipts and recoveries.
Market risk The risk to ANZ’s earnings arising from changes in interest rates, currency exchange
rates and credit spreads, or from fluctuations in bond, commodity or equity prices. ANZ has grouped market risk into two broad categories to facilitate the measurement, reporting and control of market risk:
Traded market risk - the risk of loss from changes in the value of financial
instruments due to movements in price factors for physical and derivative trading positions. Trading positions arise from transactions where ANZ acts as principal with clients or with the market.
Non-traded market risk (or balance sheet risk) - comprises interest rate risk in the
banking book and the risk to the AUD denominated value of ANZ’s capital and earnings due to foreign exchange rate movements.
ANZ Basel III Pillar 3 Disclosure June 2019
15
Operational risk The risk of loss resulting from inadequate or failed internal controls or from external
events, including legal risk but excluding reputation risk. Past due facilities Facilities where a contractual payment has not been met or the customer is outside of
contractual arrangements are deemed past due. Past due facilities include those operating in excess of approved arrangements or where scheduled repayments are outstanding but do not include impaired assets.
Qualifying Central Counterparties (QCCP)
QCCP is a central counterparty which is an entity that interposes itself between counterparties to derivative contracts. Trades with QCCP attract a more favorable risk weight calculation.
Recoveries Payments received and taken to profit for the current period for the amounts written
off in prior financial periods. Restructured items Restructured items comprise facilities in which the original contractual terms have
been modified for reasons related to the financial difficulties of the customer. Restructuring may consist of reduction of interest, principal or other payments legally due, or an extension in maturity materially beyond those typically offered to new facilities with similar risk.
Risk Weighted Assets (RWA) Assets (both on and off-balance sheet) are risk weighted according to each asset’s
inherent potential for default and what the likely losses would be in the case of default. In the case of non asset backed risks (i.e. market and operational risk), RWA is determined by multiplying the capital requirements for those risks by 12.5.
Securitisation risk The risk of credit related losses greater than expected due to a securitisation failing to
operate as anticipated, or of the values and risks accepted or transferred, not emerging as expected.
Write-Offs Facilities are written off against the related provision for impairment when they are
assessed as partially or fully uncollectable, and after proceeds from the realisation of any collateral have been received. Where individual provisions recognised in previous periods have subsequently decreased or are no longer required, such impairment losses are reversed in the current period income statement.

ANZ Basel III Pillar 3 Disclosure June 2019
16
This page has been intentionally left blank

ANZ Basel III Pillar 3 Disclosure June 2019
17