Embed Size (px)
Citation preview
Determined to offer strength in uncertain times.
Commonwealth Bank of Australia ACN 123 123 124
Basel II Pillar 3Capital Adequacy and Risk Disclosuresas at 30 June 2009
Table of Contents
1. Introduction ................................................................................................ 2
2. Basel II framework overview ........................................................................ 5
3. Scope of application .................................................................................... 6
4. Capital and risk weighted assets .................................................................. 7
Regulatory Capital ........................................................................................................................... 7 Risk Weighted Assets .................................................................................................................... 11
5. Integrated risk management ...................................................................... 13
Risk Governance ............................................................................................................................ 13 Risk Appetite ................................................................................................................................. 15 Stress Testing ................................................................................................................................ 18 Capital Management ..................................................................................................................... 19
6. Credit risk .................................................................................................. 21
Portfolios subject to standardised and supervisory risk-weights in the IRB approaches .............. 36 Portfolios subject to Internal Ratings Based approaches .............................................................. 37 Credit Risk Mitigation .................................................................................................................... 45 Counterparty Credit Risk ............................................................................................................... 48 Securitisation ................................................................................................................................. 49
7. Equity risk ................................................................................................. 59
8. Market risk ................................................................................................ 61
Traded Market Risk ....................................................................................................................... 62 Non-Traded Market Risk ............................................................................................................... 65
9. Operational risk ......................................................................................... 69
10. Appendices ............................................................................................... 72
Detailed Capital Disclosures .......................................................................................................... 72 List of APRA APS 330 Tables .......................................................................................................... 78 List of other tables and diagrams .................................................................................................. 79 Glossary ......................................................................................................................................... 80
For further information contact:
Investor Relations
Warwick Bryan
Phone: 02 9378 5130 Facsimile: 02 9378 3698
© Commonwealth Bank of Australia 2009 ABN 48 123 123 124
Page 2
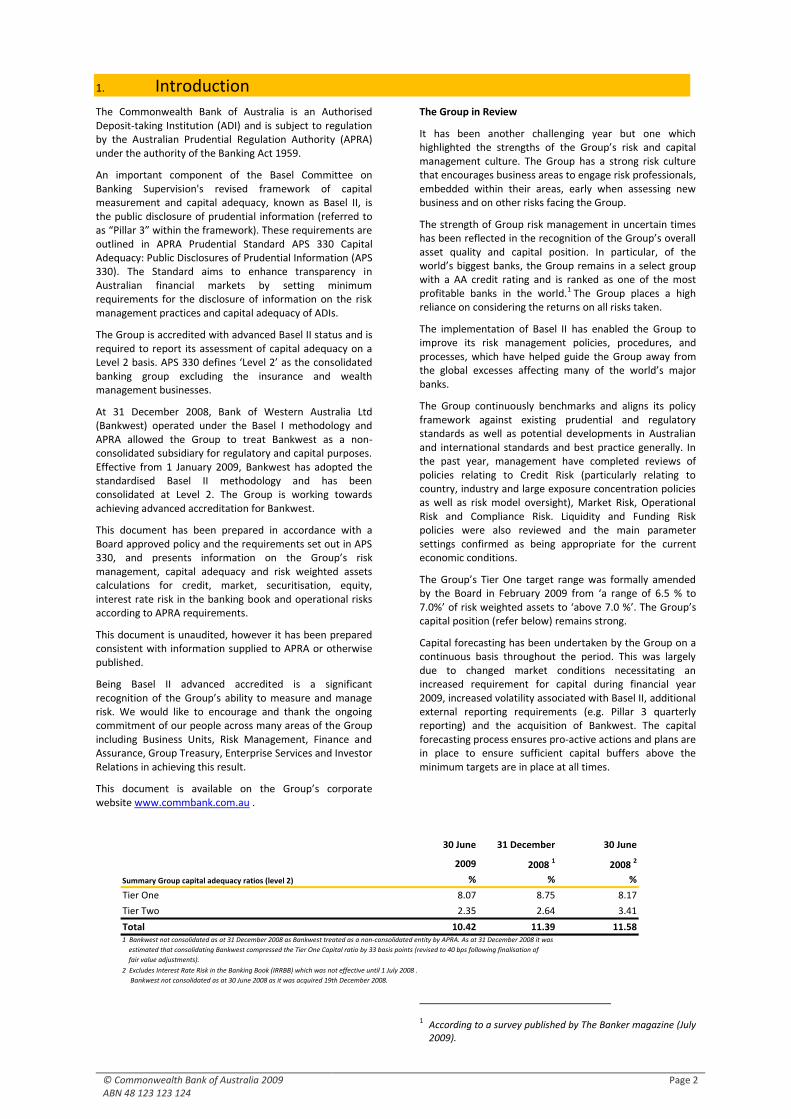
1. Introduction
The Commonwealth Bank of Australia is an Authorised Deposit-taking Institution (ADI) and is subject to regulation by the Australian Prudential Regulation Authority (APRA) under the authority of the Banking Act 1959.
An important component of the Basel Committee on Banking Supervision's revised framework of capital measurement and capital adequacy, known as Basel II, is the public disclosure of prudential information (referred to as “Pillar 3” within the framework). These requirements are outlined in APRA Prudential Standard APS 330 Capital Adequacy: Public Disclosures of Prudential Information (APS 330). The Standard aims to enhance transparency in Australian financial markets by setting minimum requirements for the disclosure of information on the risk management practices and capital adequacy of ADIs.
The Group is accredited with advanced Basel II status and is required to report its assessment of capital adequacy on a Level 2 basis. APS 330 defines ‘Level 2’ as the consolidated banking group excluding the insurance and wealth management businesses.
At 31 December 2008, Bank of Western Australia Ltd (Bankwest) operated under the Basel I methodology and APRA allowed the Group to treat Bankwest as a non-consolidated subsidiary for regulatory and capital purposes. Effective from 1 January 2009, Bankwest has adopted the standardised Basel II methodology and has been consolidated at Level 2. The Group is working towards achieving advanced accreditation for Bankwest.
This document has been prepared in accordance with a Board approved policy and the requirements set out in APS 330, and presents information on the Group’s risk management, capital adequacy and risk weighted assets calculations for credit, market, securitisation, equity, interest rate risk in the banking book and operational risks according to APRA requirements.
This document is unaudited, however it has been prepared consistent with information supplied to APRA or otherwise published.
Being Basel II advanced accredited is a significant recognition of the Group’s ability to measure and manage risk. We would like to encourage and thank the ongoing commitment of our people across many areas of the Group including Business Units, Risk Management, Finance and Assurance, Group Treasury, Enterprise Services and Investor Relations in achieving this result.
This document is available on the Group’s corporate website www.commbank.com.au .
The Group in Review
It has been another challenging year but one which highlighted the strengths of the Group’s risk and capital management culture. The Group has a strong risk culture that encourages business areas to engage risk professionals, embedded within their areas, early when assessing new business and on other risks facing the Group.
The strength of Group risk management in uncertain times has been reflected in the recognition of the Group’s overall asset quality and capital position. In particular, of the world’s biggest banks, the Group remains in a select group with a AA credit rating and is ranked as one of the most profitable banks in the world.1 The Group places a high reliance on considering the returns on all risks taken.
The implementation of Basel II has enabled the Group to improve its risk management policies, procedures, and processes, which have helped guide the Group away from the global excesses affecting many of the world’s major banks.
The Group continuously benchmarks and aligns its policy framework against existing prudential and regulatory standards as well as potential developments in Australian and international standards and best practice generally. In the past year, management have completed reviews of policies relating to Credit Risk (particularly relating to country, industry and large exposure concentration policies as well as risk model oversight), Market Risk, Operational Risk and Compliance Risk. Liquidity and Funding Risk policies were also reviewed and the main parameter settings confirmed as being appropriate for the current economic conditions.
The Group’s Tier One target range was formally amended by the Board in February 2009 from ‘a range of 6.5 % to 7.0%’ of risk weighted assets to ‘above 7.0 %’. The Group’s capital position (refer below) remains strong.
Capital forecasting has been undertaken by the Group on a continuous basis throughout the period. This was largely due to changed market conditions necessitating an increased requirement for capital during financial year 2009, increased volatility associated with Basel II, additional external reporting requirements (e.g. Pillar 3 quarterly reporting) and the acquisition of Bankwest. The capital forecasting process ensures pro-active actions and plans are in place to ensure sufficient capital buffers above the minimum targets are in place at all times.
1 According to a survey published by The Banker magazine (July 2009).
30 June 31 December 30 June
2009 2008 1 2008 2
% % %
Tier One 8.07 8.75 8.17
Tier Two 2.35 2.64 3.41
Total 10.42 11.39 11.58
Summary Group capital adequacy ratios (level 2)
1 Bankwest not consolidated as at 31 December 2008 as Bankwest treated as a non-consolidated entity by APRA. As at 31 December 2008 it was
estimated that consolidating Bankwest compressed the Tier One Capital ratio by 33 basis points (revised to 40 bps following finalisation of
fair value adjustments).
2 Excludes Interest Rate Risk in the Banking Book (IRRBB) which was not effective until 1 July 2008 .
Bankwest not consolidated as at 30 June 2008 as it was acquired 19th December 2008.

© Commonwealth Bank of Australia 2009 ABN 48 123 123 124
Page 3
The Group’s management of its capital adequacy is supported by robust capital management processes applied in each key subsidiary, including both regulatory and economic frameworks. The results from these key subsidiaries are integrated into the Group’s consolidated capital requirements, risk adjusted performance and pricing processes.
At a summary level, the focus on capital management within the Group’s subsidiaries has increased and they are all well capitalised and all robust with consideration of the cost of capital in all key decisions.
Market and Regulatory Environment Review
Over the last twelve months there have been significant market events globally. These have had a material influence on the Group’s capital management practices, including stress testing, target setting and capital raisings. The Group has maintained its objective of being well capitalised to handle market deterioration and the impacts of pro-cyclicality under Basel II. Further, the strength in the Group’s funding, liquidity and capital has allowed it to take advantage of opportunities, such as the acquisition of Bankwest.
During this time, investors and regulators internationally have been active in ensuring banks boost their level of capital. UK, Europe and USA experienced direct intervention by Governments. As a result, international peers have engaged in significant capital raisings, influencing the level and quality of capital required to be held in Australia as global uncertainty prevailed.
In Australia, the conservative nature of APRA’s regulations has meant that the four majors have been capital strong in comparison to their international peers (for example in the United Kingdom).
The introduction of Basel II during the global financial crisis has had an impact on capital levels. The pro-cyclical nature of the framework has meant increased risk weighted assets, and hence capital, as loans are re-rated in the face of a deteriorating environment. This has forced banks to raise capital at times when capital markets are expensive or inaccessible.
Pro-cyclicality under Basel II is caused, in part, by:
Deteriorating asset quality;
Lower asset values for assets marked to market;
Rating agency and internal ratings downgrades;
More conservative capital and lending practices;
Increased market volatility; and
Loss correlations increasing, which reduce portfolio effects that offset higher capital requirements in normal times.
Capital requirements are developed by simultaneously considering the regulatory capital requirements, rating agency views on what capital the Group needs to maintain its AA credit rating, the market response to capital, stress testing and the Group’s bottom-up view of economic capital. This process cascades these views into considerations on capital allocation.
Latest advice from regulators globally is that the Basel II process requires review, with the possible outcome that banks might be asked to hold more capital in better times so as to allow the use of this capital as the economy worsens. This possible change would influence the minimum amount of capital held by banks.
Other changes and proposals affecting the banking regulatory capital framework over the past year include:
The introduction by APRA of requirements for capital for Interest Rate Risk in the Banking Book (IRRBB);
Proposed revisions to the Basel Framework for market risk, securitisation, firm-wide risk oversight and the management of risk concentrations;
Proposed revisions to APRA’s Governance standard to introduce new requirements for employee remuneration, including a Board Remuneration Committee and a Remuneration Policy; and
Sound practices guidelines for stress testing and liquidity management.
© Commonwealth Bank of Australia 2009 ABN 48 123 123 124
Page 4
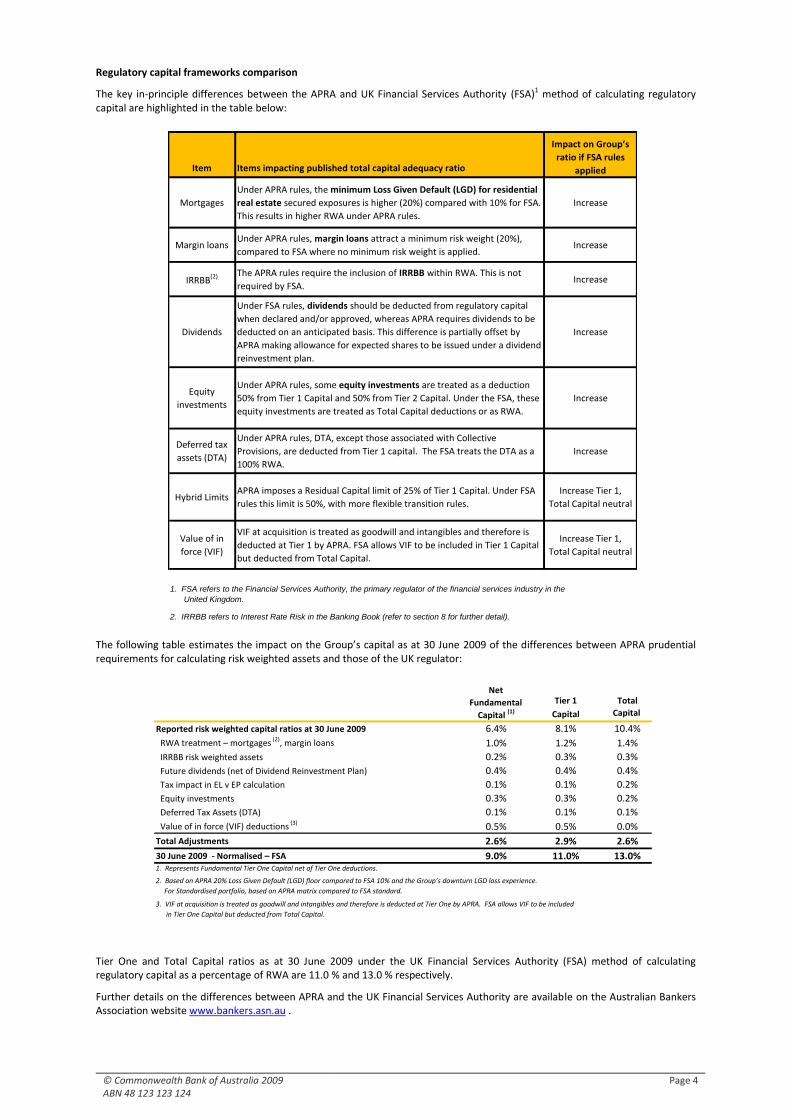
Regulatory capital frameworks comparison
The key in-principle differences between the APRA and UK Financial Services Authority (FSA)1 method of calculating regulatory capital are highlighted in the table below:
The following table estimates the impact on the Group’s capital as at 30 June 2009 of the differences between APRA prudential requirements for calculating risk weighted assets and those of the UK regulator:
Tier One and Total Capital ratios as at 30 June 2009 under the UK Financial Services Authority (FSA) method of calculating regulatory capital as a percentage of RWA are 11.0 % and 13.0 % respectively.
Further details on the differences between APRA and the UK Financial Services Authority are available on the Australian Bankers Association website www.bankers.asn.au .
Net
Fundamental Tier 1 Total
Capital (1) Capital Capital
Reported risk weighted capital ratios at 30 June 2009 6.4% 8.1% 10.4%
RWA treatment – mortgages (2), margin loans 1.0% 1.2% 1.4%
IRRBB risk weighted assets 0.2% 0.3% 0.3%
Future dividends (net of Dividend Reinvestment Plan) 0.4% 0.4% 0.4%
Tax impact in EL v EP calculation 0.1% 0.1% 0.2%
Equity investments 0.3% 0.3% 0.2%
Deferred Tax Assets (DTA) 0.1% 0.1% 0.1%
Value of in force (VIF) deductions (3) 0.5% 0.5% 0.0%
Total Adjustments 2.6% 2.9% 2.6%
30 June 2009 - Normalised – FSA 9.0% 11.0% 13.0%1. Represents Fundamental Tier One Capital net of Tier One deductions.
2. Based on APRA 20% Loss Given Default (LGD) floor compared to FSA 10% and the Group’s downturn LGD loss experience.
For Standardised portfolio, based on APRA matrix compared to FSA standard.
3. VIF at acquisition is treated as goodwill and intangibles and therefore is deducted at Tier One by APRA. FSA allows VIF to be included
in Tier One Capital but deducted from Total Capital.
Item Items impacting published total capital adequacy ratio
Mortgages
Under APRA rules, the minimum Loss Given Default (LGD) for residential
real estate secured exposures is higher (20%) compared with 10% for FSA.
This results in higher RWA under APRA rules.
Increase
Margin loansUnder APRA rules, margin loans attract a minimum risk weight (20%),
compared to FSA where no minimum risk weight is applied.Increase
IRRBB(2) The APRA rules require the inclusion of IRRBB within RWA. This is not
required by FSA.Increase
Dividends
Under FSA rules, dividends should be deducted from regulatory capital
when declared and/or approved, whereas APRA requires dividends to be
deducted on an anticipated basis. This difference is partially offset by
APRA making allowance for expected shares to be issued under a dividend
reinvestment plan.
Increase
Equity
investments
Under APRA rules, some equity investments are treated as a deduction
50% from Tier 1 Capital and 50% from Tier 2 Capital. Under the FSA, these
equity investments are treated as Total Capital deductions or as RWA.
Increase
Deferred tax
assets (DTA)
Under APRA rules, DTA, except those associated with Collective
Provisions, are deducted from Tier 1 capital. The FSA treats the DTA as a
100% RWA.
Increase
Hybrid LimitsAPRA imposes a Residual Capital limit of 25% of Tier 1 Capital. Under FSA
rules this limit is 50%, with more flexible transition rules.
Increase Tier 1,
Total Capital neutral
Value of in
force (VIF)
VIF at acquisition is treated as goodwill and intangibles and therefore is
deducted at Tier 1 by APRA. FSA allows VIF to be included in Tier 1 Capital
but deducted from Total Capital.
Increase Tier 1,
Total Capital neutral
Impact on Group’s
ratio if FSA rules
applied
1. FSA refers to the Financial Services Authority, the primary regulator of the financial services industry in the
United Kingdom.
2. IRRBB refers to Interest Rate Risk in the Banking Book (refer to section 8 for further detail).
© Commonwealth Bank of Australia 2009 ABN 48 123 123 124
Page 5
2. Basel II framework overview
APRA adopts a tiered approach to the measurement of an ADIs capital adequacy:
Level 1 the Bank and APRA approved Extended Licensed Entities (ELE);
Level 2 the Banking Group; and
Level 3 the conglomerate group including the Group’s insurance and wealth management businesses (the Group).
The Group is required to report the calculation of risk weighted assets (RWA) and assessment of capital adequacy on a Level 2 basis (refer section 3 for further details on the scope of application).
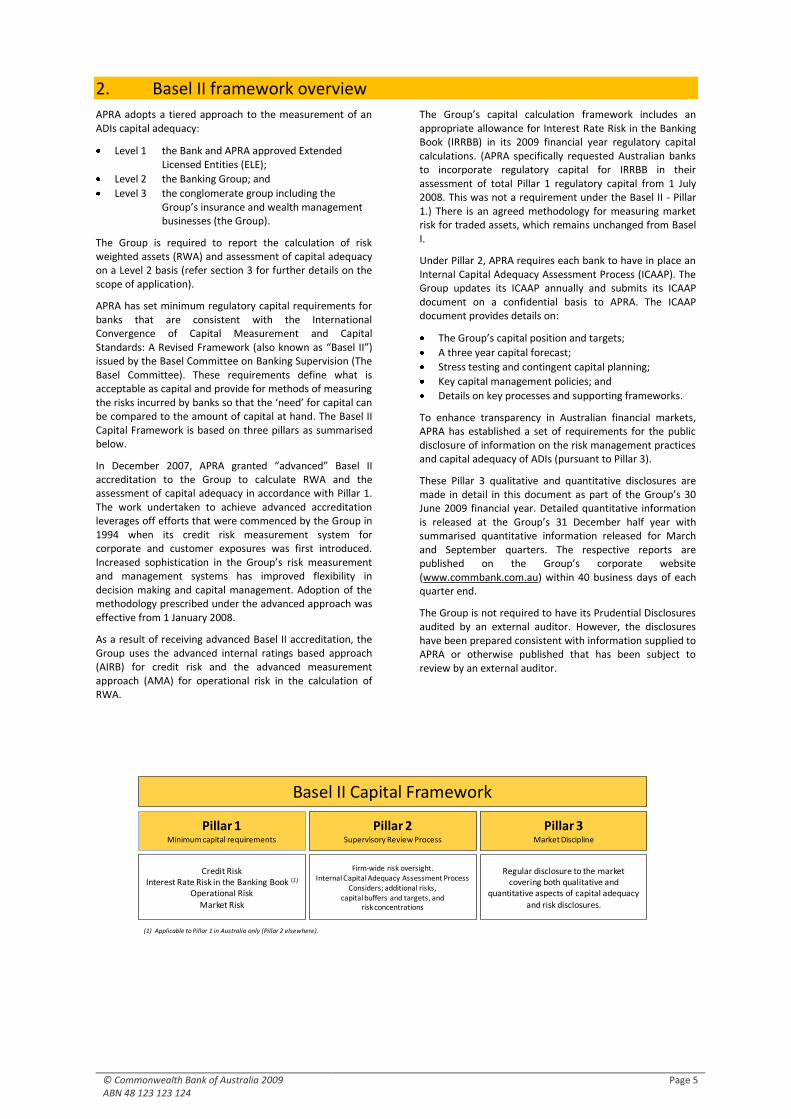
APRA has set minimum regulatory capital requirements for banks that are consistent with the International Convergence of Capital Measurement and Capital Standards: A Revised Framework (also known as “Basel II”) issued by the Basel Committee on Banking Supervision (The Basel Committee). These requirements define what is acceptable as capital and provide for methods of measuring the risks incurred by banks so that the ‘need’ for capital can be compared to the amount of capital at hand. The Basel II Capital Framework is based on three pillars as summarised below.
In December 2007, APRA granted “advanced” Basel II accreditation to the Group to calculate RWA and the assessment of capital adequacy in accordance with Pillar 1. The work undertaken to achieve advanced accreditation leverages off efforts that were commenced by the Group in 1994 when its credit risk measurement system for corporate and customer exposures was first introduced. Increased sophistication in the Group’s risk measurement and management systems has improved flexibility in decision making and capital management. Adoption of the methodology prescribed under the advanced approach was effective from 1 January 2008.
As a result of receiving advanced Basel II accreditation, the Group uses the advanced internal ratings based approach (AIRB) for credit risk and the advanced measurement approach (AMA) for operational risk in the calculation of RWA.
The Group’s capital calculation framework includes an appropriate allowance for Interest Rate Risk in the Banking Book (IRRBB) in its 2009 financial year regulatory capital calculations. (APRA specifically requested Australian banks to incorporate regulatory capital for IRRBB in their assessment of total Pillar 1 regulatory capital from 1 July 2008. This was not a requirement under the Basel II - Pillar 1.) There is an agreed methodology for measuring market risk for traded assets, which remains unchanged from Basel I.
Under Pillar 2, APRA requires each bank to have in place an Internal Capital Adequacy Assessment Process (ICAAP). The Group updates its ICAAP annually and submits its ICAAP document on a confidential basis to APRA. The ICAAP document provides details on:
The Group’s capital position and targets;
A three year capital forecast;
Stress testing and contingent capital planning;
Key capital management policies; and
Details on key processes and supporting frameworks.
To enhance transparency in Australian financial markets, APRA has established a set of requirements for the public disclosure of information on the risk management practices and capital adequacy of ADIs (pursuant to Pillar 3).
These Pillar 3 qualitative and quantitative disclosures are made in detail in this document as part of the Group’s 30 June 2009 financial year. Detailed quantitative information is released at the Group’s 31 December half year with summarised quantitative information released for March and September quarters. The respective reports are published on the Group’s corporate website (www.commbank.com.au) within 40 business days of each quarter end.
The Group is not required to have its Prudential Disclosures audited by an external auditor. However, the disclosures have been prepared consistent with information supplied to APRA or otherwise published that has been subject to review by an external auditor.
Basel II Capital Framework
Pillar 1Minimum capital requirements
Pillar 2Supervisory Review Process
Credit RiskInterest Rate Risk in the Banking Book (1)
Operational RiskMarket Risk
Pillar 3Market Discipline
Firm-wide risk oversight.Internal Capital Adequacy Assessment Process
Considers; additional risks,capital buffers and targets, and
risk concentrations
Regular disclosure to the market covering both qualitative and
quantitative aspects of capital adequacy and risk disclosures.
(1) Applicable to Pillar 1 in Australia only (Pillar 2 elsewhere).
© Commonwealth Bank of Australia 2009 ABN 48 123 123 124
Page 6
3. Scope of application
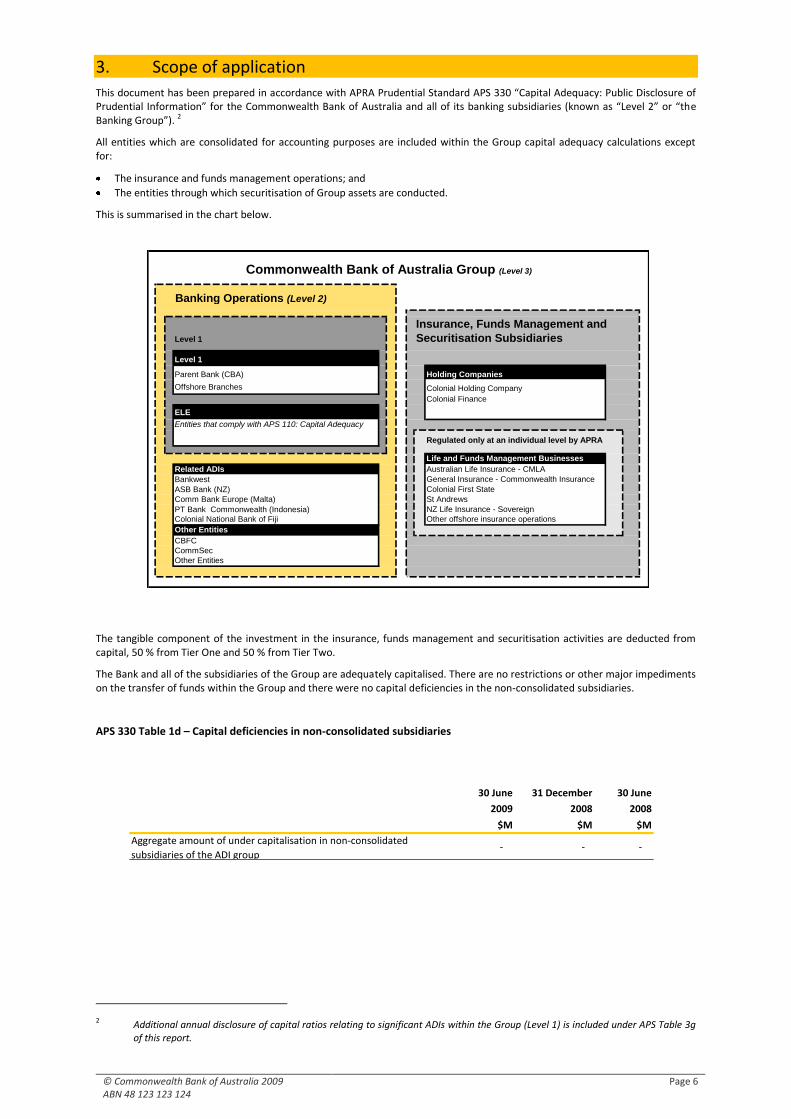
This document has been prepared in accordance with APRA Prudential Standard APS 330 “Capital Adequacy: Public Disclosure of Prudential Information” for the Commonwealth Bank of Australia and all of its banking subsidiaries (known as “Level 2” or “the Banking Group”). 2
All entities which are consolidated for accounting purposes are included within the Group capital adequacy calculations except for:
The insurance and funds management operations; and
The entities through which securitisation of Group assets are conducted.
This is summarised in the chart below.
The tangible component of the investment in the insurance, funds management and securitisation activities are deducted from capital, 50 % from Tier One and 50 % from Tier Two.
The Bank and all of the subsidiaries of the Group are adequately capitalised. There are no restrictions or other major impediments on the transfer of funds within the Group and there were no capital deficiencies in the non-consolidated subsidiaries.
APS 330 Table 1d – Capital deficiencies in non-consolidated subsidiaries
2 Additional annual disclosure of capital ratios relating to significant ADIs within the Group (Level 1) is included under APS Table 3g of this report.
Banking Operations (Level 2)
Insurance, Funds Management and
Level 1 Securitisation Subsidiaries
Level 1
Parent Bank (CBA) Holding Companies
Offshore Branches Colonial Holding Company
Colonial Finance
ELE
Entities that comply with APS 110: Capital Adequacy
Regulated only at an individual level by APRA
Life and Funds Management Businesses
Related ADIs Australian Life Insurance - CMLA
Bankwest General Insurance - Commonwealth Insurance
ASB Bank (NZ) Colonial First State
Comm Bank Europe (Malta) St Andrews
PT Bank Commonwealth (Indonesia) NZ Life Insurance - Sovereign
Colonial National Bank of Fiji Other offshore insurance operations
Other Entities
CBFC
CommSec
Other Entities
Commonwealth Bank of Australia Group (Level 3)
30 June 31 December 30 June
2009 2008 2008
$M $M $M
Aggregate amount of under capitalisation in non-consolidated
subsidiaries of the ADI group - - -
© Commonwealth Bank of Australia 2009 ABN 48 123 123 124
Page 7
4. Capital and risk weighted assets
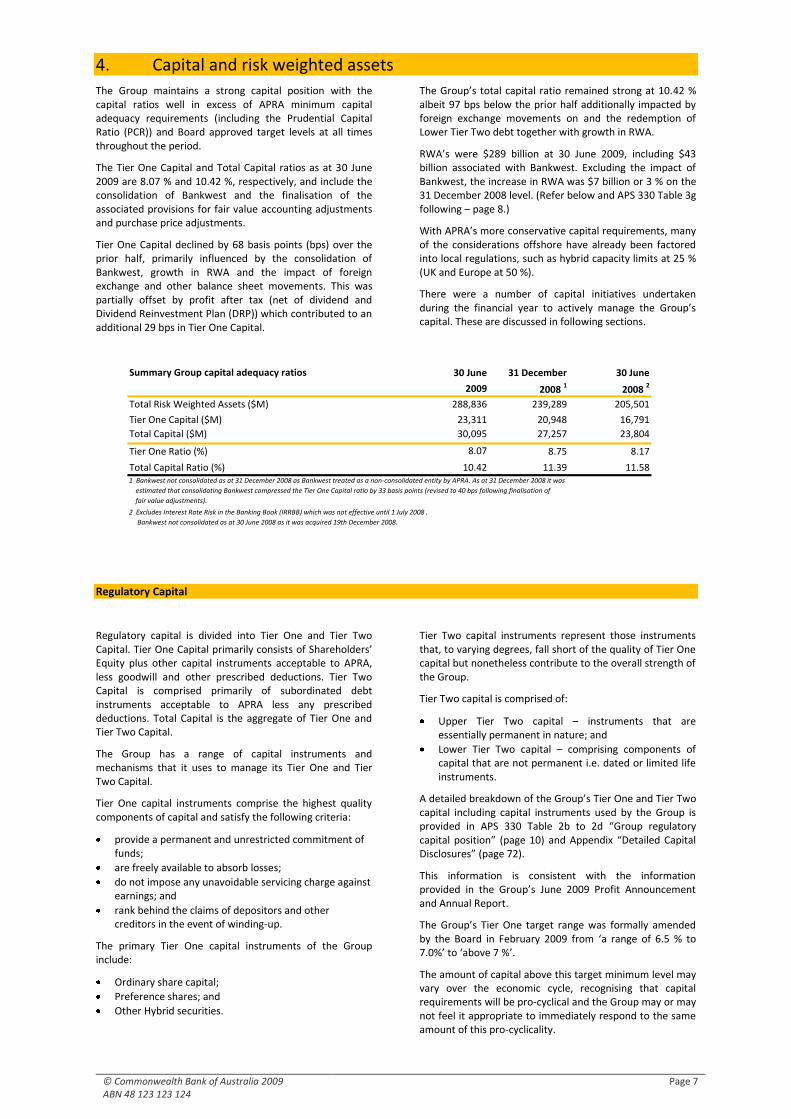
The Group maintains a strong capital position with the capital ratios well in excess of APRA minimum capital adequacy requirements (including the Prudential Capital Ratio (PCR)) and Board approved target levels at all times throughout the period.
The Tier One Capital and Total Capital ratios as at 30 June 2009 are 8.07 % and 10.42 %, respectively, and include the consolidation of Bankwest and the finalisation of the associated provisions for fair value accounting adjustments and purchase price adjustments.
Tier One Capital declined by 68 basis points (bps) over the prior half, primarily influenced by the consolidation of Bankwest, growth in RWA and the impact of foreign exchange and other balance sheet movements. This was partially offset by profit after tax (net of dividend and Dividend Reinvestment Plan (DRP)) which contributed to an additional 29 bps in Tier One Capital.
The Group’s total capital ratio remained strong at 10.42 % albeit 97 bps below the prior half additionally impacted by foreign exchange movements on and the redemption of Lower Tier Two debt together with growth in RWA.
RWA’s were $289 billion at 30 June 2009, including $43 billion associated with Bankwest. Excluding the impact of Bankwest, the increase in RWA was $7 billion or 3 % on the 31 December 2008 level. (Refer below and APS 330 Table 3g following – page 8.)
With APRA’s more conservative capital requirements, many of the considerations offshore have already been factored into local regulations, such as hybrid capacity limits at 25 % (UK and Europe at 50 %).
There were a number of capital initiatives undertaken during the financial year to actively manage the Group’s capital. These are discussed in following sections.
Regulatory Capital
Regulatory capital is divided into Tier One and Tier Two Capital. Tier One Capital primarily consists of Shareholders’ Equity plus other capital instruments acceptable to APRA, less goodwill and other prescribed deductions. Tier Two Capital is comprised primarily of subordinated debt instruments acceptable to APRA less any prescribed deductions. Total Capital is the aggregate of Tier One and Tier Two Capital.
The Group has a range of capital instruments and mechanisms that it uses to manage its Tier One and Tier Two Capital.
Tier One capital instruments comprise the highest quality components of capital and satisfy the following criteria:
provide a permanent and unrestricted commitment of funds;
are freely available to absorb losses;
do not impose any unavoidable servicing charge against earnings; and
rank behind the claims of depositors and other creditors in the event of winding-up.
The primary Tier One capital instruments of the Group include:
Ordinary share capital;
Preference shares; and
Other Hybrid securities.
Tier Two capital instruments represent those instruments that, to varying degrees, fall short of the quality of Tier One capital but nonetheless contribute to the overall strength of the Group.
Tier Two capital is comprised of:
Upper Tier Two capital – instruments that are essentially permanent in nature; and
Lower Tier Two capital – comprising components of capital that are not permanent i.e. dated or limited life instruments.
A detailed breakdown of the Group’s Tier One and Tier Two capital including capital instruments used by the Group is provided in APS 330 Table 2b to 2d “Group regulatory capital position” (page 10) and Appendix “Detailed Capital Disclosures” (page 72).
This information is consistent with the information provided in the Group’s June 2009 Profit Announcement and Annual Report.
The Group’s Tier One target range was formally amended by the Board in February 2009 from ‘a range of 6.5 % to 7.0%’ to ‘above 7 %’.
The amount of capital above this target minimum level may vary over the economic cycle, recognising that capital requirements will be pro-cyclical and the Group may or may not feel it appropriate to immediately respond to the same amount of this pro-cyclicality.
Summary Group capital adequacy ratios 30 June 31 December 30 June
2009 2008 1 2008 2
Total Risk Weighted Assets ($M) 288,836 239,289 205,501
Tier One Capital ($M) 23,311 20,948 16,791
Total Capital ($M) 30,095 27,257 23,804
Tier One Ratio (%) 8.07 8.75 8.17
Total Capital Ratio (%) 10.42 11.39 11.58
2 Excludes Interest Rate Risk in the Banking Book (IRRBB) which was not effective until 1 July 2008 .
Bankwest not consolidated as at 30 June 2008 as it was acquired 19th December 2008.
1 Bankwest not consolidated as at 31 December 2008 as Bankwest treated as a non-consolidated entity by APRA. As at 31 December 2008 it was
estimated that consolidating Bankwest compressed the Tier One Capital ratio by 33 basis points (revised to 40 bps following finalisation of
fair value adjustments).
© Commonwealth Bank of Australia 2009 ABN 48 123 123 124
Page 8
Due to a number of differences between accounting and regulatory capital, a reconciliation of the key items has been provided in Appendix “Detailed Capital Disclosures”.
Capital adequacy
The Group actively manages its capital to balance the requirements of various stakeholders (regulators, rating agencies, depositors and shareholders). This is achieved by optimising the mix of capital while maintaining adequate capital ratios throughout the financial year.
The Group has a range of instruments and methodologies available to effectively manage capital including share issues and buybacks, dividend and dividend reinvestment plan policies, hybrid capital raising and dated and undated subordinated debt issues. All major capital-related initiatives require approval by the Board.
The Group’s capital positions are monitored on a continuous basis and reported monthly to the Asset and Liability Committee of the Group and the Risk Committee of the Board. Three-year capital forecasts are conducted on a quarterly basis and a detailed capital and strategy plan is presented to the Board annually.
Capital adequacy is measured by means of a risk based capital ratio. The capital ratios reflect capital (Tier One, Tier Two and Total Capital) as a percentage of total RWA. RWA represent an allocation of risks associated with the Group’s assets and other related exposures.
The Group operates under Basel II Advanced Internal Ratings Based (AIRB) approach for credit risk and the Advanced Measurement Approach (AMA) for operational risk being adopted in the calculation of RWA effective from 1 January 2008. Interest Rate Risk in the Banking Book (IRRBB) was incorporated into the calculation of RWA from 1 July 2008. The agreed methodology for measuring market risk for traded assets remained unchanged from Basel I.
The Group is required to inform APRA immediately of any breach or potential breach of its minimum capital adequacy requirements, including details of remedial action taken or planned to be taken. Throughout the 2009 financial year, the Group’s capital ratios were in compliance with both APRA minimum capital adequacy requirements and the Board Approved Target Ranges.
In August 2008, APRA advised the Group of its Prudential Capital Ratio (PCR). The PCR was effective from 31 July 2008 and represents the regulatory minimum Tier One and Total
Capital ratios that the Group is required to maintain at all times. In order to ensure there is no breach of these minimum levels, APRA expects the Group to maintain a prudent buffer over these prescribed minimum levels. The PCR is subject to an on-going review by APRA and will be formally reassessed on an annual basis. While APRA have advised that the PCR not be publicly disclosed under any circumstances, the Group maintained its actual capital ratios well above its PCR at all times during the 2009 financial year.
Capital Initiatives
The following significant initiatives were undertaken during the financial year to actively manage the Group’s capital:
• Issue of $694 million ordinary shares in October 2008 to satisfy the Dividend Reinvestment Plan (DRP) in respect of the final dividend for 2007/08;
• Issue of $2 billion ordinary shares in October 2008, via a share placement, to fund the acquisition of Bankwest and St Andrew’s (52.6 million shares at $38.00 per share);
• The issue of $2 billion ordinary shares through the following share placements in December 2008; $357 million at a weighted average price of $28.37 per share and a further $1.65 billion in shares at $26.00 per share;
• Issue of $405 million ordinary shares in March 2009 to satisfy the DRP in respect of the interim dividend for 2008/09; and
• Issue of $865 million ordinary shares in March 2009 with respect to the Share Purchase Plan (33.3 million shares at $26.00 per share).
The PERLS II securities ($750m) were redeemed in March 2009, funded from proceeds of the December 2008 share placement.
Tier Two capital initiatives were:
Issue of $500 million of subordinated Lower Tier Two debt in September 2008; offset by
$500 million of subordinated Lower Tier Two debt redeemed in February 2009.
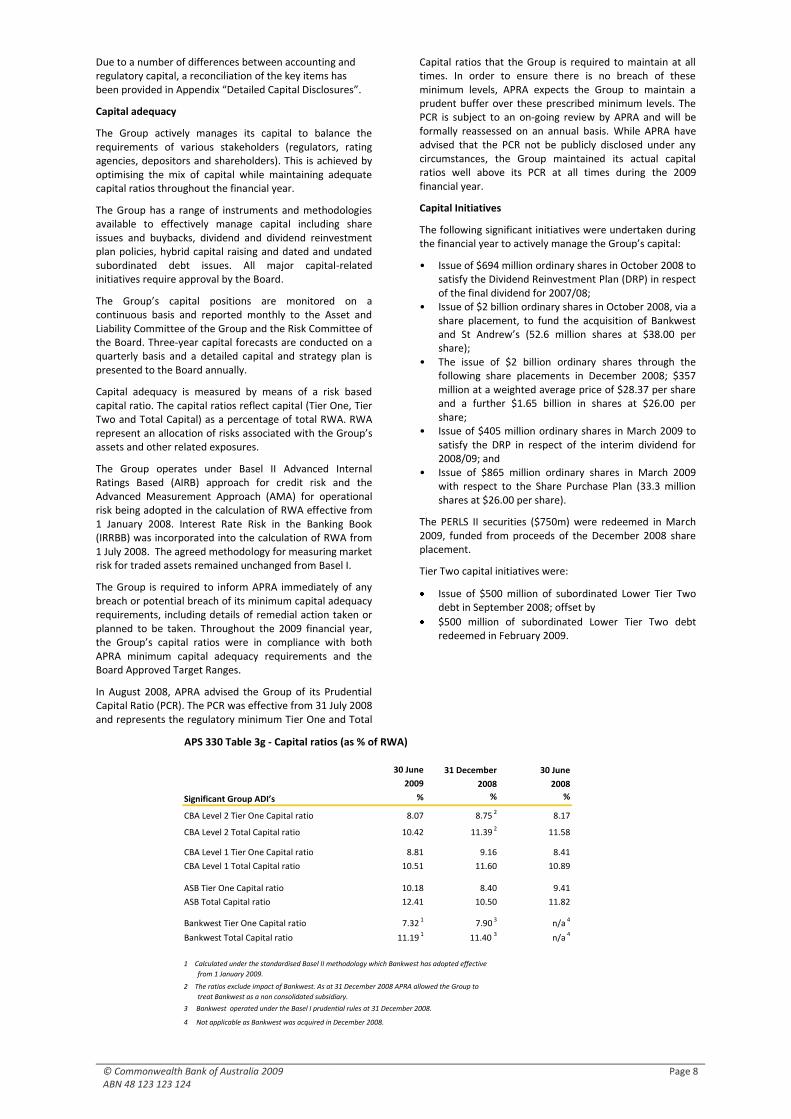
30 June 31 December 30 June
2009 2008 2008
% % %
CBA Level 2 Tier One Capital ratio 8.07 8.75 2 8.17
CBA Level 2 Total Capital ratio 10.42 11.39 2 11.58
CBA Level 1 Tier One Capital ratio 8.81 9.16 8.41
CBA Level 1 Total Capital ratio 10.51 11.60 10.89
ASB Tier One Capital ratio 10.18 8.40 9.41
ASB Total Capital ratio 12.41 10.50 11.82
Bankwest Tier One Capital ratio 7.32 1 7.90 3 n/a 4
Bankwest Total Capital ratio 11.19 1 11.40 3 n/a 4
Significant Group ADI’s
1 Calculated under the standardised Basel II methodology which Bankwest has adopted effective
from 1 January 2009.
2 The ratios exclude impact of Bankwest. As at 31 December 2008 APRA allowed the Group to
treat Bankwest as a non consolidated subsidiary.
3 Bankwest operated under the Basel I prudential rules at 31 December 2008.
4 Not applicable as Bankwest was acquired in December 2008.
APS 330 Table 3g - Capital ratios (as % of RWA)
© Commonwealth Bank of Australia 2009 ABN 48 123 123 124
Page 9
Regulatory Capital Requirements for Other Significant ADIs in the Group
ASB Bank Limited
ASB Bank Limited (ASB Bank) is subject to regulation by the Reserve Bank of New Zealand (RBNZ). The RBNZ applies a similar methodology to APRA in calculating regulatory capital requirements. ASB Bank operates under advanced Basel II status.
At 30 June 2009 ASB Bank had a Tier One ratio of 10.18 % and a Total Capital ratio of 12.41 %.
ASB Bank was in compliance with regulatory capital requirements at all times throughout the current financial year.
Bank of Western Australia Limited (Bankwest)
On 19 December 2008, the Group acquired Bankwest and St Andrew’s Australia Pty Limited (St Andrew’s) for $2.1 billion, funded through a $2 billion share placement. At 31 December 2008, APRA allowed the Group to treat Bankwest as a non consolidated subsidiary. Effective from 1 January 2009, Bankwest has been consolidated for regulatory capital purposes.
Bankwest operates as a separate ADI and is separately regulated by APRA. Bankwest operated under the existing Basel I prudential rules at 31 December 2008 and has adopted the standardised Basel II methodology effective from January 2009. Bankwest is in the process of seeking advanced accreditation from APRA.
Bankwest’s capital ratios, as at 30 June 2009, are in excess of both APRA minimum requirements and board approved targeted levels. The Tier One ratio is 7.32 % and Total Capital 11.19 %.
The St Andrew’s operations, which include life insurance, general insurance and funds management businesses, are treated as non consolidated subsidiaries for regulatory reporting purposes. Its life and general insurance entities are separately regulated by APRA.
Insurance and Funds Management Business
The Group’s life insurance business in Australia is regulated by APRA. The Life Insurance Act 1995 includes a two tiered framework for the calculation of regulatory capital requirements for life insurance companies – “solvency” and “capital adequacy”. The capital adequacy test for statutory funds is always equal to or greater than the solvency test. The shareholders’ fund is subject to a separate capital requirement.
There are no regulatory capital requirements for life insurance companies in New Zealand, though the directors of any Company must certify its solvency under the Companies Act 1993. The Group determines the minimum capital requirements for its New Zealand life insurance business according to the professional standard “Solvency Reserving for Life Insurers”, issued by the New Zealand Society of Actuaries.
The Group’s general insurance businesses are regulated by APRA under the Insurance Act 1973. The Group determines capital requirements for general insurance businesses in accordance with APRA Prudential Standards.
Fund managers in Australia are subject to ‘Responsible Entity’ regulation by the Australian Securities and Investment Commission (ASIC). The regulatory capital requirements vary depending on the type of Australian Financial Services licence or Authorised Representatives’ Licence held, but a requirement of up to $5 million of net tangible assets applies.
APRA supervises approved trustees of superannuation funds and requires them to maintain net tangible assets of at least $5 million. These requirements are not cumulative where an entity is both an approved trustee for superannuation purposes and a responsible entity.
The Group’s insurance and funds management companies held assets in excess of regulatory capital requirements at 30 June 2009. The Group’s Australian and New Zealand insurance and funds management businesses held $1,036 million of assets in excess of regulatory solvency requirements at 30 June 2009 (30 June 2008: $949 million).
© Commonwealth Bank of Australia 2009 ABN 48 123 123 124
Page 10
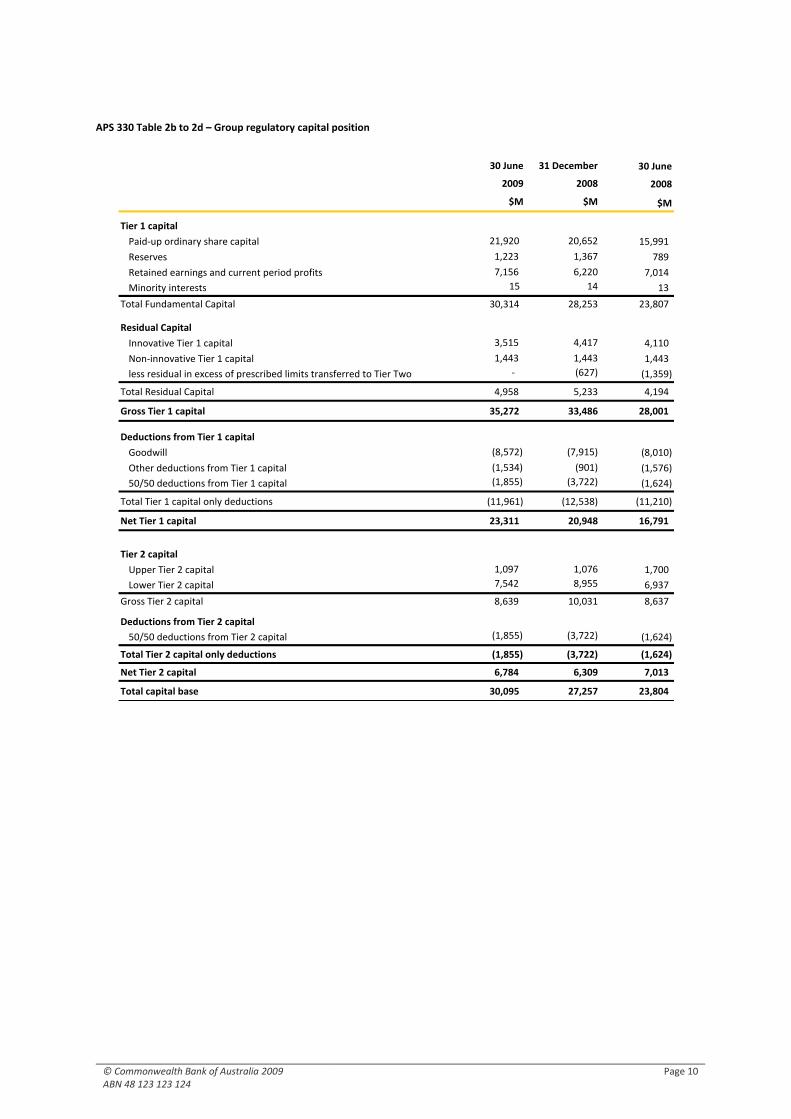
APS 330 Table 2b to 2d – Group regulatory capital position
30 June 31 December 30 June
2009 2008 2008
$M $M $M
Tier 1 capital
Paid-up ordinary share capital 21,920 20,652 15,991
Reserves 1,223 1,367 789
Retained earnings and current period profits 7,156 6,220 7,014
Minority interests 15 14 13
Total Fundamental Capital 30,314 28,253 23,807
Residual Capital
Innovative Tier 1 capital 3,515 4,417 4,110
Non-innovative Tier 1 capital 1,443 1,443 1,443
less residual in excess of prescribed limits transferred to Tier Two - (627) (1,359)
Total Residual Capital 4,958 5,233 4,194
Gross Tier 1 capital 35,272 33,486 28,001
Deductions from Tier 1 capital
Goodwill (8,572) (7,915) (8,010)
Other deductions from Tier 1 capital (1,534) (901) (1,576)
50/50 deductions from Tier 1 capital (1,855) (3,722) (1,624)
Total Tier 1 capital only deductions (11,961) (12,538) (11,210)
Net Tier 1 capital 23,311 20,948 16,791
Tier 2 capital
Upper Tier 2 capital 1,097 1,076 1,700
Lower Tier 2 capital 7,542 8,955 6,937
Gross Tier 2 capital 8,639 10,031 8,637
Deductions from Tier 2 capital
50/50 deductions from Tier 2 capital (1,855) (3,722) (1,624)
Total Tier 2 capital only deductions (1,855) (3,722) (1,624)
Net Tier 2 capital 6,784 6,309 7,013
Total capital base 30,095 27,257 23,804
© Commonwealth Bank of Australia 2009 ABN 48 123 123 124
Page 11
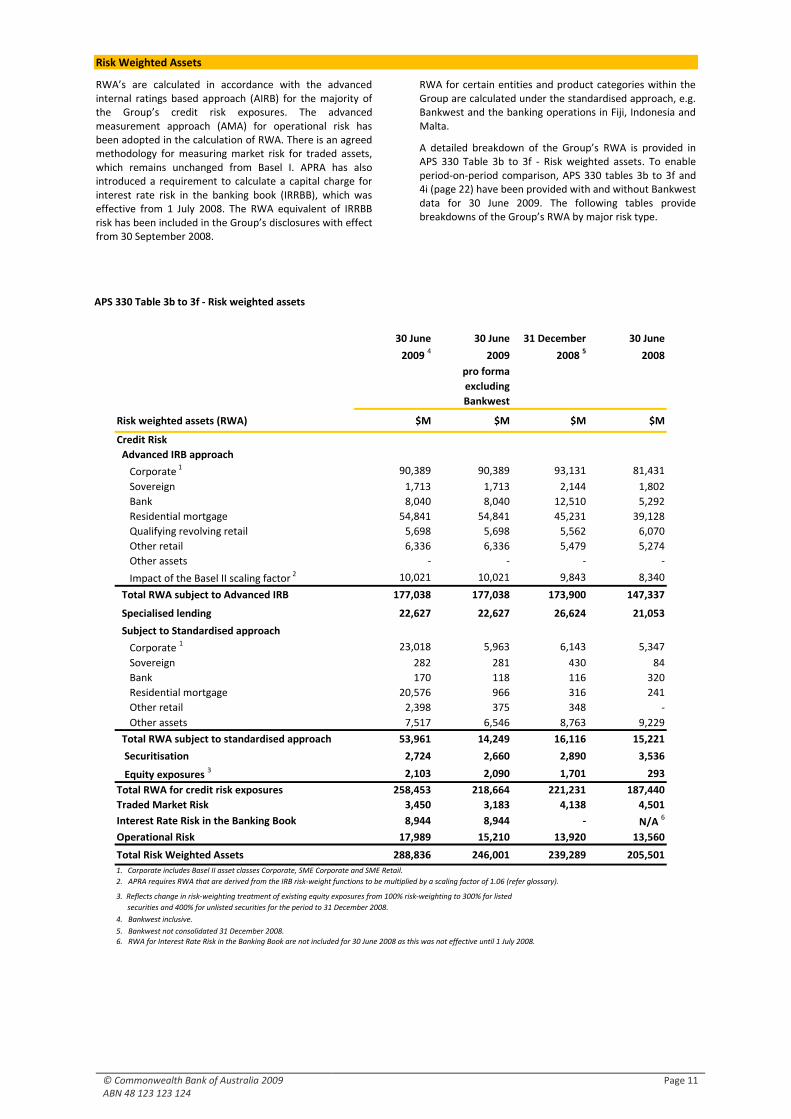
Risk Weighted Assets
RWA’s are calculated in accordance with the advanced internal ratings based approach (AIRB) for the majority of the Group’s credit risk exposures. The advanced measurement approach (AMA) for operational risk has been adopted in the calculation of RWA. There is an agreed methodology for measuring market risk for traded assets, which remains unchanged from Basel I. APRA has also introduced a requirement to calculate a capital charge for interest rate risk in the banking book (IRRBB), which was effective from 1 July 2008. The RWA equivalent of IRRBB risk has been included in the Group’s disclosures with effect from 30 September 2008.
RWA for certain entities and product categories within the Group are calculated under the standardised approach, e.g. Bankwest and the banking operations in Fiji, Indonesia and Malta.
A detailed breakdown of the Group’s RWA is provided in APS 330 Table 3b to 3f - Risk weighted assets. To enable period-on-period comparison, APS 330 tables 3b to 3f and 4i (page 22) have been provided with and without Bankwest data for 30 June 2009. The following tables provide breakdowns of the Group’s RWA by major risk type.
APS 330 Table 3b to 3f - Risk weighted assets
30 June 30 June 31 December 30 June
2009 4
2009 2008 5
2008
pro forma
excluding
Bankwest
Risk weighted assets (RWA) $M $M $M $M
Credit Risk
Advanced IRB approach
Corporate 1 90,389 90,389 93,131 81,431
Sovereign 1,713 1,713 2,144 1,802
Bank 8,040 8,040 12,510 5,292
Residential mortgage 54,841 54,841 45,231 39,128
Qualifying revolving retail 5,698 5,698 5,562 6,070
Other retail 6,336 6,336 5,479 5,274
Other assets - - - -
Impact of the Basel II scaling factor 2 10,021 10,021 9,843 8,340
Total RWA subject to Advanced IRB 177,038 177,038 173,900 147,337
Specialised lending 22,627 22,627 26,624 21,053
Subject to Standardised approach
Corporate 1 23,018 5,963 6,143 5,347
Sovereign 282 281 430 84
Bank 170 118 116 320
Residential mortgage 20,576 966 316 241
Other retail 2,398 375 348 -
Other assets 7,517 6,546 8,763 9,229
Total RWA subject to standardised approach 53,961 14,249 16,116 15,221
Securitisation 2,724 2,660 2,890 3,536
Equity exposures 3 2,103 2,090 1,701 293
Total RWA for credit risk exposures 258,453 218,664 221,231 187,440
Traded Market Risk 3,450 3,183 4,138 4,501
Interest Rate Risk in the Banking Book 8,944 8,944 - N/A 6
Operational Risk 17,989 15,210 13,920 13,560
Total Risk Weighted Assets 288,836 246,001 239,289 205,501
1. Corporate includes Basel II asset classes Corporate, SME Corporate and SME Retail.
2. APRA requires RWA that are derived from the IRB risk-weight functions to be multiplied by a scaling factor of 1.06 (refer glossary).
3. Reflects change in risk-weighting treatment of existing equity exposures from 100% risk-weighting to 300% for listed
securities and 400% for unlisted securities for the period to 31 December 2008.
4. Bankwest inclusive.
5. Bankwest not consolidated 31 December 2008.
6. RWA for Interest Rate Risk in the Banking Book are not included for 30 June 2008 as this was not effective until 1 July 2008.
© Commonwealth Bank of Australia 2009 ABN 48 123 123 124
Page 12
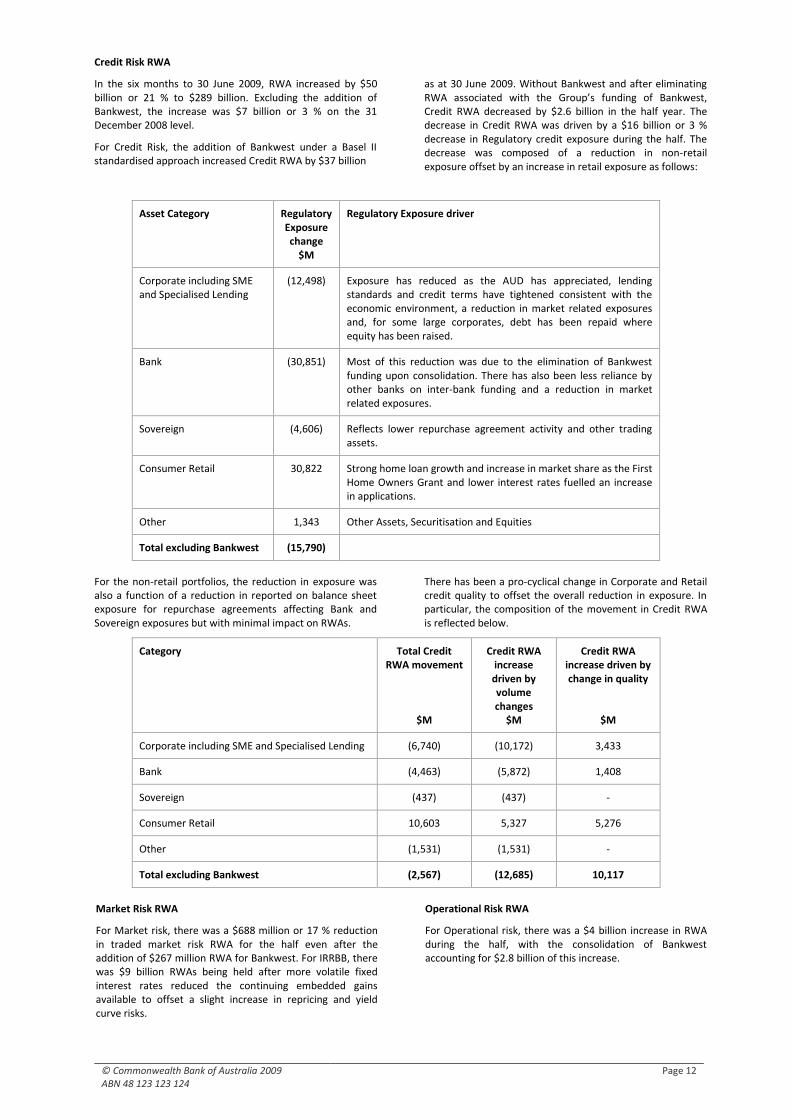
Credit Risk RWA
In the six months to 30 June 2009, RWA increased by $50 billion or 21 % to $289 billion. Excluding the addition of Bankwest, the increase was $7 billion or 3 % on the 31 December 2008 level.
For Credit Risk, the addition of Bankwest under a Basel II standardised approach increased Credit RWA by $37 billion
as at 30 June 2009. Without Bankwest and after eliminating RWA associated with the Group’s funding of Bankwest, Credit RWA decreased by $2.6 billion in the half year. The decrease in Credit RWA was driven by a $16 billion or 3 % decrease in Regulatory credit exposure during the half. The decrease was composed of a reduction in non-retail exposure offset by an increase in retail exposure as follows:
Asset Category Regulatory Exposure change
$M
Regulatory Exposure driver
Corporate including SME and Specialised Lending
(12,498) Exposure has reduced as the AUD has appreciated, lending standards and credit terms have tightened consistent with the economic environment, a reduction in market related exposures and, for some large corporates, debt has been repaid where equity has been raised.
Bank (30,851) Most of this reduction was due to the elimination of Bankwest funding upon consolidation. There has also been less reliance by other banks on inter-bank funding and a reduction in market related exposures.
Sovereign (4,606) Reflects lower repurchase agreement activity and other trading assets.
Consumer Retail 30,822 Strong home loan growth and increase in market share as the First Home Owners Grant and lower interest rates fuelled an increase in applications.
Other 1,343 Other Assets, Securitisation and Equities
Total excluding Bankwest (15,790)
For the non-retail portfolios, the reduction in exposure was also a function of a reduction in reported on balance sheet exposure for repurchase agreements affecting Bank and Sovereign exposures but with minimal impact on RWAs.
There has been a pro-cyclical change in Corporate and Retail credit quality to offset the overall reduction in exposure. In particular, the composition of the movement in Credit RWA is reflected below.
Category Total Credit RWA movement
$M
Credit RWA increase driven by volume changes
$M
Credit RWA increase driven by change in quality
$M
Corporate including SME and Specialised Lending (6,740) (10,172) 3,433
Bank (4,463) (5,872) 1,408
Sovereign (437) (437) -
Consumer Retail 10,603 5,327 5,276
Other (1,531) (1,531) -
Total excluding Bankwest (2,567) (12,685) 10,117
Market Risk RWA
For Market risk, there was a $688 million or 17 % reduction in traded market risk RWA for the half even after the addition of $267 million RWA for Bankwest. For IRRBB, there was $9 billion RWAs being held after more volatile fixed interest rates reduced the continuing embedded gains available to offset a slight increase in repricing and yield curve risks.
Operational Risk RWA
For Operational risk, there was a $4 billion increase in RWA during the half, with the consolidation of Bankwest accounting for $2.8 billion of this increase.
© Commonwealth Bank of Australia 2009 ABN 48 123 123 124
Page 13
5. Integrated risk management
Risk Governance
Risk Management governance originates at Board level, and cascades through to the CEO and businesses via policies and delegated authorities. The Board and its Risk Committee operate under the direction of their respective charters.
The Group’s Board has a comprehensive framework of Corporate Governance Guidelines, which are designed to properly balance performance and conformance and thereby allow the Group to undertake in an effective manner the prudent risk-taking activities that are the basis of its business. The Guidelines and the practices of the Group comply with the revised ‘Corporate Governance Principles and Recommendations’ published in August 2007 by the Australian Securities Exchange (ASX) Limited’s Corporate Governance Council.
The Board carries out the legal duties of its role and having regard to the interests of the Group’s customers, staff, shareholders and the broader community in which the Group operates. The role and responsibilities of the Board of Directors are set out in the Board Charter and include the establishment of governance committees.
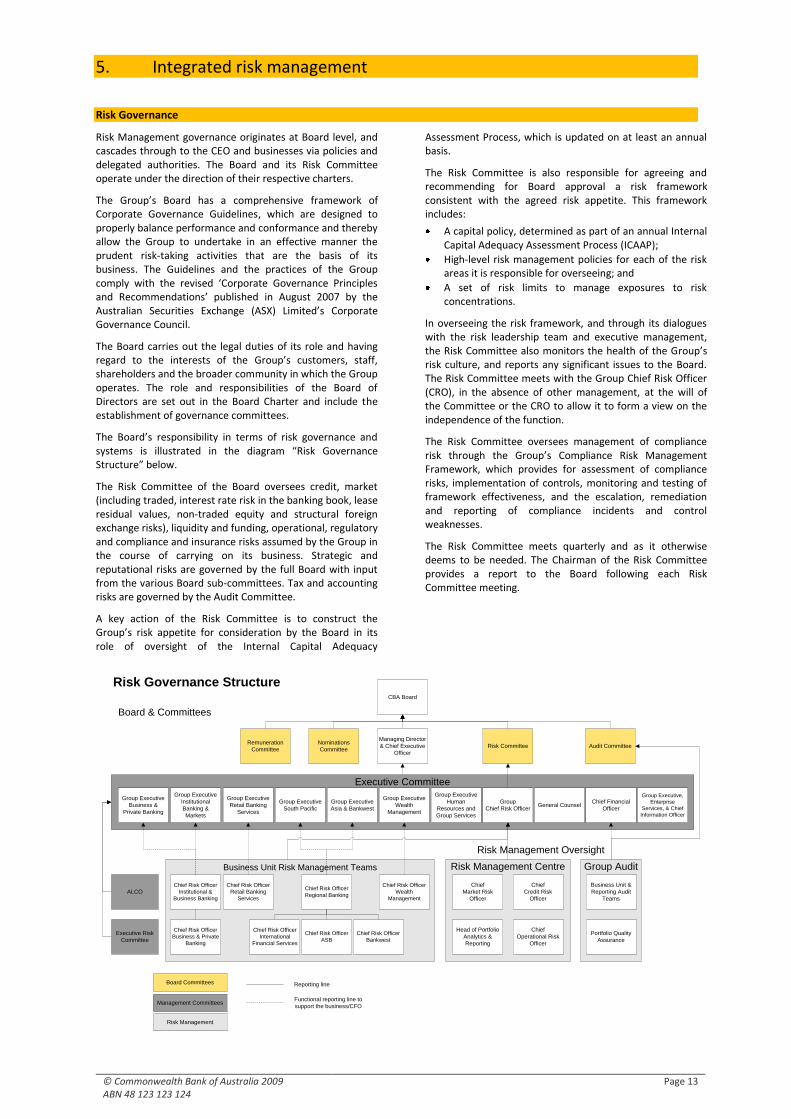
The Board’s responsibility in terms of risk governance and systems is illustrated in the diagram “Risk Governance Structure” below.
The Risk Committee of the Board oversees credit, market (including traded, interest rate risk in the banking book, lease residual values, non-traded equity and structural foreign exchange risks), liquidity and funding, operational, regulatory and compliance and insurance risks assumed by the Group in the course of carrying on its business. Strategic and reputational risks are governed by the full Board with input from the various Board sub-committees. Tax and accounting risks are governed by the Audit Committee.
A key action of the Risk Committee is to construct the Group’s risk appetite for consideration by the Board in its role of oversight of the Internal Capital Adequacy
Assessment Process, which is updated on at least an annual basis.
The Risk Committee is also responsible for agreeing and recommending for Board approval a risk framework consistent with the agreed risk appetite. This framework includes:
A capital policy, determined as part of an annual Internal Capital Adequacy Assessment Process (ICAAP);
High-level risk management policies for each of the risk areas it is responsible for overseeing; and
A set of risk limits to manage exposures to risk concentrations.
In overseeing the risk framework, and through its dialogues with the risk leadership team and executive management, the Risk Committee also monitors the health of the Group’s risk culture, and reports any significant issues to the Board. The Risk Committee meets with the Group Chief Risk Officer (CRO), in the absence of other management, at the will of the Committee or the CRO to allow it to form a view on the independence of the function.
The Risk Committee oversees management of compliance risk through the Group’s Compliance Risk Management Framework, which provides for assessment of compliance risks, implementation of controls, monitoring and testing of framework effectiveness, and the escalation, remediation and reporting of compliance incidents and control weaknesses.
The Risk Committee meets quarterly and as it otherwise deems to be needed. The Chairman of the Risk Committee provides a report to the Board following each Risk Committee meeting.
Group AuditRisk Management Centre
Executive Committee
Business Unit Risk Management Teams
Group
Chief Risk Officer
Chief Risk Officer
ASB
Chief
Operational Risk
Officer
Head of Portfolio
Analytics &
Reporting
Chief
Market Risk
Officer
Chief Risk Officer
Wealth
Management
Chief Risk Officer
Institutional &
Business Banking
Chief Risk Officer
Retail Banking
Services
Chief
Credit Risk
Officer
Chief Financial
Officer
Group Executive
Institutional
Banking &
Markets
Group Executive
Retail Banking
Services
Group Executive
Wealth
Management
Group Executive
Human
Resources and
Group Services
Group Executive,
Enterprise
Services, & Chief
Information Officer
General Counsel
Chief Risk Officer
Regional Banking
Risk Governance Structure
Board & Committees
Risk Management Oversight
CBA Board
Remuneration
CommitteeAudit CommitteeRisk Committee
Nominations
Committee
Managing Director
& Chief Executive
Officer
Business Unit &
Reporting Audit
Teams
Portfolio Quality
Assurance
Executive Risk
Committee
ALCO
Management Committees
Risk Management
Board Committees Reporting line
Functional reporting line to
support the business/CFO
Group Executive
Business &
Private Banking
Chief Risk Officer
Business & Private
Banking
Chief Risk Officer
International
Financial Services
Chief Risk Officer
Bankwest
Group Executive
Asia & Bankwest
Group Executive
South Pacific
© Commonwealth Bank of Australia 2009 ABN 48 123 123 124
Page 14
Risk Management Organisation
The Group has in place an integrated risk management framework to identify, assess, manage and report risks and risk adjusted returns on a consistent and reliable basis.
Accountability for risk management is structured by a “Three Layers of Assurance” model as follows:
• Layer 1: Business Managers – owners of the risks within their businesses;
• Layer 2: Risk Management and Compliance – independent review and oversight of risks and their management; and
• Layer 3: Group Audit - review the risk management framework and internal controls.
This framework requires each business to manage the outcome of its risk-taking activities and benefit from the resulting risk adjusted returns. Risk management professionals deployed in each Business Unit measure risks and provide advice on what risks might be taken for better returns. These risk professionals report to the Group CRO, who in turn reports to the CEO and also has direct reporting requirements to the Risk Committee of the Board.
The independent risk management function undertaken by the Group CRO is managed through the Risk Management Business Unit which is comprised of risk management teams embedded in the businesses and at Group level. Personnel within these risk management teams report directly through to the Group CRO.
Whilst the independent risk management function is an important component of the risk management framework, business managers acknowledge that they remain the owners of the risks in their business and agree to keep their risks within policy and procedure requirements.
Governance processes and disciplines based on the Risk Appetite Framework help to protect the Group from control and other operational failures, creating transparency over risk management and strategy decisions and, in turn, promote a strong risk culture. Furthermore, governance processes and disciplines create independence of the Risk Management Function from the Group’s Business Units and internal audit function, as well as encourage and protect whistle blowing actions when required.
Independent review of the risk management framework is carried out through Group Audit.
© Commonwealth Bank of Australia 2009 ABN 48 123 123 124
Page 15
Risk Appetite
Risk Appetite Concept and Framework
The risk appetite of the Group represents the types and degree of risk that it is willing to accept for its shareholders. Fundamentally it guides the Group’s risk culture and sets out quantitative and qualitative boundaries on risk-taking activities which apply Group wide.
The Board is of the view that a well articulated risk appetite is important in giving the Group’s stakeholders a clear expectation as to how the Group will operate from a risk taking perspective.
This expectation is defined by a number of principles and metrics which are aligned to the Board’s risk philosophy and sets minimum standards for shareholder value allowing for capital resilience, debt rating, funding, asset/liability management, liquidity, profit volatility and risks to which the Group is intolerant.
Risk Appetite is dynamic in nature and is reviewed on a regular basis in conjunction with the Group’s strategic plans and business actions. The validation of strategic plans against the risk appetite ensures that the assessment of the adequacy of capital and contingent capital plans into the future are also aligned with the Risk Appetite. This interaction with strategy is central to a consistent approach to risk and strategic management across the Group, creating transparency over risk management and strategy decisions and, in turn, promoting a strong risk culture.
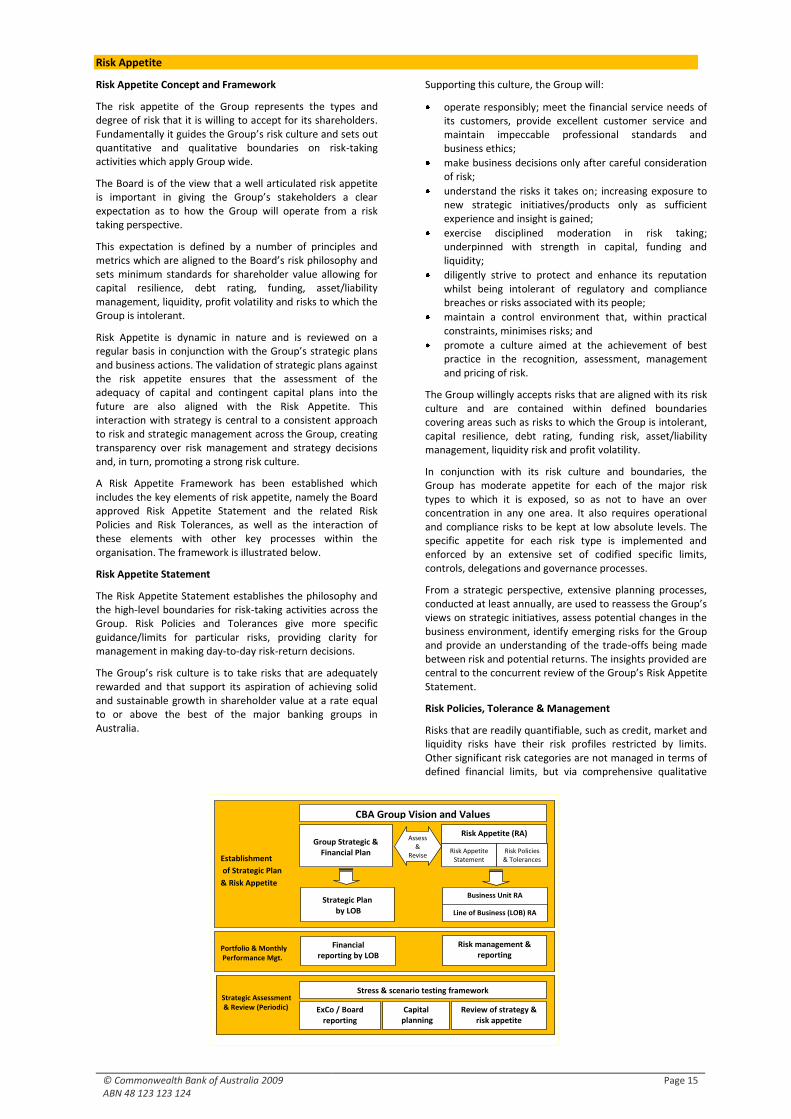
A Risk Appetite Framework has been established which includes the key elements of risk appetite, namely the Board approved Risk Appetite Statement and the related Risk Policies and Risk Tolerances, as well as the interaction of these elements with other key processes within the organisation. The framework is illustrated below.
Risk Appetite Statement
The Risk Appetite Statement establishes the philosophy and the high-level boundaries for risk-taking activities across the Group. Risk Policies and Tolerances give more specific guidance/limits for particular risks, providing clarity for management in making day-to-day risk-return decisions.
The Group’s risk culture is to take risks that are adequately rewarded and that support its aspiration of achieving solid and sustainable growth in shareholder value at a rate equal to or above the best of the major banking groups in Australia.
Supporting this culture, the Group will:
operate responsibly; meet the financial service needs of its customers, provide excellent customer service and maintain impeccable professional standards and business ethics;
make business decisions only after careful consideration of risk;
understand the risks it takes on; increasing exposure to new strategic initiatives/products only as sufficient experience and insight is gained;
exercise disciplined moderation in risk taking; underpinned with strength in capital, funding and liquidity;
diligently strive to protect and enhance its reputation whilst being intolerant of regulatory and compliance breaches or risks associated with its people;
maintain a control environment that, within practical constraints, minimises risks; and
promote a culture aimed at the achievement of best practice in the recognition, assessment, management and pricing of risk.
The Group willingly accepts risks that are aligned with its risk culture and are contained within defined boundaries covering areas such as risks to which the Group is intolerant, capital resilience, debt rating, funding risk, asset/liability management, liquidity risk and profit volatility.
In conjunction with its risk culture and boundaries, the Group has moderate appetite for each of the major risk types to which it is exposed, so as not to have an over concentration in any one area. It also requires operational and compliance risks to be kept at low absolute levels. The specific appetite for each risk type is implemented and enforced by an extensive set of codified specific limits, controls, delegations and governance processes.
From a strategic perspective, extensive planning processes, conducted at least annually, are used to reassess the Group’s views on strategic initiatives, assess potential changes in the business environment, identify emerging risks for the Group and provide an understanding of the trade-offs being made between risk and potential returns. The insights provided are central to the concurrent review of the Group’s Risk Appetite Statement.
Risk Policies, Tolerance & Management
Risks that are readily quantifiable, such as credit, market and liquidity risks have their risk profiles restricted by limits. Other significant risk categories are not managed in terms of defined financial limits, but via comprehensive qualitative
Portfolio & Monthly Performance Mgt.
Strategic Assessment & Review (Periodic)
Financial reporting by LOB
Review of strategy & risk appetite
ExCo / Board reporting
Risk management & reporting
Stress & scenario testing framework
Capital planning
Establishment
of Strategic Plan
& Risk Appetite
Group Strategic & Financial Plan Risk Policies
& Tolerances
Risk Appetite Statement
Risk Appetite (RA)
CBA Group Vision and Values
Line of Business (LOB) RA
Business Unit RA Strategic Plan
by LOB
Assess &
Revise
© Commonwealth Bank of Australia 2009 ABN 48 123 123 124
Page 16
management standards and procedures.
Tolerances are designed to be practical, relevant and capable of being aggregated across the Group. Some tolerances are explicitly contained in Risk Policies.
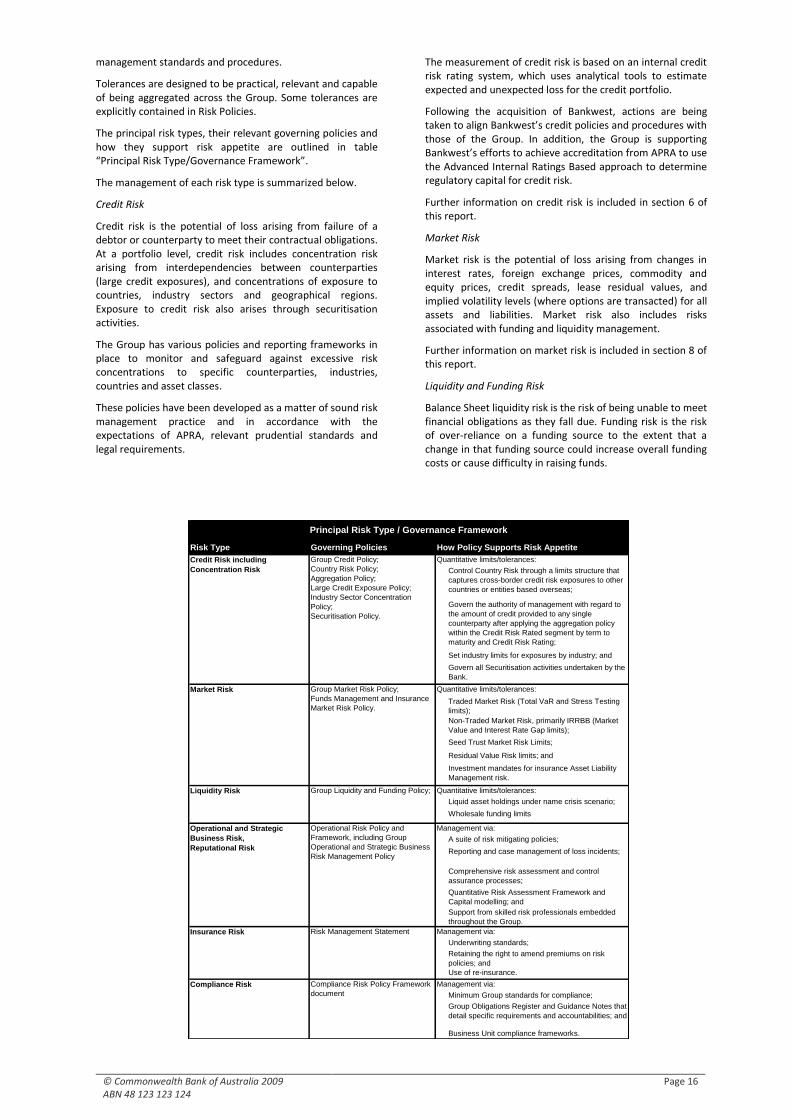
The principal risk types, their relevant governing policies and how they support risk appetite are outlined in table “Principal Risk Type/Governance Framework”.
The management of each risk type is summarized below.
Credit Risk
Credit risk is the potential of loss arising from failure of a debtor or counterparty to meet their contractual obligations. At a portfolio level, credit risk includes concentration risk arising from interdependencies between counterparties (large credit exposures), and concentrations of exposure to countries, industry sectors and geographical regions. Exposure to credit risk also arises through securitisation activities.
The Group has various policies and reporting frameworks in place to monitor and safeguard against excessive risk concentrations to specific counterparties, industries, countries and asset classes.
These policies have been developed as a matter of sound risk management practice and in accordance with the expectations of APRA, relevant prudential standards and legal requirements.
The measurement of credit risk is based on an internal credit risk rating system, which uses analytical tools to estimate expected and unexpected loss for the credit portfolio.
Following the acquisition of Bankwest, actions are being taken to align Bankwest’s credit policies and procedures with those of the Group. In addition, the Group is supporting Bankwest’s efforts to achieve accreditation from APRA to use the Advanced Internal Ratings Based approach to determine regulatory capital for credit risk.
Further information on credit risk is included in section 6 of this report.
Market Risk
Market risk is the potential of loss arising from changes in interest rates, foreign exchange prices, commodity and equity prices, credit spreads, lease residual values, and implied volatility levels (where options are transacted) for all assets and liabilities. Market risk also includes risks associated with funding and liquidity management.
Further information on market risk is included in section 8 of this report.
Liquidity and Funding Risk
Balance Sheet liquidity risk is the risk of being unable to meet financial obligations as they fall due. Funding risk is the risk of over-reliance on a funding source to the extent that a change in that funding source could increase overall funding costs or cause difficulty in raising funds.
Risk Type Governing Policies How Policy Supports Risk Appetite
Quantitative limits/tolerances:
Control Country Risk through a limits structure that
captures cross-border credit risk exposures to other
countries or entities based overseas;
Govern the authority of management with regard to
the amount of credit provided to any single
counterparty after applying the aggregation policy
within the Credit Risk Rated segment by term to
maturity and Credit Risk Rating;
Set industry limits for exposures by industry; and
Govern all Securitisation activities undertaken by the
Bank.
Quantitative limits/tolerances:
Traded Market Risk (Total VaR and Stress Testing
limits);
Non-Traded Market Risk, primarily IRRBB (Market
Value and Interest Rate Gap limits);
Seed Trust Market Risk Limits;
Residual Value Risk limits; and
Investment mandates for insurance Asset Liability
Management risk.
Quantitative limits/tolerances:
Liquid asset holdings under name crisis scenario;
Wholesale funding limits
Management via:
A suite of risk mitigating policies;
Reporting and case management of loss incidents;
Comprehensive risk assessment and control
assurance processes;
Quantitative Risk Assessment Framework and
Capital modelling; and
Support from skilled risk professionals embedded
throughout the Group.
Management via:
Underwriting standards;
Retaining the right to amend premiums on risk
policies; and
Use of re-insurance.
Management via:
Minimum Group standards for compliance;
Group Obligations Register and Guidance Notes that
detail specific requirements and accountabilities; and
Business Unit compliance frameworks.
Operational and Strategic
Business Risk,
Reputational Risk
Group Credit Policy;
Country Risk Policy;
Aggregation Policy;
Large Credit Exposure Policy;
Industry Sector Concentration
Policy;
Securitisation Policy.
Group Market Risk Policy;
Funds Management and Insurance
Market Risk Policy.
Principal Risk Type / Governance Framework
Insurance Risk Risk Management Statement
Compliance Risk Compliance Risk Policy Framework
document
Credit Risk including
Concentration Risk
Market Risk
Liquidity Risk Group Liquidity and Funding Policy;
Operational Risk Policy and
Framework, including Group
Operational and Strategic Business
Risk Management Policy
© Commonwealth Bank of Australia 2009 ABN 48 123 123 124
Page 17
Operational, Strategic Business and Reputational Risk
The Group’s operational and strategic business risk management framework supports the achievement of its financial and business goals. Framework objectives approved by the Risk Committee are:
Maintenance of an effective internal control environment and system of internal control;
Demonstration of effective governance, including a consistent approach to operational risk management across the Group;
Transparency, escalation and resolution of risk and control incidents and issues;
Making decisions based upon an informed risk-return analysis and appropriate standards of professional practice; and
Achieving business growth and enhancing financial performance through efficient and effective operational processes.
Operational Risk is defined as the risk of economic gain or loss resulting from:
Inadequate or failed internal processes and methodologies;
People;
Systems and models used in making business decisions; or
External events.
Security risk is defined as threats associated with theft and fraud, information and IT security, protective security and crisis management.
The Group’s security risk management framework forms part of the operational risk framework and sets out the key roles, responsibilities and processes for security risk management across the Group.
Each business manager is responsible for the identification and assessment of operational and strategic risks. They must maintain appropriate internal controls. Skilled operational risk professionals embedded in the business lead the Group’s operational risk framework and governance structures to support business managers through a suite of risk mitigating policies, the reporting of internal loss incidents and key risk indicators, and qualitative and quantitative assessment of risk exposures. Further governance and control oversight is provided by Group Audit for this and other risk types.
The Group’s operational risk measurement methodology combines expert assessment of individual risk exposures with internal loss data to calculate operational risk economic capital and determine potential loss.
The Group benchmarks and monitors its insurance risk transfer program for efficiency and effectiveness. This is primarily achieved through a methodology that determines the most appropriate blend of economic capital coverage and insurance risk transfer.
Strategic Business Risk is defined as the risk of economic gain or loss resulting from changes in the business environment caused by the following factors:
Macroeconomic conditions;
Competitive forces at work;
Social trends; or
Regulatory changes.
Strategic business risk is taken into account when defining business strategy and objectives. The Risk Committee receives reports on business plans, major projects and change initiatives. The Risk committee monitors progress and reviews successes compared to plans. The full Board accepts or amends the Group’s overall and each key Business Unit’s strategic plans.
Reputational risk can be defined as the risk arising from negative perception on the part of customers, counterparties, shareholders, investors, debt-holders, market analysts, regulators and other relevant parties. This risk can adversely affect a bank’s ability to maintain existing, or establish new, business relationships and access to sources of funding. Reputational risk is multidimensional and reflects the perception of other market participants. Furthermore, it exists throughout the organisation and exposure to reputational risk is essentially a function of the adequacy of the bank’s internal risk management processes, as well as the manner and efficiency with which management responds to external influences on bank-related transactions.
Business Continuity
Business Continuity Management (BCM) involves the development, maintenance and testing of advance action plans to respond to threats that have the potential to impact operations. BCM ensures that business processes continue with minimal adverse impact on customers, staff, products, services and brands.
BCM constitutes an essential component of the Group’s risk management process by providing a controlled response to business disruption events that could have a significant impact on the Group’s critical processes and revenue streams. It includes both cost-effective responses to mitigate the impact of risk events or disasters and crisis management plans to respond to crisis events.
Risk policies and tolerances are reviewed and endorsed annually by the Executive Committee and the Risk Committee.
Further information on operational risk is included in section 9 of this report.
© Commonwealth Bank of Australia 2009 ABN 48 123 123 124
Page 18
Stress Testing
Stress testing informs the Group’s view of risk, where consideration is given to potential losses related to the Group’s material risk types in a stressed environment and tested against Risk Appetite.
In addition to more standard risk measures that may be used for limit setting, regular and ad-hoc risk stress testing is also used within the Group to identify and assess the risk profile of the Group. This is used in combination with stress testing tolerances and reporting to understand and manage risk within risk tolerances.
The stress testing framework includes:
• Group-wide stress scenarios embedded in the strategic planning process which informs and engages the Board in assessing capital adequacy under various adverse operating circumstances. These tests are conducted across risk types with the results aggregated to the Group level. These stress tests, therefore, provide the most comprehensive view of the potential capital requirements of the Group under each specific stress test scenario and are of primary importance in assessing future capital needs; and
• Risk management related stress testing, which supports enhanced risk identification, assessment and management within the Group’s risk appetite. This stress testing facilitates a more robust understanding, of the Group’s risks, facilitates better management policies and predictability of capital requirements.
Stress testing also provides an input into the development of Capital Contingency Plans which detail how the Group would respond to these increases in capital requirements under specified stress test scenarios.
The Group regularly carries out stress testing across its various businesses, as part of:
• Formal business/strategic planning and capital assessment at Board level;
• Regular risk management stress testing exercises; and • Business contingency planning and requests from
regulators or external agencies.
Specific risk types for which stress tests are conducted on a routine basis for business risk management purposes are outlined herein.
Credit Risk
Business units conduct credit risk stress tests on the Home Loan portfolio, as well as for secured and unsecured non-mortgage products (Credit Cards, Personal Loans, and Cheque Accounts), in conjunction with Group-wide stress tests.
Business units also conduct stress testing of the risk rated portfolio based on migration rates provided by Risk Management Centre as part of their input to Group-wide stress tests.
Market Risk
Market risk stress testing is performed on a daily basis, with results reported to line and senior management. There is an established program in place to stress test each IRRBB risk type (including repricing, yield curve, optionality and basis risks).
Stress testing is also performed on non-traded equity investments as part of the Market Risk function.
Stress testing in the Wealth Management business is part of the risk and governance framework of Colonial Mutual Life Assurance Society Limited (CMLA). Stress testing is undertaken as part of the annual review of the CMLA Capital Management Policy.
Liquidity and Funding Risk
Formal liquidity stress testing is incorporated into the Group’s Funding and Liquidity Policy approved by the Risk Committee. The key components are a ‘Name Crisis’ stress test and a ‘Market-Systemic’ stress test.
Operational Risk
The Group has a framework for Operational Risk sensitivity and stress testing. The purpose of this framework is to assess the impact on Group operational risk economic capital from changes in key data inputs over time.
Operational risk stress tests are undertaken periodically; the last was completed in June 2009.
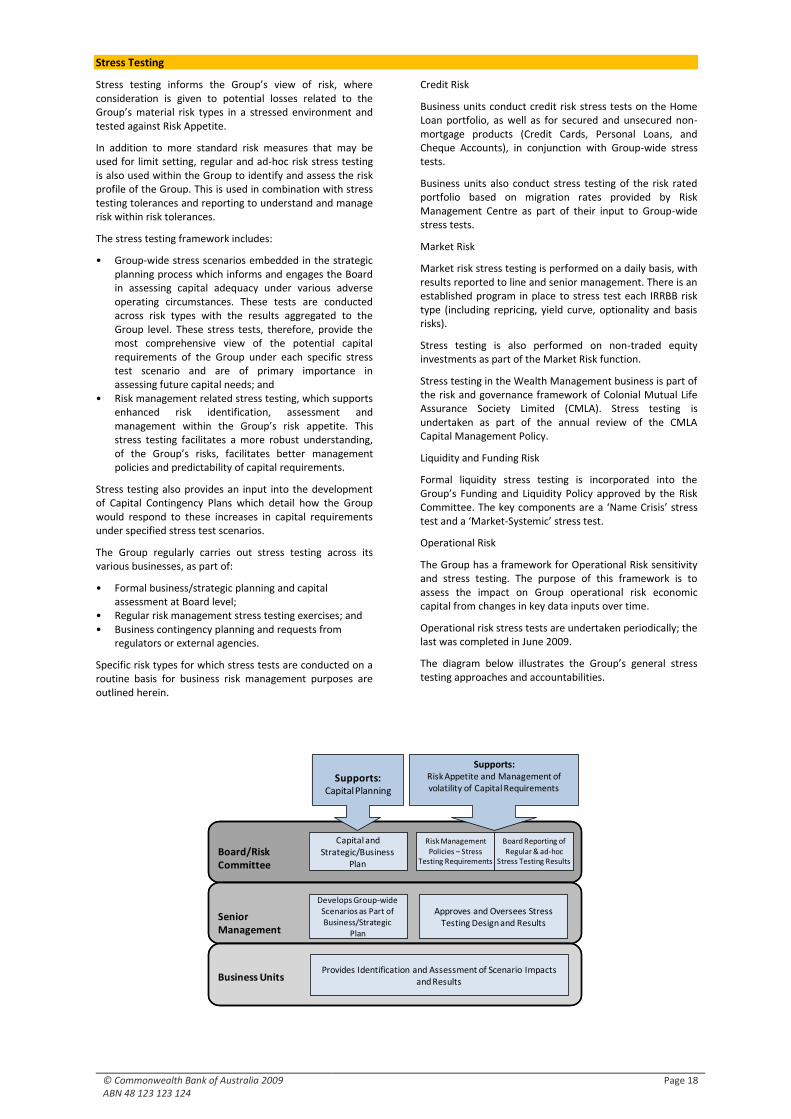
The diagram below illustrates the Group’s general stress testing approaches and accountabilities.
Board/Risk Committee
Senior Management
Business Units
Supports:Capital Planning
Supports:Risk Appetite and Management of volatility of Capital Requirements
Capital and Strategic/Business
Plan
Develops Group-wide Scenarios as Part of Business/Strategic
Plan
Provides Identification and Assessment of Scenario Impacts and Results
Risk Management Policies – Stress
Testing Requirements
Board Reporting of Regular & ad-hoc
Stress Testing Results
Approves and Oversees Stress Testing Design and Results
© Commonwealth Bank of Australia 2009 ABN 48 123 123 124
Page 19
Capital Management
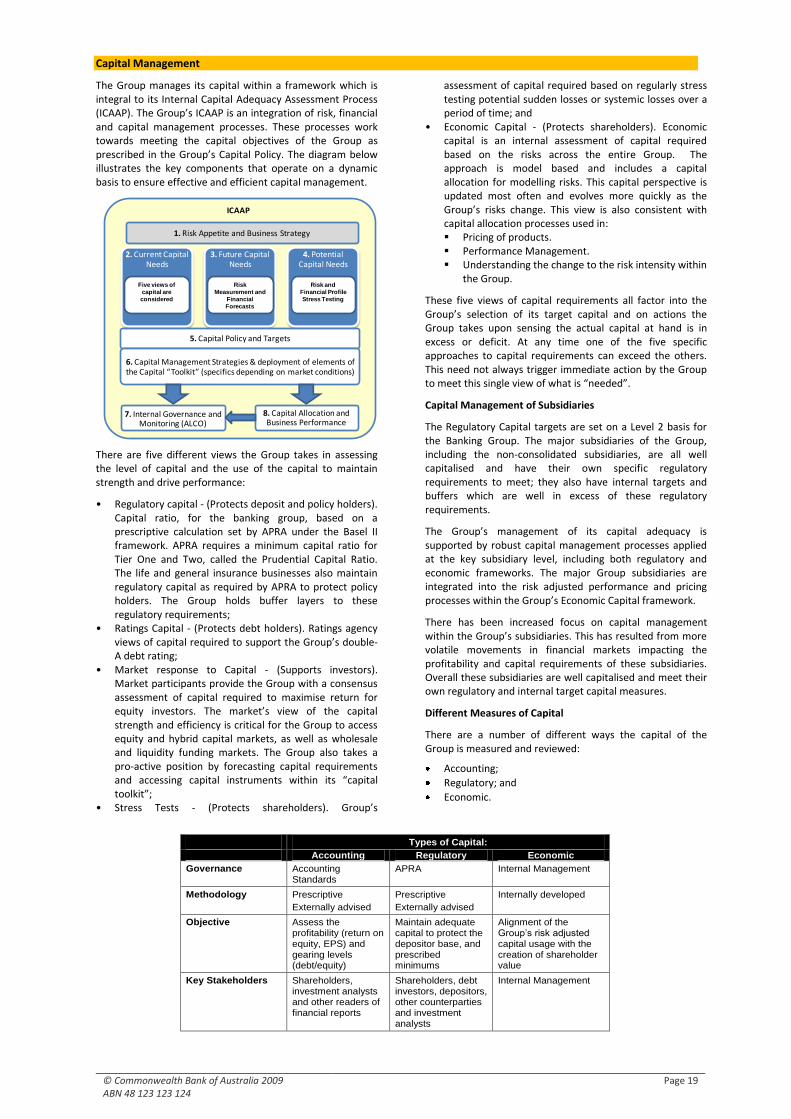
The Group manages its capital within a framework which is integral to its Internal Capital Adequacy Assessment Process (ICAAP). The Group’s ICAAP is an integration of risk, financial and capital management processes. These processes work towards meeting the capital objectives of the Group as prescribed in the Group’s Capital Policy. The diagram below illustrates the key components that operate on a dynamic basis to ensure effective and efficient capital management.
2. Current Capital Needs
1. Risk Appetite and Business Strategy
Five views of
capital are
considered
3. Future Capital Needs
Risk
Measurement and
Financial
Forecasts
4. Potential Capital Needs
Risk and
Financial Profile
Stress Testing
5. Capital Policy and Targets
6. Capital Management Strategies & deployment of elements of the Capital “Toolkit” (specifics depending on market conditions)
7. Internal Governance and Monitoring (ALCO)
8. Capital Allocation and Business Performance
ICAAP
There are five different views the Group takes in assessing the level of capital and the use of the capital to maintain strength and drive performance:
• Regulatory capital - (Protects deposit and policy holders). Capital ratio, for the banking group, based on a prescriptive calculation set by APRA under the Basel II framework. APRA requires a minimum capital ratio for Tier One and Two, called the Prudential Capital Ratio. The life and general insurance businesses also maintain regulatory capital as required by APRA to protect policy holders. The Group holds buffer layers to these regulatory requirements;
• Ratings Capital - (Protects debt holders). Ratings agency views of capital required to support the Group’s double-A debt rating;
• Market response to Capital - (Supports investors). Market participants provide the Group with a consensus assessment of capital required to maximise return for equity investors. The market’s view of the capital strength and efficiency is critical for the Group to access equity and hybrid capital markets, as well as wholesale and liquidity funding markets. The Group also takes a pro-active position by forecasting capital requirements and accessing capital instruments within its “capital toolkit”;
• Stress Tests - (Protects shareholders). Group’s
assessment of capital required based on regularly stress testing potential sudden losses or systemic losses over a period of time; and
• Economic Capital - (Protects shareholders). Economic capital is an internal assessment of capital required based on the risks across the entire Group. The approach is model based and includes a capital allocation for modelling risks. This capital perspective is updated most often and evolves more quickly as the Group’s risks change. This view is also consistent with capital allocation processes used in: Pricing of products. Performance Management. Understanding the change to the risk intensity within
the Group.
These five views of capital requirements all factor into the Group’s selection of its target capital and on actions the Group takes upon sensing the actual capital at hand is in excess or deficit. At any time one of the five specific approaches to capital requirements can exceed the others. This need not always trigger immediate action by the Group to meet this single view of what is “needed”.
Capital Management of Subsidiaries
The Regulatory Capital targets are set on a Level 2 basis for the Banking Group. The major subsidiaries of the Group, including the non-consolidated subsidiaries, are all well capitalised and have their own specific regulatory requirements to meet; they also have internal targets and buffers which are well in excess of these regulatory requirements.
The Group’s management of its capital adequacy is supported by robust capital management processes applied at the key subsidiary level, including both regulatory and economic frameworks. The major Group subsidiaries are integrated into the risk adjusted performance and pricing processes within the Group’s Economic Capital framework.
There has been increased focus on capital management within the Group’s subsidiaries. This has resulted from more volatile movements in financial markets impacting the profitability and capital requirements of these subsidiaries. Overall these subsidiaries are well capitalised and meet their own regulatory and internal target capital measures.
Different Measures of Capital
There are a number of different ways the capital of the Group is measured and reviewed:
Accounting;
Regulatory; and
Economic.
Types of Capital:
Accounting Regulatory Economic
Governance Accounting Standards
APRA Internal Management
Methodology Prescriptive
Externally advised
Prescriptive
Externally advised
Internally developed
Objective Assess the profitability (return on equity, EPS) and gearing levels (debt/equity)
Maintain adequate capital to protect the depositor base, and prescribed minimums
Alignment of the Group’s risk adjusted capital usage with the creation of shareholder value
Key Stakeholders Shareholders, investment analysts and other readers of financial reports
Shareholders, debt investors, depositors, other counterparties and investment analysts
Internal Management
© Commonwealth Bank of Australia 2009 ABN 48 123 123 124
Page 20
Each of these measures and definitions of capital performs a different function (as summarized in table “Types of Capital”), dependent on the governance involved and the key stakeholder and users of the information.
The principal differences between Accounting and Regulatory Capital are the allowance within regulatory capital for hybrid type securities and subordinated debt, less specific deductions for certain asset items including goodwill and other intangibles.
Economic Capital
Economic Capital is an internal bottom-up estimate of the capital required to cover unexpected losses from the risk profile of the Group at a confidence interval that aligns with a strong credit rating. This internal ‘Target Equity’ amount of capital is allocated to businesses as the foundation for risk-based pricing and risk-return performance reporting.
Capital held for purposes other than to cover the risk profile (such as goodwill and expected dividends) is related more to Group level strategic decisions. In the Economic Capital framework, these components are included in the capital base for risk-return measures used by the Chief Executive Officer and Group Executives to manage overall risk-adjusted return on the Group’s total capital.
Economic Capital measures for each risk type are based on risk measures and models owned by the independent risk management function of the Group.
The Economic Capital measurement methodologies for APRA’s “Pillar 1” risk types utilise the internal risk measurement models and/or risk factors that are used for Regulatory Capital measures.
The Group also has in place internal policies and limit frameworks to measure, monitor and control credit concentrations, including; large credit exposures, industry sector concentrations and country risk.
Credit concentration risk is accounted for within credit risk Economic Capital modelling through the following components:
The extent to which facilities are correlated to macroeconomic factors. This becomes the key driver for the simulated correlated defaults and correlated credit migrations;
The allocation methodology also attributes more Economic Capital to facilities which contribute more to portfolio risk. Overall, the credit risk Economic Capital model penalises large credit exposure tranches, facilities that are highly correlated to macroeconomic factors and facilities that generate more portfolio risk; and
Country risk is also accounted for in the assessment of portfolio risk in the credit risk Economic Capital model.
Economic versus Regulatory Capital
Whilst Regulatory Capital under Basel II and Economic Capital are both risk-based measures of capital requirements, there are differences in the definitions, applications and methodologies of these measures that mean that they are not directly comparable or reconcilable.
Regulatory Capital requirements are used directly in physical capital management in the Group, whilst Economic Capital is used for allocation of an appropriate level of risk-based capital to the business to generate shareholder value and is aligned to an appropriate measure of risk-based capital requirements in Group physical capital.
Quantitative disclosures in this document relate to regulatory capital.
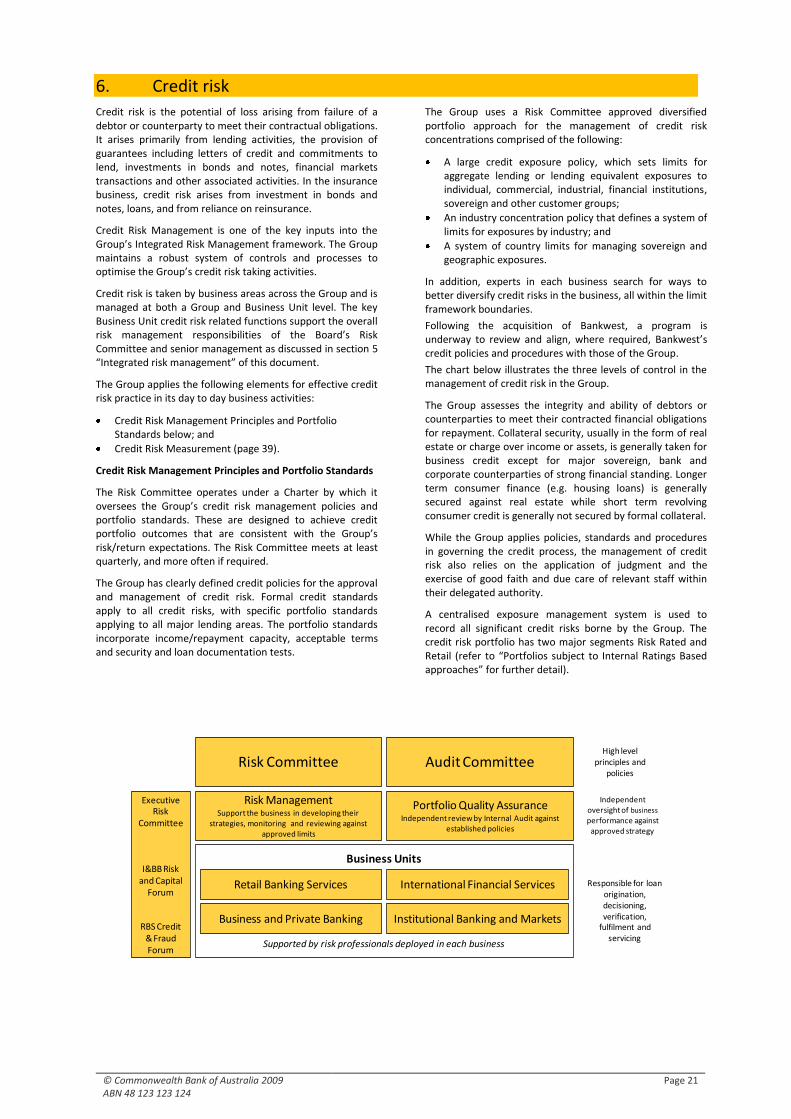
© Commonwealth Bank of Australia 2009 ABN 48 123 123 124
Page 21
6. Credit risk
Credit risk is the potential of loss arising from failure of a debtor or counterparty to meet their contractual obligations. It arises primarily from lending activities, the provision of guarantees including letters of credit and commitments to lend, investments in bonds and notes, financial markets transactions and other associated activities. In the insurance business, credit risk arises from investment in bonds and notes, loans, and from reliance on reinsurance.
Credit Risk Management is one of the key inputs into the Group’s Integrated Risk Management framework. The Group maintains a robust system of controls and processes to optimise the Group’s credit risk taking activities.
Credit risk is taken by business areas across the Group and is managed at both a Group and Business Unit level. The key Business Unit credit risk related functions support the overall risk management responsibilities of the Board’s Risk Committee and senior management as discussed in section 5 “Integrated risk management” of this document.
The Group applies the following elements for effective credit risk practice in its day to day business activities:
Credit Risk Management Principles and Portfolio Standards below; and
Credit Risk Measurement (page 39).
Credit Risk Management Principles and Portfolio Standards
The Risk Committee operates under a Charter by which it oversees the Group’s credit risk management policies and portfolio standards. These are designed to achieve credit portfolio outcomes that are consistent with the Group’s risk/return expectations. The Risk Committee meets at least quarterly, and more often if required.
The Group has clearly defined credit policies for the approval and management of credit risk. Formal credit standards apply to all credit risks, with specific portfolio standards applying to all major lending areas. The portfolio standards incorporate income/repayment capacity, acceptable terms and security and loan documentation tests.
The Group uses a Risk Committee approved diversified portfolio approach for the management of credit risk concentrations comprised of the following:
A large credit exposure policy, which sets limits for aggregate lending or lending equivalent exposures to individual, commercial, industrial, financial institutions, sovereign and other customer groups;
An industry concentration policy that defines a system of limits for exposures by industry; and
A system of country limits for managing sovereign and geographic exposures.
In addition, experts in each business search for ways to better diversify credit risks in the business, all within the limit framework boundaries.
Following the acquisition of Bankwest, a program is underway to review and align, where required, Bankwest’s credit policies and procedures with those of the Group.
The chart below illustrates the three levels of control in the management of credit risk in the Group.
The Group assesses the integrity and ability of debtors or counterparties to meet their contracted financial obligations for repayment. Collateral security, usually in the form of real estate or charge over income or assets, is generally taken for business credit except for major sovereign, bank and corporate counterparties of strong financial standing. Longer term consumer finance (e.g. housing loans) is generally secured against real estate while short term revolving consumer credit is generally not secured by formal collateral.
While the Group applies policies, standards and procedures in governing the credit process, the management of credit risk also relies on the application of judgment and the exercise of good faith and due care of relevant staff within their delegated authority.
A centralised exposure management system is used to record all significant credit risks borne by the Group. The credit risk portfolio has two major segments Risk Rated and Retail (refer to “Portfolios subject to Internal Ratings Based approaches” for further detail).
Risk Committee Audit Committee
Risk ManagementSupport the business in developing their
strategies, monitoring and reviewing against approved limits
Portfolio Quality AssuranceIndependent review by Internal Audit against
established policies
Retail Banking Services International Financial Services
Business Units
Supported by risk professionals deployed in each business
ExecutiveRisk
Committee
I&BB Risk and Capital
Forum
RBS Credit & Fraud Forum
High level principles and
policies
Independent oversight of business
performance against approved strategy
Responsible for loan origination, decisioning, verification,
fulfilment and servicing
Business and Private Banking Institutional Banking and Markets
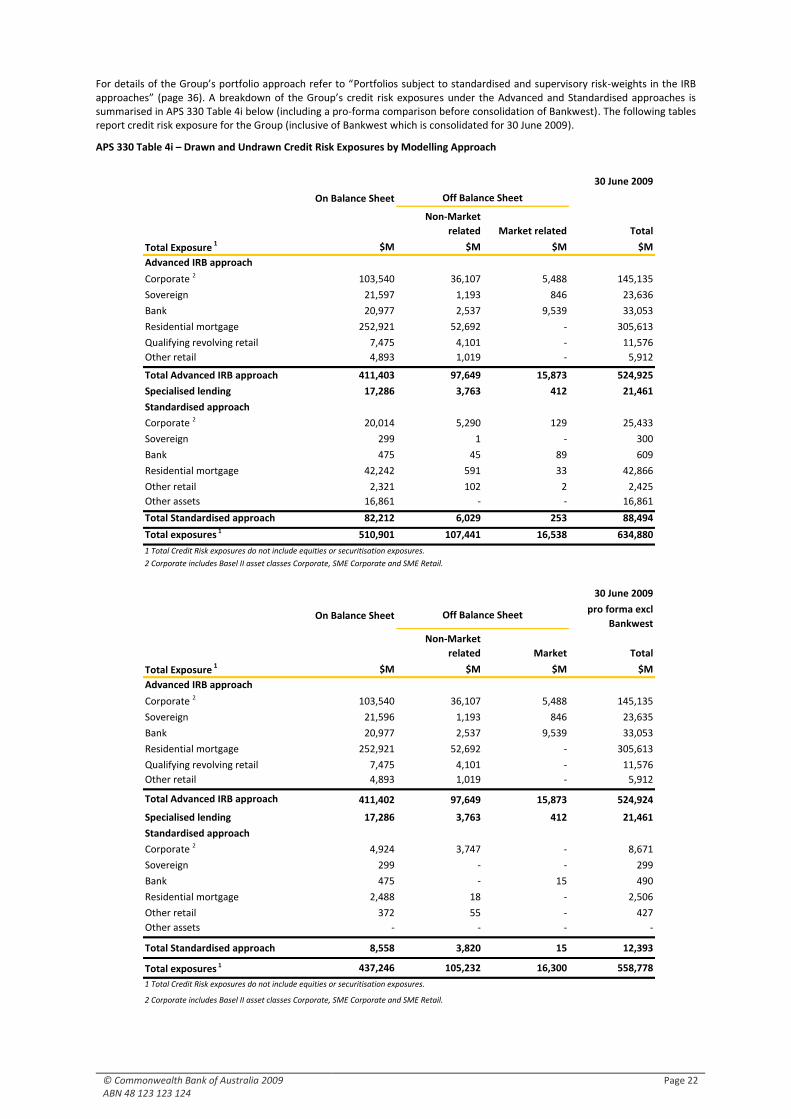
© Commonwealth Bank of Australia 2009 ABN 48 123 123 124
Page 22
For details of the Group’s portfolio approach refer to “Portfolios subject to standardised and supervisory risk-weights in the IRB approaches” (page 36). A breakdown of the Group’s credit risk exposures under the Advanced and Standardised approaches is summarised in APS 330 Table 4i below (including a pro-forma comparison before consolidation of Bankwest). The following tables report credit risk exposure for the Group (inclusive of Bankwest which is consolidated for 30 June 2009).
APS 330 Table 4i – Drawn and Undrawn Credit Risk Exposures by Modelling Approach
30 June 2009
On Balance Sheet
Total Exposure 1 $M $M $M $M
Advanced IRB approach
Corporate 2 103,540 36,107 5,488 145,135
Sovereign 21,597 1,193 846 23,636
Bank 20,977 2,537 9,539 33,053
Residential mortgage 252,921 52,692 - 305,613
Qualifying revolving retail 7,475 4,101 - 11,576
Other retail 4,893 1,019 - 5,912
Total Advanced IRB approach 411,403 97,649 15,873 524,925
Specialised lending 17,286 3,763 412 21,461
Standardised approach
Corporate 2 20,014 5,290 129 25,433
Sovereign 299 1 - 300
Bank 475 45 89 609
Residential mortgage 42,242 591 33 42,866
Other retail 2,321 102 2 2,425
Other assets 16,861 - - 16,861
Total Standardised approach 82,212 6,029 253 88,494
Total exposures 1 510,901 107,441 16,538 634,880
30 June 2009
On Balance Sheetpro forma excl
Bankwest
Total Exposure 1 $M $M $M $M
Advanced IRB approach
Corporate 2 103,540 36,107 5,488 145,135
Sovereign 21,596 1,193 846 23,635
Bank 20,977 2,537 9,539 33,053
Residential mortgage 252,921 52,692 - 305,613
Qualifying revolving retail 7,475 4,101 - 11,576
Other retail 4,893 1,019 - 5,912
Total Advanced IRB approach 411,402 97,649 15,873 524,924
Specialised lending 17,286 3,763 412 21,461
Standardised approach
Corporate 2 4,924 3,747 - 8,671
Sovereign 299 - - 299
Bank 475 - 15 490
Residential mortgage 2,488 18 - 2,506
Other retail 372 55 - 427
Other assets - - - -
Total Standardised approach 8,558 3,820 15 12,393
Total exposures 1 437,246 105,232 16,300 558,778
Non-Market
related Total
1 Total Credit Risk exposures do not include equities or securitisation exposures.
2 Corporate includes Basel II asset classes Corporate, SME Corporate and SME Retail.
Off Balance Sheet
Market
Off Balance Sheet
Non-Market
related TotalMarket related
1 Total Credit Risk exposures do not include equities or securitisation exposures.
2 Corporate includes Basel II asset classes Corporate, SME Corporate and SME Retail.
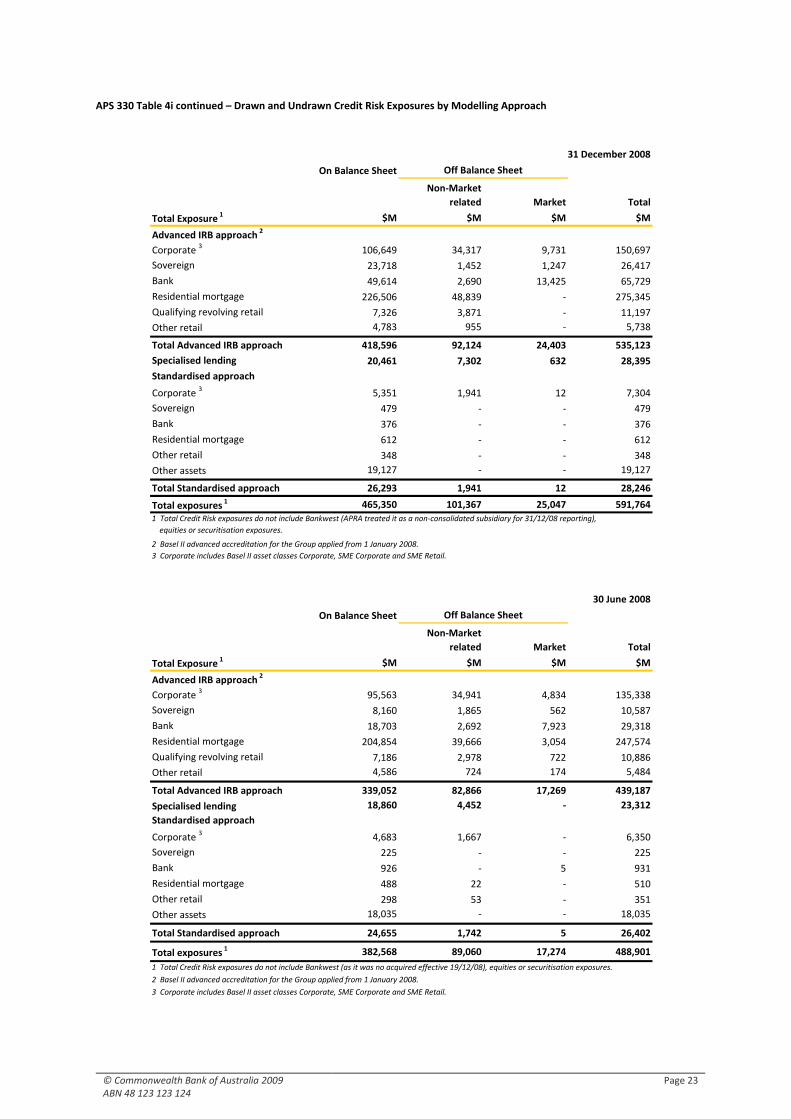
© Commonwealth Bank of Australia 2009 ABN 48 123 123 124
Page 23
APS 330 Table 4i continued – Drawn and Undrawn Credit Risk Exposures by Modelling Approach
On Balance Sheet
Total Exposure 1 $M $M $M $M
Advanced IRB approach 2
Corporate 3 106,649 34,317 9,731 150,697
Sovereign 23,718 1,452 1,247 26,417
Bank 49,614 2,690 13,425 65,729
Residential mortgage 226,506 48,839 - 275,345
Qualifying revolving retail 7,326 3,871 - 11,197
Other retail 4,783 955 - 5,738
Total Advanced IRB approach 418,596 92,124 24,403 535,123
Specialised lending 20,461 7,302 632 28,395
Standardised approach
Corporate 3 5,351 1,941 12 7,304
Sovereign 479 - - 479
Bank 376 - - 376
Residential mortgage 612 - - 612
Other retail 348 - - 348
Other assets 19,127 - - 19,127
Total Standardised approach 26,293 1,941 12 28,246
Total exposures 1 465,350 101,367 25,047 591,764
On Balance Sheet
Total Exposure 1 $M $M $M $M
Advanced IRB approach 2
Corporate 3 95,563 34,941 4,834 135,338
Sovereign 8,160 1,865 562 10,587
Bank 18,703 2,692 7,923 29,318
Residential mortgage 204,854 39,666 3,054 247,574
Qualifying revolving retail 7,186 2,978 722 10,886
Other retail 4,586 724 174 5,484
Total Advanced IRB approach 339,052 82,866 17,269 439,187
Specialised lending 18,860 4,452 - 23,312
Standardised approach
Corporate 3 4,683 1,667 - 6,350
Sovereign 225 - - 225
Bank 926 - 5 931
Residential mortgage 488 22 - 510
Other retail 298 53 - 351
Other assets 18,035 - - 18,035
Total Standardised approach 24,655 1,742 5 26,402
Total exposures 1 382,568 89,060 17,274 488,901
Market
1 Total Credit Risk exposures do not include Bankwest (as it was no acquired effective 19/12/08), equities or securitisation exposures.
2 Basel II advanced accreditation for the Group applied from 1 January 2008.
3 Corporate includes Basel II asset classes Corporate, SME Corporate and SME Retail.
3 Corporate includes Basel II asset classes Corporate, SME Corporate and SME Retail.
1 Total Credit Risk exposures do not include Bankwest (APRA treated it as a non-consolidated subsidiary for 31/12/08 reporting),
equities or securitisation exposures.
2 Basel II advanced accreditation for the Group applied from 1 January 2008.
30 June 2008
Off Balance Sheet
Non-Market
related Market Total
Non-Market
related Total
Off Balance Sheet
31 December 2008
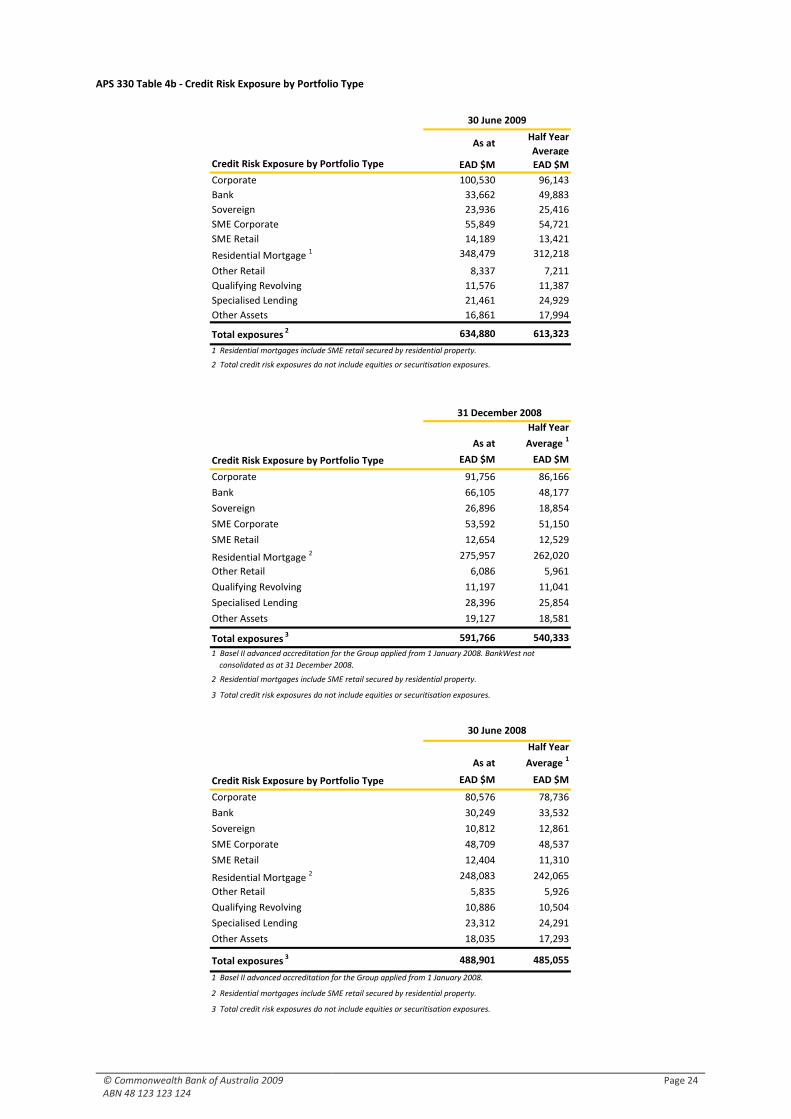
© Commonwealth Bank of Australia 2009 ABN 48 123 123 124
Page 24
APS 330 Table 4b - Credit Risk Exposure by Portfolio Type
As atHalf Year
Average
EAD $M EAD $M
Corporate 100,530 96,143
Bank 33,662 49,883
Sovereign 23,936 25,416
SME Corporate 55,849 54,721
SME Retail 14,189 13,421
Residential Mortgage 1 348,479 312,218
Other Retail 8,337 7,211
Qualifying Revolving 11,576 11,387
Specialised Lending 21,461 24,929
Other Assets 16,861 17,994
Total exposures 2 634,880 613,323
As at
Half Year
Average 1
EAD $M EAD $M
Corporate 91,756 86,166
Bank 66,105 48,177
Sovereign 26,896 18,854
SME Corporate 53,592 51,150
SME Retail 12,654 12,529
Residential Mortgage 2 275,957 262,020
Other Retail 6,086 5,961
Qualifying Revolving 11,197 11,041
Specialised Lending 28,396 25,854
Other Assets 19,127 18,581
Total exposures 3 591,766 540,333
As at
Half Year
Average 1
EAD $M EAD $M
Corporate 80,576 78,736
Bank 30,249 33,532
Sovereign 10,812 12,861
SME Corporate 48,709 48,537
SME Retail 12,404 11,310
Residential Mortgage 2 248,083 242,065
Other Retail 5,835 5,926
Qualifying Revolving 10,886 10,504
Specialised Lending 23,312 24,291
Other Assets 18,035 17,293
Total exposures 3 488,901 485,055
Credit Risk Exposure by Portfolio Type
1 Basel II advanced accreditation for the Group applied from 1 January 2008.
2 Residential mortgages include SME retail secured by residential property.
3 Total credit risk exposures do not include equities or securitisation exposures.
3 Total credit risk exposures do not include equities or securitisation exposures.
30 June 2009
31 December 2008
30 June 2008
Credit Risk Exposure by Portfolio Type
1 Residential mortgages include SME retail secured by residential property.
2 Total credit risk exposures do not include equities or securitisation exposures.
1 Basel II advanced accreditation for the Group applied from 1 January 2008. BankWest not
consolidated as at 31 December 2008.
2 Residential mortgages include SME retail secured by residential property.
Credit Risk Exposure by Portfolio Type
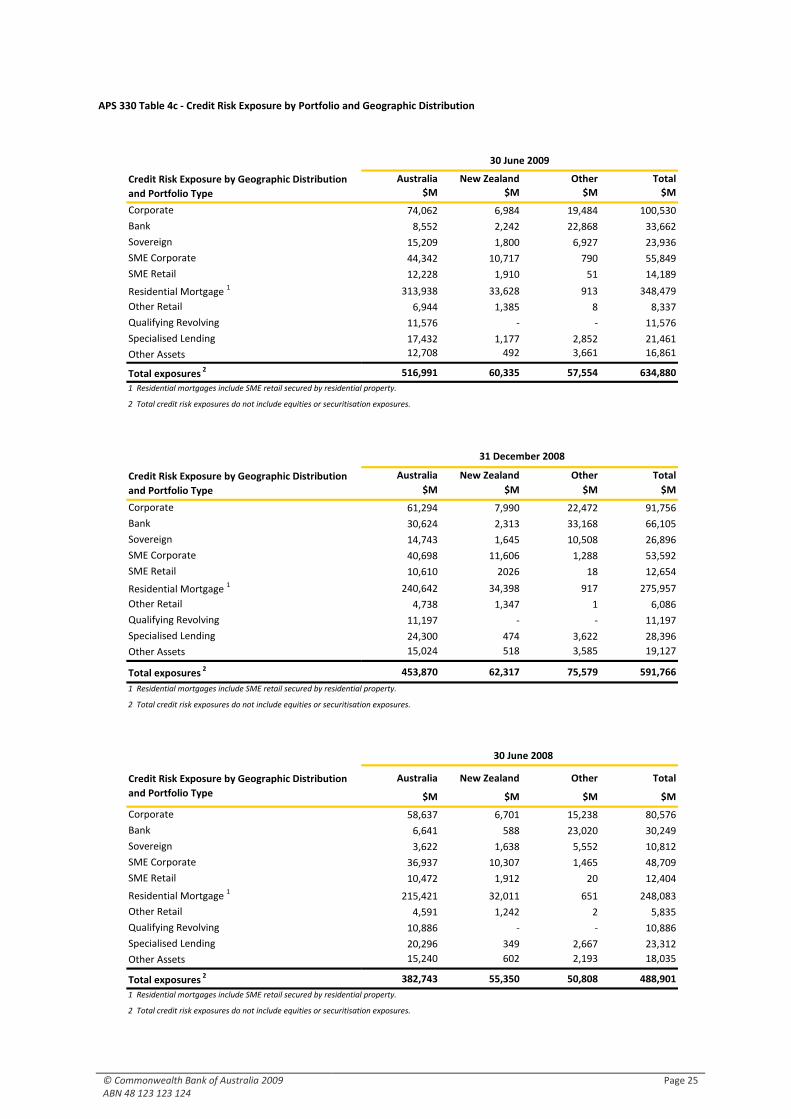
© Commonwealth Bank of Australia 2009 ABN 48 123 123 124
Page 25
APS 330 Table 4c - Credit Risk Exposure by Portfolio and Geographic Distribution
Australia New Zealand Other Total
$M $M $M $M
Corporate 74,062 6,984 19,484 100,530
Bank 8,552 2,242 22,868 33,662
Sovereign 15,209 1,800 6,927 23,936
SME Corporate 44,342 10,717 790 55,849
SME Retail 12,228 1,910 51 14,189
Residential Mortgage 1 313,938 33,628 913 348,479
Other Retail 6,944 1,385 8 8,337
Qualifying Revolving 11,576 - - 11,576
Specialised Lending 17,432 1,177 2,852 21,461
Other Assets 12,708 492 3,661 16,861
Total exposures 2 516,991 60,335 57,554 634,880
Australia New Zealand Other Total
$M $M $M $M
Corporate 61,294 7,990 22,472 91,756
Bank 30,624 2,313 33,168 66,105
Sovereign 14,743 1,645 10,508 26,896
SME Corporate 40,698 11,606 1,288 53,592
SME Retail 10,610 2026 18 12,654
Residential Mortgage 1 240,642 34,398 917 275,957
Other Retail 4,738 1,347 1 6,086
Qualifying Revolving 11,197 - - 11,197
Specialised Lending 24,300 474 3,622 28,396
Other Assets 15,024 518 3,585 19,127
Total exposures 2 453,870 62,317 75,579 591,766
Australia New Zealand Other Total
$M $M $M $M
Corporate 58,637 6,701 15,238 80,576
Bank 6,641 588 23,020 30,249
Sovereign 3,622 1,638 5,552 10,812
SME Corporate 36,937 10,307 1,465 48,709
SME Retail 10,472 1,912 20 12,404
Residential Mortgage 1 215,421 32,011 651 248,083
Other Retail 4,591 1,242 2 5,835
Qualifying Revolving 10,886 - - 10,886
Specialised Lending 20,296 349 2,667 23,312
Other Assets 15,240 602 2,193 18,035
Total exposures 2 382,743 55,350 50,808 488,901
2 Total credit risk exposures do not include equities or securitisation exposures.
2 Total credit risk exposures do not include equities or securitisation exposures.
1 Residential mortgages include SME retail secured by residential property.
1 Residential mortgages include SME retail secured by residential property.
30 June 2009
Credit Risk Exposure by Geographic Distribution
and Portfolio Type
31 December 2008
Credit Risk Exposure by Geographic Distribution
and Portfolio Type
30 June 2008
Credit Risk Exposure by Geographic Distribution
and Portfolio Type
1 Residential mortgages include SME retail secured by residential property.
2 Total credit risk exposures do not include equities or securitisation exposures.
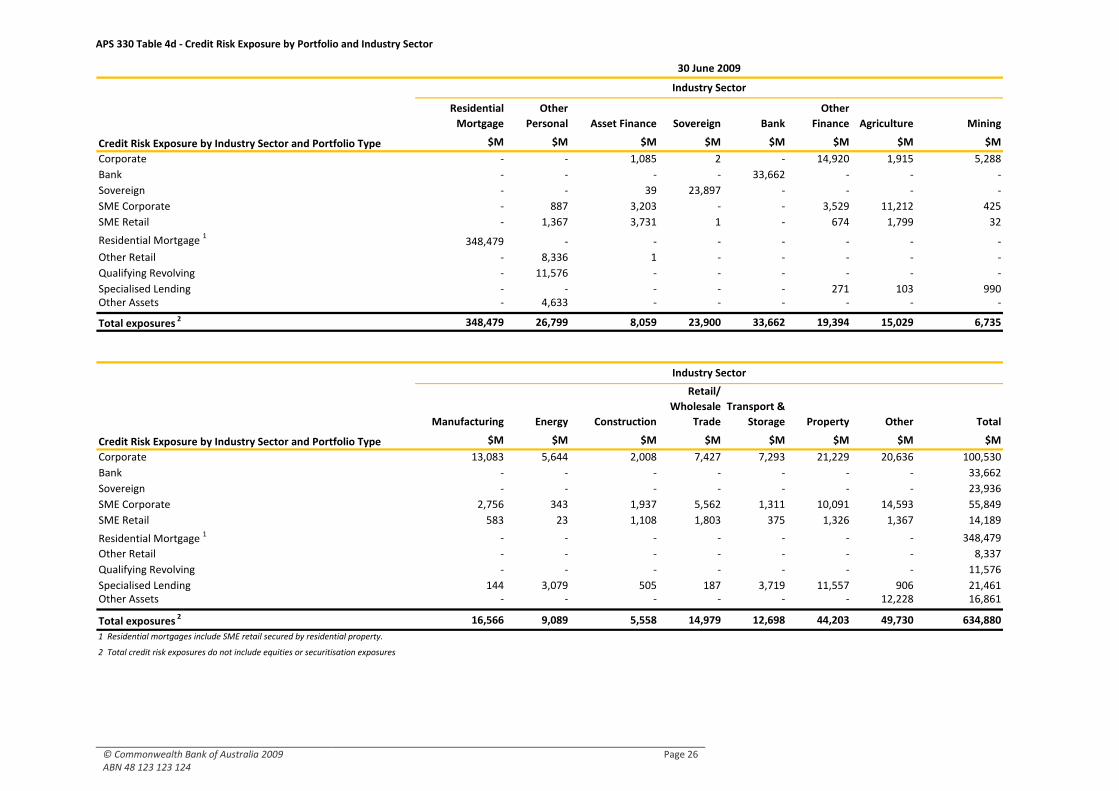
© Commonwealth Bank of Australia 2009 ABN 48 123 123 124
Page 26
APS 330 Table 4d - Credit Risk Exposure by Portfolio and Industry Sector
Residential
Mortgage
Other
Personal Asset Finance Sovereign Bank
Other
Finance Agriculture Mining
$M $M $M $M $M $M $M $M
Corporate - - 1,085 2 - 14,920 1,915 5,288
Bank - - - - 33,662 - - -
Sovereign - - 39 23,897 - - - -
SME Corporate - 887 3,203 - - 3,529 11,212 425
SME Retail - 1,367 3,731 1 - 674 1,799 32
Residential Mortgage 1 348,479 - - - - - - -
Other Retail - 8,336 1 - - - - -
Qualifying Revolving - 11,576 - - - - - -
Specialised Lending - - - - - 271 103 990 Other Assets - 4,633 - - - - - -
Total exposures 2 348,479 26,799 8,059 23,900 33,662 19,394 15,029 6,735
Manufacturing Energy Construction
Retail/
Wholesale
Trade
Transport &
Storage Property
Other Total
$M $M $M $M $M $M $M $M
Corporate 13,083 5,644 2,008 7,427 7,293 21,229 20,636 100,530
Bank - - - - - - - 33,662
Sovereign - - - - - - - 23,936
SME Corporate 2,756 343 1,937 5,562 1,311 10,091 14,593 55,849
SME Retail 583 23 1,108 1,803 375 1,326 1,367 14,189
Residential Mortgage 1 - - - - - - - 348,479
Other Retail - - - - - - - 8,337
Qualifying Revolving - - - - - - - 11,576
Specialised Lending 144 3,079 505 187 3,719 11,557 906 21,461 Other Assets - - - - - - 12,228 16,861
Total exposures 2 16,566 9,089 5,558 14,979 12,698 44,203 49,730 634,880
2 Total credit risk exposures do not include equities or securitisation exposures
30 June 2009
Industry Sector
Credit Risk Exposure by Industry Sector and Portfolio Type
Industry Sector
Credit Risk Exposure by Industry Sector and Portfolio Type
1 Residential mortgages include SME retail secured by residential property.
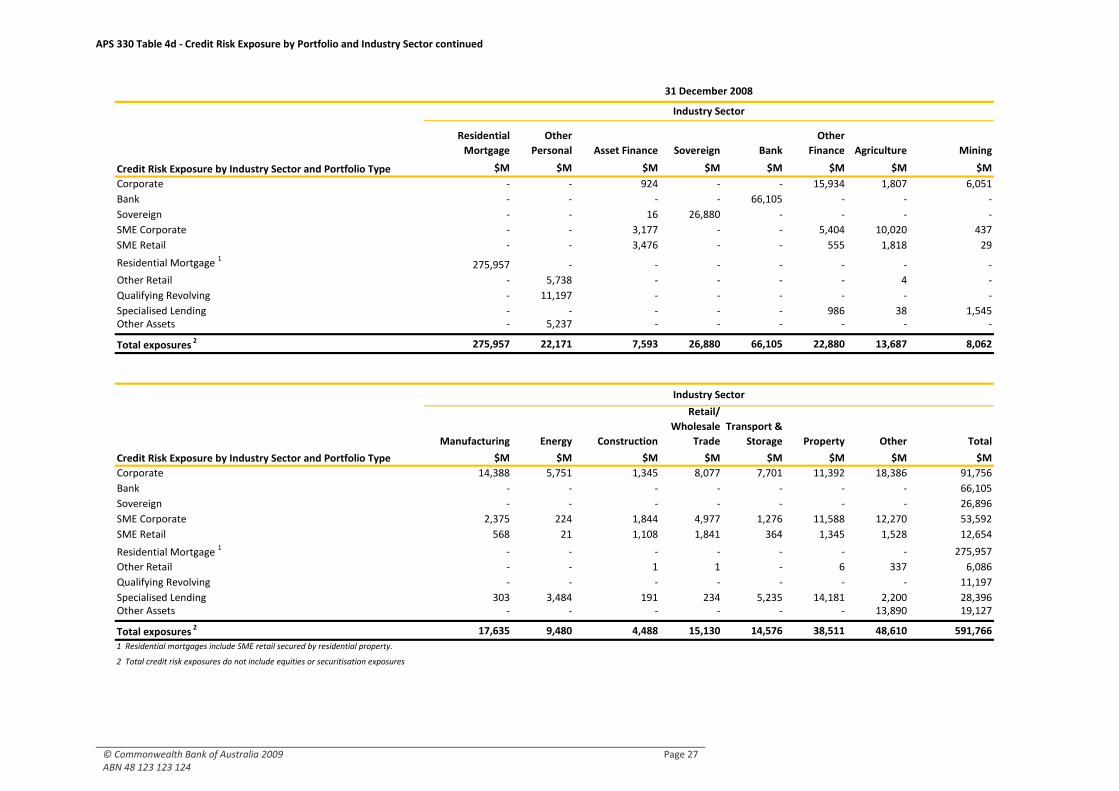
© Commonwealth Bank of Australia 2009 ABN 48 123 123 124
Page 27
APS 330 Table 4d - Credit Risk Exposure by Portfolio and Industry Sector continued
Residential
Mortgage
Other
Personal Asset Finance Sovereign Bank
Other
Finance Agriculture Mining
$M $M $M $M $M $M $M $M
Corporate - - 924 - - 15,934 1,807 6,051
Bank - - - - 66,105 - - -
Sovereign - - 16 26,880 - - - -
SME Corporate - - 3,177 - - 5,404 10,020 437
SME Retail - - 3,476 - - 555 1,818 29
Residential Mortgage 1 275,957 - - - - - - -
Other Retail - 5,738 - - - - 4 -
Qualifying Revolving - 11,197 - - - - - -
Specialised Lending - - - - - 986 38 1,545 Other Assets - 5,237 - - - - - -
Total exposures 2 275,957 22,171 7,593 26,880 66,105 22,880 13,687 8,062
Manufacturing Energy Construction
Retail/
Wholesale
Trade
Transport &
Storage Property
Other Total
$M $M $M $M $M $M $M $M
Corporate 14,388 5,751 1,345 8,077 7,701 11,392 18,386 91,756
Bank - - - - - - - 66,105
Sovereign - - - - - - - 26,896
SME Corporate 2,375 224 1,844 4,977 1,276 11,588 12,270 53,592
SME Retail 568 21 1,108 1,841 364 1,345 1,528 12,654
Residential Mortgage 1 - - - - - - - 275,957
Other Retail - - 1 1 - 6 337 6,086
Qualifying Revolving - - - - - - - 11,197
Specialised Lending 303 3,484 191 234 5,235 14,181 2,200 28,396 Other Assets - - - - - - 13,890 19,127
Total exposures 2 17,635 9,480 4,488 15,130 14,576 38,511 48,610 591,766
31 December 2008
1 Residential mortgages include SME retail secured by residential property.
2 Total credit risk exposures do not include equities or securitisation exposures
Industry Sector
Industry Sector
Credit Risk Exposure by Industry Sector and Portfolio Type
Credit Risk Exposure by Industry Sector and Portfolio Type
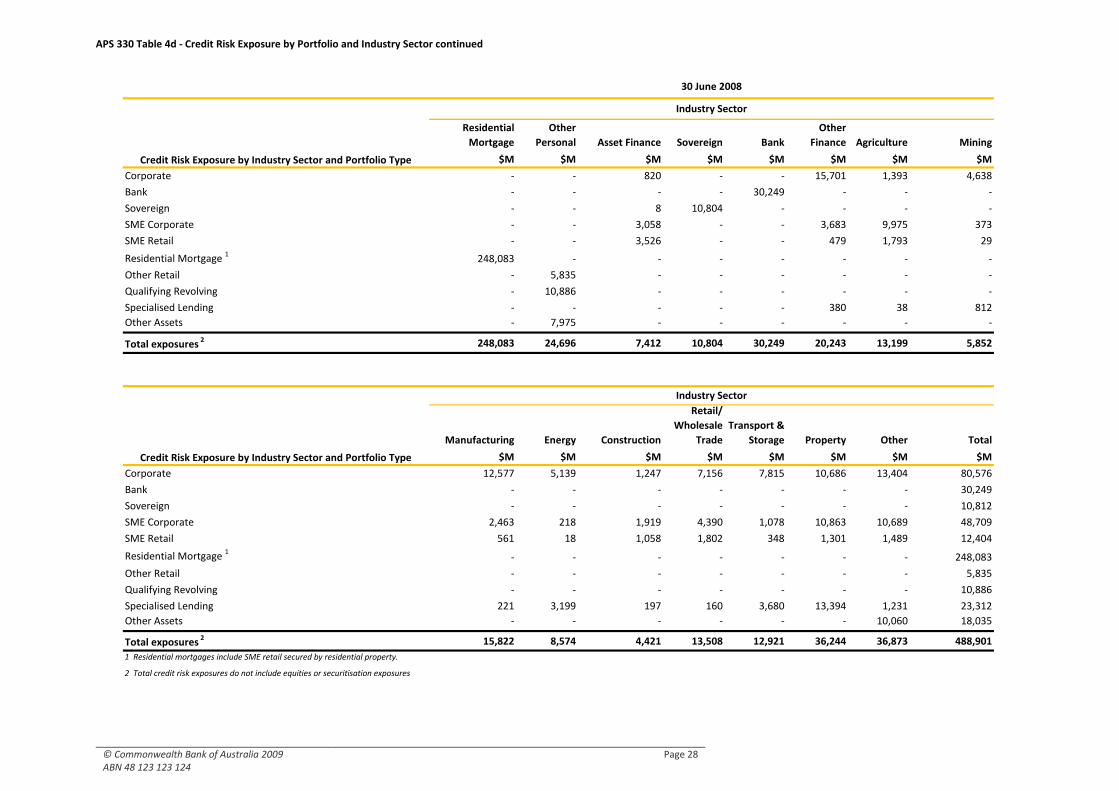
© Commonwealth Bank of Australia 2009 ABN 48 123 123 124
Page 28
APS 330 Table 4d - Credit Risk Exposure by Portfolio and Industry Sector continued
Residential
Mortgage
Other
Personal Asset Finance Sovereign Bank
Other
Finance Agriculture Mining
$M $M $M $M $M $M $M $M
Corporate - - 820 - - 15,701 1,393 4,638
Bank - - - - 30,249 - - -
Sovereign - - 8 10,804 - - - -
SME Corporate - - 3,058 - - 3,683 9,975 373
SME Retail - - 3,526 - - 479 1,793 29
Residential Mortgage 1 248,083 - - - - - - -
Other Retail - 5,835 - - - - - -
Qualifying Revolving - 10,886 - - - - - -
Specialised Lending - - - - - 380 38 812
Other Assets - 7,975 - - - - - -
Total exposures 2 248,083 24,696 7,412 10,804 30,249 20,243 13,199 5,852
Manufacturing Energy Construction
Retail/
Wholesale
Trade
Transport &
Storage Property
Other Total
$M $M $M $M $M $M $M $M
Corporate 12,577 5,139 1,247 7,156 7,815 10,686 13,404 80,576
Bank - - - - - - - 30,249
Sovereign - - - - - - - 10,812
SME Corporate 2,463 218 1,919 4,390 1,078 10,863 10,689 48,709
SME Retail 561 18 1,058 1,802 348 1,301 1,489 12,404
Residential Mortgage 1 - - - - - - - 248,083
Other Retail - - - - - - - 5,835
Qualifying Revolving - - - - - - - 10,886
Specialised Lending 221 3,199 197 160 3,680 13,394 1,231 23,312
Other Assets - - - - - - 10,060 18,035
Total exposures 2 15,822 8,574 4,421 13,508 12,921 36,244 36,873 488,901
Industry Sector
Credit Risk Exposure by Industry Sector and Portfolio Type
30 June 2008
Industry Sector
2 Total credit risk exposures do not include equities or securitisation exposures
1 Residential mortgages include SME retail secured by residential property.
Credit Risk Exposure by Industry Sector and Portfolio Type
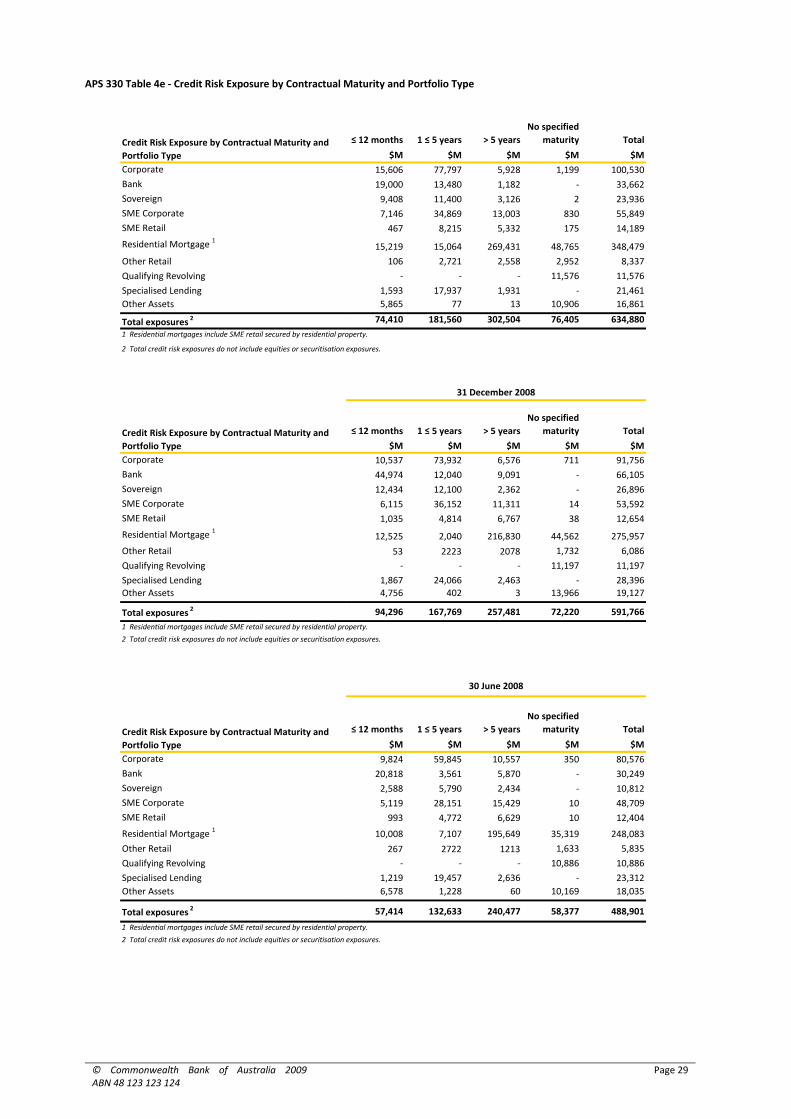
© Commonwealth Bank of Australia 2009 ABN 48 123 123 124
Page 29
APS 330 Table 4e - Credit Risk Exposure by Contractual Maturity and Portfolio Type
≤ 12 months 1 ≤ 5 years > 5 years
No specified
maturity Total
$M $M $M $M $M
Corporate 15,606 77,797 5,928 1,199 100,530
Bank 19,000 13,480 1,182 - 33,662
Sovereign 9,408 11,400 3,126 2 23,936
SME Corporate 7,146 34,869 13,003 830 55,849
SME Retail 467 8,215 5,332 175 14,189
Residential Mortgage 1 15,219 15,064 269,431 48,765 348,479
Other Retail 106 2,721 2,558 2,952 8,337
Qualifying Revolving - - - 11,576 11,576
Specialised Lending 1,593 17,937 1,931 - 21,461
Other Assets 5,865 77 13 10,906 16,861
Total exposures 2 74,410 181,560 302,504 76,405 634,880
≤ 12 months 1 ≤ 5 years > 5 years
No specified
maturity Total
$M $M $M $M $M
Corporate 10,537 73,932 6,576 711 91,756
Bank 44,974 12,040 9,091 - 66,105
Sovereign 12,434 12,100 2,362 - 26,896
SME Corporate 6,115 36,152 11,311 14 53,592
SME Retail 1,035 4,814 6,767 38 12,654
Residential Mortgage 1 12,525 2,040 216,830 44,562 275,957
Other Retail 53 2223 2078 1,732 6,086
Qualifying Revolving - - - 11,197 11,197
Specialised Lending 1,867 24,066 2,463 - 28,396
Other Assets 4,756 402 3 13,966 19,127
Total exposures 2 94,296 167,769 257,481 72,220 591,766
≤ 12 months 1 ≤ 5 years > 5 years
No specified
maturity Total
$M $M $M $M $M
Corporate 9,824 59,845 10,557 350 80,576
Bank 20,818 3,561 5,870 - 30,249
Sovereign 2,588 5,790 2,434 - 10,812
SME Corporate 5,119 28,151 15,429 10 48,709
SME Retail 993 4,772 6,629 10 12,404
Residential Mortgage 1 10,008 7,107 195,649 35,319 248,083
Other Retail 267 2722 1213 1,633 5,835
Qualifying Revolving - - - 10,886 10,886
Specialised Lending 1,219 19,457 2,636 - 23,312
Other Assets 6,578 1,228 60 10,169 18,035
Total exposures 2 57,414 132,633 240,477 58,377 488,901
Credit Risk Exposure by Contractual Maturity and
Portfolio Type
1 Residential mortgages include SME retail secured by residential property.
30 June 2008
2 Total credit risk exposures do not include equities or securitisation exposures.
2 Total credit risk exposures do not include equities or securitisation exposures.
2 Total credit risk exposures do not include equities or securitisation exposures.
Credit Risk Exposure by Contractual Maturity and
Portfolio Type
31 December 2008
Credit Risk Exposure by Contractual Maturity and
Portfolio Type
1 Residential mortgages include SME retail secured by residential property.
1 Residential mortgages include SME retail secured by residential property.
© Commonwealth Bank of Australia 2009 ABN 48 123 123 124
Page 30
Provisioning for Impairment
The Group assesses and measures credit losses in accordance with statutory financial accounting requirements under the Corporations Act and Australian Accounting Standards Board (AASB) Standards, and APRA regulatory requirements.
Accounting standard AASB 139 “Financial Instruments: Recognition and Measurement” requires the Group to assess whether a financial asset or a group of financial assets is impaired. Impairment losses are recognised if there is objective evidence of impairment. Separate accounting provisions are also raised under AASB 137 “Provisions, Contingent Liabilities and Contingent Assets” and AASB 136 “Impairment of Assets”.
APRA Prudential Standard APS 220 “Credit Quality” requires the Group to report Specific Provisions and a General Reserve for Credit Losses (GRCL) and requires that impairment be recognised for both on and off balance sheet items, including financial guarantees.
The Group has determined that its individually assessed provisions comply with APRA’s prudential requirements with respect to assessing specific provisions and that its collective and other credit provisions are consistent with APRA’s requirements.
APRA Prudential Standard APS 111 “Capital Adequacy: Measurement of Capital” requires the Group to reduce Tier One and Tier Two capital (on a 50/50 basis) when the amount of regulatory expected losses (before any tax effects) is in excess of APRA defined eligible provisions (net of deferred tax assets).
The Group assesses its provisioning for impairment in accordance with AASB 139 and recognises both individually assessed provisions and collectively assessed provisions.
This is done by a monthly process wherein key business, risk and finance employees meet to review the credit portfolio of credits, arrears data etc. A monthly provision is then determined. This number results in monthly accounting entries that record the outcome, which is then reviewed with the Risk Committee at their next meeting.
Individually Assessed and Collective Provisions
The Group assesses at each balance date whether there is any objective evidence of impairment.
If there is objective evidence that an impairment loss on loans, advances and other receivables has been incurred, the amount of the loss is measured as the difference between the asset’s carrying amount and the present value of the expected future cash flows (excluding future credit losses that have not been incurred), discounted at the financial asset’s original effective interest rate. Short-term balances are not discounted. Individually assessed provisions are made against individual facilities in the risk rated managed segment where a loss of $10,000 or more is expected.
All other loans and advances that do not have an individually assessed provision are assessed collectively for impairment. Collective provisions are maintained to reduce the carrying amount of portfolios of similar loans and advances to their estimated recoverable amounts at the balance sheet date.
The evaluation process for these collective provisions is subject to a series of estimates and judgments depending on how the portfolio is managed:
Risk rated segment - the risk rating system, including the frequency of default and loss given default (LGD) rates, and loss history are considered; or
Retail managed segment - the history of arrears and losses are reviewed for the various portfolios.
Current developments in portfolios including performance, quality and economic conditions are considered as part of the collective provisioning process. Changes in these estimates can have a direct impact on the level of provision determined.
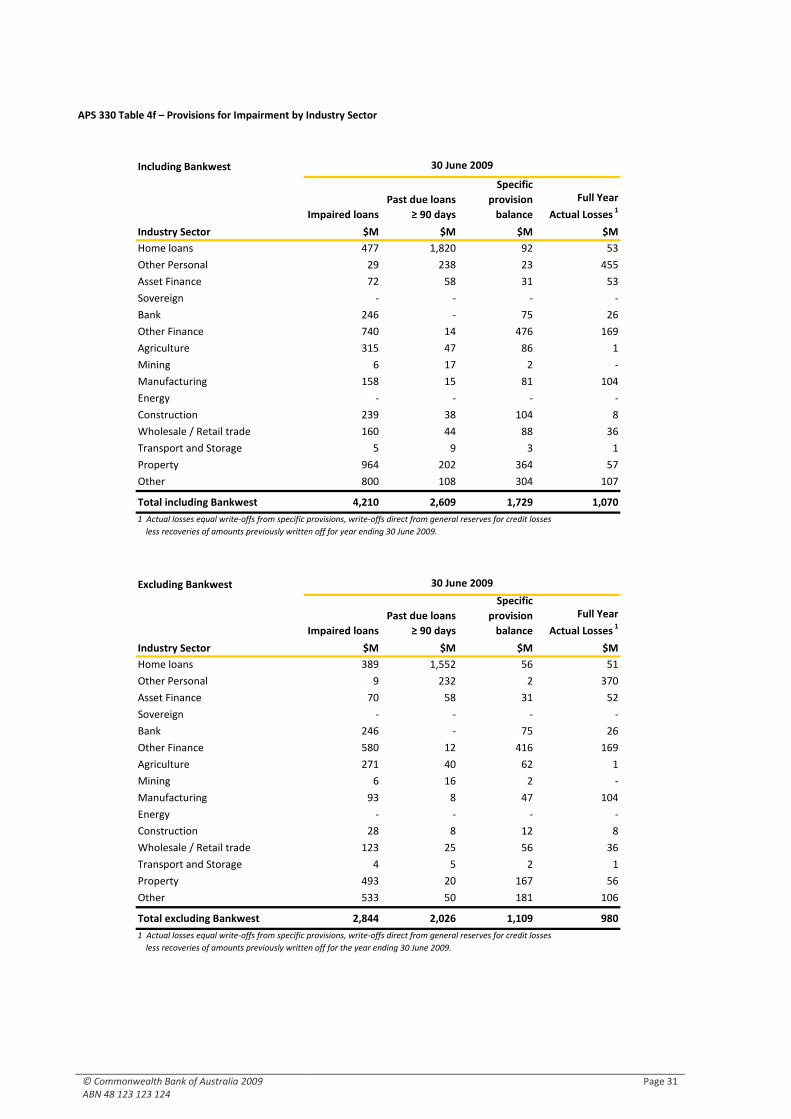
© Commonwealth Bank of Australia 2009 ABN 48 123 123 124
Page 31
APS 330 Table 4f – Provisions for Impairment by Industry Sector
Including Bankwest
Impaired loans
Past due loans
≥ 90 days
Specific
provision
balance
Full Year
Actual Losses 1
Industry Sector $M $M $M $M
Home loans 477 1,820 92 53
Other Personal 29 238 23 455
Asset Finance 72 58 31 53
Sovereign - - - -
Bank 246 - 75 26
Other Finance 740 14 476 169
Agriculture 315 47 86 1
Mining 6 17 2 -
Manufacturing 158 15 81 104
Energy - - - -
Construction 239 38 104 8
Wholesale / Retail trade 160 44 88 36
Transport and Storage 5 9 3 1
Property 964 202 364 57
Other 800 108 304 107
Total including Bankwest 4,210 2,609 1,729 1,070
Excluding Bankwest
Impaired loans
Past due loans
≥ 90 days
Specific
provision
balance
Full Year
Actual Losses 1
Industry Sector $M $M $M $M
Home loans 389 1,552 56 51
Other Personal 9 232 2 370
Asset Finance 70 58 31 52
Sovereign - - - -
Bank 246 - 75 26
Other Finance 580 12 416 169
Agriculture 271 40 62 1
Mining 6 16 2 -
Manufacturing 93 8 47 104
Energy - - - -
Construction 28 8 12 8
Wholesale / Retail trade 123 25 56 36
Transport and Storage 4 5 2 1
Property 493 20 167 56
Other 533 50 181 106
Total excluding Bankwest 2,844 2,026 1,109 980
30 June 2009
1 Actual losses equal write-offs from specific provisions, write-offs direct from general reserves for credit losses
less recoveries of amounts previously written off for the year ending 30 June 2009.
30 June 2009
1 Actual losses equal write-offs from specific provisions, write-offs direct from general reserves for credit losses
less recoveries of amounts previously written off for year ending 30 June 2009.
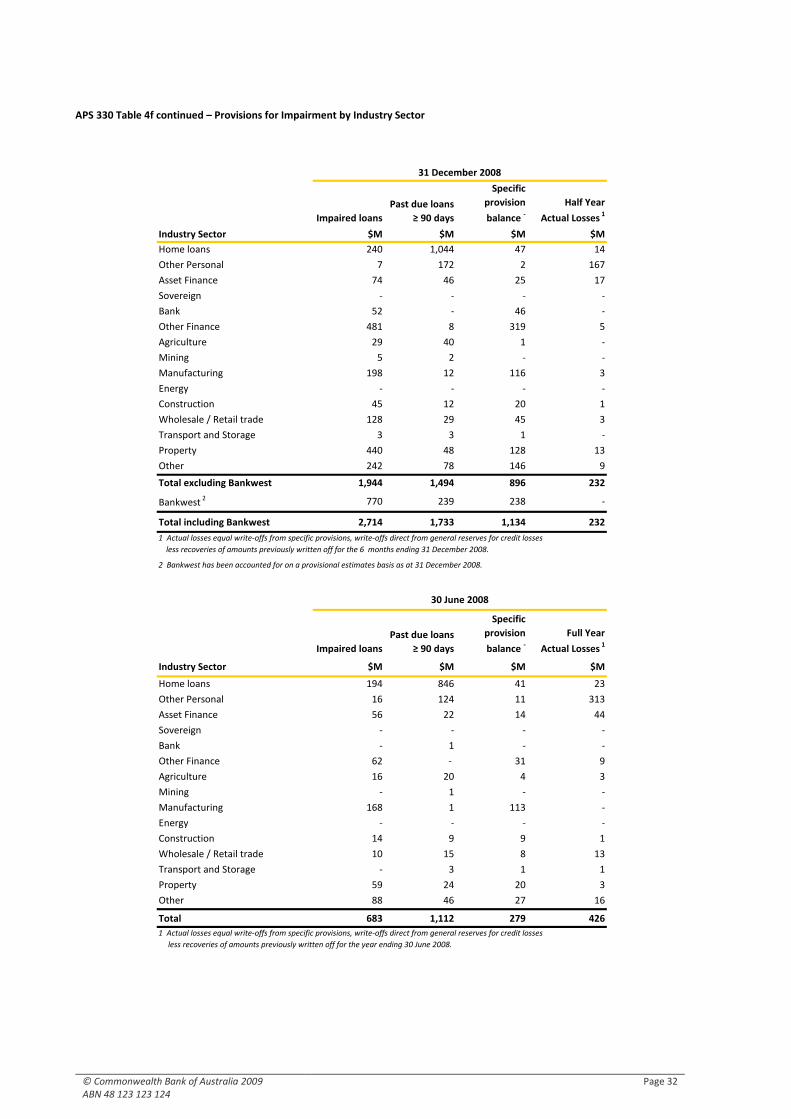
© Commonwealth Bank of Australia 2009 ABN 48 123 123 124
Page 32
APS 330 Table 4f continued – Provisions for Impairment by Industry Sector
Impaired loans
Past due loans
≥ 90 days
Specific
provision
balance -Half Year
Actual Losses 1
Industry Sector $M $M $M $M
Home loans 240 1,044 47 14
Other Personal 7 172 2 167
Asset Finance 74 46 25 17
Sovereign - - - -
Bank 52 - 46 -
Other Finance 481 8 319 5
Agriculture 29 40 1 -
Mining 5 2 - -
Manufacturing 198 12 116 3
Energy - - - -
Construction 45 12 20 1
Wholesale / Retail trade 128 29 45 3
Transport and Storage 3 3 1 -
Property 440 48 128 13
Other 242 78 146 9
Total excluding Bankwest 1,944 1,494 896 232
Bankwest 2 770 239 238 -
Total including Bankwest 2,714 1,733 1,134 232
Impaired loans
Past due loans
≥ 90 days
Specific
provision
balance -Full Year
Actual Losses 1
Industry Sector $M $M $M $M
Home loans 194 846 41 23
Other Personal 16 124 11 313
Asset Finance 56 22 14 44
Sovereign - - - -
Bank - 1 - -
Other Finance 62 - 31 9
Agriculture 16 20 4 3
Mining - 1 - -
Manufacturing 168 1 113 -
Energy - - - -
Construction 14 9 9 1
Wholesale / Retail trade 10 15 8 13
Transport and Storage - 3 1 1
Property 59 24 20 3
Other 88 46 27 16
Total 683 1,112 279 426
1 Actual losses equal write-offs from specific provisions, write-offs direct from general reserves for credit losses
less recoveries of amounts previously written off for the year ending 30 June 2008.
30 June 2008
31 December 2008
1 Actual losses equal write-offs from specific provisions, write-offs direct from general reserves for credit losses
less recoveries of amounts previously written off for the 6 months ending 31 December 2008.
2 Bankwest has been accounted for on a provisional estimates basis as at 31 December 2008.
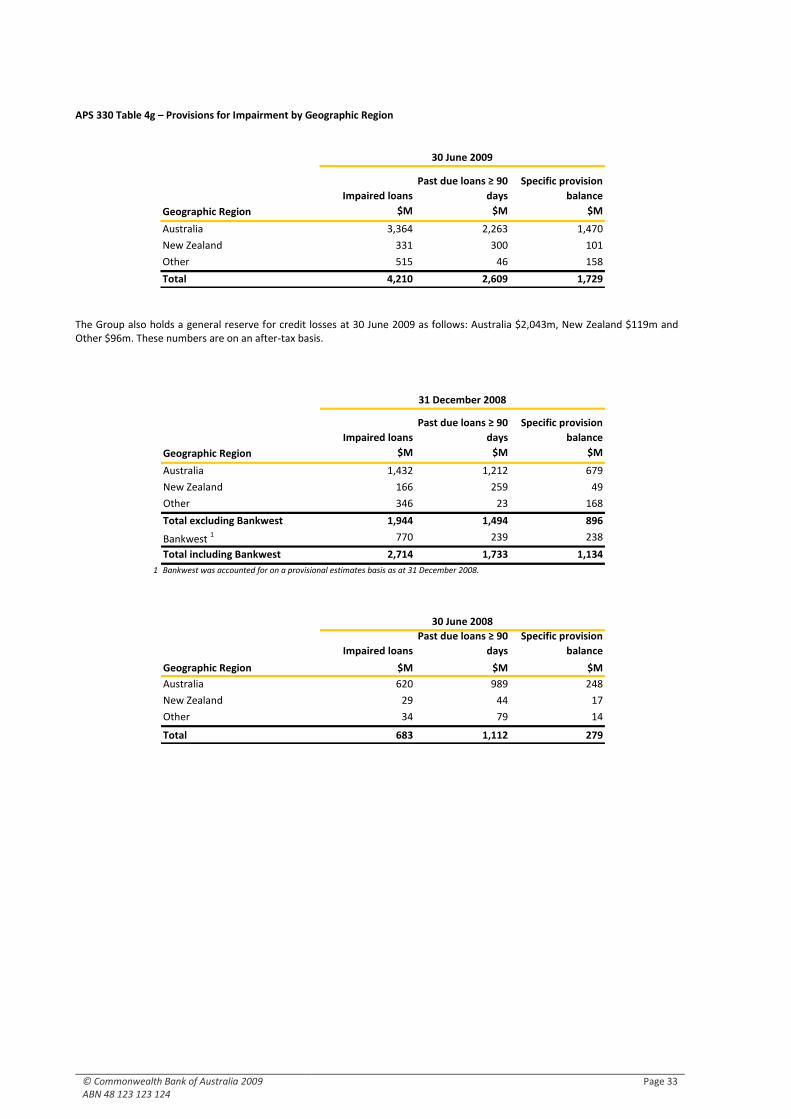
© Commonwealth Bank of Australia 2009 ABN 48 123 123 124
Page 33
APS 330 Table 4g – Provisions for Impairment by Geographic Region
The Group also holds a general reserve for credit losses at 30 June 2009 as follows: Australia $2,043m, New Zealand $119m and Other $96m. These numbers are on an after-tax basis.
Impaired loans
Past due loans ≥ 90
days
Specific provision
balance
Geographic Region $M $M $M
Australia 1,432 1,212 679
New Zealand 166 259 49
Other 346 23 168
Total excluding Bankwest 1,944 1,494 896
Bankwest 1 770 239 238
Total including Bankwest 2,714 1,733 1,134
1
Impaired loans
Past due loans ≥ 90
days
Specific provision
balance
Geographic Region $M $M $M
Australia 620 989 248
New Zealand 29 44 17
Other 34 79 14
Total 683 1,112 279
31 December 2008
30 June 2008
Bankwest was accounted for on a provisional estimates basis as at 31 December 2008.
Impaired loans
Past due loans ≥ 90
days
Specific provision
balance
Geographic Region $M $M $M
Australia 3,364 2,263 1,470
New Zealand 331 300 101
Other 515 46 158
Total 4,210 2,609 1,729
30 June 2009
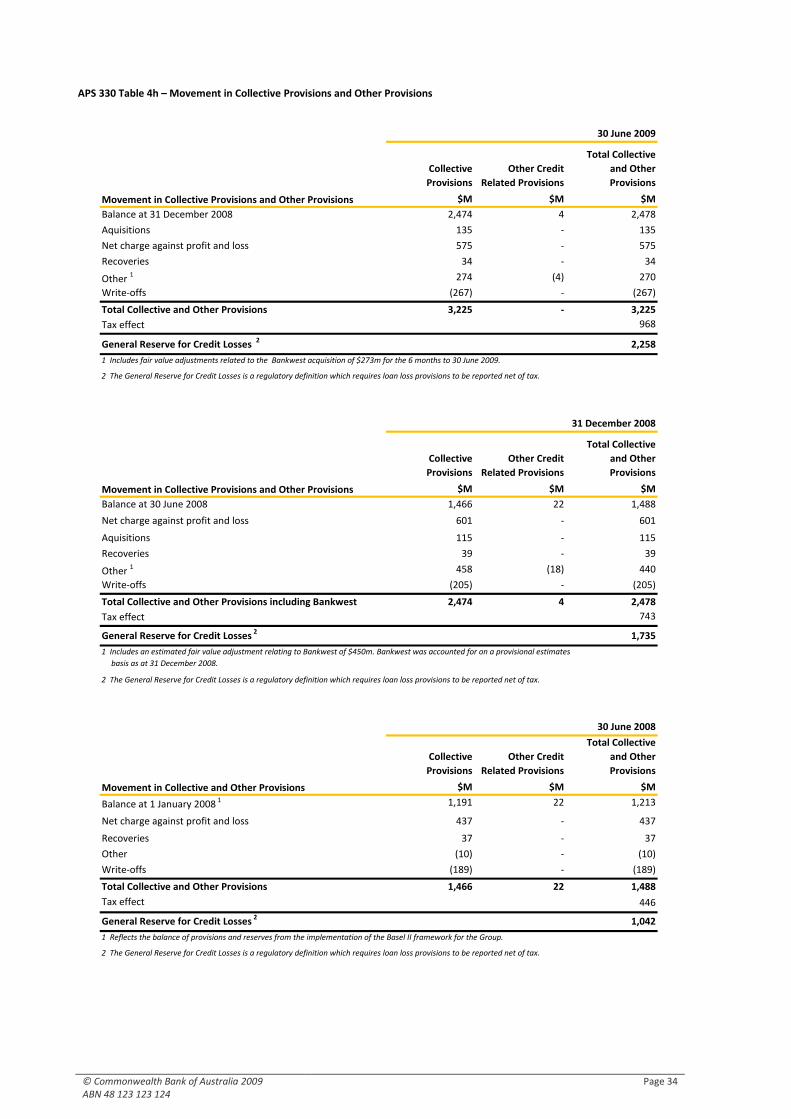
© Commonwealth Bank of Australia 2009 ABN 48 123 123 124
Page 34
APS 330 Table 4h – Movement in Collective Provisions and Other Provisions
Collective
Provisions
Other Credit
Related Provisions
Total Collective
and Other
Provisions
$M $M $M
Balance at 31 December 2008 2,474 4 2,478
Aquisitions 135 - 135
Net charge against profit and loss 575 - 575
Recoveries 34 - 34
Other 1 274 (4) 270
Write-offs (267) - (267)
Total Collective and Other Provisions 3,225 - 3,225
Tax effect 968
General Reserve for Credit Losses 2 2,258
Collective
Provisions
Other Credit
Related Provisions
Total Collective
and Other
Provisions
$M $M $M
Balance at 30 June 2008 1,466 22 1,488
Net charge against profit and loss 601 - 601
Aquisitions 115 - 115
Recoveries 39 - 39
Other 1 458 (18) 440
Write-offs (205) - (205)
Total Collective and Other Provisions including Bankwest 2,474 4 2,478
Tax effect 743
General Reserve for Credit Losses 2 1,735
Collective
Provisions
Other Credit
Related Provisions
Total Collective
and Other
Provisions
$M $M $M
Balance at 1 January 2008 1 1,191 22 1,213
Net charge against profit and loss 437 - 437
Recoveries 37 - 37
Other (10) - (10)
Write-offs (189) - (189)
Total Collective and Other Provisions 1,466 22 1,488
Tax effect 446
General Reserve for Credit Losses 2 1,042
2 The General Reserve for Credit Losses is a regulatory definition which requires loan loss provisions to be reported net of tax.
30 June 2009
Movement in Collective Provisions and Other Provisions
2 The General Reserve for Credit Losses is a regulatory definition which requires loan loss provisions to be reported net of tax.
2 The General Reserve for Credit Losses is a regulatory definition which requires loan loss provisions to be reported net of tax.
1 Includes fair value adjustments related to the Bankwest acquisition of $273m for the 6 months to 30 June 2009.
31 December 2008
Movement in Collective Provisions and Other Provisions
1 Includes an estimated fair value adjustment relating to Bankwest of $450m. Bankwest was accounted for on a provisional estimates
basis as at 31 December 2008.
30 June 2008
Movement in Collective and Other Provisions
1 Reflects the balance of provisions and reserves from the implementation of the Basel II framework for the Group.
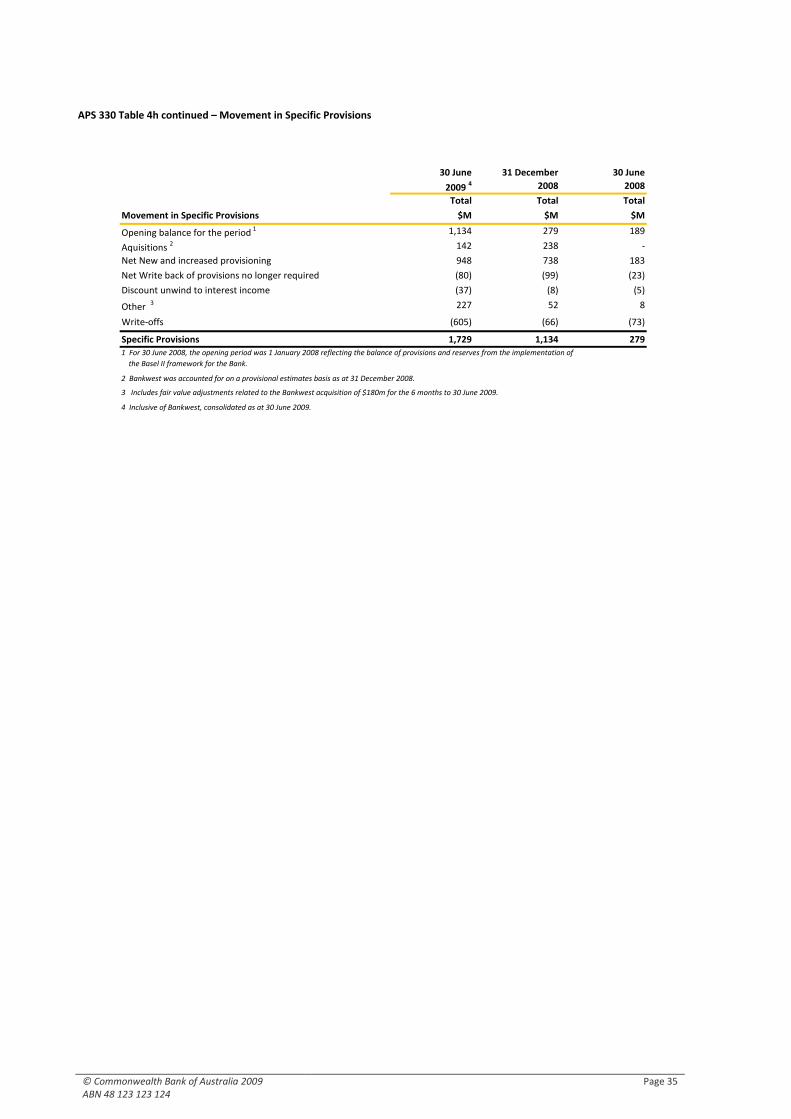
© Commonwealth Bank of Australia 2009 ABN 48 123 123 124
Page 35
APS 330 Table 4h continued – Movement in Specific Provisions
30 June
2009 431 December
2008
30 June
2008
Total Total Total
Movement in Specific Provisions $M $M $M
Opening balance for the period 1 1,134 279 189
Aquisitions 2 142 238 -
Net New and increased provisioning 948 738 183
Net Write back of provisions no longer required (80) (99) (23)
Discount unwind to interest income (37) (8) (5)
Other 3 227 52 8
Write-offs (605) (66) (73)
Specific Provisions 1,729 1,134 279
2 Bankwest was accounted for on a provisional estimates basis as at 31 December 2008.
1 For 30 June 2008, the opening period was 1 January 2008 reflecting the balance of provisions and reserves from the implementation of
the Basel II framework for the Bank.
4 Inclusive of Bankwest, consolidated as at 30 June 2009.
3 Includes fair value adjustments related to the Bankwest acquisition of $180m for the 6 months to 30 June 2009.
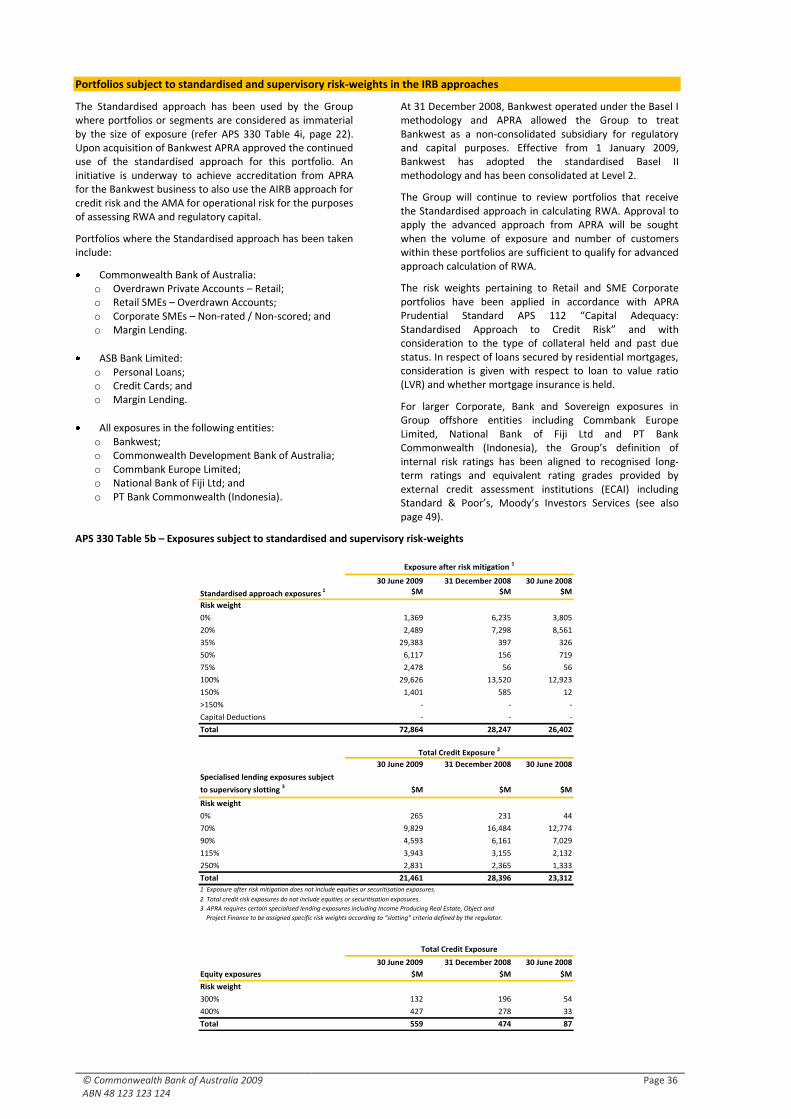
© Commonwealth Bank of Australia 2009 ABN 48 123 123 124
Page 36
Portfolios subject to standardised and supervisory risk-weights in the IRB approaches
The Standardised approach has been used by the Group where portfolios or segments are considered as immaterial by the size of exposure (refer APS 330 Table 4i, page 22). Upon acquisition of Bankwest APRA approved the continued use of the standardised approach for this portfolio. An initiative is underway to achieve accreditation from APRA for the Bankwest business to also use the AIRB approach for credit risk and the AMA for operational risk for the purposes of assessing RWA and regulatory capital.
Portfolios where the Standardised approach has been taken include:
Commonwealth Bank of Australia: o Overdrawn Private Accounts – Retail; o Retail SMEs – Overdrawn Accounts; o Corporate SMEs – Non-rated / Non-scored; and o Margin Lending.
ASB Bank Limited: o Personal Loans; o Credit Cards; and o Margin Lending.
All exposures in the following entities: o Bankwest; o Commonwealth Development Bank of Australia; o Commbank Europe Limited; o National Bank of Fiji Ltd; and o PT Bank Commonwealth (Indonesia).
At 31 December 2008, Bankwest operated under the Basel I methodology and APRA allowed the Group to treat Bankwest as a non-consolidated subsidiary for regulatory and capital purposes. Effective from 1 January 2009, Bankwest has adopted the standardised Basel II methodology and has been consolidated at Level 2.
The Group will continue to review portfolios that receive the Standardised approach in calculating RWA. Approval to apply the advanced approach from APRA will be sought when the volume of exposure and number of customers within these portfolios are sufficient to qualify for advanced approach calculation of RWA.
The risk weights pertaining to Retail and SME Corporate portfolios have been applied in accordance with APRA Prudential Standard APS 112 “Capital Adequacy: Standardised Approach to Credit Risk” and with consideration to the type of collateral held and past due status. In respect of loans secured by residential mortgages, consideration is given with respect to loan to value ratio (LVR) and whether mortgage insurance is held.
For larger Corporate, Bank and Sovereign exposures in Group offshore entities including Commbank Europe Limited, National Bank of Fiji Ltd and PT Bank Commonwealth (Indonesia), the Group’s definition of internal risk ratings has been aligned to recognised long-term ratings and equivalent rating grades provided by external credit assessment institutions (ECAI) including Standard & Poor’s, Moody’s Investors Services (see also page 49).
APS 330 Table 5b – Exposures subject to standardised and supervisory risk-weights
30 June 2009 31 December 2008 30 June 2008$M $M $M
Risk weight
0% 1,369 6,235 3,805
20% 2,489 7,298 8,561
35% 29,383 397 326
50% 6,117 156 719
75% 2,478 56 56
100% 29,626 13,520 12,923
150% 1,401 585 12
>150% - - -
Capital Deductions - - -
Total 72,864 28,247 26,402
30 June 2009 31 December 2008 30 June 2008
Specialised lending exposures subject
to supervisory slotting 3 $M $M $M
Risk weight
0% 265 231 44
70% 9,829 16,484 12,774
90% 4,593 6,161 7,029
115% 3,943 3,155 2,132
250% 2,831 2,365 1,333
Total 21,461 28,396 23,312
30 June 2009 31 December 2008 30 June 2008
Equity exposures $M $M $M
Risk weight
300% 132 196 54
400% 427 278 33
Total 559 474 87
Total Credit Exposure
Exposure after risk mitigation 1
Total Credit Exposure 2
1 Exposure after risk mitigation does not include equities or securitisation exposures.
2 Total credit risk exposures do not include equities or securitisation exposures.
3 APRA requires certain specialised lending exposures including Income Producing Real Estate, Object and
Project Finance to be assigned specific risk weights according to “slotting” criteria defined by the regulator.
Standardised approach exposures 1
© Commonwealth Bank of Australia 2009 ABN 48 123 123 124
Page 37
Portfolios subject to Internal Ratings Based approaches
The measurement of credit risk is based on an internal credit risk rating system developed by the Commonwealth Bank, and uses analytical tools to calculate expected and unexpected loss for the credit portfolio. A credit risk measurement system for corporate customer exposures was first introduced in the Group in mid 1994, and an enhanced version of the rating system was applied in 1995 to allow operation on a two-dimensional basis (probability of default or PD and loss given default or LGD). Refer to “Credit Risk Measurement” for more discussion on these measures.
This has subsequently been enhanced as the result of reviewing outcomes against projections and the alignment of internal ratings with external rating agency grades. To provide greater granularity for risk management and for origination/pricing purposes, in 1998 the five pass grade rating scale was expanded to sixteen for the more sophisticated end of the corporate curve. The Group has also been using scorecards to “auto-decision” loan applications for over 15 years in its Consumer Retail business. SME Retail applications are auto-decisioned for the approval of credit using a scorecard approach whereby the performance of historical applications is supplemented by information from a credit reference bureau and/or from the Group’s existing knowledge of a customer’s behaviour.
During this time, the Group has developed robust credit policies, procedures, rules, credit underwriting standards, counterparty standards, and credit product standards, and used its credit risk factors to price transactions, measure performance and help determine the amount of capital required to support business activities.
As a result of the Group’s rigorous approach to the measurement of credit risk and strong processes and controls, APRA granted advanced Basel II accreditation to the Group on 10 December 2007 for the purpose of calculating the Group's capital requirements under APRA Prudential Standard APS 113 “Capital Adequacy: Internal Ratings-based Approach to Credit Risk”.
More granular LGD have been developed for Asset Finance exposures during the year depending on whether they are retail or non-retail and on the type of asset being financed (e.g. motor vehicles, shop fitting etc.). New pools have been implemented for SME retail exposures less than $1 million based on behaviour score modeling.
The credit risk portfolio has two major segments, Risk Rated and Retail:
(i) Risk Rated
The Risk Rated Segment comprises exposures to bank, sovereign and corporate obligors. Commercial exposures less than $1 million that are required to be risk rated and individually managed under the Group’s internal credit policy are classified under the small and medium enterprise (SME) corporate asset class.
Obligors that are risk rated have their PD Rating assigned either via Expert Judgement and/or by using the appropriate PD Rating Calculator. Obligors whose PD Ratings are assigned via Expert Judgement include Banks, Sovereigns and large corporate customers of the Institutional Bank. Under Expert Judgement, PD ratings are assigned based on the expert knowledge of the credit officer conducting the review. The credit officer may use multiple rating inputs, including internal rating and the ratings assigned by an external rating agency, benchmark rating criteria, market or other relevant information to assist with the rating decision.
For the Middle Market and Local Business Banking segments, PD Calculators are the primary method of assigning a PD Rating. PD Calculators are statistical models designed to replicate the rating process under Expert Judgment with different models tailored to different industry segments. Ratings are assigned based on the responses to a series of questions relating to the financial condition of the customer’s business, as well as questions relating to management capability and integrity. The responses are weighted by their importance in predicting credit quality and are used to calculate an overall score upon which the rating is determined.
Both the Expert Judgement and PD calculator rating methods target a common rating descriptor for each risk grade. The rating descriptors are the same, regardless of how the rating is assigned and all ratings map to the same PD master scale which allocates probabilities of default to each PD grade. For ratings assigned by Expert Judgement, there are eighteen non-default grades (A0 through to G) and one default grade (H) as shown in APS 330 Table 6b (page 38). For ratings assigned via the PD Calculators, there are eleven non-default grades (A2, B2, C2, D1, D2, D3, E1, E2, E3, F and G) and one default grade (H).
The PD Rating reflects the statistical probability of default for that grade over a one-year horizon. The Group’s rating approach reflects features of both through the cycle (TTC) and point in time (PIT) approaches to rating assignment. Under a PIT approach, ratings translate into PDs that are conditioned on how the industry and the economy are currently performing. A TTC approach is best exemplified by the rating agencies, where ratings are based on longer term considerations to capture a company’s ability to perform through a typical down-turn in the cycle. The rating approach (PIT or TTC) does not affect the long-run average PD for a particular rating, only the volatility of the observed default rate is impacted. The Group’s rating criteria reflect both long-run and current considerations of the financial health of an obligor.
PD Ratings fall within the following categories:
1. ‘Exceptional’: (A0 through to A3) - a strong profit history with principal and interest repayments covered by large stable surpluses.
2. ‘Strong’: (B1 through to C3) – a strongly performing business with principal and interest payments well protected by stable cash operating surpluses.
3. ‘Pass’: (D1 through to E3) – a soundly performing business with sufficient operating cash surpluses to meet all principal and interest repayments.
4. ‘Weak’: (F, G) – profitability has been weak and the capacity to meet principal and interest payments is declining.
5. ‘Default’: (H) – the obligation is in default (see below).
A PD Rating of ‘Pass’ grade or above qualifies the obligor for approval of new facilities or increased exposure on normal commercial terms. An obligor whose PD Rating is ‘Weak’ (excluding F grade well secured) or ‘Default’ is not eligible for new facilities or increased exposure unless it will protect or improve the Group’s position by maximising recovery prospects or to facilitate rehabilitation.
For the purpose of determining the PD Rating, default is defined as any one of the following:
A contractual payment is overdue by 90 days or more;
An approved overdraft limit has been exceeded for 90 days or more;
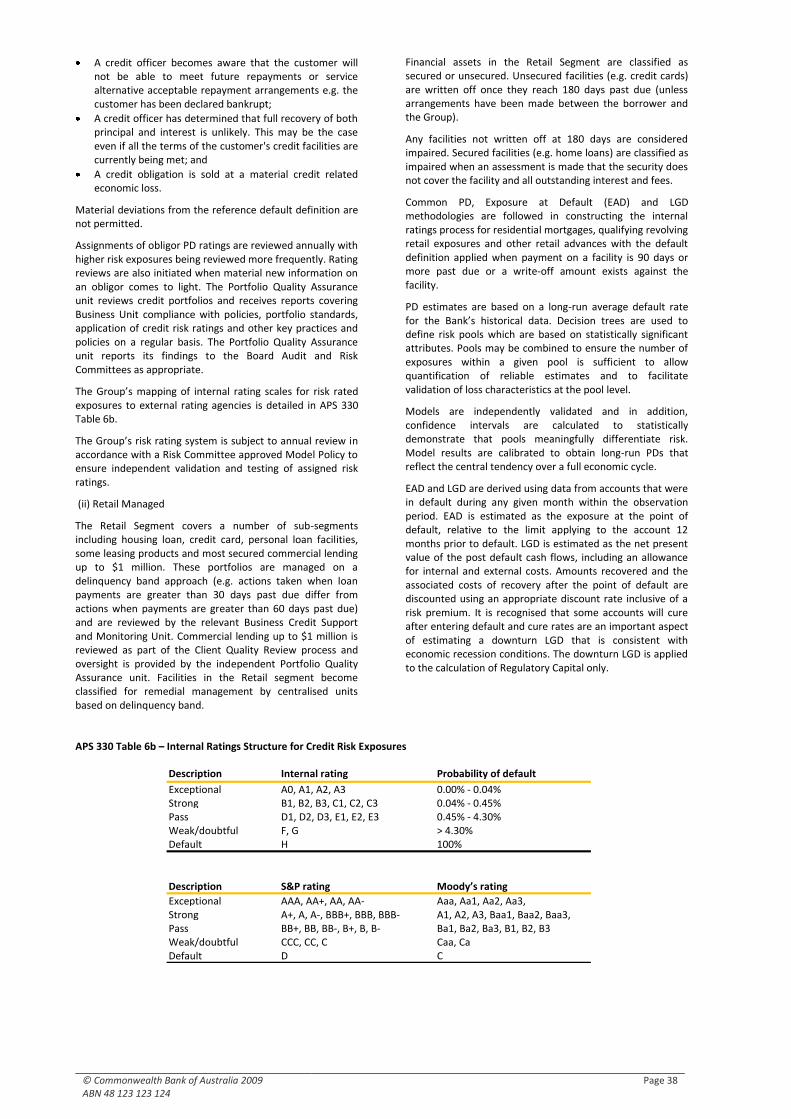
© Commonwealth Bank of Australia 2009 ABN 48 123 123 124
Page 38
A credit officer becomes aware that the customer will not be able to meet future repayments or service alternative acceptable repayment arrangements e.g. the customer has been declared bankrupt;
A credit officer has determined that full recovery of both principal and interest is unlikely. This may be the case even if all the terms of the customer's credit facilities are currently being met; and
A credit obligation is sold at a material credit related economic loss.
Material deviations from the reference default definition are not permitted.
Assignments of obligor PD ratings are reviewed annually with higher risk exposures being reviewed more frequently. Rating reviews are also initiated when material new information on an obligor comes to light. The Portfolio Quality Assurance unit reviews credit portfolios and receives reports covering Business Unit compliance with policies, portfolio standards, application of credit risk ratings and other key practices and policies on a regular basis. The Portfolio Quality Assurance unit reports its findings to the Board Audit and Risk Committees as appropriate.
The Group’s mapping of internal rating scales for risk rated exposures to external rating agencies is detailed in APS 330 Table 6b.
The Group’s risk rating system is subject to annual review in accordance with a Risk Committee approved Model Policy to ensure independent validation and testing of assigned risk ratings.
(ii) Retail Managed
The Retail Segment covers a number of sub-segments including housing loan, credit card, personal loan facilities, some leasing products and most secured commercial lending up to $1 million. These portfolios are managed on a delinquency band approach (e.g. actions taken when loan payments are greater than 30 days past due differ from actions when payments are greater than 60 days past due) and are reviewed by the relevant Business Credit Support and Monitoring Unit. Commercial lending up to $1 million is reviewed as part of the Client Quality Review process and oversight is provided by the independent Portfolio Quality Assurance unit. Facilities in the Retail segment become classified for remedial management by centralised units based on delinquency band.
Financial assets in the Retail Segment are classified as secured or unsecured. Unsecured facilities (e.g. credit cards) are written off once they reach 180 days past due (unless arrangements have been made between the borrower and the Group).
Any facilities not written off at 180 days are considered impaired. Secured facilities (e.g. home loans) are classified as impaired when an assessment is made that the security does not cover the facility and all outstanding interest and fees.
Common PD, Exposure at Default (EAD) and LGD methodologies are followed in constructing the internal ratings process for residential mortgages, qualifying revolving retail exposures and other retail advances with the default definition applied when payment on a facility is 90 days or more past due or a write-off amount exists against the facility.
PD estimates are based on a long-run average default rate for the Bank’s historical data. Decision trees are used to define risk pools which are based on statistically significant attributes. Pools may be combined to ensure the number of exposures within a given pool is sufficient to allow quantification of reliable estimates and to facilitate validation of loss characteristics at the pool level.
Models are independently validated and in addition, confidence intervals are calculated to statistically demonstrate that pools meaningfully differentiate risk. Model results are calibrated to obtain long-run PDs that reflect the central tendency over a full economic cycle.
EAD and LGD are derived using data from accounts that were in default during any given month within the observation period. EAD is estimated as the exposure at the point of default, relative to the limit applying to the account 12 months prior to default. LGD is estimated as the net present value of the post default cash flows, including an allowance for internal and external costs. Amounts recovered and the associated costs of recovery after the point of default are discounted using an appropriate discount rate inclusive of a risk premium. It is recognised that some accounts will cure after entering default and cure rates are an important aspect of estimating a downturn LGD that is consistent with economic recession conditions. The downturn LGD is applied to the calculation of Regulatory Capital only.
APS 330 Table 6b – Internal Ratings Structure for Credit Risk Exposures
Description Internal rating Probability of default
Exceptional A0, A1, A2, A3 0.00% - 0.04%Strong B1, B2, B3, C1, C2, C3 0.04% - 0.45%Pass D1, D2, D3, E1, E2, E3 0.45% - 4.30%Weak/doubtful F, G > 4.30%Default H 100%
Description S&P rating Moody’s rating
Exceptional AAA, AA+, AA, AA- Aaa, Aa1, Aa2, Aa3,Strong A+, A, A-, BBB+, BBB, BBB- A1, A2, A3, Baa1, Baa2, Baa3,Pass BB+, BB, BB-, B+, B, B- Ba1, Ba2, Ba3, B1, B2, B3Weak/doubtful CCC, CC, C Caa, CaDefault D C
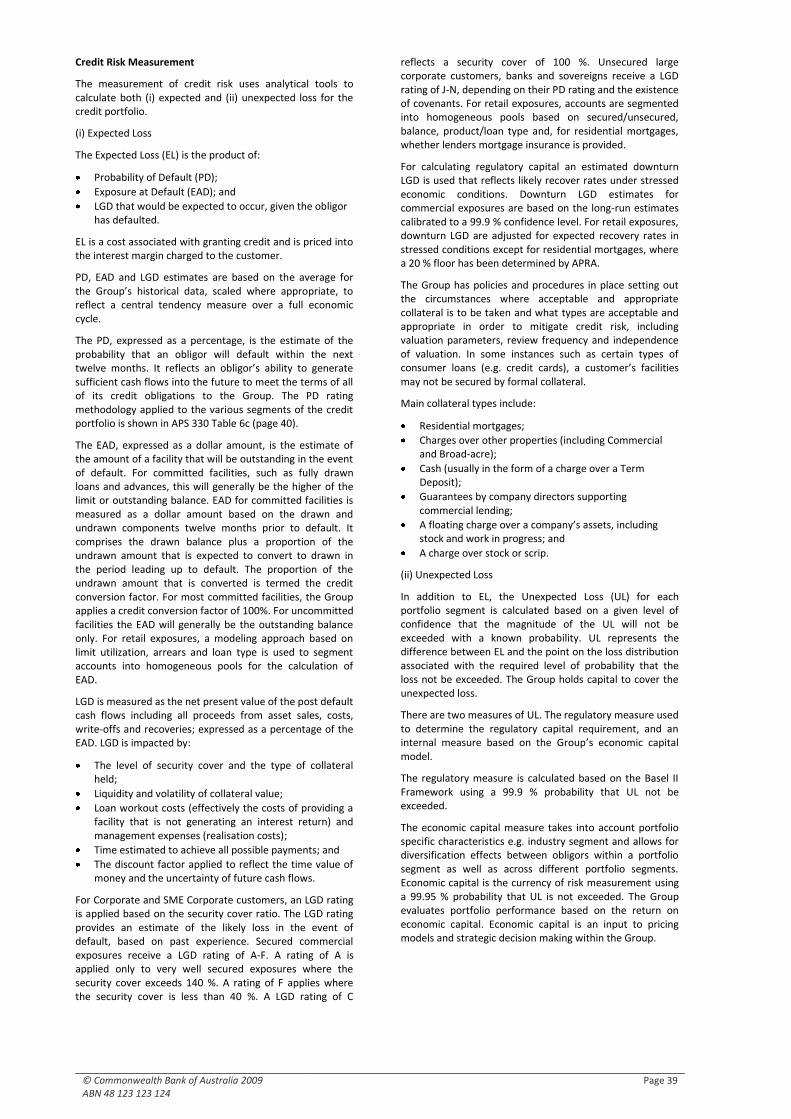
© Commonwealth Bank of Australia 2009 ABN 48 123 123 124
Page 39
Credit Risk Measurement
The measurement of credit risk uses analytical tools to calculate both (i) expected and (ii) unexpected loss for the credit portfolio.
(i) Expected Loss
The Expected Loss (EL) is the product of:
Probability of Default (PD);
Exposure at Default (EAD); and
LGD that would be expected to occur, given the obligor has defaulted.
EL is a cost associated with granting credit and is priced into the interest margin charged to the customer.
PD, EAD and LGD estimates are based on the average for the Group’s historical data, scaled where appropriate, to reflect a central tendency measure over a full economic cycle.
The PD, expressed as a percentage, is the estimate of the probability that an obligor will default within the next twelve months. It reflects an obligor’s ability to generate sufficient cash flows into the future to meet the terms of all of its credit obligations to the Group. The PD rating methodology applied to the various segments of the credit portfolio is shown in APS 330 Table 6c (page 40).
The EAD, expressed as a dollar amount, is the estimate of the amount of a facility that will be outstanding in the event of default. For committed facilities, such as fully drawn loans and advances, this will generally be the higher of the limit or outstanding balance. EAD for committed facilities is measured as a dollar amount based on the drawn and undrawn components twelve months prior to default. It comprises the drawn balance plus a proportion of the undrawn amount that is expected to convert to drawn in the period leading up to default. The proportion of the undrawn amount that is converted is termed the credit conversion factor. For most committed facilities, the Group applies a credit conversion factor of 100%. For uncommitted facilities the EAD will generally be the outstanding balance only. For retail exposures, a modeling approach based on limit utilization, arrears and loan type is used to segment accounts into homogeneous pools for the calculation of EAD.
LGD is measured as the net present value of the post default cash flows including all proceeds from asset sales, costs, write-offs and recoveries; expressed as a percentage of the EAD. LGD is impacted by:
The level of security cover and the type of collateral held;
Liquidity and volatility of collateral value;
Loan workout costs (effectively the costs of providing a facility that is not generating an interest return) and management expenses (realisation costs);
Time estimated to achieve all possible payments; and
The discount factor applied to reflect the time value of money and the uncertainty of future cash flows.
For Corporate and SME Corporate customers, an LGD rating is applied based on the security cover ratio. The LGD rating provides an estimate of the likely loss in the event of default, based on past experience. Secured commercial exposures receive a LGD rating of A-F. A rating of A is applied only to very well secured exposures where the security cover exceeds 140 %. A rating of F applies where the security cover is less than 40 %. A LGD rating of C
reflects a security cover of 100 %. Unsecured large corporate customers, banks and sovereigns receive a LGD rating of J-N, depending on their PD rating and the existence of covenants. For retail exposures, accounts are segmented into homogeneous pools based on secured/unsecured, balance, product/loan type and, for residential mortgages, whether lenders mortgage insurance is provided.
For calculating regulatory capital an estimated downturn LGD is used that reflects likely recover rates under stressed economic conditions. Downturn LGD estimates for commercial exposures are based on the long-run estimates calibrated to a 99.9 % confidence level. For retail exposures, downturn LGD are adjusted for expected recovery rates in stressed conditions except for residential mortgages, where a 20 % floor has been determined by APRA.
The Group has policies and procedures in place setting out the circumstances where acceptable and appropriate collateral is to be taken and what types are acceptable and appropriate in order to mitigate credit risk, including valuation parameters, review frequency and independence of valuation. In some instances such as certain types of consumer loans (e.g. credit cards), a customer’s facilities may not be secured by formal collateral.
Main collateral types include:
Residential mortgages;
Charges over other properties (including Commercial and Broad-acre);
Cash (usually in the form of a charge over a Term Deposit);
Guarantees by company directors supporting commercial lending;
A floating charge over a company’s assets, including stock and work in progress; and
A charge over stock or scrip.
(ii) Unexpected Loss
In addition to EL, the Unexpected Loss (UL) for each portfolio segment is calculated based on a given level of confidence that the magnitude of the UL will not be exceeded with a known probability. UL represents the difference between EL and the point on the loss distribution associated with the required level of probability that the loss not be exceeded. The Group holds capital to cover the unexpected loss.
There are two measures of UL. The regulatory measure used to determine the regulatory capital requirement, and an internal measure based on the Group’s economic capital model.
The regulatory measure is calculated based on the Basel II Framework using a 99.9 % probability that UL not be exceeded.
The economic capital measure takes into account portfolio specific characteristics e.g. industry segment and allows for diversification effects between obligors within a portfolio segment as well as across different portfolio segments. Economic capital is the currency of risk measurement using a 99.95 % probability that UL is not exceeded. The Group evaluates portfolio performance based on the return on economic capital. Economic capital is an input to pricing models and strategic decision making within the Group.
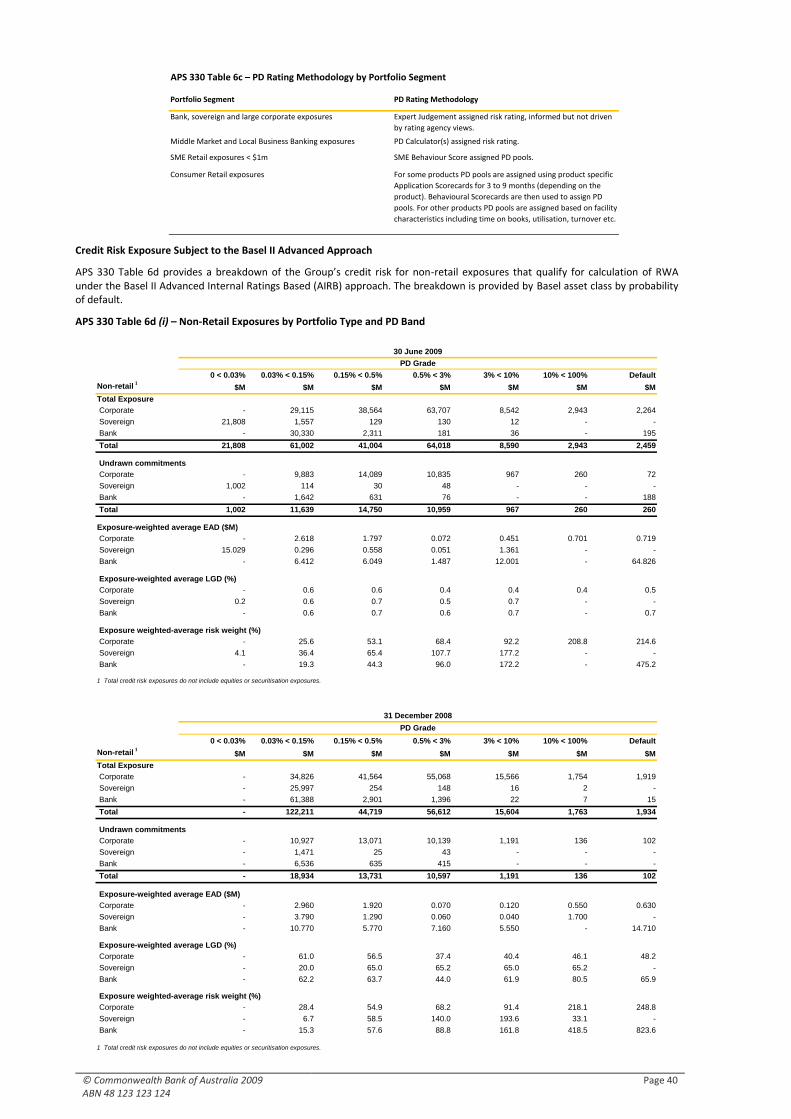
© Commonwealth Bank of Australia 2009 ABN 48 123 123 124
Page 40
Credit Risk Exposure Subject to the Basel II Advanced Approach
APS 330 Table 6d provides a breakdown of the Group’s credit risk for non-retail exposures that qualify for calculation of RWA under the Basel II Advanced Internal Ratings Based (AIRB) approach. The breakdown is provided by Basel asset class by probability of default.
APS 330 Table 6d (i) – Non-Retail Exposures by Portfolio Type and PD Band
0 < 0.03% 0.03% < 0.15% 0.15% < 0.5% 0.5% < 3% 3% < 10% 10% < 100% Default
Non-retail 1
$M $M $M $M $M $M $M
Total Exposure
Corporate - 29,115 38,564 63,707 8,542 2,943 2,264
Sovereign 21,808 1,557 129 130 12 - -
Bank - 30,330 2,311 181 36 - 195
Total 21,808 61,002 41,004 64,018 8,590 2,943 2,459
Corporate - 9,883 14,089 10,835 967 260 72
Sovereign 1,002 114 30 48 - - -
Bank - 1,642 631 76 - - 188
Total 1,002 11,639 14,750 10,959 967 260 260
Corporate - 2.618 1.797 0.072 0.451 0.701 0.719
Sovereign 15.029 0.296 0.558 0.051 1.361 - -
Bank - 6.412 6.049 1.487 12.001 - 64.826
Corporate - 0.6 0.6 0.4 0.4 0.4 0.5
Sovereign 0.2 0.6 0.7 0.5 0.7 - -
Bank - 0.6 0.7 0.6 0.7 - 0.7
Corporate - 25.6 53.1 68.4 92.2 208.8 214.6
Sovereign 4.1 36.4 65.4 107.7 177.2 - -
Bank - 19.3 44.3 96.0 172.2 - 475.2
0 < 0.03% 0.03% < 0.15% 0.15% < 0.5% 0.5% < 3% 3% < 10% 10% < 100% Default
Non-retail 1
$M $M $M $M $M $M $M
Total Exposure
Corporate - 34,826 41,564 55,068 15,566 1,754 1,919
Sovereign - 25,997 254 148 16 2 -
Bank - 61,388 2,901 1,396 22 7 15
Total - 122,211 44,719 56,612 15,604 1,763 1,934
Corporate - 10,927 13,071 10,139 1,191 136 102
Sovereign - 1,471 25 43 - - -
Bank - 6,536 635 415 - - -
Total - 18,934 13,731 10,597 1,191 136 102
Corporate - 2.960 1.920 0.070 0.120 0.550 0.630
Sovereign - 3.790 1.290 0.060 0.040 1.700 -
Bank - 10.770 5.770 7.160 5.550 - 14.710
Corporate - 61.0 56.5 37.4 40.4 46.1 48.2
Sovereign - 20.0 65.0 65.2 65.0 65.2 -
Bank - 62.2 63.7 44.0 61.9 80.5 65.9
Corporate - 28.4 54.9 68.2 91.4 218.1 248.8
Sovereign - 6.7 58.5 140.0 193.6 33.1 -
Bank - 15.3 57.6 88.8 161.8 418.5 823.6
Exposure-weighted average LGD (%)
Exposure weighted-average risk weight (%)
Undrawn commitments
Exposure-weighted average EAD ($M)
30 June 2009
PD Grade
31 December 2008
PD Grade
Undrawn commitments
Exposure-weighted average EAD ($M)
Exposure-weighted average LGD (%)
Exposure weighted-average risk weight (%)
1 Total credit risk exposures do not include equities or securitisation exposures.
1 Total credit risk exposures do not include equities or securitisation exposures.
Portfolio Segment PD Rating Methodology
Bank, sovereign and large corporate exposures Expert Judgement assigned risk rating, informed but not driven
by rating agency views.
Middle Market and Local Business Banking exposures PD Calculator(s) assigned risk rating.
SME Retail exposures < $1m SME Behaviour Score assigned PD pools.
Consumer Retail exposures For some products PD pools are assigned using product specific
Application Scorecards for 3 to 9 months (depending on the
product). Behavioural Scorecards are then used to assign PD
pools. For other products PD pools are assigned based on facility
characteristics including time on books, utilisation, turnover etc.
APS 330 Table 6c – PD Rating Methodology by Portfolio Segment
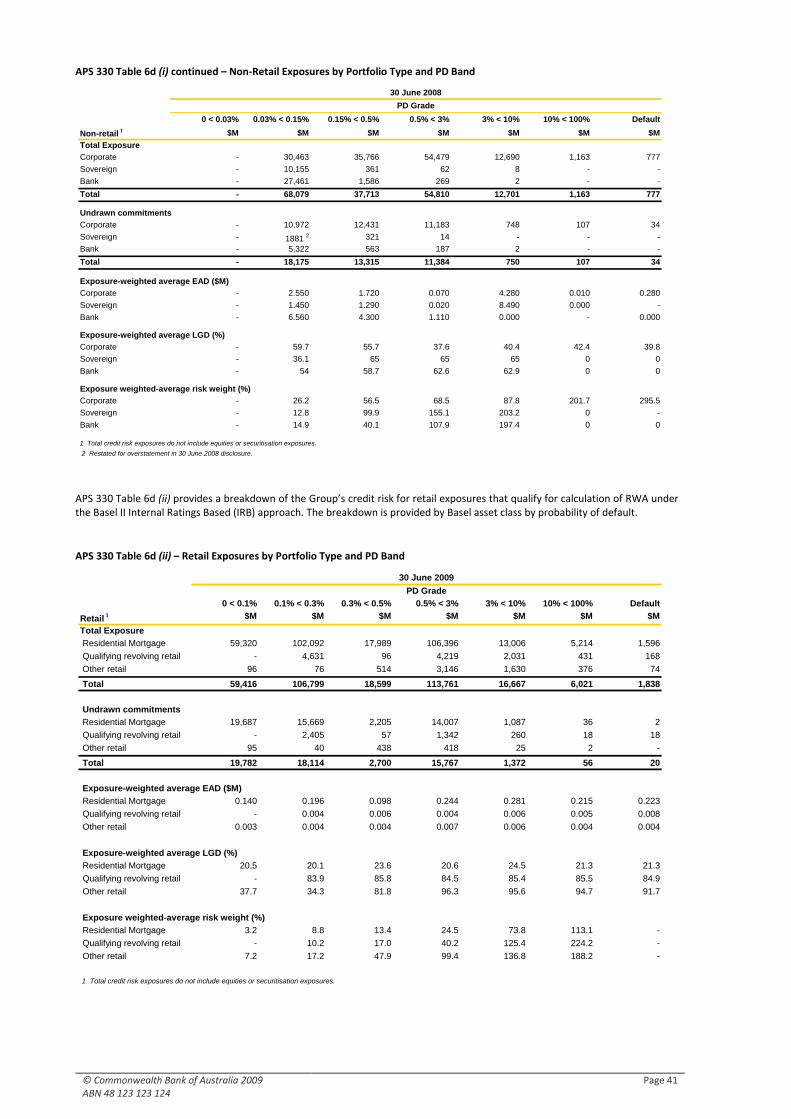
© Commonwealth Bank of Australia 2009 ABN 48 123 123 124
Page 41
APS 330 Table 6d (i) continued – Non-Retail Exposures by Portfolio Type and PD Band
0 < 0.03% 0.03% < 0.15% 0.15% < 0.5% 0.5% < 3% 3% < 10% 10% < 100% Default
Non-retail 1 $M $M $M $M $M $M $M
Total Exposure
Corporate - 30,463 35,766 54,479 12,690 1,163 777
Sovereign - 10,155 361 62 8 - -
Bank - 27,461 1,586 269 2 - -
Total - 68,079 37,713 54,810 12,701 1,163 777
Corporate - 10,972 12,431 11,183 748 107 34
Sovereign - 1881 2 321 14 - - -
Bank - 5,322 563 187 2 - -
Total - 18,175 13,315 11,384 750 107 34
Corporate - 2.550 1.720 0.070 4.280 0.010 0.280
Sovereign - 1.450 1.290 0.020 8.490 0.000 -
Bank - 6.560 4.300 1.110 0.000 - 0.000
Corporate - 59.7 55.7 37.6 40.4 42.4 39.8
Sovereign - 36.1 65 65 65 0 0
Bank - 54 58.7 62.6 62.9 0 0
Corporate - 26.2 56.5 68.5 87.8 201.7 295.5
Sovereign - 12.8 99.9 155.1 203.2 0 -
Bank - 14.9 40.1 107.9 197.4 0 0
2 Restated for overstatement in 30 June 2008 disclosure.
30 June 2008
PD Grade
Undrawn commitments
Exposure-weighted average EAD ($M)
Exposure-weighted average LGD (%)
Exposure weighted-average risk weight (%)
1 Total credit risk exposures do not include equities or securitisation exposures.
APS 330 Table 6d (ii) provides a breakdown of the Group’s credit risk for retail exposures that qualify for calculation of RWA under the Basel II Internal Ratings Based (IRB) approach. The breakdown is provided by Basel asset class by probability of default.
APS 330 Table 6d (ii) – Retail Exposures by Portfolio Type and PD Band
0 < 0.1% 0.1% < 0.3% 0.3% < 0.5% 0.5% < 3% 3% < 10% 10% < 100% Default
Retail 1 $M $M $M $M $M $M $M
Total Exposure
Residential Mortgage 59,320 102,092 17,989 106,396 13,006 5,214 1,596
Qualifying revolving retail - 4,631 96 4,219 2,031 431 168
Other retail 96 76 514 3,146 1,630 376 74
Total 59,416 106,799 18,599 113,761 16,667 6,021 1,838
Residential Mortgage 19,687 15,669 2,205 14,007 1,087 36 2
Qualifying revolving retail - 2,405 57 1,342 260 18 18
Other retail 95 40 438 418 25 2 -
Total 19,782 18,114 2,700 15,767 1,372 56 20
Residential Mortgage 0.140 0.196 0.098 0.244 0.281 0.215 0.223
Qualifying revolving retail - 0.004 0.006 0.004 0.006 0.005 0.008
Other retail 0.003 0.004 0.004 0.007 0.006 0.004 0.004
Residential Mortgage 20.5 20.1 23.6 20.6 24.5 21.3 21.3
Qualifying revolving retail - 83.9 85.8 84.5 85.4 85.5 84.9
Other retail 37.7 34.3 81.8 96.3 95.6 94.7 91.7
Residential Mortgage 3.2 8.8 13.4 24.5 73.8 113.1 -
Qualifying revolving retail - 10.2 17.0 40.2 125.4 224.2 -
Other retail 7.2 17.2 47.9 99.4 136.8 188.2 -
1 Total credit risk exposures do not include equities or securitisation exposures.
Exposure-weighted average LGD (%)
Exposure weighted-average risk weight (%)
Undrawn commitments
Exposure-weighted average EAD ($M)
30 June 2009
PD Grade
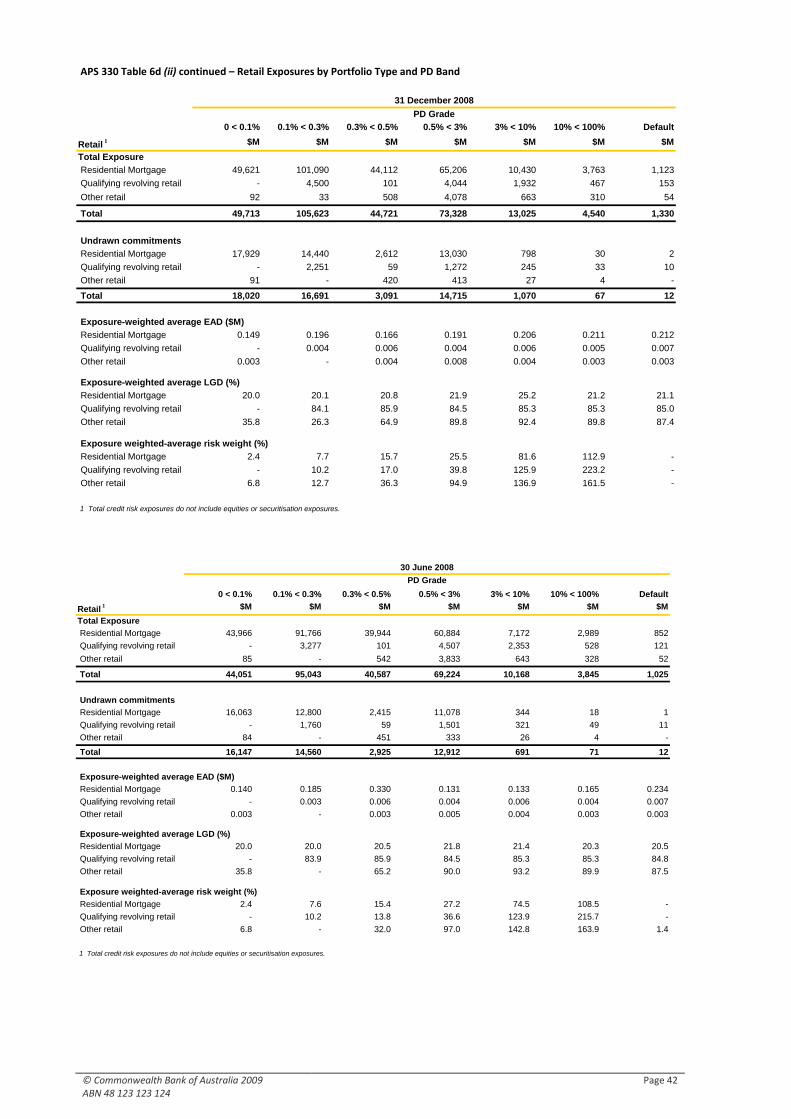
© Commonwealth Bank of Australia 2009 ABN 48 123 123 124
Page 42
APS 330 Table 6d (ii) continued – Retail Exposures by Portfolio Type and PD Band
0 < 0.1% 0.1% < 0.3% 0.3% < 0.5% 0.5% < 3% 3% < 10% 10% < 100% Default
Retail 1 $M $M $M $M $M $M $M
Total Exposure
Residential Mortgage 43,966 91,766 39,944 60,884 7,172 2,989 852
Qualifying revolving retail - 3,277 101 4,507 2,353 528 121
Other retail 85 - 542 3,833 643 328 52
Total 44,051 95,043 40,587 69,224 10,168 3,845 1,025
Residential Mortgage 16,063 12,800 2,415 11,078 344 18 1
Qualifying revolving retail - 1,760 59 1,501 321 49 11
Other retail 84 - 451 333 26 4 -
Total 16,147 14,560 2,925 12,912 691 71 12
Residential Mortgage 0.140 0.185 0.330 0.131 0.133 0.165 0.234
Qualifying revolving retail - 0.003 0.006 0.004 0.006 0.004 0.007
Other retail 0.003 - 0.003 0.005 0.004 0.003 0.003
Residential Mortgage 20.0 20.0 20.5 21.8 21.4 20.3 20.5
Qualifying revolving retail - 83.9 85.9 84.5 85.3 85.3 84.8
Other retail 35.8 - 65.2 90.0 93.2 89.9 87.5
Residential Mortgage 2.4 7.6 15.4 27.2 74.5 108.5 -
Qualifying revolving retail - 10.2 13.8 36.6 123.9 215.7 -
Other retail 6.8 - 32.0 97.0 142.8 163.9 1.4
1 Total credit risk exposures do not include equities or securitisation exposures.
30 June 2008
PD Grade
Undrawn commitments
Exposure-weighted average EAD ($M)
Exposure-weighted average LGD (%)
Exposure weighted-average risk weight (%)
0 < 0.1% 0.1% < 0.3% 0.3% < 0.5% 0.5% < 3% 3% < 10% 10% < 100% Default
Retail 1 $M $M $M $M $M $M $M
Total Exposure
Residential Mortgage 49,621 101,090 44,112 65,206 10,430 3,763 1,123
Qualifying revolving retail - 4,500 101 4,044 1,932 467 153
Other retail 92 33 508 4,078 663 310 54
Total 49,713 105,623 44,721 73,328 13,025 4,540 1,330
Residential Mortgage 17,929 14,440 2,612 13,030 798 30 2
Qualifying revolving retail - 2,251 59 1,272 245 33 10
Other retail 91 - 420 413 27 4 -
Total 18,020 16,691 3,091 14,715 1,070 67 12
Residential Mortgage 0.149 0.196 0.166 0.191 0.206 0.211 0.212
Qualifying revolving retail - 0.004 0.006 0.004 0.006 0.005 0.007
Other retail 0.003 - 0.004 0.008 0.004 0.003 0.003
Residential Mortgage 20.0 20.1 20.8 21.9 25.2 21.2 21.1
Qualifying revolving retail - 84.1 85.9 84.5 85.3 85.3 85.0
Other retail 35.8 26.3 64.9 89.8 92.4 89.8 87.4
Residential Mortgage 2.4 7.7 15.7 25.5 81.6 112.9 -
Qualifying revolving retail - 10.2 17.0 39.8 125.9 223.2 -
Other retail 6.8 12.7 36.3 94.9 136.9 161.5 -
1 Total credit risk exposures do not include equities or securitisation exposures.
31 December 2008
PD Grade
Undrawn commitments
Exposure-weighted average EAD ($M)
Exposure-weighted average LGD (%)
Exposure weighted-average risk weight (%)
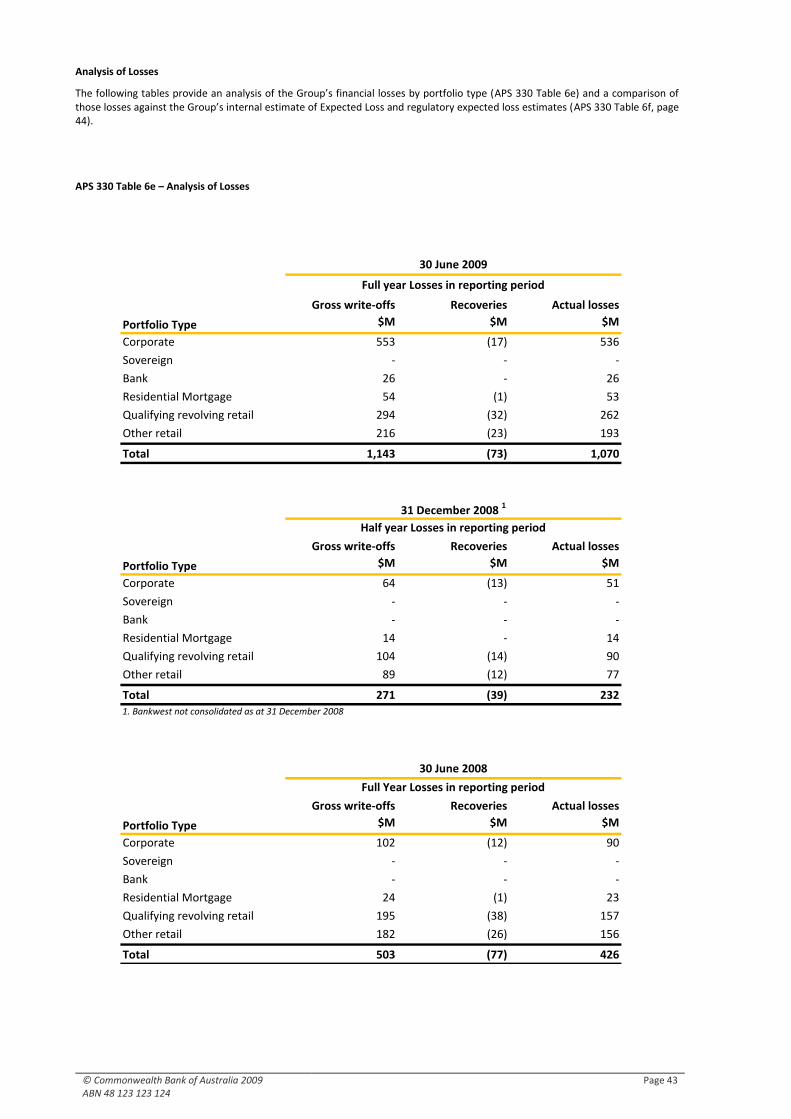
© Commonwealth Bank of Australia 2009 ABN 48 123 123 124
Page 43
Analysis of Losses
The following tables provide an analysis of the Group’s financial losses by portfolio type (APS 330 Table 6e) and a comparison of those losses against the Group’s internal estimate of Expected Loss and regulatory expected loss estimates (APS 330 Table 6f, page 44).
APS 330 Table 6e – Analysis of Losses
Gross write-offs Recoveries Actual losses
$M $M $M
Corporate 553 (17) 536
Sovereign - - -
Bank 26 - 26
Residential Mortgage 54 (1) 53
Qualifying revolving retail 294 (32) 262
Other retail 216 (23) 193
Total 1,143 (73) 1,070
Gross write-offs Recoveries Actual losses
$M $M $M
Corporate 64 (13) 51
Sovereign - - -
Bank - - -
Residential Mortgage 14 - 14
Qualifying revolving retail 104 (14) 90
Other retail 89 (12) 77
Total 271 (39) 232
Gross write-offs Recoveries Actual losses
$M $M $M
Corporate 102 (12) 90
Sovereign - - -
Bank - - -
Residential Mortgage 24 (1) 23
Qualifying revolving retail 195 (38) 157
Other retail 182 (26) 156
Total 503 (77) 426
Portfolio Type
30 June 2009
Full year Losses in reporting period
Portfolio Type
31 December 2008 1
Half year Losses in reporting period
Portfolio Type
30 June 2008
Full Year Losses in reporting period
1. Bankwest not consolidated as at 31 December 2008
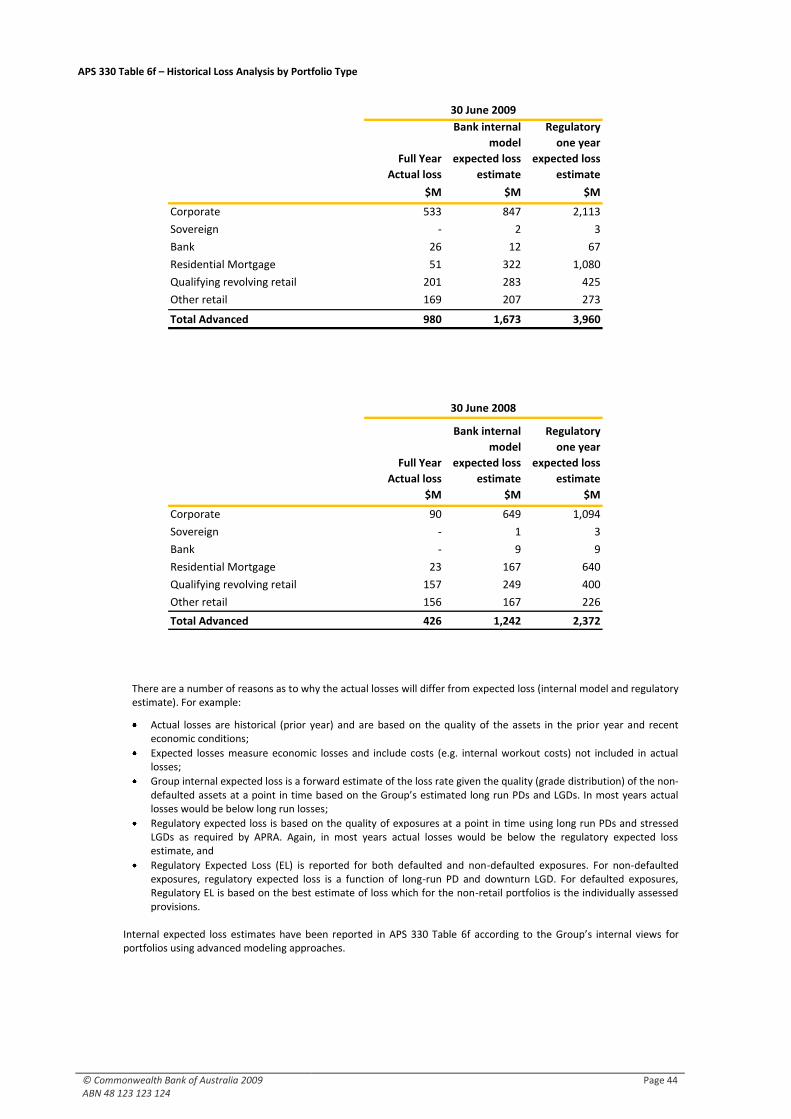
© Commonwealth Bank of Australia 2009 ABN 48 123 123 124
Page 44
APS 330 Table 6f – Historical Loss Analysis by Portfolio Type
There are a number of reasons as to why the actual losses will differ from expected loss (internal model and regulatory estimate). For example:
Actual losses are historical (prior year) and are based on the quality of the assets in the prior year and recent economic conditions;
Expected losses measure economic losses and include costs (e.g. internal workout costs) not included in actual losses;
Group internal expected loss is a forward estimate of the loss rate given the quality (grade distribution) of the non-defaulted assets at a point in time based on the Group’s estimated long run PDs and LGDs. In most years actual losses would be below long run losses;
Regulatory expected loss is based on the quality of exposures at a point in time using long run PDs and stressed LGDs as required by APRA. Again, in most years actual losses would be below the regulatory expected loss estimate, and
Regulatory Expected Loss (EL) is reported for both defaulted and non-defaulted exposures. For non-defaulted exposures, regulatory expected loss is a function of long-run PD and downturn LGD. For defaulted exposures, Regulatory EL is based on the best estimate of loss which for the non-retail portfolios is the individually assessed provisions.
Internal expected loss estimates have been reported in APS 330 Table 6f according to the Group’s internal views for portfolios using advanced modeling approaches.
Full Year
Actual loss
Bank internal
model
expected loss
estimate
Regulatory
one year
expected loss
estimate
$M $M $M
Corporate 533 847 2,113
Sovereign - 2 3
Bank 26 12 67
Residential Mortgage 51 322 1,080
Qualifying revolving retail 201 283 425
Other retail 169 207 273
Total Advanced 980 1,673 3,960
Full Year
Actual loss
Bank internal
model
expected loss
estimate
Regulatory
one year
expected loss
estimate
$M $M $M
Corporate 90 649 1,094
Sovereign - 1 3
Bank - 9 9
Residential Mortgage 23 167 640
Qualifying revolving retail 157 249 400
Other retail 156 167 226
Total Advanced 426 1,242 2,372
30 June 2009
30 June 2008
© Commonwealth Bank of Australia 2009 ABN 48 123 123 124
Page 45
Credit Risk Mitigation
Where the Group has legal certainty, it recognises on-balance sheet netting for Group Limit Facilities where the balances of all participating accounts to a lead overdraft account are netted and set-off.
The Group restricts its exposure to credit losses by entering into master netting arrangements with counterparties with which it undertakes a significant volume of transactions. Master netting arrangements do not generally result in an offset of Balance Sheet assets and liabilities as transactions are usually settled on a gross basis. However, the credit risk associated with favourable contracts is reduced by a master netting arrangement to the extent that if an event of default occurs, all amounts with the counterparty are terminated and settled on a net basis.
The Group CRO (or delegate) is responsible for approving acceptable collateral types.
The type, liquidity and carrying costs on collateral held is a key determination of the LGD percentage that is assigned to a credit risk exposure. Collateral held for any credit facility is valued, recorded and controlled as follows:
Real estate collateral
Real estate collateral values can only be extended for LGD mitigation purposes where the following criteria are met:
Objective market value of collateral - the collateral must be valued by an independent valuer (or via a valuation approach approved by the Group CRO or delegate), at no more than the current fair value under which the property could be sold under private contract between a willing seller and an arm’s-length buyer on the date of valuation;
Revaluation - the value of the collateral should be monitored regularly and where appropriate, re-valued;
Insurance - steps are taken to ensure that the property taken as collateral is adequately insured against damage or deterioration;
Prior claim – other parties may have senior claims to the Group on an asset offered for collateral. For example, council rates and land tax usually benefit from specific legal protection. The impact of such claims needs to be allowed for when assessing security values; and
Environment - the risk of environmental liability arising in respect of the collateral must be appropriately assessed, monitored and where appropriate, reflected in the valuation of collateral.
Non-real estate collateral
Non-real estate collateral values are only extended for LGD purposes where there is a sound process for determining the value of the collateral. Continuous monitoring processes that are appropriate for the specific exposures (either immediate or contingent) attributable to the collateral are used as a risk mitigant. The main non-real estate collateral types include:
Cash (usually in the form of a charge over a Term Deposit);
Guarantees by company directors supporting commercial lending;
A floating charge over a company’s assets, including stock and work in progress; and
A charge over bonds, stocks or scrip.
The Group applies a Risk Committee approved Large Credit Exposure Policy (LCEP). This policy governs the authority of management with regard to the amount of credit provided to any single counterparty after applying the Aggregation Policy within the Risk Rated segment and Probability of Default rating.
The objective of LCEP is to ensure that the Group is not exposed to catastrophic loss through the failure of a single counterparty (or group of related counterparties). The LCEP is reviewed annually.
Usage of LCEP limits is determined by the aggregate exposure weighted average limit utilisation for a group of related counterparties, and is subject to Risk Committee approved constraints.
Management reports to the Risk Committee each quarter, on a total credit risk exposure basis:
All exposures at, or greater than, the LCEP limits - including those resulting from PD deterioration;
Outcomes relative to agreed strategies to reduce or alter exposures; and
All exposures ceasing to exceed LCEP limits since the last report.
All relevant borrower specific credit submissions are to prominently demonstrate relative compliance with LCEP.
Credit risk concentration limits have been developed to ensure portfolio diversification and prevent credit risk concentrations. Periodic stress tests of major credit risk concentrations are conducted to identify potential changes in market conditions such as changes in interest rates, droughts, etc. that could adversely impact the credit portfolios performance. Action is taken where necessary to reduce the volatility of losses.
Apart from the taking of collateral mentioned above, other forms of credit risk mitigation are used by banks to either reduce or transfer credit risk. This may be achieved by purchasing/obtaining a credit default swap (credit derivative) and/or guarantee from typically exceptional and strong rated banks or corporates. To be an eligible mitigant, the credit default swap or guarantee must be contractually binding, have legal certainty and be non-cancellable. APS 330 Table 7b and 7c (page 46) discloses the Group’s coverage of exposure by credit default swaps and guarantees.
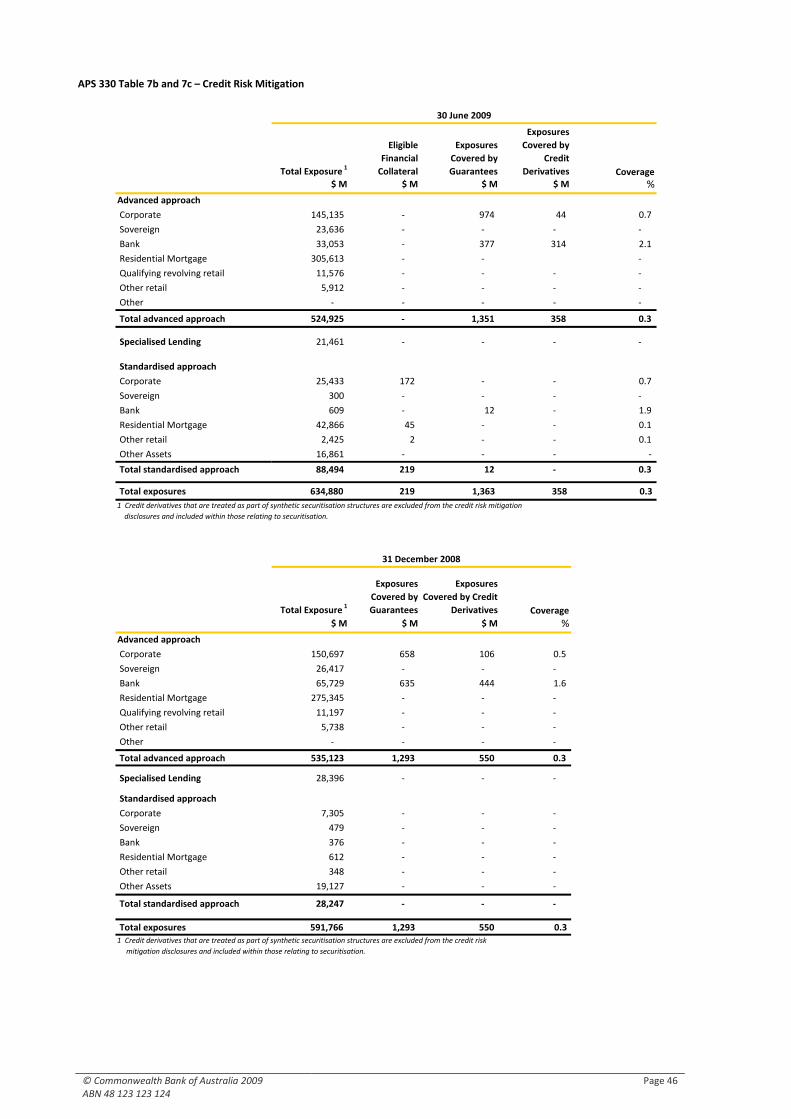
© Commonwealth Bank of Australia 2009 ABN 48 123 123 124
Page 46
APS 330 Table 7b and 7c – Credit Risk Mitigation
Total Exposure 1
Eligible
Financial
Collateral
Exposures
Covered by
Guarantees
Exposures
Covered by
Credit
Derivatives Coverage$ M $ M $ M $ M %
Advanced approach
Corporate 145,135 - 974 44 0.7
Sovereign 23,636 - - - -
Bank 33,053 - 377 314 2.1
Residential Mortgage 305,613 - - -
Qualifying revolving retail 11,576 - - - -
Other retail 5,912 - - - -
Other - - - - -
Total advanced approach 524,925 - 1,351 358 0.3
Specialised Lending 21,461 - - - -
Standardised approach
Corporate 25,433 172 - - 0.7
Sovereign 300 - - - -
Bank 609 - 12 - 1.9
Residential Mortgage 42,866 45 - - 0.1
Other retail 2,425 2 - - 0.1
Other Assets 16,861 - - - -
Total standardised approach 88,494 219 12 - 0.3
Total exposures 634,880 219 1,363 358 0.3
Total Exposure 1
Exposures
Covered by
Guarantees
Exposures
Covered by Credit
Derivatives Coverage
$ M $ M $ M %
Advanced approach
Corporate 150,697 658 106 0.5
Sovereign 26,417 - - -
Bank 65,729 635 444 1.6
Residential Mortgage 275,345 - - -
Qualifying revolving retail 11,197 - - -
Other retail 5,738 - - -
Other - - - -
Total advanced approach 535,123 1,293 550 0.3
Specialised Lending 28,396 - - -
Standardised approach
Corporate 7,305 - - -
Sovereign 479 - - -
Bank 376 - - -
Residential Mortgage 612 - - -
Other retail 348 - - -
Other Assets 19,127 - - -
Total standardised approach 28,247 - - -
Total exposures 591,766 1,293 550 0.3
30 June 2009
1 Credit derivatives that are treated as part of synthetic securitisation structures are excluded from the credit risk mitigation
disclosures and included within those relating to securitisation.
31 December 2008
1 Credit derivatives that are treated as part of synthetic securitisation structures are excluded from the credit risk
mitigation disclosures and included within those relating to securitisation.
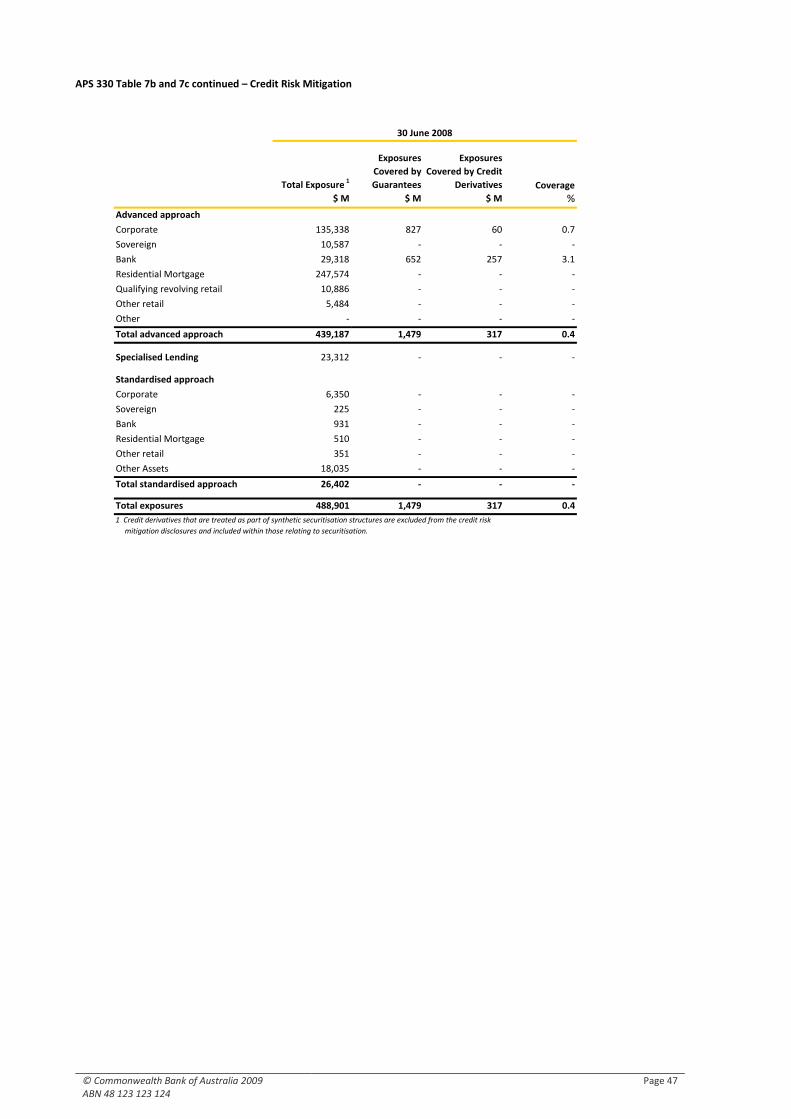
© Commonwealth Bank of Australia 2009 ABN 48 123 123 124
Page 47
APS 330 Table 7b and 7c continued – Credit Risk Mitigation
Total Exposure 1
Exposures
Covered by
Guarantees
Exposures
Covered by Credit
Derivatives Coverage
$ M $ M $ M %
Advanced approach
Corporate 135,338 827 60 0.7
Sovereign 10,587 - - -
Bank 29,318 652 257 3.1
Residential Mortgage 247,574 - - -
Qualifying revolving retail 10,886 - - -
Other retail 5,484 - - -
Other - - - -
Total advanced approach 439,187 1,479 317 0.4
Specialised Lending 23,312 - - -
Standardised approach
Corporate 6,350 - - -
Sovereign 225 - - -
Bank 931 - - -
Residential Mortgage 510 - - -
Other retail 351 - - -
Other Assets 18,035 - - -
Total standardised approach 26,402 - - -
Total exposures 488,901 1,479 317 0.4
1 Credit derivatives that are treated as part of synthetic securitisation structures are excluded from the credit risk
mitigation disclosures and included within those relating to securitisation.
30 June 2008
© Commonwealth Bank of Australia 2009 ABN 48 123 123 124
Page 48
Counterparty Credit Risk
Counterparty Credit Risk (CCR) is the risk that the counterparty to a transaction could default before the final settlement of the transaction's cash flows. An economic loss would occur if the transactions or portfolio of transactions with the counterparty has a positive economic value at the time of default. Unlike exposure to credit risk through a loan, where the exposure to credit risk is unilateral and only the lending bank faces the risk of loss, CCR creates a bilateral risk of loss whereby the market value for many different types of transactions can be positive or negative to either counterparty. The market value is uncertain and can vary over time with the movement of underlying market factors.
Counterparty credit risk Economic Capital is measured in accordance with the risk rating and expected exposure of the customer. Economic Capital is allocated to CCR exposures in proportion to the contributions of those exposures to total Economic Capital, after taking into account correlation and diversification impacts across risk types.
Wrong-way Risk is a risk associated with counterparty credit risk. There are two types of wrong-way risk, general and specific.
General wrong-way risk arises when the probability of default of counterparties is positively correlated with general market risk factors. Specific wrong-way risk arises when the exposure to a particular counterparty is positively correlated with the probability of default of the counterparty due to nature of its unique business.
Counterparty credit risk and wrong-way risk are controlled through a variety of credit policies and procedures; including, but not limited to the following:
Large Credit Exposure Policy;
Country Risk Policy;
Aggregation Policy;
Credit Risk Rating; and
Specific product policies.
Collateralised Counterparty Credit Risk
Credit Support Annexes (CSA) collateralise credit counterparty risk for global markets type products. CSAs lower the wrong-way risk (and economic capital) which may be due to market movements. This is by requiring the
counterparty (or the Group) to post collateral according to a Threshold and Minimum Transfer matrix.
Long term debt ratings are used as references within approximately 75 % of ISDA Master Agreement and CSA’s to determine the Thresholds and Minimum Transfer Amount increments to which both the Group and counterparties adhere. Generally, the lower a counterparty’s rating the lower the Threshold and Minimum Transfer Amount given to that counterparty. In some instances, an independent or initial margin amount may also be introduced resulting from a low rating.
These terms are agreed between the principal and counterparty during the negotiation of the ISDA Master Agreement and CSA. Risk Managers provide sign off on terms of the CSA prior to the documentation being executed. Upon execution of a CSA with a counterparty, all possible thresholds levels for each credit ratings level are input into the collateral management system together with the credit ratings. The system monitors the threshold limits outlined in the CSA.
The long term debt ratings are taken from two main rating agencies, Moody’s Investors Service Inc. and Standard & Poor’s Ratings Services. The CSA states that in an event of a split level rating with these ratings agencies, the lower of the two ratings will be used when calculating collateral obligations.
The aim of collateral stress testing is to determine the effect that a rating downgrade, both 1 and 2 credit ratings, would have on the Group’s collateral obligation to its counterparties and determine the actual increased US Dollar amount required to meet these obligations. The Group analyses the resulting movement of in Threshold and Minimum Transfer Amount, at a counterparty level to determine the effect of the credit downgrades at a counterpart basis or against the Group as a whole.
The actual posting obligation figures provide a ‘worst case’ scenario based on all counterparties making full collateral calls that the Group sees against itself. Large variances in collateral posted or received have occurred over the past year. As at 30 June 2009 the Group was posting more collateral than it received. A one notch downgrade in the Group's rating would have resulted in a 2 % increase in collateral posted. A 2 notch downgrade would have resulted in a 6.3 % increase in collateral posted.
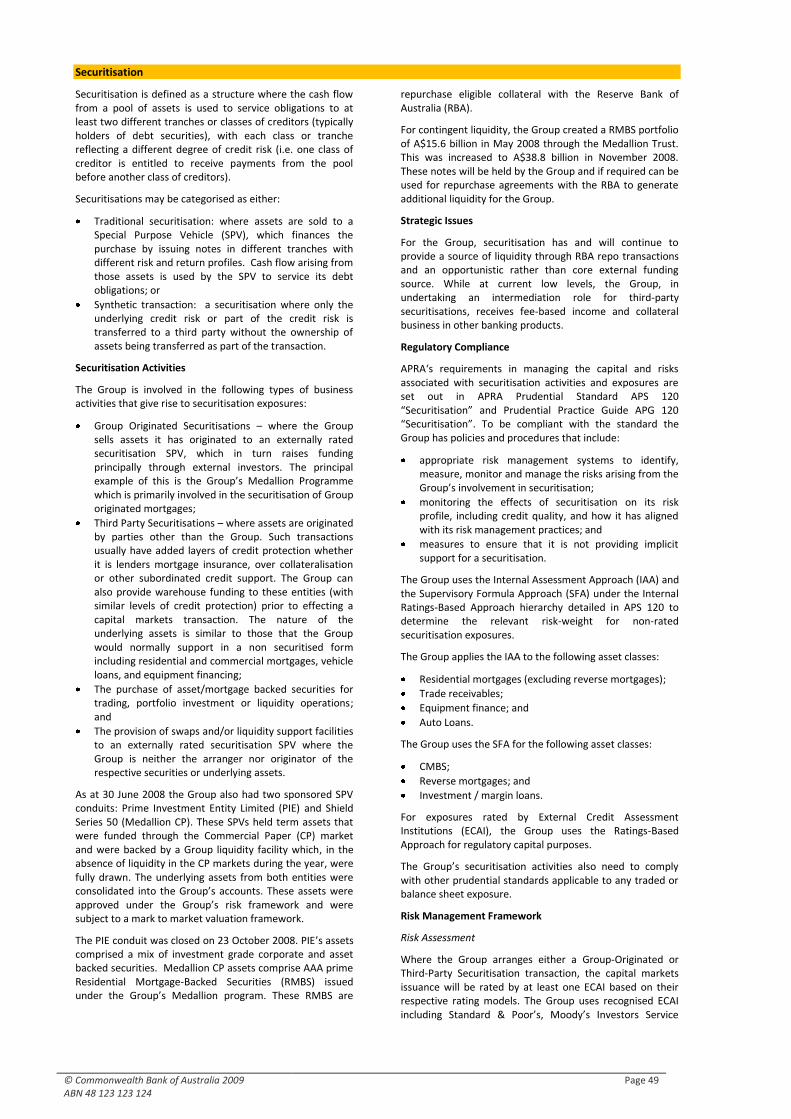
© Commonwealth Bank of Australia 2009 ABN 48 123 123 124
Page 49
Securitisation
Securitisation is defined as a structure where the cash flow from a pool of assets is used to service obligations to at least two different tranches or classes of creditors (typically holders of debt securities), with each class or tranche reflecting a different degree of credit risk (i.e. one class of creditor is entitled to receive payments from the pool before another class of creditors).
Securitisations may be categorised as either:
Traditional securitisation: where assets are sold to a Special Purpose Vehicle (SPV), which finances the purchase by issuing notes in different tranches with different risk and return profiles. Cash flow arising from those assets is used by the SPV to service its debt obligations; or
Synthetic transaction: a securitisation where only the underlying credit risk or part of the credit risk is transferred to a third party without the ownership of assets being transferred as part of the transaction.
Securitisation Activities
The Group is involved in the following types of business activities that give rise to securitisation exposures:
Group Originated Securitisations – where the Group sells assets it has originated to an externally rated securitisation SPV, which in turn raises funding principally through external investors. The principal example of this is the Group’s Medallion Programme which is primarily involved in the securitisation of Group originated mortgages;
Third Party Securitisations – where assets are originated by parties other than the Group. Such transactions usually have added layers of credit protection whether it is lenders mortgage insurance, over collateralisation or other subordinated credit support. The Group can also provide warehouse funding to these entities (with similar levels of credit protection) prior to effecting a capital markets transaction. The nature of the underlying assets is similar to those that the Group would normally support in a non securitised form including residential and commercial mortgages, vehicle loans, and equipment financing;
The purchase of asset/mortgage backed securities for trading, portfolio investment or liquidity operations; and
The provision of swaps and/or liquidity support facilities to an externally rated securitisation SPV where the Group is neither the arranger nor originator of the respective securities or underlying assets.
As at 30 June 2008 the Group also had two sponsored SPV conduits: Prime Investment Entity Limited (PIE) and Shield Series 50 (Medallion CP). These SPVs held term assets that were funded through the Commercial Paper (CP) market and were backed by a Group liquidity facility which, in the absence of liquidity in the CP markets during the year, were fully drawn. The underlying assets from both entities were consolidated into the Group’s accounts. These assets were approved under the Group’s risk framework and were subject to a mark to market valuation framework.
The PIE conduit was closed on 23 October 2008. PIE’s assets comprised a mix of investment grade corporate and asset backed securities. Medallion CP assets comprise AAA prime Residential Mortgage-Backed Securities (RMBS) issued under the Group’s Medallion program. These RMBS are
repurchase eligible collateral with the Reserve Bank of Australia (RBA).
For contingent liquidity, the Group created a RMBS portfolio of A$15.6 billion in May 2008 through the Medallion Trust. This was increased to A$38.8 billion in November 2008. These notes will be held by the Group and if required can be used for repurchase agreements with the RBA to generate additional liquidity for the Group.
Strategic Issues
For the Group, securitisation has and will continue to provide a source of liquidity through RBA repo transactions and an opportunistic rather than core external funding source. While at current low levels, the Group, in undertaking an intermediation role for third-party securitisations, receives fee-based income and collateral business in other banking products.
Regulatory Compliance
APRA‘s requirements in managing the capital and risks associated with securitisation activities and exposures are set out in APRA Prudential Standard APS 120 “Securitisation” and Prudential Practice Guide APG 120 “Securitisation”. To be compliant with the standard the Group has policies and procedures that include:
appropriate risk management systems to identify, measure, monitor and manage the risks arising from the Group’s involvement in securitisation;
monitoring the effects of securitisation on its risk profile, including credit quality, and how it has aligned with its risk management practices; and
measures to ensure that it is not providing implicit support for a securitisation.
The Group uses the Internal Assessment Approach (IAA) and the Supervisory Formula Approach (SFA) under the Internal Ratings-Based Approach hierarchy detailed in APS 120 to determine the relevant risk-weight for non-rated securitisation exposures.
The Group applies the IAA to the following asset classes:
Residential mortgages (excluding reverse mortgages);
Trade receivables;
Equipment finance; and
Auto Loans.
The Group uses the SFA for the following asset classes:
CMBS;
Reverse mortgages; and
Investment / margin loans.
For exposures rated by External Credit Assessment Institutions (ECAI), the Group uses the Ratings-Based Approach for regulatory capital purposes.
The Group’s securitisation activities also need to comply with other prudential standards applicable to any traded or balance sheet exposure.
Risk Management Framework
Risk Assessment
Where the Group arranges either a Group-Originated or Third-Party Securitisation transaction, the capital markets issuance will be rated by at least one ECAI based on their respective rating models. The Group uses recognised ECAI including Standard & Poor’s, Moody’s Investors Service
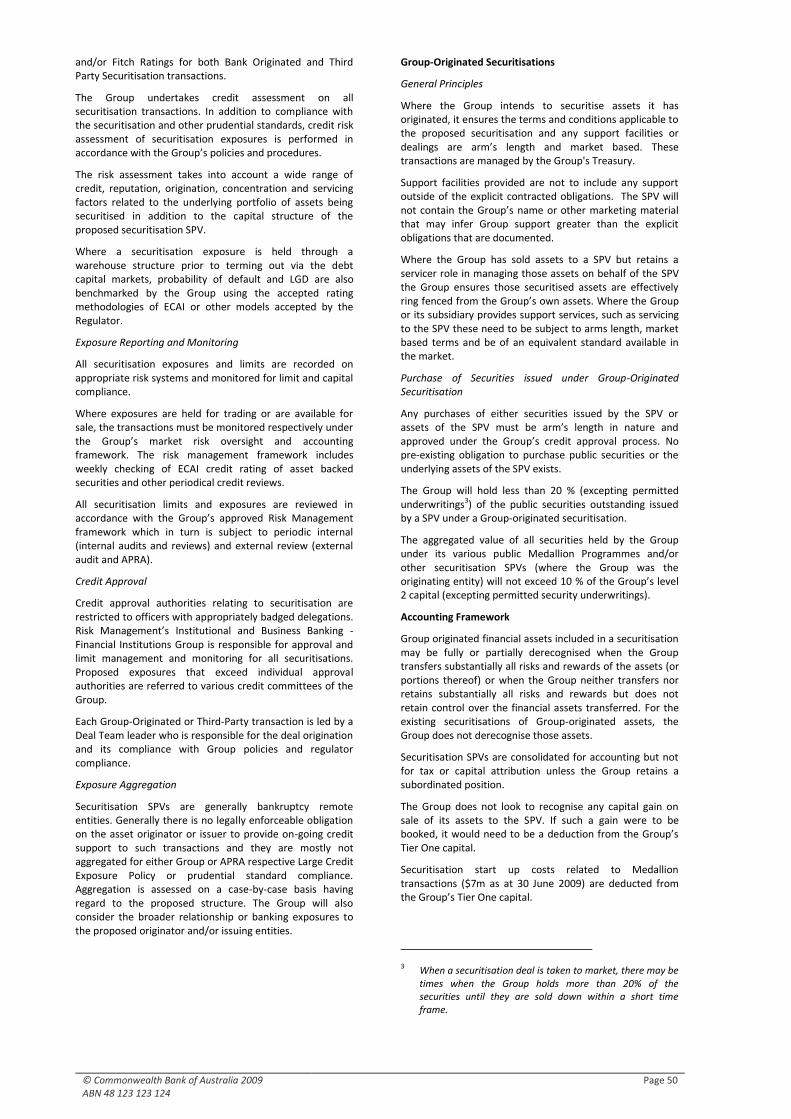
© Commonwealth Bank of Australia 2009 ABN 48 123 123 124
Page 50
and/or Fitch Ratings for both Bank Originated and Third Party Securitisation transactions.
The Group undertakes credit assessment on all securitisation transactions. In addition to compliance with the securitisation and other prudential standards, credit risk assessment of securitisation exposures is performed in accordance with the Group’s policies and procedures.
The risk assessment takes into account a wide range of credit, reputation, origination, concentration and servicing factors related to the underlying portfolio of assets being securitised in addition to the capital structure of the proposed securitisation SPV.
Where a securitisation exposure is held through a warehouse structure prior to terming out via the debt capital markets, probability of default and LGD are also benchmarked by the Group using the accepted rating methodologies of ECAI or other models accepted by the Regulator.
Exposure Reporting and Monitoring
All securitisation exposures and limits are recorded on appropriate risk systems and monitored for limit and capital compliance.
Where exposures are held for trading or are available for sale, the transactions must be monitored respectively under the Group’s market risk oversight and accounting framework. The risk management framework includes weekly checking of ECAI credit rating of asset backed securities and other periodical credit reviews.
All securitisation limits and exposures are reviewed in accordance with the Group’s approved Risk Management framework which in turn is subject to periodic internal (internal audits and reviews) and external review (external audit and APRA).
Credit Approval
Credit approval authorities relating to securitisation are restricted to officers with appropriately badged delegations. Risk Management’s Institutional and Business Banking - Financial Institutions Group is responsible for approval and limit management and monitoring for all securitisations. Proposed exposures that exceed individual approval authorities are referred to various credit committees of the Group.
Each Group-Originated or Third-Party transaction is led by a Deal Team leader who is responsible for the deal origination and its compliance with Group policies and regulator compliance.
Exposure Aggregation
Securitisation SPVs are generally bankruptcy remote entities. Generally there is no legally enforceable obligation on the asset originator or issuer to provide on-going credit support to such transactions and they are mostly not aggregated for either Group or APRA respective Large Credit Exposure Policy or prudential standard compliance. Aggregation is assessed on a case-by-case basis having regard to the proposed structure. The Group will also consider the broader relationship or banking exposures to the proposed originator and/or issuing entities.
Group-Originated Securitisations
General Principles
Where the Group intends to securitise assets it has originated, it ensures the terms and conditions applicable to the proposed securitisation and any support facilities or dealings are arm’s length and market based. These transactions are managed by the Group's Treasury.
Support facilities provided are not to include any support outside of the explicit contracted obligations. The SPV will not contain the Group’s name or other marketing material that may infer Group support greater than the explicit obligations that are documented.
Where the Group has sold assets to a SPV but retains a servicer role in managing those assets on behalf of the SPV the Group ensures those securitised assets are effectively ring fenced from the Group’s own assets. Where the Group or its subsidiary provides support services, such as servicing to the SPV these need to be subject to arms length, market based terms and be of an equivalent standard available in the market.
Purchase of Securities issued under Group-Originated Securitisation
Any purchases of either securities issued by the SPV or assets of the SPV must be arm’s length in nature and approved under the Group’s credit approval process. No pre-existing obligation to purchase public securities or the underlying assets of the SPV exists.
The Group will hold less than 20 % (excepting permitted underwritings3) of the public securities outstanding issued by a SPV under a Group-originated securitisation.
The aggregated value of all securities held by the Group under its various public Medallion Programmes and/or other securitisation SPVs (where the Group was the originating entity) will not exceed 10 % of the Group’s level 2 capital (excepting permitted security underwritings).
Accounting Framework
Group originated financial assets included in a securitisation may be fully or partially derecognised when the Group transfers substantially all risks and rewards of the assets (or portions thereof) or when the Group neither transfers nor retains substantially all risks and rewards but does not retain control over the financial assets transferred. For the existing securitisations of Group-originated assets, the Group does not derecognise those assets.
Securitisation SPVs are consolidated for accounting but not for tax or capital attribution unless the Group retains a subordinated position.
The Group does not look to recognise any capital gain on sale of its assets to the SPV. If such a gain were to be booked, it would need to be a deduction from the Group’s Tier One capital.
Securitisation start up costs related to Medallion transactions ($7m as at 30 June 2009) are deducted from the Group’s Tier One capital.
3 When a securitisation deal is taken to market, there may be times when the Group holds more than 20% of the securities until they are sold down within a short time frame.
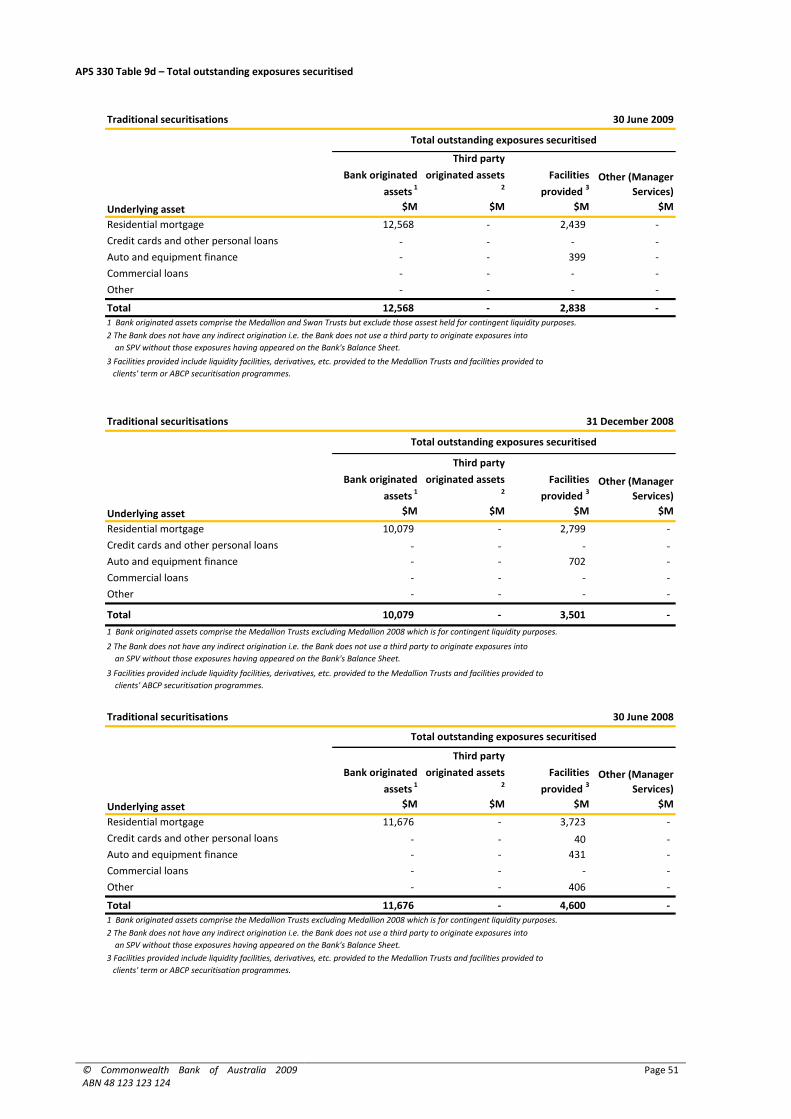
© Commonwealth Bank of Australia 2009 ABN 48 123 123 124
Page 51
APS 330 Table 9d – Total outstanding exposures securitised
Traditional securitisations
Bank originated
assets 1
Third party
originated assets 2
Facilities
provided 3Other (Manager
Services)
$M $M $M $M
Residential mortgage 12,568 - 2,439 -
Credit cards and other personal loans - - - -
Auto and equipment finance - - 399 -
Commercial loans - - - -
Other - - - -
Total 12,568 - 2,838 -
Traditional securitisations
Bank originated
assets 1
Third party
originated assets 2
Facilities
provided 3Other (Manager
Services)
$M $M $M $M
Residential mortgage 10,079 - 2,799 -
Credit cards and other personal loans - - - -
Auto and equipment finance - - 702 -
Commercial loans - - - -
Other - - - -
Total 10,079 - 3,501 -
Traditional securitisations
Bank originated
assets 1
Third party
originated assets 2
Facilities
provided 3Other (Manager
Services)
$M $M $M $M
Residential mortgage 11,676 - 3,723 -
Credit cards and other personal loans - - 40 -
Auto and equipment finance - - 431 -
Commercial loans - - - -
Other - - 406 -
Total 11,676 - 4,600 -
30 June 2009
Underlying asset
Total outstanding exposures securitised
1 Bank originated assets comprise the Medallion and Swan Trusts but exclude those assest held for contingent liquidity purposes.
2 The Bank does not have any indirect origination i.e. the Bank does not use a third party to originate exposures into
an SPV without those exposures having appeared on the Bank's Balance Sheet.
3 Facilities provided include liquidity facilities, derivatives, etc. provided to the Medallion Trusts and facilities provided to
clients' term or ABCP securitisation programmes.
3 Facilities provided include liquidity facilities, derivatives, etc. provided to the Medallion Trusts and facilities provided to
clients' term or ABCP securitisation programmes.
1 Bank originated assets comprise the Medallion Trusts excluding Medallion 2008 which is for contingent liquidity purposes.
2 The Bank does not have any indirect origination i.e. the Bank does not use a third party to originate exposures into
an SPV without those exposures having appeared on the Bank's Balance Sheet.
3 Facilities provided include liquidity facilities, derivatives, etc. provided to the Medallion Trusts and facilities provided to
clients' ABCP securitisation programmes.
30 June 2008
Underlying asset
1 Bank originated assets comprise the Medallion Trusts excluding Medallion 2008 which is for contingent liquidity purposes.
2 The Bank does not have any indirect origination i.e. the Bank does not use a third party to originate exposures into
an SPV without those exposures having appeared on the Bank's Balance Sheet.
Total outstanding exposures securitised
31 December 2008
Total outstanding exposures securitised
Underlying asset
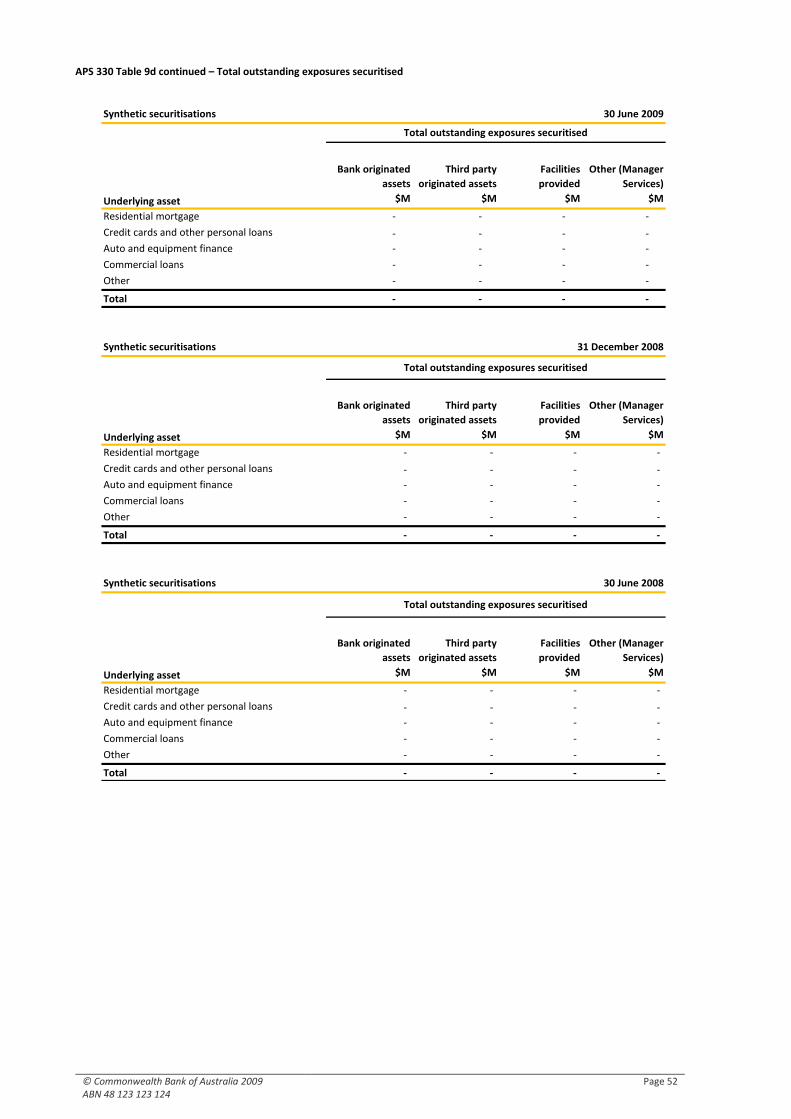
© Commonwealth Bank of Australia 2009 ABN 48 123 123 124
Page 52
APS 330 Table 9d continued – Total outstanding exposures securitised
Synthetic securitisations
Bank originated
assets
Third party
originated assets
Facilities
provided
Other (Manager
Services)
$M $M $M $M
Residential mortgage - - - -
Credit cards and other personal loans - - - -
Auto and equipment finance - - - -
Commercial loans - - - -
Other - - - -
Total - - - -
Synthetic securitisations
Bank originated
assets
Third party
originated assets
Facilities
provided
Other (Manager
Services)
$M $M $M $M
Residential mortgage - - - -
Credit cards and other personal loans - - - -
Auto and equipment finance - - - -
Commercial loans - - - -
Other - - - -
Total - - - -
Synthetic securitisations
Bank originated
assets
Third party
originated assets
Facilities
provided
Other (Manager
Services)
$M $M $M $M
Residential mortgage - - - -
Credit cards and other personal loans - - - -
Auto and equipment finance - - - -
Commercial loans - - - -
Other - - - -
Total - - - -
31 December 2008
Total outstanding exposures securitised
Underlying asset
30 June 2008
Total outstanding exposures securitised
Underlying asset
30 June 2009
Total outstanding exposures securitised
Underlying asset
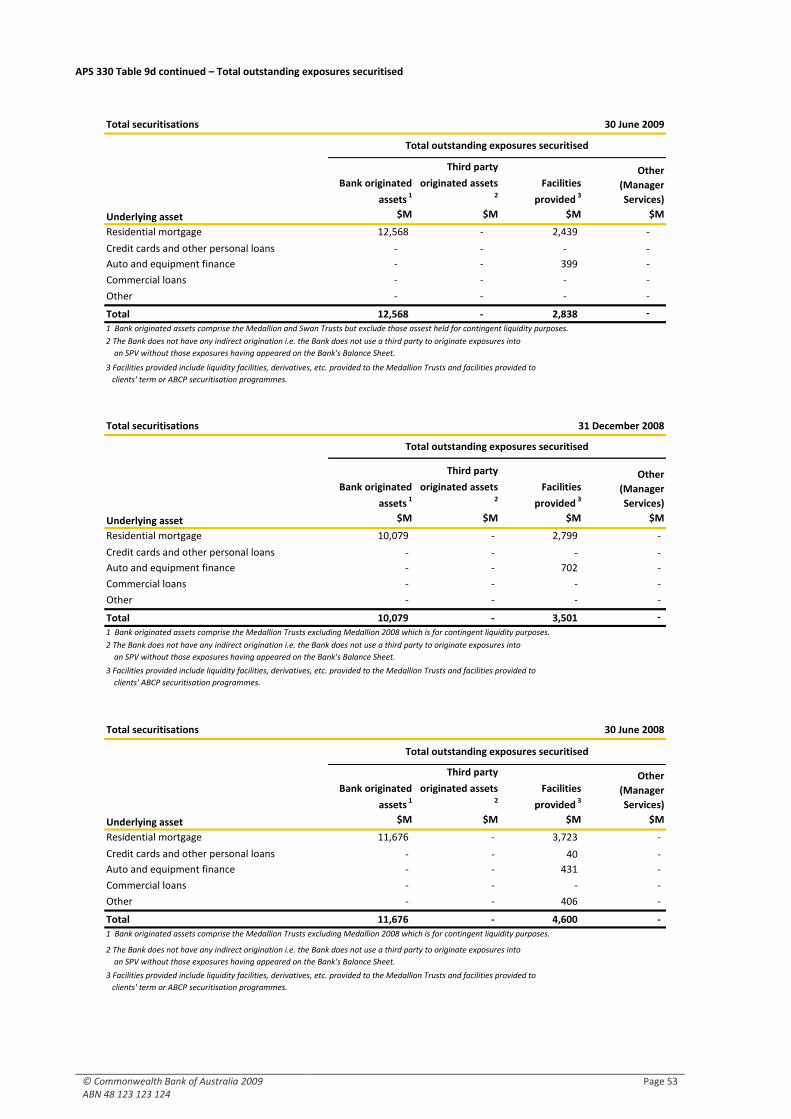
© Commonwealth Bank of Australia 2009 ABN 48 123 123 124
Page 53
APS 330 Table 9d continued – Total outstanding exposures securitised
Total securitisations
Bank originated
assets 1
Third party
originated assets 2
Facilities
provided 3
Other
(Manager
Services)
$M $M $M $M
Residential mortgage 12,568 - 2,439 -
Credit cards and other personal loans - - - -
Auto and equipment finance - - 399 -
Commercial loans - - - -
Other - - - -
Total 12,568 - 2,838 -
Total securitisations
Bank originated
assets 1
Third party
originated assets 2
Facilities
provided 3
Other
(Manager
Services)
$M $M $M $M
Residential mortgage 10,079 - 2,799 -
Credit cards and other personal loans - - - -
Auto and equipment finance - - 702 -
Commercial loans - - - -
Other - - - -
Total 10,079 - 3,501 -
Total securitisations
Bank originated
assets 1
Third party
originated assets 2
Facilities
provided 3
Other
(Manager
Services)
$M $M $M $M
Residential mortgage 11,676 - 3,723 -
Credit cards and other personal loans - - 40 -
Auto and equipment finance - - 431 -
Commercial loans - - - -
Other - - 406 -
Total 11,676 - 4,600 -
Underlying asset
1 Bank originated assets comprise the Medallion and Swan Trusts but exclude those assest held for contingent liquidity purposes.
2 The Bank does not have any indirect origination i.e. the Bank does not use a third party to originate exposures into
an SPV without those exposures having appeared on the Bank's Balance Sheet.
3 Facilities provided include liquidity facilities, derivatives, etc. provided to the Medallion Trusts and facilities provided to
clients' term or ABCP securitisation programmes.
1 Bank originated assets comprise the Medallion Trusts excluding Medallion 2008 which is for contingent liquidity purposes.
2 The Bank does not have any indirect origination i.e. the Bank does not use a third party to originate exposures into
an SPV without those exposures having appeared on the Bank's Balance Sheet.
3 Facilities provided include liquidity facilities, derivatives, etc. provided to the Medallion Trusts and facilities provided to
clients' ABCP securitisation programmes.
1 Bank originated assets comprise the Medallion Trusts excluding Medallion 2008 which is for contingent liquidity purposes.
30 June 2008
Total outstanding exposures securitised
Underlying asset
2 The Bank does not have any indirect origination i.e. the Bank does not use a third party to originate exposures into
an SPV without those exposures having appeared on the Bank's Balance Sheet.
3 Facilities provided include liquidity facilities, derivatives, etc. provided to the Medallion Trusts and facilities provided to
clients' term or ABCP securitisation programmes.
30 June 2009
Total outstanding exposures securitised
31 December 2008
Total outstanding exposures securitised
Underlying asset
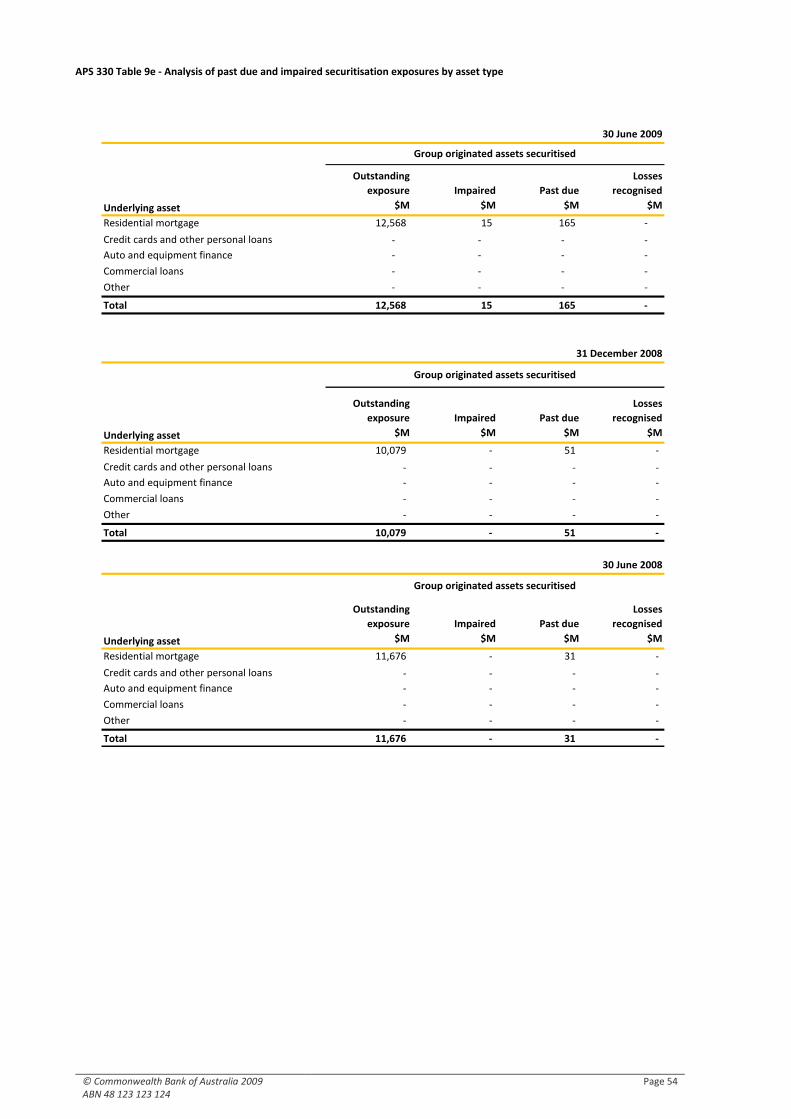
© Commonwealth Bank of Australia 2009 ABN 48 123 123 124
Page 54
APS 330 Table 9e - Analysis of past due and impaired securitisation exposures by asset type
Outstanding
exposure Impaired Past due
Losses
recognised
$M $M $M $M
Residential mortgage 12,568 15 165 -
Credit cards and other personal loans - - - -
Auto and equipment finance - - - -
Commercial loans - - - -
Other - - - -
Total 12,568 15 165 -
Outstanding
exposure Impaired Past due
Losses
recognised
$M $M $M $M
Residential mortgage 10,079 - 51 -
Credit cards and other personal loans - - - -
Auto and equipment finance - - - -
Commercial loans - - - -
Other - - - -
Total 10,079 - 51 -
Outstanding
exposure Impaired Past due
Losses
recognised
$M $M $M $M
Residential mortgage 11,676 - 31 -
Credit cards and other personal loans - - - -
Auto and equipment finance - - - -
Commercial loans - - - -
Other - - - -
Total 11,676 - 31 -
30 June 2009
Group originated assets securitised
Group originated assets securitised
Underlying asset
Group originated assets securitised
Underlying asset
30 June 2008
Underlying asset
31 December 2008
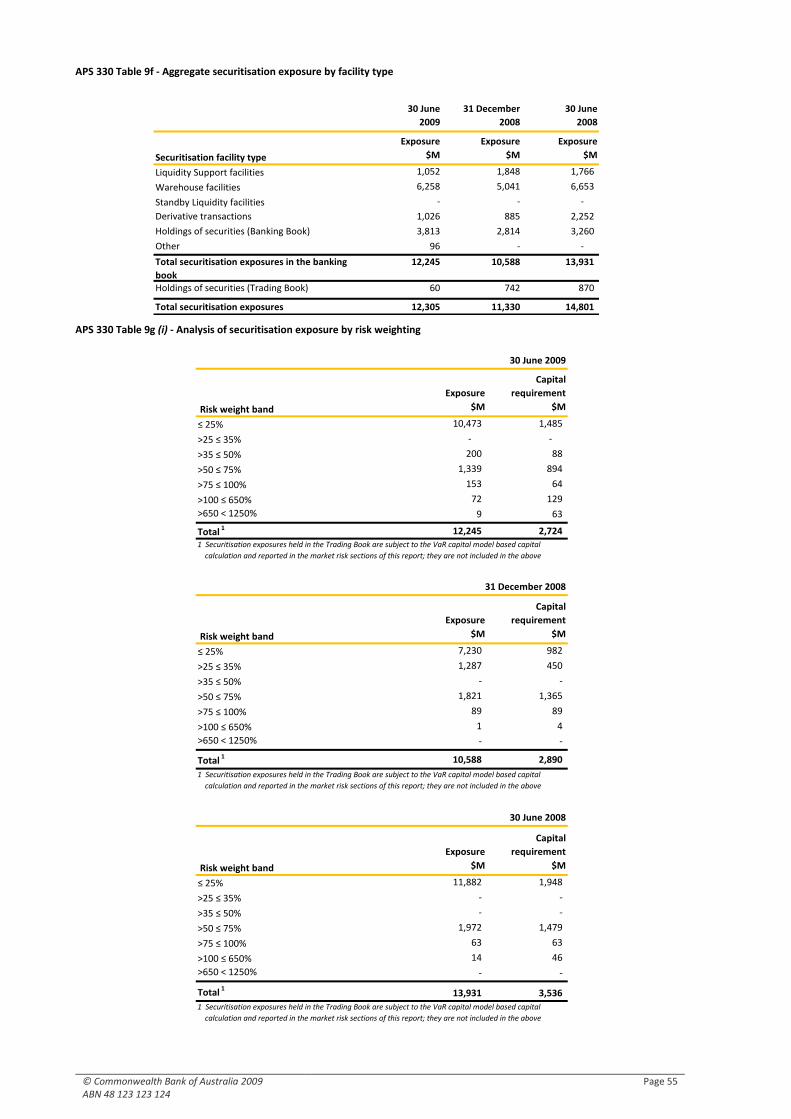
© Commonwealth Bank of Australia 2009 ABN 48 123 123 124
Page 55
APS 330 Table 9f - Aggregate securitisation exposure by facility type
APS 330 Table 9g (i) - Analysis of securitisation exposure by risk weighting
Exposure
Capital
requirement
$M $M
≤ 25% 10,473 1,485
>25 ≤ 35% - -
>35 ≤ 50% 200 88
>50 ≤ 75% 1,339 894
>75 ≤ 100% 153 64
>100 ≤ 650% 72 129
>650 < 1250% 9 63
Total 1 12,245 2,724
Exposure
Capital
requirement
$M $M
≤ 25% 7,230 982
>25 ≤ 35% 1,287 450
>35 ≤ 50% - -
>50 ≤ 75% 1,821 1,365
>75 ≤ 100% 89 89
>100 ≤ 650% 1 4
>650 < 1250% - -
Total 1 10,588 2,890
Exposure
Capital
requirement
$M $M
≤ 25% 11,882 1,948
>25 ≤ 35% - -
>35 ≤ 50% - -
>50 ≤ 75% 1,972 1,479
>75 ≤ 100% 63 63
>100 ≤ 650% 14 46
>650 < 1250% - -
Total 113,931 3,536
30 June 2009
Risk weight band
1 Securitisation exposures held in the Trading Book are subject to the VaR capital model based capital
calculation and reported in the market risk sections of this report; they are not included in the above
1 Securitisation exposures held in the Trading Book are subject to the VaR capital model based capital
calculation and reported in the market risk sections of this report; they are not included in the above
1 Securitisation exposures held in the Trading Book are subject to the VaR capital model based capital
calculation and reported in the market risk sections of this report; they are not included in the above
30 June 2008
Risk weight band
31 December 2008
Risk weight band
30 June
2009
31 December
2008
30 June
2008
Exposure Exposure Exposure
$M $M $M
Liquidity Support facilities 1,052 1,848 1,766
Warehouse facilities 6,258 5,041 6,653
Standby Liquidity facilities - - -
Derivative transactions 1,026 885 2,252
Holdings of securities (Banking Book) 3,813 2,814 3,260
Other 96 - -
Total securitisation exposures in the banking
book
12,245 10,588 13,931
Holdings of securities (Trading Book) 60 742 870
Total securitisation exposures 12,305 11,330 14,801
Securitisation facility type
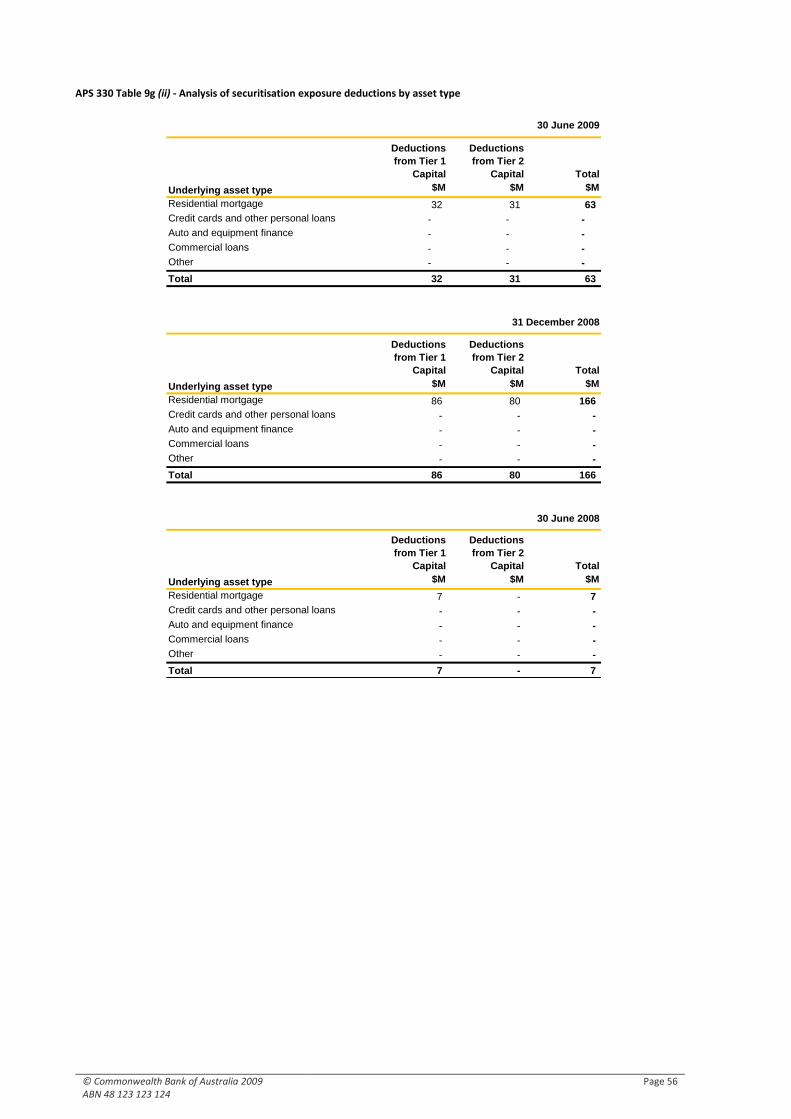
© Commonwealth Bank of Australia 2009 ABN 48 123 123 124
Page 56
APS 330 Table 9g (ii) - Analysis of securitisation exposure deductions by asset type
Deductions
from Tier 1
Capital
Deductions
from Tier 2
Capital Total
$M $M $M
Residential mortgage 32 31 63
Credit cards and other personal loans - - -
Auto and equipment finance - - -
Commercial loans - - -
Other - - -
Total 32 31 63
Deductions
from Tier 1
Capital
Deductions
from Tier 2
Capital Total
$M $M $M
Residential mortgage 86 80 166
Credit cards and other personal loans - - -
Auto and equipment finance - - -
Commercial loans - - -
Other - - -
Total 86 80 166
Deductions
from Tier 1
Capital
Deductions
from Tier 2
Capital Total
$M $M $M
Residential mortgage 7 - 7
Credit cards and other personal loans - - -
Auto and equipment finance - - -
Commercial loans - - -
Other - - -
Total 7 - 7
Underlying asset type
30 June 2009
Underlying asset type
Underlying asset type
31 December 2008
30 June 2008
© Commonwealth Bank of Australia 2009 ABN 48 123 123 124
Page 57
APS 330 Table 9h - Analysis of securitisation exposure subject to early amortisation
Seller's interest
Investors'
interest
Drawn
balances Undrawn lines Drawn balances Undrawn lines
$M $M $M $M $M $M
Residential mortgage - - - - - -
Credit cards and other personal loans - - - - - -
Auto and equipment finance - - - - - -
Commercial loans - - - - - -
Other - - - - - -
Total - - - - - -
Seller's interest Investors'
interest
Drawn
balances
Undrawn lines
Drawn balances
Undrawn lines
$M $M $M $M $M $M
Residential mortgage - - - - - -
Credit cards and other personal loans - - - - - -
Auto and equipment finance - - - - - -
Commercial loans - - - - - -
Other - - - - - -
Total - - - - - -
30 June 2009
Aggregate drawn exposure
Aggregate IRB capital charge
against Bank's retained shares
from:
Aggregate IRB capital charge against
investor's shares of:
Underlying asset type
Underlying asset type
Aggregate drawn exposure
Aggregate IRB capital charge
against Bank's retained shares
from:
Aggregate IRB capital charge against
investor's shares of:
Underlying asset type
30 June 2008
Aggregate drawn exposure
Aggregate IRB capital charge
against Bank's retained shares
from:
Aggregate IRB capital charge against
investor's shares of:
31 December 2008
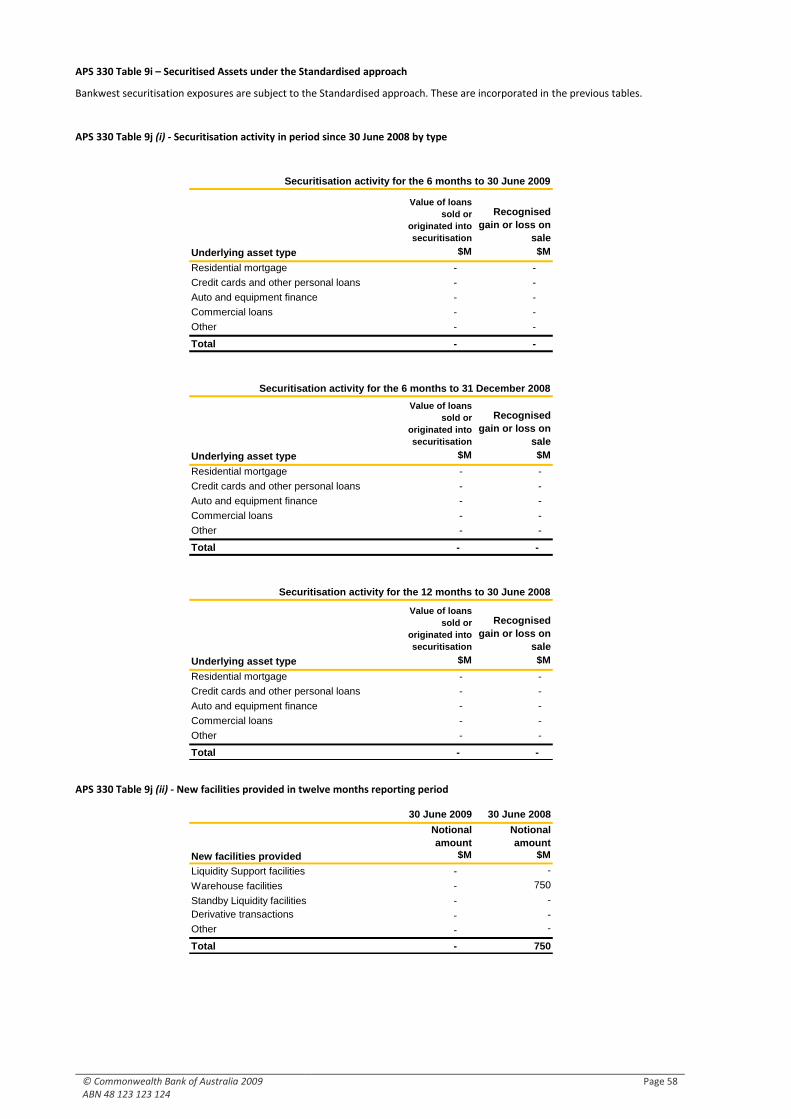
© Commonwealth Bank of Australia 2009 ABN 48 123 123 124
Page 58
APS 330 Table 9i – Securitised Assets under the Standardised approach
Bankwest securitisation exposures are subject to the Standardised approach. These are incorporated in the previous tables.
APS 330 Table 9j (i) - Securitisation activity in period since 30 June 2008 by type
APS 330 Table 9j (ii) - New facilities provided in twelve months reporting period
Value of loans
sold or
originated into
securitisation
Recognised
gain or loss on
sale
Underlying asset type $M $M
Residential mortgage - -
Credit cards and other personal loans - -
Auto and equipment finance - -
Commercial loans - -
Other - -
Total - -
Value of loans
sold or
originated into
securitisation
Recognised
gain or loss on
sale
Underlying asset type $M $M
Residential mortgage - -
Credit cards and other personal loans - -
Auto and equipment finance - -
Commercial loans - -
Other - -
Total - -
Value of loans
sold or
originated into
securitisation
Recognised
gain or loss on
sale
Underlying asset type $M $M
Residential mortgage - -
Credit cards and other personal loans - -
Auto and equipment finance - -
Commercial loans - -
Other - -
Total - -
Securitisation activity for the 6 months to 31 December 2008
Securitisation activity for the 6 months to 30 June 2009
Securitisation activity for the 12 months to 30 June 2008
30 June 2009 30 June 2008
Notional
amount
Notional
amount
$M $M
Liquidity Support facilities - -
Warehouse facilities - 750
Standby Liquidity facilities - -
Derivative transactions - -
Other - -
Total - 750
New facilities provided
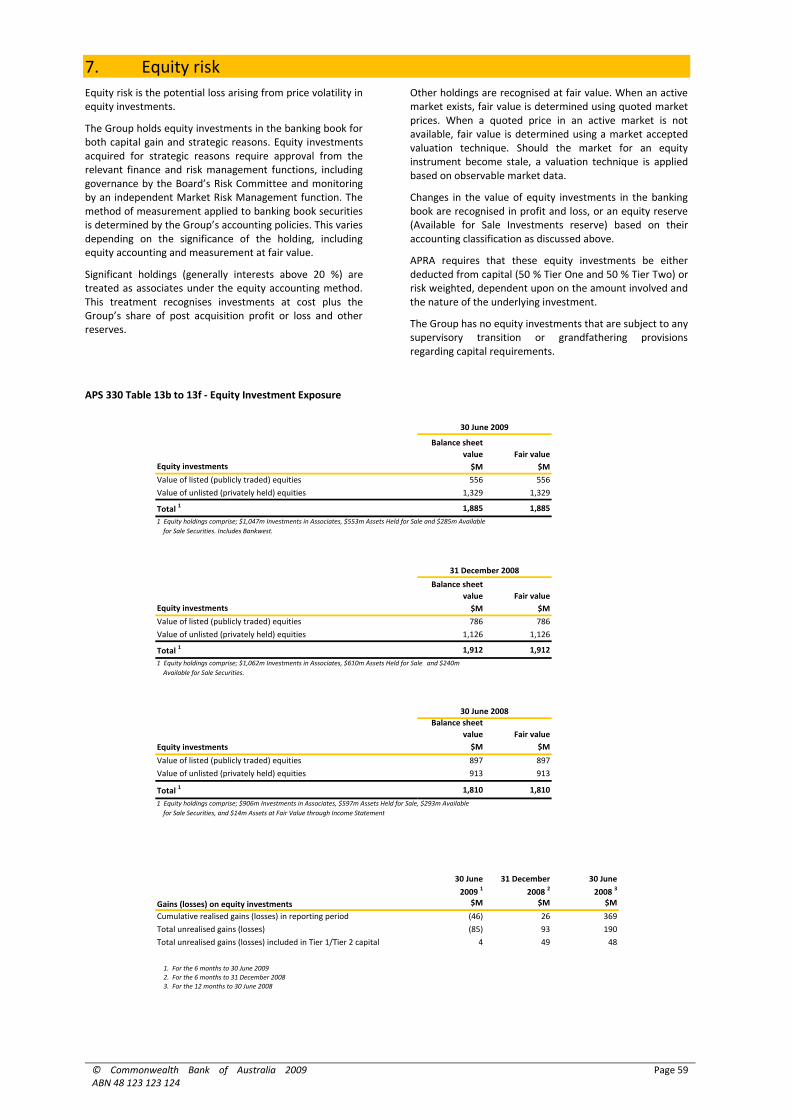
© Commonwealth Bank of Australia 2009 ABN 48 123 123 124
Page 59
7. Equity risk
Equity risk is the potential loss arising from price volatility in equity investments.
The Group holds equity investments in the banking book for both capital gain and strategic reasons. Equity investments acquired for strategic reasons require approval from the relevant finance and risk management functions, including governance by the Board’s Risk Committee and monitoring by an independent Market Risk Management function. The method of measurement applied to banking book securities is determined by the Group’s accounting policies. This varies depending on the significance of the holding, including equity accounting and measurement at fair value.
Significant holdings (generally interests above 20 %) are treated as associates under the equity accounting method. This treatment recognises investments at cost plus the Group’s share of post acquisition profit or loss and other reserves.
Other holdings are recognised at fair value. When an active market exists, fair value is determined using quoted market prices. When a quoted price in an active market is not available, fair value is determined using a market accepted valuation technique. Should the market for an equity instrument become stale, a valuation technique is applied based on observable market data.
Changes in the value of equity investments in the banking book are recognised in profit and loss, or an equity reserve (Available for Sale Investments reserve) based on their accounting classification as discussed above.
APRA requires that these equity investments be either deducted from capital (50 % Tier One and 50 % Tier Two) or risk weighted, dependent upon on the amount involved and the nature of the underlying investment.
The Group has no equity investments that are subject to any supervisory transition or grandfathering provisions regarding capital requirements.
APS 330 Table 13b to 13f - Equity Investment Exposure
Balance sheet
value Fair value
$M $M
Value of listed (publicly traded) equities 556 556
Value of unlisted (privately held) equities 1,329 1,329
Total 1 1,885 1,885
Balance sheet
value Fair value
$M $M
Value of listed (publicly traded) equities 786 786
Value of unlisted (privately held) equities 1,126 1,126
Total 1 1,912 1,912
Balance sheet
value Fair value
$M $M
Value of listed (publicly traded) equities 897 897
Value of unlisted (privately held) equities 913 913
Total 1 1,810 1,810
30 June
2009 131 December
2008 230 June
2008 3
$M $M $M
Cumulative realised gains (losses) in reporting period (46) 26 369
Total unrealised gains (losses) (85) 93 190
Total unrealised gains (losses) included in Tier 1/Tier 2 capital 4 49 48
1 Equity holdings comprise; $906m Investments in Associates, $597m Assets Held for Sale, $293m Available
for Sale Securities, and $14m Assets at Fair Value through Income Statement
1 Equity holdings comprise; $1,047m Investments in Associates, $553m Assets Held for Sale and $285m Available
for Sale Securities. Includes Bankwest.
1. For the 6 months to 30 June 2009
2. For the 6 months to 31 December 2008
3. For the 12 months to 30 June 2008
31 December 2008
30 June 2008
30 June 2009
Gains (losses) on equity investments
Equity investments
Equity investments
Equity investments
1 Equity holdings comprise; $1,062m Investments in Associates, $610m Assets Held for Sale and $240m
Available for Sale Securities.
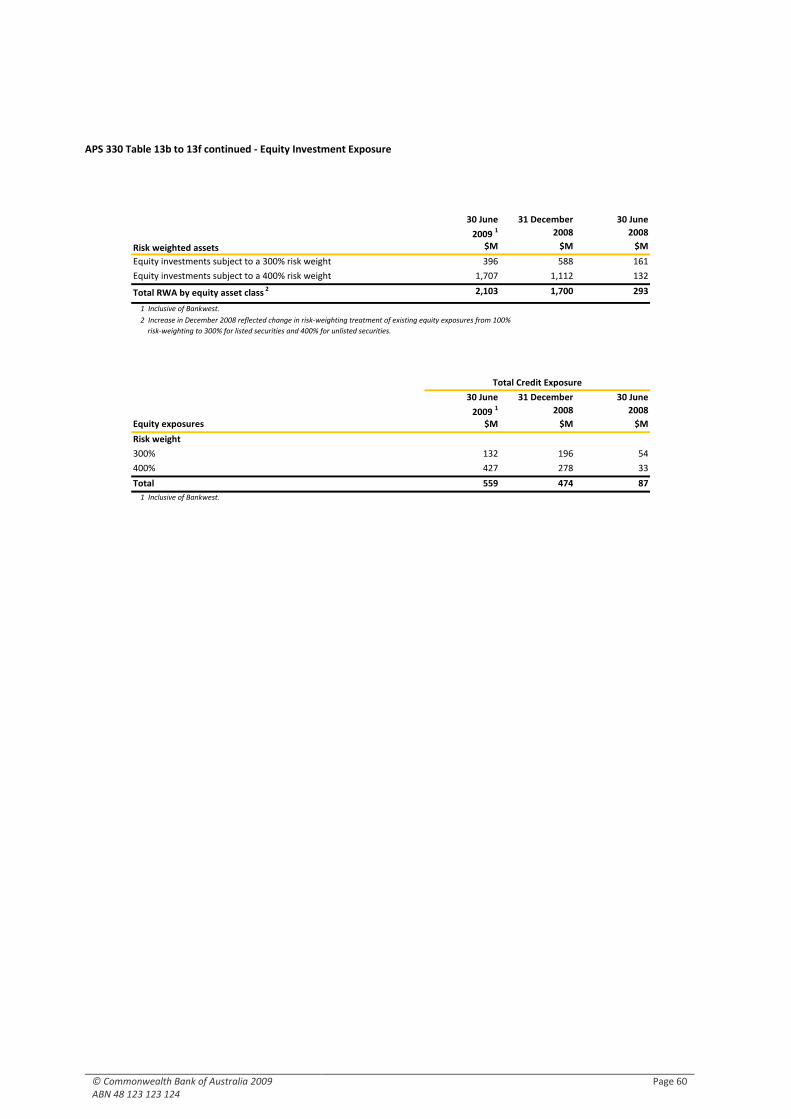
© Commonwealth Bank of Australia 2009 ABN 48 123 123 124
Page 60
APS 330 Table 13b to 13f continued - Equity Investment Exposure
30 June
2009 131 December
2008
30 June
2008
$M $M $M
Equity investments subject to a 300% risk weight 396 588 161
Equity investments subject to a 400% risk weight 1,707 1,112 132
Total RWA by equity asset class 2 2,103 1,700 293
30 June
2009 131 December
2008
30 June
2008
Equity exposures $M $M $M
Risk weight
300% 132 196 54
400% 427 278 33
Total 559 474 87
Risk weighted assets
1 Inclusive of Bankwest.
1 Inclusive of Bankwest.
Total Credit Exposure
2 Increase in December 2008 reflected change in risk-weighting treatment of existing equity exposures from 100%
risk-weighting to 300% for listed securities and 400% for unlisted securities.
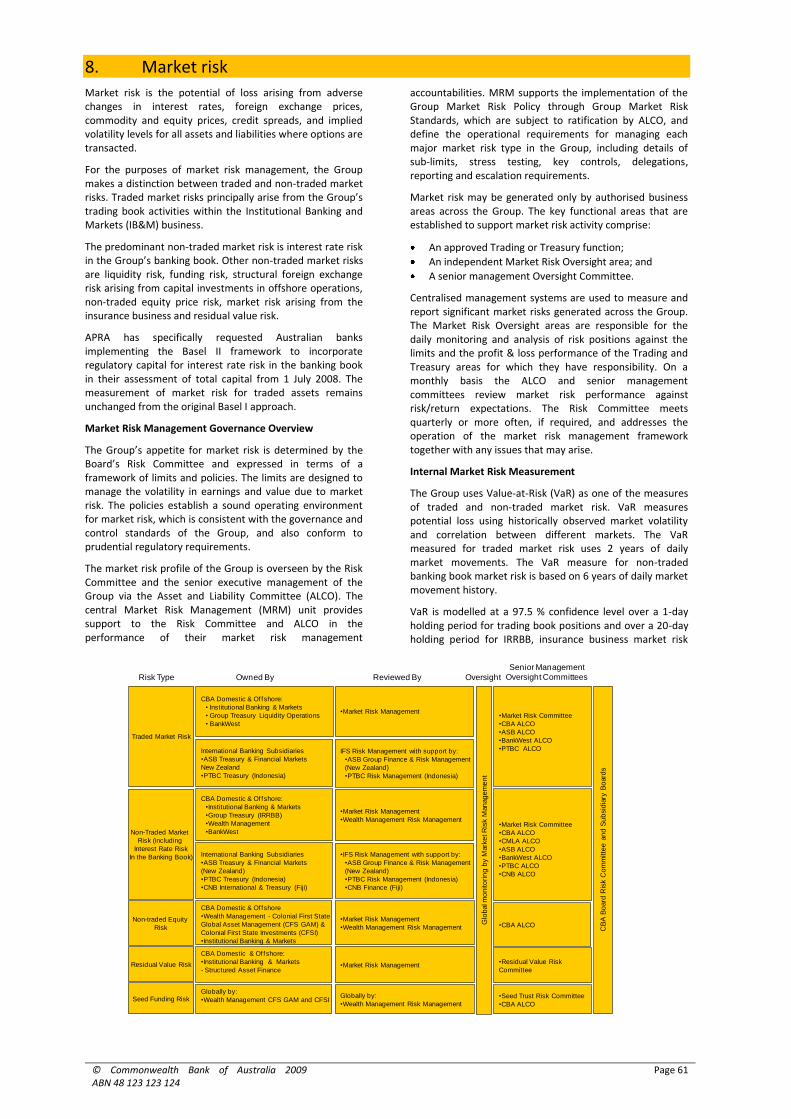
© Commonwealth Bank of Australia 2009 ABN 48 123 123 124
Page 61
8. Market risk
Market risk is the potential of loss arising from adverse changes in interest rates, foreign exchange prices, commodity and equity prices, credit spreads, and implied volatility levels for all assets and liabilities where options are transacted.
For the purposes of market risk management, the Group makes a distinction between traded and non-traded market risks. Traded market risks principally arise from the Group’s trading book activities within the Institutional Banking and Markets (IB&M) business.
The predominant non-traded market risk is interest rate risk in the Group’s banking book. Other non-traded market risks are liquidity risk, funding risk, structural foreign exchange risk arising from capital investments in offshore operations, non-traded equity price risk, market risk arising from the insurance business and residual value risk.
APRA has specifically requested Australian banks implementing the Basel II framework to incorporate regulatory capital for interest rate risk in the banking book in their assessment of total capital from 1 July 2008. The measurement of market risk for traded assets remains unchanged from the original Basel I approach.
Market Risk Management Governance Overview
The Group’s appetite for market risk is determined by the Board’s Risk Committee and expressed in terms of a framework of limits and policies. The limits are designed to manage the volatility in earnings and value due to market risk. The policies establish a sound operating environment for market risk, which is consistent with the governance and control standards of the Group, and also conform to prudential regulatory requirements.
The market risk profile of the Group is overseen by the Risk Committee and the senior executive management of the Group via the Asset and Liability Committee (ALCO). The central Market Risk Management (MRM) unit provides support to the Risk Committee and ALCO in the performance of their market risk management
accountabilities. MRM supports the implementation of the Group Market Risk Policy through Group Market Risk Standards, which are subject to ratification by ALCO, and define the operational requirements for managing each major market risk type in the Group, including details of sub-limits, stress testing, key controls, delegations, reporting and escalation requirements.
Market risk may be generated only by authorised business areas across the Group. The key functional areas that are established to support market risk activity comprise:
An approved Trading or Treasury function;
An independent Market Risk Oversight area; and
A senior management Oversight Committee.
Centralised management systems are used to measure and report significant market risks generated across the Group. The Market Risk Oversight areas are responsible for the daily monitoring and analysis of risk positions against the limits and the profit & loss performance of the Trading and Treasury areas for which they have responsibility. On a monthly basis the ALCO and senior management committees review market risk performance against risk/return expectations. The Risk Committee meets quarterly or more often, if required, and addresses the operation of the market risk management framework together with any issues that may arise.
Internal Market Risk Measurement
The Group uses Value-at-Risk (VaR) as one of the measures of traded and non-traded market risk. VaR measures potential loss using historically observed market volatility and correlation between different markets. The VaR measured for traded market risk uses 2 years of daily market movements. The VaR measure for non-traded banking book market risk is based on 6 years of daily market movement history.
VaR is modelled at a 97.5 % confidence level over a 1-day holding period for trading book positions and over a 20-day holding period for IRRBB, insurance business market risk
Traded Market Risk
Non-Traded Market
Risk (including
Interest Rate Risk
In the Banking Book)
Residual Value Risk
Seed Funding Risk
CBA Domestic & Offshore:
• Institutional Banking & Markets
• Group Treasury Liquidity Operations
• BankWest
CBA Domestic & Offshore:
•Institutional Banking & Markets
•Group Treasury (IRRBB)
•Wealth Management
•BankWest
CBA Domestic & Offshore:
•Institutional Banking & Markets
- Structured Asset Finance
Globally by:
•Wealth Management CFS GAM and CFSI
•Market Risk Management
IFS Risk Management with support by:
•ASB Group Finance & Risk Management
(New Zealand)
•PTBC Risk Management (Indonesia)
•Market Risk Management
•Wealth Management Risk Management
•IFS Risk Management with support by:
•ASB Group Finance & Risk Management
(New Zealand)
•PTBC Risk Management (Indonesia)
•CNB Finance (Fiji)
•Market Risk Committee
•CBA ALCO
•ASB ALCO
•BankWest ALCO
•PTBC ALCO
•Market Risk Committee
•CBA ALCO
•CMLA ALCO
•ASB ALCO
•BankWest ALCO
•PTBC ALCO
•CNB ALCO
•Seed Trust Risk Committee
•CBA ALCO
CB
A B
oard
Ris
k C
om
mitte
e a
nd
Su
bsid
iary
Bo
ard
s
Risk Type Owned By Reviewed By
Senior Management
Oversight Committees
•Residual Value Risk
Committee
International Banking Subsidiaries
•ASB Treasury & Financial Markets
New Zealand
•PTBC Treasury (Indonesia)
International Banking Subsidiaries
•ASB Treasury & Financial Markets
(New Zealand)
•PTBC Treasury (Indonesia)
•CNB International & Treasury (Fiji)
•Market Risk Management
Globally by:
•Wealth Management Risk Management
Glo
bal m
on
ito
rin
g b
y M
ark
et R
isk M
an
ag
em
en
t
Oversight
Non-traded Equity
Risk
•Market Risk Management
•Wealth Management Risk Management
CBA Domestic & Offshore
•Wealth Management - Colonial First State
Global Asset Management (CFS GAM) &
Colonial First State Investments (CFSI)
•Institutional Banking & Markets
•CBA ALCO
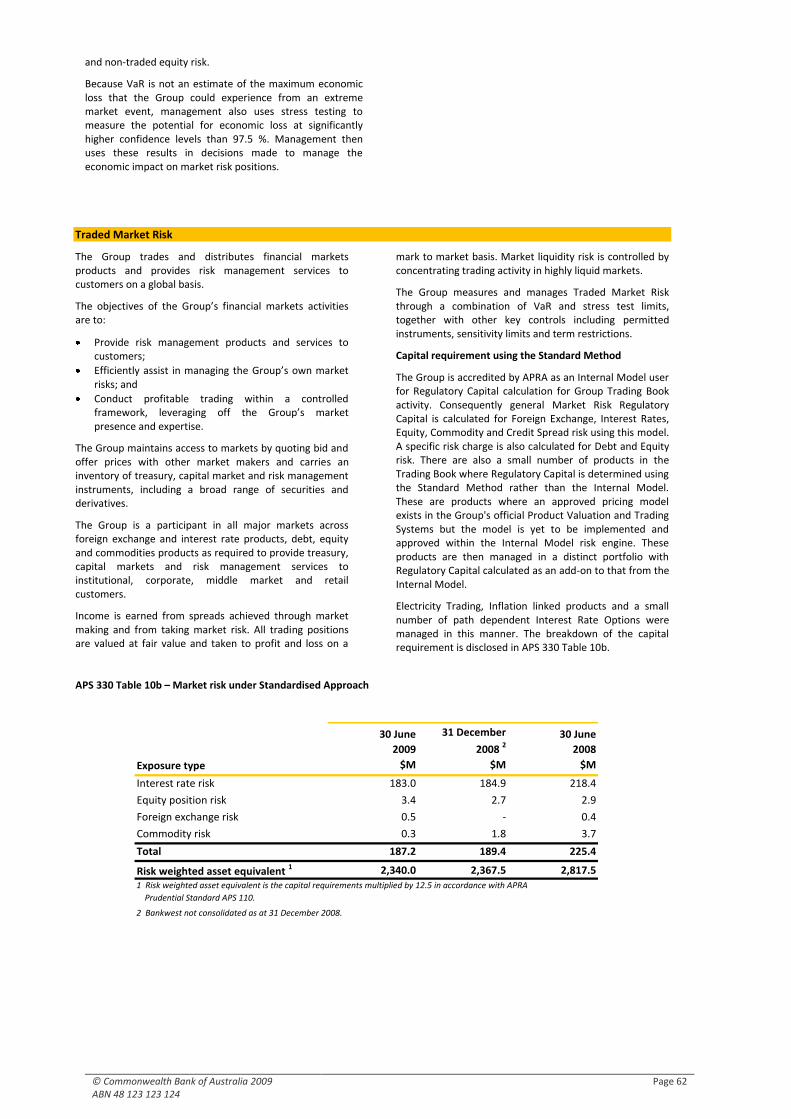
© Commonwealth Bank of Australia 2009 ABN 48 123 123 124
Page 62
and non-traded equity risk.
Because VaR is not an estimate of the maximum economic loss that the Group could experience from an extreme market event, management also uses stress testing to measure the potential for economic loss at significantly higher confidence levels than 97.5 %. Management then uses these results in decisions made to manage the economic impact on market risk positions.
Traded Market Risk
The Group trades and distributes financial markets products and provides risk management services to customers on a global basis.
The objectives of the Group’s financial markets activities are to:
Provide risk management products and services to customers;
Efficiently assist in managing the Group’s own market risks; and
Conduct profitable trading within a controlled framework, leveraging off the Group’s market presence and expertise.
The Group maintains access to markets by quoting bid and offer prices with other market makers and carries an inventory of treasury, capital market and risk management instruments, including a broad range of securities and derivatives.
The Group is a participant in all major markets across foreign exchange and interest rate products, debt, equity and commodities products as required to provide treasury, capital markets and risk management services to institutional, corporate, middle market and retail customers.
Income is earned from spreads achieved through market making and from taking market risk. All trading positions are valued at fair value and taken to profit and loss on a
mark to market basis. Market liquidity risk is controlled by concentrating trading activity in highly liquid markets.
The Group measures and manages Traded Market Risk through a combination of VaR and stress test limits, together with other key controls including permitted instruments, sensitivity limits and term restrictions.
Capital requirement using the Standard Method
The Group is accredited by APRA as an Internal Model user for Regulatory Capital calculation for Group Trading Book activity. Consequently general Market Risk Regulatory Capital is calculated for Foreign Exchange, Interest Rates, Equity, Commodity and Credit Spread risk using this model. A specific risk charge is also calculated for Debt and Equity risk. There are also a small number of products in the Trading Book where Regulatory Capital is determined using the Standard Method rather than the Internal Model. These are products where an approved pricing model exists in the Group's official Product Valuation and Trading Systems but the model is yet to be implemented and approved within the Internal Model risk engine. These products are then managed in a distinct portfolio with Regulatory Capital calculated as an add-on to that from the Internal Model.
Electricity Trading, Inflation linked products and a small number of path dependent Interest Rate Options were managed in this manner. The breakdown of the capital requirement is disclosed in APS 330 Table 10b.
APS 330 Table 10b – Market risk under Standardised Approach
30 June
2009
31 December
2008 230 June
2008
Exposure type $M $M $M
Interest rate risk 183.0 184.9 218.4
Equity position risk 3.4 2.7 2.9
Foreign exchange risk 0.5 - 0.4
Commodity risk 0.3 1.8 3.7
Total 187.2 189.4 225.4
Risk weighted asset equivalent 1 2,340.0 2,367.5 2,817.5 1 Risk weighted asset equivalent is the capital requirements multiplied by 12.5 in accordance with APRA
Prudential Standard APS 110.
2 Bankwest not consolidated as at 31 December 2008.
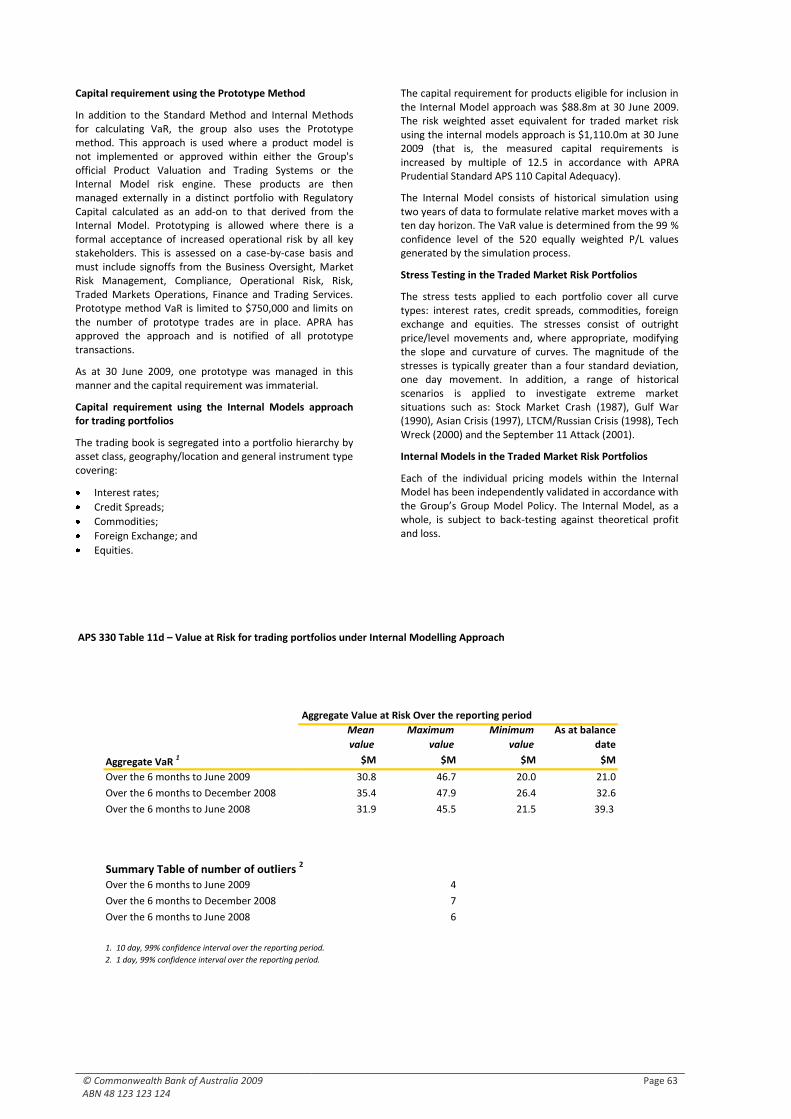
© Commonwealth Bank of Australia 2009 ABN 48 123 123 124
Page 63
Capital requirement using the Prototype Method
In addition to the Standard Method and Internal Methods for calculating VaR, the group also uses the Prototype method. This approach is used where a product model is not implemented or approved within either the Group's official Product Valuation and Trading Systems or the Internal Model risk engine. These products are then managed externally in a distinct portfolio with Regulatory Capital calculated as an add-on to that derived from the Internal Model. Prototyping is allowed where there is a formal acceptance of increased operational risk by all key stakeholders. This is assessed on a case-by-case basis and must include signoffs from the Business Oversight, Market Risk Management, Compliance, Operational Risk, Risk, Traded Markets Operations, Finance and Trading Services. Prototype method VaR is limited to $750,000 and limits on the number of prototype trades are in place. APRA has approved the approach and is notified of all prototype transactions.
As at 30 June 2009, one prototype was managed in this manner and the capital requirement was immaterial.
Capital requirement using the Internal Models approach for trading portfolios
The trading book is segregated into a portfolio hierarchy by asset class, geography/location and general instrument type covering:
Interest rates;
Credit Spreads;
Commodities;
Foreign Exchange; and
Equities.
The capital requirement for products eligible for inclusion in the Internal Model approach was $88.8m at 30 June 2009. The risk weighted asset equivalent for traded market risk using the internal models approach is $1,110.0m at 30 June 2009 (that is, the measured capital requirements is increased by multiple of 12.5 in accordance with APRA Prudential Standard APS 110 Capital Adequacy).
The Internal Model consists of historical simulation using two years of data to formulate relative market moves with a ten day horizon. The VaR value is determined from the 99 % confidence level of the 520 equally weighted P/L values generated by the simulation process.
Stress Testing in the Traded Market Risk Portfolios
The stress tests applied to each portfolio cover all curve types: interest rates, credit spreads, commodities, foreign exchange and equities. The stresses consist of outright price/level movements and, where appropriate, modifying the slope and curvature of curves. The magnitude of the stresses is typically greater than a four standard deviation, one day movement. In addition, a range of historical scenarios is applied to investigate extreme market situations such as: Stock Market Crash (1987), Gulf War (1990), Asian Crisis (1997), LTCM/Russian Crisis (1998), Tech Wreck (2000) and the September 11 Attack (2001).
Internal Models in the Traded Market Risk Portfolios
Each of the individual pricing models within the Internal Model has been independently validated in accordance with the Group’s Group Model Policy. The Internal Model, as a whole, is subject to back-testing against theoretical profit and loss.
APS 330 Table 11d – Value at Risk for trading portfolios under Internal Modelling Approach
Mean
value
Maximum
value
Minimum
value
As at balance
date
Aggregate VaR 1 $M $M $M $M
Over the 6 months to June 2009 30.8 46.7 20.0 21.0
Over the 6 months to December 2008 35.4 47.9 26.4 32.6
Over the 6 months to June 2008 31.9 45.5 21.5 39.3
Summary Table of number of outliers 2
4
7
6
2. 1 day, 99% confidence interval over the reporting period.
Over the 6 months to June 2009
Over the 6 months to December 2008
Over the 6 months to June 2008
Aggregate Value at Risk Over the reporting period
1. 10 day, 99% confidence interval over the reporting period.
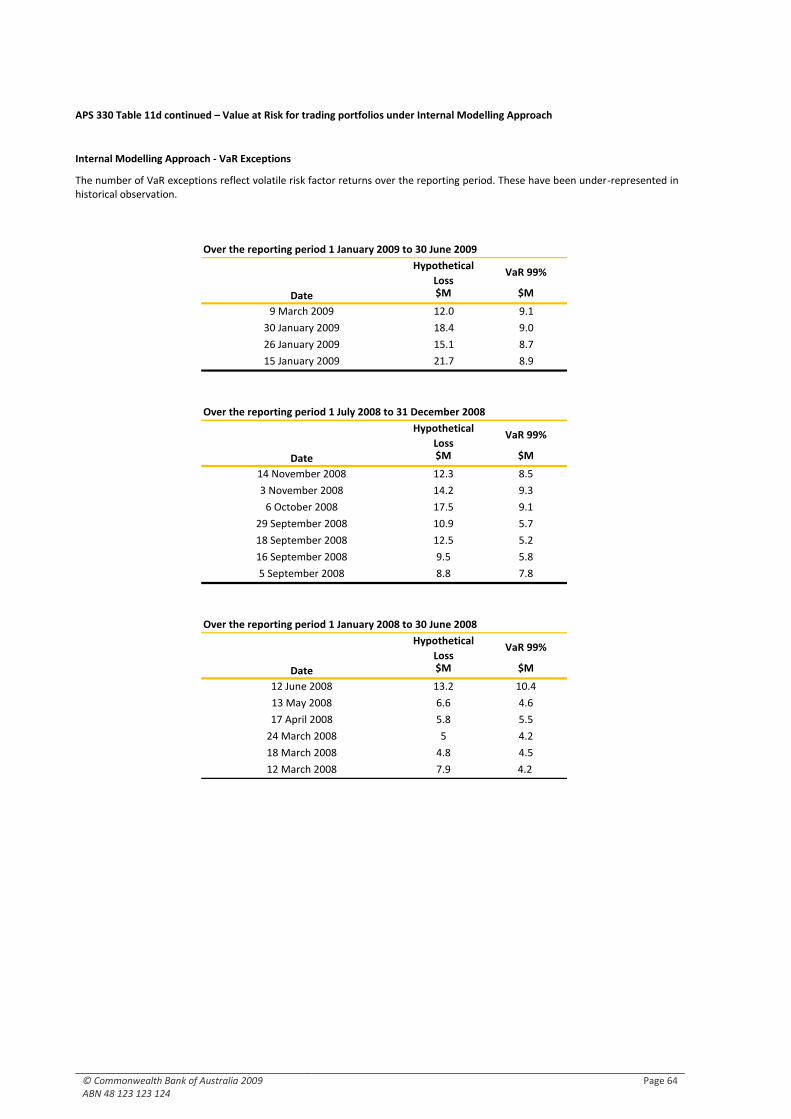
© Commonwealth Bank of Australia 2009 ABN 48 123 123 124
Page 64
APS 330 Table 11d continued – Value at Risk for trading portfolios under Internal Modelling Approach
Internal Modelling Approach - VaR Exceptions
The number of VaR exceptions reflect volatile risk factor returns over the reporting period. These have been under-represented in historical observation.
Hypothetical
LossVaR 99%
$M $M
9 March 2009 12.0 9.1
30 January 2009 18.4 9.0
26 January 2009 15.1 8.7
15 January 2009 21.7 8.9
Hypothetical
LossVaR 99%
$M $M
14 November 2008 12.3 8.5
3 November 2008 14.2 9.3
6 October 2008 17.5 9.1
29 September 2008 10.9 5.7
18 September 2008 12.5 5.2
16 September 2008 9.5 5.8
5 September 2008 8.8 7.8
Hypothetical
LossVaR 99%
$M $M
12 June 2008 13.2 10.4
13 May 2008 6.6 4.6
17 April 2008 5.8 5.5
24 March 2008 5 4.2
18 March 2008 4.8 4.5
12 March 2008 7.9 4.2
Over the reporting period 1 January 2009 to 30 June 2009
Date
Date
Date
Over the reporting period 1 July 2008 to 31 December 2008
Over the reporting period 1 January 2008 to 30 June 2008
© Commonwealth Bank of Australia 2009 ABN 48 123 123 124
Page 65
Non-Traded Market Risk
Non-traded market risk activities are governed by the Group market risk framework approved by the Risk Committee. Implementation of the policy, procedures and limits for the Group is the responsibility of the Group Executive of the associated Business Unit with senior management oversight by the Group’s Asset and Liability Committee. Independent management of the non-traded market risk activities of offshore banking subsidiaries is delegated to the CEO of each entity with oversight by the local Asset and Liability Committee.
Interest Rate Risk in the Banking Book
Interest rate risk in the Group’s banking book (IRRBB) is the risk of adverse changes in expected net interest earnings in current and future years from changes in interest rates on mismatched assets and liabilities in the banking book. The objective is to manage interest rate risk to achieve stable and sustainable net interest earnings in the long term.
The Group measures and manages Banking Book interest rate risk in two ways:
(a) Next 12 months’ earnings
The risk to net interest earnings over the next 12 months from changes in interest rates is measured on a monthly basis. Risk is measured assuming an instantaneous 100 basis point parallel movement in interest rates across the yield curve. Potential variations in net interest earnings are measured using a simulation model that takes into account the projected change in Banking Book asset and liability levels and mix. Assets and liabilities with pricing directly based on market rates are repriced based on the full extent of the rate shock that is applied. Risk on the other assets and liabilities (those priced at the discretion of the Group) are measured by taking into account both the manner in which the products have repriced in the past as well as the expected change in price based on the current competitive market environment.
(b) Economic Value
A 20-day 97.5 % VaR measure is used to capture the economic impact of adverse changes in interest rates on all banking book assets and liabilities. This analysis measures the potential change in the net present value of cash flows of assets and liabilities. Cash flows for fixed rate products are included on a contractual basis, after adjustment for forecast prepayment activities. Cash flows for products repriced at the discretion of the Group are based on the expected repricing characteristics of those products.
Interest rate risk on banking book items is transferred from the originating Business Units to the Group Treasury function under a matched-funds-transfer pricing framework. Products having contractual maturities and direct market-linked rates are transferred using their actual repricing schedules. Products with indeterminate maturities or discretionary rates are transferred via replicating portfolios, which consist of revolving transactions at market rates designed to approximate the average cash flow and repricing behaviour of the underlying customer transactions. Modelling assumptions relating to the structure of replicating portfolios are regularly reviewed and adjusted as necessary.
The portion of total non-rate sensitive liabilities which funds rate-sensitive assets is assigned a repricing profile which is determined by ALCO and reviewed by the Risk Committee. The regulatory capital requirement for IRRBB is based, as
required by APRA, on the difference between measured economic value risk vs the measured value derived from a hypothetical balance sheet with an investment term of capital of one year.
Determining interest rate risk in the banking book
The interest rate risk associated with banking book items is measured by the Group’s internal measurement model:
1. Repricing risk and yield curve risk - which arise from repricing mismatches between assets and liabilities - are jointly determined from the distribution of changes in the economic value of the banking book as a consequence of interest rate changes (overall level of the yield curve and the shape of the yield curve). A historical simulation Value-at-Risk (VaR) approach is used, with IRRBB regulatory capital determined with respect to a one year holding period and a 99 % level of confidence. Interest rate scenarios are constructed over a historical observation period of six years.
2. Basis risk is measured as the risk of loss in earnings of the
banking book arising from differences between the actual and expected interest margins on banking book items. The IRRBB regulatory capital requirement for basis risk is measured under a dynamic simulation approach, as the change in net interest income over a twelve month forecast period in response to an adverse change to implied forward cash rates.
3. Optionality risk is measured as the risk of loss in
economic value owing to the existence of stand-alone or embedded options in the banking book, to the extent that such potential losses are not included in the measurement of repricing, yield curve or basis risks. Optionality risk arising from a departure from assumed prepayment behaviour is calculated from a stressed prepayment rate scenario by the VaR model. Optionality risk arising from the use of replicating portfolios for indeterminate maturity or discretionary rate items is measured by the VaR model under an applied mismatch between the underlying product balances and the unhedged term asset positions.
4. The embedded loss or gain in banking book items not
accounted for on a marked-to-market basis is measured and included in the regulatory capital for IRRBB. The embedded loss or gain measures the difference between the book value and economic value of banking book activities, based on transfer-priced assets and liabilities.
APRA has specifically requested Australian banks implementing the Basel II framework who are accredited for advanced approaches, to incorporate regulatory capital for interest rate risk in the banking book in their assessment of total capital from 1 July 2008.
Bankwest is excluded as it is reporting under the standardised approach, which does not require an IRRBB calculation for RWA. An initiative is underway to achieve advanced accreditation from APRA for the Bankwest business to use an internal model approach for assessing capital required for IRRBB.
The major proportion of the $9 billion growth in IRRBB RWA over the six months to 30 June 2009 (see APS 330 Table 14b) was attributable to more volatile fixed interest rates reducing
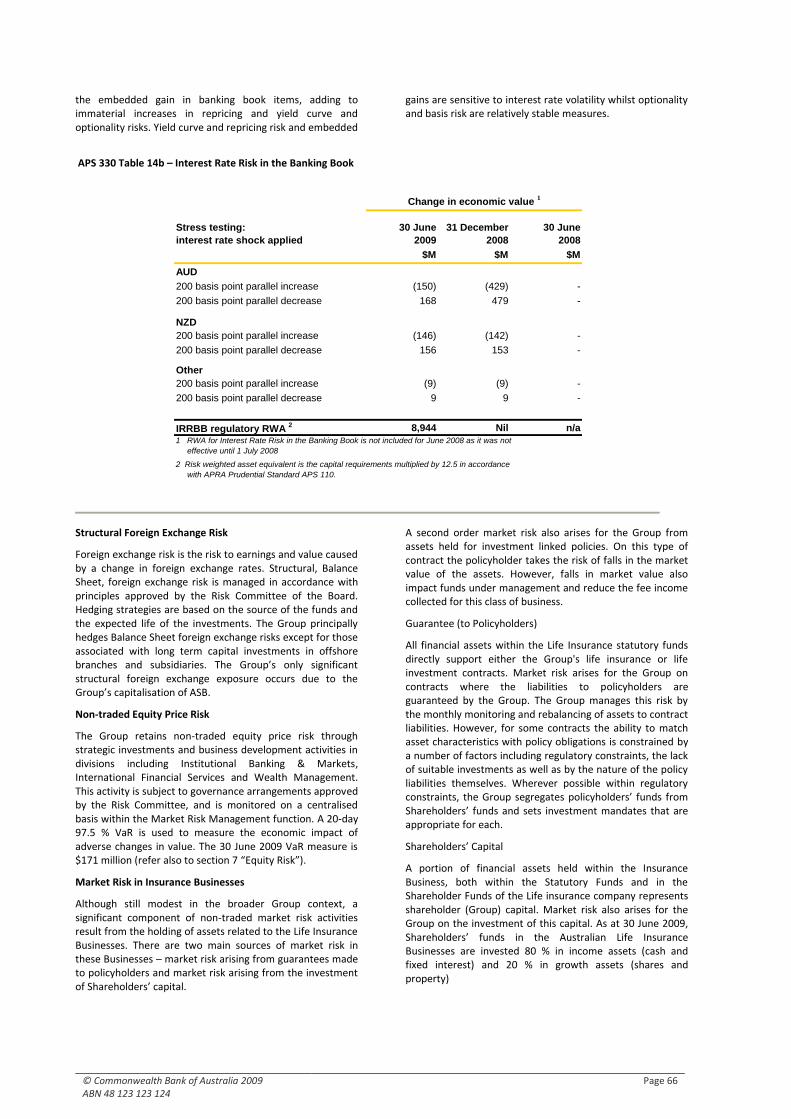
© Commonwealth Bank of Australia 2009 ABN 48 123 123 124
Page 66
the embedded gain in banking book items, adding to immaterial increases in repricing and yield curve and optionality risks. Yield curve and repricing risk and embedded
gains are sensitive to interest rate volatility whilst optionality and basis risk are relatively stable measures.
APS 330 Table 14b – Interest Rate Risk in the Banking Book
Structural Foreign Exchange Risk
Foreign exchange risk is the risk to earnings and value caused by a change in foreign exchange rates. Structural, Balance Sheet, foreign exchange risk is managed in accordance with principles approved by the Risk Committee of the Board. Hedging strategies are based on the source of the funds and the expected life of the investments. The Group principally hedges Balance Sheet foreign exchange risks except for those associated with long term capital investments in offshore branches and subsidiaries. The Group’s only significant structural foreign exchange exposure occurs due to the Group’s capitalisation of ASB.
Non-traded Equity Price Risk
The Group retains non-traded equity price risk through strategic investments and business development activities in divisions including Institutional Banking & Markets, International Financial Services and Wealth Management. This activity is subject to governance arrangements approved by the Risk Committee, and is monitored on a centralised basis within the Market Risk Management function. A 20-day 97.5 % VaR is used to measure the economic impact of adverse changes in value. The 30 June 2009 VaR measure is $171 million (refer also to section 7 “Equity Risk”).
Market Risk in Insurance Businesses
Although still modest in the broader Group context, a significant component of non-traded market risk activities result from the holding of assets related to the Life Insurance Businesses. There are two main sources of market risk in these Businesses – market risk arising from guarantees made to policyholders and market risk arising from the investment of Shareholders’ capital.
A second order market risk also arises for the Group from assets held for investment linked policies. On this type of contract the policyholder takes the risk of falls in the market value of the assets. However, falls in market value also impact funds under management and reduce the fee income collected for this class of business.
Guarantee (to Policyholders)
All financial assets within the Life Insurance statutory funds directly support either the Group's life insurance or life investment contracts. Market risk arises for the Group on contracts where the liabilities to policyholders are guaranteed by the Group. The Group manages this risk by the monthly monitoring and rebalancing of assets to contract liabilities. However, for some contracts the ability to match asset characteristics with policy obligations is constrained by a number of factors including regulatory constraints, the lack of suitable investments as well as by the nature of the policy liabilities themselves. Wherever possible within regulatory constraints, the Group segregates policyholders’ funds from Shareholders’ funds and sets investment mandates that are appropriate for each.
Shareholders’ Capital
A portion of financial assets held within the Insurance Business, both within the Statutory Funds and in the Shareholder Funds of the Life insurance company represents shareholder (Group) capital. Market risk also arises for the Group on the investment of this capital. As at 30 June 2009, Shareholders’ funds in the Australian Life Insurance Businesses are invested 80 % in income assets (cash and fixed interest) and 20 % in growth assets (shares and property)
Stress testing:
interest rate shock applied
30 June
2009
31 December
2008
30 June
2008
$M $M $M
AUD
200 basis point parallel increase (150) (429) -
200 basis point parallel decrease 168 479 -
NZD
200 basis point parallel increase (146) (142) -
200 basis point parallel decrease 156 153 -
- Other
200 basis point parallel increase (9) (9) -
200 basis point parallel decrease 9 9 -
IRRBB regulatory RWA 2 8,944 Nil n/a
2 Risk weighted asset equivalent is the capital requirements multiplied by 12.5 in accordance
with APRA Prudential Standard APS 110.
1 RWA for Interest Rate Risk in the Banking Book is not included for June 2008 as it was not
effective until 1 July 2008
Change in economic value 1
© Commonwealth Bank of Australia 2009 ABN 48 123 123 124
Page 67
Residual Value Risk
The Group takes residual value risk on assets such as industrial and mining equipment, rail, aircraft, marine technology, healthcare and other equipment. A residual value guarantee exposes the business to the movement in secondhand asset prices. The residual value risk within the Group is controlled through a risk management framework approved by the Risk Committee. The framework includes asset, geographic and maturity concentration limits and stress testing which is performed by the independent Market Risk Management function.
Liquidity and Funding Risk
Overview
Balance Sheet liquidity risk is the risk of being unable to meet financial obligations as they fall due. The Group manages liquidity requirements by currency and by geographical location of its operations. Subsidiaries are also included in the Group’s liquidity policy framework.
Funding risk is the risk of over-reliance on a funding source to the extent that a change in that funding source could increase overall funding costs or cause difficulty in raising funds. The funding requirements are integrated into the Group’s liquidity and funding policy with its aim to ensure the Group has a stable diversified funding base without over-reliance on any one market sector.
The Group’s liquidity and funding policies are designed to ensure it will meet its obligations as and when they fall due, by ensuring it is able to borrow funds on an unsecured basis, or has sufficient quality assets to borrow against on a secured basis, or has sufficient quality liquid assets to sell to raise immediate funds without adversely affecting the Group’s net asset value.
The Group’s funding policies and risk management framework complement the Group’s liquidity policies by ensuring an optimal liability structure to finance the Group’s businesses. The long term stability and security of the Group’s funding is also designed to protect its liquidity position in the event of a crisis specific to the Group.
The Group’s liquidity policies are designed to ensure it maintains sufficient cash balances and liquid asset holdings to meet its obligations to customers, in both ordinary market conditions and during periods of extreme stress. These policies are intended to protect the value of the Group’s operations during periods of unfavourable market conditions, such as have been experienced since August 2007.
The Group’s funding policies are designed to achieve diversified sources of funding by product, term, maturity date, investor type, investor location, jurisdiction, currency and concentration, on a cost-effective basis. This objective applies to the Group’s wholesale and retail funding activities. The Group’s retail funding base formed approximately 58 % of its total funding requirements as at 30 June 2009.
The Risk Management Framework for Liquidity and Funding
The Group’s liquidity and funding policies are approved by the Risk Committee and agreed with APRA. The Group has an Asset and Liability Committee whose charter includes reviewing the management of assets and liabilities, reviewing liquidity and funding policies and strategies, as well as regularly monitoring compliance with those policies across the Group. The Group Treasury division manages the Group’s liquidity and funding positions in accordance with the Group’s liquidity policy including monitoring and satisfying
the liquidity needs of the Group and its subsidiaries. The Group Treasury division manages Bankwest’s liquidity and funding positions.
Larger domestic subsidiaries, such as CBFC Limited and subsidiaries within the Colonial Group, are subject to Group oversight and also apply their own liquidity and funding methods to address their specific needs.
The Group’s New Zealand banking subsidiary, ASB Bank Limited (ASB), manages its own domestic liquidity and funding needs in accordance with its own liquidity policies and the policies of the Group. ASB’s liquidity policy is also overseen by the Reserve Bank of New Zealand.
The Group also has relatively small banking subsidiaries in Indonesia and Fiji that manage their liquidity and funding on a similar basis.
The Group’s Financial Services and Risk Management divisions provide prudential oversight of the Group’s liquidity and funding risk and manage the Group’s relationship with prudential regulators.
Liquidity and Funding Policies and Management
The Group’s liquidity and funding policies provide that:
Balance sheet assets that cannot be liquidated quickly are funded with deposits or term borrowings that meet minimum maturity requirements with appropriate liquidity buffers;
Short and long term wholesale funding limits are established and reviewed regularly based on surveys and analysis of market capacity;
Minimum levels of assets are retained in highly liquid form;
The level of liquid assets complies with crisis scenario assumptions related to “worst case” wholesale and retail market conditions; is adequate to meet known funding obligations over certain timeframes; and are allocated across Australian dollar and foreign currency denominated securities in accordance with specific calculations;
Certain levels of liquid assets are held to provide for the risk of the Group’s committed but un-drawn lending obligations being drawn by customers and retail deposit withdrawals, as calculated based on draw down estimates and forecasts; and
The Group maintains certain levels of liquid assets categories within its liquid assets portfolio. The first category includes negotiable certificates of deposit of Australian banks, bank bills, Commonwealth of Australia Government and Australian state and semi-government bonds and supra-national bonds eligible for repurchase by the Reserve Bank of Australia (RBA) at any time. The second category is AAA and A-1+ rated Australian residential mortgage backed securities that meet certain minimum requirements.
At 30 June 2009 around 100 % of the Group’s Australian dollar liquid assets qualified for repurchase by the RBA at any time.

© Commonwealth Bank of Australia 2009 ABN 48 123 123 124
Page 68
The Group’s key liquidity tools include:
A liquidity management model similar to a “cash flow ladder” or “maturity gap analysis”, that allows forecasting of liquidity needs on a daily basis;
An additional liquidity management model that implements the agreed prudential liquidity policies. This model is calibrated with a series of “worst case” liquidity crisis scenarios, incorporating both systemic and “name” crisis assumptions, such that the Group will have sufficient liquid assets available to ensure it meets all of its obligations as and when they fall due;
The RBA’s repurchase agreement facilities provide the Group with the ability to borrow funds on a secured basis, even when normal funding markets are unavailable;
The Group’s various short term funding programmes are supplemented by the Interbank Deposit Agreement between the four major Australian banks. This
agreement is similar to a standby liquidity facility that allows the Group to access funding in various crisis circumstances;
Its consumer, small business and institutional deposit base. Its consumer retail funding base includes a wide range of retail transaction accounts, investment accounts, term deposits and retirement style accounts for individual consumers; and
Its wholesale international and domestic funding programmes that include: Australian dollar Negotiable Certificates of Deposit programme; Transferable Certificate of Deposit programme; Australian dollar bank bill programme; Australian, U.S. and Euro Commercial Paper programmes; U.S. Extendible Notes programme; Australian dollar domestic borrowing programme; U.S. Medium Term Note Programme; Euro Medium Term Note Programme and its Medallion “Regulation AB” securitisation programme.
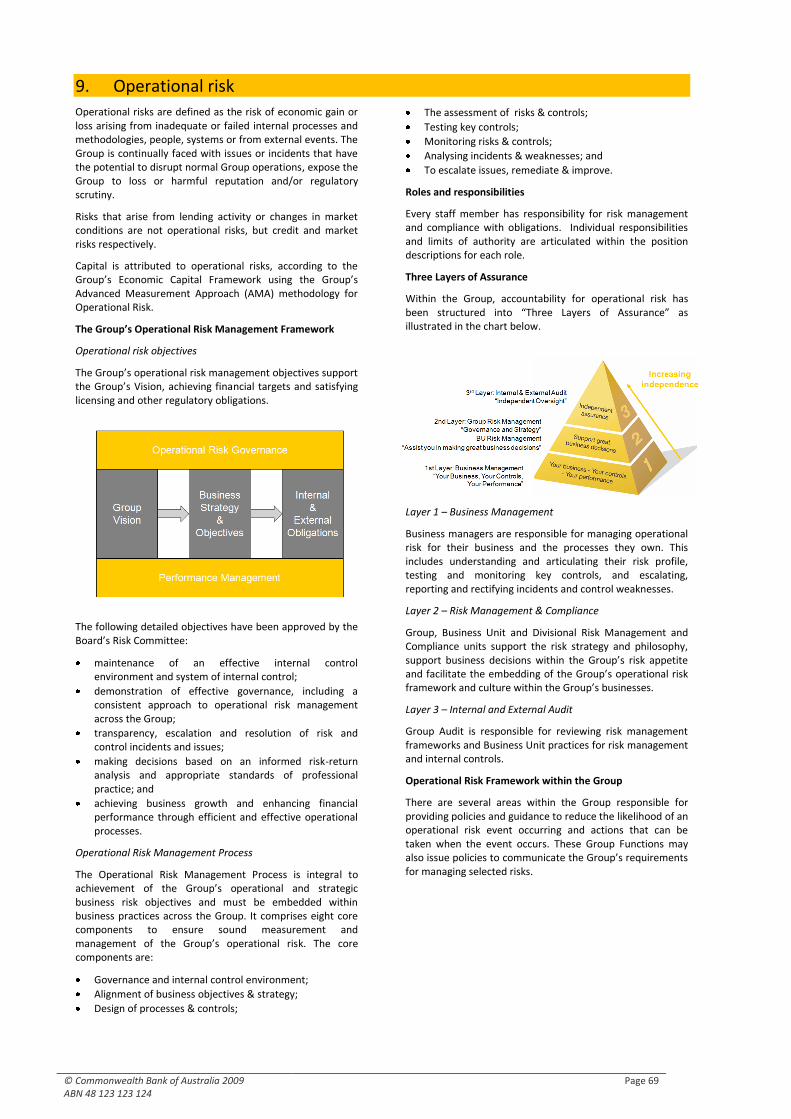
© Commonwealth Bank of Australia 2009 ABN 48 123 123 124
Page 69
9. Operational risk
Operational risks are defined as the risk of economic gain or loss arising from inadequate or failed internal processes and methodologies, people, systems or from external events. The Group is continually faced with issues or incidents that have the potential to disrupt normal Group operations, expose the Group to loss or harmful reputation and/or regulatory scrutiny.
Risks that arise from lending activity or changes in market conditions are not operational risks, but credit and market risks respectively.
Capital is attributed to operational risks, according to the Group’s Economic Capital Framework using the Group’s Advanced Measurement Approach (AMA) methodology for Operational Risk.
The Group’s Operational Risk Management Framework
Operational risk objectives
The Group’s operational risk management objectives support the Group’s Vision, achieving financial targets and satisfying licensing and other regulatory obligations.
The following detailed objectives have been approved by the Board’s Risk Committee:
maintenance of an effective internal control environment and system of internal control;
demonstration of effective governance, including a consistent approach to operational risk management across the Group;
transparency, escalation and resolution of risk and control incidents and issues;
making decisions based on an informed risk-return analysis and appropriate standards of professional practice; and
achieving business growth and enhancing financial performance through efficient and effective operational processes.
Operational Risk Management Process
The Operational Risk Management Process is integral to achievement of the Group’s operational and strategic business risk objectives and must be embedded within business practices across the Group. It comprises eight core components to ensure sound measurement and management of the Group’s operational risk. The core components are:
Governance and internal control environment;
Alignment of business objectives & strategy;
Design of processes & controls;
The assessment of risks & controls;
Testing key controls;
Monitoring risks & controls;
Analysing incidents & weaknesses; and
To escalate issues, remediate & improve.
Roles and responsibilities
Every staff member has responsibility for risk management and compliance with obligations. Individual responsibilities and limits of authority are articulated within the position descriptions for each role.
Three Layers of Assurance
Within the Group, accountability for operational risk has been structured into “Three Layers of Assurance” as illustrated in the chart below.
Layer 1 – Business Management
Business managers are responsible for managing operational risk for their business and the processes they own. This includes understanding and articulating their risk profile, testing and monitoring key controls, and escalating, reporting and rectifying incidents and control weaknesses.
Layer 2 – Risk Management & Compliance
Group, Business Unit and Divisional Risk Management and Compliance units support the risk strategy and philosophy, support business decisions within the Group’s risk appetite and facilitate the embedding of the Group’s operational risk framework and culture within the Group’s businesses.
Layer 3 – Internal and External Audit
Group Audit is responsible for reviewing risk management frameworks and Business Unit practices for risk management and internal controls.
Operational Risk Framework within the Group
There are several areas within the Group responsible for providing policies and guidance to reduce the likelihood of an operational risk event occurring and actions that can be taken when the event occurs. These Group Functions may also issue policies to communicate the Group’s requirements for managing selected risks.
© Commonwealth Bank of Australia 2009 ABN 48 123 123 124
Page 70
Responsibilities of Group Functions
The Group Functions collaborate to identify where there are commonalities in their own areas of accountabilities. They also centrally implement processes and act as information repositories so that information can be shared, rather than collected and recorded in multiple areas.
Strategic Business Risk
Strategic Business Risk is defined as the risk of economic gain or loss resulting from changes in the business environment caused by the following factors:
Economic;
Competitor;
Social trends; or
Regulatory.
Strategic business risk is taken into account when defining business strategy and objectives. The Board receives reports on business plans, major projects and change initiatives (including the Group’s current relocation program and the core system modernisation project). The risk committee monitors progress and reviews successes compared to plans.
Economic capital for strategic business risk is also attributed to all Business Units. The strategic business risk model looks at the revenue volatility associated with the profit margin vs the fixed cost of the Group. This allocation is made based on Business Unit’s contribution to the total potential loss distribution given the Group’s underlying profit volatility.
Compliance Risk Management
Compliance risk is the risk of legal or regulatory sanctions, material financial loss, or loss of reputation that the Group may suffer as a result of its failure to comply with the requirements of relevant laws, regulatory bodies, industry standards and codes.
The Group’s Compliance Risk Management Framework (CRMF) is a key element of the Group’s integrated risk management framework. The CRMF is consistent with the Australian Standard on Compliance Programs; as such it is designed to meet the Group’s obligations under the Corporations Act 2001 and the Group’s Australian Financial Services Licence. The CRMF incorporates a number of components including Group Standards, a Compliance Obligations Register and Guidance Notes that detail specific requirements and accountabilities. These are complemented by Business Unit compliance frameworks including obligations registers, standards and procedures.
The CRMF provides for the assessment of compliance risks, implementation of controls, monitoring and testing of framework effectiveness and the escalation, remediation and reporting of compliance incidents and control weaknesses.
The Group's compliance strategy is based on two fundamental principles:
Line Management in each Business Unit have the responsibility to ensure their business is and remains compliant with legislative, regulatory, industry code and organisational requirements; and
Group and Business Unit Regulatory Risk and Compliance teams work together to monitor, overview and report on compliance to management, compliance committees and the Board.
Risk Mitigation through Insurance
The Group transfers selected unexpected insurable operational risk losses to the insurance market. The Group’s insurance program is structured based upon the Group’s risk appetite and risk retention strategies.
In the design of the insurance program the adequacy and appropriateness of cover are subject to continuous review. The quality and scope of cover are reviewed with the Group’s operational risk profile. Information such as the Group’s loss data, quantitative risk analyses, external loss data, loss modelling, external benchmarking, external valuations and the cost of cover are factors in the program design and structure.
The Group appoints an external advisor to provide insurance and insurance risk management advice and deliver the optimal insurance program.
The insurance program is subject to review by the Risk Committee and the Executive Committee.
Capital Measurement Approach
The Group follows a mathematically determined loss distribution approach to measure operational risk. This involves separate modelling of the frequency and severity of risks at a component level and then aggregating the simulated losses from these components into loss distributions for the Group and for its parts.
The Group’s modelling approach is granular – all twenty ‘Level 2’ event types defined in Basel II are considered for each business. Each intersection of a business and a Level 2 event type is referred to as the Business / Risk Type (or BuRT). The approach has a two-fold benefit:
(i) To model risk and the tail event potential accurately; and (ii) To align to the organisation dimension where the
business owns and manages their risk.
To continue this and capture the best business judgments in the scenario analysis process, the Group allows businesses to assess their key risks (within a particular Level 2 event type) at the exposure level with separate frequency and severity judgements.
These exposure level judgements are simulated to provide an annual loss distribution for the exposure that is ‘played back’ to the business subject matter experts to ensure their judgements have been captured appropriately.
These exposure annual loss distributions are aggregated to the BuRT level, resulting in an annual loss distribution for the risk type within the respective Business Unit. However, separate frequency and severity distributions are required at the BuRT levels to:
Combine with other information sources (e.g. Internal Loss data); and
Incorporate frequency dependence modelling.
The BuRT level frequency and severity distributions are aggregated using Monte Carlo simulation to produce capital results for the Group and its businesses.
The Group has developed an operational risk modelling system called “OpRA” to perform the measurement cycle function. OpRA has been subject to independent review by external audit firms KPMG and Ernst & Young as part of the Group’s obligations under APRA's AMA accreditation process.
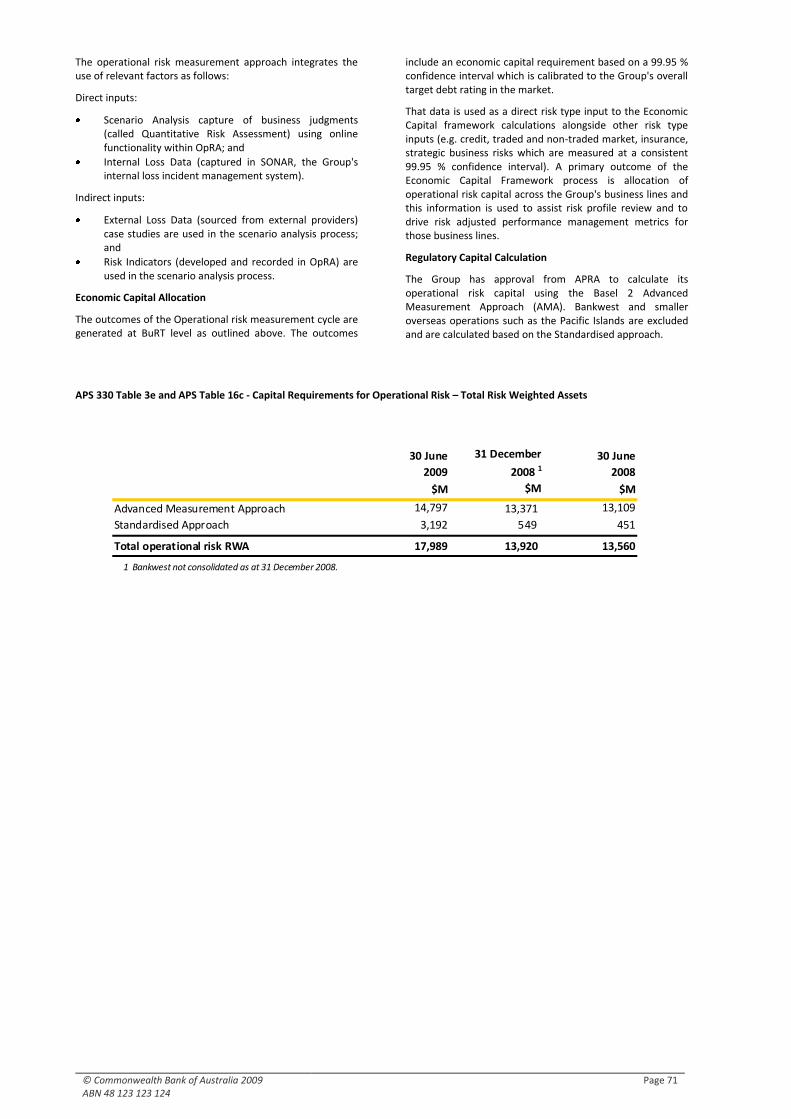
© Commonwealth Bank of Australia 2009 ABN 48 123 123 124
Page 71
The operational risk measurement approach integrates the use of relevant factors as follows:
Direct inputs:
Scenario Analysis capture of business judgments (called Quantitative Risk Assessment) using online functionality within OpRA; and
Internal Loss Data (captured in SONAR, the Group's internal loss incident management system).
Indirect inputs:
External Loss Data (sourced from external providers) case studies are used in the scenario analysis process; and
Risk Indicators (developed and recorded in OpRA) are used in the scenario analysis process.
Economic Capital Allocation
The outcomes of the Operational risk measurement cycle are generated at BuRT level as outlined above. The outcomes
include an economic capital requirement based on a 99.95 % confidence interval which is calibrated to the Group's overall target debt rating in the market.
That data is used as a direct risk type input to the Economic Capital framework calculations alongside other risk type inputs (e.g. credit, traded and non-traded market, insurance, strategic business risks which are measured at a consistent 99.95 % confidence interval). A primary outcome of the Economic Capital Framework process is allocation of operational risk capital across the Group's business lines and this information is used to assist risk profile review and to drive risk adjusted performance management metrics for those business lines.
Regulatory Capital Calculation
The Group has approval from APRA to calculate its operational risk capital using the Basel 2 Advanced Measurement Approach (AMA). Bankwest and smaller overseas operations such as the Pacific Islands are excluded and are calculated based on the Standardised approach.
APS 330 Table 3e and APS Table 16c - Capital Requirements for Operational Risk – Total Risk Weighted Assets
30 June
2009
31 December
2008 130 June
2008
$M $M $M
Advanced Measurement Approach 14,797 13,371 13,109
Standardised Approach 3,192 549 451
Total operational risk RWA 17,989 13,920 13,560
1 Bankwest not consolidated as at 31 December 2008.
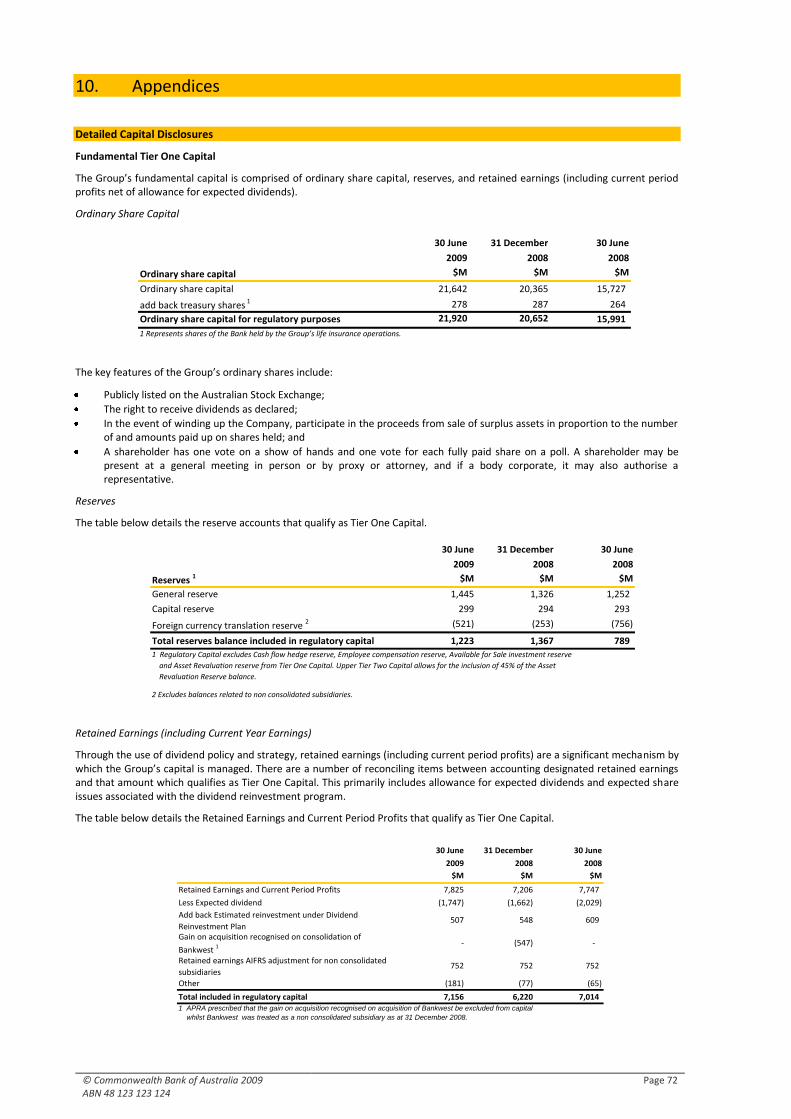
© Commonwealth Bank of Australia 2009 ABN 48 123 123 124
Page 72
10. Appendices
Detailed Capital Disclosures
Fundamental Tier One Capital
The Group’s fundamental capital is comprised of ordinary share capital, reserves, and retained earnings (including current period profits net of allowance for expected dividends).
Ordinary Share Capital
The key features of the Group’s ordinary shares include:
Publicly listed on the Australian Stock Exchange;
The right to receive dividends as declared;
In the event of winding up the Company, participate in the proceeds from sale of surplus assets in proportion to the number of and amounts paid up on shares held; and
A shareholder has one vote on a show of hands and one vote for each fully paid share on a poll. A shareholder may be present at a general meeting in person or by proxy or attorney, and if a body corporate, it may also authorise a representative.
Reserves
The table below details the reserve accounts that qualify as Tier One Capital.
Retained Earnings (including Current Year Earnings)
Through the use of dividend policy and strategy, retained earnings (including current period profits) are a significant mechanism by which the Group’s capital is managed. There are a number of reconciling items between accounting designated retained earnings and that amount which qualifies as Tier One Capital. This primarily includes allowance for expected dividends and expected share issues associated with the dividend reinvestment program.
The table below details the Retained Earnings and Current Period Profits that qualify as Tier One Capital.
30 June 31 December 30 June
2009 2008 2008
$M $M $M
Ordinary share capital 21,642 20,365 15,727
add back treasury shares 1 278 287 264
Ordinary share capital for regulatory purposes 21,920 20,652 15,991
1 Represents shares of the Bank held by the Group’s life insurance operations.
Ordinary share capital
30 June 31 December 30 June
2009 2008 2008
$M $M $M
General reserve 1,445 1,326 1,252
Capital reserve 299 294 293
Foreign currency translation reserve 2 (521) (253) (756)
Total reserves balance included in regulatory capital 1,223 1,367 789
2 Excludes balances related to non consolidated subsidiaries.
1 Regulatory Capital excludes Cash flow hedge reserve, Employee compensation reserve, Available for Sale investment reserve
and Asset Revaluation reserve from Tier One Capital. Upper Tier Two Capital allows for the inclusion of 45% of the Asset
Revaluation Reserve balance.
Reserves 1
30 June 31 December 30 June
2009 2008 2008
$M $M $M
Retained Earnings and Current Period Profits 7,825 7,206 7,747
Less Expected dividend (1,747) (1,662) (2,029)
Add back Estimated reinvestment under Dividend
Reinvestment Plan 507 548 609
Gain on acquisition recognised on consolidation of
Bankwest 1 - (547) -
Retained earnings AIFRS adjustment for non consolidated
subsidiaries 752 752 752
Other (181) (77) (65)
Total included in regulatory capital 7,156 6,220 7,014 1 APRA prescribed that the gain on acquisition recognised on acquisition of Bankwest be excluded from capital
whilst Bankwest was treated as a non consolidated subsidiary as at 31 December 2008.
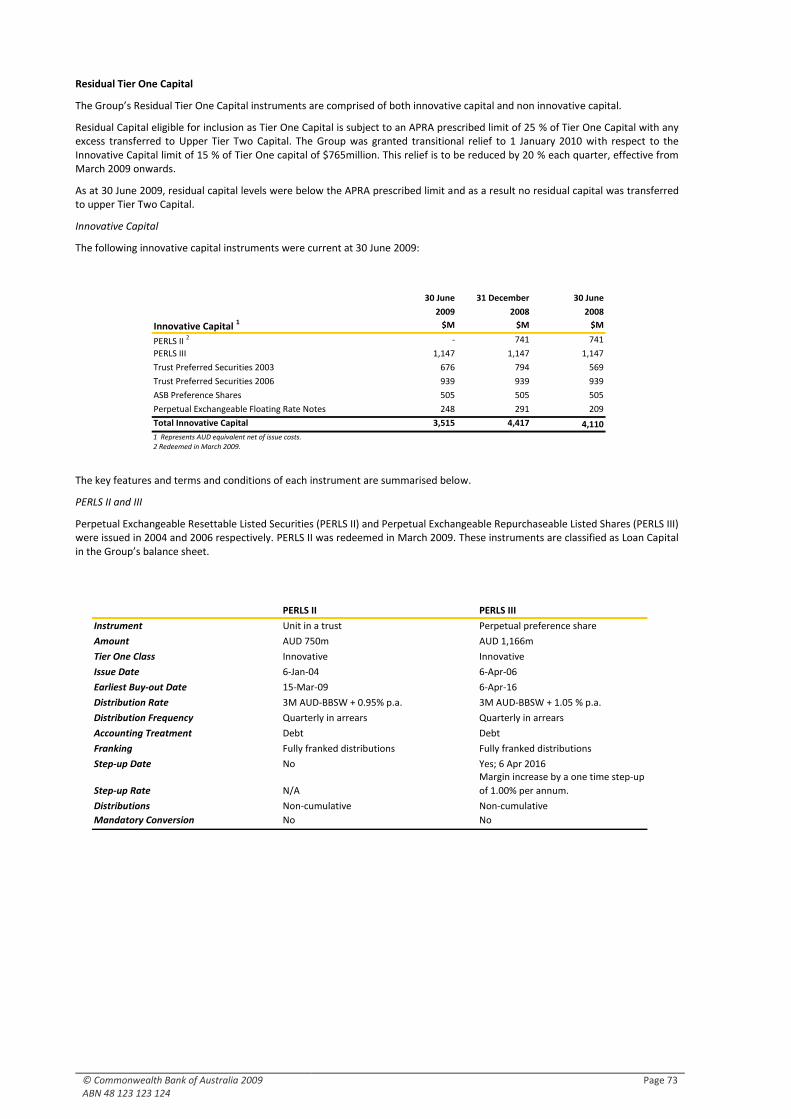
© Commonwealth Bank of Australia 2009 ABN 48 123 123 124
Page 73
Residual Tier One Capital
The Group’s Residual Tier One Capital instruments are comprised of both innovative capital and non innovative capital.
Residual Capital eligible for inclusion as Tier One Capital is subject to an APRA prescribed limit of 25 % of Tier One Capital with any excess transferred to Upper Tier Two Capital. The Group was granted transitional relief to 1 January 2010 with respect to the Innovative Capital limit of 15 % of Tier One capital of $765million. This relief is to be reduced by 20 % each quarter, effective from March 2009 onwards.
As at 30 June 2009, residual capital levels were below the APRA prescribed limit and as a result no residual capital was transferred to upper Tier Two Capital.
Innovative Capital
The following innovative capital instruments were current at 30 June 2009:
The key features and terms and conditions of each instrument are summarised below.
PERLS II and III
Perpetual Exchangeable Resettable Listed Securities (PERLS II) and Perpetual Exchangeable Repurchaseable Listed Shares (PERLS III) were issued in 2004 and 2006 respectively. PERLS II was redeemed in March 2009. These instruments are classified as Loan Capital in the Group’s balance sheet.
30 June 31 December 30 June
2009 2008 2008
$M $M $M
PERLS II 2 - 741 741
PERLS III 1,147 1,147 1,147
Trust Preferred Securities 2003 676 794 569
Trust Preferred Securities 2006 939 939 939
ASB Preference Shares 505 505 505
Perpetual Exchangeable Floating Rate Notes 248 291 209
Total Innovative Capital 3,515 4,417 4,110
2 Redeemed in March 2009.
Innovative Capital 1
1 Represents AUD equivalent net of issue costs.
PERLS II PERLS III
Instrument Unit in a trust Perpetual preference share
Amount AUD 750m AUD 1,166m
Tier One Class Innovative Innovative
Issue Date 6-Jan-04 6-Apr-06
Earliest Buy-out Date 15-Mar-09 6-Apr-16
Distribution Rate 3M AUD-BBSW + 0.95% p.a. 3M AUD-BBSW + 1.05 % p.a.
Distribution Frequency Quarterly in arrears Quarterly in arrears
Accounting Treatment Debt Debt
Franking Fully franked distributions Fully franked distributions
Step-up Date No Yes; 6 Apr 2016
Step-up Rate N/A
Margin increase by a one time step-up
of 1.00% per annum.
Distributions Non-cumulative Non-cumulative
Mandatory Conversion No No
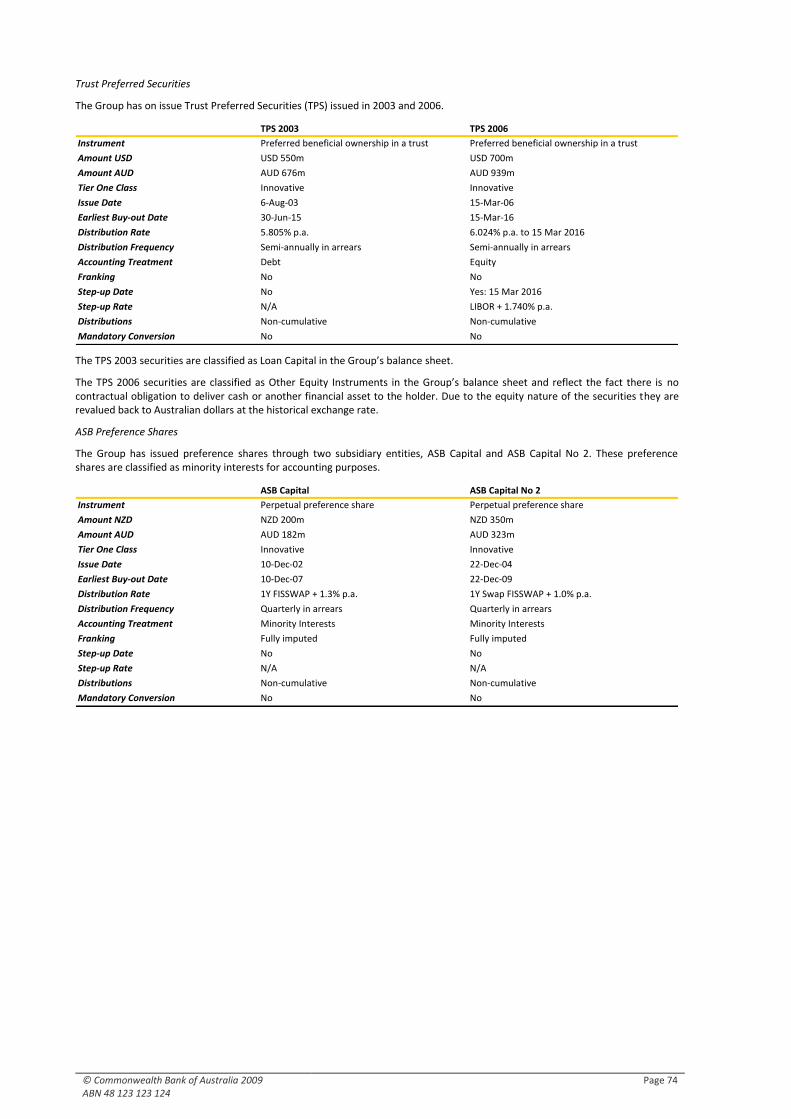
© Commonwealth Bank of Australia 2009 ABN 48 123 123 124
Page 74
Trust Preferred Securities
The Group has on issue Trust Preferred Securities (TPS) issued in 2003 and 2006.
TPS 2003 TPS 2006
Instrument Preferred beneficial ownership in a trust Preferred beneficial ownership in a trust
Amount USD USD 550m USD 700m
Amount AUD AUD 676m AUD 939m
Tier One Class Innovative Innovative
Issue Date 6-Aug-03 15-Mar-06
Earliest Buy-out Date 30-Jun-15 15-Mar-16
Distribution Rate 5.805% p.a. 6.024% p.a. to 15 Mar 2016
Distribution Frequency Semi-annually in arrears Semi-annually in arrears
Accounting Treatment Debt Equity
Franking No No
Step-up Date No Yes: 15 Mar 2016
Step-up Rate N/A LIBOR + 1.740% p.a.
Distributions Non-cumulative Non-cumulative
Mandatory Conversion No No
The TPS 2003 securities are classified as Loan Capital in the Group’s balance sheet.
The TPS 2006 securities are classified as Other Equity Instruments in the Group’s balance sheet and reflect the fact there is no contractual obligation to deliver cash or another financial asset to the holder. Due to the equity nature of the securities they are revalued back to Australian dollars at the historical exchange rate.
ASB Preference Shares
The Group has issued preference shares through two subsidiary entities, ASB Capital and ASB Capital No 2. These preference shares are classified as minority interests for accounting purposes.
ASB Capital ASB Capital No 2
Instrument Perpetual preference share Perpetual preference share
Amount NZD NZD 200m NZD 350m
Amount AUD AUD 182m AUD 323m
Tier One Class Innovative Innovative
Issue Date 10-Dec-02 22-Dec-04
Earliest Buy-out Date 10-Dec-07 22-Dec-09
Distribution Rate 1Y FISSWAP + 1.3% p.a. 1Y Swap FISSWAP + 1.0% p.a.
Distribution Frequency Quarterly in arrears Quarterly in arrears
Accounting Treatment Minority Interests Minority Interests
Franking Fully imputed Fully imputed
Step-up Date No No
Step-up Rate N/A N/A
Distributions Non-cumulative Non-cumulative
Mandatory Conversion No No
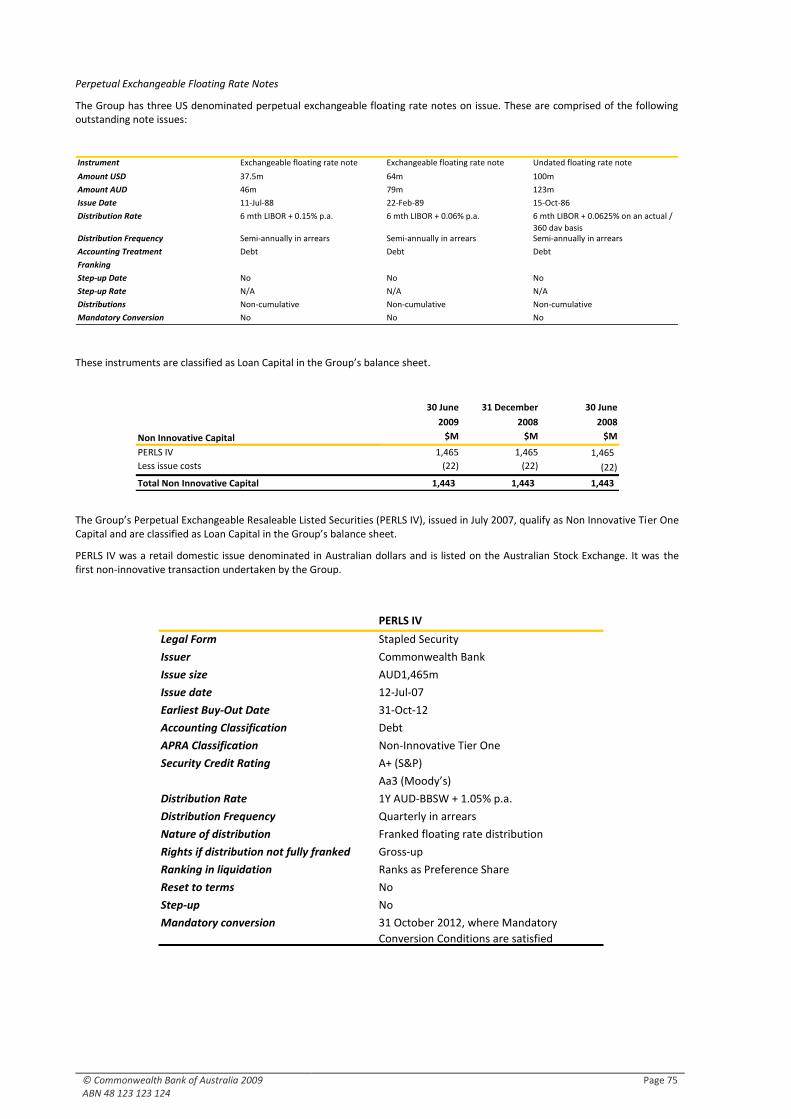
© Commonwealth Bank of Australia 2009 ABN 48 123 123 124
Page 75
Perpetual Exchangeable Floating Rate Notes
The Group has three US denominated perpetual exchangeable floating rate notes on issue. These are comprised of the following outstanding note issues:
Instrument Exchangeable floating rate note Exchangeable floating rate note Undated floating rate note
Amount USD 37.5m 64m 100m
Amount AUD 46m 79m 123m
Issue Date 11-Jul-88 22-Feb-89 15-Oct-86
Distribution Rate 6 mth LIBOR + 0.15% p.a. 6 mth LIBOR + 0.06% p.a. 6 mth LIBOR + 0.0625% on an actual /
360 day basisDistribution Frequency Semi-annually in arrears Semi-annually in arrears Semi-annually in arrears
Accounting Treatment Debt Debt Debt
Franking
Step-up Date No No No
Step-up Rate N/A N/A N/A
Distributions Non-cumulative Non-cumulative Non-cumulative
Mandatory Conversion No No No
These instruments are classified as Loan Capital in the Group’s balance sheet.
The Group’s Perpetual Exchangeable Resaleable Listed Securities (PERLS IV), issued in July 2007, qualify as Non Innovative Tier One Capital and are classified as Loan Capital in the Group’s balance sheet.
PERLS IV was a retail domestic issue denominated in Australian dollars and is listed on the Australian Stock Exchange. It was the first non-innovative transaction undertaken by the Group.
30 June 31 December 30 June
2009 2008 2008
$M $M $M
PERLS IV 1,465 1,465 1,465
Less issue costs (22) (22) (22)
Total Non Innovative Capital 1,443 1,443 1,443
Non Innovative Capital
PERLS IV
Legal Form Stapled Security
Issuer Commonwealth Bank
Issue size AUD1,465m
Issue date 12-Jul-07
Earliest Buy-Out Date 31-Oct-12
Accounting Classification Debt
APRA Classification Non-Innovative Tier One
A+ (S&P)
Aa3 (Moody’s)
Distribution Rate 1Y AUD-BBSW + 1.05% p.a.
Distribution Frequency Quarterly in arrears
Nature of distribution Franked floating rate distribution
Rights if distribution not fully franked Gross-up
Ranking in liquidation Ranks as Preference Share
Reset to terms No
Step-up No
Mandatory conversion 31 October 2012, where Mandatory
Conversion Conditions are satisfied
Security Credit Rating
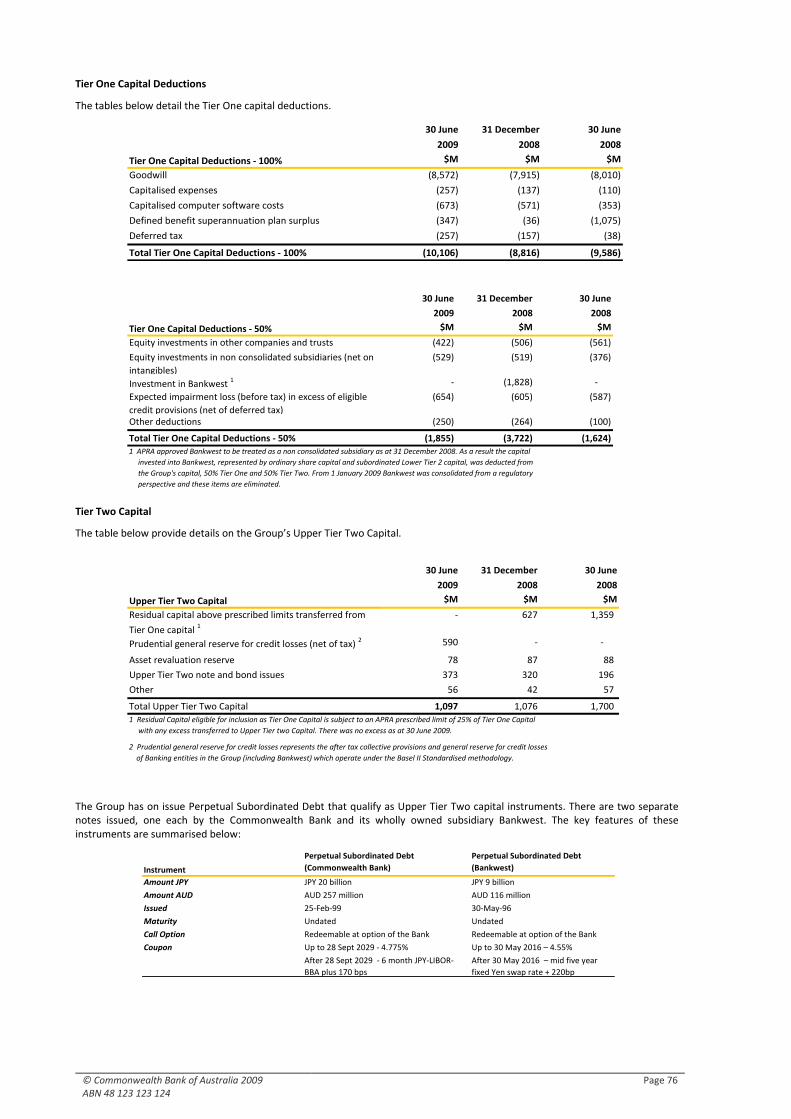
© Commonwealth Bank of Australia 2009 ABN 48 123 123 124
Page 76
Tier One Capital Deductions
The tables below detail the Tier One capital deductions.
Tier Two Capital
The table below provide details on the Group’s Upper Tier Two Capital.
The Group has on issue Perpetual Subordinated Debt that qualify as Upper Tier Two capital instruments. There are two separate notes issued, one each by the Commonwealth Bank and its wholly owned subsidiary Bankwest. The key features of these instruments are summarised below:
30 June 31 December 30 June
2009 2008 2008
$M $M $M
Goodwill (8,572) (7,915) (8,010)
Capitalised expenses (257) (137) (110)
Capitalised computer software costs (673) (571) (353)
Defined benefit superannuation plan surplus (347) (36) (1,075)
Deferred tax (257) (157) (38)
Total Tier One Capital Deductions - 100% (10,106) (8,816) (9,586)
Tier One Capital Deductions - 100%
Perpetual Subordinated Debt Perpetual Subordinated Debt
(Commonwealth Bank) (Bankwest)
Amount JPY JPY 20 billion JPY 9 billion
Amount AUD AUD 257 million AUD 116 million
Issued 25-Feb-99 30-May-96
Maturity Undated Undated
Call Option Redeemable at option of the Bank Redeemable at option of the Bank
Up to 28 Sept 2029 - 4.775% Up to 30 May 2016 – 4.55%
After 28 Sept 2029 - 6 month JPY-LIBOR-
BBA plus 170 bps
After 30 May 2016 – mid five year
fixed Yen swap rate + 220bp
Instrument
Coupon
30 June 31 December 30 June
2009 2008 2008
$M $M $M
Residual capital above prescribed limits transferred from
Tier One capital 1 - 627 1,359
Prudential general reserve for credit losses (net of tax) 2 590 - -
Asset revaluation reserve 78 87 88
Upper Tier Two note and bond issues 373 320 196
Other 56 42 57
Total Upper Tier Two Capital 1,097 1,076 1,700
Upper Tier Two Capital
1 Residual Capital eligible for inclusion as Tier One Capital is subject to an APRA prescribed limit of 25% of Tier One Capital
with any excess transferred to Upper Tier two Capital. There was no excess as at 30 June 2009.
2 Prudential general reserve for credit losses represents the after tax collective provisions and general reserve for credit losses
of Banking entities in the Group (including Bankwest) which operate under the Basel II Standardised methodology.
30 June 31 December 30 June
2009 2008 2008
$M $M $M
Equity investments in other companies and trusts (422) (506) (561)
Equity investments in non consolidated subsidiaries (net on
intangibles)
(529) (519) (376)
Investment in Bankwest 1 - (1,828) -
Expected impairment loss (before tax) in excess of eligible
credit provisions (net of deferred tax)
(654) (605) (587)
Other deductions (250) (264) (100)
Total Tier One Capital Deductions - 50% (1,855) (3,722) (1,624) 1 APRA approved Bankwest to be treated as a non consolidated subsidiary as at 31 December 2008. As a result the capital
invested into Bankwest, represented by ordinary share capital and subordinated Lower Tier 2 capital, was deducted from
the Group's capital, 50% Tier One and 50% Tier Two. From 1 January 2009 Bankwest was consolidated from a regulatory
perspective and these items are eliminated.
Tier One Capital Deductions - 50%
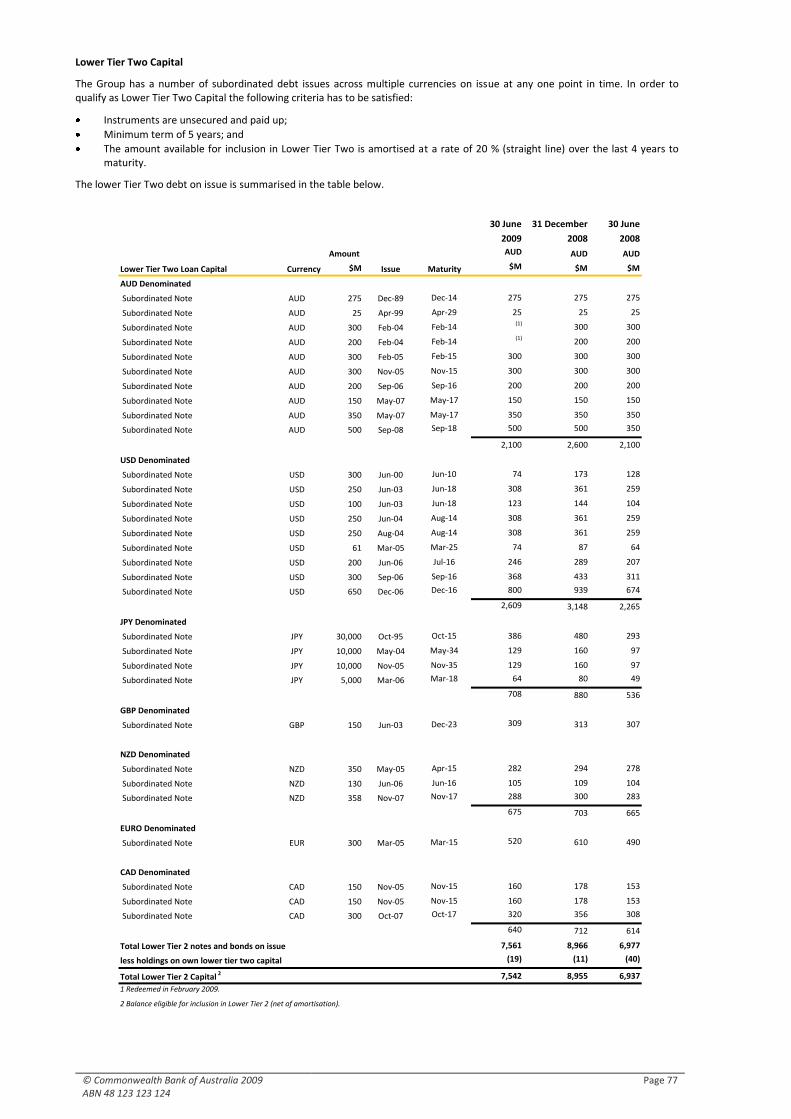
© Commonwealth Bank of Australia 2009 ABN 48 123 123 124
Page 77
Lower Tier Two Capital
The Group has a number of subordinated debt issues across multiple currencies on issue at any one point in time. In order to qualify as Lower Tier Two Capital the following criteria has to be satisfied:
Instruments are unsecured and paid up;
Minimum term of 5 years; and
The amount available for inclusion in Lower Tier Two is amortised at a rate of 20 % (straight line) over the last 4 years to maturity.
The lower Tier Two debt on issue is summarised in the table below.
30 June 31 December 30 June
2009 2008 2008
Amount AUD AUD AUD
$M $M $M $M
AUD 275 Dec-89 Dec-14 275 275 275
AUD 25 Apr-99 Apr-29 25 25 25
AUD 300 Feb-04 Feb-14 (1) 300 300
AUD 200 Feb-04 Feb-14 (1) 200 200
AUD 300 Feb-05 Feb-15 300 300 300
AUD 300 Nov-05 Nov-15 300 300 300
AUD 200 Sep-06 Sep-16 200 200 200
AUD 150 May-07 May-17 150 150 150
AUD 350 May-07 May-17 350 350 350
AUD 500 Sep-08 Sep-18 500 500 350
2,100 2,600 2,100
USD 300 Jun-00 Jun-10 74 173 128
USD 250 Jun-03 Jun-18 308 361 259
USD 100 Jun-03 Jun-18 123 144 104
USD 250 Jun-04 Aug-14 308 361 259
USD 250 Aug-04 Aug-14 308 361 259
USD 61 Mar-05 Mar-25 74 87 64
USD 200 Jun-06 Jul-16 246 289 207
USD 300 Sep-06 Sep-16 368 433 311
USD 650 Dec-06 Dec-16 800 939 674
2,609 3,148 2,265
JPY 30,000 Oct-95 Oct-15 386 480 293
JPY 10,000 May-04 May-34 129 160 97
JPY 10,000 Nov-05 Nov-35 129 160 97
JPY 5,000 Mar-06 Mar-18 64 80 49
708 880 536
GBP 150 Jun-03 Dec-23 309 313 307
NZD 350 May-05 Apr-15 282 294 278
NZD 130 Jun-06 Jun-16 105 109 104
NZD 358 Nov-07 Nov-17 288 300 283
675 703 665
EUR 300 Mar-05 Mar-15 520 610 490
CAD 150 Nov-05 Nov-15 160 178 153
CAD 150 Nov-05 Nov-15 160 178 153
CAD 300 Oct-07 Oct-17 320 356 308
640 712 614
7,561 8,966 6,977
(19) (11) (40)
Total Lower Tier 2 Capital 2 7,542 8,955 6,937
EURO Denominated
less holdings on own lower tier two capital
Total Lower Tier 2 notes and bonds on issue
Subordinated Note
CAD Denominated
Subordinated Note
Subordinated Note
GBP Denominated
Subordinated Note
Subordinated Note
NZD Denominated
Subordinated Note
Subordinated Note
Subordinated Note
JPY Denominated
Subordinated Note
Subordinated Note
Subordinated Note
Subordinated Note
Subordinated Note
Subordinated Note
Subordinated Note
Subordinated Note
Subordinated Note
Subordinated Note
Subordinated Note
USD Denominated
Subordinated Note
Subordinated Note
Subordinated Note
Subordinated Note
Subordinated Note
Subordinated Note
Subordinated Note
Subordinated Note
Subordinated Note
1 Redeemed in February 2009.
2 Balance eligible for inclusion in Lower Tier 2 (net of amortisation).
Currency Issue Maturity
AUD Denominated
Subordinated Note
Lower Tier Two Loan Capital
Subordinated Note
Subordinated Note
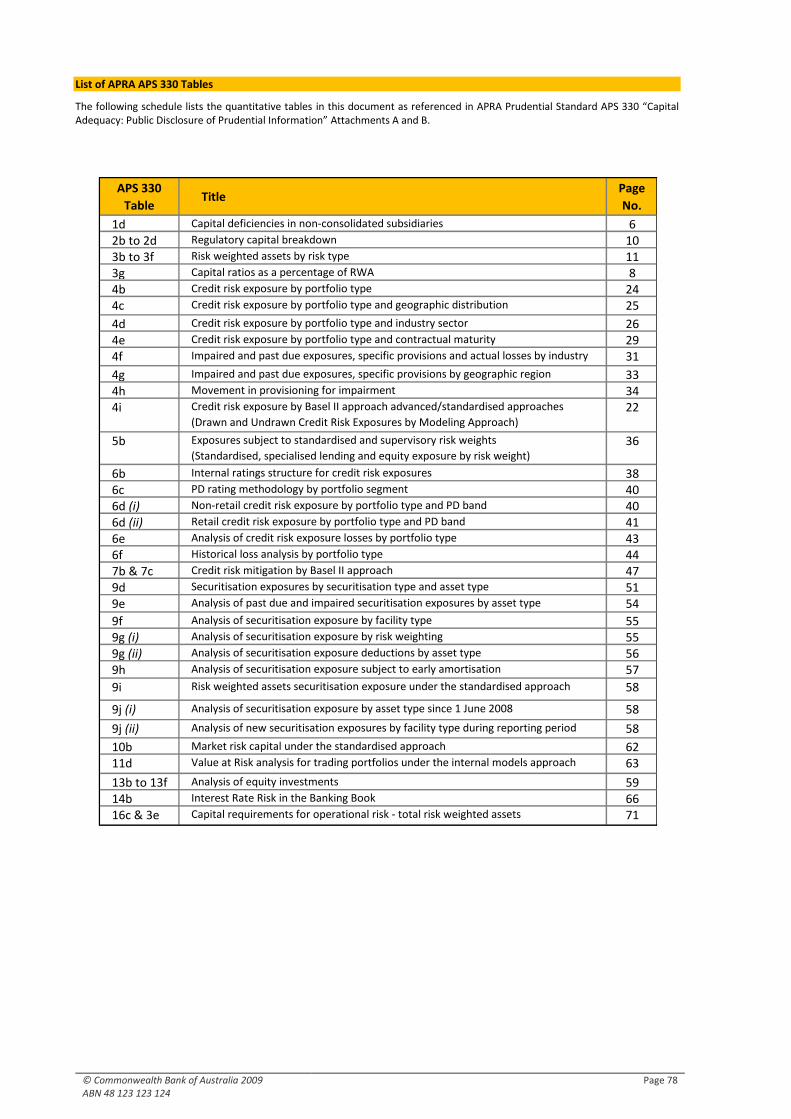
© Commonwealth Bank of Australia 2009 ABN 48 123 123 124
Page 78
List of APRA APS 330 Tables
The following schedule lists the quantitative tables in this document as referenced in APRA Prudential Standard APS 330 “Capital Adequacy: Public Disclosure of Prudential Information” Attachments A and B.
APS 330
TableTitle
Page
No.
1d Capital deficiencies in non-consolidated subsidiaries 62b to 2d Regulatory capital breakdown 103b to 3f Risk weighted assets by risk type 113g Capital ratios as a percentage of RWA 84b Credit risk exposure by portfolio type 244c Credit risk exposure by portfolio type and geographic distribution 25
4d Credit risk exposure by portfolio type and industry sector 264e Credit risk exposure by portfolio type and contractual maturity 294f Impaired and past due exposures, specific provisions and actual losses by industry
sector31
4g Impaired and past due exposures, specific provisions by geographic region 334h Movement in provisioning for impairment 344i Credit risk exposure by Basel II approach advanced/standardised approaches
(Drawn and Undrawn Credit Risk Exposures by Modeling Approach)22
5b Exposures subject to standardised and supervisory risk weights
(Standardised, specialised lending and equity exposure by risk weight)36
6b Internal ratings structure for credit risk exposures 386c PD rating methodology by portfolio segment 406d (i) Non-retail credit risk exposure by portfolio type and PD band 406d (ii) Retail credit risk exposure by portfolio type and PD band 416e Analysis of credit risk exposure losses by portfolio type 436f Historical loss analysis by portfolio type 447b & 7c Credit risk mitigation by Basel II approach 479d Securitisation exposures by securitisation type and asset type 519e Analysis of past due and impaired securitisation exposures by asset type 54
9f Analysis of securitisation exposure by facility type 559g (i) Analysis of securitisation exposure by risk weighting 559g (ii) Analysis of securitisation exposure deductions by asset type 569h Analysis of securitisation exposure subject to early amortisation 57
9i Risk weighted assets securitisation exposure under the standardised approach 58
9j (i) Analysis of securitisation exposure by asset type since 1 June 2008 58
9j (ii) Analysis of new securitisation exposures by facility type during reporting period 58
10b Market risk capital under the standardised approach 6211d Value at Risk analysis for trading portfolios under the internal models approach 63
13b to 13f Analysis of equity investments 5914b Interest Rate Risk in the Banking Book 6616c & 3e Capital requirements for operational risk - total risk weighted assets 71
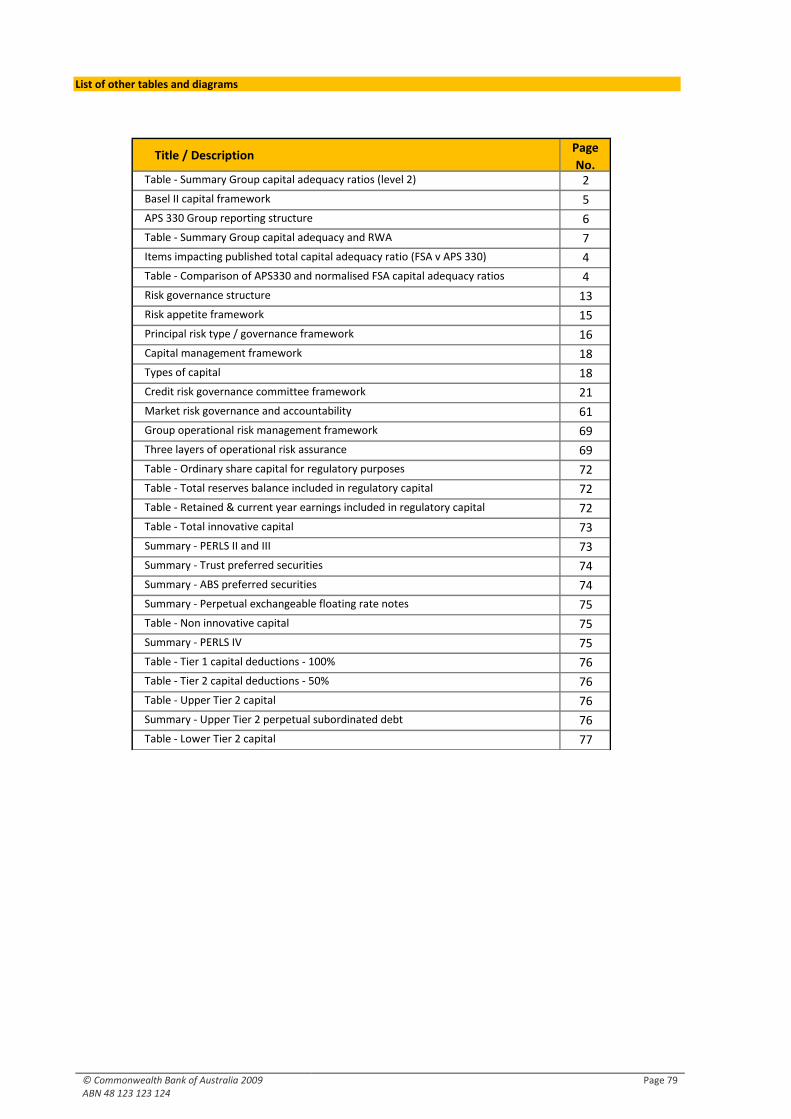
© Commonwealth Bank of Australia 2009 ABN 48 123 123 124
Page 79
List of other tables and diagrams
Title / DescriptionPage
No.Table - Summary Group capital adequacy ratios (level 2) 2
Basel II capital framework 5
APS 330 Group reporting structure 6
Table - Summary Group capital adequacy and RWA 7
Items impacting published total capital adequacy ratio (FSA v APS 330) 4
Table - Comparison of APS330 and normalised FSA capital adequacy ratios 4
Risk governance structure 13
Risk appetite framework 15
Principal risk type / governance framework 16
Capital management framework 18
Types of capital 18
Credit risk governance committee framework 21
Market risk governance and accountability 61
Group operational risk management framework 69
Three layers of operational risk assurance 69
Table - Ordinary share capital for regulatory purposes 72
Table - Total reserves balance included in regulatory capital 72
Table - Retained & current year earnings included in regulatory capital 72
Table - Total innovative capital 73
Summary - PERLS II and III 73
Summary - Trust preferred securities 74
Summary - ABS preferred securities 74
Summary - Perpetual exchangeable floating rate notes 75
Table - Non innovative capital 75
Summary - PERLS IV 75
Table - Tier 1 capital deductions - 100% 76
Table - Tier 2 capital deductions - 50% 76
Table - Upper Tier 2 capital 76
Summary - Upper Tier 2 perpetual subordinated debt 76
Table - Lower Tier 2 capital 77
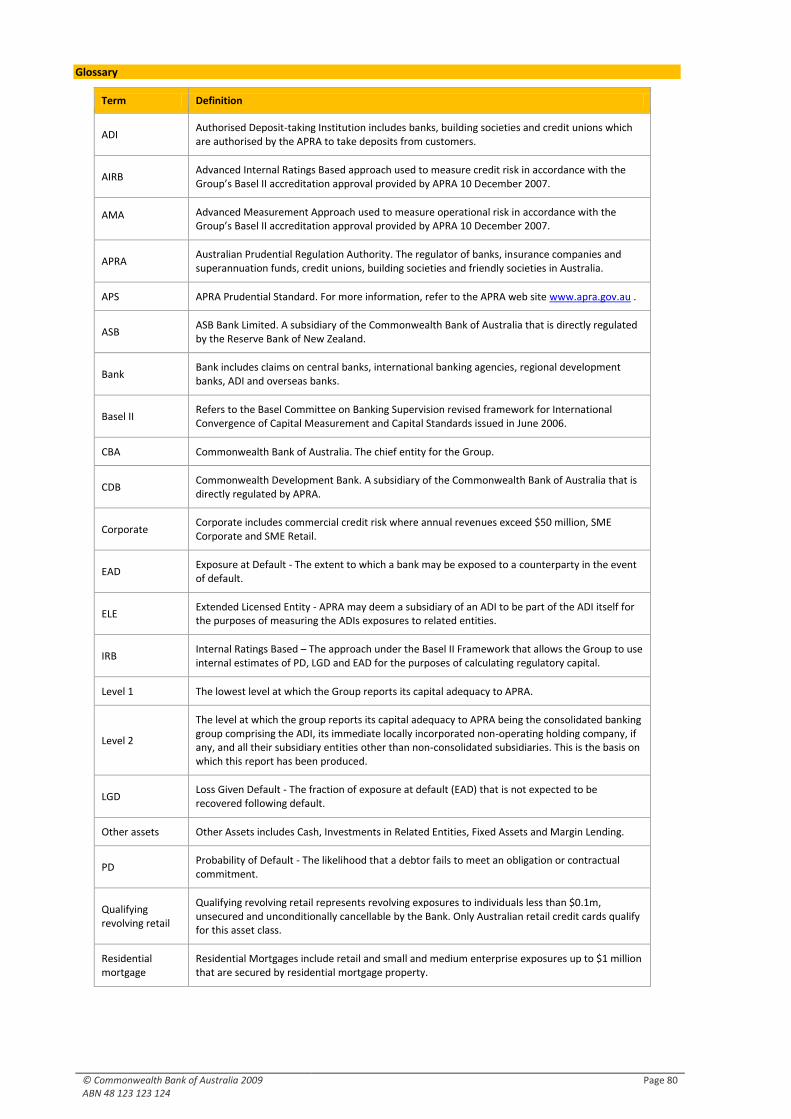
© Commonwealth Bank of Australia 2009 ABN 48 123 123 124
Page 80
Glossary
Term Definition
ADI Authorised Deposit-taking Institution includes banks, building societies and credit unions which are authorised by the APRA to take deposits from customers.
AIRB Advanced Internal Ratings Based approach used to measure credit risk in accordance with the Group’s Basel II accreditation approval provided by APRA 10 December 2007.
AMA Advanced Measurement Approach used to measure operational risk in accordance with the Group’s Basel II accreditation approval provided by APRA 10 December 2007.
APRA Australian Prudential Regulation Authority. The regulator of banks, insurance companies and superannuation funds, credit unions, building societies and friendly societies in Australia.
APS APRA Prudential Standard. For more information, refer to the APRA web site www.apra.gov.au .
ASB ASB Bank Limited. A subsidiary of the Commonwealth Bank of Australia that is directly regulated by the Reserve Bank of New Zealand.
Bank Bank includes claims on central banks, international banking agencies, regional development banks, ADI and overseas banks.
Basel II Refers to the Basel Committee on Banking Supervision revised framework for International Convergence of Capital Measurement and Capital Standards issued in June 2006.
CBA Commonwealth Bank of Australia. The chief entity for the Group.
CDB Commonwealth Development Bank. A subsidiary of the Commonwealth Bank of Australia that is directly regulated by APRA.
Corporate Corporate includes commercial credit risk where annual revenues exceed $50 million, SME Corporate and SME Retail.
EAD Exposure at Default - The extent to which a bank may be exposed to a counterparty in the event of default.
ELE Extended Licensed Entity - APRA may deem a subsidiary of an ADI to be part of the ADI itself for the purposes of measuring the ADIs exposures to related entities.
IRB Internal Ratings Based – The approach under the Basel II Framework that allows the Group to use internal estimates of PD, LGD and EAD for the purposes of calculating regulatory capital.
Level 1 The lowest level at which the Group reports its capital adequacy to APRA.
Level 2
The level at which the group reports its capital adequacy to APRA being the consolidated banking group comprising the ADI, its immediate locally incorporated non-operating holding company, if any, and all their subsidiary entities other than non-consolidated subsidiaries. This is the basis on which this report has been produced.
LGD Loss Given Default - The fraction of exposure at default (EAD) that is not expected to be recovered following default.
Other assets Other Assets includes Cash, Investments in Related Entities, Fixed Assets and Margin Lending.
PD Probability of Default - The likelihood that a debtor fails to meet an obligation or contractual commitment.
Qualifying revolving retail
Qualifying revolving retail represents revolving exposures to individuals less than $0.1m, unsecured and unconditionally cancellable by the Bank. Only Australian retail credit cards qualify for this asset class.
Residential mortgage
Residential Mortgages include retail and small and medium enterprise exposures up to $1 million that are secured by residential mortgage property.
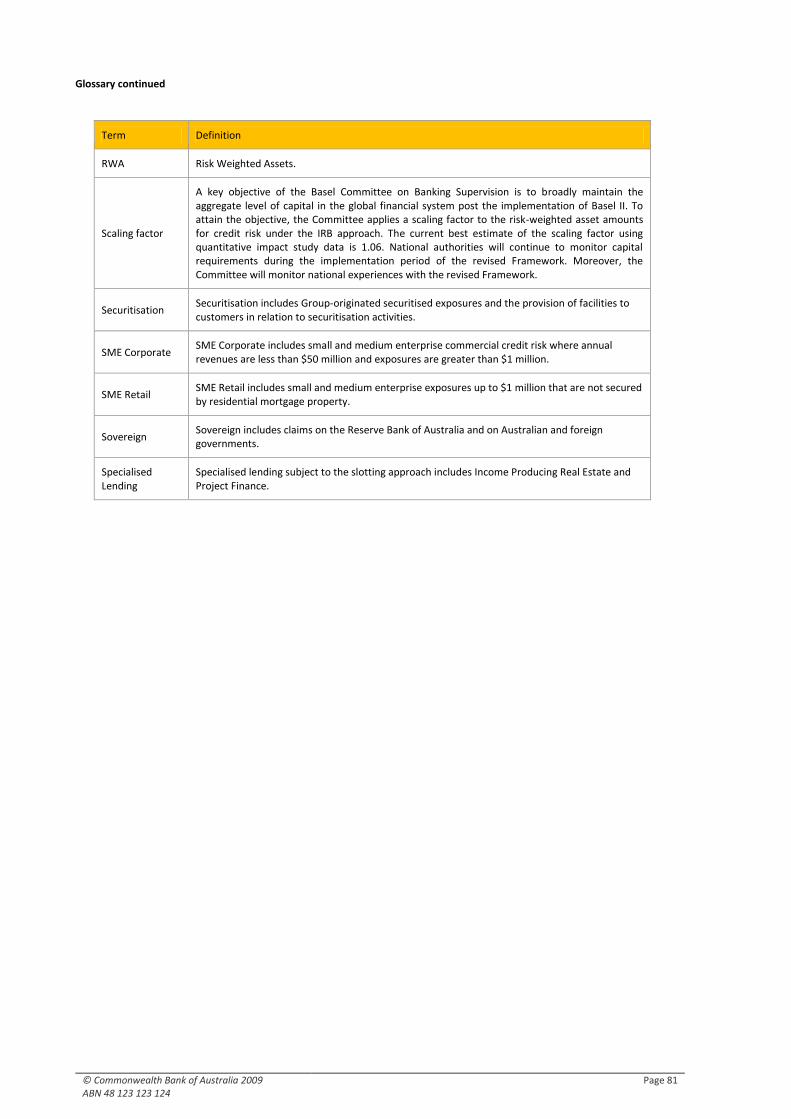
© Commonwealth Bank of Australia 2009 ABN 48 123 123 124
Page 81
Glossary continued
Term Definition
RWA Risk Weighted Assets.
Scaling factor
A key objective of the Basel Committee on Banking Supervision is to broadly maintain the aggregate level of capital in the global financial system post the implementation of Basel II. To attain the objective, the Committee applies a scaling factor to the risk-weighted asset amounts for credit risk under the IRB approach. The current best estimate of the scaling factor using quantitative impact study data is 1.06. National authorities will continue to monitor capital requirements during the implementation period of the revised Framework. Moreover, the Committee will monitor national experiences with the revised Framework.
Securitisation Securitisation includes Group-originated securitised exposures and the provision of facilities to customers in relation to securitisation activities.
SME Corporate SME Corporate includes small and medium enterprise commercial credit risk where annual revenues are less than $50 million and exposures are greater than $1 million.
SME Retail SME Retail includes small and medium enterprise exposures up to $1 million that are not secured by residential mortgage property.
Sovereign Sovereign includes claims on the Reserve Bank of Australia and on Australian and foreign governments.
Specialised Lending
Specialised lending subject to the slotting approach includes Income Producing Real Estate and Project Finance.