Embed Size (px)
Citation preview
Projection of ACC Long Term Claim Numbers
weekly compensation
Todd NicholsonBee Wong Sim
22 November 2010
Outline• Purpose
• Background
• Modelling
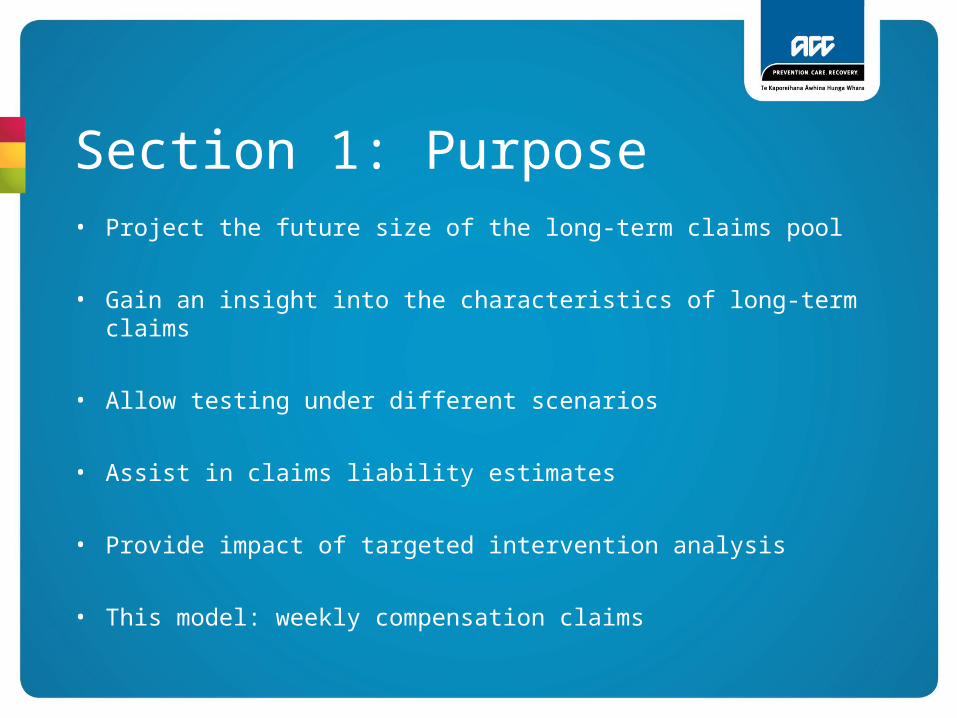
Section 1: Purpose• Project the future size of the long-term claims pool
• Gain an insight into the characteristics of long-term claims
• Allow testing under different scenarios
• Assist in claims liability estimates
• Provide impact of targeted intervention analysis
• This model: weekly compensation claims
Section 2: Background
Weekly Compensation
• Definitions – weekly compensation (“WC”)– long term claims
• Outstanding claims liability provision for WC at June 2010 is $6.7 billion – 90% due to claims active one year post accident
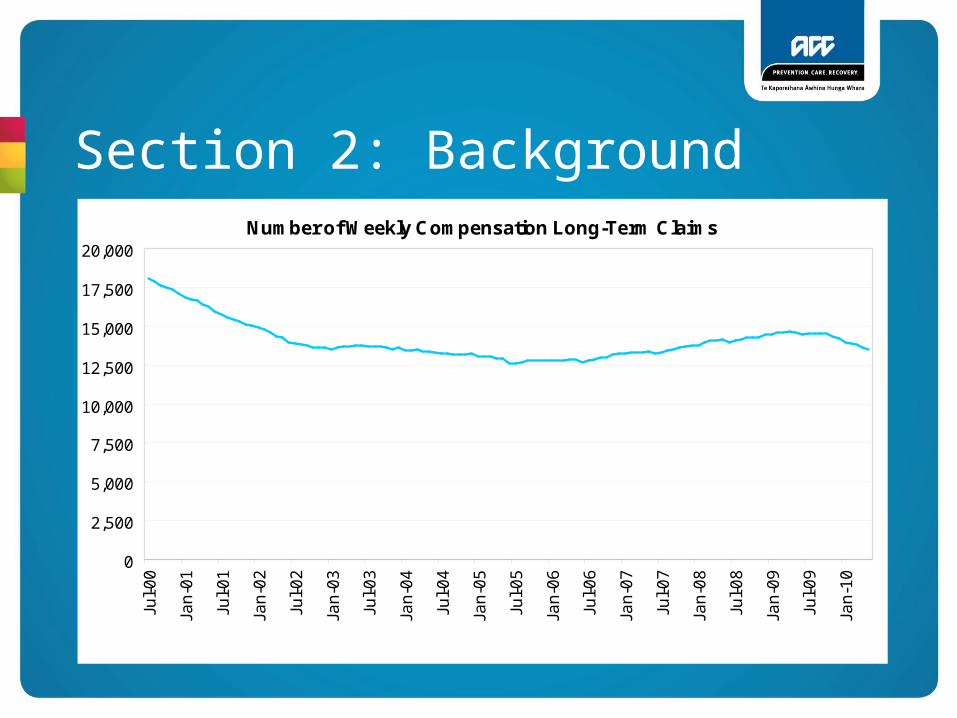
Section 2: BackgroundNumber of Weekly Compensation Long-Term Claims
0
2,500
5,000
7,500
10,000
12,500
15,000
17,500
20,000
Jul-
00
Jan
-01
Jul-
01
Jan
-02
Jul-
02
Jan
-03
Jul-
03
Jan
-04
Jul-
04
Jan
-05
Jul-
05
Jan
-06
Jul-
06
Jan
-07
Jul-
07
Jan
-08
Jul-
08
Jan
-09
Jul-
09
Jan
-10
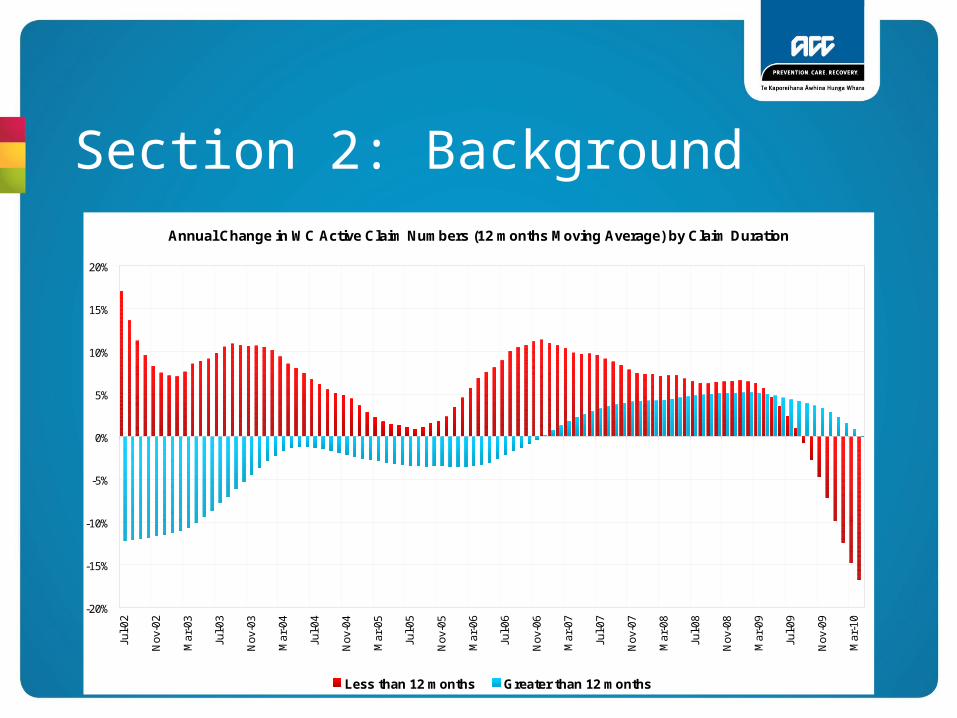
Section 2: BackgroundAnnual Change in WC Active Claim Numbers (12 months Moving Average) by Claim Duration
-20%
-15%
-10%
-5%
0%
5%
10%
15%
20%
Jul-0
2
Nov
-02
Mar
-03
Jul-0
3
Nov
-03
Mar
-04
Jul-0
4
Nov
-04
Mar
-05
Jul-0
5
Nov
-05
Mar
-06
Jul-0
6
Nov
-06
Mar
-07
Jul-0
7
Nov
-07
Mar
-08
Jul-0
8
Nov
-08
Mar
-09
Jul-0
9
Nov
-09
Mar
-10
Less than 12 months Greater than 12 months
Section 2: Background
External Environment
• Recession
• Political landscape
• Decline in new claims
Section 2: Background
Internal Environment
• Renewed case management focus
• Changes to operations model
Section 2: Background
Old Operations Model
• Front-end and volume driven
• Process compliance focused
• Case management focus on new claims to detriment of long-term claims management
Section 2: Background
New Operations Model
• Get back to basics
• Auto-streaming
• Experts review to identify “at risk” claims
• Expert early psycho-social screening
Section 2: Background
Recover Independence Service (“RIS”)
• New specialist rehabilitation team
• Set up in July 2009
• Focuses on claims that have received weekly compensation in excess of 2.5 years
• Increased number of case managers
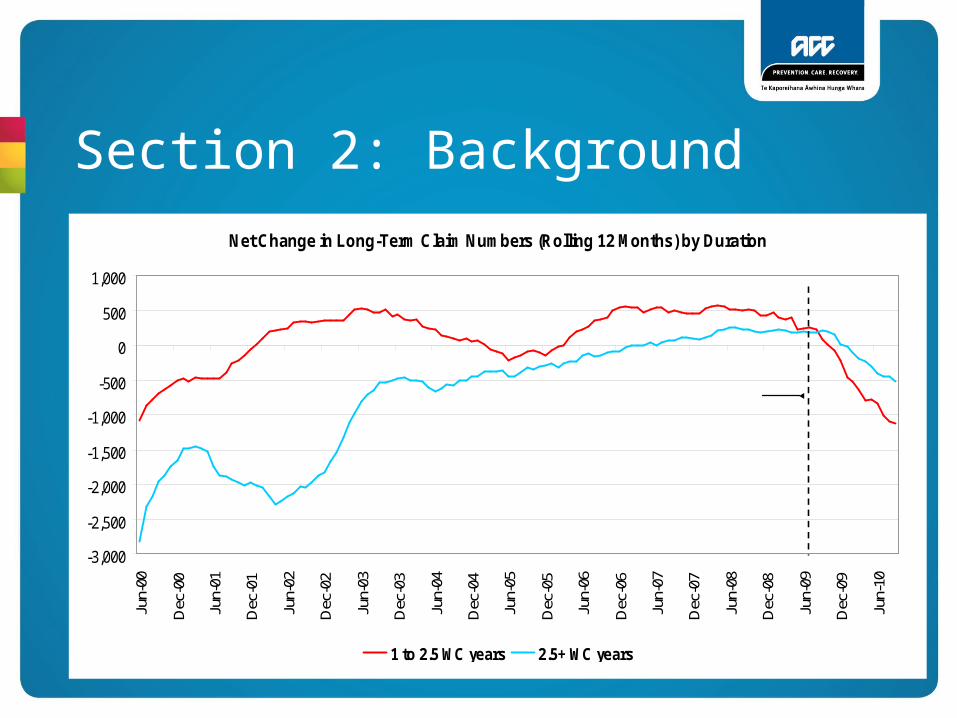
Section 2: BackgroundNet Change in Long-Term Claim Numbers (Rolling 12 Months) by Duration
-3,000
-2,500
-2,000
-1,500
-1,000
-500
0
500
1,000
Jun-
00
Dec
-00
Jun-
01
Dec
-01
Jun-
02
Dec
-02
Jun-
03
Dec
-03
Jun-
04
Dec
-04
Jun-
05
Dec
-05
Jun-
06
Dec
-06
Jun-
07
Dec
-07
Jun-
08
Dec
-08
Jun-
09
Dec
-09
Jun-
10
1 to 2.5 WC years 2.5+ WC years
RIS established
Section 2: Background
Questions:
• Favourable experience in the past 6 months
• How significant is the “RIS” factor
• How long is it likely to last
• Project future WC claim numbers
Section 3: Model1. Segment the existing long-term WC claims pool to
understand claim-mix
2. Construct a survival analysis model to determine which factors influence claim duration
3. Construct a simulation model to project future long-term claim numbers
Section 3: Model
Data
Segmentation• Claims that had payments since 1 Jan 2000 and had
more than 365 WC days
Survival Analysis• Claims began on or after 1 Jan 2000 and had more than
365 WC days
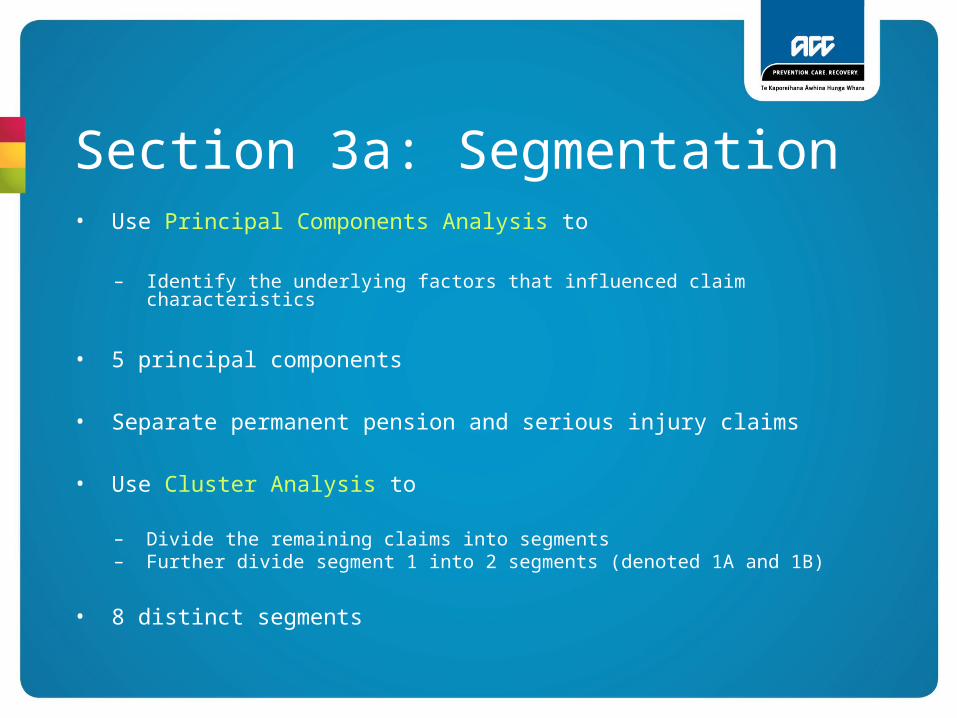
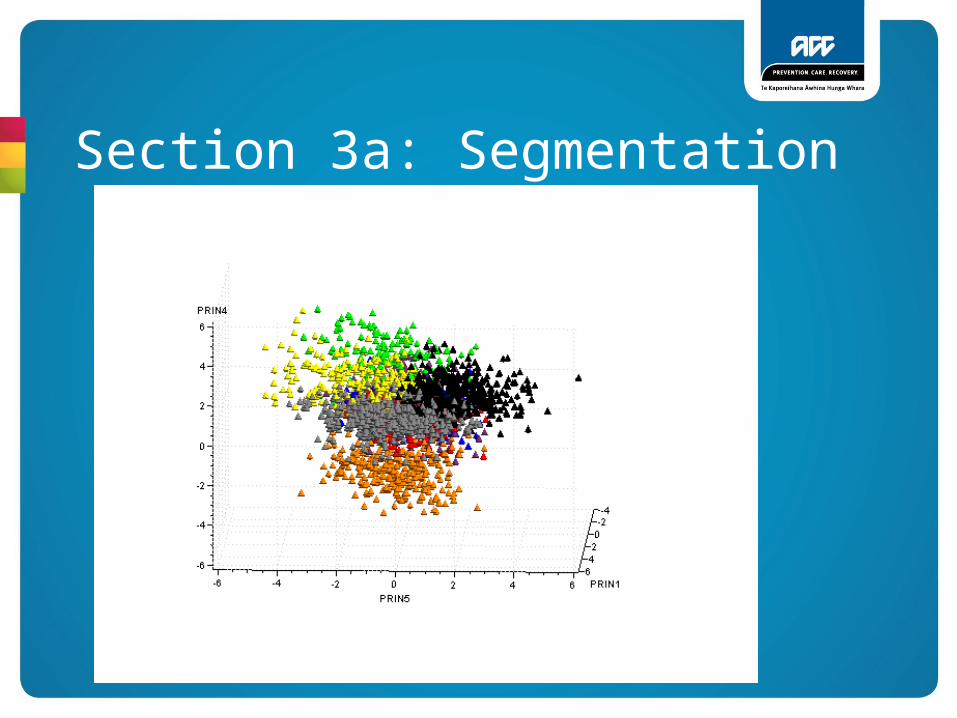
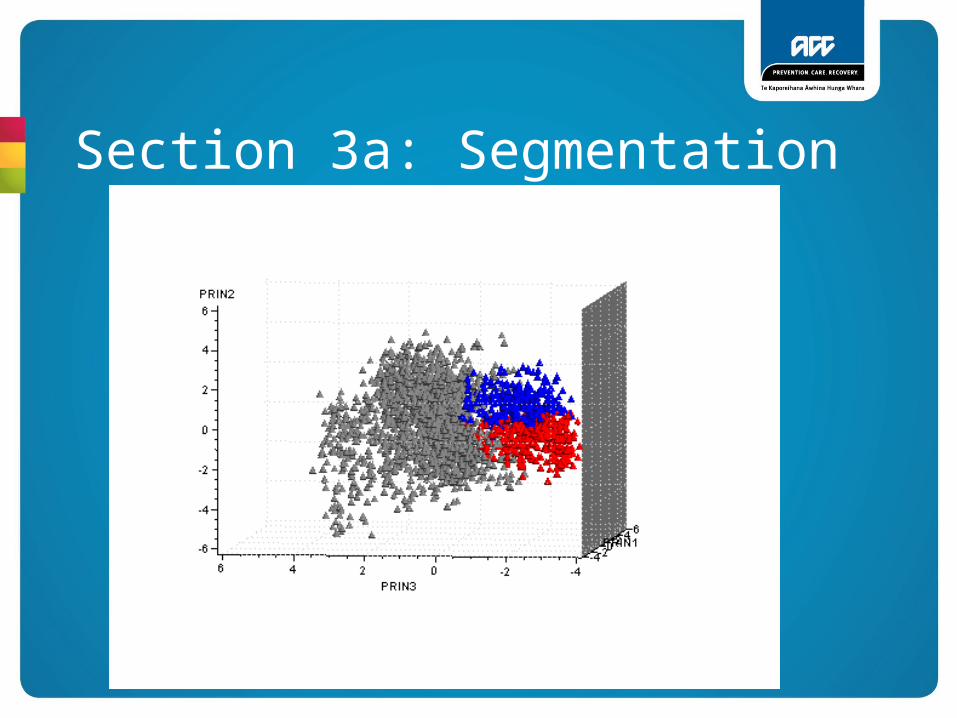
Section 3a: Segmentation• Use Principal Components Analysis to
– Identify the underlying factors that influenced claim characteristics
• 5 principal components
• Separate permanent pension and serious injury claims
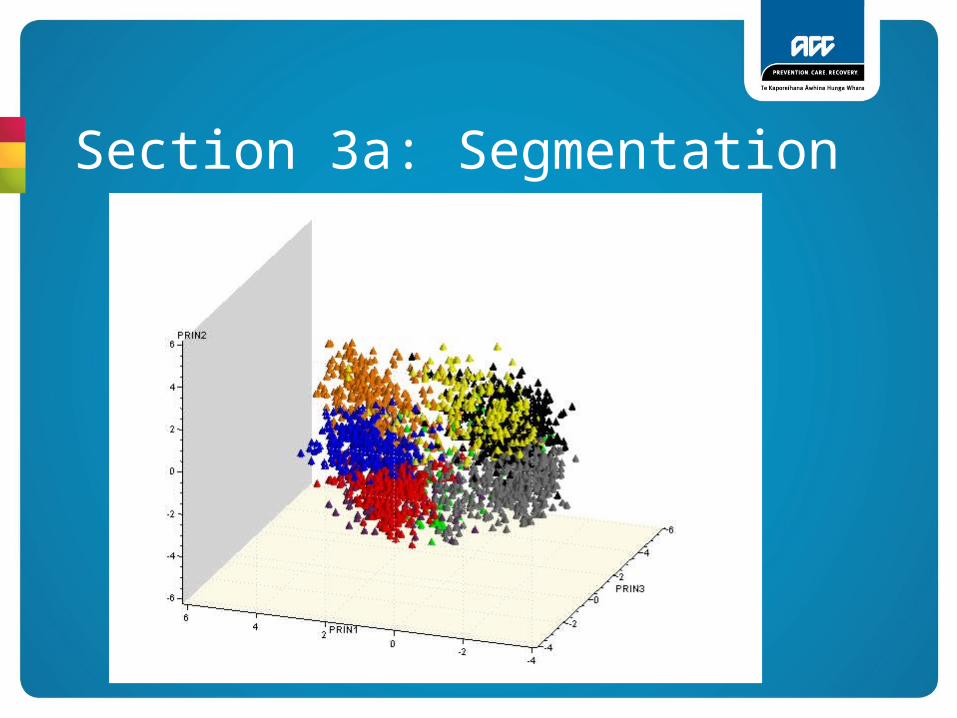
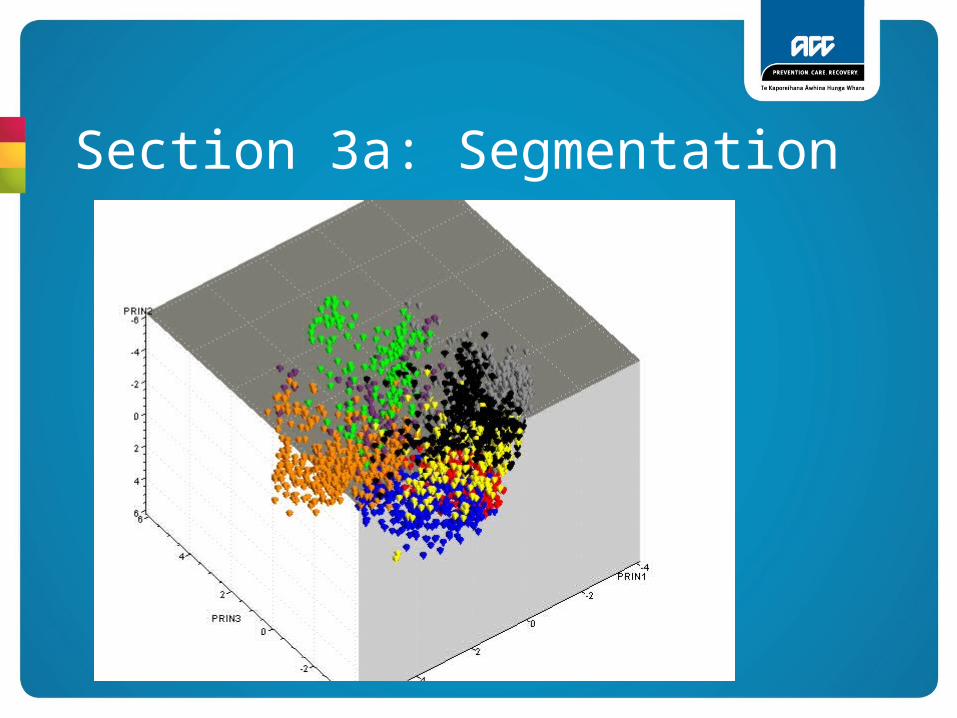
• Use Cluster Analysis to
– Divide the remaining claims into segments– Further divide segment 1 into 2 segments (denoted 1A and 1B)
• 8 distinct segments
Section 3a: Segmentation
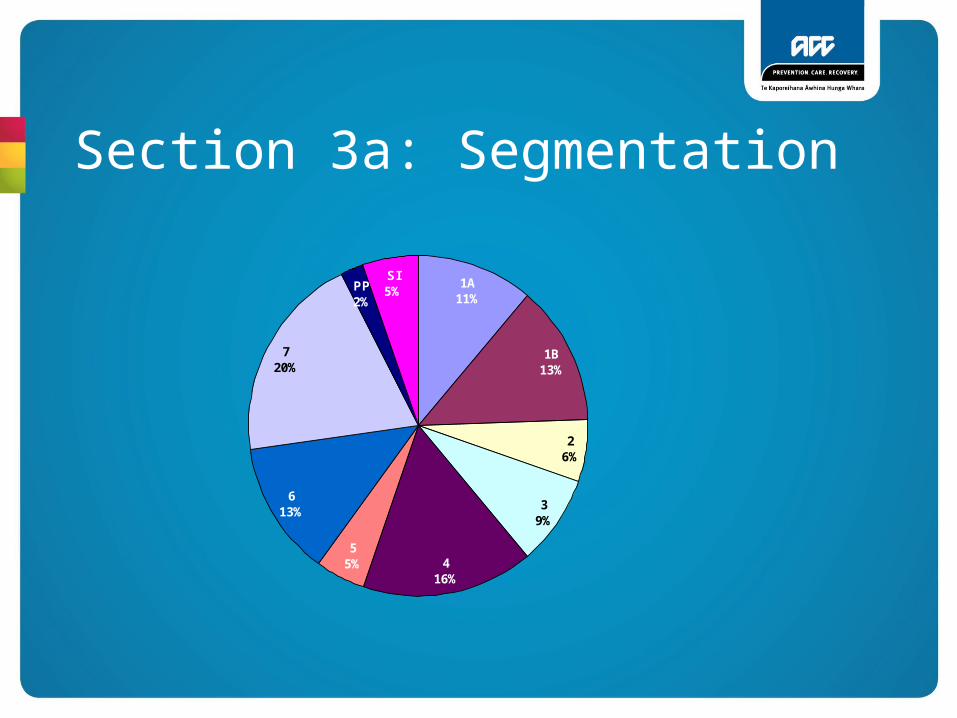
1A11%
1B13%
416%
55%
613%
SI5%
720%
39%
26%
PP2%
Section 3a: Segmentation
Section 3a: Segmentation
Section 3a: Segmentation
Section 3a: Segmentation
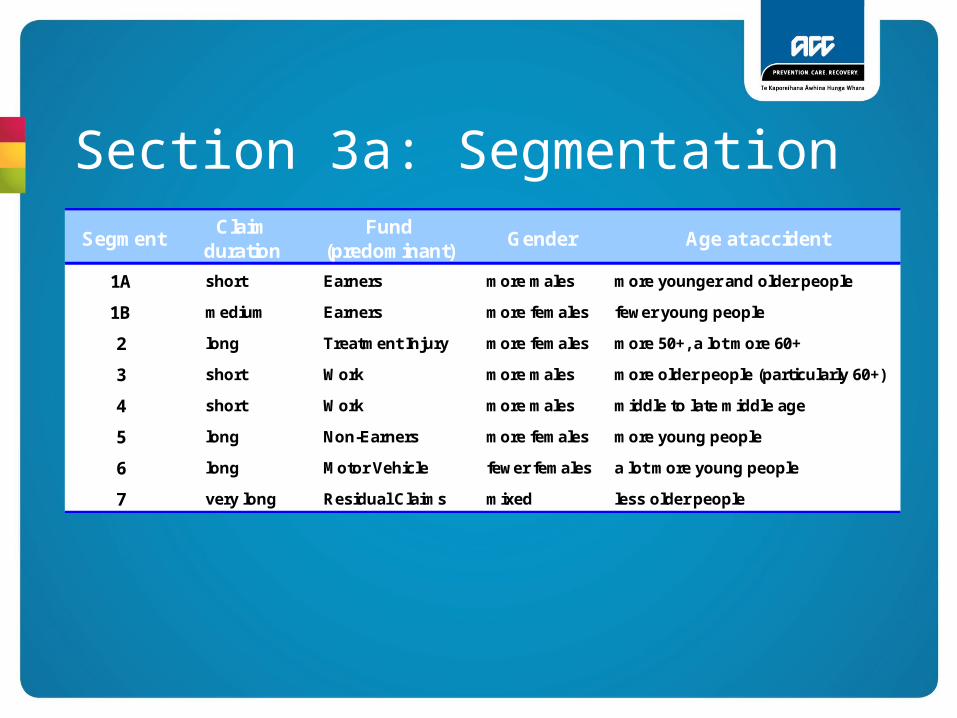
Section 3a: SegmentationSegment
Claim duration
Fund (predominant)
Gender Age at accident
1A short Earners more males more younger and older people
1B medium Earners more females fewer young people
2 long Treatment Injury more females more 50+, a lot more 60+
3 short Work more males more older people (particularly 60+)
4 short Work more males middle to late middle age
5 long Non-Earners more females more young people
6 long Motor Vehicle fewer females a lot more young people
7 very long Residual Claims mixed less older people
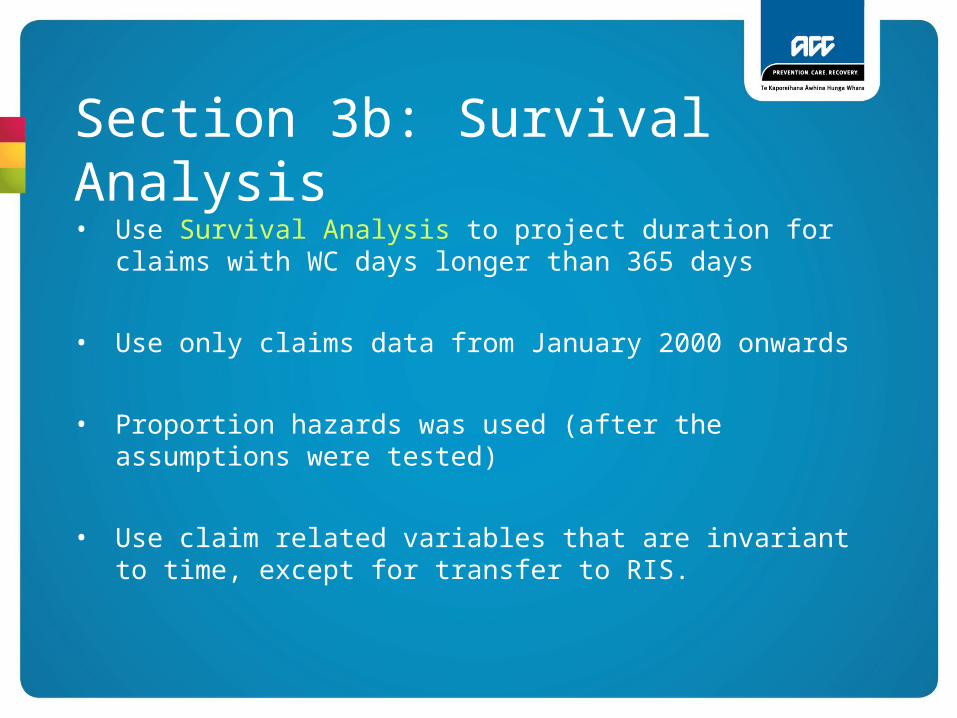
Section 3b: Survival Analysis• Use Survival Analysis to project duration for claims
with WC days longer than 365 days
• Use only claims data from January 2000 onwards
• Proportion hazards was used (after the assumptions were tested)
• Use claim related variables that are invariant to time, except for transfer to RIS.
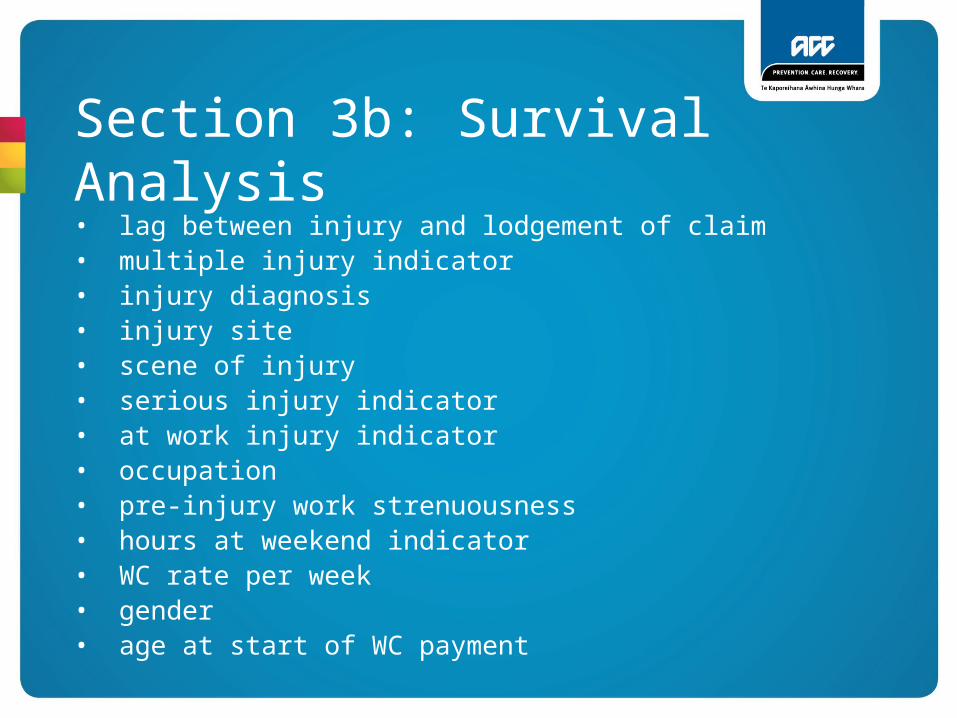
Section 3b: Survival Analysis• lag between injury and lodgement of claim• multiple injury indicator• injury diagnosis• injury site• scene of injury• serious injury indicator• at work injury indicator• occupation• pre-injury work strenuousness• hours at weekend indicator• WC rate per week• gender• age at start of WC payment
Section 3b: Survival Analysis
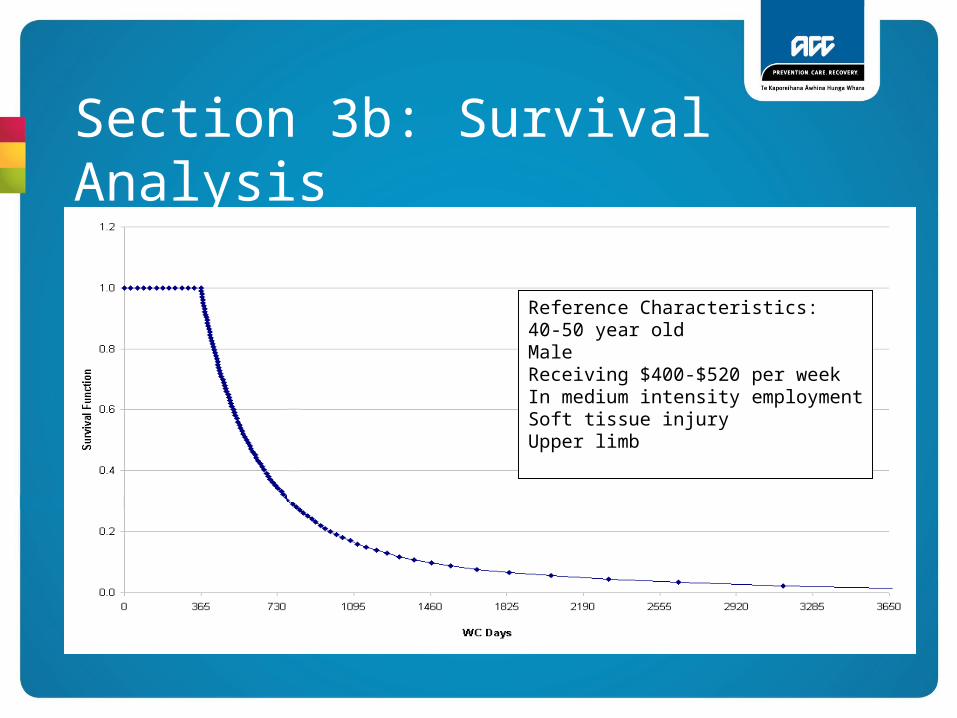
Reference Characteristics:40-50 year oldMaleReceiving $400-$520 per weekIn medium intensity employmentSoft tissue injuryUpper limb
Section 3b: Survival Analysis
VariableParameter Estimate
Significance (P value)
Hazard Ratio
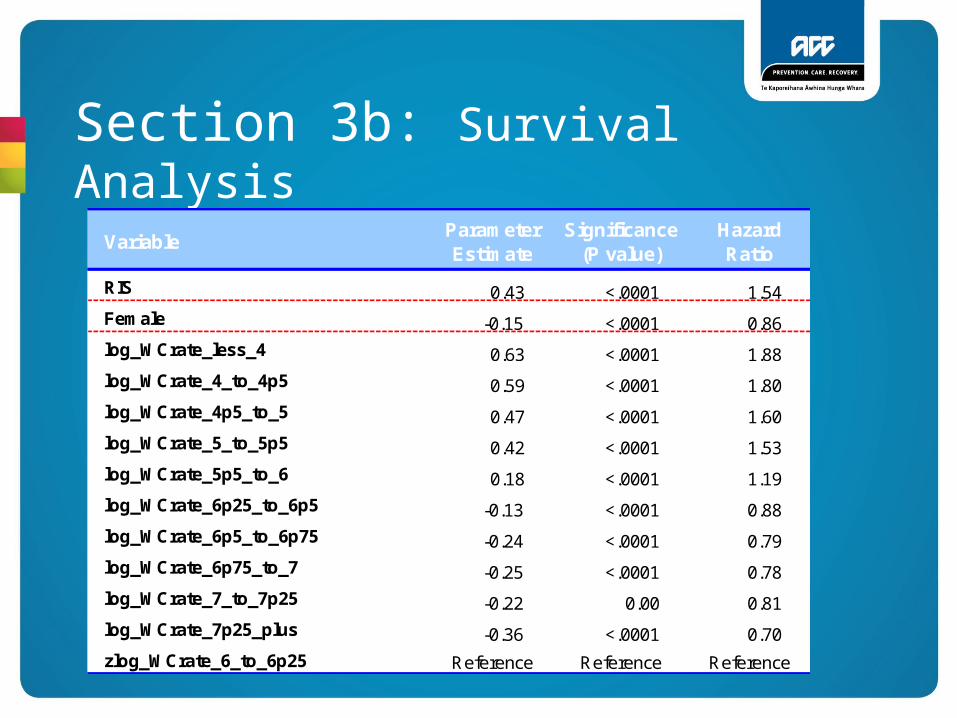
RIS 0.43 <.0001 1.54
Female -0.15 <.0001 0.86
log_WCrate_less_4 0.63 <.0001 1.88
log_WCrate_4_to_4p5 0.59 <.0001 1.80
log_WCrate_4p5_to_5 0.47 <.0001 1.60
log_WCrate_5_to_5p5 0.42 <.0001 1.53
log_WCrate_5p5_to_6 0.18 <.0001 1.19
log_WCrate_6p25_to_6p5 -0.13 <.0001 0.88
log_WCrate_6p5_to_6p75 -0.24 <.0001 0.79
log_WCrate_6p75_to_7 -0.25 <.0001 0.78
log_WCrate_7_to_7p25 -0.22 0.00 0.81
log_WCrate_7p25_plus -0.36 <.0001 0.70
zlog_WCrate_6_to_6p25 Reference Reference Reference
Section 3b: Survival Analysis
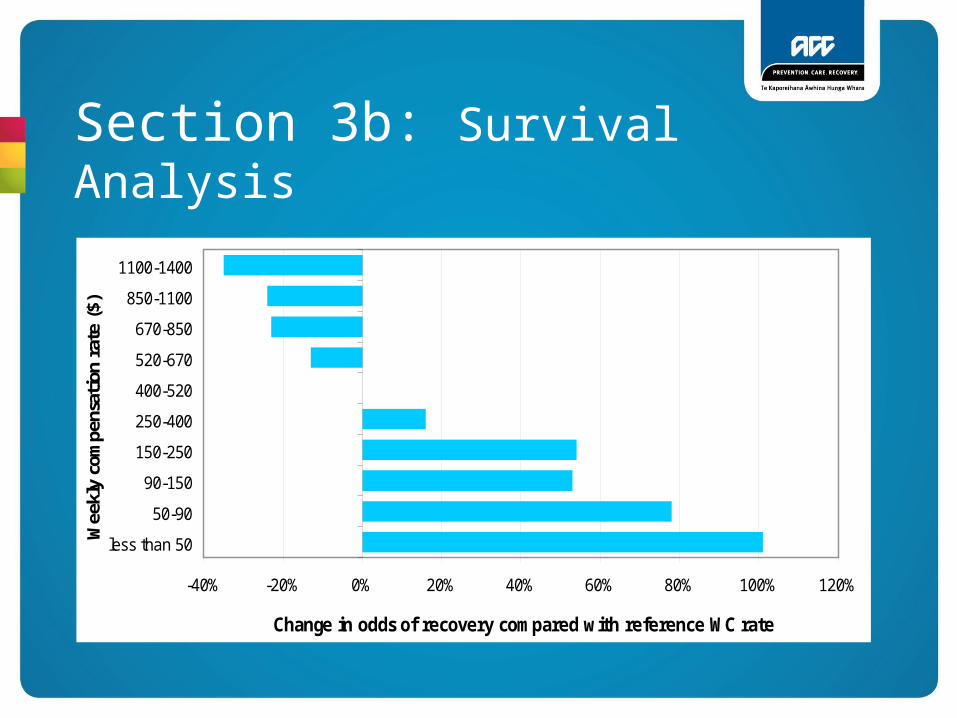
-40% -20% 0% 20% 40% 60% 80% 100% 120%
less than 50
50-90
90-150
150-250
250-400
400-520
520-670
670-850
850-1100
1100-1400
Wee
kly
com
pens
atio
n ra
te ($)
Change in odds of recovery compared with reference WC rate
Reference
Section 3b: Survival Analysis
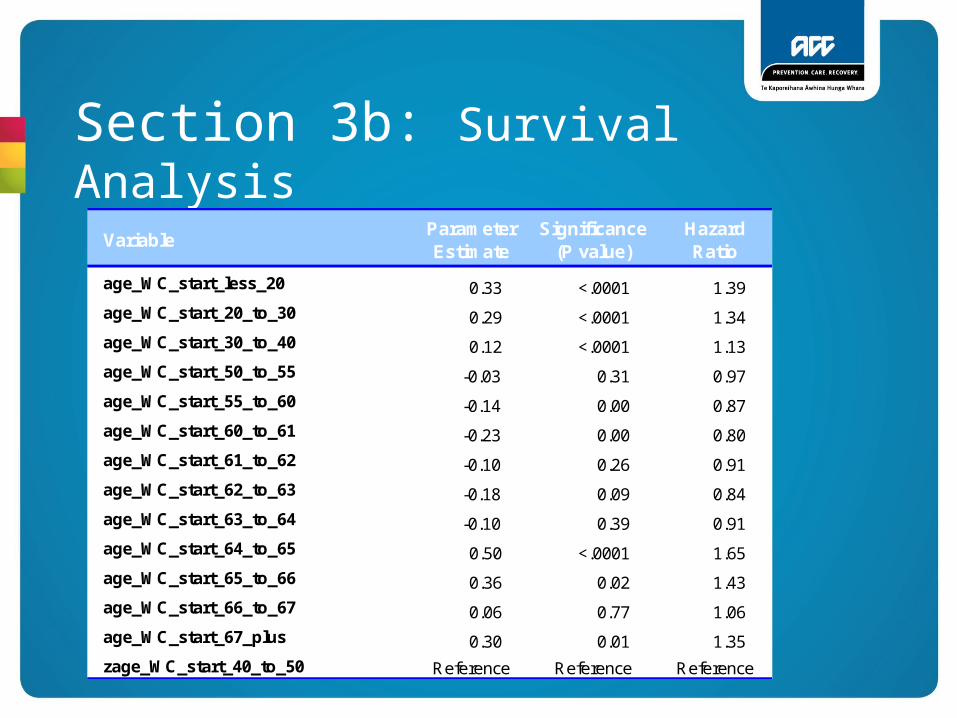
VariableParameter Estimate
Significance (P value)
Hazard Ratio
age_WC_start_less_20 0.33 <.0001 1.39
age_WC_start_20_to_30 0.29 <.0001 1.34
age_WC_start_30_to_40 0.12 <.0001 1.13
age_WC_start_50_to_55 -0.03 0.31 0.97
age_WC_start_55_to_60 -0.14 0.00 0.87
age_WC_start_60_to_61 -0.23 0.00 0.80
age_WC_start_61_to_62 -0.10 0.26 0.91
age_WC_start_62_to_63 -0.18 0.09 0.84
age_WC_start_63_to_64 -0.10 0.39 0.91
age_WC_start_64_to_65 0.50 <.0001 1.65
age_WC_start_65_to_66 0.36 0.02 1.43
age_WC_start_66_to_67 0.06 0.77 1.06
age_WC_start_67_plus 0.30 0.01 1.35
zage_WC_start_40_to_50 Reference Reference Reference
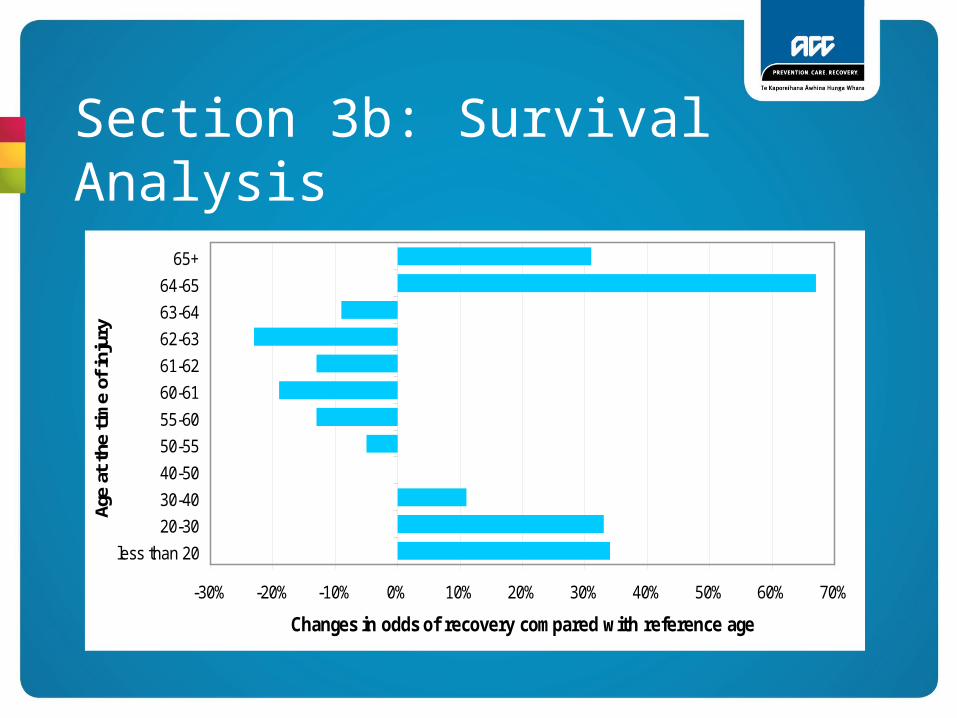
Section 3b: Survival Analysis
-30% -20% -10% 0% 10% 20% 30% 40% 50% 60% 70%
less than 20
20-30
30-40
40-50
50-55
55-60
60-61
61-62
62-63
63-64
64-65
65+
Age
at t
he t
ime
of in
jury
Changes in odds of recovery compared with reference age
Reference
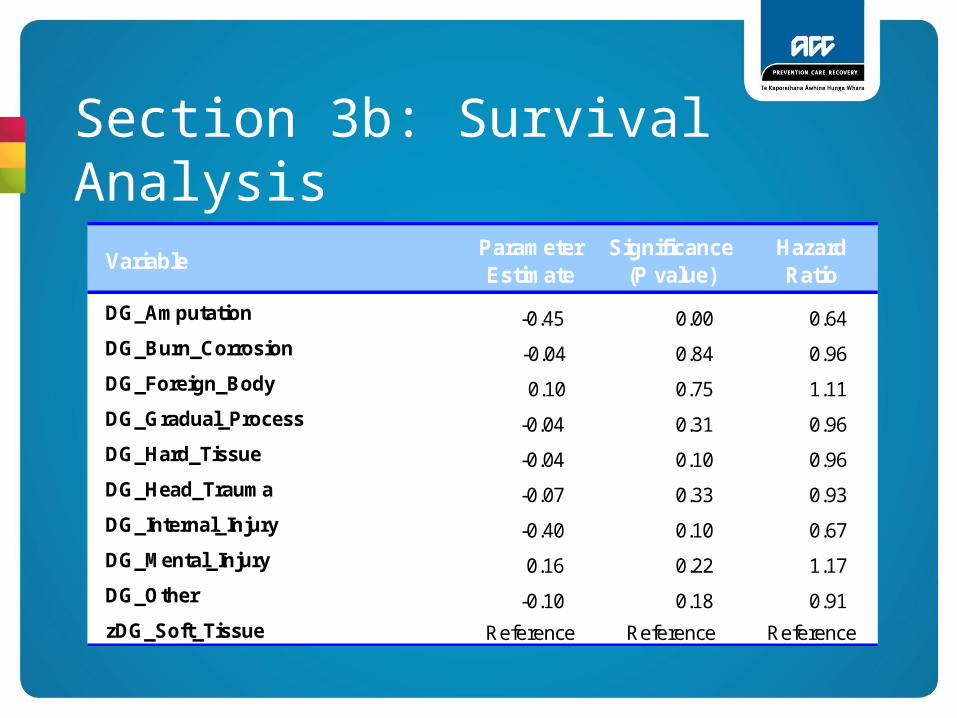
Section 3b: Survival Analysis
VariableParameter Estimate
Significance (P value)
Hazard Ratio
DG_Amputation -0.45 0.00 0.64
DG_Burn_Corrosion -0.04 0.84 0.96
DG_Foreign_Body 0.10 0.75 1.11
DG_Gradual_Process -0.04 0.31 0.96
DG_Hard_Tissue -0.04 0.10 0.96
DG_Head_Trauma -0.07 0.33 0.93
DG_Internal_Injury -0.40 0.10 0.67
DG_Mental_Injury 0.16 0.22 1.17
DG_Other -0.10 0.18 0.91
zDG_Soft_Tissue Reference Reference Reference
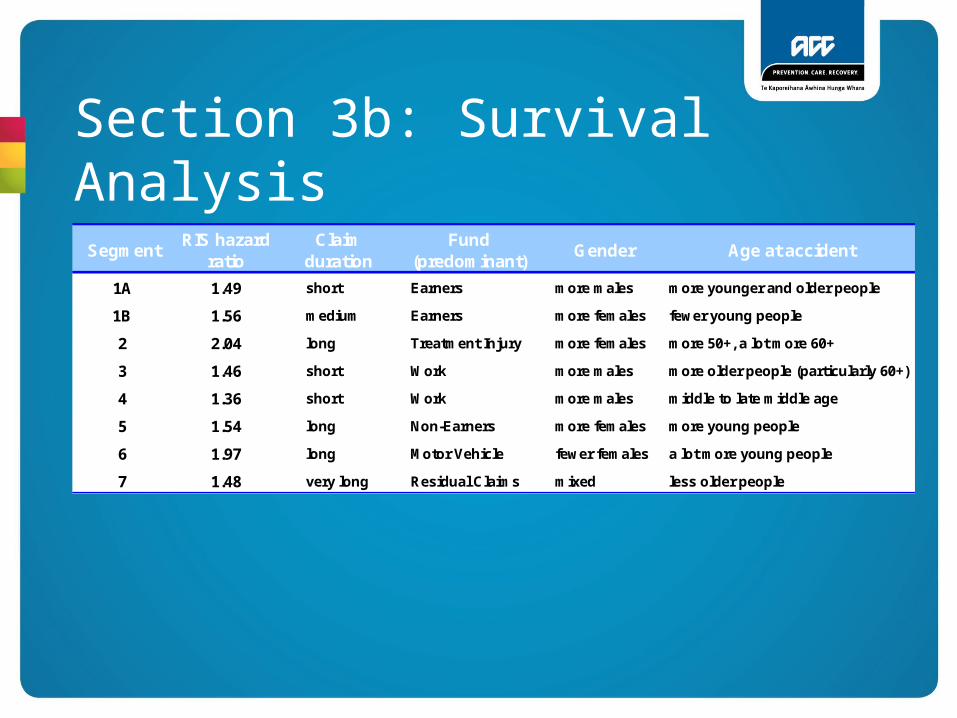
Section 3b: Survival Analysis
SegmentRIS hazard
ratioClaim
durationFund
(predominant)Gender Age at accident
1A 1.49 short Earners more males more younger and older people
1B 1.56 medium Earners more females fewer young people
2 2.04 long Treatment Injury more females more 50+, a lot more 60+
3 1.46 short Work more males more older people (particularly 60+)
4 1.36 short Work more males middle to late middle age
5 1.54 long Non-Earners more females more young people
6 1.97 long Motor Vehicle fewer females a lot more young people
7 1.48 very long Residual Claims mixed less older people
Section 3b: Survival Analysis
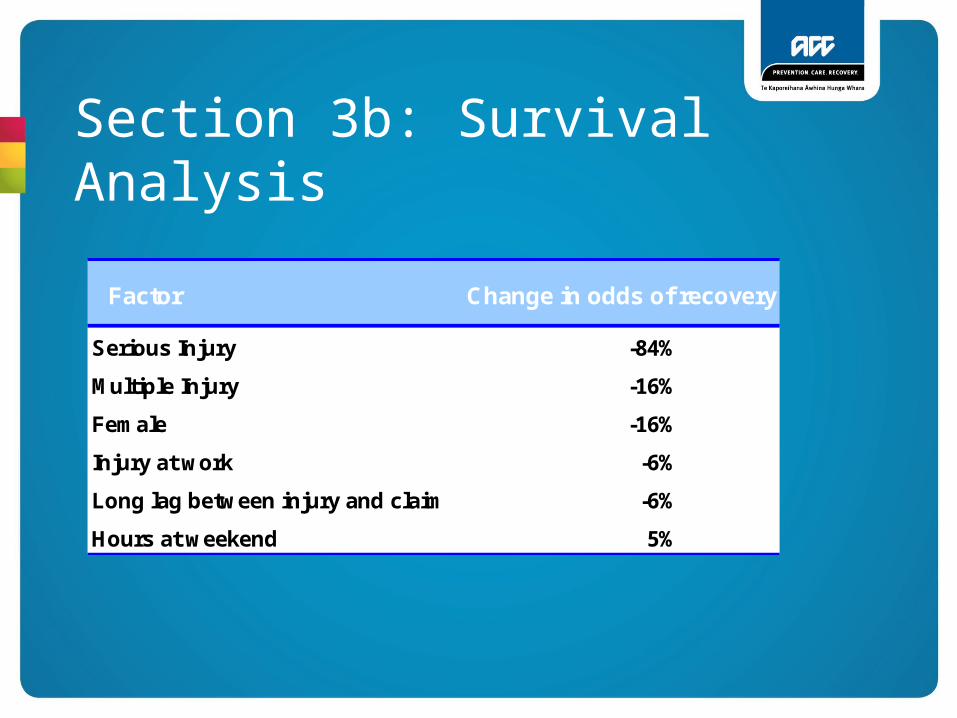
Factor Change in odds of recovery
Serious Injury -84%
Multiple Injury -16%
Female -16%
Injury at work -6%
Long lag between injury and claim -6%
Hours at weekend 5%
Section 3b: Survival Analysis
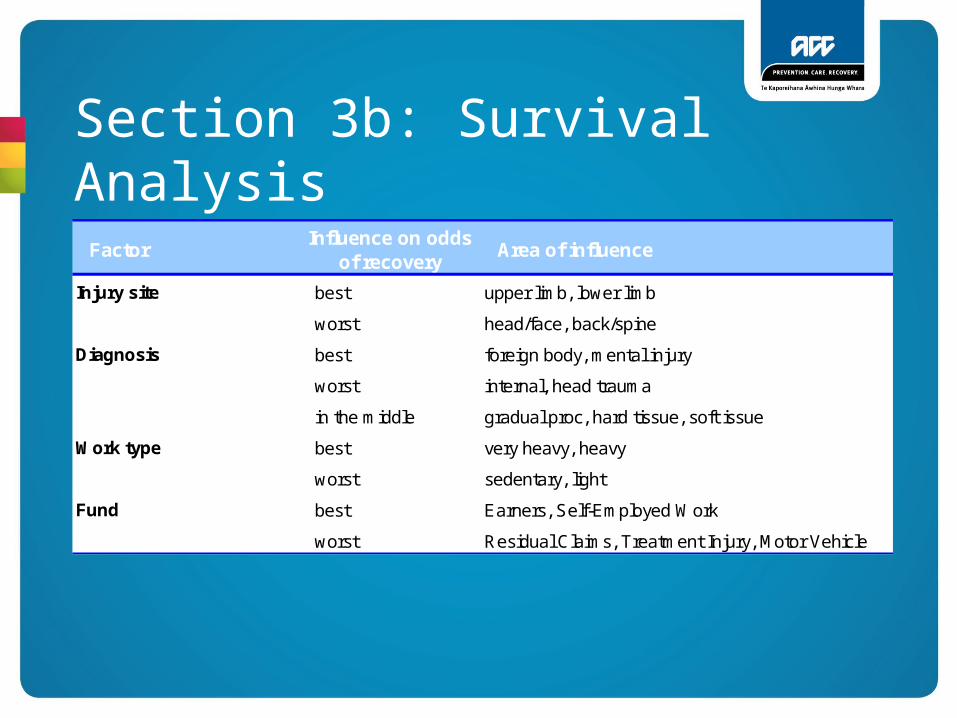
FactorInfluence on odds
of recoveryArea of influence
Injury site best upper limb, lower limb
worst head/face, back/spine
Diagnosis best foreign body, mental injury
worst internal, head trauma
in the middle gradual proc, hard tissue, soft issue
Work type best very heavy, heavy
worst sedentary, light
Fund best Earners, Self-Employed Work
worst Residual Claims, Treatment Injury, Motor Vehicle
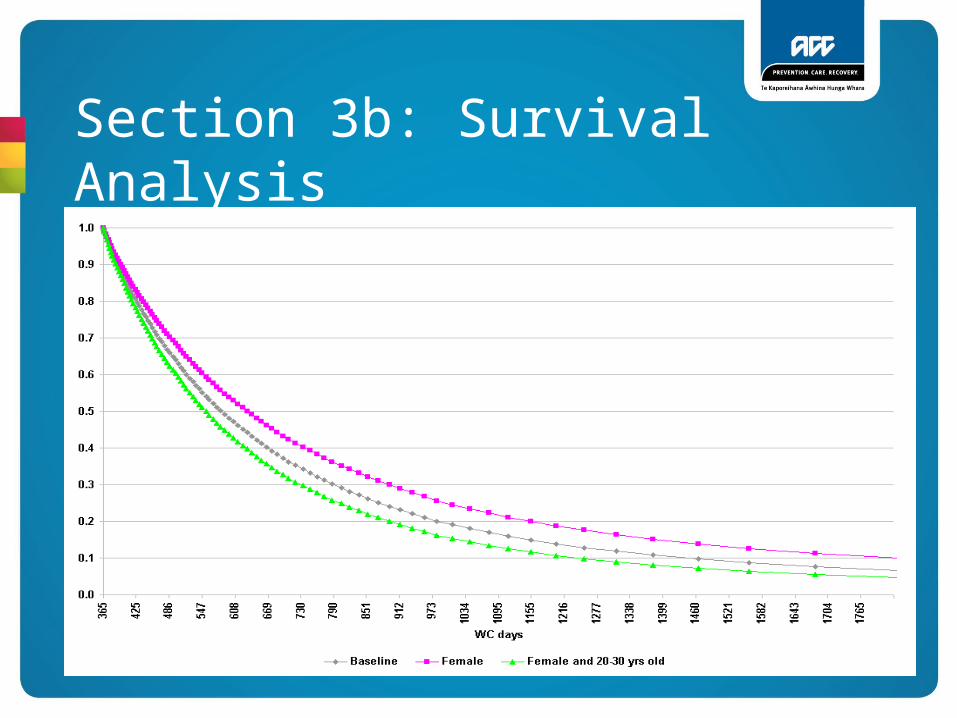
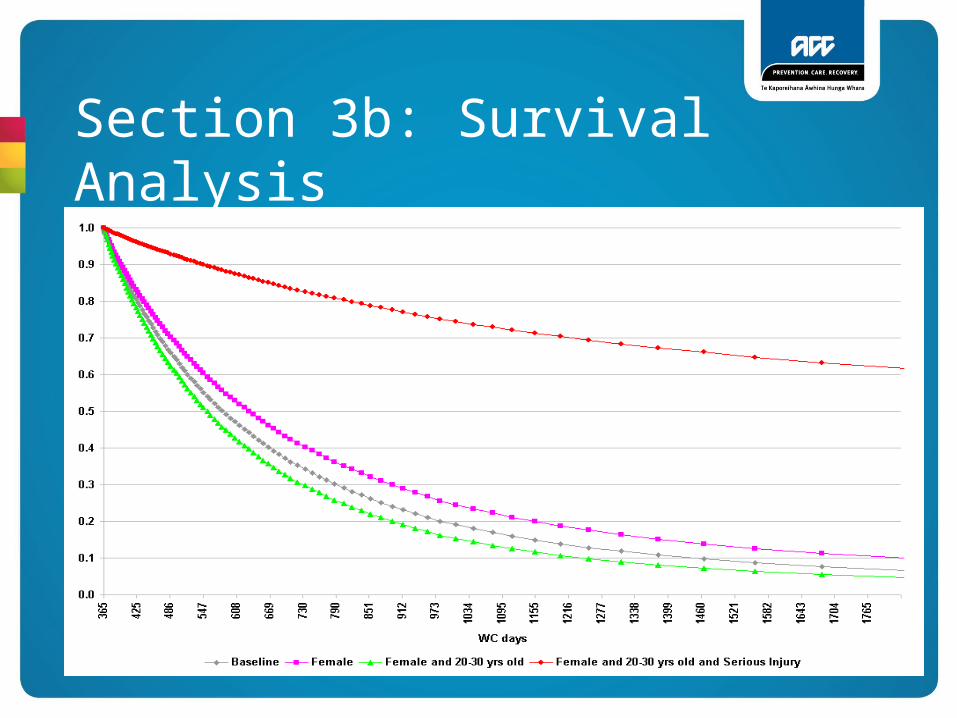
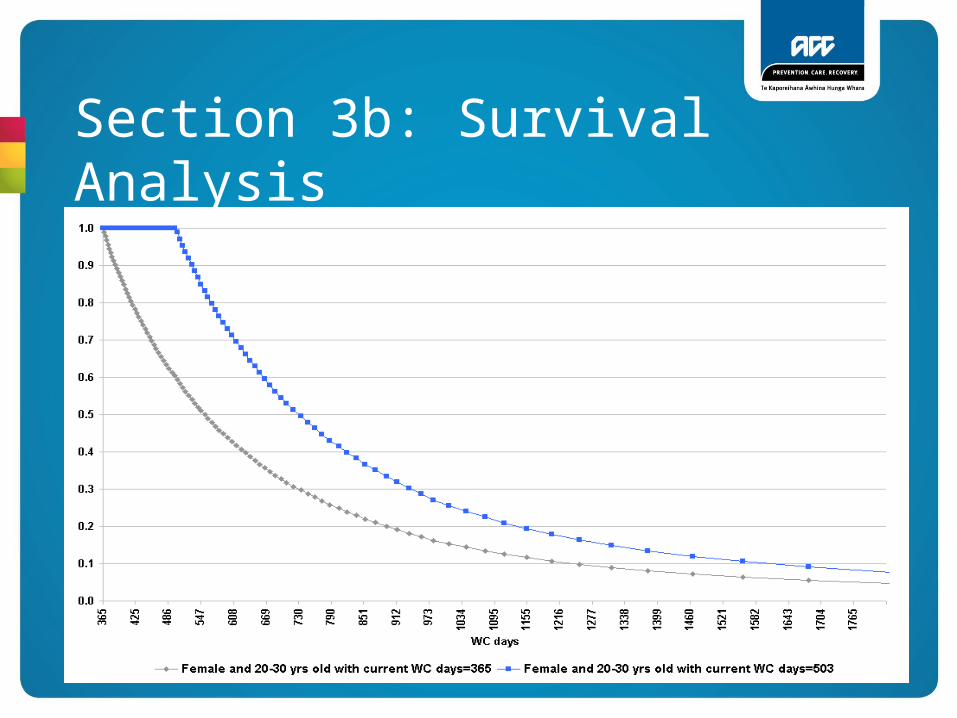
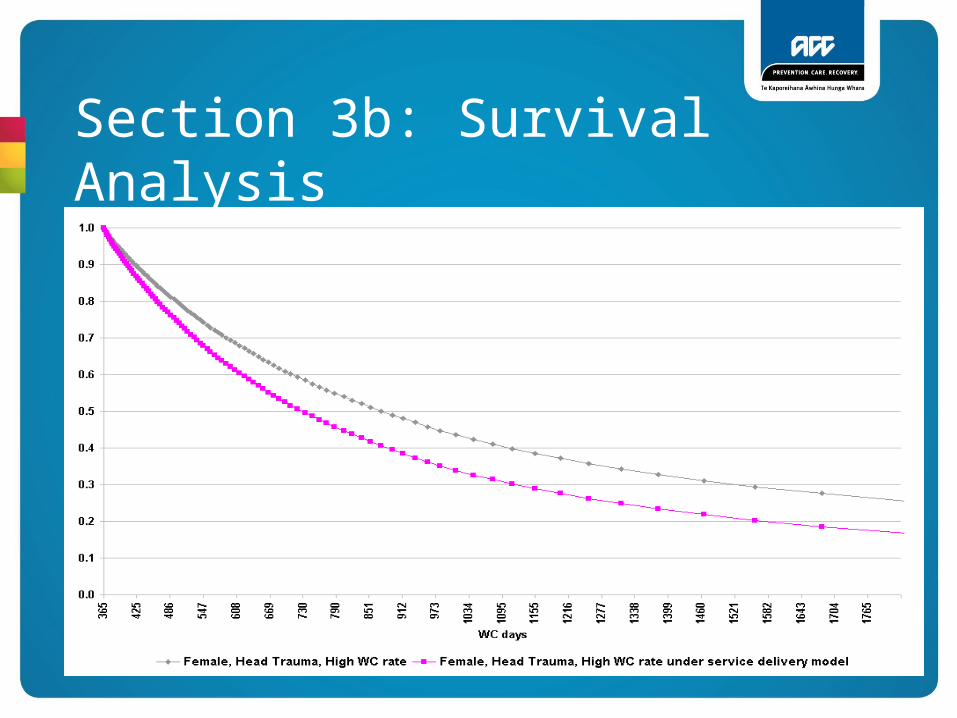
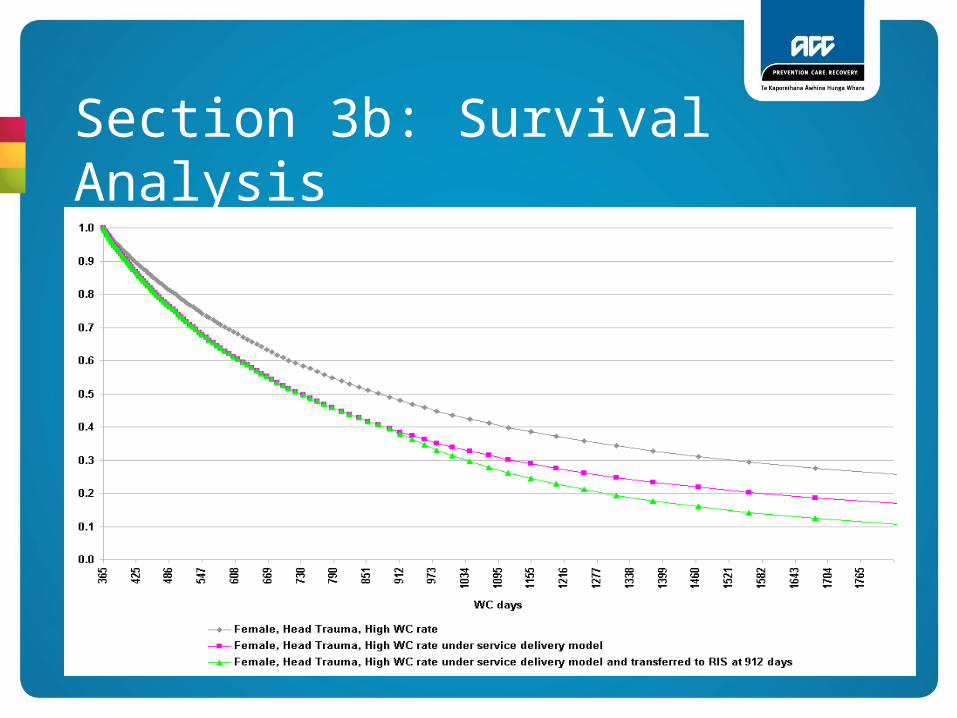
Section 3b: Survival AnalysisTo get the predicted survival curve for each claim we:
• Take the baseline survival curve
• Adjust for the claim characteristics
• Adjust for how long they have survived so far
• Adjust for the introduction of the service delivery model
• Adjust for the claim being transferred to the RIS team
Section 3b: Survival Analysis
Section 3b: Survival Analysis
Section 3b: Survival Analysis
Section 3b: Survival Analysis
Section 3b: Survival Analysis
Section 3b: Survival Analysis
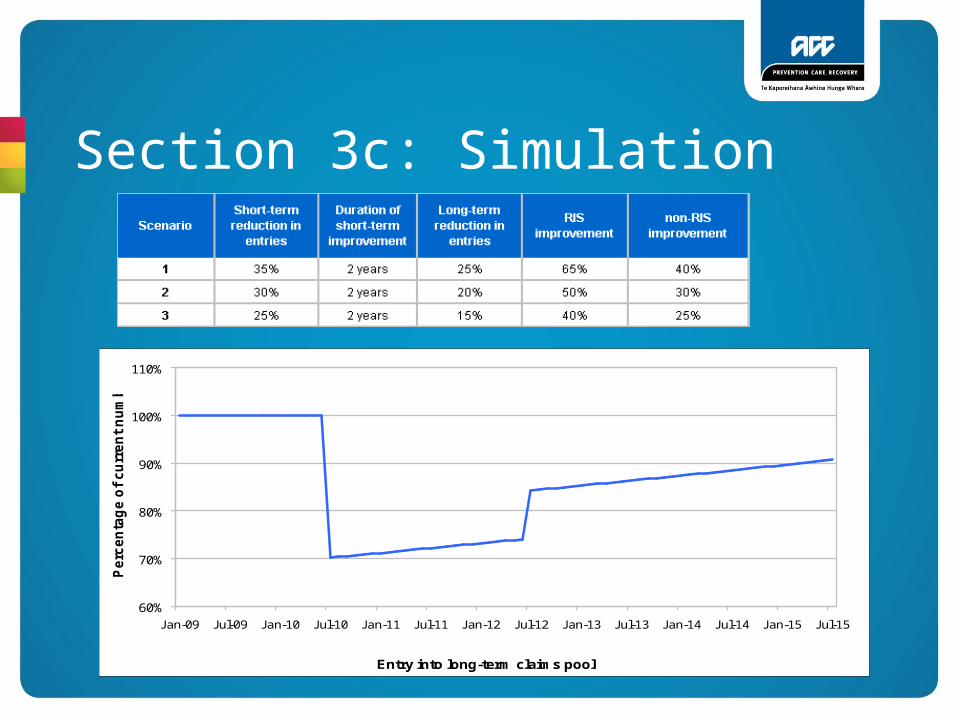
Section 3c: SimulationIn the simulation each claim has a simulated opening
and closing date. The advantages of using a simulation include:
• Easier for non-statistical audience to understand the output
• Output has the same format as real data so we can run any existing report on the simulated data
• Easier to track changes in the case mix
• Easier to trial different scenarios such as number and case mix of new claims
Section 3c: SimulationModelling Steps
• Determine the baseline survival function for each claim
• Adjust for individual claim characteristics, the influence of RIS and the service delivery model
• Generate a random number ( U[0,1] ) and use it to determine the closing duration of the claim
• Simulate new claims by taking the last year of claims and putting them in again each year

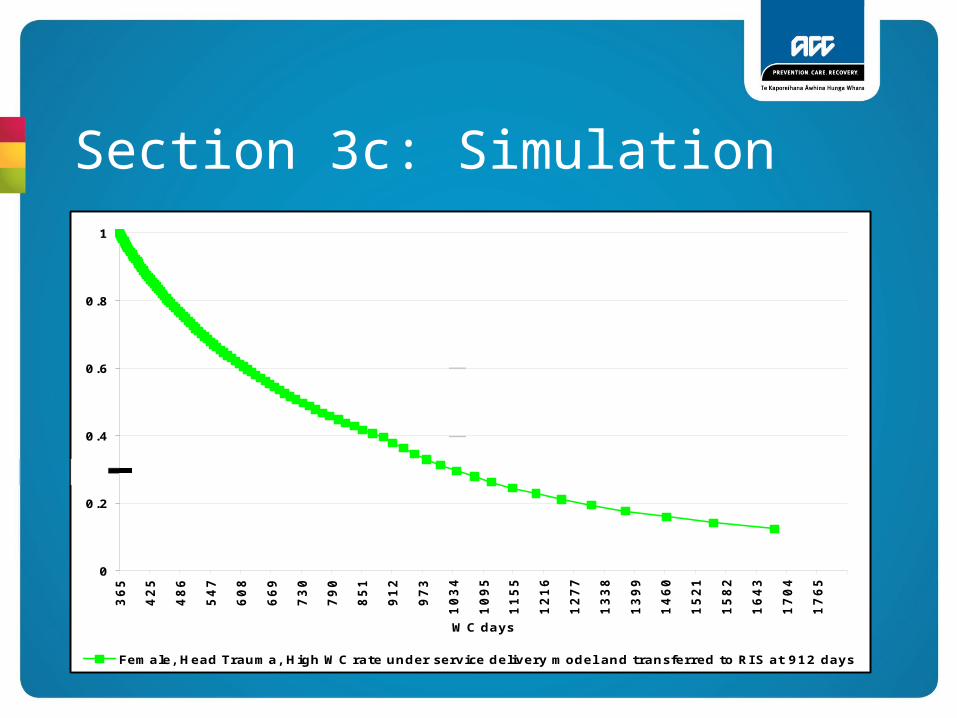
Section 3c: Simulation
0
0.2
0.4
0.6
0.8
1
36
5
42
5
48
6
54
7
60
8
66
9
73
0
79
0
85
1
91
2
97
3
10
34
10
95
11
55
12
16
12
77
13
38
13
99
14
60
15
21
15
82
16
43
17
04
17
65
WC days
Female, Head Trauma, High WC rate under service delivery model and transferred to RI S at 912 days
Section 3c: Simulation
0
0.2
0.4
0.6
0.8
1
36
5
42
5
48
6
54
7
60
8
66
9
73
0
79
0
85
1
91
2
97
3
10
34
10
95
11
55
12
16
12
77
13
38
13
99
14
60
15
21
15
82
16
43
17
04
17
65
WC days
Female, Head Trauma, High WC rate under service delivery model and transferred to RI S at 912 days
Section 3c: Simulation
60%
70%
80%
90%
100%
110%
Jan-09 Jul-09 Jan-10 Jul-10 Jan-11 Jul-11 Jan-12 Jul-12 Jan-13 Jul-13 Jan-14 Jul-14 Jan-15 Jul-15
Entry into long-term claims pool
Perc
en
tag
e o
f cu
rre
nt
nu
mb
er
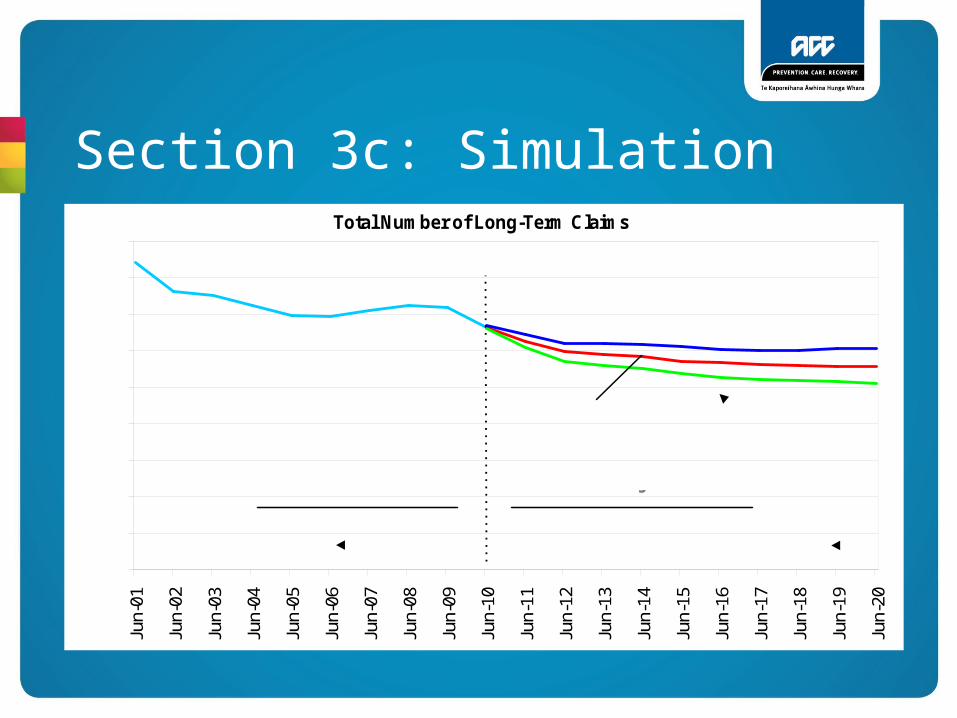
Section 3c: SimulationTotal Number of Long-Term Claims
0
2,000
4,000
6,000
8,000
10,000
12,000
14,000
16,000
18,000
Jun-
01
Jun-
02
Jun-
03
Jun-
04
Jun-
05
Jun-
06
Jun-
07
Jun-
08
Jun-
09
Jun-
10
Jun-
11
Jun-
12
Jun-
13
Jun-
14
Jun-
15
Jun-
16
Jun-
17
Jun-
18
Jun-
19
Jun-
20
Scenario 1
Actual Projected
Scenario 3
Scenario 2
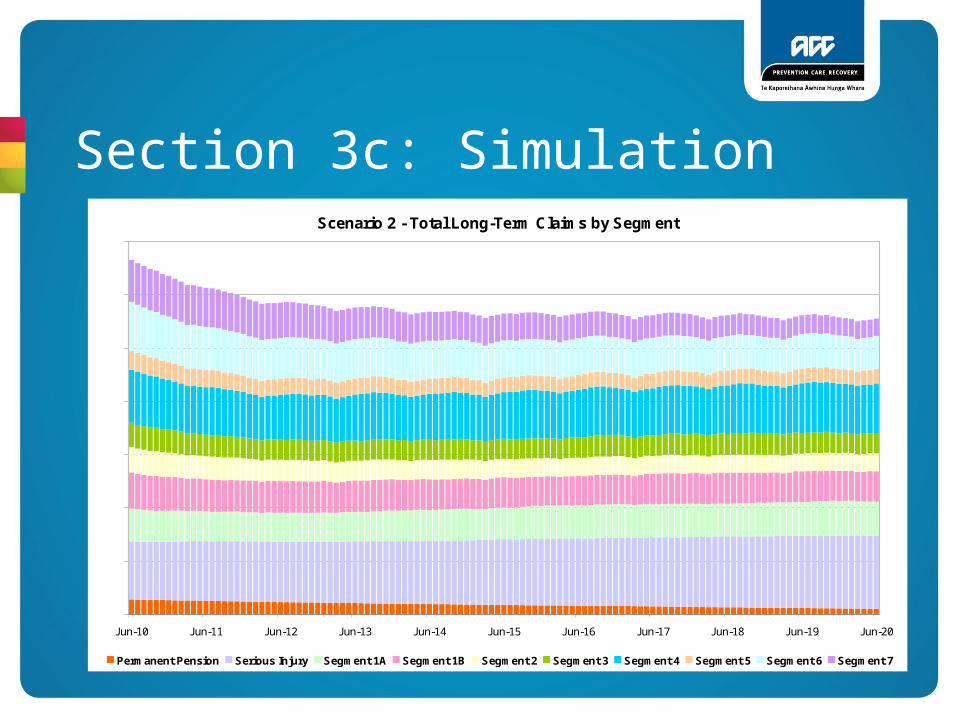
Section 3c: SimulationScenario 2 - Total Long-Term Claims by Segment
0
2000
4000
6000
8000
10000
12000
14000
Jun-10 Jun-11 Jun-12 Jun-13 Jun-14 Jun-15 Jun-16 Jun-17 Jun-18 Jun-19 Jun-20
Permanent Pension Serious Injury Segment 1A Segment 1B Segment 2 Segment 3 Segment 4 Segment 5 Segment 6 Segment 7

Questions…