Embed Size (px)
Citation preview
Applied Bioinformatics
Week 10
Theory I
• Protein Sequences
• Protein Families
• Protein Domains
• Computer Learning– Garbage in -> Garbage out
• Prediction based on learned Examples
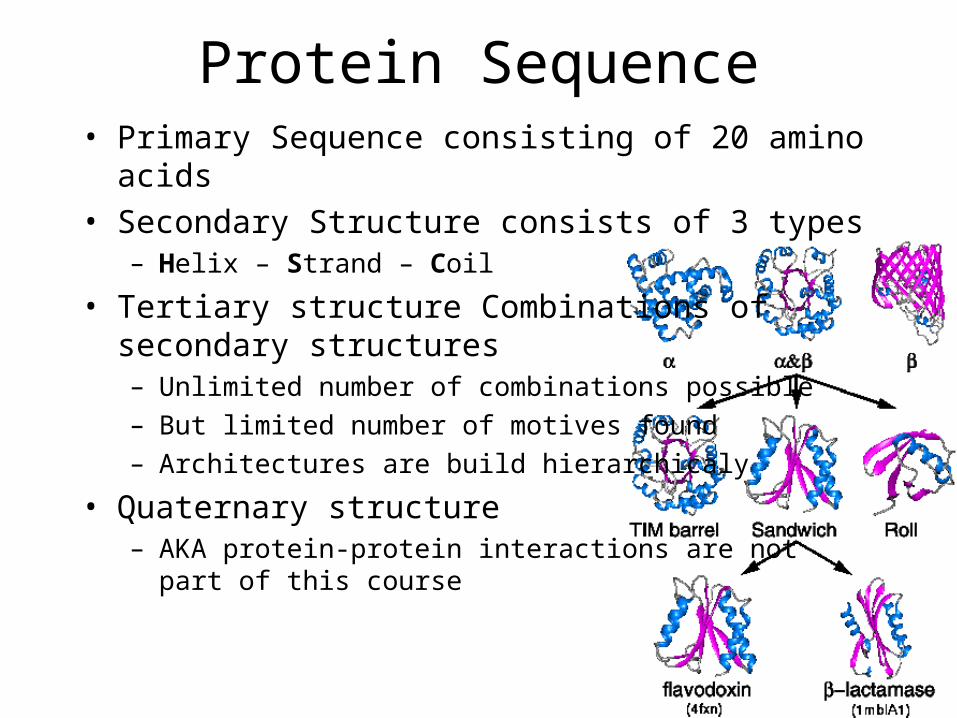
Protein Sequence• Primary Sequence consisting of 20 amino acids
• Secondary Structure consists of 3 types– Helix – Strand – Coil
• Tertiary structure Combinations of secondary structures – Unlimited number of combinations possible
– But limited number of motives found
– Architectures are build hierarchicaly
• Quaternary structure– AKA protein-protein interactions are not
part of this course
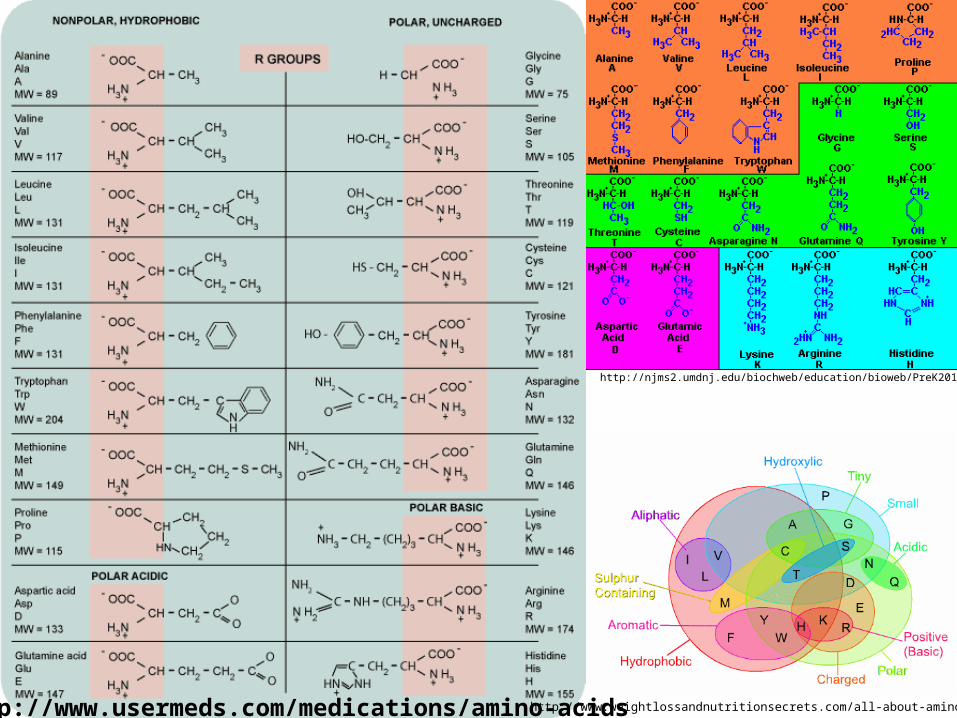
http://www.usermeds.com/medications/amino-acids
http://njms2.umdnj.edu/biochweb/education/bioweb/PreK2010/AminoAcids.htm
http://www.weightlossandnutritionsecrets.com/all-about-amino-acids/
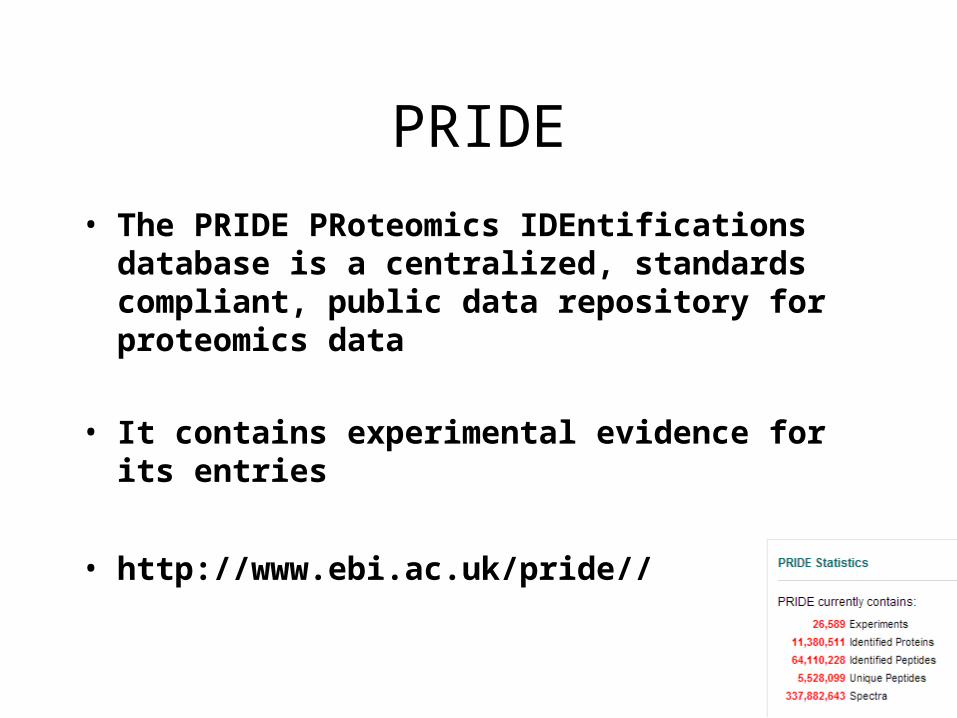
PRIDE
• The PRIDE PRoteomics IDEntifications database is a centralized, standards compliant, public data repository for proteomics data
• It contains experimental evidence for its entries
• http://www.ebi.ac.uk/pride//
Protein Sequences
• Swissprot = UniProtKB– http://www.expasy.ch/sprot
– http://www.ebi.ac.uk/swissprot/
• As in Genebank for nucleotide sequences we need a unique identifier for each protein sequence
• Let’s look at EBI now
UniProtKB
• The Universal Protein Resource (UniProt) is a comprehensive resource for protein sequence and annotation data. (KB: Knowledge Base)
• Often manually reviewed and annotated information
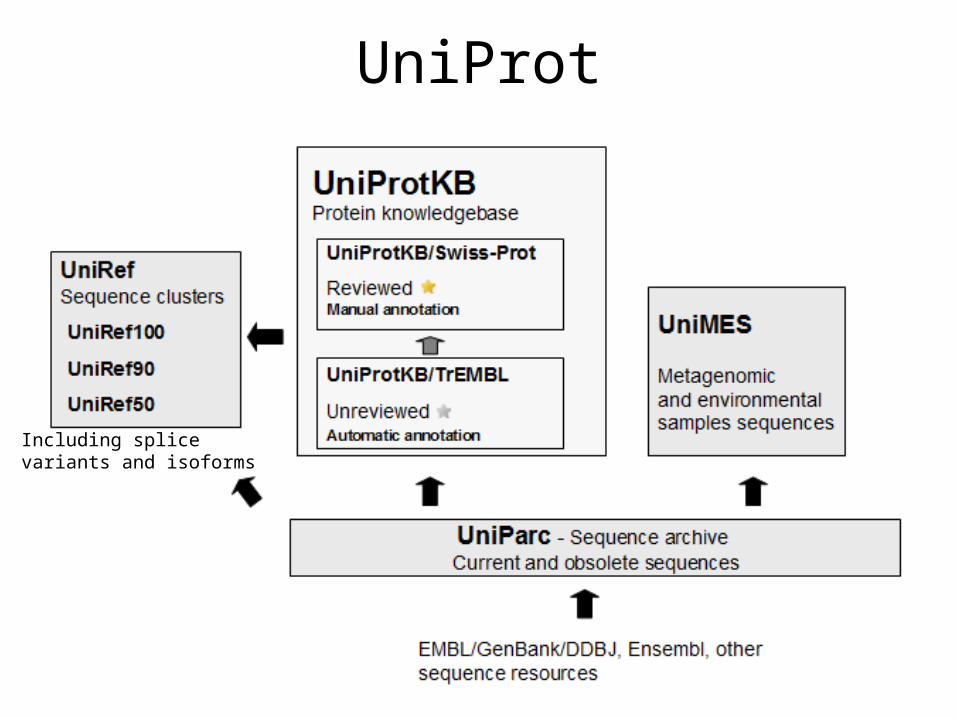
UniProt
Including splicevariants and isoforms
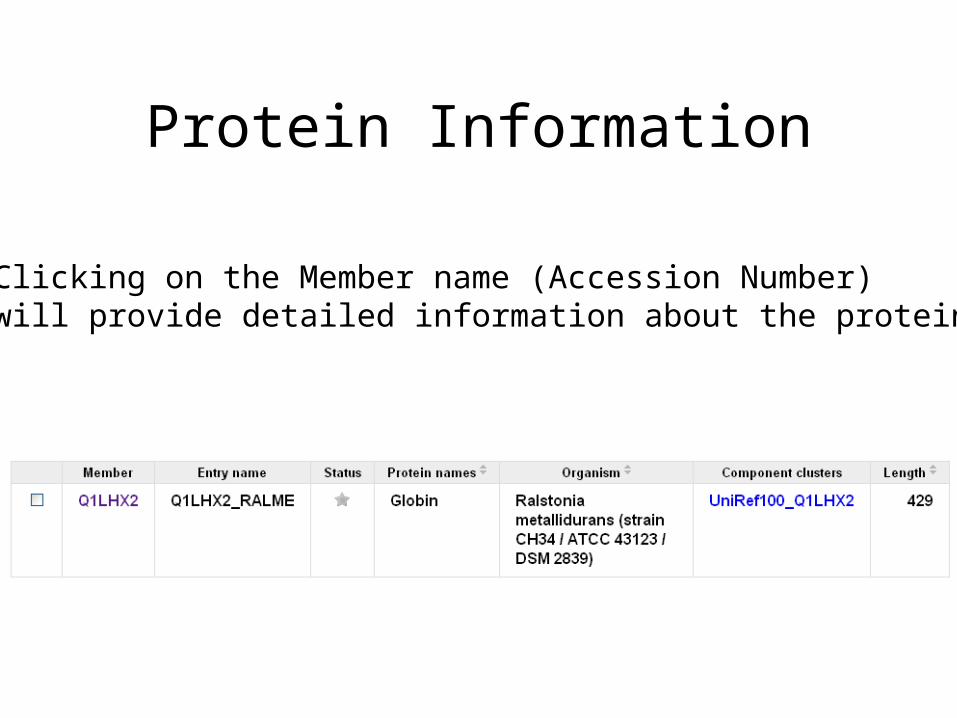
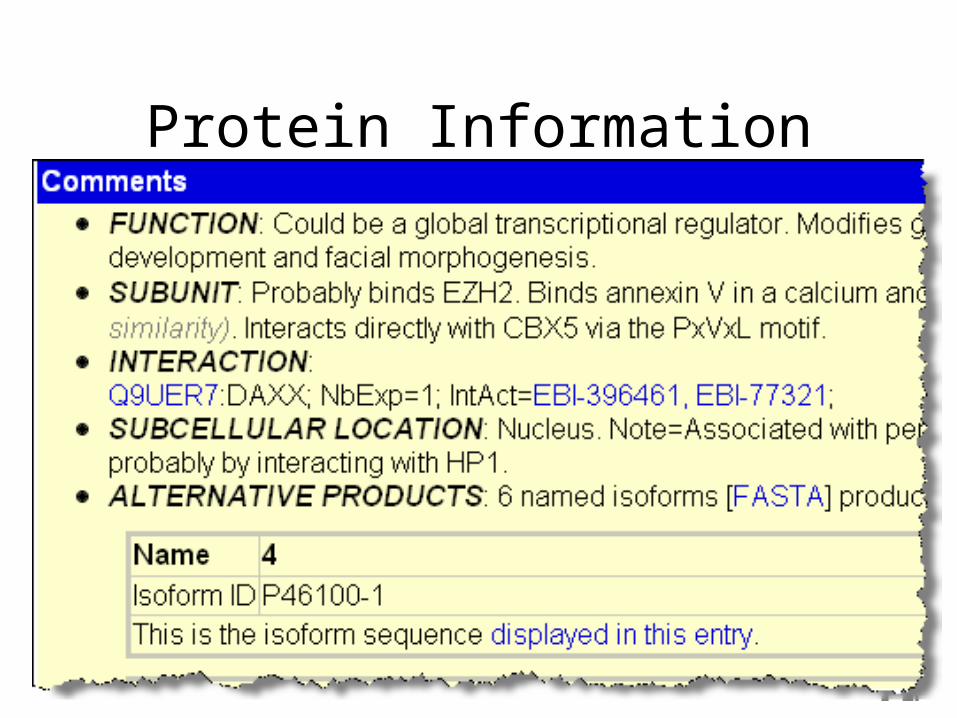
Protein Information
Clicking on the Member name (Accession Number)will provide detailed information about the protein
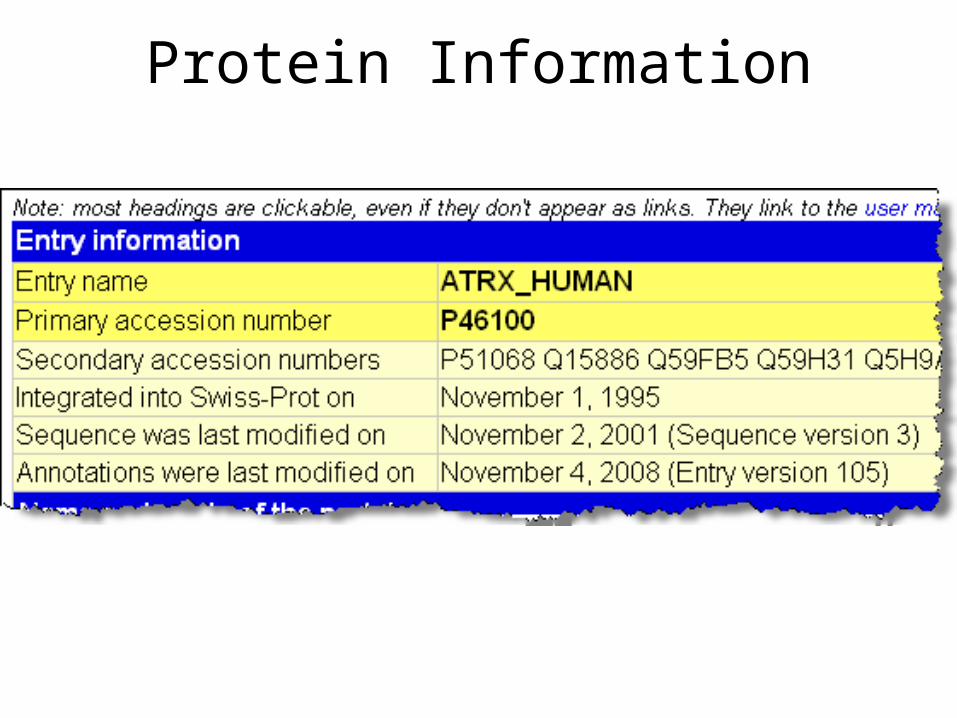
Protein Information
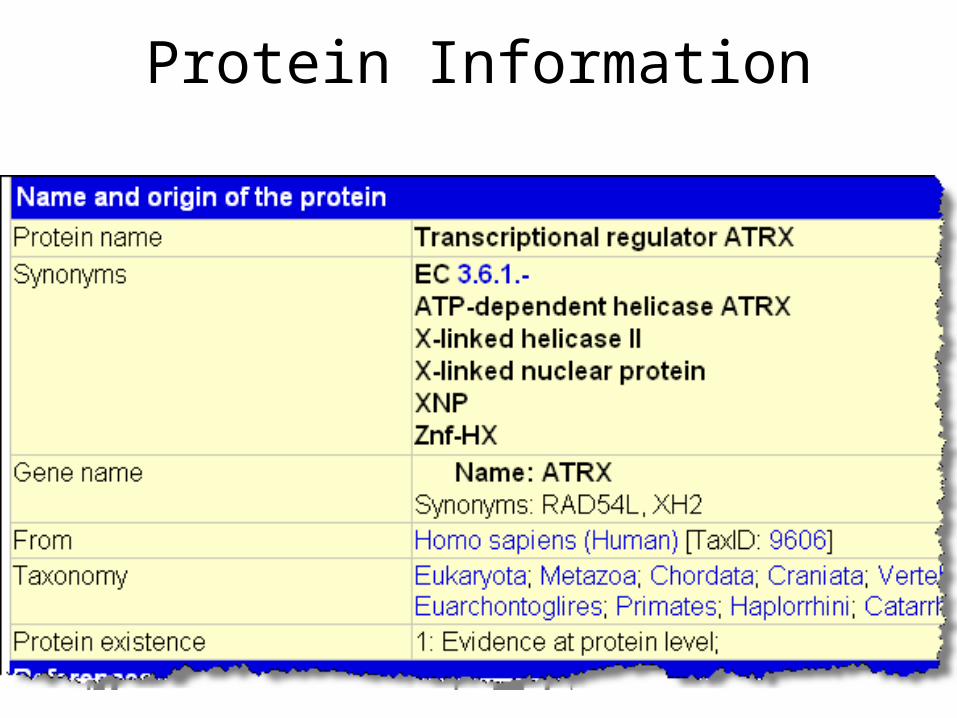
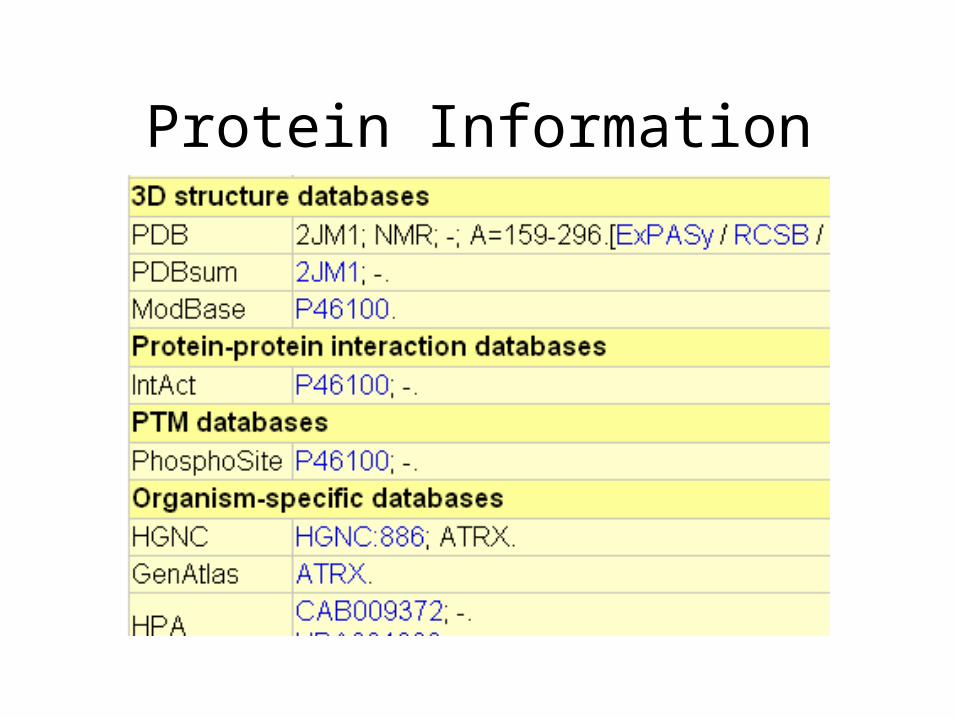
Protein Information
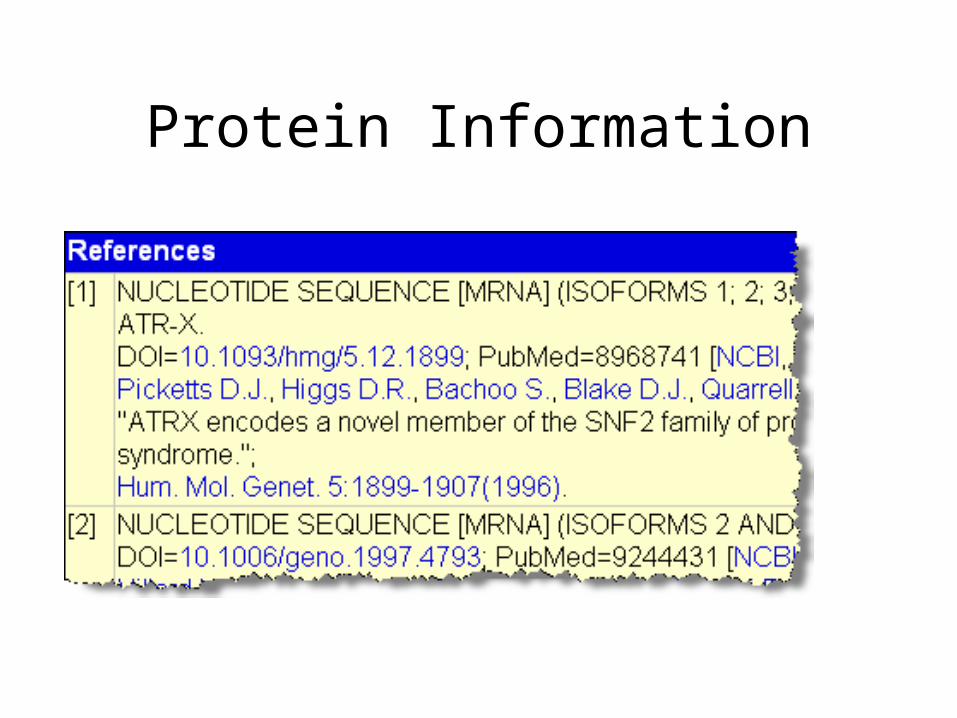
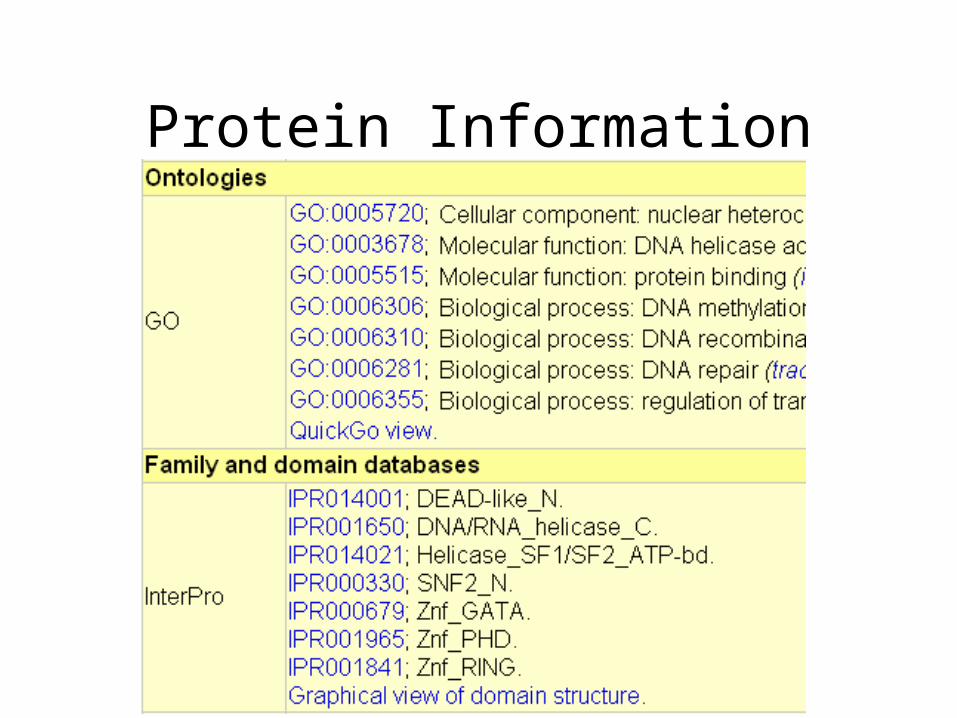
Protein Information
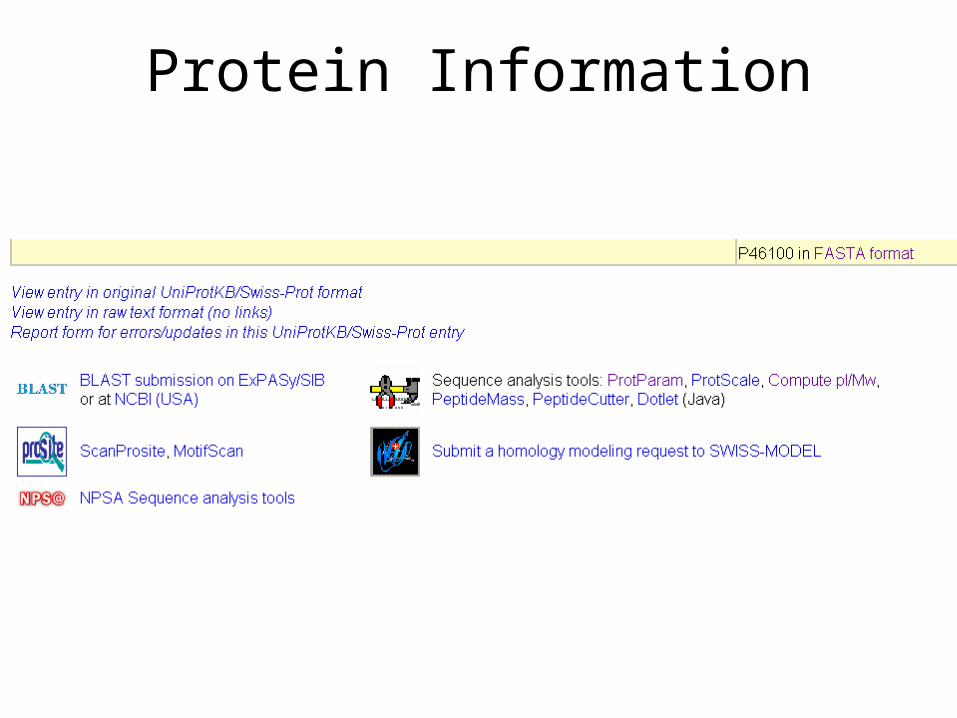
Protein Information
Protein Information
Protein Information
Protein Information
Machine Learning
• For example clustering• UniRef90
• UniRef50
Learning
• Many Facts -> Rules/Knowledge
• Learning = Deducing rules from facts
• Computer/Machine learning?– Same idea
Computer Learning
• Neural Networks
• Support Vector Machines
• Naive Bayes Classifiers
• Self Organizing Maps
• Decision Trees
• And many other algorithms
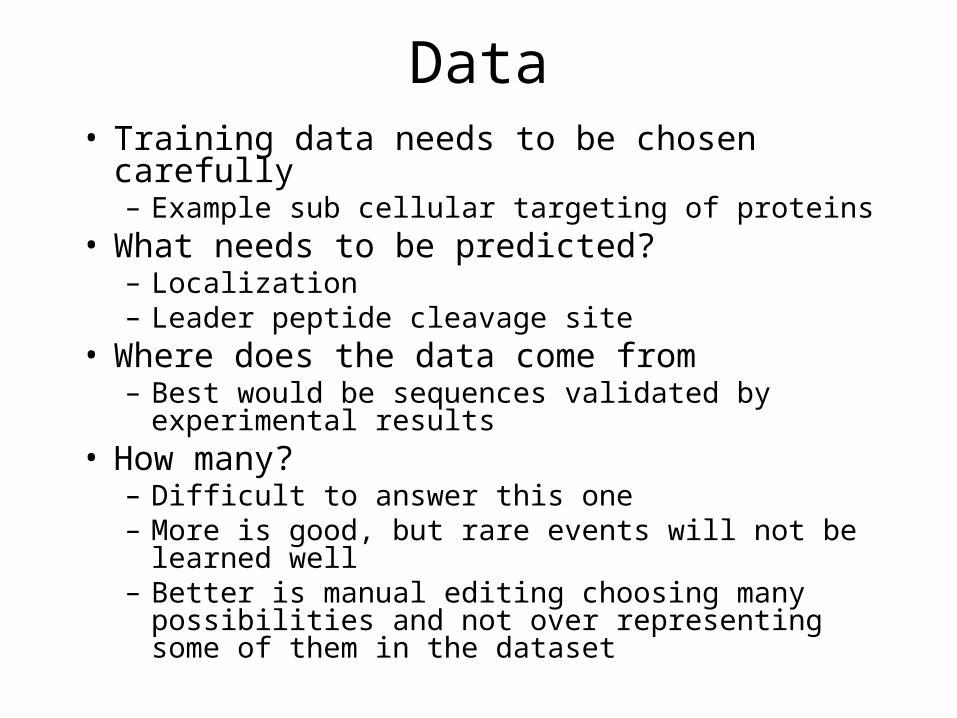
Data• Training data needs to be chosen carefully
– Example sub cellular targeting of proteins• What needs to be predicted?
– Localization– Leader peptide cleavage site
• Where does the data come from– Best would be sequences validated by experimental
results• How many?
– Difficult to answer this one– More is good, but rare events will not be learned well– Better is manual editing choosing many possibilities
and not over representing some of them in the dataset
Data
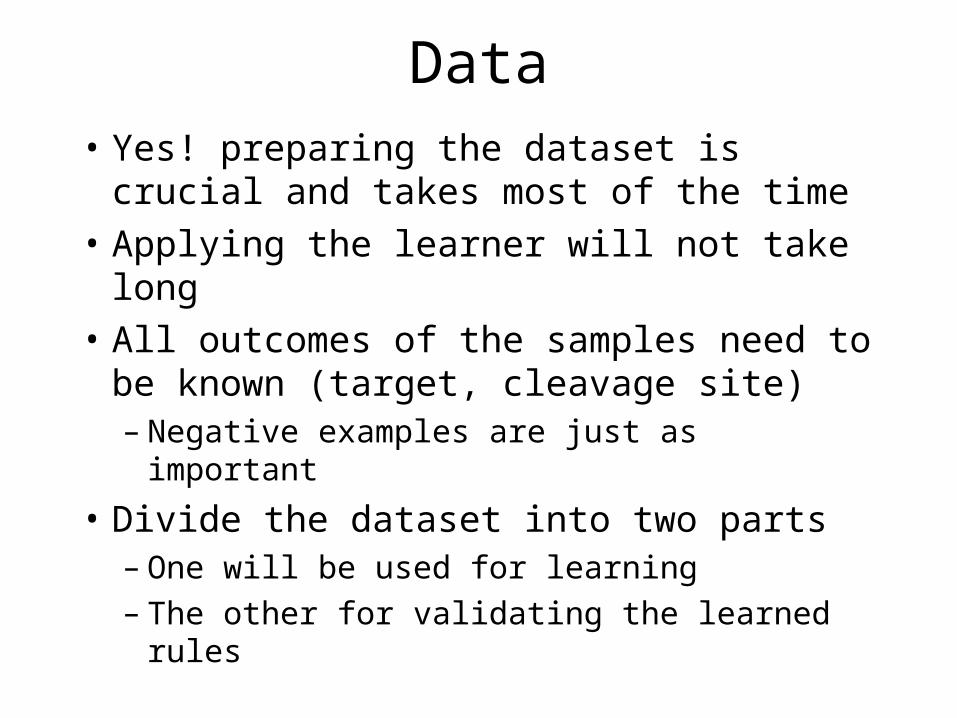
• Yes! preparing the dataset is crucial and takes most of the time
• Applying the learner will not take long
• All outcomes of the samples need to be known (target, cleavage site)– Negative examples are just as important
• Divide the dataset into two parts– One will be used for learning– The other for validating the learned rules
Validation
• The dataset can be automatically divided into different training and validation sets
• This can be performed many times and the best result (rule set) can later be used to predict new sequences
• That’s machine learning in brief
• We just touched the surface of it
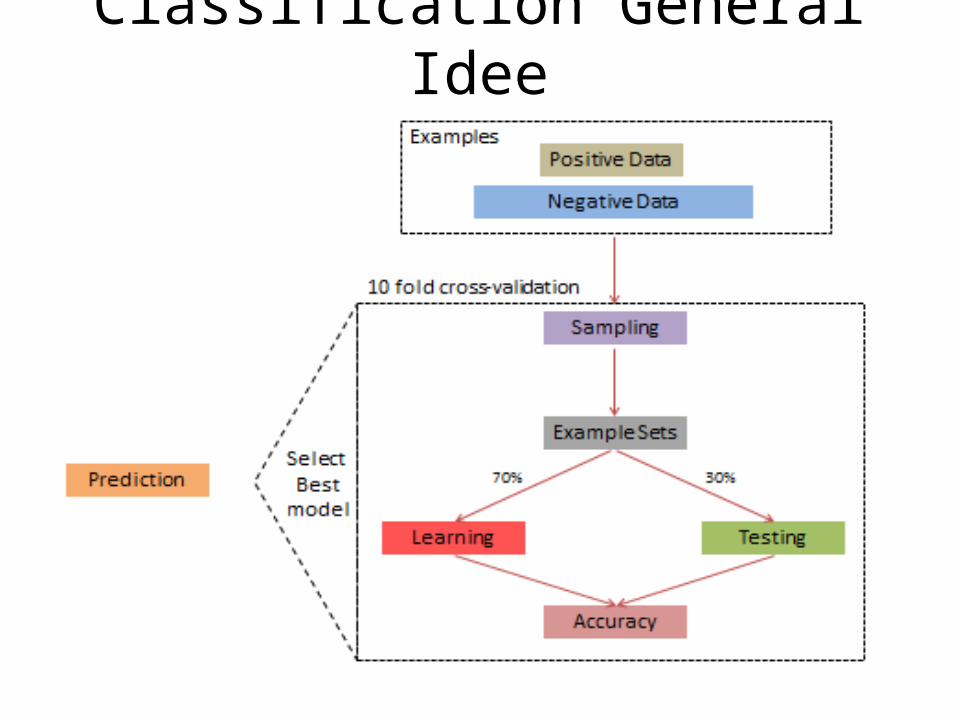
Classification General Idee
Practical Considerations
• You want to predict the sub cellular target of a protein– Which species are you working with?– Which species did the training data come from?– You can try a few known examples
• Read the publication– How precise is the prediction– For localization– For prediction of the leader peptide
• If possible, try different approaches
Clustering (Machine Learning)
• Basically same idea as in MSA – Similar sequences are aligned first– Similar datasets are clustered first
• The initial clusters are combined into super clusters (hierarchical clustering)– Similar to forming a guide tree
• New measurements can be assigned to known clusters – Information can be inferred
Protein Families
• Based on– Clusters of protein sequences– Domains (basically blocks of above)
• Many domains are annotated– Good place to find these is– http://www.ebi.ac.uk/InterProScan

Practice I
Protein Information
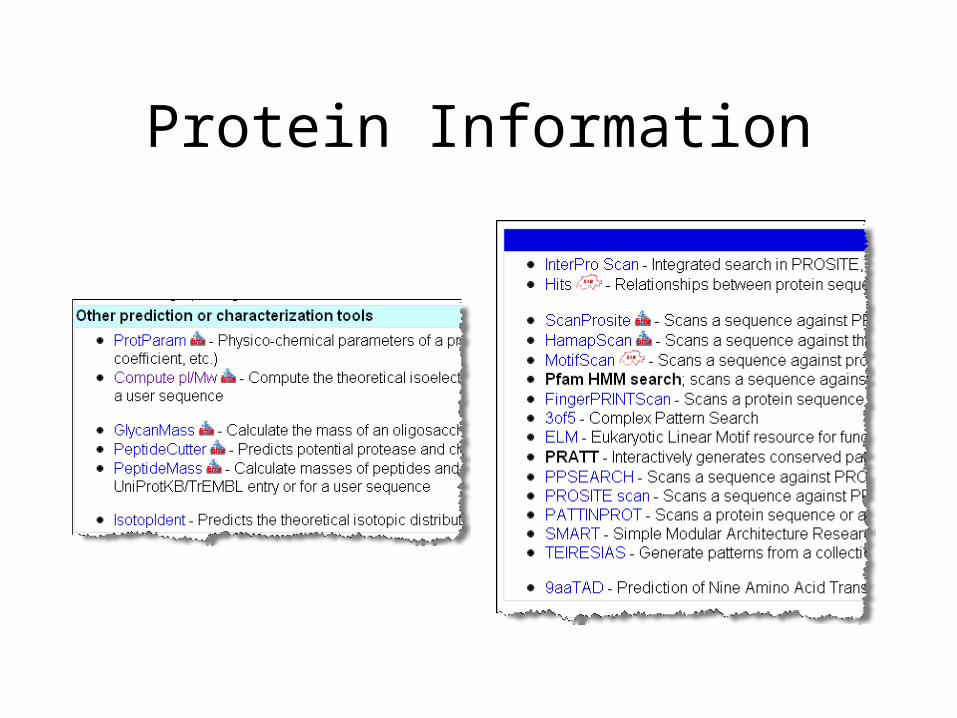
• In many cases we would like to get additional information about a protein– Molecular mass– pI– Subcellular targeting
• http://www.expasy.org/tools– Many calculations, etc for proteins
Tools at Expasy
• Prediction/ Characterizing Tools
• Pattern and Profile searches
• PTM predictions
• Topology Prediction
• Structure– Primary (Analysis) – Secondary (Prediction)– Tertiary (Prediction, Analysis)
• …
Protein Information
Localization
• You want to predict the sub cellular localization of a protein
Let’s tackle this problem
• Get a protein from swissprot– O82533 (Gene: AtFtsZ2-1)
• Annotation: Chloroplast targeting
• Try a few prediction tools to see if you can confirm the annotation
Localization Prediction
• Choose tools from Expasy for example
• ChloroP
• SignalP
• Predotar
Theory II
Substitution Matrices
First Substitution Matrices
Substitution Matrices
Sequence relationships may be hidden by changes in sequenceMutations
Evolution
Approximate matches are needed
Selectionist Model
Some mutations are neutralNot disturbing the function much
Not disturbing the structure much
These accumulate over time (evolution)
Some mutations are disruptiveL <> Q
Frameshift insertions or deletions
More elaborate Matrices
FormatTable 20 X 20Probability of change for each combinationSymmetric190 distinct entries + 20
ExamplesUnitaryGCMBLOSUMPAM
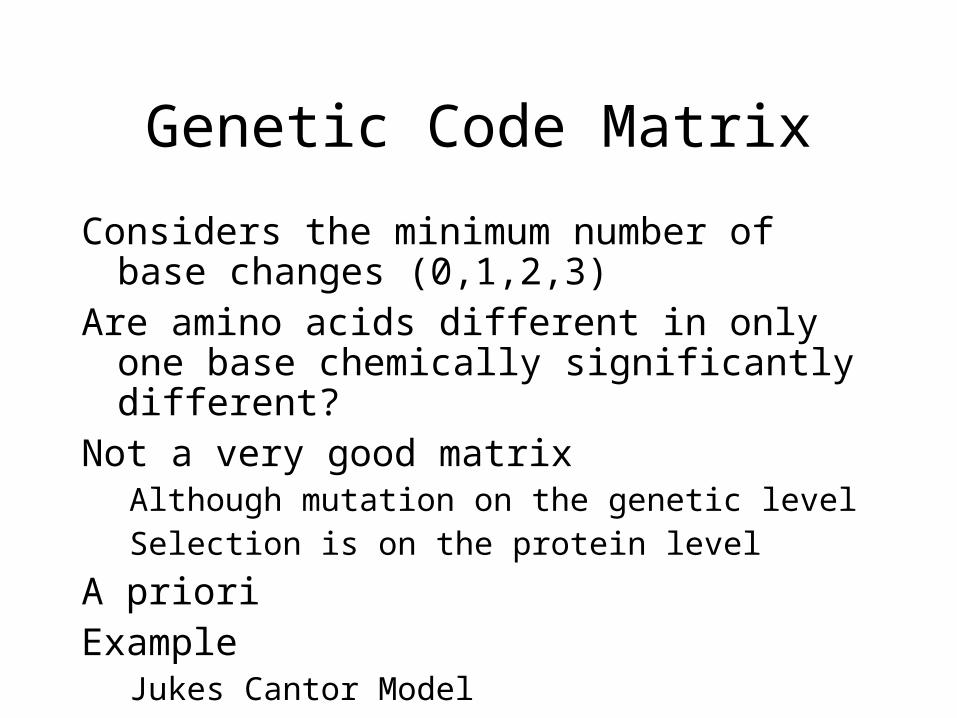
Genetic Code Matrix
Considers the minimum number of base changes (0,1,2,3)
Are amino acids different in only one base chemically significantly different?
Not a very good matrixAlthough mutation on the genetic levelSelection is on the protein level
A prioriExample
Jukes Cantor Model
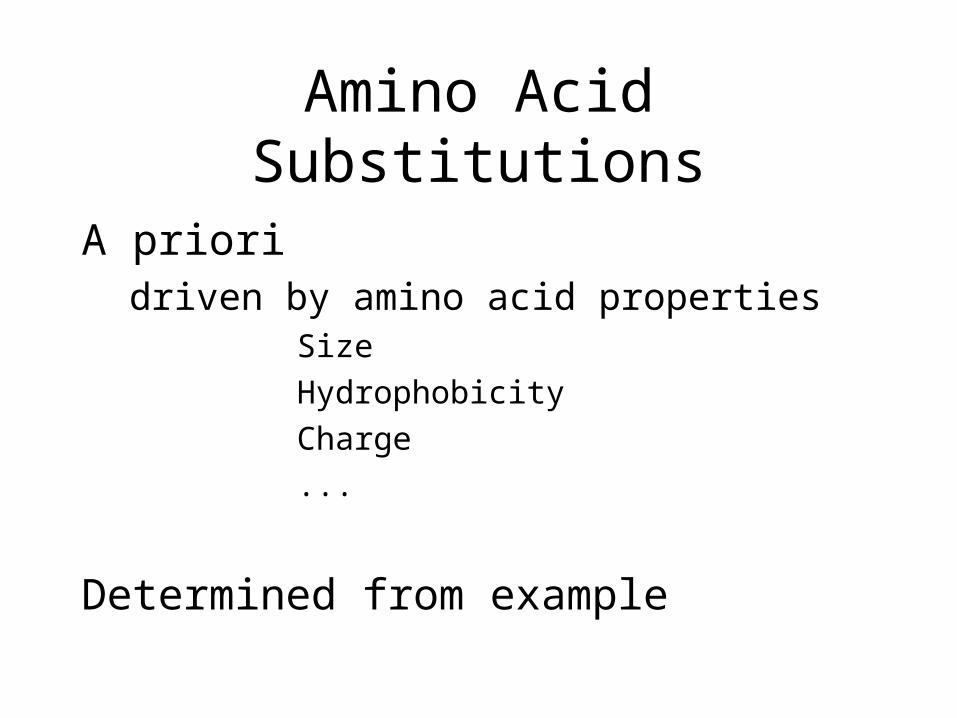
Amino Acid Substitutions
A prioridriven by amino acid properties
Size
Hydrophobicity
Charge
...
Determined from example
http://www.cs.iastate.edu/~cs544/Lectures/PAM_matrices.ppt
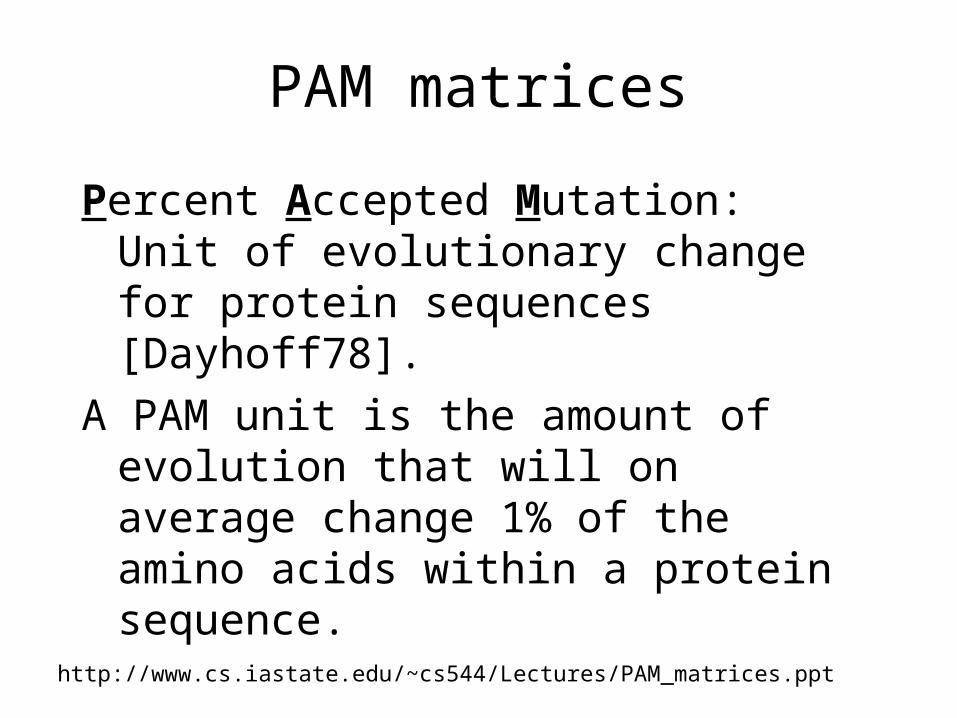
PAM matrices
Percent Accepted Mutation: Unit of evolutionary change for protein sequences [Dayhoff78].
A PAM unit is the amount of evolution that will on average change 1% of the amino acids within a protein sequence.
http://www.cs.iastate.edu/~cs544/Lectures/PAM_matrices.ppt
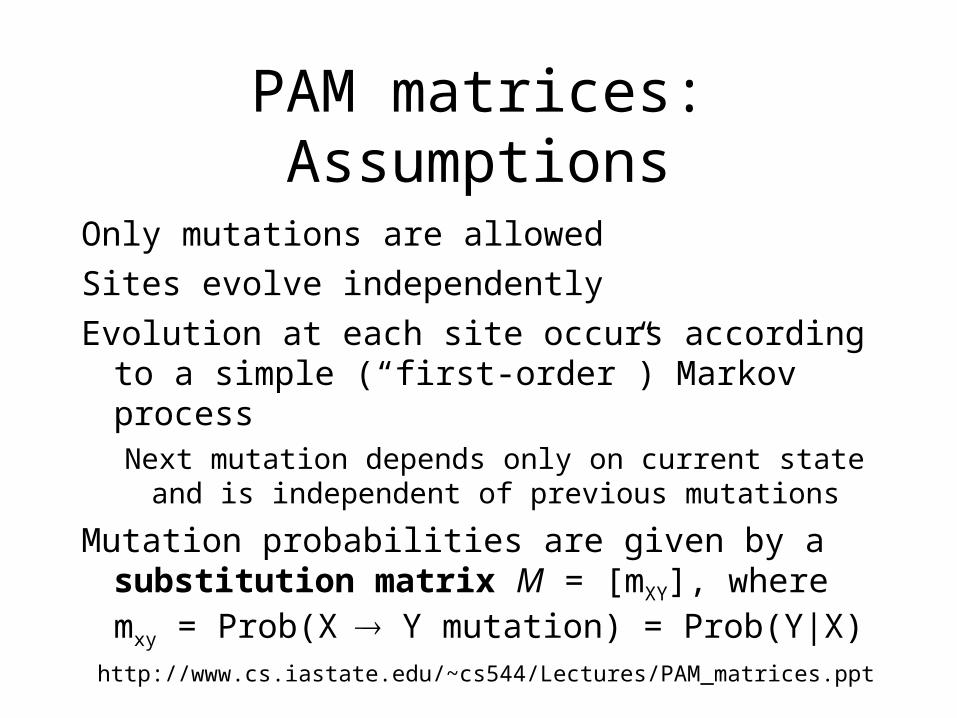
PAM matrices: Assumptions
Only mutations are allowed
Sites evolve independently
Evolution at each site occurs according to a simple (“first-order”) Markov processNext mutation depends only on current state and is
independent of previous mutations
Mutation probabilities are given by a substitution matrix M = [mXY], where mxy = Prob(X Y mutation) = Prob(Y|X)
http://www.cs.iastate.edu/~cs544/Lectures/PAM_matrices.ppt
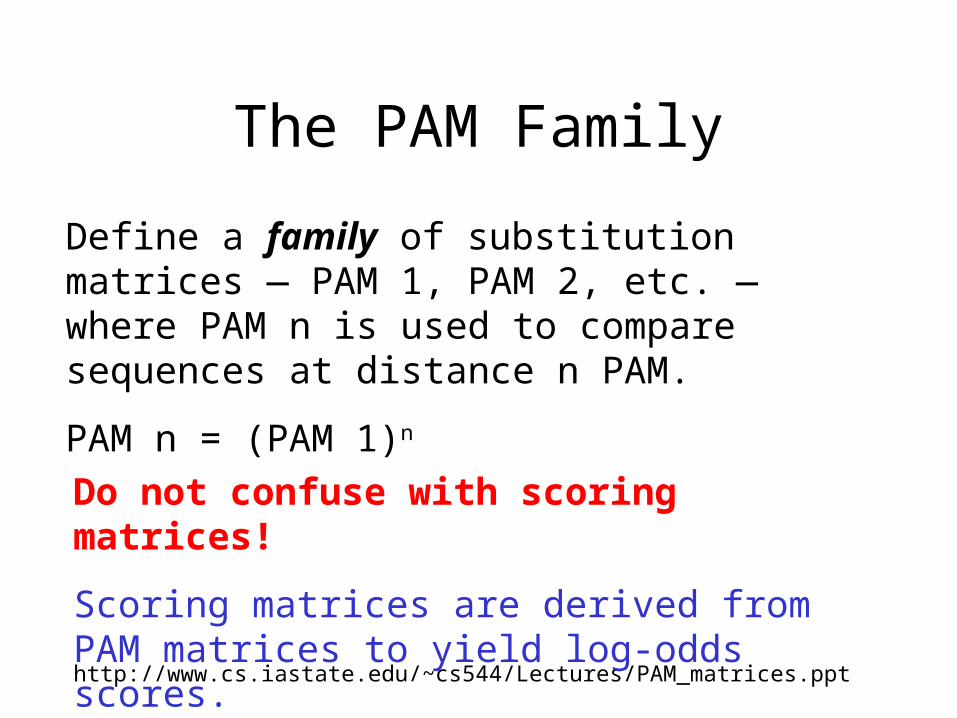
The PAM Family
Define a family of substitution matrices — PAM 1, PAM 2, etc. — where PAM n is used to compare sequences at distance n PAM.
PAM n = (PAM 1)n
Do not confuse with scoring matrices!
Scoring matrices are derived from PAM matrices to yield log-odds scores.
http://www.cs.iastate.edu/~cs544/Lectures/PAM_matrices.ppt
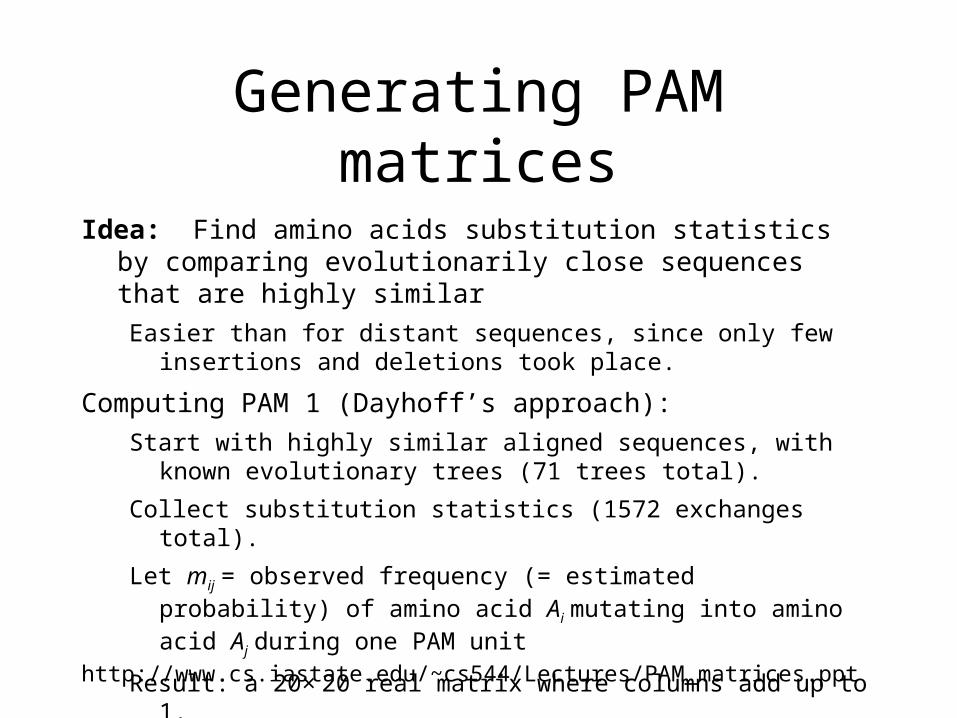
Generating PAM matrices
Idea: Find amino acids substitution statistics by comparing evolutionarily close sequences that are highly similar
Easier than for distant sequences, since only few insertions and deletions took place.
Computing PAM 1 (Dayhoff’s approach):
Start with highly similar aligned sequences, with known evolutionary trees (71 trees total).
Collect substitution statistics (1572 exchanges total).
Let mij = observed frequency (= estimated probability) of amino acid Ai mutating into amino acid Aj during one PAM unit
Result: a 20× 20 real matrix where columns add up to 1.
http://www.cs.iastate.edu/~cs544/Lectures/PAM_matrices.ppt
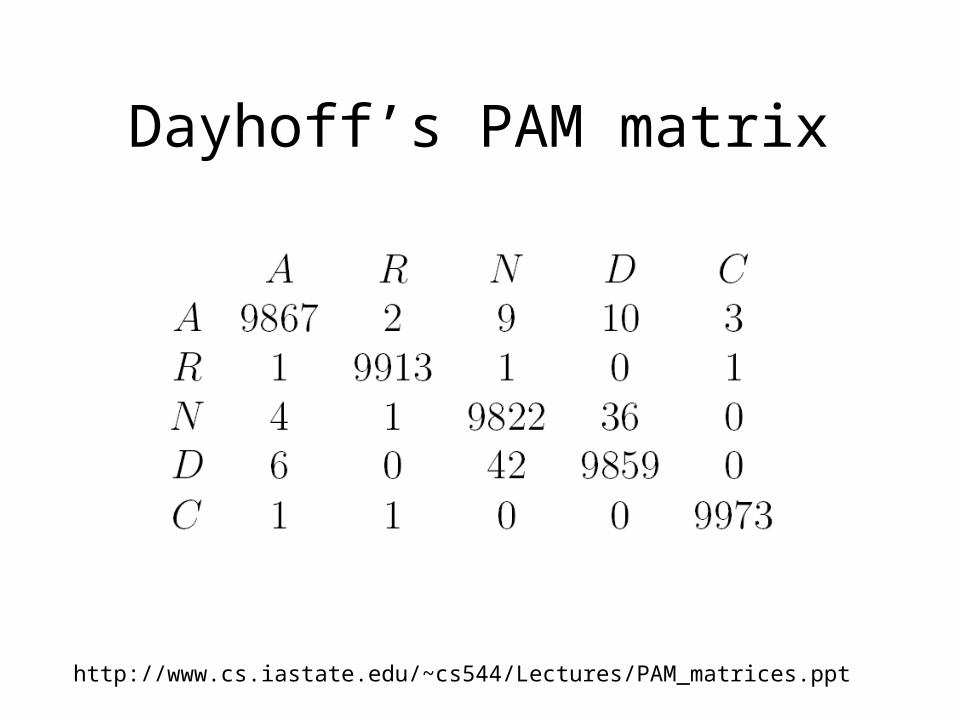
Dayhoff’s PAM matrix
All entries 104

Calculate a substitution frequency matrix
A
A MV
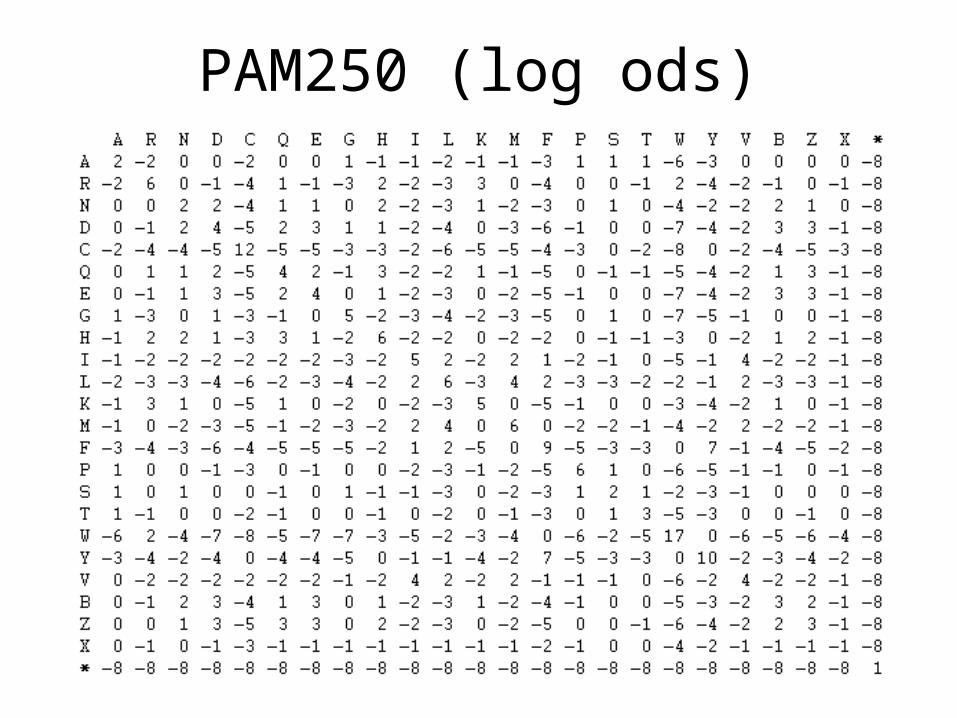
PAM250 (log ods)
http://www.cs.iastate.edu/~cs544/Lectures/BLOSUM_matrices.ppt
BLOSUM matrices
Blocks Substitution Matrix. Scores for each position are obtained frequencies of substitutions in blocks of local alignments of protein sequences [Henikoff & Henikoff92].
For example BLOSUM62 is derived from sequence alignments with no more than 62% identity.
http://www.cs.iastate.edu/~cs544/Lectures/BLOSUM_matrices.ppt
BLOSUM Scoring Matrices
BLOck SUbstitution Matrix
Based on comparisons of blocks of sequences derived from the Blocks database
The Blocks database contains multiply aligned ungapped segments corresponding to the most highly conserved regions of proteins (local alignment versus global alignment)
BLOSUM matrices are derived from blocks whose alignment corresponds to the BLOSUM-,matrix number
http://www.cs.iastate.edu/~cs544/Lectures/BLOSUM_matrices.ppt
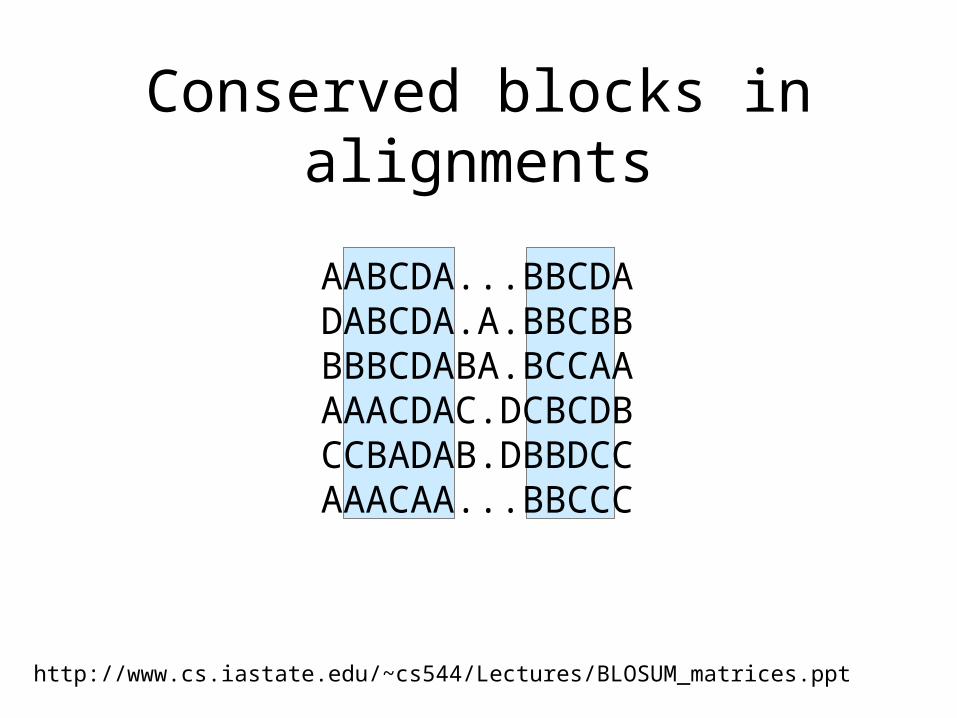
AABCDA...BBCDADABCDA.A.BBCBBBBBCDABA.BCCAAAAACDAC.DCBCDBCCBADAB.DBBDCCAAACAA...BBCCC
Conserved blocks in alignments
http://www.cs.iastate.edu/~cs544/Lectures/BLOSUM_matrices.ppt
Constructing BLOSUM r
To avoid bias in favor of a certain protein, first eliminate sequences that are more than r% identical
The elimination is done by either removing sequences from the block, or finding a cluster of similar sequences and replacing it by a new
sequence that represents the cluster.
BLOSUM r is the matrix built from blocks with no more the r% of similarityE.g., BLOSUM62 is the matrix built using sequences with no more
than 62% similarity.Note: BLOSUM 62 is the default matrix for protein BLAST
http://www.cs.iastate.edu/~cs544/Lectures/BLOSUM_matrices.ppt
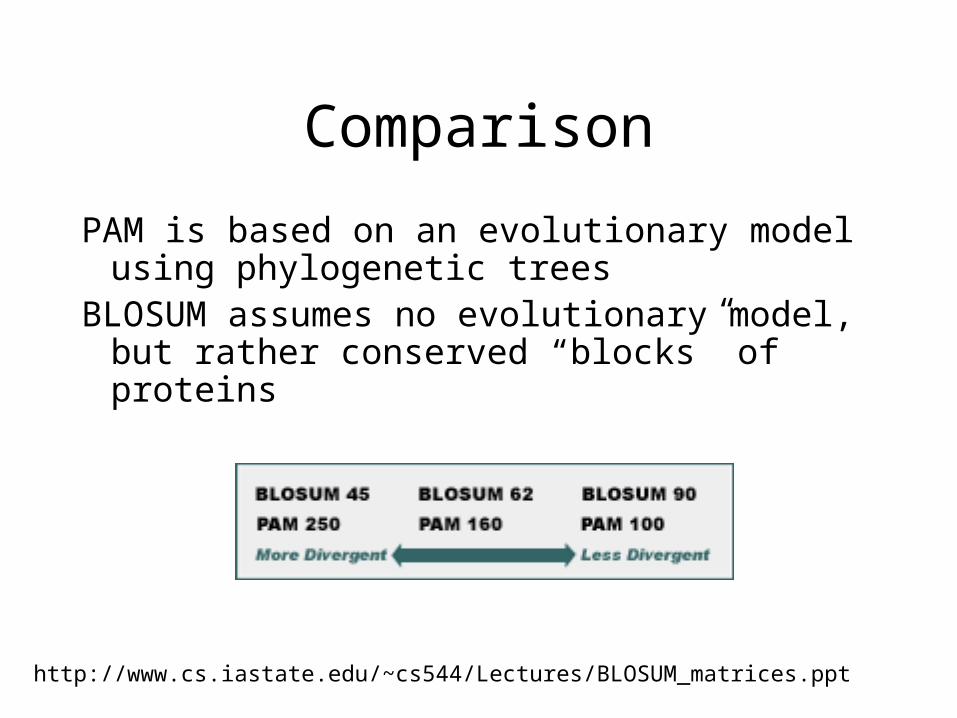
Comparison
PAM is based on an evolutionary model using phylogenetic trees
BLOSUM assumes no evolutionary model, but rather conserved “blocks” of proteins
http://www.cs.iastate.edu/~cs544/Lectures/BLOSUM_matrices.ppt
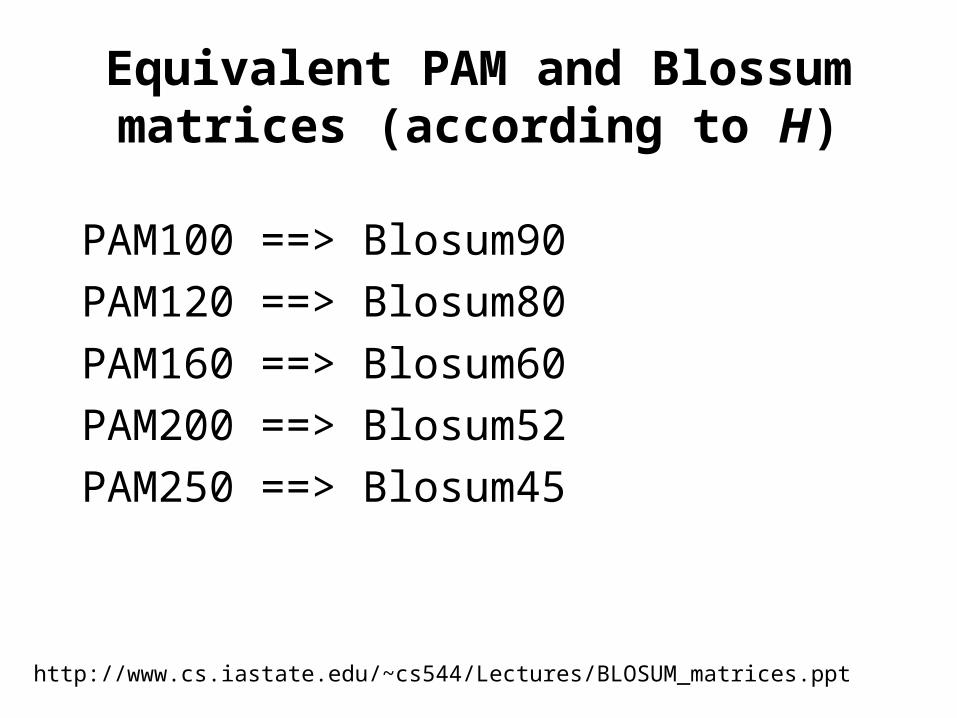
Equivalent PAM and Blossum matrices (according to H)
PAM100 ==> Blosum90
PAM120 ==> Blosum80
PAM160 ==> Blosum60
PAM200 ==> Blosum52
PAM250 ==> Blosum45
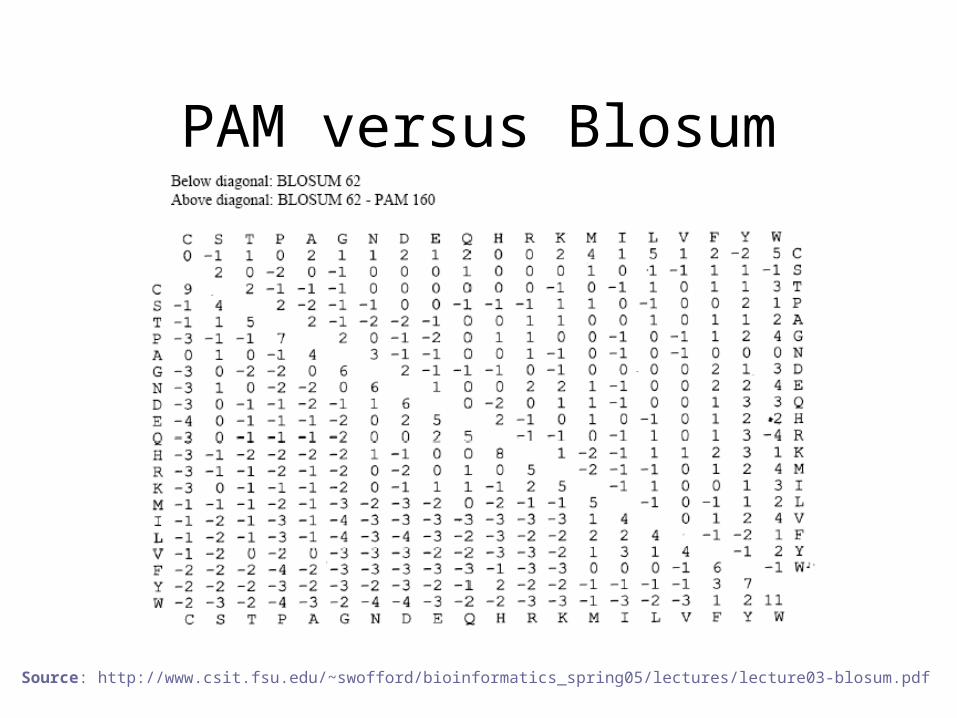
PAM versus Blosum
Source: http://www.csit.fsu.edu/~swofford/bioinformatics_spring05/lectures/lecture03-blosum.pdf

Practice II
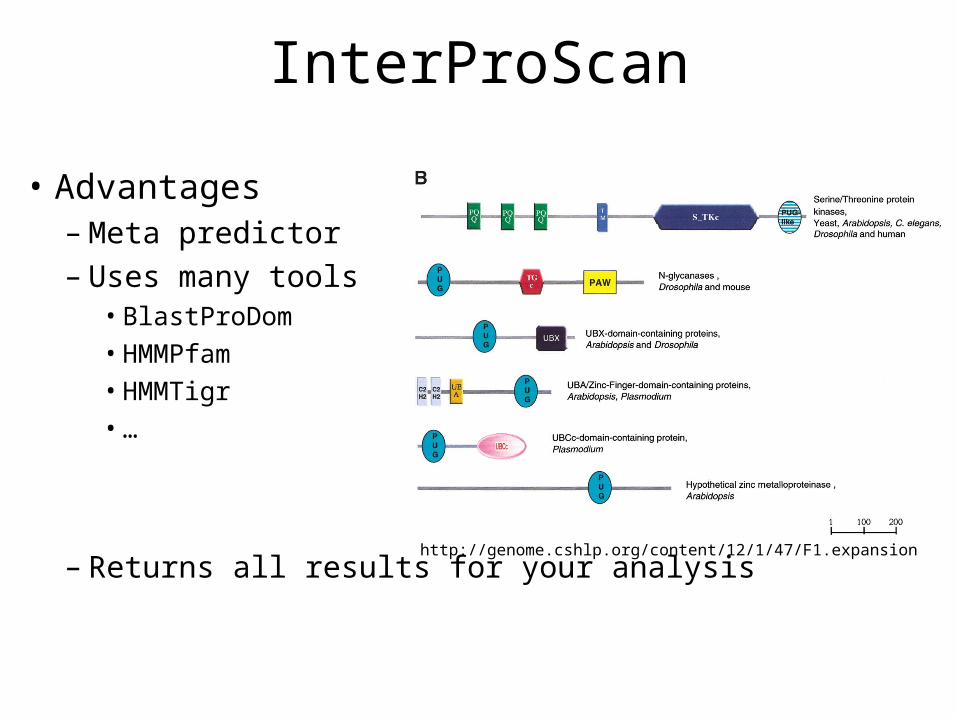
InterProScan
• Advantages– Meta predictor– Uses many tools
• BlastProDom• HMMPfam• HMMTigr• …
– Returns all results for your analysishttp://genome.cshlp.org/content/12/1/47/F1.expansion
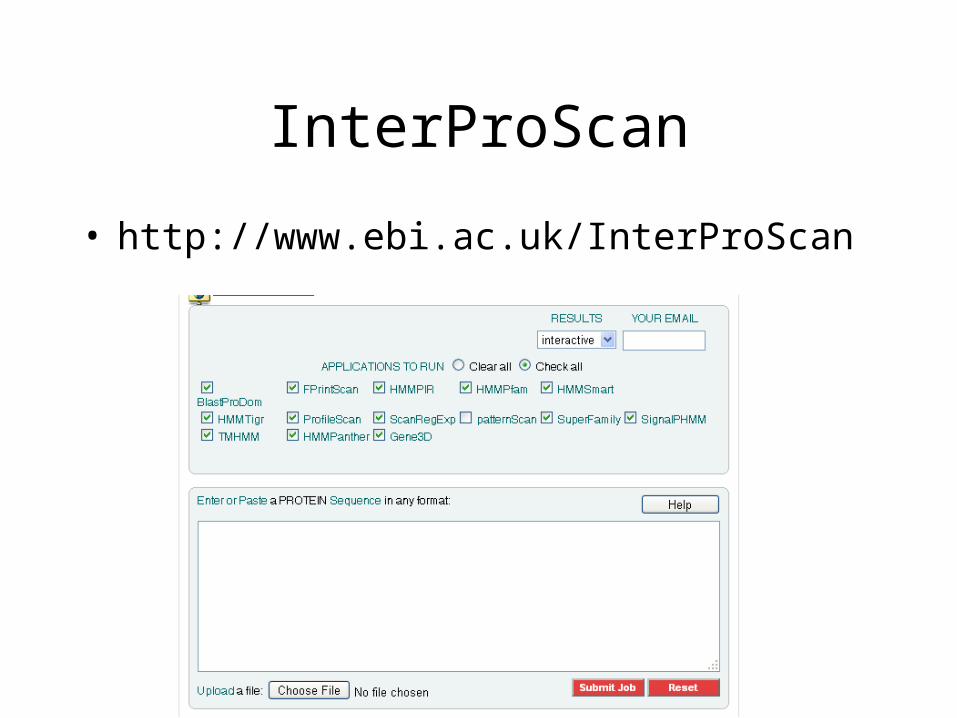
InterProScan
• http://www.ebi.ac.uk/InterProScan
Which Sequence
• Go to swissprot
• Select a sequence of interest– E.g.: a translocase– Should have some annotated function
• Paste the FASTA sequence
• Run InterProScan
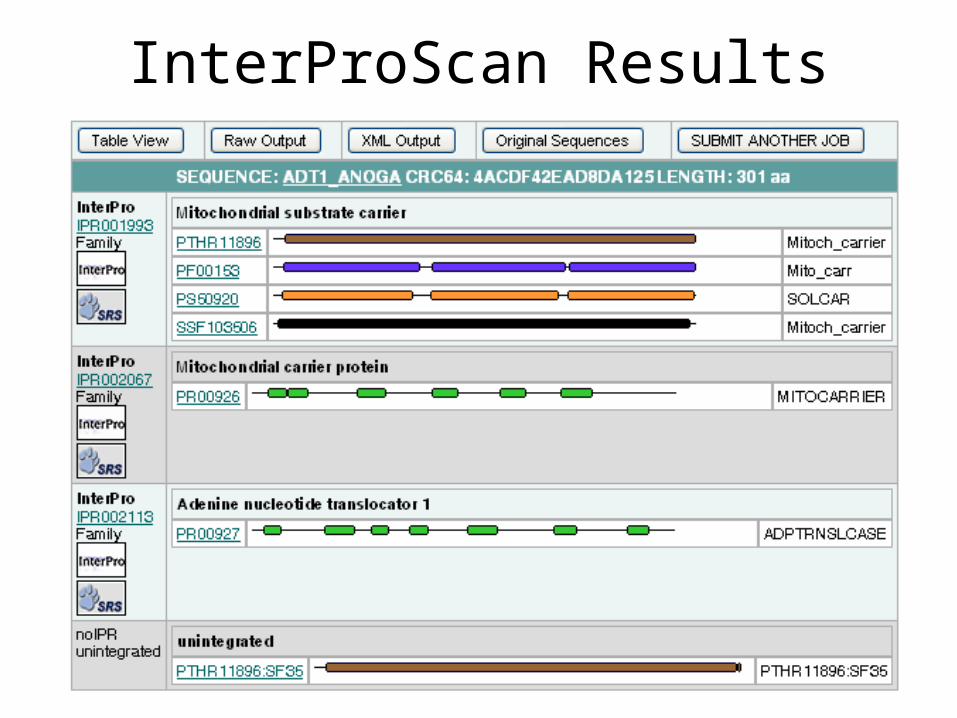
InterProScan Results
So?
• First glance– The colored highlights over the sequence are
domains– The more the merrier– None? New protein? Be happy!
• Boxes refer to a record in InterPro database
• The IPR… link summarizes the results
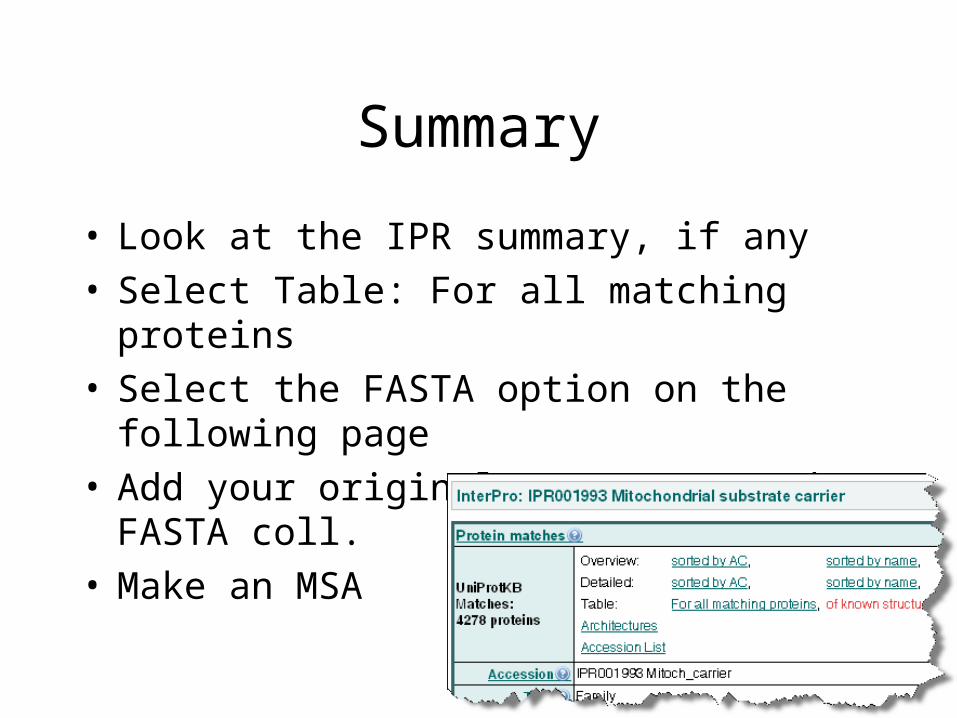
Summary
• Look at the IPR summary, if any• Select Table: For all matching proteins• Select the FASTA option on the following page• Add your original sequence to the FASTA coll.• Make an MSA
Protein Domains
• Use the same sequence– Do the same analysis using NCBI CD server– http://www.ncbi.nlm.nih.gov/Structure/cdd/
wrpsb.cgi
• NCBI may have domains that InterScanPro doesn’t have and vice versa
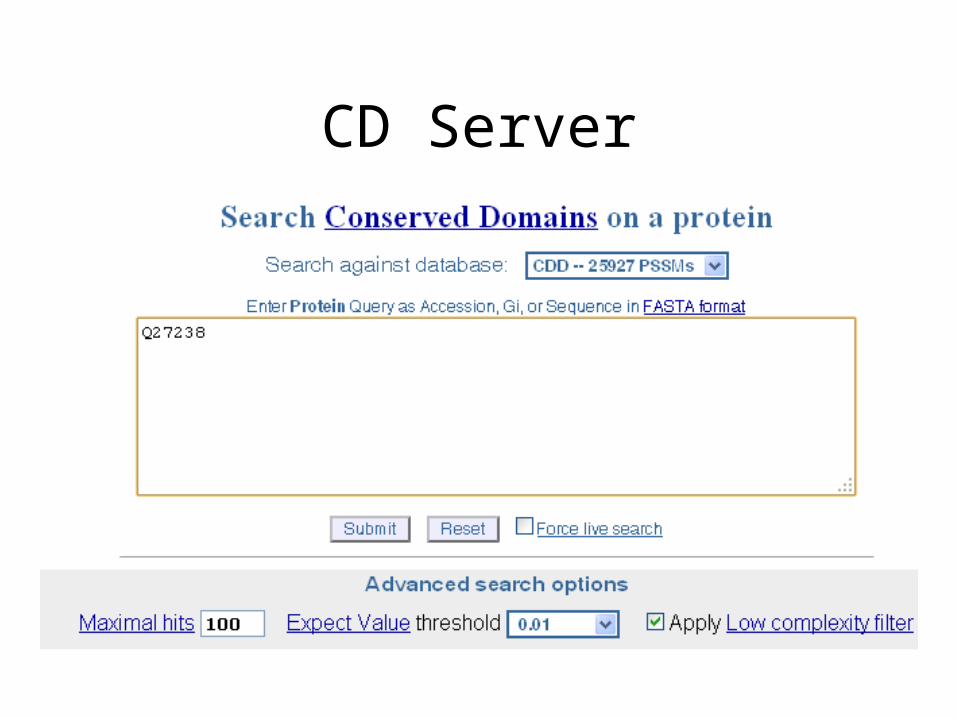
CD Server
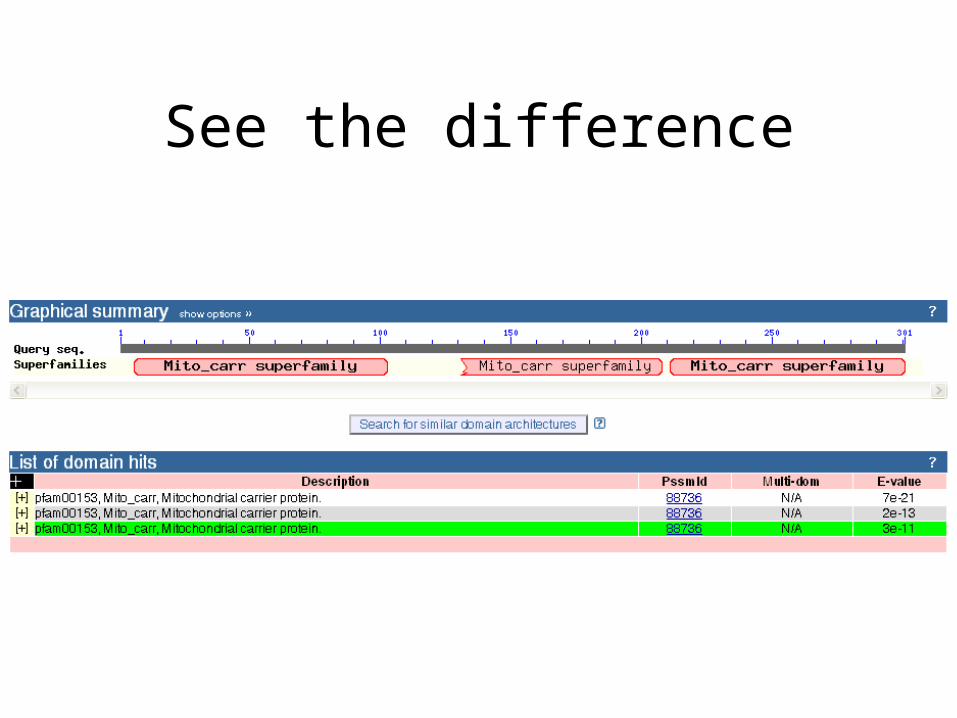
See the difference
More to test
• http://www.expasy.org/tools/#pattern– Try
• Hits
• HamapScan
• SMART
• ScanProsite (if time allows)
![Protein Domains - uni-hamburg.de · •3 domains •each similar to some different protein Andrew Torda 12/11/2015 [ 8 ] •appears as if modules are mixed together •should be visible](https://img.pdfslide.us/doc/110x75/605a854aea19c5290020a2ac/protein-domains-uni-a3-domains-aeach-similar-to-some-different-protein-andrew.jpg)