Embed Size (px)
Citation preview

Applications of IRT/Rasch Measurement in Substance
Abuse Treatment
Beverly Pringle, National Institute on Drug Abuse
Ken Conrad,School of Public Health,
University of Illinois at ChicagoMichael Dennis,
Chestnut Health Systems,Bloomington, IL

Three Parts Of This Workshop
1. The Need to Improve Measurement in Health Services Research Related to Substance Abuse Treatment (Beverly Pringle)
2. The Basics of Rasch (Kendon Conrad)
3. Example: Validation of DSM-IV Substance Use Disorder by Substance and Age Using Rasch (Michael Dennis)

Part 1. The Need to Improve Measurement in Health Services Research Related
to Substance Abuse TreatmentBeverly Pringle, National Institute on Drug Abuse

What is the Problem?
“There is a pressing need to better quantify clinically important symptoms and outcomes, including pain, fatigue, and quality of life...”
Zerhouni, 2003

Measurement Science and Substance Abuse
Need to better quantify over the life course:
• Symptoms (hazardous use, severity)
• Diagnoses (abuse, dependence, disorder)
• Outcomes (recovery, quality of life)

NIDA should…
• Support the development and refinement of methods to address critical treatment intervention questions.
• Provide technical assistance and funding to develop methodologies for conducting research.
Blue Ribbon Task Force

What is Measurement?
“The value of a reading taken of a phenomenon”
- University of Leicester Statistical Glossary
“The process of creating a correspondence between a concept and data in specifying that concept”
- Northern Arizona University
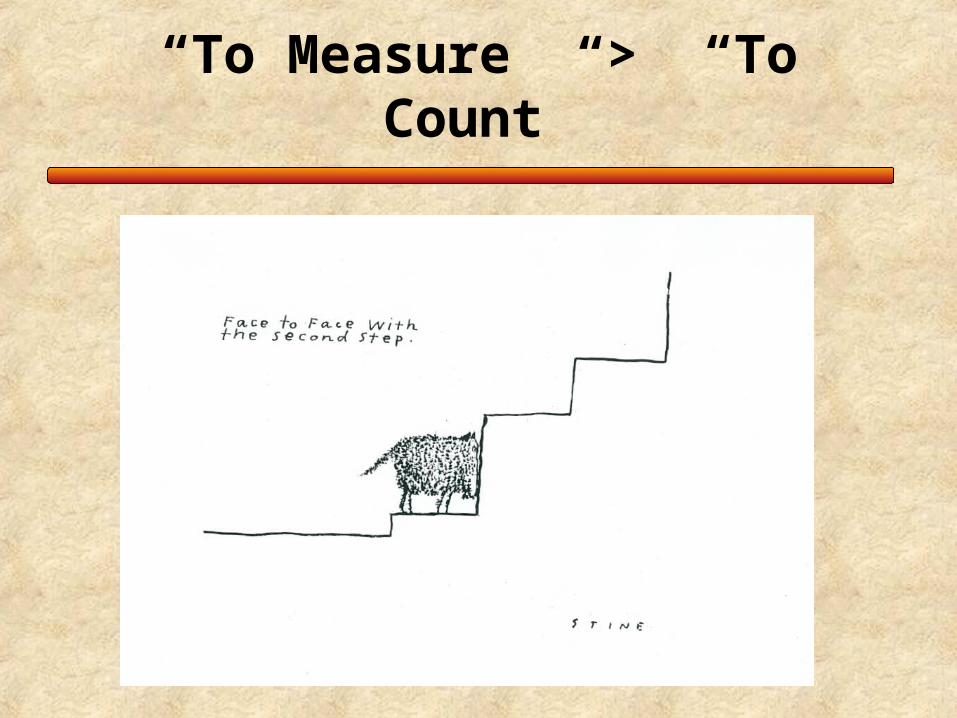
“To Measure” > “To Count”

Why Now?
• Field of measurement has grown tremendously over past 15 years.
• New technologies facilitate: – Clinical assessment – Item development– Measurement calculations– Data analysis
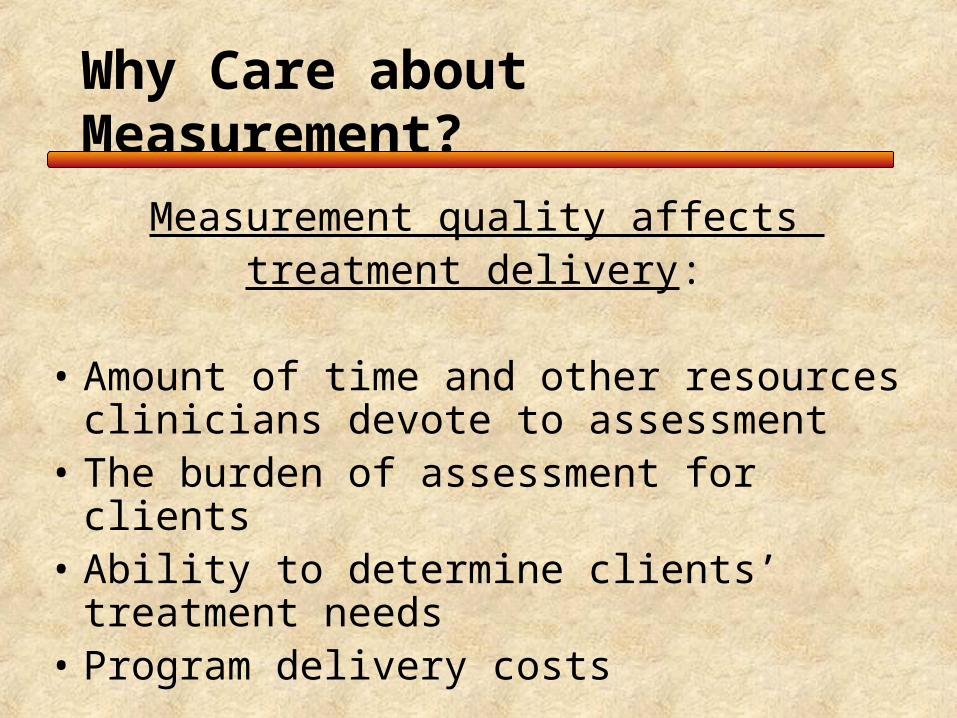
Why Care about Measurement?
Measurement quality affects treatment delivery:
• Amount of time and other resources clinicians devote to assessment
• The burden of assessment for clients• Ability to determine clients’ treatment needs • Program delivery costs

Why Care about Measurement?
Measurement quality affects research:
• How well we measure what we are interested in
• Whether our classifications are meaningful • Whether we find important differences that
exist• How well we understand concepts like
health disparities

And now…
Part 2. The Basics of Rasch
Kendon Conrad, University of Illinois at Chicago

Outline
• Differences between traditional/classical test theory and IRT/Rasch measurement
• Why and how Rasch analysis seeks to create linear, interval measures
• Evaluating Differential Item Functioning
• Evaluating Differential Test Functioning
• Facets analysis across multiple factors

Classical Testing Theory (CTT) assumes all items are created equal
But we know that is not true. Is that how we measure potatoes? How about spelling? Items actually range from: Easy->hard
Like addition -> division
E.g., Guttman: 1111100000
Lack of recent practice on item 5: 1111011000
Educated guess on item 8: 1111100100
Slow, nervous start: 0111111000

Requirements for Measurement
• Test items are the operational definition of the underlying trait.
• Test items can be ordered from easy to hard like increasing height for high jumping.
• The Rasch model expects:
1 1 1 1 1 1 1 0 1 0 1 0 1 0 0 0 0 0 0 0
• Test takers can be ordered from less able to more able.

Sample Free Measures
Interval measures are not sample dependent. Children high jumping is analogous to the Rasch method. – A height of 2’ does not change– So we can define ability using that stable
standard. – The children can then be defined in terms of
their jumping ability using that standard. – Actually, every child can be placed
quite exactly and reliably at their ability level on the interval heightmeasure. It’s the point where their chance of getting over is 50/50.

Measuring Attributes
To measure an attribute, we:• Bring to the fore the idea of the variable
we want to measure• Determine what observations it will be
useful to consider as informative manifestations of that variable
• Construct agents, write items, intended to elicit singular instances of this “made-to-be” unidimensional “ability” variable.
• These items are the “bars” that subjects try to “jump”. They enable us to home in on the person’s level on the construct.

How Scores Depend on the Difficulty of Test Items
Very Easy Test 1 8 Expected
Score 8
Person
Very Hard Test
1 8Expected Score 0
Person
Medium Test
1Expected Score 5
Person
8
Reprinted with permission from: Wright, B.D. & Stone, M. (1979) Best test design, Chicago: MESA Press, p. 5.

How Differences Between Person Ability and Item Difficulty Ought to Affect the Probability of a Correct Response
Person Ability
Item Difficulty
p > . 5
Person Ability
Item Difficulty
p = . 5
Person Ability
Item Difficulty
p < . 5
Reprinted with permission from: Wright, B.D. & Stone, M. (1979) Best test design, Chicago: MESA Press, p. 13.

Probability of Success on an Item
Rasch (1960) -The probability of a successful outcome is governed by the combination of the person’s ability and the item’s difficulty.

Fechner’s Law (1860):
The relationship between the stimulus and the
response (body and soul) is predictable andmathematical, but not additive
• The relationship is a logarithmic function
• Light intensity, electric shock
• The cumulative normal curve
• Thermometer to measure health

e (ability-item_difficulty)
1 + e (ability-item_difficulty)P1,0 =
Rasch (1960) formula for the probability of endorsing an item…
“e” is a constant, 2.71…., that describes growth curves. It is like Pi, 3.14…., a constant that describes circumference.

P1,0 =e (0)
1 + e (0)=
1
2=
.50
When Person Ability equals Item Difficulty

The Rasch Yardstick
• The concatenated odds of passing an item can be represented by distances on a map of persons and items.
• The resulting map of the variable is no less a “ruler” than one constructed for measuring length.
• It can be applied in a similar way to produce measures as useful as those of any yardstick.

Unidimensionality Requirement
• We can only measure one thing at a time.• The ideal of the Rasch model is that all the
information in the data be explained by one latent construct.
• Then, the unexplained part, the residuals, is, by intention, random noise.
• If there is a 2nd or 3rd rival factor, we will need to construct more than one measure.
• If the data fit the model, we have a map or ruler of the variable.

PERSONS MAP OF ITEMS <more>|<rare> 2 TRUNCATED.### | ## | .## | . | HlthProbs .## |T 1 .## + .## S| .### | .### |S Withdrawal/ill .#### | ProbW/Law .###### | Unsafe GiveUpActs DespiteMedPsyProbs .#### | DepressedNervous NeededMoreAOD UnableCutDown 0 .###### +M .###### | ResponNotMet LargerAmnt/more .####### | .############ M| HideWhenUseAOD Fights/trouble .###### |S SpentTimeGetting .####### | .###### | ParentComplained -1 .###### + .##### |T WeeklyAOD . | .###### | .#### | . S| .###### | -2 . + .#### |
.##### | -3 TRUNCATED + -4 .############ + EACH '#' is 24
Figure 1. GAIN Substance Problems Scale

Computerized Adaptive Test
• Having a difficulty parameter enables us to home in on a person’s trait level without using all of the items.
• People with less of the trait will not need to take a lot of items that are too difficult for them; while people with more of the trait will not be bored with items that are too easy.
• Reduces testing time.• Enables more privacy, e.g., in carrels or via Internet• Immediate data entry• Immediate feedback

A person fits the Guttman model if their answers look like this: 1111100000
A person fits the Rasch model if their answers look like this: 1110101000
What if their answers look like a: 0111100000b: 1111100010c: 0101010101
The Question of Fit

|ENTRY RAW MODEL| INFIT | OUTFIT |PTMEA| |NUMBER SCORE COUNT MEASURE S.E. |MNSQ ZSTD|MNSQ ZSTD|CORR.| ITEM-----------------------------------------------------------------------------------------| 1 3475 3406 -.49 .03|1.43 9.9|1.80 9.9|A .51| CHideWhenUseAOD | 8 2103 3379 .49 .03|1.54 9.9|1.77 9.9|B .42| KProbW/Law | 2 4072 3402 -.91 .03|1.18 8.1|1.30 8.5|C .62| DParentComplainedAOD | 5 1205 3400 1.35 .03|1.30 8.8|1.21 3.7|D .49| GHlthProbs | 9 3330 3373 -.41 .03|1.08 3.8|1.17 5.3|E .62| MFights/trouble | 11 1953 3381 .62 .03|1.11 4.2| .95 -1.2|F .60| PWithdrawl/ill | 7 2284 3365 .34 .03|1.03 1.2|1.03 .8|G .60| JUnsafe | 3 4375 3385 -1.15 .03| .92 -3.7|1.02 .6|H .68| EWeeklyAOD | 4 2522 3402 .18 .03| .97 -1.5| .92 -2.5|h .64| FDepressedNervous | 13 2554 3357 .13 .03| .92 -3.7| .88 -3.7|g .65| RUnableCutDownAOD | 16 2366 3380 .29 .03| .87 -5.8| .80 -6.2|f .65| UCausingProbs | 10 2513 3370 .17 .03| .83 -8.1| .79 -6.9|e .66| NNeededMoreAOD | 15 2382 3379 .27 .03| .81 -9.2| .73 -8.6|d .67| TGiveUpActs | 14 3627 3377 -.62 .03| .78 -9.9| .74 -9.3|c .71| SSpentTimeGet/UseAOD | 6 3007 3403 -.17 .03| .78 -9.9| .74 -9.3|b .69| HResponNotMet | 12 2890 3383 -.10 .03| .77 -9.9| .77 -8.1|a .69| QLargerAmnt|------------------------------------+----------+----------+-----+-----------------------
ITEM STATISTICS: MISFIT ORDER

Differential Item Functioning (DIF)
• Tendency of a subtype of respondents systematically to answer in a way that differs from another subtype even though they are at the same level on the construct, e.g., gender, age, race, country, culture, language, diagnosis.
• DIF can be a form of multidimensionality (Stout, 1987; Lange et al., 2000) such that removal of DIF in biased items decreases dimensionality.
• Removal of DIF, in addition to creating unbiased measures, may also improve their quality.
• Alternatively, DIF may identify REAL differences among subgroups that have implications for clinical practice

Differential Item Functioning
• Do the items mean the same thing to men and women? Whites and non-whites? Youth and adults?
• In the tables below, items that are harder for adults to endorse are indicated by a positive value. Our threshold for a clinically significant DIF is .5 logit.

DIF Contrasts of Youth (1) with Young Adults (2) and with Adults (3)
+---------------------------------------------------------------------------+| PERS DIF DIF PERS DIF DIF DIF JOINT ITEM | CLAS MEAS S.E.CLAS MEAS S.E. CONTRAST S.E. t Number Name |---------------------------------------------------------------------------|| 1 -.71 .03 2 -.08 .09 -.63 .09 -6.62 1 HideWhenUseAOD | 1 -.71 .03 3 .31 .06 -1.02 .07 -14.6 1 CHideWhenUseAOD | 1 -1.08 .03 2 -.65 .09 -.42 .10 -4.45 2 DParentComplained | 1 -1.08 .03 3 -.22 .06 -.86 .07 -12.0 2 DParentComplained | 1 -1.15 .03 2 -1.11 .09 -.04 .10 -.40 3 EWeeklyAOD | 1 -1.15 .03 3 -1.16 .07 .01 .08 .15 3 EWeeklyAOD | 1 .40 .03 2 -.10 .09 .50 .10 5.23 4 FDepressedNervous | 1 .40 .03 3 -.55 .07 .95 .07 12.70 4 FDepressedNervous | 1 1.30 .04 2 1.09 .10 .21 .11 1.89 5 GHlthProbs | 1 1.30 .04 3 1.60 .07 -.30 .08 -3.61 5 GHlthProbs | 1 -.10 .03 2 -.13 .09 .03 .09 .31 6 HResponNotMet | 1 -.10 .03 3 -.50 .07 .40 .07 5.53 6 HResponNotMet | 1 .33 .03 2 -.01 .09 .34 .10 3.50 7 JUnsafe | 1 .33 .03 3 .54 .06 -.21 .07 -3.00 7 JUnsafe | 1 .16 .03 2 .74 .10 -.58 .10 -5.65 8 KProbW/Law | 1 .16 .03 3 1.72 .07 -1.57 .08 -19.8 8 KProbW/Law | 1 -.58 .03 2 -.43 .09 -.14 .09 -1.52 9 MFights/trouble | 1 -.58 .03 3 .34 .06 -.92 .07 -13.2 9 MFights/trouble +--------------------------------------------------------------------------+

DIF Contrasts of Youth (1) with Young Adults (2) and with Adults (3)+---------------------------------------------------------------------------+
| PERS DIF DIF PERS DIF DIF DIF JOINT ITEM
| CLAS MEAS S.E.CLAS MEAS S.E. CONTRAST S.E. t Number Name
|---------------------------------------------------------------------------|
| 1 .24 .03 2 .20 .09 .04 .10 .44 10 NNeededMoreAOD
| 1 .24 .03 3 -.12 .06 .36 .07 4.99 10 NNeededMoreAOD
| 1 .78 .04 2 .39 .09 .40 .10 3.99 11 PWithdrawl/ill
| 1 .78 .04 3 .17 .06 .61 .07 8.39 11 PWithdrawl/ill
| 1 -.01 .03 2 .00 .09 -.01 .10 -.06 12 QLargerAmnt/more|
| 1 -.01 .03 3 -.55 .07 .55 .07 7.43 12 QLargerAmnt/more|
| 1 .29 .03 2 -.02 .09 .31 .10 3.23 13 RUnableCutDownAOD
| 1 .29 .03 3 -.42 .07 .71 .07 9.60 13 RUnableCutDownAOD
| 1 -.58 .03 2 -.54 .09 -.04 .10 -.46 14 SSpentTimeGet/use
| 1 -.58 .03 3 -.85 .07 .27 .08 3.51 14 SSpentTimeGet/use
| 1 .33 .03 2 .41 .09 -.09 .10 -.89 15 TGiveUpActs
| 1 .33 .03 3 -.01 .06 .34 .07 4.74 15 TGiveUpActs
| 1 .42 .03 2 .18 .09 .24 .10 2.52 16 UDespiteMedPsyProbs
| 1 .42 .03 3 -.18 .06 .60 .07 8.30 16 UDespiteMedPsyProbs
+--------------------------------------------------------------------------+

DIF Contrasts of Youth (1) with Adults (3)
+---------------------------------------------------------------------------+| PERS DIF DIF PERS DIF DIF DIF JOINT ITEM | Teen MEAS S.E.AdultMEAS S.E. CONTRAST S.E. t Number Name |---------------------------------------------------------------------------|| 1 -.71 .03 3 .31 .06 -1.02 .07 -14.6 1 CHideWhenUseAOD | 1 -1.08 .03 3 -.22 .06 -.86 .07 -12.0 2 DParentComplained | 1 -1.15 .03 3 -1.16 .07 .01 .08 .15 3 EWeeklyAOD | 1 .40 .03 3 -.55 .07 .95 .07 12.70 4 FDepressedNervous | 1 1.30 .04 3 1.60 .07 -.30 .08 -3.61 5 GHlthProbs | 1 -.10 .03 3 -.50 .07 .40 .07 5.53 6 HResponNotMet | 1 .33 .03 3 .54 .06 -.21 .07 -3.00 7 JUnsafe | 1 .16 .03 3 1.72 .07 -1.57 .08 -19.8 8 KProbW/Law | 1 -.58 .03 3 .34 .06 -.92 .07 -13.2 9 MFights/trouble| 1 .24 .03 3 -.12 .06 .36 .07 4.99 10 NNeededMoreAOD | 1 .78 .04 3 .17 .06 .61 .07 8.39 11 PWithdrawl/ill | 1 -.01 .03 3 -.55 .07 .55 .07 7.43 12 QLargerAmnt/more|| 1 .29 .03 3 -.42 .07 .71 .07 9.60 13 RUnableCutDownAOD | 1 -.58 .03 3 -.85 .07 .27 .08 3.51 14 SSpentTimeGet/use | 1 .33 .03 3 -.01 .06 .34 .07 4.74 15 TGiveUpActs | 1 .42 .03 3 -.18 .06 .60 .07 8.30 16 UDespiteMedPsyProbs +--------------------------------------------------------------------------+

Differential Test Functioning (DTF)
• While there may be differences in individual items, over a larger pool of items these differences may balance out and still produce a reliable measure
• Significant DTF suggest the need for different norms for the subgroups and/or that the test may not “mean” the same thing

Evaluating DTF
1. Put teens and adults on the same ruler by anchoring rating scale categories and 8 common (non-DIF) items using their common calibrations.
2. Do separate Winsteps runs for each group letting the unanchored, 8 DIF items “float,” i.e., calibrate themselves within the subgroup.
3. Given a cutoff score based on common clinical practice estimate the changes before and after DIF adjustment.

Creating A Common Ruler to Evaluate DTF
8 items fixed to be equal and used to make a common
ruler
Remaining 8 items allowed to vary

DTF Group Means and High Need Cut-off
Results Before and After DIF Adjustment
Before DIF adjustment
After DIF adjustment
Adult mean (sd) .02 (1.64) .20 (1.86)*** Teen mean (sd) -.89 (1.53) - .90 (1.59)*** Adult n high need 765 (57%) 860 (65%)*** Teen n high need 1,479 (27%) 1,458 (27%)**
Adult N = 1,293; adolescent N = 5,366 ** p < .01 *** p < .0001

Analyzing Facets: Beyond Persons and Items
• There are factors, a.k.a. facets, beyond persons and items that influence measures.
• For example, when raters are involved, the scoring severity of the rater influences how highly the person will be ranked.
• With the SPS, we have clients attribute 11 substance abuse and dependence symptoms to 1 to 14 DSM substance classes.
• Like logistic regression, Facets allows us to simultaneously look at difference in multiple dimensions (e.g.., age, gender, race, time, substance)

Part 3. Example: Validation of DSM-IV Substance Use
Disorder by Substance and Age Using RaschMichael Dennis, Chestnut Health Systems

This presentation was supported by analytic runs provided Substance Abuse and Mental Health Services Administration's (SAMHSA's) Center for Substance Abuse Treatment (CSAT) under Contracts 207-98-7047, 277-00-6500, and 270-2003-00006 using data provided by the following grantees: CSAT (TI11320, TI11324, TI11317, TI11321, TI11323, TI11874, TI11424, TI11894, TI11871, TI11433, TI11423, TI11432, TI11422, TI11892, TI11888, TI013313, TI013309, TI013344, TI013354, TI013356, TI013305, TI013340, TI130022, TI03345, TI012208, TI013323, TI14376, TI14261, TI14189,TI14252, TI14315, TI14283, TI14267, TI14188, TI14103, TI14272, TI14090, TI14271, TI14355, TI14196, TI14214, TI14254, TI14311, TI15678, TI15670, TI15486, TI15511, TI15433, TI15479, TI15682, TI15483, TI15674, TI15467, TI15686, TI15481, TI15461, TI15475, TI15413, TI15562, TI15514, TI15672, TI15478, TI15447, TI15545, TI15671, TI11320, TI12541, TI00567); NIAAA (R01 AA 10368); NIDA (R37 DA11323; R01 DA 018183); Illinois Criminal Justice Information Authority (95-DB-VX-0017); Illinois Office of Alcoholism and Substance Abuse (PI 00567); Intervention Foundation’s Drug Outcome Monitoring Study (DOMS), Robert Woods Johnson Foundation’s Reclaiming Futures. Any opinions about this data are those of the authors and do not reflect official positions of the government or individual grantees. The opinions are those of the author and do not reflect official positions of the consortium or government. Available on line at www.chestnut.org/LI/Posters or by contacting Joan Unsicker at 720 West Chestnut, Bloomington, IL 61701, phone: (309) 827-6026, fax: (309) 829-4661, e-Mail: [email protected]
Acknowledgement

Goals for Part 3
1. Examine the origins, definitions and current debates surrounding the Diagnostic and Statistical Manual IV TR (DSM-IV-TR) substance use disorder (SUD) construct
2. Use Rasch analysis of the GAIN’s Substance Problem Scale (SPS) data to inform current debates related to SUD
3. Discuss the implications of the findings for further refinement of the SUD concept.

Evolution of the Substance Use Disorders (SUD) Concept
• Much of our conceptual basis of addiction comes from Jellnick’s 1960 “disease” model of adult alcoholism
• Edwards & Gross (1976) codified this into a set of bio-psycho-social symptoms related to a “dependence” syndrome
• In practice, they are typically complemented by a set of separate “abuse” symptoms that represent other key reasons why people enter treatment
• DSM 3, 3R, 4, 4TR, ICD 8, 9, & 10, and ASAM’s PPC1 and PPC2 all focus on this syndrome
• Note that these symptoms are only correlated about .4 to .6 with use or problem scales more commonly used in evaluation
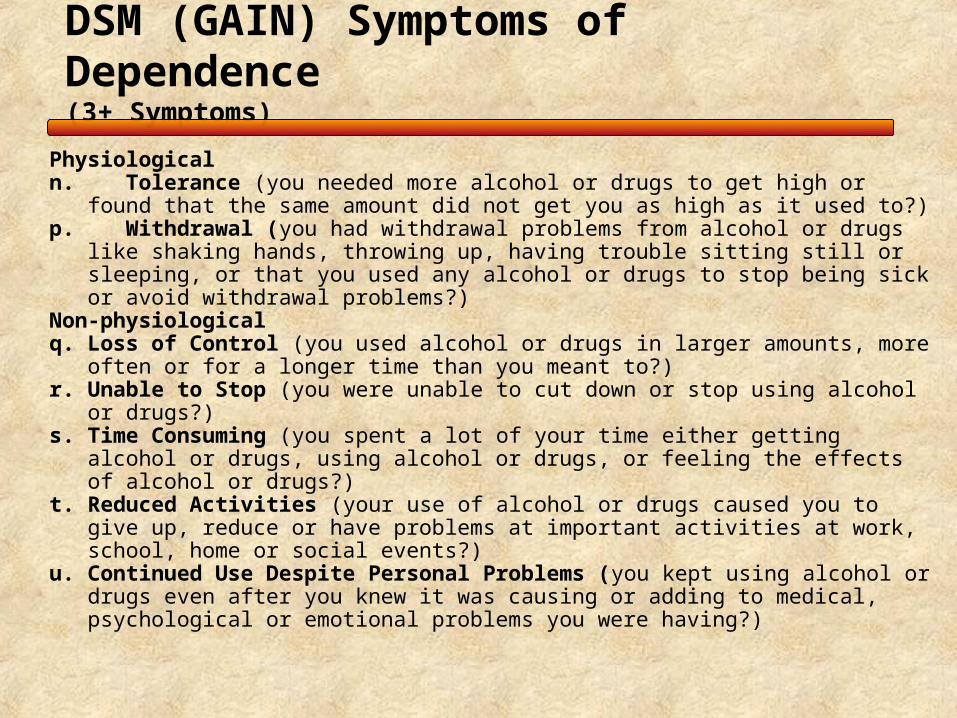
DSM (GAIN) Symptoms of Dependence (3+ Symptoms)
Physiologicaln. Tolerance (you needed more alcohol or drugs to get high or found that the
same amount did not get you as high as it used to?)p. Withdrawal (you had withdrawal problems from alcohol or drugs like
shaking hands, throwing up, having trouble sitting still or sleeping, or that you used any alcohol or drugs to stop being sick or avoid withdrawal problems?)
Non-physiologicalq. Loss of Control (you used alcohol or drugs in larger amounts, more often or
for a longer time than you meant to?) r. Unable to Stop (you were unable to cut down or stop using alcohol or drugs?) s. Time Consuming (you spent a lot of your time either getting alcohol or drugs,
using alcohol or drugs, or feeling the effects of alcohol or drugs?)t. Reduced Activities (your use of alcohol or drugs caused you to give up,
reduce or have problems at important activities at work, school, home or social events?)
u. Continued Use Despite Personal Problems (you kept using alcohol or drugs even after you knew it was causing or adding to medical, psychological or emotional problems you were having?)

DSM (GAIN) Symptoms of Abuse (1+ symptoms)
h. Role Failure (you kept using alcohol or drugs even though you knew it was keeping you from meeting your responsibilities at work, school, or home?)
j. Hazardous Use (you used alcohol or drugs where it made the situation unsafe or dangerous for you, such as when you were driving a car, using a machine, or where you might have been forced into sex or hurt?)
k. Legal problems (your alcohol or drug use caused you to have repeated problems with the law?)
m. Continued Use after Legal/Social Problems (you kept using alcohol or drugs even after you knew it could get you into fights or other kinds of legal trouble?)
Source: Dennis et al 2003

• Do abuse and dependence symptoms vary along the same or different dimensions?
• Are physiological symptoms (tolerance and withdrawal) good markers of high severity?
• Are abuse symptoms good markers of low severity?
• Does the average and pattern of symptom severity vary by substance?
• Are there differential item function by age? (Note: there was no adolescent data considered at the time DSM-IV was created).
• Are diagnostic orphans (1-2 symptoms of dependence without abuse) similar to abuse or lower?
Unresolved Questions from DSM’s Substance Use Disorder Criteria

Data Source and Methods
• Data from 2474 Adolescents, 344 Young Adults and 661 Adults interviewed between 1998 and 2005 with the Global Appraisal of Individual Needs (GAIN; Dennis et al 2003)
• Participants recruited at intake to Early Intervention, Outpatient, Intensive Outpatient, Short, Moderate & Long term Residential, Corrections Based and Post Residential Outpatient Continuing Care as part of 72 local evaluations around the U.S. and pooled into a common data set
• Analysis here focuses on the GAIN Substance Use Disorder Scale (SUDS) with symptoms of dependence and abuse overall and by substance. The rating scale is 3=past month, 2=past 2-12 months, 1=more than a year ago and 0=never.
• Analyses done with a combination of Winsteps and Facets

Sample Characteristics
Adolescents: <18 (n=2474)
Young Adult: 18-25
(n=344)
Adults: 26+
(n=661)
Male 74% 58% 47%
Caucasian 48% 54% 29%
African American 18% 27% 63%
Hispanic 12% 7% 2%
Average Age 15.6 20.2 37.3
Substance Disorder 85% 82% 90%
Internal Disorder 53% 62% 67%
External Disorder 63% 45% 37%
Crime/Violence 64% 51% 34%
Residential Tx 31% 56% 74%
Current CJ/JJ invol. 69% 74% 45%
Note: all significant, p < .01

Differences in Symptom Severity by DrugR
asch
Sev
erit
y M
easu
re
Des
p.P
H/M
H (
+0.
10)
Giv
e u
p a
ct. (
+0.
05)
Can
't s
top
(+
0.05
)
Tim
e C
on
s. (
-0.2
1)
Lo
ss o
f C
on
tro
(-0
.10)
Haz
ard
ou
s (-
0.03
)
Des
pit
e L
egal
(+
0.10
)
Ro
le F
ailu
re (
-0.1
2)
Fig
hts
/tro
ub
. (0.
17)
-0.60
-0.40
-0.20
0.00
0.20
0.40
0.60
0.80Tim
e Con
s
Role F
ailur
e
Fights/
troub
.
Loss
of C
ontro
l
Hazar
dous
Tolera
nce
Can't s
top
Give u
p ac
t.
Desp.
PH/MH
Despit
e Le
gal
With
draw
al
To
lera
nce
(0.
00)
Wit
hd
raw
al (
+0.
34)
Physiological Sx:While Withdrawal is
High severity, Tolerance is only
Moderate
Dependence Sx: Other dependence Symptoms
spread over continuum
Abuse Sx: Abuse Symptoms are also
spread over continuum
1st dimension explains 75% of variance (2nd explains 1.2%)Average Item Severity (0.00)

Symptom Severity Varied by Drug
Easier to endorse
hazardous use for
ALC/CAN
Ras
ch S
ever
ity
Mea
sure
ALC
ALC
ALC
ALCALC
ALC
ALC
AMP
AMP
AMPAMP
AMP
AMP
CAN
CAN
CAN
CAN
COC COC
COC
OPI
OPIOPI
OPI
OPI
ALC
ALC ALC
ALC
AMP
AMP
AMP
AMP
AMP
CAN
CAN
CAN
CAN
CAN
CAN
CAN
COC
COCCOC
COC
COC
COCCOC
COC
OPI
OPI OPIOPI
OPI
OPI
-0.60
-0.40
-0.20
0.00
0.20
0.40
0.60
0.80Tim
e Con
s.
Role F
ailur
e
Fights/
troub
.
Loss
of C
ontro
l
Hazar
dous
Tolera
nce
Can't s
top
Give u
p ac
t.
Desp.
PH/MH
Despit
e Le
gal
With
draw
al
AVG (0.00)
ALC (-0.44)
AMP (+0.89)
CAN (-0.67)
COC (-0.22)
OPI (+0.44)
Easier to endorse fighting/ trouble for ALC/CAN
Easier to endorse time consuming for CAN
Easier to endorse
moderate Sx for
COC/OPI
Easier to endorse
despite legal problem for ALC/CAN
Easier to endorse
Withdrawal for
AMP/OPI
Withdrawal much less likely for CAN

Symptom Severity Varied Even More By AgeR
asch
Sev
erit
y M
easu
re
<18 <18
<18
<18
<18
18-25
18-25
18-25
18-25
18-25
18-25
26+
26+
26+
26+
26+
26+
26+
26+
26+
26+
26+<18<18
<18
<18
<18
<18
18-25
18-25
18-25
18-25
18-25
-1
-0.8
-0.6
-0.4
-0.2
0
0.2
0.4
0.6
0.8
1
1.2
1.4
1.6
1.8Tim
e Con
s.
Role F
ailur
e
Fights/
troub
.
Loss
of C
ontro
l
Hazar
dous
Tolera
nce
Can't s
top
Give u
p ac
t.
Desp.
PH/MH
Despit
e Le
gal
With
draw
al
<18
18-25
26+
Age
Adults more likely to endorse most symptomsMore likely to lead to
fights among Adol/YAHazardous use more
likely among Adol/YA
Continued use in spite of legal problems more likely among Adol/YA

Lifetime Pattern of Substance Use Disorders
66%2%
20%
4%8%
Both
DependenceOnly
Abuse
DiagnosticOrphan
Neither

Past Month Status
26%
3%
21%
2%12%
25%
3%8%
Both
Dependence Only
Abuse Only
Diagnostic Orphan
Lifetime SUD in CE45+ days
Lifetime SUD inearly remission
Diagnostic Orphanin early remission
Lifetime use only

Rasch Severity by Past Month Status
-3.50
-3.00
-2.50
-2.00
-1.50
-1.00
-0.50
0.00
0.50
1.00
1.50
2.00
None DiagnosticOrphan in early
remission
DiagnosticOrphan
Lifetime SUD
in early remission
LifetimeSUD in CE
45+ days
Abuse Only
DependenceOnly
BothAbuse
and Dependence
Ras
ch S
ever
ity
Mea
sure
Diagnostic Orphans (1-2 dependence symptoms)
are lower, but still overlap with other clinical groups

Severity by Past Year Symptom Count
-4.00-3.50-3.00-2.50-2.00-1.50-1.00-0.500.000.501.001.502.00
0 1 2 3 4 5 6 7 8 9 10 11
Ras
ch S
ever
ity
Mea
sure
1. Better Gradation2. Still a lot of overlap in range

Severity by Number of Past Year SUD Diagnoses
Ras
ch S
ever
ity
Mea
sure
-4.00
-3.50
-3.00
-2.50
-2.00
-1.50
-1.00
-0.50
0.00
0.50
1.00
1.50
2.00
0 1 2 3 4 5
1. Better Gradation2. Less overlap in range
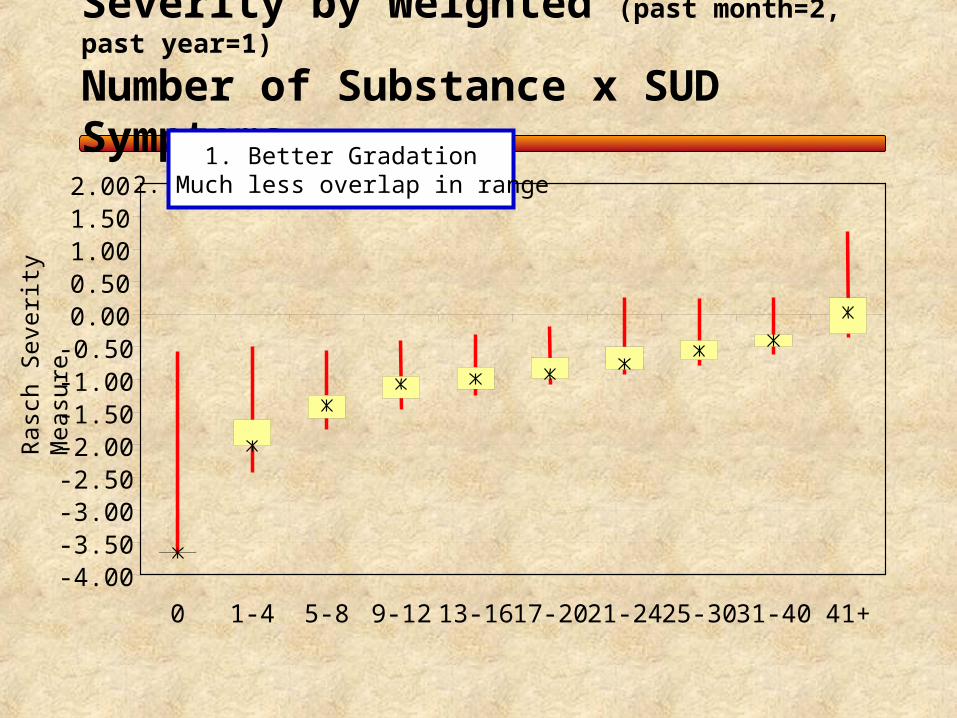
Severity by Weighted (past month=2, past year=1)
Number of Substance x SUD Symptoms
Ras
ch S
ever
ity
Mea
sure
-4.00-3.50-3.00-2.50-2.00-1.50-1.00-0.500.000.501.001.502.00
0 1-4 5-8 9-12 13-16 17-20 21-24 25-30 31-40 41+
1. Better Gradation2. Much less overlap in range

Average Severity by Age
-4.00
-3.50
-3.00
-2.50
-2.00
-1.50
-1.00
-0.50
0.00
0.50
1.00
1.50
2.00
Adolescent (<18) Young Adult (18-25) Adult (26+)
1. Average goes up with age2. Complete overlap in range3. Narrowing of distribution on higher severity at older ages

Construct Validity (i.e., does it matter?)
Fre
que
ncy
Of U
se
Pa
st W
eek
With
dra
wal
Em
otio
na
l P
robl
em
s
Re
cove
ry
En
viro
nmen
t
So
cia
l Ris
k
DSM diagnosis \a 0.47 0.40 0.32 0.30 0.30
Symptom Count Continuous \b 0.48 0.43 0.39 0.32 0.31
Weighted Drug x Symptom \c,d 0.26 0.27 0.19 0.29 0.09
\a Categorized as Past year physiology dependence, non-physiological dependence, abuse, other\b Raw past year symptom count (0-11)\c Symptoms weighted by recency (2=past month, 1=2-12 months ago, 0=other)\d Symptoms by drug (alcohol, amphetamine, cannabis, cocaine, opioids)
Past year Symptomcount didbetter than
DSM
Weighted Symptom Rasch \c 0.57 0.46 0.39 0.39 0.32
Rasch does
a little Betterstill
Weighted symptom by drug count severity did
WORSE

Implications for SUD Concept
• “Tolerance” is not a good marker of high severity; withdrawal (and substance induced health problems are)
• “Abuse” symptoms are consistent with the overall syndrome and represent moderate severity or “other reasons to treat in the absence of the full blown syndrome”
• Diagnostic orphans are lower severity, but relevant• Pattern of symptoms varies by substance and age, but all symptoms are
relevant• “Adolescents” experienced the same range of symptoms, though they (and
young adults) were particularly more likely to be involved with the law, use in hazardous situations, and to get into fights at lower severity
• Symptom Counts appear to be more useful than the current DSM approach to categorizing severity
• While weighting by recency & drug delineated severity, it did not improve construct validity

Other Progress
• Will work to submit a paper on this analysis this fall• Also submitting papers on
– Differential item functioning by age, gender, & race– Differential item functioning over time– Computer adaptive testing to shorten the GAIN
• Started doing Rasch analyses of other scales: – Internal Mental Distress Scale (somatic, depression,
suicide, anxiety, trauma)– Behavior Complexity Scale (ADHD, CD, and other
impulse control disorders)– Crime/Violence Scale (violence, property, interpersonal,
and drug related crime)– General Individual Severity Scale (total symptom count
for above and substance problems scale)

References
• Dennis, M. L., Titus, J. C., White, M. K., Unsicker, J., & Hodgkins, D. (2003). Global Appraisal of Individual Needs: Administration Guide for the GAIN and Related Measures. Bloomington, IL: Chestnut Health Systems. Retrieved from http://www.chestnut.org/li/gain .
• Fechner, G.T. (1860). Elemente der Psychophysik. Leipzig: Breitkopf & Hartel. For a brief, useful discussion, see Nunnally, J. & Bernstein, I. (1994). Psychometric Theory, 3rd Ed. New York: McGraw-Hill, pp. 45-47.
• Rasch, G. (1960). Probabilistic models for some intelligence and attainment tests. Copenhagen: Danmarks Paedogogiske Institut. (Republished Chicago: The University of Chicago Press: 1980).
• Weisner, C., McLellan, T., Barthwell, A., Blitz, C., Catalano, R., Chalk, M., Chinnia, L., Collins, R. L., Compton, W., Dennis, M. L., Frank, R., Hewitt, W., Inciardi, J. A., Lightfoot, M., Montoya, I., Sterk, C. E., Wood, J., Pintello, D., Volkow, M., & Michaud, S. E. (2004). Report of the Blue Ribbon Task Force on Health Services Research at the National Institute on Drug Abuse. Rockville, MD: National Institute on Drug Abuse. Retrieved on 2/14/04 from http://www.drugabuse.gov/about/organization/nacds/HSRReport.pdf
• Zerhouni, E. (2003). NIH Roadmap. Science, 32(3), 63-65.

Copies of these handouts are available…
• On line at www.chestnut.org/LI/Posters
• or by contacting Joan Unsicker at 720 West Chestnut, Bloomington, IL 61701, phone: (309) 827-6026, fax: (309) 829-4661, e-Mail: [email protected]