Embed Size (px)
Citation preview

A p p l i c a t i o n P r o g r a m m i n g I V C - 3 D
RE
FE
RE
NC
E
MA
NU
AL

© SICK AG 2013-09-09
All rights reserved
Subject to change without prior notice.
Please read the complete manual before attempting to operate your IVC-3D.
WARNING
IVC-3D is a laser product complying as such to the standards IEC 60825-1 and 21 CFR
1040.10 / 11 (CDRH). It cannot be considered as a standalone unit and must only be
used as a part of a laser system, which incorporates additional features depending on the
applicable laser class. The IVC-3D product is equipped with a Class II / 2M laser or with a
Class IIIb / 3B laser.
LASER RADIATION – DO NOT STARE INTO BEAM
OR VIEW DIRECTLY WITH OPTICAL INSTRUMENTS
CLASS 2M LASER PRODUCT
According to IEC 60825-1 : 2007
CAUTION Class II / 2M lasers emit visible radiation in the
wavelength range from 400 nm to 700 nm where eye
protection is normally afforded by aversion responses
including the blink reflex. However, viewing of the
output is hazardous if the user employs optical
instruments within the beam or suppresses the blink
reflex intentionally.
Do not stare into beam.
Do not view the laser beam directly with optical
instruments like magnifying glasses, telescopes,
etc.
LASER RADIATION – AVOID
DIRECT EXPOSURE TO BEAM
CLASS 3B LASER PRODUCT
according to IEC 60825-1 : 2007
DANGER
Class IIIb / 3B lasers are considered dangerous to
your retina if exposed. This includes looking directly
into a reflection from a specular (mirror-like) surface.
Viewing diffuse reflections are normally safe. Certifica-
tion is given on systems that fulfil all safety require-
ments for 3B laser systems.
Class IIIb / 3B laser products must bear warning
and certification labels.
During installation and alignment appropriate eye
protection must be used.
The IVC-3D is a laser product and operation using procedures other than those specified
herein may result in hazardous radiation exposure.
Please read and follow ALL Warning statements throughout this manual.
German versions of the Operating Instructions and Reference manual are available on the CD. Eine deutsche Version der Bedienungsanleitung und des Referenzhandbuchs finden Sie auf der beigelegten CD.
WARNING
Do not open the IVC-3D
The IVC-3D unit should not be opened, the IVC-3D contains no user serviceable parts inside. Opening the IVC-3D
unit may result in hazardous radiation exposure.

Turn off the power to the IVC-3D before maintenance
The power to the IVC-3D must be turned off before any maintenance is performed. Failure to turn this power off
when maintaining the unit may result in hazardous radiation exposure.
ISM Radio Frequency Classification - EN55011 – s
Group1, Class A
Warning: Class A equipment is intended for use in an industrial environment. There may be potential difficulties
in ensuring electromagnetic compatibility in other environments, due to conducted as well as radi-
ated disturbances.
Explanations:
Group1 – ISM equipment (ISM = Industrial, Scientific and Medical)
Group 1 contains all ISM equipment in which there is intentionally generated and/or used conductively coupled
radio-frequency energy which is necessary for the internal functioning of the equipment itself.
Class A equipment is equipment suitable for use in all establishments other than domestic and those directly
connected to a low voltage power supply network which supplies buildings used for domestic purposes.
Class A equipment shall meet class A limits.
Note: Although class A limits have been derived for industrial and commercial establishments, administrations
may allow, with whatever additional measures are necessary, the installation and use of class A ISM equipment in
a domestic establishment or in an establishment connected directly to domestic electricity power supplies.

Reference Manual
IVC-3D
4 ©SICK AG • Advanced Industrial Sensors • www.sick.com • All rights reserved
Contents
Contents 1 Functional Overview ......................................................................................................................................9
1.1 IVC-3D Camera....................................................................................................................................................9 1.2 IVC Studio ...........................................................................................................................................................12 1.3 Handling Multiple Products ..........................................................................................................................14
2 Getting Started............................................................................................................................................. 15 2.1 Creating a Product...........................................................................................................................................15 2.2 About Writing Programs.................................................................................................................................18 2.3 Adding Program Steps...................................................................................................................................20 2.4 Setting Parameter Values.............................................................................................................................23 2.5 Testing and Running the Program.............................................................................................................29 2.6 Saving the Program ........................................................................................................................................30 2.7 What’s Next? .....................................................................................................................................................31
3 Using IVC Studio .......................................................................................................................................... 32 3.1 Handling Devices .............................................................................................................................................32 3.2 Handling the Emulator ...................................................................................................................................35 3.3 Handling Products ...........................................................................................................................................38 3.4 Handling Programs..........................................................................................................................................40 3.5 Handling Tables ................................................................................................................................................42 3.6 Handling Images ..............................................................................................................................................43 3.7 IVC Studio Settings..........................................................................................................................................44 3.8 Programming .....................................................................................................................................................44 3.9 Efficient Programming ....................................................................................................................................50
4 Tools................................................................................................................................................................. 52 4.1 Image....................................................................................................................................................................53
Grab Setup .................................................................................................................................................53 Grab on Command..................................................................................................................................54 Grab...............................................................................................................................................................55 Set Laser .....................................................................................................................................................57 Copy Image Bank.....................................................................................................................................58 Image Bank Operation ...........................................................................................................................59 Add Text.......................................................................................................................................................61 Draw Line ....................................................................................................................................................62 Draw ROI......................................................................................................................................................63 Define Curve ..............................................................................................................................................64 Draw Curve.................................................................................................................................................65 Define Surface ..........................................................................................................................................66 Draw Surface .............................................................................................................................................67 Reset Image Banks.................................................................................................................................68 Display ..........................................................................................................................................................69 Extract Profile.............................................................................................................................................70 Rotate Image .............................................................................................................................................71
4.2 Region of Interest (ROI).................................................................................................................................72 ROI Rectangle ............................................................................................................................................72 ROI Rotated Rectangle...........................................................................................................................73 ROI Circle .....................................................................................................................................................75 ROI Ellipse ...................................................................................................................................................76 ROI Perimeter ............................................................................................................................................77

Reference Manual
IVC-3D
©SICK AG • Advanced Industrial Sensors • www.sick.com • All rights reserved 5
Contents
ROI Union.....................................................................................................................................................78 ROI Intersection ........................................................................................................................................79 ROI Difference ...........................................................................................................................................80 ROI Interval .................................................................................................................................................81 ROI Height ...................................................................................................................................................82
4.3 Filter ......................................................................................................................................................................83 Binarize.........................................................................................................................................................83 Dilate.............................................................................................................................................................84 Erode.............................................................................................................................................................85 Filter...............................................................................................................................................................86 Filter Profile.................................................................................................................................................87 Profile Difference......................................................................................................................................89 Fill Missing Data........................................................................................................................................91 Detail Extraction........................................................................................................................................92
4.4 Edge......................................................................................................................................................................94 Find Row Edge ..........................................................................................................................................94 Find Column Edge....................................................................................................................................95 Find Row ......................................................................................................................................................96 Find Column ...............................................................................................................................................98 Find Line Edge........................................................................................................................................100 Find Subpixel Edge...............................................................................................................................103 Find Multiple Edges..............................................................................................................................104 Find Mean of Edges.............................................................................................................................107 Find Circle Edges...................................................................................................................................109 Find Profile Points..................................................................................................................................112
4.5 Measure ...........................................................................................................................................................115 Centroid ....................................................................................................................................................115 Single Blob Analysis .............................................................................................................................116 Area ............................................................................................................................................................117 Perimeter..................................................................................................................................................118 Line Intersection....................................................................................................................................119 Distance and Angle ..............................................................................................................................120 Curve Intersection.................................................................................................................................121 Cross-Section Area...............................................................................................................................122 Volume ......................................................................................................................................................123 Distance....................................................................................................................................................124 Deviation...................................................................................................................................................125 Blob Finder...............................................................................................................................................126 Blob Analyzer ..........................................................................................................................................128 Co-Planarity..............................................................................................................................................131
4.6 Matching...........................................................................................................................................................132 Shape Locator........................................................................................................................................132 Add Shape Runtime .............................................................................................................................135 Get Shape................................................................................................................................................136 Transform Image...................................................................................................................................137 Transform ROI ........................................................................................................................................139 Teach Rotation.......................................................................................................................................141 Match Rotation.......................................................................................................................................142 Teach Pattern .........................................................................................................................................143 Inspect Pattern.......................................................................................................................................145
4.7 Circular ..............................................................................................................................................................151 External Perimeter ................................................................................................................................151

Reference Manual
IVC-3D
6 ©SICK AG • Advanced Industrial Sensors • www.sick.com • All rights reserved
Contents
Internal Perimeter .................................................................................................................................153 Circular Perimeter ROI .........................................................................................................................155 Circular Analysis.....................................................................................................................................156 Check Circular Surface........................................................................................................................157 Check Circular Shape ..........................................................................................................................158
4.8 Calculation .......................................................................................................................................................159 Mathematical Operation.....................................................................................................................159 Mathematical Expression...................................................................................................................160 In Range....................................................................................................................................................161 Polar to Cartesian Coordinates........................................................................................................162 Fit Circle ....................................................................................................................................................163 Fit Ellipse...................................................................................................................................................164 Sort .............................................................................................................................................................165 Update Statistics ...................................................................................................................................166 Reset Statistics ......................................................................................................................................167 Fit Circle to Profile .................................................................................................................................168 Fit Curve....................................................................................................................................................170 Fit Surface................................................................................................................................................172 Fit Surface to Points.............................................................................................................................174 Coordinate Alignment ..........................................................................................................................176 Get Calibrated Point .............................................................................................................................177
4.9 Program............................................................................................................................................................178 Goto............................................................................................................................................................178 If Then Goto.............................................................................................................................................179 If Error Goto.............................................................................................................................................180 If in Range Goto .....................................................................................................................................181 If All in Range Goto ...............................................................................................................................182 If ...................................................................................................................................................................183 Else .............................................................................................................................................................184 For ...............................................................................................................................................................185 While...........................................................................................................................................................186 Subroutine Start.....................................................................................................................................187 End..............................................................................................................................................................188 Run Flash Program ...............................................................................................................................189 Program Protection...............................................................................................................................190
4.10 System..............................................................................................................................................................191 Get Timer..................................................................................................................................................191 Wait.............................................................................................................................................................192 Read from Table....................................................................................................................................193 Write to Table .........................................................................................................................................194 Fill Table ....................................................................................................................................................195 Load Data Block from Flash .............................................................................................................196 Save Data Block to Flash...................................................................................................................197 Load Image from Flash.......................................................................................................................198 Save Image to Flash ............................................................................................................................199 Web Status Page...................................................................................................................................201 Write Table To Flash ............................................................................................................................203 Read Table From Flash.......................................................................................................................204
4.11 Communication..............................................................................................................................................205 Setup RS485..........................................................................................................................................205 Read RS485 Values ............................................................................................................................206 Write RS485 Values.............................................................................................................................207

Reference Manual
IVC-3D
©SICK AG • Advanced Industrial Sensors • www.sick.com • All rights reserved 7
Contents
Read RS485 String ..............................................................................................................................208 Write RS485 String ..............................................................................................................................209 Enable Ethernet .....................................................................................................................................210 Open Ethernet Raw ..............................................................................................................................211 Close Ethernet Raw..............................................................................................................................213 Read Ethernet Bytes............................................................................................................................214 Read Ethernet Bytes Formatted .....................................................................................................215 Read Ethernet String ...........................................................................................................................217 Write Ethernet Bytes............................................................................................................................218 Write Ethernet Bytes Formatted .....................................................................................................219 Write Ethernet String............................................................................................................................221 Communication Setup.........................................................................................................................222 Communication Read/Write..............................................................................................................223 Send to FTP.............................................................................................................................................224 Get from FTP...........................................................................................................................................227 Get SNTP Time.......................................................................................................................................229
4.12 Input/Output ...................................................................................................................................................230 Read Input ...............................................................................................................................................230 Set Output................................................................................................................................................231 Set All Outputs........................................................................................................................................232 Set Timed Output..................................................................................................................................233 Set Output by Distance.......................................................................................................................235 Clear Output Queues ...........................................................................................................................237 Get Encoder Tick...................................................................................................................................238 Encoder Difference ..............................................................................................................................239 Set LED .....................................................................................................................................................240
4.13 Reader ..............................................................................................................................................................241 Read Barcode ........................................................................................................................................241
5 Interactive Setups .................................................................................................................................... 243 Grab Setup ..................................................................................................................................................................243 Shape Locator Interactive Setup........................................................................................................................251 Add/Edit Shape Interactive Setup......................................................................................................................254 Locating Shapes (tips and tricks).......................................................................................................................256 Find Line Edge............................................................................................................................................................260 Coordinate Alignment..............................................................................................................................................262 Communication Setup ............................................................................................................................................266 Binarize Setup ............................................................................................................................................................271 Blob Finder Setup.....................................................................................................................................................272 Blob Analyzer Setup.................................................................................................................................................275 Detail Extraction Setup ...........................................................................................................................................278
6 Troubleshooting......................................................................................................................................... 280 6.1 Connecting to Devices ...............................................................................................................................280 6.2 Saving to Flash ..............................................................................................................................................282 6.3 Grabbing 3D Images ...................................................................................................................................283 6.4 Running IVC Studio.......................................................................................................................................283 6.5 Debugging Step Programs........................................................................................................................284 6.6 IVC Emulator ...................................................................................................................................................284 6.7 Trouble report ................................................................................................................................................284
Appendix................................................................................................................................................................ 286 A Mathematical Expressions........................................................................................................................286 B Setting Device Parameters.......................................................................................................................290

Reference Manual
IVC-3D
8 ©SICK AG • Advanced Industrial Sensors • www.sick.com • All rights reserved
Contents
C Missing Data in Certain Tools ..................................................................................................................294

Reference Manual Chapter 1
IVC-3D
©SICK AG • Advanced Industrial Sensors • www.sick.com • All rights reserved 9
IVC-3D Camera
1 Functional Overview
1.1 IVC-3D Camera The IVC-3D camera contains a powerful microprocessor that is tailored for image analysis
and especially analysis of 3D images. The processor can perform a number of commands
– or tools – that are used for example for capturing an image, finding an edge in an image
or setting one of the camera’s output signals.
Active
Program
Active
Table
Image
Banks
Data
Blocks
Working Memory
Flash Memory
Program
Banks
Saved
Data Blocks
Saved
Images
x1=1.273
y1=9.742
z1=6.37
...
1
2
3
4
5
...
1
2
3
4
5
...
1
2
3
4
5
...
The camera also has a working memory, which contains the following:
Active program, which is a sequence of commands that are used for analyzing the
images.
Active table, which is used for reading and storing values that are used during the
analysis.
A number of image banks, which each contains an image captured and processed by
the camera. An image bank may contain either a 3D image or a profile.
Data blocks, which are used by some tools for storing or reading additional data. For
example, some pattern recognition tools (Teach tools) create and save data in a data
block, which can later be used by other tools (Match tools).
In addition, the camera has a flash memory, which is used for permanent storage. The
flash memory contains the following:
Program banks, which are used for storing programs and tables that can be loaded into
the camera’s working memory. A program bank always contains both one program and
one table.
Saved images, which can be used for example as a basis when teaching the camera
patterns to recognize.
Saved data blocks, containing for example pattern recognition data to be used by
Match tools, so that the pattern does not have to be taught before running a program.

Chapter 1 Reference Manual
IVC-3D
10 ©SICK AG • Advanced Industrial Sensors • www.sick.com • All rights reserved
Functional Overview
1.1.1 3D Images
A 3D image shows the topology of an object, or the distance from the bottom (or refer-
ence plane) to a point on the surface of the object. The brighter a pixel is in the image, the
higher up that point is on the object.
Since each pixel in the 3D image represents a height the pixel values are displayed in
millimeters, and not as gray or color values as in ordinary digital images. The resulting height
value is measured from a reference plane located at a fixed distance from the camera.
This means that the units of the 3D coordinates in an image are pixels along the x- and y-
axis, and millimeters along the z-axis. The coordinates in the 3D image can however easily
be converted to millimeters by using a tool in the camera.
1.1.2 Profiles
A 3D image is generated from profiles, where each profile represents a cross-section of the
object. A profile is created when the object passes under a laser beam, which is reflected as
a line on the object. When viewed from an angle, the line shows the contour of the object.
z
xProfile
The coordinate system in profiles is the same as in 3D images – that is pixels along the
x-axis and millimeters along the z-axis.
1.1.3 Suppressing ambient light
The laser line used to create 3D images has a certain wavelength range, and the IVC-3D
has built-in filters that suppress ambient light. However, sunlight and also some standard
light sources used at factory floors contain light with the same wavelength range as the
laser. For a robust measurement day and night, all over the year, it is recommended to
shroud the inspection area from ambient light, especially sunlight.
y (transport)
z (height)
x (width)
x (width)
y (transport)

Reference Manual Chapter 1
IVC-3D
©SICK AG • Advanced Industrial Sensors • www.sick.com • All rights reserved 11
IVC-3D Camera
1.1.4 Capturing 3D Images
The camera takes a suitable number of profiles as the object passes under the laser. By
knowing the distance that the object moved between two profiles the camera can build a
3D image of the object from the profiles.
The camera assumes that the distance between the profiles is constant. Therefore it is
important to make sure that this is actually the case, in order to generate accurate 3D
images. There are two ways to achieve this:
• Make sure that the object is moving with a known and constant speed. The speed is
specified in the program, and the camera will then take profiles with a constant time
interval.
• Use an encoder. In this case, the encoder will trigger the camera to take a profile when
the object has moved a certain distance.
It is strongly recommended to use an encoder if you intend to measure for example the
shape or volume of the objects. If no encoder is used, the results of the analysis may be
inaccurate if the speed of the objects varies.
Object is moving with
the expected speed
Object is moving slower
than expected
The speed of the
object is uneven
1.1.5 Missing Data
Sometimes the laser line on the object is hidden by other parts of the object. This makes it
impossible for the camera to decide the height of the part of the object that is obscured. In
the resulting 3D image, such areas are represented with missing data, which is displayed
as black or holes when viewing the image.
Profile is missingz
xProfile
Normally, the tools that are used for analyzing the 3D images ignore missing data. However,
some tools treat missing data as a height value of 0 mm. This may affect the result of the
analysis, for example an edge could be detected at a location in the image where there are
actually missing data. A list of those tools is found in appendix C in the reference manual.
The camera has a tool for removing missing data from an image and thereby minimizing
the impact on the analysis made by such tools. The Fill Missing Data tool assumes that the
height of the hidden area is same as the area surrounding it, and thus “fills in the hole”.

Chapter 1 Reference Manual
IVC-3D
12 ©SICK AG • Advanced Industrial Sensors • www.sick.com • All rights reserved
Functional Overview
1.2 IVC Studio IVC Studio is used for developing the programs that are used by the cameras when
performing inspections – that is, analyzing images. IVC Studio can handle both 2D and 3D
cameras.
When you develop a program in IVC Studio, you work with a product. A product in IVC
Studio is a great help for handling all the devices (usually cameras), programs and tables
that are needed for a certain inspection.
The product contains a list of the used devices, and copies of all programs and tables that
are used by the devices. Normally, each device has one program and one table associated
to it, which is also the program and table that are currently in the working memory.
To be able to work with a program in IVC Studio, it must be associated with a device. The
device can be either a hardware camera or the Emulator, see below. A program is always
executed on a device – and never on the computer. The computer is mainly used for
building and modifying the programs on the devices, and to display the results sent from
the devices.
Product
Devices
Camera1
FillLevel FillTable
Label LabelTable
Camera2 Emulator
Programs Tables<< uses >>
1.2.1 IVC Emulator
The Emulator is a software behaving like an IVC camera, and can be used instead of an
IVC camera. The Emulator is available in the IVC Studio development environment, and it
makes it possible to develop programs when there is no IVC camera available. The Emula-
tor can emulate both 2D and 3D cameras. The main difference between the Emulator and
a camera is that the former uses a predefined set of images stored in an image folder on
the PC, whereas the latter views live images.
1.2.2 Programs in Development and Production
During development, you build the program in IVC Studio but the program is automatically
downloaded to the associated device.
When a program (or program step) is executed it is executed in the camera, and the
results are sent back to IVC Studio where they are displayed.
Program stepsTable values
ImagesResult values

Reference Manual Chapter 1
IVC-3D
©SICK AG • Advanced Industrial Sensors • www.sick.com • All rights reserved 13
IVC Studio
When the development of a program is finished and it is ready to be used, the program
(and table) is downloaded to the device and started.
After this it is not necessary to use IVC Studio any more. It may be used to display the
results from the program, for example to signal when faults occur. But the device can also
be used as a stand-alone unit, where other equipment is used for controlling the device
and displaying the output. For example, you could set up a web page on the camera and
then monitor the camera from a web browser on any computer on the network.
ProgramsTables
InputOutput
1.2.3 Saving Programs
When you save a product in IVC Studio, the included programs and tables are saved with
the product on the computer. Nothing is saved on the device when you save the product.
This is not a problem since the program associated with the device is automatically loaded
into the device as soon as the program is started or edited in IVC Studio.
Working Memory
ActiveProgram
ActiveTable
FlashMemory
ProgramBanks
1
2
3
4
5
...
ProductDevices
Camera 1
Camera 2Save in
Flash
AssociatedProgram
Copiedautomatically
Copy valuesmanually
AssociatedTable
The programs and tables may be stored manually on the device as well. The flash memory
in the device contains a number of program banks, each of which can contain a program
and a table.
When you store a program in the flash memory, you always store the active program and
table, which are currently in the working memory of the device.
A program stored in program bank 0 will automatically be started when the device is
powered up.

Chapter 1 Reference Manual
IVC-3D
14 ©SICK AG • Advanced Industrial Sensors • www.sick.com • All rights reserved
Functional Overview
1.3 Handling Multiple Products A device may be used in several products, using different programs and tables depending
on the product. This makes it easy to use the same camera for performing different in-
spections. Just create one product for each inspection, and in each product associate the
program and table to be used for the specific inspection.
For example, there are three cameras set up by a production line, and we are producing
two different items on this production line – a transparent bottle and an opaque jar. For the
bottle we can use IVC-2D cameras to inspect both the label on the front and the fill level,
but for the jar we need to use an IVC-3D camera to inspect the fill level.
Device 1
Device 3
Device 1
Device 2
Product: Jar
Dev Program Table1 Label Jar_Label_Table
3 Jar_FillLevel Jar_FillLevel_Table
Product: Bottle
Dev Program Table1 Label Bottle_Label_Table2 Bottle_FillLevel Bottle_FillLevel_Table
To achieve this we create two products in IVC Studio with the following contents:
Product: Bottle Device Program Table
1 Label Bottle_Label_Table
2 Bottle_FillLevel Bottle_FillLevel_Table
Product: Jar Device Program Table
1 Label Jar_Label_Table
3 Jar_FillLevel Jar_FillLevel_Table
When switching between producing the two products, we can simply open the product in
IVC Studio to load the corresponding programs and tables into the devices. If we would
change the design of the label for the bottle, we can just change the values in the table
Bottle_Label_Table to suit the new design. If necessary we could also make a copy of the
program Label, modify it, and associate the modified program with device 1.

Reference Manual Chapter 2
IVC-3D
©SICK AG • Advanced Industrial Sensors • www.sick.com • All rights reserved 15
Creating a Product
2 Getting Started In this chapter we will introduce the basics in IVC Studio and learn how to:
Create a product in IVC Studio in which to write the program
Write the program - that is adding program steps and setting parameters
Test and debug the program
As an example we will build a simple program that slices a loaf of bread in a number of
pieces of equal volume (or weight if we can assume that the density is constant). One way
to achieve this is to:
Capture a 3D image of the loaf
Calculate the total volume of the loaf and divide that volume with the desired number of
slices to get the volume of each slice
Move along the 3D image from one end to the other, while calculating the accumulated
volume of the part of the loaf that we have covered
Scanning direction
Slices
Accumulated volume
When the accumulated volume is equal to (or larger than) the desired volume of a slice,
the current position is stored and the accumulated volume is reset. In a real production
environment, the camera could control a knife that slices the loaf at the correct places.
When writing a program in IVC Studio you can use either a hardware camera or, if no such
is available, the Emulator.
In the following sections it is assumed that a hardware camera is used, and that both the
camera and IVC Studio are installed and are working properly. How to install the camera
and IVC Studio is described in the installation instruction. To capture 3D images you would
also need movement and some kind of trigger for triggering the 3D image grab. It is also
strongly recommended to use an encoder for capturing accurate 3D images.
How to use the Emulator is described in section Using IVC Studio in the IVC-3D Reference
Manual.
2.1 Creating a Product Before starting to write the program, we need the following:
A product to work with
A device to use in the product (in this case a camera)
A program written for the device
A table used for the program in the device

Chapter 2 Reference Manual
IVC-3D
16 ©SICK AG • Advanced Industrial Sensors • www.sick.com • All rights reserved
Getting Started
A product in IVC Studio is a collection of devices (usually cameras) that are used for per-
forming an inspection, for example of loafs of bread on a production line. Each device
contains one or more programs that instruct the device how to perform the inspection.
A program is a list of commands, or tools, that the device executes one by one, in order to
capture images, analyze them and draw conclusions from them. To its help, the program
has a table that it can read values from and store results in.
Product
Devices
Camera1
FillLevel FillTable
Label LabelTable
Camera2 Emulator
Programs Tables<< uses >>
2.1.1 Create a Product
The first step is to create the product to work with:
1. Start IVC Studio and log in.
If you just installed IVC Studio, the default user and password can be found in the
installation instruction.
2. Choose File New Product from the IVC Studio menu bar.
A new empty product named New Product is opened.
The main window shows the contents of the currently open product. The left pane shows
the different categories of objects that the product may contain, that is; devices, programs
and tables.
Clicking on one of the categories will display the objects contained in the product. Since
the product was just created, all categories are empty, with the exception of Devices,
which contains all devices that are available.
Left pane Right pane
There is also a fourth category that we haven’t mentioned yet - macros. Macros are basi-
cally small programs that you can call from within regular programs. They can be useful for
reusing blocks of program steps when writing advanced programs.

Reference Manual Chapter 2
IVC-3D
©SICK AG • Advanced Industrial Sensors • www.sick.com • All rights reserved 17
Creating a Product
2.1.2 Select a Device
The next step is to select the device used for the inspection:
3. Click Devices in the left pane of the main window.
The camera is displayed in the right pane. If there are more devices that can be used
by IVC Studio in your network, those will also be displayed there.
4. Select a device by clicking in the checkbox in front of it in the right pane.
You should always select the devices that you intend to use in your product. IVC Studio
periodically updates the information in the device list by polling the devices that are se-
lected in the list.
If no device is selected in the list, IVC Studio will poll every device it can find for information.
This slows IVC Studio down and may also affect the performance of devices used in other
applications.
2.1.3 Create a Program
We are now ready to create the program we intend to build and to associate it with a
device.
The reason for associating the program with a device before building it is that the program
is always run on a device and not on the computer. What you see in IVC Studio when
running a program are just the results, which are sent from the device. If you did not
associate the program with a device, you would not be able to see any result of the pro-
gram or even test the program.
5. Right-click Programs in the left pane of the main window and choose New Program
from the pop-up menu.
6. Fill in a name for the program in the dialog box and click OK.
7. Click Devices in the left pane of the main window.
8. In the right pane, right-click the device that is selected for the product and choose
Select Program from the pop-up menu.
9. Select the program in the list in the dialog box and click OK.
2.1.4 Create a Table
There must also be a table associated with the device, so before starting to build the
program we must create a table and associate it with the device:
10. Create the table by right-clicking Tables in the left pane, choosing New Table from the
pop-up menu and filling in a name in the dialog box.
11. Right-click the device that is selected for the product and choose Select Table from the
pop-up menu.
12. In the dialog box, select the table and click OK.
13. Finally, save your changes to the product on the PC by choosing File Save Product.

Chapter 2 Reference Manual
IVC-3D
18 ©SICK AG • Advanced Industrial Sensors • www.sick.com • All rights reserved
Getting Started
2.2 About Writing Programs Before starting to write the program, we will take a look at what a program consists of and
the programming environment.
2.2.1 Tools
A program is a list of commands – or tools – that are performed by the camera. When the
program runs, the commands are carried out one by one in the order that they appear in
the program list. So when you build a program in IVC Studio, you work with this list of
commands.
Most of the tools have a number of input parameters that can be set. For example when
capturing an image from a camera, you can specify in which image bank to store the
image.
�� ���� ���� ����
����� ����
��� ����� �� ����
���
�
����� ��� �
� �������� �� �� ��
�� ������� �� �����
����������� ���� �
�� ��������� �����
����� �
����� �
���
����
���
���
���
�� ���������� ���
����� �� ������
������� ����
��!���� ����
����
"����� ���� #
$%&
'%&
�� ���������� ��
(����� ������
)����� ����
�
*��
�� ���� ���� �� �
����� ����
��� ����� �� ����
���
�
����� ��� �
� �������� �� �� ���
!� ���������� �"� ��
(����� ������
)����� ����
�
+��,
(- .�� (-
#�$��
���
�
�
����
#/�
%��
��� ���
Many tools also produce results that are available as output parameters. These parame-
ters can be stored in the table or be used directly by other steps in your program.
Reference Manual Chapter 2
IVC-3D
©SICK AG • Advanced Industrial Sensors • www.sick.com • All rights reserved 19
About Writing Programs
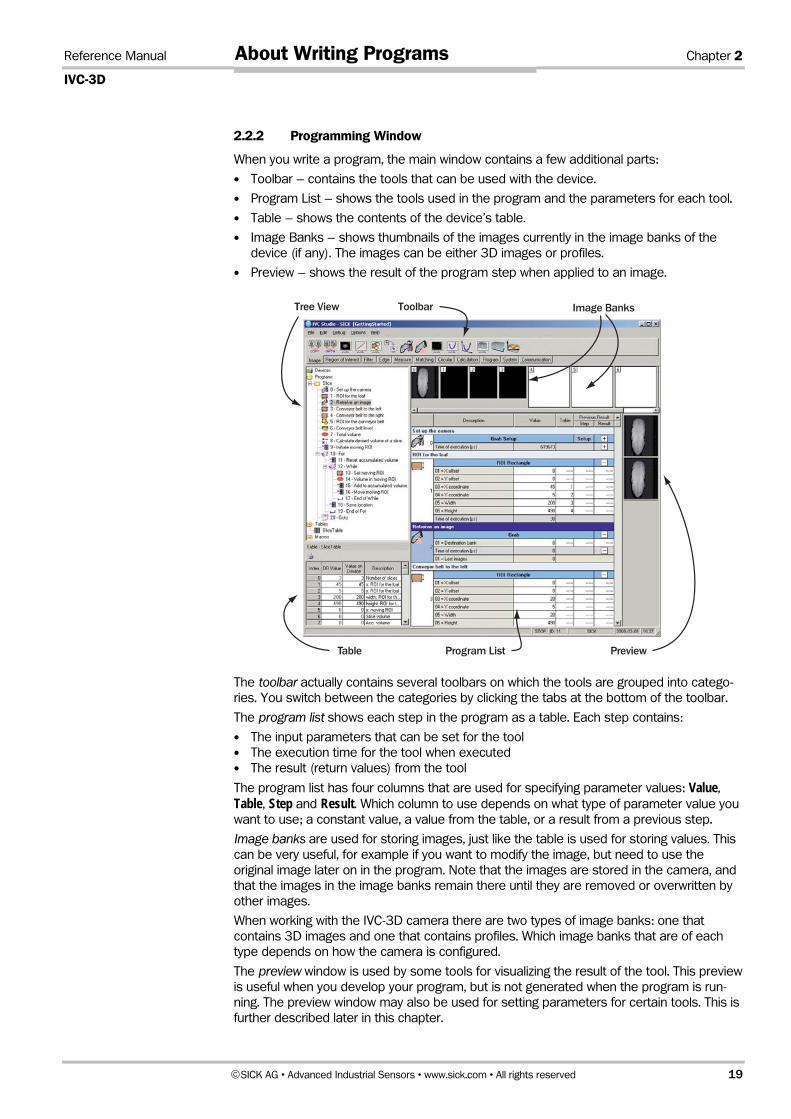
2.2.2 Programming Window
When you write a program, the main window contains a few additional parts:
Toolbar – contains the tools that can be used with the device.
Program List – shows the tools used in the program and the parameters for each tool.
Table – shows the contents of the device’s table.
Image Banks – shows thumbnails of the images currently in the image banks of the
device (if any). The images can be either 3D images or profiles.
Preview – shows the result of the program step when applied to an image.
ToolbarTree View Image Banks
PreviewTable Program List
The toolbar actually contains several toolbars on which the tools are grouped into catego-
ries. You switch between the categories by clicking the tabs at the bottom of the toolbar.
The program list shows each step in the program as a table. Each step contains:
The input parameters that can be set for the tool
The execution time for the tool when executed
The result (return values) from the tool
The program list has four columns that are used for specifying parameter values: Value,
Table, Step and Result. Which column to use depends on what type of parameter value you
want to use; a constant value, a value from the table, or a result from a previous step.
Image banks are used for storing images, just like the table is used for storing values. This
can be very useful, for example if you want to modify the image, but need to use the
original image later on in the program. Note that the images are stored in the camera, and
that the images in the image banks remain there until they are removed or overwritten by
other images.
When working with the IVC-3D camera there are two types of image banks: one that
contains 3D images and one that contains profiles. Which image banks that are of each
type depends on how the camera is configured.
The preview window is used by some tools for visualizing the result of the tool. This preview
is useful when you develop your program, but is not generated when the program is run-
ning. The preview window may also be used for setting parameters for certain tools. This is
further described later in this chapter.

Chapter 2 Reference Manual
IVC-3D
20 ©SICK AG • Advanced Industrial Sensors • www.sick.com • All rights reserved
Getting Started
2.3 Adding Program Steps Now we are ready to start writing our program for measuring and slicing the loaf of bread.
Start by adding the first program step to the program, which should grab a 3D image from
the camera:
14. Click on the name of your program in the left pane in the main window.
A toolbar is displayed at the top of the window, which contains a number of tools that
can be used with the device. Below the toolbar there is a row of tabs, which are used
for switching between different tool categories.
15. Click the Grab tool in the Image category on the toolbar to add the first step to the
program.
The Grab tool is added to the program’s folder in the left pane and to the Program List
in the right pane.
16. Double-click the blue field at the top of the program step and type a description for
the step, for example “Retrieve an image”.
The command is now added to our program. Before we can test the program and view the
image, we should set up the camera to grab the image that we want.
17. Click the Grab Setup tool on the Image toolbar.
18. In the dialog box that is displayed, choose ...before current step and click OK.
The Grab Setup step is added to the program list.
19. Add a description to the step, such as “Set up the camera”.
20. Double-click the Setup field that is located in the bottom left corner of the program
step in the program list.
The Grab Setup window is now opened.

Reference Manual Chapter 2
IVC-3D
©SICK AG • Advanced Industrial Sensors • www.sick.com • All rights reserved 21
Adding Program Steps
21. In the Grab Setup window, make the following settings:
Basic tab Field of view Adjust the sliders Height, Stand-off and Profile width so that you
can view the profile in the preview. You may also have to adjust
the Measurement settings to improve the quality of the profile.
Profile triggering Select Free-running or Encoder controlled, depending on whether
or not you have an encoder connected to the camera.
Analysis Select 3D Image analysis and fill in the number of profiles per
image.
Advanced tab
Profile triggering If you have an encoder, set the number of pulses per millimeter
and profile distance. Image triggering Select Free-running or Triggered by input signal depending on
whether or not you have a trigger connected to the camera.
We are now ready to run the program on the camera and view the image that was retrieved.
22. Click the Grab Setup step in the program list to select the step.
23. Press F1 to open up the Reference manual for the Grab Setup step.
24. Close the manual again and remember to use the F1 button whenever you want to
learn more about a tool.
25. Choose Debug Execute Step from the IVC Studio menu, or press the F5 key on the
keyboard.
26. Select the Grab step in the program list and choose Debug Execute Step once more.
An image is now retrieved from the camera and stored in image bank 0. Double-click
on the image bank to see the 3D image in a larger window, together with a
visualization of the image.
Chapter 2 Reference Manual
IVC-3D
22 ©SICK AG • Advanced Industrial Sensors • www.sick.com • All rights reserved
Getting Started
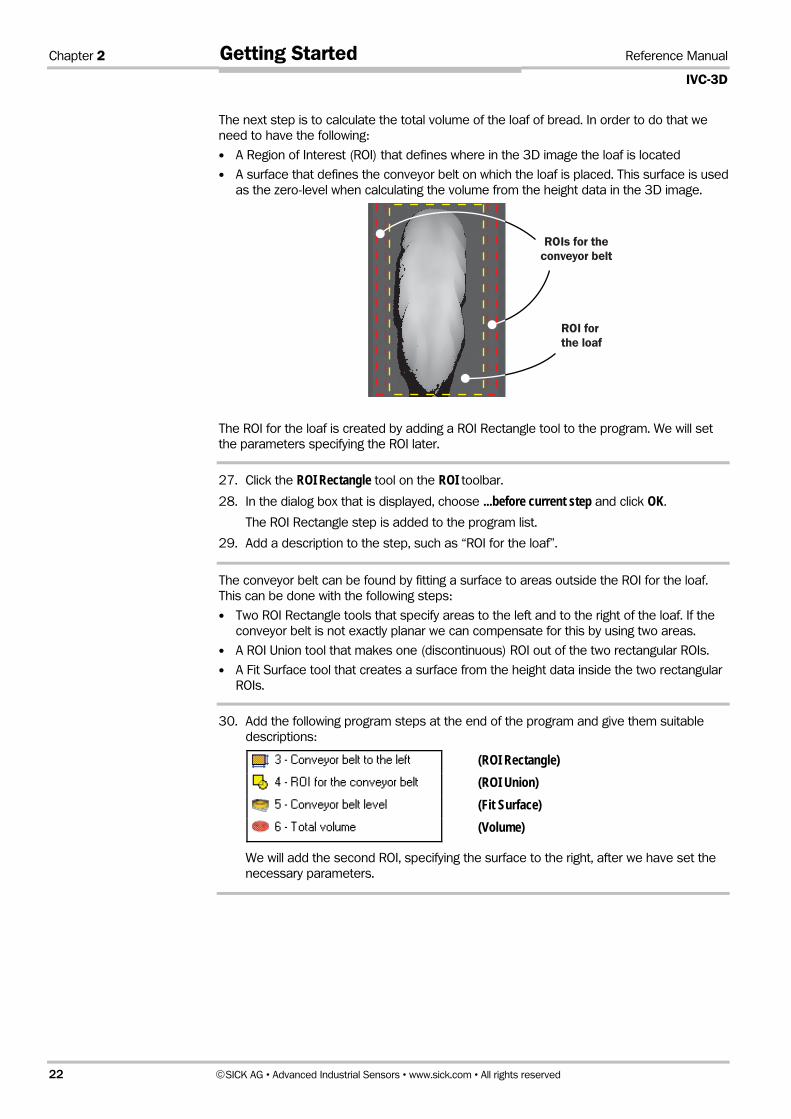
The next step is to calculate the total volume of the loaf of bread. In order to do that we
need to have the following:
A Region of Interest (ROI) that defines where in the 3D image the loaf is located
A surface that defines the conveyor belt on which the loaf is placed. This surface is used
as the zero-level when calculating the volume from the height data in the 3D image.
ROI for the loaf
ROIs for the conveyor belt
The ROI for the loaf is created by adding a ROI Rectangle tool to the program. We will set
the parameters specifying the ROI later.
27. Click the ROI Rectangle tool on the ROI toolbar.
28. In the dialog box that is displayed, choose ...before current step and click OK.
The ROI Rectangle step is added to the program list.
29. Add a description to the step, such as “ROI for the loaf”.
The conveyor belt can be found by fitting a surface to areas outside the ROI for the loaf.
This can be done with the following steps:
Two ROI Rectangle tools that specify areas to the left and to the right of the loaf. If the
conveyor belt is not exactly planar we can compensate for this by using two areas.
A ROI Union tool that makes one (discontinuous) ROI out of the two rectangular ROIs.
A Fit Surface tool that creates a surface from the height data inside the two rectangular
ROIs.
30. Add the following program steps at the end of the program and give them suitable
descriptions:
(ROI Rectangle)
(ROI Union)
(Fit Surface)
(Volume)
We will add the second ROI, specifying the surface to the right, after we have set the
necessary parameters.
Reference Manual Chapter 2
IVC-3D
©SICK AG • Advanced Industrial Sensors • www.sick.com • All rights reserved 23
Setting Parameter Values
2.4 Setting Parameter Values The input parameters of the tools can be set in a number of different ways:
By manually entering a constant value
By using interactive setup to set constant values
By retrieving a value from the table
By using the result from a previous step
By writing an expression that may combine the methods above
In this section we will look at different ways of setting constant parameter values. Using
tables, results from previous steps and expressions will be shown in the following sections.
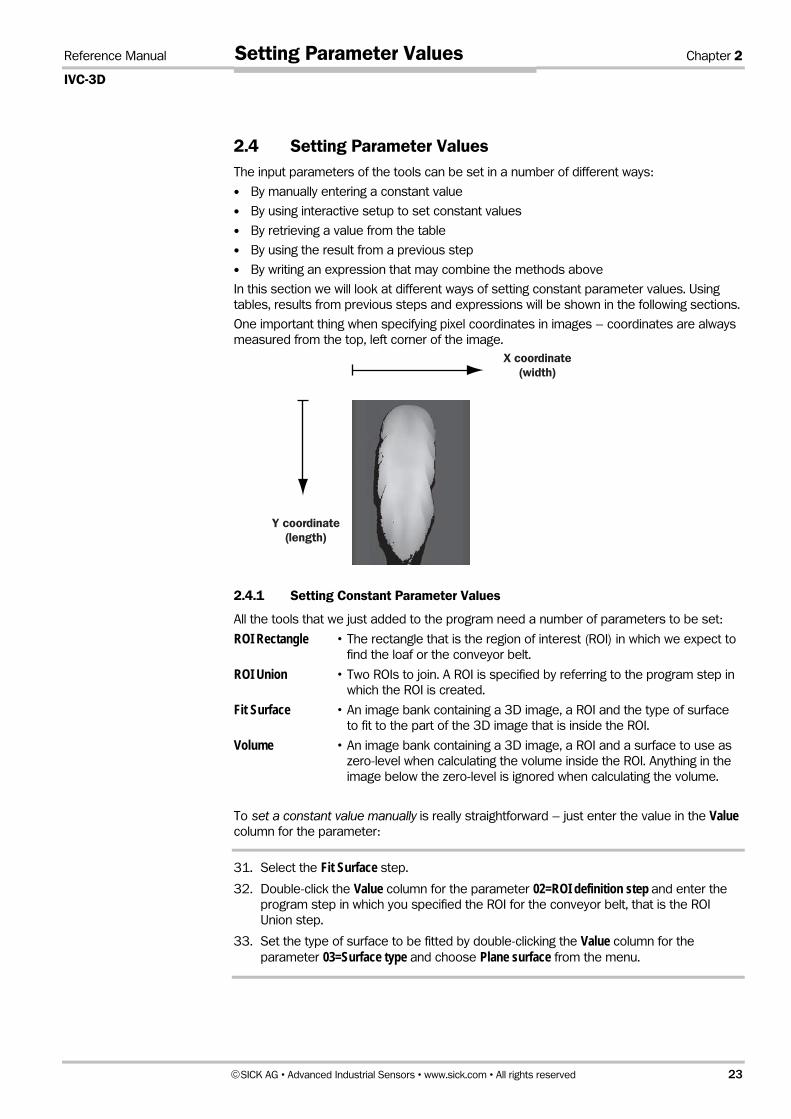
One important thing when specifying pixel coordinates in images – coordinates are always
measured from the top, left corner of the image.
X coordinate(width)
Y coordinate(length)
2.4.1 Setting Constant Parameter Values
All the tools that we just added to the program need a number of parameters to be set:
ROI Rectangle • The rectangle that is the region of interest (ROI) in which we expect to
find the loaf or the conveyor belt.
ROI Union • Two ROIs to join. A ROI is specified by referring to the program step in
which the ROI is created.
Fit Surface • An image bank containing a 3D image, a ROI and the type of surface
to fit to the part of the 3D image that is inside the ROI.
Volume • An image bank containing a 3D image, a ROI and a surface to use as
zero-level when calculating the volume inside the ROI. Anything in the
image below the zero-level is ignored when calculating the volume.
To set a constant value manually is really straightforward – just enter the value in the Value
column for the parameter:
31. Select the Fit Surface step.
32. Double-click the Value column for the parameter 02=ROI definition step and enter the
program step in which you specified the ROI for the conveyor belt, that is the ROI
Union step.
33. Set the type of surface to be fitted by double-clicking the Value column for the
parameter 03=Surface type and choose Plane surface from the menu.

Chapter 2 Reference Manual
IVC-3D
24 ©SICK AG • Advanced Industrial Sensors • www.sick.com • All rights reserved
Getting Started
Interactive setup windows are also used in some tools for entering parameter values. In
these windows captured images are used to provide feedback for the settings. Parameters
can be set interactively in three different ways:
In the Preview window
By clicking the button with three dots ( ), that is displayed when a parameter is
double-clicked
By double-clicking the Setup field that is displayed at the bottom left corner of certain
program steps
The Grab Setup window, which we used earlier to set up the camera, is one example of an
interactive setup window.
As another example, it is usually much easier to adjust the size and location of the ROI
directly in the image in a preview window than entering coordinates for the rectangle in the
Value column:
34. Select the ROI rectangle step “ROI for the loaf”.
A rectangle is shown in the upper preview window. This is the default ROI that is set
for a new ROI rectangle.
35. Move and resize the rectangle in the preview, so that it marks the area where you can
see the shape of the loaf of bread.
36. In a similar manner, set the ROI rectangle for the step “Conveyor belt to the left” so
that it marks a section of the empty area to the left of the loaf.
If you need a larger window to work in, you can double-click a preview to open it in a
separate window. In this window you can fine-tune the parameters settings, for example if
there are small details in the image.
Before moving along, we will just add the last ROI Rectangle (for the area to the right of the
loaf of bread) and set the rest of the parameters for the steps that we have added this far.
37. Select the “Conveyor belt to the left” step and choose Edit Copy from the main
menu.
38. Choose Edit Paste and paste the step after the current step.
39. Move the rectangle in the preview window to the right of the loaf of bread.
40. Change the description of the program step to “Conveyor belt to the right”.
41. Set the following parameters for the remaining steps:
ROI Union 01=ROI A definition step Step number of “Conveyor belt to the left”
02=ROI B definition step Step number of “Conveyor belt to the right”
Volume 02=ROI definition step Step number of “ROI for the loaf”
03= Surface definition step Step number of the Fit Surface tool
42. Execute all the steps in the camera by selecting the first ROI Rectangle step (“ROI for
the loaf”) and choose Debug Step by step or press the F8 key until all steps in the
program have been executed.

Reference Manual Chapter 2
IVC-3D
©SICK AG • Advanced Industrial Sensors • www.sick.com • All rights reserved 25
Setting Parameter Values
2.4.2 Using Tables and Results from Other Steps
The table is very useful for storing constants and results of calculations that we need to
use later.
For example, to calculate the desired volume of a slice of bread we can use the table for
setting the number of slices to make, and to store the desired volume of a slice to be used
later when we decide where to cut.
43. Double-click in the Value on Device column of an empty row in the table and fill in the
number of slices to make. Fill in a description of the value in the Description column of
the row, for example “Number of slices”.
The row is now highlighted in the table, indicating that the value on the device differs
from the value in the database.
44. In the table, right-click the value in the Value on Device column and choose Copy Device Value to the DB to synchronize the value on the PC with the value in the device.
45. Add a Mathematical Operation tool (from the Calculation toolbar) to the program.
46. Set the parameter 03=Mathematical operation to / (Division) and fill in a description.
47. Click in the Table column for the parameter 02=Variable B and type in the number of
the table row in which you entered the number of slices.
48. This tool can store the result of the calculation directly in the table, so double-click the
Value column of the parameter 04=Table index and fill in the number of an empty row in
the table. Remember to fill in a description of the value in the table.
To calculate the desired volume of a slice we also need the total volume, which we calcu-
lated in the previous step. We may store the total volume in the table and read the value
from there, but we can also retrieve the value directly from the returned values of the step.
49. Double-click the Step column of the parameter 01=Variable A.
A Previous result dialog box is displayed. Here you can select a result from a program
step to use as parameter value.
50. Choose the step number of the Volume step and then the first result from that step
(there is only one result to choose from) and click OK.
The number of the step and the result are entered in the Step and Result columns of
the 01=Variable A parameter and the current value is displayed in the Value column.

Chapter 2 Reference Manual
IVC-3D
26 ©SICK AG • Advanced Industrial Sensors • www.sick.com • All rights reserved
Getting Started
The next step in our problem is to find where to cut the loaf of bread. This can be solved in
the following way:
1. Set a thin ROI (1 pixel high) at the beginning of the loaf and set an accumulated
volume to 0.
2. Calculate the volume of the thin part of the loaf that is inside the ROI and add this
volume to the accumulated volume.
3. Move the ROI 1 pixel at a time and add the volume inside the ROI to the accumulated
volume.
4. When the accumulated volume becomes larger than the desired volume of a slice, cut
the loaf (or just mark the location) and reset the accumulated volume.
We will use the table for storing both the current location (y-coordinate) of the moving ROI
and the accumulated volume.
Since we start at the beginning of the loaf, we can initiate the location of the moving ROI
with the y-coordinate of the ROI for the loaf. This value is currently hard-coded into a
program step, but if we instead store the coordinates and size of the ROI for the loaf in the
table, we can easily read the coordinate we need when initiating the moving ROI.
51. In the program step “ROI for the loaf”, copy the values of the parameters 03=X coordinate, 04=Y coordinate, 05=Width and 06=Height and store them in the table. Fill in
descriptions for the table values and make in the program step read these values
from the table.
52. Add a Write to Table tool (from the System toolbar) to the program and set the
following parameters:
01=Value Row number in the table in which the y-coordinate of the ROI for the
loaf is stored.
02=Table index The table row in which to store the current location of the moving ROI.
We can now reset the accumulated volume, set the moving ROI and calculate the accumu-
lated volume.
53. Add another Write to Table tool and fill in the description “Reset accumulated volume”.
Set the following parameters:
01=Value 0
02=Table index The row number in the table in which to store the accumulated
volume. Remember to fill in a description of the value in the table.
54. Add a ROI Rectangle tool and fill in the description “Set moving ROI”. Set the following
parameters:
03=X coordinate The x-coordinate of the ROI for the loaf
04=Y coordinate The current location of the moving ROI
05=Width The width of the ROI for the loaf
06=Height 1
55. Add a Volume tool and fill in the description “Volume in moving ROI”. Set the following
parameters:
02=ROI definition step Step number of the “Set moving ROI” step
03=Surface definition step Step number of the Fit Surface tool

Reference Manual Chapter 2
IVC-3D
©SICK AG • Advanced Industrial Sensors • www.sick.com • All rights reserved 27
Setting Parameter Values
2.4.3 Setting Parameter Values with Expressions
To add the volume inside the moving ROI to the accumulated volume, we need to read the
current accumulated volume from the table, perform the addition and then store the new
value back to the table. By using an expression we can do all that in one program step.
56. Add another Write to Table tool and fill in the description “Add to accumulated volume”.
Set the following parameters:
01=Value =V<row> + S<step>R1
where <row> is replaced with the table row number in which the
accumulated volume is stored, and <step> is replaced with the
step number of the “Volume in moving ROI” above.
02=Table index The row number in the table in which the accumulated volume is
stored (the same as <row>).
The value of the parameter 01=Value is an expression that calculates a value each time this
step is performed. An expression always begins with an equal sign (=) and may contain:
Constant values 360, 4/7, etc.
Table values Vn for the value in row n
Results from other steps SmRn for result n of step m (for example S17R2)
Parameters (arguments) in other steps SmAn for input parameter n of step m
Functions sin(), abs(), etc.
Please note that a program using expressions will not necessarily execute faster than (or
even as fast as) a program where program steps are used for the same calculations. The
expressions need to be parsed each time the program step is executed, which will add
some time to the execution time.
Next, we will move the ROI 1 pixel to prepare for the next thin slice of loaf to be added to
the accumulated volume. We do that by increasing the location of the moving ROI by 1 – a
value that is stored in the table.
57. Select the program step “Add to accumulated volume” and choose Edit Copy.
58. Paste the step after the selected step. Change the description to “Move moving ROI”.
59. Change the following parameters of the “Move moving ROI” step:
01=Value =V<row> + 1
where <row> is replaced with the table row number in which the
location of the moving ROI is stored.
02=Table index The row number in the table in which the location of the moving
ROI is stored (the same as <row>).
2.4.4 Using Conditions and Jumps
Since we intend to move the ROI along the entire bread loaf, we need to repeat the last
steps. In fact we need two loops in order to solve our problem:
An inner loop that calculates the accumulated volume until we have a full slice, that is
when the accumulated volume is as large or larger than the desired volume for a slice.
An outer loop that runs from 1 to (the number of slices – 1) and takes care of the loca-
tions where we should cut the bread loaf (there is no need to cut after the last slice).
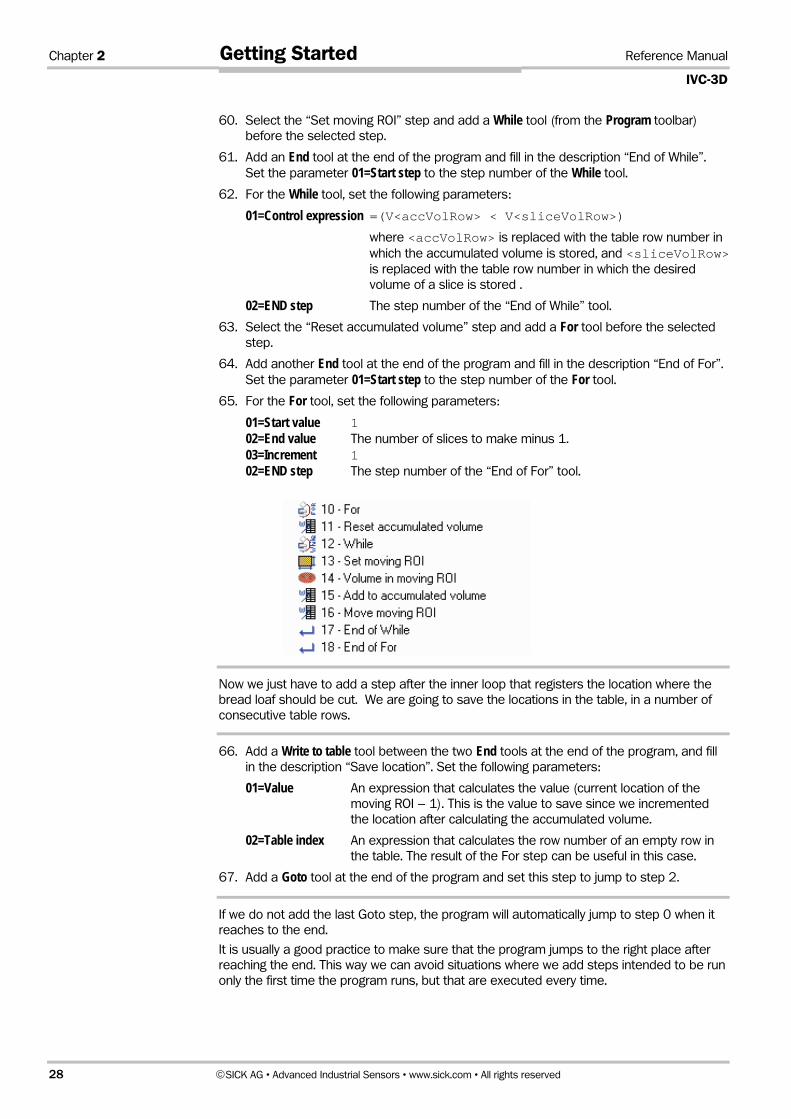
Chapter 2 Reference Manual
IVC-3D
28 ©SICK AG • Advanced Industrial Sensors • www.sick.com • All rights reserved
Getting Started
60. Select the “Set moving ROI” step and add a While tool (from the Program toolbar)
before the selected step.
61. Add an End tool at the end of the program and fill in the description “End of While”.
Set the parameter 01=Start step to the step number of the While tool.
62. For the While tool, set the following parameters:
01=Control expression =(V<accVolRow> < V<sliceVolRow>)
where <accVolRow> is replaced with the table row number in
which the accumulated volume is stored, and <sliceVolRow>
is replaced with the table row number in which the desired
volume of a slice is stored .
02=END step The step number of the “End of While” tool.
63. Select the “Reset accumulated volume” step and add a For tool before the selected
step.
64. Add another End tool at the end of the program and fill in the description “End of For”.
Set the parameter 01=Start step to the step number of the For tool.
65. For the For tool, set the following parameters:
01=Start value 1 02=End value The number of slices to make minus 1.
03=Increment 1
02=END step The step number of the “End of For” tool.
Now we just have to add a step after the inner loop that registers the location where the
bread loaf should be cut. We are going to save the locations in the table, in a number of
consecutive table rows.
66. Add a Write to table tool between the two End tools at the end of the program, and fill
in the description “Save location”. Set the following parameters:
01=Value An expression that calculates the value (current location of the
moving ROI – 1). This is the value to save since we incremented
the location after calculating the accumulated volume.
02=Table index An expression that calculates the row number of an empty row in
the table. The result of the For step can be useful in this case.
67. Add a Goto tool at the end of the program and set this step to jump to step 2.
If we do not add the last Goto step, the program will automatically jump to step 0 when it
reaches to the end.
It is usually a good practice to make sure that the program jumps to the right place after
reaching the end. This way we can avoid situations where we add steps intended to be run
only the first time the program runs, but that are executed every time.

Reference Manual Chapter 2
IVC-3D
©SICK AG • Advanced Industrial Sensors • www.sick.com • All rights reserved 29
Testing and Running the Program
2.5 Testing and Running the Program How do we know that the program we have written this far is working properly?
One way is to step through the program using Debug Execute Step and Debug Step by Step. The result of each step is shown in the preview window and the Value column of each
parameter.
68. Use Debug Execute Step and Debug Step by Step to step through the program and
make sure that it gives the correct result.
Another way is to add some program steps that display the result of the analysis and run
the program.
69. Add a Copy image bank tool after the first Grab step.
We add this step in order to have a copy of the image to draw in. If we draw in the
original image the analysis could be affected. Also make sure that the bank is not
already used.
70. Add a Draw ROI tool after the Copy image bank tool.
This step draws the region of interest in the image. Make sure to draw in the image
bank with the copy of the image.
71. Add a Draw line tool after the “Save location” step. Set the parameters 01=Start point X, 02=Start point Y, 03=End point X and 04=End point Y so that the tool draws a line across
the ROI for the loaf at the location of the cut, which is stored in the table. Make sure to
draw in the correct image bank.
72. Add a Display tool after the “End of For” step and set the parameter so that it displays
image bank 1.
73. Choose Debug Run and watch the result in the Display window.
We are now done writing the example program, but there are – at least – two more func-
tions that could be added to the program:
Making the cuts.
We could use either the outputs of the camera to directly control a knife that cuts the
loaf of bread, or we could have another device that controls the knife and send the lo-
cations where to cut to that device using either RS485 or Ethernet.
Before sending the locations, remember that the values stored in the table have the
unit “pixels”. It would probably be a good idea to get the calibrated positions (in millime-
ters) before passing them on.
Improving the precision of the program.
Every slice – except the last one – will be slightly larger than the desired volume. This is
because we are working with a resolution of 1 pixel along the y-axis, and do not make
the cut until the accumulated volume is larger than the desired volume. If we add a
interpolation calculation that can give us a sub-pixel position where the accumulated
volume exceeds the desired volume, the precision of program could be greatly
improved.
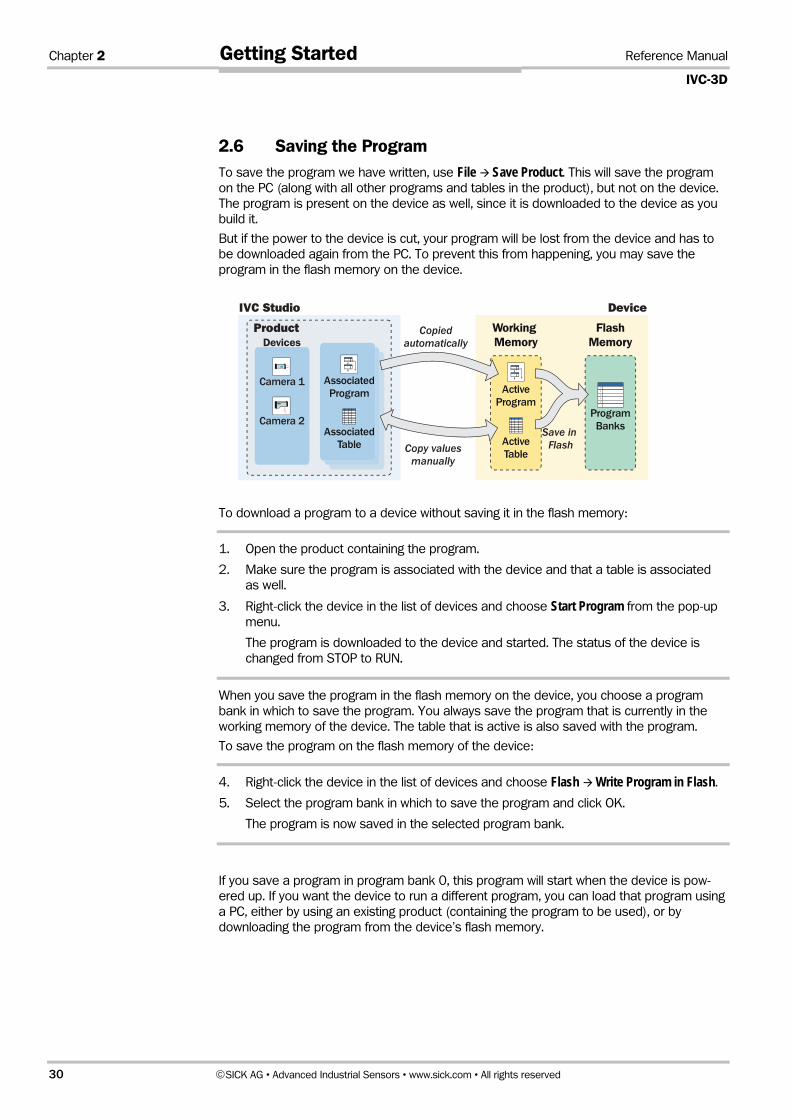
Chapter 2 Reference Manual
IVC-3D
30 ©SICK AG • Advanced Industrial Sensors • www.sick.com • All rights reserved
Getting Started
2.6 Saving the Program To save the program we have written, use File Save Product. This will save the program
on the PC (along with all other programs and tables in the product), but not on the device.
The program is present on the device as well, since it is downloaded to the device as you
build it.
But if the power to the device is cut, your program will be lost from the device and has to
be downloaded again from the PC. To prevent this from happening, you may save the
program in the flash memory on the device.
Working Memory
ActiveProgram
ActiveTable
FlashMemory
ProgramBanks
1
2
3
4
5
...
Product
IVC Studio Device
Devices
Camera 1
Camera 2Save in
Flash
AssociatedProgram
Copiedautomatically
Copy valuesmanually
AssociatedTable
To download a program to a device without saving it in the flash memory:
1. Open the product containing the program.
2. Make sure the program is associated with the device and that a table is associated
as well.
3. Right-click the device in the list of devices and choose Start Program from the pop-up
menu.
The program is downloaded to the device and started. The status of the device is
changed from STOP to RUN.
When you save the program in the flash memory on the device, you choose a program
bank in which to save the program. You always save the program that is currently in the
working memory of the device. The table that is active is also saved with the program.
To save the program on the flash memory of the device:
4. Right-click the device in the list of devices and choose Flash Write Program in Flash.
5. Select the program bank in which to save the program and click OK.
The program is now saved in the selected program bank.
If you save a program in program bank 0, this program will start when the device is pow-
ered up. If you want the device to run a different program, you can load that program using
a PC, either by using an existing product (containing the program to be used), or by
downloading the program from the device’s flash memory.

Reference Manual Chapter 2
IVC-3D
©SICK AG • Advanced Industrial Sensors • www.sick.com • All rights reserved 31
What’s Next?
2.7 What’s Next? In this chapter we have looked at the basics of how to handle IVC Studio, such as setting
up a product and writing a simple program. However, there are many features in IVC Studio
and the camera that have not been covered, which makes it possible to write advanced
programs for inspections and automation of production. Some of the features are:
Using the camera as a stand-alone unit
Using several devices in a product
Using several programs on a single device
Using Cameras Stand-alone Once the program is developed it can be downloaded to the device and started. Now the
program will run in the device until it is stopped, and it is no longer necessary to use IVC
Studio. If the program is also saved in program bank 0 on the flash memory, the program
will be started when the device is powered up.
If you want to interact with the device, you can write a program that for example communi-
cates with other equipment via the RS485 port, or set up a web page in the camera that
can be used for monitoring and controlling the device in a web browser on a PC.
Using Several Devices A product may use several devices that each performs a certain inspection. It is also
possible to use the same device in several products and let the device run different
programs depending on the current product.
Device 1
Device 3
Device 1
Device 2
Product: Jar
Dev Program Table1 Label Jar_Label_Table
3 Jar_FillLevel Jar_FillLevel_Table
Product: Bottle
Dev Program Table1 Label Bottle_Label_Table2 Bottle_FillLevel Bottle_FillLevel_Table
To use several devices in the product, simply select the devices by clicking the checkbox in
front of them in the main window.
When the development is finished you can easily download the programs and tables to all
included devices at once by right-clicking Devices in the left pane of the main window and
choosing Product Transmission. This will also start the programs in the devices.
Using Several Programs While there can be only one program in the working memory, additional programs can be
stored in the flash memory of the device. These programs can either be loaded manually
into the working memory, or they can be called from the active program.
To load a program manually, use IVC Studio to associate the program with the device
and then start the program. This requires that the program is available in the product
that is open in IVC Studio.
If the program is not available on the PC, you can retrieve it from the device by right-
clicking the device in the list of devices and choosing Flash Import Program from Flash. To call a program stored in flash from the active program, please refer to the Tools
section of this manual for information on which tool to use.
Note that calling a program stored in flash will load both a program and a table into the
working memory of the device, replacing the previous program and table there.

Chapter 3 Reference Manual
IVC-3D
32 ©SICK AG • Advanced Industrial Sensors • www.sick.com • All rights reserved
Using IVC Studio
3 Using IVC Studio 3.1 Handling Devices Note: Do not connect to, configure or view live images from a camera that is already
used through another PC. A camera can only be connected to one PC at a time.
IVC Studio will only detect an Emulator running on the same PC.
3.1.1 Installing and Configuring
Configuring Ethernet The Ethernet configuration depends on how the device (camera) is connected to the PC.
To configure a device
Choose Options Configuration from the IVC Studio menu bar.
A window containing a tree view is displayed.
Select Ethernet Devices in the tree view.
The Ethernet devices dialog is displayed in the right pane in the
window.
Click the Ethernet Device Configuration button.
The Ethernet Device Settings window is displayed, containing a list
of available devices.
Select a device from the list.
The current settings of that device are displayed in the right pane.
Double-click the IP number parameter value and change it.
Click Update.
Viewing Live Image
To view a camera image for IVC-2D
Click Devices in the left pane.
The available cameras, devices, are listed in the right pane.
Double-click the device or right-click the device and choose Live Device from the pop-up menu.
A live image is displayed in a pop-up window.
Clicking the handle of the drawer on the right of the image window
displays sliders for Shutter, Gain, and Strobe.
To view a camera image for IVC-3D
Select the program currently associated with the device, or create
a new program and associate it with the device.
Add a Grab Setup tool to the program by clicking on the Grab Setup icon in the Image toolbar.
Double-click the Setup button at the bottom left corner of the
program step.
The Grab Setup window is displayed. A live image of the profile is
shown in side the white box in the right pane in the window.
Setting Number of Image Banks
To change the number of Image Banks used by the device
Choose Options Configuration from the IVC Studio menu bar.
A window containing a tree view is displayed.
Select Ethernet Devices in the tree view.
Ethernet devices are displayed in the right pane in the window.
Click the Ethernet Device Configuration button.
The Ethernet Device Settings window is displayed containing a list
of available devices.
Select a device from the list.
The current settings of that device are displayed in the right pane.
Change the value of the parameter Image Banks.
For IVC-3D, change the value of the parameter Profile Banks.
Click Update.

Reference Manual Chapter 3
IVC-3D
©SICK AG • Advanced Industrial Sensors • www.sick.com • All rights reserved 33
Handling Devices
Loading Device Firmware
Firmware contains information on the available tools and how they perform. You load new
firmware to upgrade IVC Studio with new tools.
To load device firm-ware
Choose File Load Device Firmware.
Note: Do not interrupt the loading of firmware once it has started.
Do not disconnect the power or the network connection to
the device until the device is shown again in the list of de-
vices in the IVC Studio main window (that is listed with the
status RUNNING or STOP)
3.1.2 Starting, Stopping, and Resetting Devices
The device can be in one of three states:
run
stop
error
Resetting the device restarts the processor in the camera. This may be necessary if the
device is stalled.
To start running a program in a device
Right-click the device and choose Start Program from the pop-
up menu, or press F6. The program keeps running until it is
stopped.
To view the result when using an IVC-2D, right-click the
device and choose Live Device from the pop-up menu.
To stop a program Right-click the device and choose Stop Program from the pop-
up menu.
To reset a device Choose Options Configuration from the IVC Studio menu
bar.
A pop-up window containing a tree view appears.
Select Ethernet Devices in the tree view.
Ethernet devices appear in the right panel of the pop-up
window.
Click the Ethernet Device Configuration button.
The Ethernet Device Settings window appears containing
available devices.
Right-click the device and choose Reset Device from the pop-
up menu.
3.1.3 Handling Memory in Camera
Saving camera memory is useful for backup purposes. The camera contains image banks,
a data block memory and a Flash memory. For more information on the Flash memory see
section Handling Programs on the Camera.
Image banks and data block memory are used for storage during program execution.
When starting to develop a new program, it may be useful to refresh the memory in order
to make sure that no old data affects the new program. The contents of the image banks
can also be saved to disk.
To save the data block memory from the camera to a PC file
Right-click the device and choose Device Management Save Data Block to File from the pop-up menu.
To save an image bank to disk
Right-click image bank in the active program window and
choose Save Image Bank to Disk from the pop-up menu. See
section Handling Images for more information on handling
image banks.

Chapter 3 Reference Manual
IVC-3D
34 ©SICK AG • Advanced Industrial Sensors • www.sick.com • All rights reserved
Using IVC Studio
To reset data block memory
Right-click the device and choose Device Management Reset Data Block from the pop-up menu.
To reset image banks Right-click the device and choose Device Management Reset Banks from the pop-up menu. It is also possible to
reset the image banks one by one when a program is open.
See chapter Handling Images for more information.
To restore data block memory from a PC file
Right-click the device and choose Device Management Load Data Block from File from the pop-up menu.
3.1.4 Viewing Device Information
Information is available on the status of devices and errors that have occurred. The infor-
mation can be refreshed on one or all devices.
To view device infor-mation
Right-click the device and choose Device management Device Information from the pop-up menu.
This window contains detailed information about the device,
such as hardware and software versions, Ethernet information
and the status of the device.
To view the status of running program, inputs and outputs
Right-click the device and choose Device management Signal Status from the pop-up menu.
This window shows the status of inputs and outputs of the
device. If a program is running you can also see which program
steps that are performed at the moment
To refresh displayed information on a checked device
Choose Options Refresh from the IVC Studio menu bar or
press F5.
To refresh and dis-play information on all devices
Choose Options Update All from the IVC Studio menu bar or
press Ctrl F5.

Reference Manual Chapter 3
IVC-3D
©SICK AG • Advanced Industrial Sensors • www.sick.com • All rights reserved 35
Handling the Emulator
3.2 Handling the Emulator The Emulator is a software program in IVC Studio that behaves like a hardware camera. It
makes it possible to write or update programs when there is no hardware camera avail-
able. The Emulator can behave as (emulate) both 2D and 3D cameras. Each product in
IVC Studio can contain several devices, but only one emulated camera.
The main difference between the Emulator and a camera is that the former uses a prede-
fined set of images stored in a dedicated image folder on the PC, whereas the latter views
live images. Not all tools are emulated by the Emulator; these tools are marked with [Not emulated] in the user interface. Interactive setups are not available for non-emulated tools.
The Grab tool functions differently when the Emulator is used. This is described in section
Using the Grab and the Grab Setup Tools below.
The execution time of a tool when using the emulator depends on the performance of the
PC. This time is not the same as the execution time when the tool is executed on a hard-
ware camera. This means that the field “Time of execution (us)” in the step program view
cannot be used in a calculation of the expected cycle time for the application when the
emulator is used.
From the Emulator menu in the menu bar you can enable and disable the Emulator, and
change its settings. In the Emulator settings dialog you can choose which camera type to
emulate, select which folder to capture pre-recorded images from, and choose to enable
the Emulator automatically when starting IVC Studio.
3.2.1 Preparing images for the Emulator
Instead of viewing live images, the Emulator captures pre-recorded images. Before starting
the Emulator it is thus necessary to prepare images. This is done by recording images that
are captured by a real camera. The images must be saved in the raw format (.raw or .img)
for IVC-3D and IVC-2D, or bitmap (.bmp) for IVC-2D, in a version of IVC Studio that sup-
ports the Emulator. When saving an image, the Grab Setup parameters are stored in the
image file and can be read by the Emulator.
To record images Use a camera of the same type that you will emulate.
Select or write a program containing a Grab Setup tool defining
how to captures images, a Grab tool to capture the images, and a
Send to FTP tool to store the images in raw format in a selected
folder. The PC receiving the images must have an FTP server
running.
To use recorded images in the
Choose Emulator Settings… from the IVC Studio menu bar.
The Emulator settings dialog box is opened.

Chapter 3 Reference Manual
IVC-3D
36 ©SICK AG • Advanced Industrial Sensors • www.sick.com • All rights reserved
Using IVC Studio
Emulator Click Browse… and select a folder containing recorded images.
The Emulator camera type must be of the same type that was
used when recording the images.
Click OK.
3.2.2 Basics
To enable the Emulator
Choose Emulator Enable… from the IVC Studio menu bar.
The Emulator settings dialog box is opened.
Select which camera type to emulate from the drop-down list.
Enter a numeric camera ID. The ID must be unique within the
Product. Maximum length is 9 digits.
Click Browse… and select a folder containing pre-recorded
images. The Emulator camera type must be of the same type
that was used when recording the images.
Click OK.
To disable the Emulator
Choose Emulator Disable from the IVC Studio menu bar.
The Emulator disappears from the list of Devices.
To enable the Emulator auto-matically
Choose Emulator Settings… from the IVC Studio menu bar.
The Emulator settings dialog box is opened.
Tick Enable Emulator when launching IVC Studio and click OK.
The Emulator is now automatically enabled when starting IVC
Studio.
To change the Emulator settings
Choose Emulator Settings… from the IVC Studio menu bar.
If Type, ID, Number of image banks or Number of profile banks
is changed, the Emulator will be restarted.
To access the flash disk of the Emula-tor
The flash disk of the Emulator is found on the PC under My
Documents (Documents in Vista) for the current user. The default
path to the Emulator flash is:
My Documents\SICKIVP\SmartCameras\IVC Studio x.x\ Emula-
tor\flash
3.2.3 Using the Grab and the Grab Setup Tools
Each time the Grab tool is executed a new image is read from the image source. The
name of this image file is displayed as a result parameter of the Grab step, and the Grab
Setup parameters saved in the image file are used to update the image banks.
The program thus works as if a Grab Setup step with these settings were executed.
3.2.4 Using Old Images in an Emulated 3D Camera
It is possible to use images that are captured with a version of IVC Studio that does not
support the Emulator. The Grab Setup tool then needs to be executed with the same
settings as were used when capturing the images, since the images do not contain any
setup information.
To use old images in an emulated 3D camera
Choose Emulator Settings… from the IVC Studio menu bar,
select the desired image source folder, and click OK.
Configure a Grab Setup step with the same settings that were
used when the images were captured.

Reference Manual Chapter 3
IVC-3D
©SICK AG • Advanced Industrial Sensors • www.sick.com • All rights reserved 37
Handling the Emulator
Execute the Grab Setup step.
Execute the Grab step.
3.2.5 Using a Non-Emulated Tool in the Emulator
Some tools are not emulated by the Emulator. When executed in the Emulator, they return
the default values of all parameters. Interactive setups are not available for non-emulated
tools.

Chapter 3 Reference Manual
IVC-3D
38 ©SICK AG • Advanced Industrial Sensors • www.sick.com • All rights reserved
Using IVC Studio
3.3 Handling Products A product in IVC Studio is a collection of devices, programs and tables. A device can be
either a hardware camera or an Emulator.
Product
Devices
Camera1
FillLevel FillTable
Label LabelTable
Camera2 Emulator
Programs Tables<< uses >>
3.3.1 Basics
To create a new product
Choose File New Product from the IVC Studio menu bar.
An empty product named New Product is opened.
To open a product Choose File Open Product… from the IVC Studio menu bar. Select a product in the dialog box and click OK.
To save a product Choose File Save Product from the IVC Studio menu bar.
If you try to open another product or to close IVC Studio without
saving the presently active product a dialog box appears prompt-
ing you to do so.
If the product has not yet been saved, a dialog box is displayed.
Type the name of the product and click OK.
To make a copy of the current product
Choose File Save Product As… from the IVC Studio menu bar.
Type the name of the new product and click OK.
To revert to the last saved version of the current product
Choose File Revert… from the IVC Studio menu bar.
The product files can be stored in two formats; the standard .prd and a new extended
format (.prc) that also contains a checksum. The checksum is used to verify the integrity of
the product file to ensure that the contents have not been altered, e.g. by a problem in a
zip/unzip-procedure.
The new format is not compatible with IVC Studio versions prior to 3.1 SR1. The old format
is still supported, and existing files can easily be converted to the new format by using
“Save As” in IVC Studio 3.1 SR1 or higher.

Reference Manual Chapter 3
IVC-3D
©SICK AG • Advanced Industrial Sensors • www.sick.com • All rights reserved 39
Handling Products
3.3.2 Managing Devices Used in a Product
You should always check the devices you are using in order to decrease the execution
time. IVC Studio continuously updates the information about the status of all devices in the
device list, but if you check the devices you currently use, the list is only updated with
information about these, which saves time.
To check/uncheck a device
Select Devices in the left pane and click on the checkbox in
front of the device.
To uncheck all devices
Select Devices in the left pane. Right-click a device in the right
pane and choose Uncheck All Devices from the pop-up menu.
3.3.3 Associating Programs and Tables with a Device
Both a program and a table have to be associated with the device in order for the program
to be able to run.
To associate a program to a device
Right-click the device and choose Select Program from the pop-
up menu. Select a program from the pop-up dialog and click OK
to associate it with the device.
To associate a table Right-click the device and choose Select Table from the pop-up
menu. Select a table from the pop-up dialog and click OK.
To import a program from another product
Right-click Programs in the tree view and choose Import Program from the pop-up menu.
3.3.4 Handling Products
To start all devices in a product
Right-click Devices in the left pane and choose Product Trans-mission from the pop-up menu.
To stop all devices in a product
Right-click Devices in the left pane and choose Stop Product from the pop-up menu.

Chapter 3 Reference Manual
IVC-3D
40 ©SICK AG • Advanced Industrial Sensors • www.sick.com • All rights reserved
Using IVC Studio
3.4 Handling Programs Programs are developed on a PC. During development a copy of the program is main-
tained in the device. Programs are always run in the camera, even during development. A
camera can contain several programs, but after a shutdown it always runs the one in
program bank zero in the Flash memory.
If you don’t want to start from scratch when building a program, you may instead import a
program used in another product or retrieve a program that is stored in a device. To import
a program from another product, the program must first be exported to a file on the com-
puter.
Working Memory
ActiveProgram
ActiveTable
FlashMemory
ProgramBanks
1
2
3
4
5
...
Product
IVC Studio Device
Devices
Camera 1
Camera 2Save in
Flash
AssociatedProgram
Copiedautomatically
Copy valuesmanually
AssociatedTable
3.4.1 Handling Programs on PC
Basics
To create a new program
Right-click Programs in the tree view and choose New Program
from the pop-up menu.
To delete a program Right-click the program in the tree view and choose Delete Program from the pop-up menu.
To rename a program Right-click the program in the tree view and choose Rename Program from the pop-up menu. Write the new name in the
dialog box that is displayed.
To print a program Right-click the program in the tree view and choose Print Program from the pop-up menu.
To view program information
Right-click program in the tree view and choose Program Information from the pop-up menu.
A pop up window displays information such as program name
and dates of creation and last change and who made the
latest changes to the program.

Reference Manual Chapter 3
IVC-3D
©SICK AG • Advanced Industrial Sensors • www.sick.com • All rights reserved 41
Handling Programs
Copying, Importing, and Exporting Programs
To make a copy of a program
Right-click the program in the tree view and choose Copy Program from the pop-up menu. Click YES to confirm and
name the new program.
To import a program from a file on the PC
Right-click Programs or one of the programs in the tree view in
the left pane and choose Import Program from the pop-up
menu.
To export a program to a file on the PC
Right-click the program in the tree view and choose Export Program from the pop-up menu.
3.4.2 Handling Programs on the Camera Flash
To write product in flash
Right-click Devices in the left pane and choose Write Product in Flash from the pop-up menu. The currently associated prod-
uct and table is stored on the camera flash in position 0 for
each of the devices in the Device list. No action is performed
if the device is not associated with a program in the current
product.
To store a program in flash memory on the device
Right-click the device and choose Device Management Flash Write Program in Flash from the pop-up menu. Select a
memory position in the dialog window and click Save. The
table is automatically stored with the program.
To delete programs stored in flash
Right-click the device and choose Device Management Flash Delete Stored Program in Flash from the pop-up menu. This
deletes the program in the selected position in the flash
memory. It is also possible to delete multiple programs by
selecting more than one position.
To clear unused memory on flash
When a program is deleted from flash, the flash blocks
occupied by the program is not immediately reused but
marked as unused (dead). The unused memory will not be
reused until there is no more free memory on the device. This
is done in order to minimize the wear of the flash memory.
To reuse a block of unused memory, it must first be cleared.
Clearing the memory takes some time and may affect the
performance of the device. To restore the performance, the
unused memory can be cleared manually.
To clear unused memory, right-click the device and choose Device Management Flash Clear unused memory from the
pop-up menu. In the dialog box that is displayed, click Start and wait for the device to be finished.
To import programs from flash program bank to PC
Right-click the device and choose Device Management Flash Import Program From Flash from the pop-up menu. Select a
program in the pop-up dialog window and click Save. The
associated table is automatically imported with the program.
3.4.3 Handling the Camera Flash
The flash disk of the IVC camera can be used to store programs, images, data blocks and
tables. The disk is also used by the web server to store HTML files. The FTP server on the
camera allows for external access to the contents of the flash disk.
For details regarding the handling of the flash disk, please refer to in the section
Troubleshooting.

Chapter 3 Reference Manual
IVC-3D
42 ©SICK AG • Advanced Industrial Sensors • www.sick.com • All rights reserved
Using IVC Studio
3.5 Handling Tables Tables are used to store parameters and other values that a program uses.
The index column shows a row number in the table.
The DB Value column shows the value that is currently stored on the PC.
The Value on Device column shows the current value stored on the device.
In the description column you can add descriptive names for the values in the table.
The values on the PC and the device are not automatically synchronized. Therefore the
values have to be copied manually between the two.
3.5.1 Basics
To create a new table Right-click Tables in the tree view in the left pane and choose
New Table from the pop-up menu.
To show the contents of a table
Right-click the table in the tree view and choose Show Table from
the pop-up menu.
To rename a table Right-click the table in the tree view and choose Rename Table
from the pop-up menu.
To delete a table Right-click the table in the tree view and choose Delete Table
from the pop-up menu.
3.5.2 Copying, Importing, and Exporting Tables
To make a copy of a table
Right-click the table in the tree view and choose Copy Table
from the pop-up menu. Click YES to confirm and name the new
table.
To import a table from a file on the PC
Right-click Tables or a table in the tree view and choose Import Table from the pop-up menu.
To export a table to a file on the PC
Right-click the table in the tree view and choose Export Table from the pop-up menu.
To store a table in the flash memory on a device, store the program associated with the
table. To import a table from a device, import the associated program. When writing a table
to the flash memory on a device, the descriptions are not saved, and are therefore not
included when the table is imported from the device.
Reference Manual Chapter 3
IVC-3D
©SICK AG • Advanced Industrial Sensors • www.sick.com • All rights reserved 43
Handling Images
3.5.3 Handling Table Values
To enter a parameter value in the table
Right-click the table in the tree view in the left pane and choose
Show table, or double-click the table in the tree view. A separate
table window opens. Double-click the cell in the Value on Device
column and enter a value. Close the table window and click
YES to save the entered values.
To copy a parameter value from the PC to the device
Right-click the device and choose Show Table from the pop-up
menu. Right-click the row in the DB Value column and choose
Copy DB Value to the Device from the pop-up menu.
To set parameter comment in the table
Right-click the table in the tree view in the left pane and choose
Show table, or double-click the table in the tree view. A separate
table window opens. Double-click the cell in the Description
column and enter a comment. Close the table window and click
YES to save the entered values.
To save the table in the flash memory
Right-click the device and choose Device Management Flash Write Program in Flash from the pop-up menu. Select a memory
position in the pop-up dialog window and click Save. The table
is automatically stored with the program.
3.6 Handling Images Images are saved in image banks during program execution. The image banks (and their
current contents) are displayed in the active program window at the top of the right pane.
Images that are saved to disk on the PC can be loaded back into an image bank. You can
also save some images to disk in another file format by choosing Export…, but such files
cannot be loaded to the device.
Note that when loading an image to an IVC-3D camera, the camera must have the same
settings for field-of-view (FOV) and length as when the image was saved.
To change size of the image bank thumb-nails or previews
Place the cursor on border that surrounds the area where the
bank thumbnails or previews. The cursor will change to two
arrows.
Then click on the border and drag it to resize the thumbnails or
previews.
To save an image bank to disk
Right-click the image bank in the active program window and
choose Save Image Bank to Disk from the pop-up menu.
To load an image bank from disk
Right-click the image bank in the active program window and
choose Load Image Bank from Disk from the pop-up menu.
To save an image bank in a different format (IVC-3D only)
Right-click the image bank in the active program window and
choose Export Bitmap to disk or Export Raw to Disk from the pop-
up menu.
To reset all banks Right-click an image bank in the active program window and
choose Reset All Banks from the pop-up menu.
To reset a selected bank
Right-click the image bank in the active program window and
choose Reset Bank from the pop-up menu.
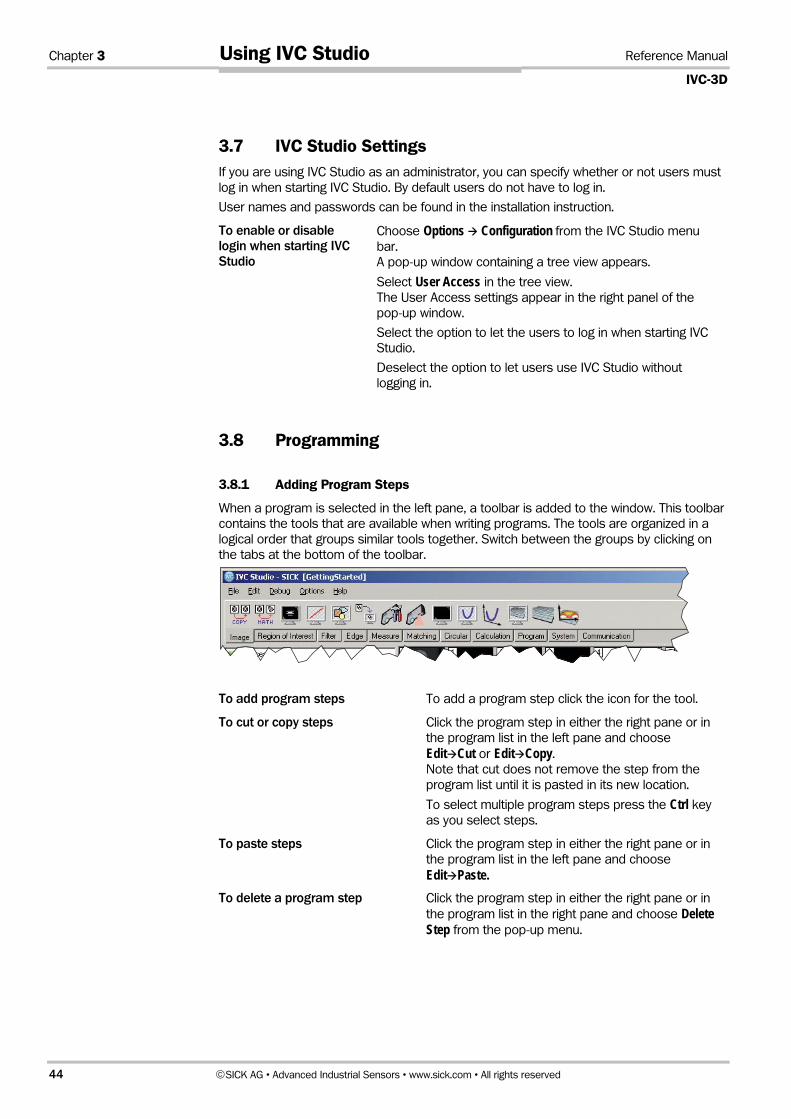
Chapter 3 Reference Manual
IVC-3D
44 ©SICK AG • Advanced Industrial Sensors • www.sick.com • All rights reserved
Using IVC Studio
3.7 IVC Studio Settings If you are using IVC Studio as an administrator, you can specify whether or not users must
log in when starting IVC Studio. By default users do not have to log in.
User names and passwords can be found in the installation instruction.
To enable or disable login when starting IVC Studio
Choose Options Configuration from the IVC Studio menu
bar.
A pop-up window containing a tree view appears.
Select User Access in the tree view.
The User Access settings appear in the right panel of the
pop-up window.
Select the option to let the users to log in when starting IVC
Studio.
Deselect the option to let users use IVC Studio without
logging in.
3.8 Programming
3.8.1 Adding Program Steps
When a program is selected in the left pane, a toolbar is added to the window. This toolbar
contains the tools that are available when writing programs. The tools are organized in a
logical order that groups similar tools together. Switch between the groups by clicking on
the tabs at the bottom of the toolbar.
To add program steps To add a program step click the icon for the tool.
To cut or copy steps Click the program step in either the right pane or in
the program list in the left pane and choose
Edit Cut or Edit Copy.
Note that cut does not remove the step from the
program list until it is pasted in its new location.
To select multiple program steps press the Ctrl key
as you select steps.
To paste steps Click the program step in either the right pane or in
the program list in the left pane and choose
Edit Paste. To delete a program step Click the program step in either the right pane or in
the program list in the right pane and choose Delete Step from the pop-up menu.

Reference Manual Chapter 3
IVC-3D
©SICK AG • Advanced Industrial Sensors • www.sick.com • All rights reserved 45
Programming
To increase/decrease tabulation
Tabulation is only used to add readability to the
program. It has no effect on the performance or
execution of the program. To increase tabulation for
a program step right-click it and choose Increase Tabulation from the pop-up menu. To decrease
tabulation for a program step right-click it and
choose Decrease Tabulation from the pop-up menu.
3.8.2 Setting Parameters
The input parameters can be set in a number of different ways:
By manually entering a fixed value
By retrieving a value from the table
By using the result from a previous step
By writing an expression that may combine the methods above
To enter parameter value in a program step
Select program step and double-click in the Value column of
the parameter. Enter the value and click anywhere outside the
changed cell.
To enter a string as a parameter value
Strings must begin with a single quotation mark.
Example: ‘String
To use parameter values from the table
Select the Table column in the program step. Enter the index
number of the desired value and click anywhere outside the
changed cell. The table value appears in the value column of
the program step.
To use results from previous program steps
Select the Step column in the program step. Double-click and
choose the number of the previous step and the result you
want to use and click OK.
To use parameter expressions
Type the expression in the Value column of the program step.
An expression always begins with = directly followed by the
expression. Use the following prefixes:
Vn – for table Value in position n.
SnRn – for output Result n from a previous Step.
SnAn – for input Argument from a previous Step.
Example: =V2+S3A2*S3R1 This means that the value of position
2 in the table is added to input parameter 2 in step 3, multi-
plied with the first output from step 3.
It is also possible to use mathematical functions such as sin
and cos. See Appendix A for more information.
It is usually slower to use expressions than using values directly
from the table.
Using Interactive Set-up
Interactive set-up is a possibility to graphically change parameter values of tools.
Interactive setup may be done in three different ways.
In the upper preview window
Some parameter fields, for example the fields for setting threshold values in the Find column edge tool, have a button with three dots following the space to fill in a value.
Some tools, for example Find line edge, have a setup button.

Chapter 3 Reference Manual
IVC-3D
46 ©SICK AG • Advanced Industrial Sensors • www.sick.com • All rights reserved
Using IVC Studio
Upper preview window
Can be used for most geometrical settings.
Preview
Select a program step containing a
geometrical setting and execute it. The
top image in the pane to the far right in
the window now contains a figure repre-
senting the setting. It is possible to move
the circle and change the size of it di-
rectly in the preview window.
For fine-tuning, double-click the image to
display it in a separate window. Note how
the values in the parameter field in the
program step are updated as you change
the settings.
The size of the preview can be changed
by clicking and dragging the borders
around the previews..
The dotted button
Click the dotted button to open a window
enabling interactive setup.
Setup button
Double-click the Setup button to open a
window enabling interactive setup.
3.8.3 Using Macros
Macros are used for operations that are performed frequently and are used by more than
one program. It makes programs more readable.
Macros are available from the Macros tab in the tab bar. As they are created the macros
are listed as available tools on the toolbar. Default name is Macro TOOL. Use the tool tip to
distinguish between the macros.
Note: The execution time of a macro includes the time it takes to run the two tools Start
Macro and End Macro. This means that the total execution time of the macro is slightly
larger than the sum of the steps in the macro. This difference is more apparent when
executing the macro in IVC Studio as then also the communication with the camera is
included in the execution time of the macro.
To create a new macro
Right-click Macro in the tree view and choose New Macro from
the pop-up menu.
To delete a macro Right-click the macro and choose Delete Macro from the pop-up
menu.
To make a copy of a macro
Right-click the macro and choose Copy Macro from the pop-up
menu. Click YES to confirm and name the new macro.
To import a macro Right-click Macro or a macro in the tree view and choose
Import Macro from the pop-up menu.
To export a macro Right-click the macro in the tree view and choose Export Macro from the pop-up menu.
To print a macro Right-click the macro in the tree view and choose Print Macro

Reference Manual Chapter 3
IVC-3D
©SICK AG • Advanced Industrial Sensors • www.sick.com • All rights reserved 47
Programming
from the pop-up menu.
To show information on a macro
Right-click the macro in the tree view and choose Macro Infor-mation from the pop-up menu.
A pop up window displays information such as program name
and dates of creation and latest change and who made the
latest changes to the macro.

Chapter 3 Reference Manual
IVC-3D
48 ©SICK AG • Advanced Industrial Sensors • www.sick.com • All rights reserved
Using IVC Studio
3.8.4 Changing Macro Properties
To change name and description of a macro
Right-click the macro in the tree view and choose Macro Properties from the pop-up menu. This opens the Macro
Properties window. Enter macro name and a description in
the Name and Description fields and click OK.
To change a macro icon
You need an icon with file extension .ico consisting of two
images. One 16 x 16 pixels and one 32 x 32 pixels. The
smaller is used in the IVC Studio tree view, and the larger in
the IVC Studio toolbar.
Right-click the macro in the tree view and choose Macro Properties from the pop-up menu. Enter the path to the icon
image in the Icon field, or use the browse button, and click OK.
To specify arguments and results
Right-click the macro in the tree view and choose Macro Properties from the pop-up menu. Select one of the tabs
Arguments or Results. Add arguments and results by using the
+! button.

Reference Manual Chapter 3
IVC-3D
©SICK AG • Advanced Industrial Sensors • www.sick.com • All rights reserved 49
Programming
3.8.5 Running and Debugging Programs
You can run and test the program in two different ways:
Run the entire program over and over, and view results in the Run window.
Step through the program or run parts of it, and view the results directly in the Pro-
gramming window when the program is paused.
You can set breakpoints on program steps where you want the execution to pause, and
also disable program steps that you don’t want to be executed. Breakpoints are ignored
when running the entire program, - for example when the device is running stand-alone –
but disabled program steps will never be executed by the device – even if the device is
running without IVC Studio.
When running the entire program, use a ‘Display‘ tool in the program to display parameter
values and the contents of an image bank in the Run window. The information in the Run
window will be updated each time the ‘Display‘ tool is executed. For more information on
the ‘Display’ tool, see the Tools chapter.
To run the entire program from the Programming window
Choose Debug Run or press F6.
The Run window is displayed, and the program will run over and
over until it is stopped. Any breakpoints in the program are
ignored.
To execute a single program step
Select a step and choose Debug Execute Step or press F5.
If Run debug or Run to cursor is chosen after executing a single
step, the program will continue with the selected step.
To execute a program step by step
Select a step and choose Debug Step by Step or press F8. The
selected step is executed and IVC Studio selects the next step
as active.
If Run debug or Run to cursor is chosen after executing a step,
the program will continue with the selected step.
To continue the pro-gram up to a selected step
Select the step to stop at and choose Debug Run to Cursor. When choosing Run to Cursor, the program will stop at any
breakpoint that is encountered prior to the selected step.
To continue the pro-gram until the next breakpoint
Choose Debug Run Debug.
To remove a break-point
Select the step with a breakpoint in either the tree view or in the
program list, and choose Debug Set Breakpoint. To continue the pro-gram from a certain step
Select the program step to start from and choose Debug Execute Step or press F5.
Then use Run debug or Run to cursor to continue running the
program from the last executed step.
Note: If the execution time of a step exceeds the IVC Studio communication timeout
(default 2500 ms), an ITF-2 error is displayed in IVC Studio, even though the camera is still
executing the step. By pressing F5 or F8 again, the connection to the camera is restored,
and the results from the step will be displayed in the step program view.

Chapter 3 Reference Manual
IVC-3D
50 ©SICK AG • Advanced Industrial Sensors • www.sick.com • All rights reserved
Using IVC Studio
3.9 Efficient Programming It is important for both efficiency and readability reasons that programs are well structured
and well documented. When writing programs in IVC Studio you should consider the tips in
this chapter for more efficient programming.
3.9.1 Organizing Programs for Readability and Maintenance
By following these rules your programs become more readable and easier to maintain:
Divide the program structure into two main parts. One initialization part and one cycle
part.
The initialization part contains everything that is only set once after power-up, for exam-
ple grabbing parameters, static ROIs, load table from memory, and so on.
The cycle part is what is executed over and over again until the program is stopped.
Group sequences of steps to represent a higher-level function than the individual steps.
To perform this grouping, there are three standard ways:
1) tabulation in the program tree
2) subroutines
3) macros
Name step tools more specifically than the tool’s original name.
Example: Rename “Scan rows” to “Scan rows, find upper left edge” or “If go” to “If width
too small, go to fail”.
Name the first step in the sequence in accordance with the purpose of the entire high-
level function when a sequence of steps is grouped.
Example: If 12 steps are used to localize a blob and find its uppermost edge pixel, then
rename the first step to “Find top edge of blob” and indent the remaining 11 steps.
Add dummy steps with the only purpose to give a sequence of indented steps a good
name, and to retain the possibility to give a more specific name to the first image proc-
essing step of the sequence. For example, a ‘Goto‘ tool that only goes to the next step
can be used.
3.9.2 Making Debugging Easier
Display key values of your program/table, using the ‘Display‘ tool, to enable perform-
ance tests and fast debugging.
Display key parameters in different colors and sizes in the displayed bank by using the
‘Add Text‘ tool. For example in simple pass/fail applications you display Pass in green
letters or Fail in red letters.
For graphical feedback, add a ‘Draw ROI‘ step directly after the ROI creation to speed
up debugging when you use dynamic ROIs. Dynamic ROIs are ROIs that move around
depending on other results in the program.

Reference Manual Chapter 3
IVC-3D
©SICK AG • Advanced Industrial Sensors • www.sick.com • All rights reserved 51
Efficient Programming
3.9.3 Organizing Error Handling
Without error handling a program stops if an error occur. Hence it is very important to
handle possible errors. Error handling is initiated by the ‘On error goto‘ tool in the Program
category. This step can either be added at the beginning of a small program or, for exam-
ple, at the beginning of each part in a larger program.
3.9.4 Organizing Tables for Readability and Maintenance
Use a table for all parameters that you may want to change during the installation and
use of the application. Divide the table parameters into blocks: User settings, advanced
settings, Debug parameters and so on. It is practical to start filling the table with the
user settings, as these are visible immediately in the programming environment (no
need to scroll the table to find them). Preferably, place a few empty rows in the table
between each parameter block to make adjustments easier.
Give parameters in a table unique names that anyone familiar with IVC Studio and the
application can understand.
3.9.5 Optimizing Performance
Make ROIs as small as possible.
Use image processing filters only when necessary.
Avoid displaying results that are not necessary to see.
Place static ROI definitions outside of the program loops so that they are only executed
once. This is only a concern in very time-critical applications.
3.9.6 Providing Image Processing Robustness
Make sure to provide good lighting conditions.
Avoid dependence on 50 Hz lamps unless shutter times are very long.
Mount a band pass filter on the lens if only one color is of interest.

Chapter 4 Reference Manual
IVC-3D
52 ©SICK AG • Advanced Industrial Sensors • www.sick.com • All rights reserved
Tools
4 Tools IVC Studio contains more than 100 advanced image processing tools. These tools are
available on the toolbar in the programming window, and are grouped into the following
categories.
Image The image tool group contains tools that are used for taking a picture
to work with, adding graphics to the images and editing the image
banks, which is the image memory in the camera.
Region of Interest The region of interest (ROI) tools are used for defining an area in
which the other tools should work. These tools speed up the image
processing since the entire image is not treated.
Filter The filter tools can be applied to enhance features in the image.
Available tools are erode and dilate tools as well as binarize tools for
transforming grayscale images to binary.
Edge The edge tools are used to find object edges in the pictures and
thereby the coordinates of the objects. It is possible to scan the im-
age from all different directions and also to find multiple edges on
one specific line.
Measure This category contains tools that measure area, center of mass, find
and measure blobs and measure distance and angle.
Matching The matching tools are used for teaching the camera to recognize an
object, and then using this for locating objects in images, counting
the number of objects, or for calculating the rotation of objects.
Circular The group of circular tool contains a specific set of tools. These tools
make it possible to check perimeters of objects, diameters, the sur-
face and the outer shape of objects.
Calculation Calculation tools are used for example for determining whether or
not values are in correct ranges, or calculating the deviation of round
objects from circles.
Program The step programming tools are used for defining loops and condi-
tions in programs. Some of the available tools are: For, If, Else, If
then goto, If in range goto, Run program, and Subroutine.
The subroutine is a powerful tool when optimizing the program. It
increases the overview and readability of your program.
System The system group contains tools for inserting delays in the program,
saving values or results to a permanent flash memory, and writing
and reading result or parameter values to a memory separate from
the actual program (the Table).
Communication The communication tools are used for sending values over RS485
and Ethernet.
Input/Output The tools in the Input/Output group handle reading of digital inputs
and setting digital outputs. Tools for encoder handling are also found
in this group.
Reader The reader tools are used for reading barcodes in the images.

Reference Manual Chapter 4
IVC-3D
©SICK AG • Advanced Industrial Sensors • www.sick.com • All rights reserved 53
Image
4.1 Image
Grab Setup This tool is used for setting up the IVC-3D camera before capturing 3D images or profiles.
The following needs to be set in order to retrieve images from the camera:
Profile triggering and rate
Field-of-view (FOV) and resolution along the x-axis
3D image triggering
Length and resolution along the y-axis for 3D images
In addition it could be necessary to adjust measurement settings in order to improve the
quality of the images.
When this tool is executed, the size of the image banks is adjusted to fit the specified FOV.
When executed on a hardware camera, the device will also start capturing images. Use the
'Grab' tool to move the captured images to an image bank.
There are no parameters that can be set directly in the program step for the 3D Grab
Setup tool. Instead there is an interactive set-up that is used for changing the settings. For
more information on how to use the interactive set-up, please refer to Grab Setup on page
243.
Input Parameters
None as standard. Use the interactive setup for setting the parameters for the tool.
Exception: See the section For Advanced Users below.
Returned Values
None as standard.
Exception: See the section For Advanced Users below.
Error Messages
Err. = 7401 Invalid FOV settings. Grab Setup has been set up for another
camera type.
Err. = 8610 The interactive Grab Setup must be opened to adjust the
FOV settings.
For Advanced Users
By entering a special key code (found in Serial.txt in the installation folder), some of the
arguments and results of the tool are made available from the step program. Please note
that some arguments depend on each other, and modifying them programmatically in the
step program may cause the tool or the interactive setup to malfunction. Proper error
handling and testing is important to ensure a robust application.
It is possible to use references to other steps and mathematical expressions in the argu-
ments to the Grab Setup tool, but this is not supported by the interactive setup. It will not
be possible to open the interactive setup if references or mathematical expressions are
used as arguments.

Chapter 4 Reference Manual
IVC-3D
54 ©SICK AG • Advanced Industrial Sensors • www.sick.com • All rights reserved
Image
Grab on Command This tool is used for triggering the device to start capturing a 3D image. To use this tool in a
program, Trigger by program step must have been selected for the 'Grab Setup' tool.
After the Grab on command tool has been executed, the image is captured in parallel with
the execution of the program. Use the 'Grab' tool to wait for the image to be completed
and to move it into an image bank.
The Grab on command tool makes it possible to start the image capturing at a known
point in time in the program. It also allows for more complex decision rules for when to
take an image, for example when receiving some special command from an external
device.
Input Parameters
None
Returned Values
None
Error Messages
Err. = 7403 No 'Grab Setup' tool has been successfully executed.
Err. = 7405 Capturing in progress. The last trigged image has not yet
been completed.
Err. = 7406 Trigged by program step has not been selected for the
'Grab Setup' tool.

Reference Manual Chapter 4
IVC-3D
©SICK AG • Advanced Industrial Sensors • www.sick.com • All rights reserved 55
Image
Grab The Grab tool is used for retrieving the latest captured 3D image or profile and moving it to
a specified image bank. The Grab tool functions a bit differently depending on if it is exe-
cuted in the Emulator or in a hardware camera, and if an encoder is used or not.
Using the Emulator
When using the Emulator as device, images are captured from a predefined set of image
files. Executing a ‘Grab’ tool means that the next image in the dedicated image folder is
captured. To be able to execute a Grab tool, the FOV settings in the Grab Setup must be
adjusted to the FOV settings of the image. This is obtained by executing the Grab Setup
tool.
For more information regarding the Emulator, see Handling the Emulator.
Using a hardware camera
The device starts capturing images as soon as a 'Grab Setup' tool is executed. The captur-
ing is done in parallel with the program execution.
A captured image can be retrieved to an image bank as long as the next image has not
been completely captured. This means that the device can start capturing the next image
before the program has retrieved the previous image.
If more than one image has been captured since the last time a 'Grab' tool was executed,
only the latest completed image can be retrieved. All previous images are lost. The number
of lost images is returned in the parameter Lost images.
If no image has been completely captured since the last time a 'Grab' tool was executed,
the 'Grab' tool waits for the image to be completed. The parameter Time out specifies the
maximum time to wait. If a time-out occurred, Lost Images is set to -1.
Using an encoder
When using an encoder for triggering profiles, the encoder’s tick count – that is, the num-
ber of pulses that the IVC-3D received since the camera was rebooted – is returned in the
Tick count at grab start parameter. When capturing 3D images, the tick count for the first
profile in the image is returned.
Executing a 'Grab setup' tool will remove any captured images from the device before
starting to capture new images, and reset the Lost image count. The Grab setup tool will
only affect the contents of the image banks if they are resized by the tool, otherwise the
tool will only remove captured images that are not yet transferred to an image bank.
The result parameter Tick count at grab stop can be used in a mathematical expression to
identify when the conveyor movement has exceeded its maximum speed. The conse-
quence of this is lost profiles and distorted object proportions in the image. The number of
lost profiles can be calculated as:
Lost profiles = ((Stop tick – Start tick )/(Ticks per profile)) - (Profiles per image)
Note: For internal rounding reasons, Lost profiles = 0 or -1 both indicate a normal image
acquisition. A suitable indication of exceeded maximum speed is Lost profiles ≥ 1.
Capturing 3D images when testing and developing programs
If you are using an infinite timeout (Time out is set to -1), and execute a Grab tool in
Debug mode (that is, using any of the items on the Debug menu except for Run), the Grab
tool will return immediately instead of waiting for an image to be ready.
If the device is capturing overlapping 3D images, it may also place a partial image in the
image bank, consisting of the profiles captured so far. To prevent this from happening, set
the Time out parameter to a value other than -1 when testing a program capturing over-

Chapter 4 Reference Manual
IVC-3D
56 ©SICK AG • Advanced Industrial Sensors • www.sick.com • All rights reserved
Image
lapping images, and if necessary set the timeout to -1 when the program is ready to be
run stand-alone in the IVC-3D.
Also note that if you use a timeout longer than the timeout set for the communication
between the IVC-3D and IVC Studio, executing the Grab tool in Debug mode may result in
an ITF Error = 2.
Input Parameters
01 = Destination bank The image bank where the grabbed image should be
placed.
02 = Time out (ms) Maximum time to wait for the image to be completed.
If set to -1 the tool will never time out.
Returned Values
01 = Lost images Number of images that have been lost since the last
time a 'Grab' or 'Grab Setup' tool was executed.
If the image capturing timed out, -1 is returned.
02 = Tick count at grab start
The encoder tick count at the start of image grabbing. It
corresponds to the number of pulses that the IVC-3D
received from the encoder since the camera was
rebooted.
If capturing profiles or images without using an en-
coder, -1 is always returned.
03 = File Name The file name of the acquired image file.
04 = Tick count at grab stop
The encoder tick count at the end of image grabbing.
When using the camera in Single profile mode, -1 is
always returned.
Error Messages
Err. = 8604 A 2D image cannot be loaded into a 3D camera.
Err. = 8607 It is not possible to load the image. Please open the
interactive Grab Setup to (automatically) adjust the FOV
settings.
Err. = 8608 The image is not taken with this camera type.
Err. = 8609 Invalid image type.
Err. = 8614 The image is taken with an IVC Studio version earlier
than 3.0, and it does not contain any FOV information.
The settings in Grab Setup must be adjusted manually
to be able to load the image.

Reference Manual Chapter 4
IVC-3D
©SICK AG • Advanced Industrial Sensors • www.sick.com • All rights reserved 57
Image
Set Laser There can be situations when the laser needs to be forced on or off, for example during
maintenance work by the machine operator. This tool allows control of the laser from the
step program.
Normally, the enabling/disabling of the laser is controlled by the Grab Setup and Grab
tools. This tool will override the internal control of the laser state and can result in images
containing only missing data.
From the disabled state, the laser can be enabled either by using the Set Laser tool again
(Laser state enabled), or by executing the Grab Setup tool.
Laser safety note:
For laser safety regulation reasons, this software tool can be used in addition to but does
not replace the external ICT-R Terminal box accessory for the laser class 3B version of IVC-
3D.
Input Parameters
01=Laser state The state of the laser.
Enabled – The laser will be activated normally.
Disabled – The laser will be turned off.
Returned Values
None
The Emulator does
not emulate this
tool. See section
Handling the
Emulator for more
information.

Chapter 4 Reference Manual
IVC-3D
58 ©SICK AG • Advanced Industrial Sensors • www.sick.com • All rights reserved
Image
Copy Image Bank This tool is used to make a copy of an image bank. The parameters Source bank and
Destination bank specify which bank to duplicate and where to place the new copy.
Note that the contents of the destination bank are replaced by the new copy. There is no
undo function. Replaced data in the destination bank is lost.
Input Parameters
01 = Source bank This parameter indicates the image bank number to copy
from.
02 = Destination bank This parameter indicates the image bank number where the
new copy is placed.
Returned Values
None

Reference Manual Chapter 4
IVC-3D
©SICK AG • Advanced Industrial Sensors • www.sick.com • All rights reserved 59
Image
Image Bank Operation This tool is used for copying a region of an image to another image bank. In addition to
copying the pixels, you may also calculate new height values for each pixel, based on the
height values of the pixels in the image in the source bank and an image already in the
destination bank.
The parameters Source bank and Destination bank specify which banks to use for the
operation. The resulting image will be placed in the Destination bank.
Note that the image in the destination bank will be replaced by the merged image. There is
no undo function. Replaced data in the destination bank is lost.
Input Parameters
01=Source bank The image bank containing the image to copy from.
02=ROI definition step
The step number in your program that holds the definition of
which region of interest in the image that the operation is per-
formed for.
03=Mathematical operation
Specifies which mathematical operation to perform when copying
pixels from the ROI of the source image to the destination bank.
Min (and) The resulting image will contain the lowest of the
corresponding pair of pixels from the source and
the destination images.
For binary images the corresponding pixels in both
images must be white for the resulting pixel to be
white. This is equivalent to an AND operation.
Max (or) The resulting image will contain the highest of the
corresponding pair of pixels from the source and
the destination images.
For binary images the resulting pixel is white if
either the source or destination pixel is white. This
is equivalent to an OR operation.
Diff (xor) The height of each resulting pixel is calculated by:
Height at bottom of FOV + absolute value of
(height in source image - height in destination
image)
Two identical images results in a black image.
For binary images the resulting pixel is white if
either the source or destination images are white
but not both. This is equivalent to an XOR opera-
tion.
Inv (not) The height of each resulting pixel is calculated
from:
Height at top of FOV - (height in source -
height at bottom of FOV)
For binary images the resulting pixel in the target
bank will be white if the source image is black and
vice versa. This is equivalent to a NOT operation.
Copy Copies every pixel in the ROI of the source image
to the destination bank.
04=Destination bank
The image bank in which the resulting image is placed. For most
of the operations the result is affected by any image that is
stored in this bank prior to executing this tool.

Chapter 4 Reference Manual
IVC-3D
60 ©SICK AG • Advanced Industrial Sensors • www.sick.com • All rights reserved
Image
Returned Values
None
Error Messages
Err. = 7704 The region of interest has parts that are outside the source bank.
Example
Source Destination
Min (and)
Max (or)
Diff (xor)
Inv (not)
Copy

Reference Manual Chapter 4
IVC-3D
©SICK AG • Advanced Industrial Sensors • www.sick.com • All rights reserved 61
Image
Add Text This tool adds a text strip to an image bank. The text itself as well as the background strip
can be drawn in the color or gray scale value of your choice.
The text can consist of a text string, a number or both. If the String type parameter is set
to Text, the text string can of course hold numbers, but they will be static. If String type is
set to Text and variable or Variable, variable values can be part of the text strip.
When double clicking the values of String color or Background color parameters, the
respective colors can be specified as numbers or chosen from an interactive menu. Possi-
ble inputs are numbers between 0 and 255, where 0 through 243 are gray scale values
and 244 through 255 are various colors.
Input Parameters
01 = X coordinate The x-coordinate of the upper left corner of the text strip.
02 = Y coordinate The y-coordinate of the upper left corner of the text strip.
03 = String type This parameter specifies whether the text strip is a static
text, a variable value or a combination. For the latter case,
the variable value will follow the static string with a space
in between.
04 = Text This parameter specifies the static text.
05 = Variable This parameter specifies the variable value. Note that the
value can be given as a constant value, evaluated by an
expression, a table value or be an argument or result from
a previous step.
06 = String color The gray scale value or color code that specifies the color
of the text. Allowed values are 0 through 255.
07 = Background color The gray scale value or color code that specifies the color
of the strip behind the text. The value 254 is transparent.
08 = Size This parameter specifies the size of the font where 1 is the
smallest and 8 is the largest font available.
09 = Destination bank The image bank in which to overlay the text.
Returned Values
01 = String length Number of letters in the text strip. Note that the space
between the string and the number is included in the count
if String type is set to Text and variable.
02 = Character width The number of pixels each letter is wide.
03 = Character height The text strip height in pixels.

Chapter 4 Reference Manual
IVC-3D
62 ©SICK AG • Advanced Industrial Sensors • www.sick.com • All rights reserved
Image
Draw Line This tool adds a line to an image bank. The line is 2 pixels wide and can be drawn in the
color or gray scale level of your choice. The line can for instance be used to separate
blobs, to enhance an edge between two known points or simply for visualization. When
double clicking the value of the Color parameter, the color of the line can be specified as a
number or chosen from an interactive menu. Possible inputs are numbers between 0 and
255, where 0 through 243 are gray scale values and 244 through 255 are various colors.
Input Parameters
01 = Start point X The x-coordinate of the first end point.
02 = Start point Y The y-coordinate of the first end point.
03 = End point X The x-coordinate of the second end point.
04 = End point Y The y-coordinate of the second end point.
05 = Color The gray scale value or color code that specifies the color of
the line. Allowed values are 0 through 255.
06 = Destination bank The image bank in which to overlay the line.
Returned Values
None

Reference Manual Chapter 4
IVC-3D
©SICK AG • Advanced Industrial Sensors • www.sick.com • All rights reserved 63
Image
Draw ROI This tool draws a previously defined ROI in a selected image bank. It is possible to choose
if the interior area or the contour of the ROI should be colored. To color the contour set the
Filling parameter to False, to color the whole area set the Filling parameter to True.
Drawing a ROI in a bank is used for visualization of the current ROI and to control the
selected area for next coming processing steps.
Input Parameters
01 = ROI definition step Number of the step with the ROI to show in the
selected image bank.
02 = Color Select a color to mark the ROI. Double-click on the
input field to choose from a color palette.
02 = Filling True whole area of the ROI will be color with
the selected color.
False only the contour of the ROI will be color.
03 = Destination bank Number of destination bank in which to draw the
selected ROI.
Returned Values
None

Chapter 4 Reference Manual
IVC-3D
64 ©SICK AG • Advanced Industrial Sensors • www.sick.com • All rights reserved
Image
Define Curve This tool is used to define a constant height line.
Such a line can be used as a reference level for cross-section area calculations. Setting a
curve with this tool is a lot faster and easier than fitting a curve to height data with the
Curve fit tool.
Input Parameters
01 = Height (mm) The constant curve height.

Reference Manual Chapter 4
IVC-3D
©SICK AG • Advanced Industrial Sensors • www.sick.com • All rights reserved 65
Image
Draw Curve This tool draws a previously defined curve in a user-specified profile bank. The curve
values that are outside the bank’s range and the values that are outside the region of
interest are set as missing data.
Drawing a curve to a bank is mainly intended for visualization purposes.
Input Parameters
01 = ROI definition step The program step where the ROI was defined.
02 = Curve definition step The program step where the curve was defined.
03 = Destination bank Profile bank where the curve is drawn.

Chapter 4 Reference Manual
IVC-3D
66 ©SICK AG • Advanced Industrial Sensors • www.sick.com • All rights reserved
Image
Define Surface This tool is used for defining a surface plane with a constant height. This surface plane can
be used for example as a reference level for volume calculations or deviation measure-
ments.
Setting a surface with this tool is much faster than fitting a surface to a 3D image with the
'Fit Surface' tool.
Please note that it is possible to define a surface plane outside the field of view, as speci-
fied with the 'Grab Setup' tool, but such a surface will not be visible when drawn in an
image bank.
Input Parameters
01 = Height (mm) The height of the surface plane.

Reference Manual Chapter 4
IVC-3D
©SICK AG • Advanced Industrial Sensors • www.sick.com • All rights reserved 67
Image
Draw Surface This tool draws a previously defined surface in a selected image bank.
Any parts of the surface that are outside the field-of-view, as defined with the '3D Grab
Setup' tool, will be displayed as missing data
Drawing a surface to a bank is mainly intended for visualization purposes.
Input Parameters
01 = ROI definition step The program step where the ROI was defined.
02 = Surface definition step The program step where the surface was
defined.
03 = Destination bank Image bank in which the surface is drawn.

Chapter 4 Reference Manual
IVC-3D
68 ©SICK AG • Advanced Industrial Sensors • www.sick.com • All rights reserved
Image
Reset Image Banks This tool sets all pixels in an image bank to a height value of your choice. If the Number of banks to reset parameter is greater than one, multiple image banks are reset from left to
right starting with First bank to reset.
Input Parameters
01 = First bank to reset This parameter specifies the number of the first
image bank to reset.
02 = Number of banks to reset This specifies how many image banks to reset.
03 = Height (mm) The height value with which the image banks should
be filled.
Returned Values
None

Reference Manual Chapter 4
IVC-3D
©SICK AG • Advanced Industrial Sensors • www.sick.com • All rights reserved 69
Image
Display The display tool is used for showing an image bank and a table with ten variable values in
a separate Run window when the program is running. The Run window is only displayed
when the program is running, and not when stepping through or debugging the program.
Each time the tool is executed, a new row is added to the table in the Run window, show-
ing the current values of the variables. The table can display up to 150 values. For each
numerical variable, the mean value and deviation is calculated and displayed at the bottom
of the Run window.
If the variable refers to a value stored in the table, the description in the table for that row
is used as header of that variable’s column. When displaying a value from a previous
program step, the name of that result is used as the header. For any other type of variable
(numerical value, string or expression) the column has the parameter name (Variable 1 – 10) as header.
It is possible to export the values of the variables to file. If the “Export variable values”
checkbox is checked when closing the Run window, a save dialog is displayed allowing the
user to specify a file name and location. Up to 10.000 of the rows displayed in the Run
window are saved to the file. If more than 10.000 rows have been displayed, it is only the
10.000 latest rows that will be saved to file. N.B. variables that are longer than 100 char-
acters will be truncated.
If the communication between PC and the device should be interrupted, for instance by
pulling the Ethernet cable from the PC, the execution in the device goes on but the up-
dates by the Display tool will be stopped until the connection is re-established.
Double-clicking on a 3D image in the Run window will display a 3D visualization of the
image in a separate window. This 3D visualization will be updated as the 3D image in the
Run window is updated.
Input Parameters
01 = Source bank The number of the image bank to display when the program is
running.
02 = Binarized color Specifies a color or gray level to mark out pixels that are ON in
an image returned by the 'Binarize' tool.
03 = Variable 1 04 = Variable 2 … 12 = Variable 10
The parameters 03–12 specifies the values to be displayed
in the table
Returned Values
None

Chapter 4 Reference Manual
IVC-3D
70 ©SICK AG • Advanced Industrial Sensors • www.sick.com • All rights reserved
Image
Extract Profile This tool extracts a profile from a 3D image along a line that is specified by the pixel coor-
dinates of the start and end points of the line.
The actual location of the last point in the profile may be slightly different from the specified
end point due to the sampling distance. The distance between the last point in the profile
and the end point of the line will be at the most half the sampling distance, unless the end
point is at the image border, in which case the distance is at the most one sampling dis-
tance.
y (pixels)
x (pixels)
Start X Stop X
Stop Y
Start Y
Sampling distance
Points in the resulting profile
The maximum number of points in the resulting profile is 32768, and if the resulting profile
will be longer, an error message is returned.
Input Parameters
01 = Source bank Bank that contains the image from which to
extract a profile.
02 = Start pixel X X coordinate of the start pixel.
03 = Start pixel Y Y coordinate of the start pixel.
04 = End pixel X X coordinate of the end pixel.
05 = End pixel Y Y coordinate of the end pixel.
06 = Sampling distance (mm) The distance in mm between two points in the
resulting profile. Enter -1 to use the same
sampling distance as the source image bank X
axis. 07 = Destination Bank The profile bank where the resulting profile is
stored.
Error Messages
Err. = 7703 The resulting profile’s length exceeds the
maximum length
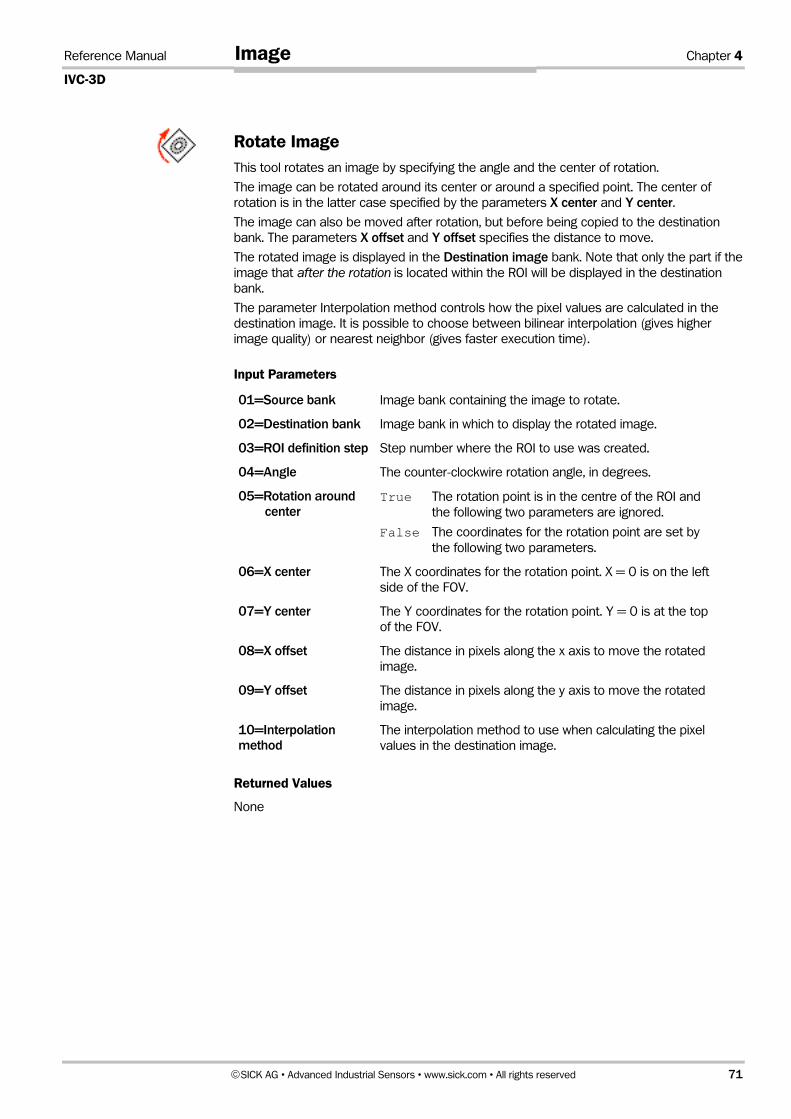
Reference Manual Chapter 4
IVC-3D
©SICK AG • Advanced Industrial Sensors • www.sick.com • All rights reserved 71
Image
Rotate Image This tool rotates an image by specifying the angle and the center of rotation.
The image can be rotated around its center or around a specified point. The center of
rotation is in the latter case specified by the parameters X center and Y center.
The image can also be moved after rotation, but before being copied to the destination
bank. The parameters X offset and Y offset specifies the distance to move.
The rotated image is displayed in the Destination image bank. Note that only the part if the
image that after the rotation is located within the ROI will be displayed in the destination
bank.
The parameter Interpolation method controls how the pixel values are calculated in the
destination image. It is possible to choose between bilinear interpolation (gives higher
image quality) or nearest neighbor (gives faster execution time).
Input Parameters
01=Source bank Image bank containing the image to rotate.
02=Destination bank Image bank in which to display the rotated image.
03=ROI definition step Step number where the ROI to use was created.
04=Angle The counter-clockwire rotation angle, in degrees.
05=Rotation around center
True The rotation point is in the centre of the ROI and
the following two parameters are ignored.
False The coordinates for the rotation point are set by
the following two parameters.
06=X center The X coordinates for the rotation point. X = 0 is on the left
side of the FOV.
07=Y center The Y coordinates for the rotation point. Y = 0 is at the top
of the FOV.
08=X offset The distance in pixels along the x axis to move the rotated
image.
09=Y offset The distance in pixels along the y axis to move the rotated
image.
10=Interpolation method
The interpolation method to use when calculating the pixel
values in the destination image.
Returned Values
None

Chapter 4 Reference Manual
IVC-3D
72 ©SICK AG • Advanced Industrial Sensors • www.sick.com • All rights reserved
Region of Interest (ROI)
4.2 Region of Interest (ROI)
ROI Rectangle This tool generates on every type of image a rectangular shaped ROI (Region Of Interest).
The ROI is used to define a rectangular limited working area to perform image processing
steps or other functions.
To set the position and dimension of the ROI it is possible to type the coordinates of the
top left corner of the rectangle and the size specifying the width and the height in pixels.
During the setup of the ROI it is also possible to set the size of the ROI and position in the
preview using the left mouse button. Double-clicking the image in the preview opens a
larger image to set the ROI with the mouse more precisely.
It is possible to define the position of the ROI relative to a previously generated result. This
is done by setting an offset of the top left corner of the ROI using the input parameters X
offset and Y offset. The values of the offset must come from a previous step result or from
the table.
The ROI is plotted in the current preview.
Input Parameters
01 = X offset Offset value of the upper left ROI corner in x direction. To set an
offset the value must come from the table or as a result from a
previously performed program step.
02 = Y offset Like above but for Y direction.
03 = X coordidate X coordinate for the top left corner of the ROI.
04 = Y coordinate Y coordinate for the top left corner of the ROI.
05 = Width Width of the ROI (in X direction) in pixels.
06 = Height Height of the ROI (in Y direction) in pixels.
Returned Values
None.
Error Messages
Err. = 148 Error in ROI means that parts of the ROI are out of the FOV.
Reduce size of ROI.
Check X and Y origin.
Check offset values.
Check Width and Height parameters.

Reference Manual Chapter 4
IVC-3D
©SICK AG • Advanced Industrial Sensors • www.sick.com • All rights reserved 73
Region of Interest (ROI)
ROI Rotated Rectangle This tool generates a rectangular shaped ROI (Region Of Interest) that can be rotated. The
ROI is used for defining a rectangular limited working area in which to perform image
processing or other functions.
To set the position of the ROI the coordinates of the top left corner of the rectangle can be
used. It is also possible to define the position of the ROI relative to a previously generated
result. This is done by setting an offset of the top left corner of the ROI using the input
parameters X offset and Y offset. The values of the offset must come from a previous step
result or from the table.
The size is set in pixels by the parameters Width and Height.
During the setup of the ROI it is also possible to set the size of the ROI and position in the
preview using the left mouse button. Double-clicking the image in the preview opens a
larger image to set the ROI with the mouse more precisely.
It is possible to rotate the ROI with respect to the center of the ROI or with chosen coordi-
nates of the rotation center. If the rotation center coordinates are equal to -1 the rotation
is done with respect to the center of the ROI. The coordinates of the rotation center could
also be outside of the ROI somewhere in the FOV. Note that it is necessary to execute the
ROI tool (keyboard key F5) to perform the rotation.
Input Parameters
01 = Source bank
Copy the selected image bank to the preview bank
02 =X offset Offset value of the upper left ROI corner in x direction. To set an
offset the value must come from the table or as a result from a
previously performed program step.
03 = Y offset Like above but for Y direction.
04 = Rotation around center
True means that the rotation point is in the centre of the ROI
and the following two parameters are ignored.
False means that the coordinates for the rotation point are set
by the following two parameters.
05 = Rotation point X
Set the X coordinates for the rotation point. X = 0 is on the left
side of the FOV.
06 = Rotation point Y
Like above but for Y direction. Y = 0 is on the top of the FOV.
07 = X coordinate X coordinate for the top left corner of the ROI (before rotation).
08 = Y coordinate Like above but for Y direction (before rotation).
09 = Width Width of the ROI (in X direction) in pixels (before rotation).
10 = Height Height of the ROI (in Y direction) in pixels (before rotation).
11 = Angle Rotation angle with respect to the rotation point. Input values are
the rotation angle in degrees.
Positive values mean counterclockwise rotation.
Negative values mean clockwise rotation.
Value = 0 means no rotation.
12= Destination bank
Number of destination bank (-1= no display of the ROI in the
preview window).
Returned Values
None

Chapter 4 Reference Manual
IVC-3D
74 ©SICK AG • Advanced Industrial Sensors • www.sick.com • All rights reserved
Region of Interest (ROI)
Error Messages
Err. = 107 points out of bank means that the rotation of the ROI
leads out of the FOV.
Reduce size of ROI.
Check offset values.
If using rotation point change coordinates of rotation point.

Reference Manual Chapter 4
IVC-3D
©SICK AG • Advanced Industrial Sensors • www.sick.com • All rights reserved 75
Region of Interest (ROI)
ROI Circle This tool generates a circular shaped ROI (Region Of Interest). The ROI defines a circular
limited working area in which to perform image processing or other functions.
To set the position and dimension of the ROI it is possible to type the coordinates of the
center of the circle and radius length in pixels. During the setup of the ROI it is also possi-
ble to set the size of the ROI and position in the preview using the left mouse button.
Double-clicking the image in the preview opens a larger image to set the ROI with the
mouse more precisely.
It is also possible to define the position of the ROI relative to a previously generated result.
This is done by setting an offset to the top left corner of the bounding box of the circle
using the input parameters X offset and Y offset. The values of the offset must come from
a previous step result or from the table.
Input Parameters
01 = X offset Offset value of the upper left corner of the bounding box in X
direction. To set an offset the value must come from the table or
as a result from a previously performed program step.
02 = Y offset Like above but for Y direction.
03 = X center X coordinate of the center of the circle.
04 = Y center Like above but for Y direction.
05 = Radius Length of the circle radius in pixels.
Returned Values
None
Error Messages
Err. = 148 Error in ROI means that a part of the ROI is out of the FOV.
Reduce circle radius.
Check offset and center parameters.

Chapter 4 Reference Manual
IVC-3D
76 ©SICK AG • Advanced Industrial Sensors • www.sick.com • All rights reserved
Region of Interest (ROI)
ROI Ellipse This tool generates on every type of image an elliptical shaped ROI (Region Of Interest).
The ROI is used to define an elliptic limited working area to perform image processing
steps or other functions.
The position and dimension of the ROI can be set by specifying the coordinates in pixels of
the center of the ellipse (X center and Y center) and radius of the axes in X and Y direction
(X radius and Y radius). The ROI can also be set by adjusting the position and dimension in
the Preview of the program step. Double-clicking on the preview image opens a larger
window with the image to work in.
It is also possible to define the position of the ROI relative to a previously generated result.
This is done by setting an offset of the top left corner of the bounding box of the ellipse
using the input parameters X offset and Y offset. The values of the offset must come from
a previous step result or from the table.
Input Parameters
01 = X offset Offset value of the upper left corner of the bounding box in X
direction. To set an offset the value must come from the table or
as a result from a previous program step.
02 = Y offset Offset value of the upper left corner of the bounding box in Y
direction. This value must come from the table or be a result from
a previous step.
03 = X center X coordinate of the centre of the ellipse.
04 = Y center Y coordinate of the centre of the ellipse
05 = X radius Radius of the axes in X direction in pixels.
06 = Y radius Radius of the axes in Y direction in pixels.
Returned Values
None
Error Messages
Err. = 148 Error in ROI means that a part of the ellipse is out of the
FOV.
Check radius parameters.
Check center and offset coordinates.

Reference Manual Chapter 4
IVC-3D
©SICK AG • Advanced Industrial Sensors • www.sick.com • All rights reserved 77
Region of Interest (ROI)
ROI Perimeter ROI perimeter generates a ROI which shape, position and size is defined by the found
contour pixels from the ’Perimeter’ tool. The ’Perimeter’ tool traces the contour of an object
and returns the pixels which are found along the contour and this is used as input. The
’Perimeter’ tool is found in the Measure category.
Note: The ROI perimeter tool can only be used after the ’Perimeter’ tool is executed in a
previous program step.
With the Margin parameter it is possible to expand or shrink the ROI with respect to the
original shape. A positive margin value will expand the ROI in each direction by the typed
value in pixels. A negative margin will shrink the ROI. If a positive margin value is used
make sure that the resulting ROI is not larger than the total FOV of the camera. If a nega-
tive margin value is used make sure that the typed value will not produce negative results
for the size of the ROI.
The parameter Filling controls if the area inside the ROI is colored red (internal) or if only
the contour of the ROI (external) is colored red.
Input Parameters
01 = Perimeter definition step
Number of the step with the ’Perimeter’ tool which
provides the contour pixels to process the ROI.
02 = Margin Positive or negative values to expand or shrink the size
of the ROI.
03 = Filling 0=internal whole area of the ROI will color red.
1=external only the contour of the ROI is color
red.
04 = Destination bank Number of destination bank to display the ROI.
-1= no display of the ROI.
Returned Values
None
Error Messages
Err. = 152 Error in ROI from perimeter
Check Margin values and make sure that the result will
not produce negative results or lead outside of the
FOV.

Chapter 4 Reference Manual
IVC-3D
78 ©SICK AG • Advanced Industrial Sensors • www.sick.com • All rights reserved
Region of Interest (ROI)
ROI Union This tool unifies two different ROIs from previous program steps to one single ROI.
The two ROIs to be unified are named ROI A and ROI B. The resulting single ROI is the
addition of ROI A and ROI B. If it is necessary to display the unified ROI use the ‘Draw ROI’
tool in the Image category.
Input Parameters
01 = ROI A definition step Reference to program step to select ROI A
02 = ROI B definition step Reference to program step to select ROI B
Returned Values
None

Reference Manual Chapter 4
IVC-3D
©SICK AG • Advanced Industrial Sensors • www.sick.com • All rights reserved 79
Region of Interest (ROI)
ROI Intersection This tool generates a new ROI from the intersection of two different ROIs.
The resulting single ROI is the intersection of ROI A and ROI B. If it is necessary to display
the unified ROI use the ‘Draw ROI’ tool in the Image category.
Note that if the selected ROI A and ROI B have no intersection at all this tool will not gener-
ate a new ROI. In that case this could be the cause for error messages if input parameter
ROI definition from a different tool refers to the result of this tool.
Input Parameters
01 = ROI A definition step Reference to program step to select ROI A
02 = ROI B definition step Reference to program step to select ROI B
Returned Values
None

Chapter 4 Reference Manual
IVC-3D
80 ©SICK AG • Advanced Industrial Sensors • www.sick.com • All rights reserved
Region of Interest (ROI)
ROI Difference This tool performs a subtraction between two different ROIs and generates as result a new
ROI. The subtraction will be executed as follows:
Resulting ROI = ROI A – ROI B.
If it is necessary to display the unified ROI use the ‘Draw ROI’ tool in the Image category.
Note that if the selected ROI A and ROI B are identical this tool will not generate a new ROI.
In that case this could be the cause for error messages if input parameter ROI definition
from a different tool refers to the result of this tool.
Input Parameters
01 = ROI A definition step Reference to program step to select ROI A
02 = ROI B definition step Reference to program step to select ROI B
Returned Values
None

Reference Manual Chapter 4
IVC-3D
©SICK AG • Advanced Industrial Sensors • www.sick.com • All rights reserved 81
Region of Interest (ROI)
ROI Interval This tool creates a profile ROI (Region Of Interest) that specifies the intervals of the profile
where other tools can be applied without affecting (or being affected by) the profile outside
the intervals. The ROI is used in other tools by referring to the program step in which the
ROI was created.
The ROI is created by specifying the x-coordinate where it starts (X start pixel) and the
width of it (Width).
Profile
z
xWidth
X start pixel
Resulting ROI
Figure – ROI interval creates a ROI that corresponds to a section of the x-axis.
Input Parameters
01 = X start pixel X pixel for the starting point of the ROI.
02 = Width Width of the ROI (in X direction) in pixels.
Returned Values
None.
Error Messages
Err. = 7310 Error in ROI means that parts of the ROI are outside
of the FOV. In that case:
Reduce the size of of ROI.
Check the X origin.
Check the Width parameter.

Chapter 4 Reference Manual
IVC-3D
82 ©SICK AG • Advanced Industrial Sensors • www.sick.com • All rights reserved
Region of Interest (ROI)
ROI Height This tool creates a profile ROI (Region Of Interest) that specifies the intervals of the profile
where other tools can be applied without affecting (or being affected by) the profile outside
the intervals. The ROI is used in other tools by referring to the program step in which the
ROI was created.
The ROI is created by specifying the Threshold height and choosing the Threshold type
parameter. The resulting ROI will contain the parts of the profile where the height values
are above or below Threshold height, depending on which Threshold type that was cho-
sen.
Profile
z
x
Threshold height
Threshold type:Above threshold
Resulting ROI(discontinuous)
Figure – ROI height creates a ROI that consists of the parts of the x-axis where a profile is above or below a specified threshold.
Input Parameters
01 = Source bank Image bank that contains a profile on which the
threshold is applied.
02 = Threshold height (mm) The threshold height with which the profile values are
compared.
03 = Threshold type Below threshold Parts of the profile where the
height values are less than the
threshold height are included
in the ROI.
Above threshold Parts of the profile where the
height values are greater than
the threshold height are in-
cluded in the ROI.
Returned Values
None.

Reference Manual Chapter 4
IVC-3D
©SICK AG • Advanced Industrial Sensors • www.sick.com • All rights reserved 83
Filter
4.3 Filter
Binarize This tool creates a binary image based on the image in Source Bank. All pixels inside the
specified ROI with height values between a lower and an upper threshold are set to a ‘high’
value. All other pixels are set to a ‘low’ value. Return values are the total number of pixels
inside the ROI that are in range (within the threshold bounds) and the number of pixels that
are out of range (outside the threshold bounds). The resulting binary image is written to the
image bank pointed out by the Destination Bank parameter.
This tool is suitable as a pre-processing step to further image processing.
When binarizing an image, all calibrated 3D-data is lost. You cannot measure mm values or
volume in the resulting image.
It is recommended to use the interactive setup to customize the parameters. Double click
on the Setup button to open the interactive setup window. For more information on the
interactive setup, see on page 271.
Input Parameters
01 = Source bank Image bank containing the image to binarize.
02 = ROI definition step Step number where the ROI to use was created.
03 = Lower threshold (mm) Lower threshold for height value.
04 = Upper threshold (mm) Upper threshold for height value.
05 = Destination bank Image bank in which to display the binarized image.
06 = Threshold Mode Available options are:
Manual
Set the upper and lower thresholds yourself.
Automatic Automatically sets the thresholds. Pixels within
the range become white, and the pixels outside
the range become black.
Automatic inverted Automatically sets the thresholds, but with in-
verted colors compared to the Automatic
mode.
Returned Values
01 = Pixels in range Total number of found pixels between lower and
upper height threshold.
02 = Pixel out of range Total number of pixels found outside the lower and
the upper threshold.
03 = Low threshold (mm) Lower threshold value. Values lower than the
threshold are out of range.
04 = High threshold (mm) Higher threshold value. Values higher than the
threshold are out of range.
Note:

Chapter 4 Reference Manual
IVC-3D
84 ©SICK AG • Advanced Industrial Sensors • www.sick.com • All rights reserved
Filter
Dilate This tool shifts a 3 by 3 matrix over the image and replaces the value of the center matrix
element with highest value out of the surrounding matrix elements. In general this tool
erodes dark pixels and can be used to reduce image artifacts due to single dark pixels.
Sometimes it is necessary to repeat this step several times until the desired result is
achieved.
Figure – The value of the center matrix element is changed to the highest value out of the surrounding matrix elements.
Input Parameters
01 = Source bank Image bank containing the image to dilate.
02 = ROI definition step Step number where the ROI to use was created.
03 = Destination bank Image bank in which to display the dilated image.
Returned Values
None
Center matrix element
before applying function
110 110110
250 80140
250 8080
110 110 110
250 80 250
250 80 80
Center matrix element
after applying function

Reference Manual Chapter 4
IVC-3D
©SICK AG • Advanced Industrial Sensors • www.sick.com • All rights reserved 85
Filter
Erode This tool shifts a 3 by 3 matrix over the image and replaces the value of the center matrix
element with lowest value out of the surrounding matrix elements. In general this tool
erodes pixels with high values (bright or high) and can be used to reduce image artifacts
due to single white pixels.
Sometimes it is necessary to repeat this step several times until the desired result is
achieved.
Figure – The value of the center matrix element is changed to the lowest value out of the surrounding matrix elements.
Input Parameters
01 = Source bank Image bank containing the image to erode.
02 = ROI definition step Step number where the ROI to use was created.
03 = Destination bank Image bank in which to display the eroded image.
Returned Values
None
Center matrix element
before applying function
110 110110
250 80140
250 8080
110 110 110
250 80 80
250 80 80
Center matrix element
after applying function

Chapter 4 Reference Manual
IVC-3D
86 ©SICK AG • Advanced Industrial Sensors • www.sick.com • All rights reserved
Filter
Filter This tool offers the following three filter types:
1. Smooth
2. Edge
3. Median
Smooth
The Smooth filter shifts a 3 by 3 matrix over the image. The value in the matrix center will
be replaced by the mean value out of the surrounding 8 matrix elements, as shown in the
following figure:
Figure – The value of the center matrix element will be replaced by the mean value out of the surrounding 8 matrix elements.
Edge
The Edge filter is based on a sobel filter in x and y direction and detects edges in the
image.
Median
The Median filter is similar to the Smooth filter, but the value in the matrix center is re-
placed by the median value of the surrounding elements, instead of the mean value.
The result of the median filter is an image where noise and small details (single pixels) are
removed but edges are preserved.
Note that the both filter types operate only inside the selected ROI. The results are dis-
played in a user defined image bank.
Input Parameters
01 = Source bank Image bank containing the image to be filtered.
02 = ROI definition step Step number where the ROI to use was created.
03 = Filter type Smooth Smooth the part of the image inside the ROI.
Edge Detects edges of the image part inside the
ROI.
Median Smooth the part of the image inside the ROI.
04 = Destination bank The image bank in which to display the filtered image.
Returned Values
None
Center matrix element
before applying smooth filter
100 100100
100 50140
50 5050
100 100 100
100 50 75
50 50 50
Center matrix element
after smooth filtering

Reference Manual Chapter 4
IVC-3D
©SICK AG • Advanced Industrial Sensors • www.sick.com • All rights reserved 87
Filter
Filter Profile The Filter Profile tool is used to generate a new profile with smoothed or enhanced detail
features compared to the original one. A typical use is to decrease local peaks to the level
of the environment.
There are three filter modes: Smooth, Edge and Median.
The smooth filter will apply a normalized averaging using a rectangular filter kernel. This
mode is very fast due to the rectangular filter kernel (typical execution time is in the order
of 0.1 ms). This speed is independent from the filter kernel size. The normalization is done
so that missing data and data outside the provided ROI will not affect the result of the
filtering. This also means that the filter behaves nicely near the ends of the profile also for
very large kernels.
The median filter is slower than the smooth filter. Still the execution time is typically around
3 ms per profile. Median filters may be preferred when filtering objects where many differ-
ent heights are represented. On the other hand, the smoothing filter may perform well also
here if complemented with a suitable range-based ROI. Which one to choose is ultimately
application specific.
The edge filter performs a normalized convolution with a rectangular shaped differential
operator which returns the derivative of the original profile. The derivative is offset by the
center of the FOV since IVC profiles cannot assume negative values. The tool currently
does not output the numeric value of this offset but it can be found either by looking at the
result from derivation of a constant signal or by using the option FOV Center in the Profile
Difference tool.
The Original profile (left) Median-filtered profile (right). The Median filter removes de-tails.
Input Parameters
01 = Source bank Profile bank on which the filter is applied
02 = ROI definition step The Profile ROI defining what parts of the source bank
will contribute to the result. The input data will be
masked by this ROI before filtering. It is suggested to
use the tool ROI Height to define the ROI. This gives a
powerful method to eliminate range values that

Chapter 4 Reference Manual
IVC-3D
88 ©SICK AG • Advanced Industrial Sensors • www.sick.com • All rights reserved
Filter
should be disregarded. 03 = Filter type Specifies which type of filter to use:
Smooth will perform a normalized averaging using a
rectangular kernel. Values outside the ROI will not
affect the result at all. The same holds for ‘missing
data’. Notice however that if the profile has been
obtained using the Extract Profile tool, it may contain
values that are outside the expected field of view due
to interpolation. It is therefore suitable to use the ROI
Height tool whenever extracted profiles are consid-
ered.
Median will perform a median filtering while disregard-
ing all values outside the ROI and missing data.
Edge will perform a derivation of the profile by nor-
malized convolution with a rectangular differential
operator. The result will be the result of this convolu-
tion + a fix offset which corresponds to the height of
the center of the FOV. This is added to put the output
profile within the allowed range of values. 04 = Filter size Determines the size of the filter kernel in pixels. This
determines the size of the supporting region of the
profile for each output pixel. Any value from 1 to 500
is allowed and the total kernel size is 2*radius +1.
The value has no significant effect on execution time.
05 = Destination bank Image bank in which the resulting profile is stored
06 = Fill missing data If true, target profile points outside the ROI or with no
corresponding valid source data will also get an
output value. This value is calculated in exactly the
same way as all other target values.
If false, all values outside the ROI and all values
corresponding to missing data in the input will be set
to ‘missing data’ in the result.
Setting this option to true may be useful in cases
where a “golden part” is used to learn a background
pattern where any missing data should be disre-
garded.
Returned Values
None
Error Messages Err. = 7704 The region of interest has parts that are outside the
source bank.

Reference Manual Chapter 4
IVC-3D
©SICK AG • Advanced Industrial Sensors • www.sick.com • All rights reserved 89
Filter
Profile Difference The Profile Difference tool subtracts one profile bank from another. It uses a ROI to define
on which height values to work. All values which are not part of the ROI will be left un-
touched. Since the IVC-3D expects profile values to be within a certain range correspond-
ing to the current FOV, there is a user-configurable offset to place the output values within
a suitable range. The default setting for the offset is FOV Center. This is suitable for profiles
with minor fluctuations. If the profile in the Destination bank contains large negative spikes,
the FOV Top setting is recommended, and for large positive spikes, the FOV Bottom is
recommended. Finally, the option Absolute is available for situations where none of the
above settings are applicable. It is then possible to specify the exact offset in mm to use.
The tool calculates the difference according to the following formula:
Destination Bank := Source Bank – Destination Bank + Offset Z.
The bottom profile is the difference between the two upper profiles.
Input Parameters
01 = Source bank Profile bank on which the filter is applied
02 = ROI definition step Defines the region of interest in which the subtraction
shall be done. All values outside this ROI will be left
untouched by the tool. If you wish these values to be
set to missing data you can use an Image Operation
tool of type Copy within the ROI to an empty profile
bank. 03 = Offset Type Specifies the type of offset to add to the resulting
profile. There are four options:
Absolute The value in the parameter Offset Z (mm) is

Chapter 4 Reference Manual
IVC-3D
90 ©SICK AG • Advanced Industrial Sensors • www.sick.com • All rights reserved
Filter
added to the resulting profile.
FOV Bottom The bottom level of the current FOV is
added.
FOV Center The center level of the current FOV is
added. This is the default setting.
FOV Top The top level of the current FOV is added.
04 = Offset Z (mm) Defines how many mm to add to the resulting differ-
ence before writing the result in the destination bank.
This parameter is only used if the Offset Type is set
to Absolute. 05 = Destination bank The profile bank containing the profile to be sub-
tracted and the bank where the resulting difference
profile will be put.
Returned Values
01 = Offset Used The tool returns the mm value actually used as offset.
This is convenient if the actual mm difference value
shall be used later in the step program (by a result
reference).
To get the actual difference in mm in any specific
point, use the tool Get Calibrated Point and subtract
the Used Offset from the obtained Z value.
Error Messages Err. = 7704 The region of interest has parts that are outside the
source bank.

Reference Manual Chapter 4
IVC-3D
©SICK AG • Advanced Industrial Sensors • www.sick.com • All rights reserved 91
Filter
Fill Missing Data This tool removes missing data from a selected part of a 3D image or profile, by interpolat-
ing the height values from areas surrounding the missing data.
Only the pixels within the ROI are affected in the output but values outside the ROI are
used for interpolation. If the ROI only contains missing data, this tool does nothing. Data
can not be created from scratch.
Typically, this tool is used for preparing 3D images for use with tools that treats missing
data as a height value. For example, if an image containing missing data is used in the
'Find Row' tool, the missing data could be interpreted as an edge. For a list of tools that
treats missing data as height values, please refer to appendix C.
The tool is mainly designed to fill small areas of missing data but will work for areas of any
size.
Input Parameters
01 = Source bank Image bank containing the 3D image or profile.
02 = ROI definition step The program step where the ROI was defined.
03 = Destination bank Image bank in which to store the resulting interpo-
lated surface or curve.
Error Messages
Err. = 7704 The region of interest has parts that are outside
the source bank.

Chapter 4 Reference Manual
IVC-3D
92 ©SICK AG • Advanced Industrial Sensors • www.sick.com • All rights reserved
Filter
Detail Extraction The Detail extraction tool finds image details that “stick out” from the background. In 3D
images, embossed (raised) details or de-bossed (lowered) details are enhanced, for
example embossed text on tires, or embossed or engraved text on forged metal objects.
It is recommended to use the interactive setup to customize the parameters. Double-click
on the Setup button to open the interactive setup window. For more information on the
interactive setup, see Detail Extraction Setup
on page 278.
The result from the tool is a new image where only two height values are represented –
high for details (top of the FOV) and low for background (bottom of the FOV).
The actual height values in the resulting image will be different from the original image and
therefore it is not relevant to measure the height or volume in such an image. Missing data
in the image will still be missing data in the output image.
Original image 3D visualization of original image
Filtered with Detail Extraction 3D visualization of filtered image
Figure –Filtering a 3D image with the Detail extraction tool
In the Operator Type parameter you set how the deviation search should be carried out.
Pixels near the edges of the ROI will be affected by pixels outside the ROI.
Input Parameters
01 = Source Bank Image bank containing the image to be filtered
02 = ROI Definition Step Previous program step defining the ROI to be used by
this tool
03 = Operator Type Defines which set of neighbouring points to consider
when locating deviating points:
Horizontal Compare the current point to
the horizontal neighbours.
Vertical Compare the current point to
the vertical neighbours.
Four points Compare the current point to
the horizontal and vertical
neighbours.
Eight points Compare the current point to
the horizontal, the vertical and
the diagonal neighbours.
Full Region(slow) All pixels inside the operator
radius are considered.
04 = Threshold (mm) The minimum height difference between the pixel and
the background that is required to consider the pixel a
detail.
Note:
Note:

Reference Manual Chapter 4
IVC-3D
©SICK AG • Advanced Industrial Sensors • www.sick.com • All rights reserved 93
Filter
05 = Operator Radius The radius within which the Operator Type operates. It
determines how far from the current point the consid-
ered neighbour points can be.
06 = Destination Bank Image bank in which to store the filtered image.
07 = Deviation Type Specifies whether the details to look for are higher
(Raised), lower (Lowered) or both higher and lower
(Raised + Lowered) than the background.
Note: If the Operator Type parameter is set to Full region, the Raised + Lowered option is not avail-
able.
Returned Values
01 = Number of Detail Pixels The total number of detail pixels found.

Chapter 4 Reference Manual
IVC-3D
94 ©SICK AG • Advanced Industrial Sensors • www.sick.com • All rights reserved
Edge
4.4 Edge
Find Row Edge This tool scans a defined row and outputs the first found pixel with a height value that is
within the defined height value thresholds. The return value is the column number of the
first found pixel. This column number is the x-coordinate of the found pixel and the y-
coordinate is the row number set with the input parameter Row.
This tool requires a non-rotated rectangle ROI from a previous step. Note that only ROIs
that are generated by the 'ROI rectangle' tool can be used. Do not use ROIs created by any
other ROI tool.
Only the pixels along the row inside the ROI will be considered.
The Row parameter can be set in the preview image by using the left mouse button and
drop the line from the top border of the FOV to the desired position.
It is possible to select scan direction along the row by the parameter Analysis direction. If you select analysis direction from left to right (Left -> Right) the found column corre-
sponds to the first found pixel from the left side of the ROI.
The height value thresholds are set by the parameters Min height and Max height. To set
the thresholds with a slider, double-click the input field for the height value threshold and
click the appearing button. This opens a larger image. Use the left mouse button to move
the slider.
All pixels inside the ROI with height values within the two thresholds are colored blue.
Input Parameters
01 = Source bank Image bank containing the image to be processed.
02 = Row Row number for the row to be scanned. 0 = top of FOV
03 = Analysis direction Scan direction.
Left –> Right beginning from the left side of the
ROI.
Right –> Left beginning from the right side of the
ROI.
04 = Min height (mm) Low height value threshold.
05 = Max height (mm) High height value threshold.
06 = ROI definition step Step number where the ROI to use was created.
Note that only ROIs generated by the 'ROI rectangle' tool
can be used.
Returned Values
01= Column Returns the number of the column where the found pixel is
located. This could be used as the X-coordinate of the
found pixel.
Error Messages
Err. = 107 Error: points out of bank
Check if the specified ROI is generated by a 'ROI rectangle'
tool.
Err. = 108 Error in Find row edge
Check if selected row is inside the ROI.

Reference Manual Chapter 4
IVC-3D
©SICK AG • Advanced Industrial Sensors • www.sick.com • All rights reserved 95
Edge
Find Column Edge This tool scans a defined column and outputs the first found pixel with a height value that
is within the defined height value thresholds. The return value is the number of the corre-
sponding row of the first found pixel. This row number is the y-coordinate of the found pixel
and the x-coordinate is the column number set with the input parameter Column.
This tool requires a non-rotated rectangular ROI from a previous step. Note that only ROIs
that are generated by the 'ROI Rectangle' tool can be used. Do not use ROIs created by
any other ROI tool.
Only the pixels along the row inside the ROI are considered.
The Column parameter can be set in the preview window by using the left mouse button
and drop the line from the top border of the FOV to the desired position.
It is possible to define Analysis direction to have either the column at the bottom of the
ROI as starting point (Down -> up) or the top column (Up -> down). Selecting Analysis direction Down -> up outputs the row of the first found pixel beginning from the bottom
of the ROI.
The height value thresholds are set by the parameters Min height and Max height. To set
the thresholds with a slider, double-click the input field for the height value threshold and
click again on an appearing button that opens a larger image. Use the left mouse button to
move the slider. It is also possible to adjust the column position in this window.
All pixels inside the ROI with height values within the two thresholds are colored blue.
Input Parameters
01 = Source bank Image bank containing the image to be processed.
02 = Column Column number for the row which will be considered.
0 = left border of FOV
03 = Analysis direction Direction of the analysis.
Down -> up beginning from the bottom of the ROI
Up -> down beginning from the top of the ROI.
04 = Min height (mm) Low height value threshold.
05 = Max height (mm) High height value threshold.
06 = ROI definition step Step number where the ROI to use was created.
Note that ONLY ROIs generated by the 'ROI rectangle' tool
can be used.
Returned Values
01 = Row Returns the number of the row where the found pixel is
located. This could be used as the Y-coordinate of the
found pixel.
Error Messages
Err. = 104 Error: points out of bank
Check if the specified ROI is generated by a 'ROI rectangle'
tool.
Check if the specified column is inside the ROI.

Chapter 4 Reference Manual
IVC-3D
96 ©SICK AG • Advanced Industrial Sensors • www.sick.com • All rights reserved
Edge
Find Row This tool scans an image along a horizontal line to find a row that contains pixels with
height values that are in a specified range. Only the part of the image that is inside a ROI is
scanned.
The returned value is the y-coordinate of the found row. In the preview window, the found
row is marked with a yellow line.
The tool will “find” a row (and stop scanning the image) when the row contains a certain
amount of pixels with height values within the range. This amount is specified by the pa-
rameter Level, and can be used for making the tool less sensitive for noise in the image.
Analysis Direction
ROI
Pixels with height values
between Min heightand Max height
Level
Row returnedby the tool
0 5 10 15 20 25 30
Amount of matching
pixels along the line
Line along which
the pixels are counted
The parameter Type of transition is used for choosing whether the tool should stop scan-
ning when the amount of matching pixels in the line rises above the amount set in Level (pixels > level), or when it sinks below the amount set in Level (pixels < level).
The lower and upper limits of the range of height values are set by the parameters Min height and Max height. These parameters can be set in an interactive setup window,
which is opened by clicking the button that is displayed when double-clicking the Value field
of the parameters. In the interactive setup window, all pixels inside the ROI with height
values within the range are colored blue.
The image is scanned either from the top of the ROI to the bottom, or from the bottom to
the top depending on the setting of the parameter Analysis direction.
This tool requires a non-rotated rectangular ROI. The parameter ROI definition step points
out the program step in which the ROI is created. Note that only ROIs created with the 'ROI
Rectangle' tool are allowed. Do not use a ROI created by another ROI tool.
For some applications it is useful to combine this tool with the 'Find Column' tool to detect
the column as well. In some cases the column and the row could be used to establish the
x- and y-coordinates of the found pixel.

Reference Manual Chapter 4
IVC-3D
©SICK AG • Advanced Industrial Sensors • www.sick.com • All rights reserved 97
Edge
Input Parameters
01 = Source bank Image bank containing the image to analyze.
02 = Analysis direction Direction of the analysis.
Down→up beginning from the bottom of the ROI.
Up→down beginning from the top of the ROI.
03 = Min height (mm) Lower height value threshold.
04 = Max height (mm) Upper height value threshold.
05 = Level Amount of pixels with height values in between Min height and Max height.
Default setting = 2
06 = Type of transition Pixels > level Stop when the amount of matching
pixels in the line rises above Level.
Pixels < level Stop when the amount of matching
pixels in the line sinks below Level.
07 = ROI definition step Selected ROI from a previous program step.
Note that only ROIs created with the 'ROI rectangle' tool
are allowed.
Returned Values
01 = Row Y-coordinate of the found row.
Error Messages
Err. 107 Error: points out of bank
Check that the ROI is generated by the 'ROI rectangle' tool
and not by a different ROI tool.
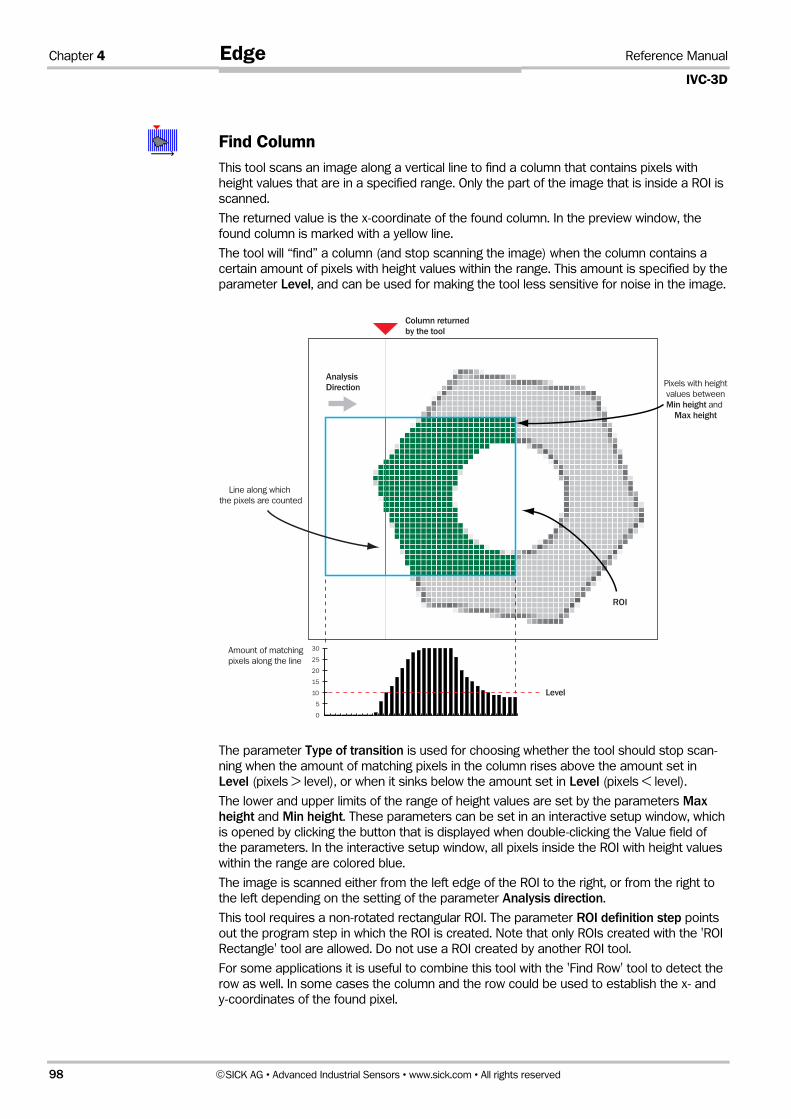
Chapter 4 Reference Manual
IVC-3D
98 ©SICK AG • Advanced Industrial Sensors • www.sick.com • All rights reserved
Edge
Find Column This tool scans an image along a vertical line to find a column that contains pixels with
height values that are in a specified range. Only the part of the image that is inside a ROI is
scanned.
The returned value is the x-coordinate of the found column. In the preview window, the
found column is marked with a yellow line.
The tool will “find” a column (and stop scanning the image) when the column contains a
certain amount of pixels with height values within the range. This amount is specified by the
parameter Level, and can be used for making the tool less sensitive for noise in the image.
Analysis Direction
ROI
Pixels with height
values between
Min height and
Max height
Level
0
5
10
15
20
25
30Amount of matching
pixels along the line
Column returnedby the tool
Line along which
the pixels are counted
The parameter Type of transition is used for choosing whether the tool should stop scan-
ning when the amount of matching pixels in the column rises above the amount set in
Level (pixels > level), or when it sinks below the amount set in Level (pixels < level).
The lower and upper limits of the range of height values are set by the parameters Max height and Min height. These parameters can be set in an interactive setup window, which
is opened by clicking the button that is displayed when double-clicking the Value field of
the parameters. In the interactive setup window, all pixels inside the ROI with height values
within the range are colored blue.
The image is scanned either from the left edge of the ROI to the right, or from the right to
the left depending on the setting of the parameter Analysis direction.
This tool requires a non-rotated rectangular ROI. The parameter ROI definition step points
out the program step in which the ROI is created. Note that only ROIs created with the 'ROI
Rectangle' tool are allowed. Do not use a ROI created by another ROI tool.
For some applications it is useful to combine this tool with the 'Find Row' tool to detect the
row as well. In some cases the column and the row could be used to establish the x- and
y-coordinates of the found pixel.

Reference Manual Chapter 4
IVC-3D
©SICK AG • Advanced Industrial Sensors • www.sick.com • All rights reserved 99
Edge
Input Parameters
01 = Source bank Image bank containing the image to analyze.
02 = Analysis direction Direction of the analysis.
L – R beginning from the left side of the ROI.
R – L beginning from the right side of the ROI.
03 = Min height (mm) Lower height value threshold.
04 = Max height (mm) Upper height value threshold.
05 = Level Amount of pixels with height values in between Min height and Max height.
Default setting: 2
06 = Type of transition Pixels > level Stop when the amount of matching
pixels in the column rises above Level.
Pixels < level Stop when the amount of matching
pixels in the column sinks below Level.
07 = ROI definition step Selected ROI from a previously program step. Note that
only ROIs generated by the 'ROI rectangle' tool can be
used.
Returned Values
01 = Column X-coordinate of the found column.
Error Messages
Err. 107 Error: points out of bank
Check that the ROI is generated by the 'ROI rectangle' tool
and not by a different ROI tool.

Chapter 4 Reference Manual
IVC-3D
100 ©SICK AG • Advanced Industrial Sensors • www.sick.com • All rights reserved
Edge
Find Line Edge This tool finds edges on a user defined straight line by evaluating how the height changes
along the line. There is an interactive setup and it is recommended to use it to set the
parameters. Double-click the Setup button to open the interactive setup. For more informa-
tion on the interactive setup please refer to on page 260.
There are two evaluation methods to detect transitions/changes in the height.
Evaluation Method 1: Detect Relative Change in Height
Beginning at the starting point of the line this method detects the first change in height that
is above the user defined value. The evaluation is based on the derivation of the histogram
along the line. If the first absolute value of the derivation, average out of 4 pixels, is greater
or equal to the user defined threshold the function terminates. In that case the function
returns the coordinates of the first found pixel (X transition, Y transition).
Figure – Evaluation method 1: Detect relative change in height The figure above shows an example of evaluation method 1. The pixel with the first abso-
lute relative change in height (in direction of evaluation) that is greater or equal to the
threshold is detected. In this case the amount of the last change is ≥ than the threshold.
The red circle indicates the detected point on the blue line. This point corresponds to the
location of the returned X and Y pixel coordinates. Red circle displayed in this example
only.
Evaluation Method 2: Detect Absolute Change in Height
Beginning at the starting point of the line this method detects if the height enters a user
defined region of height values. The evaluation is based on the absolute values in the
histogram along the line. The region of height values is defined by upper and lower thresh-
olds. In this mode the function returns each transition into the region of height values. Note
following convention: If the height value of the starting point of the line is already in the
region of height values the starting point itself is a detected point as well. In this mode the
function writes the found pixel coordinates of detected transitions into the table.
The figure below shows an example of evaluation method 2. The red circles indicate the
detected points in the histogram (green line). Note that only one transition of the height
into the selected region of height values is detected. This is due to the fact that the loca-
tion of the detected points depends on the direction of evaluation. The red circles corre-
spond to the location of the returned X and Y coordinates. Red circles displayed in this
example only.
Height value along the line
User defined threshold of the minimal
required change in height
Absolute derivative of the height (shows
amount of height changes along the line)
Direction of evaluation

Reference Manual Chapter 4
IVC-3D
©SICK AG • Advanced Industrial Sensors • www.sick.com • All rights reserved 101
Edge
Figure – Evaluation method 2: Detect absolute change in height
The evaluation method and the geometrical definition of the line parameters are selected
by the input parameter Type. The following types are available:
Type
Evaluation method
Line parameters
Single & Cartesian
1 Cartesian coordinates for start and end point of line.
Single & Interval
1 Cartesian coordinates for start point and relative values
delta X and delta Y for end point of line.
Single & Polar
1 Cartesian coordinates for start point and distance and
angle (anti clockwise with respect to x-axes) for end point
of line.
Multiple & Cartesian
2 Cartesian coordinates for start and end point of line.
Multiple & Interval
2 Cartesian coordinates for start point and relative values
delta X and delta Y for end point of line.
Multiple & Polar
2 Cartesian coordinates for start point and distance and
angle (anti clockwise with respect to x-axes) for end point
of line.
To reduce the influence of noise the input parameter Average pixels can be set to make
an average of the height values in up to 10 pixels in line direction. This avoids faulty results
due to the influence on single pixels. This option is available with evaluation method 2:
Detect an absolute change in height only.
Direction of evaluation
Height value along the line
User defined upper and lower
threshold

Chapter 4 Reference Manual
IVC-3D
102 ©SICK AG • Advanced Industrial Sensors • www.sick.com • All rights reserved
Edge
Input Parameters
01 = Source bank Selected image bank for the processing of this
function.
02 = Type Selects evaluation method and
geometric definition of line parameters (see table
above).
03 = Start point X X coordinate for start point of line.
04 = Start point Y Y coordinate for start point of line.
05 = End point X, width, L If Type is Cartesian:
X coordinate for end point of line.
If Type is Interval:
Relative distance delta X to end point of line.
If Type is Polar:
Absolute distance to end point of line.
06 = End point Y, height, angle If Type is Cartesian:
Y coordinate for end point of line.
If Type is Interval:
Relative distance delta Y to end point of line.
If Type is Polar:
Angle with respect to x-axes.
07 = Min height (mm) Lower height threshold value (method 2). Derivative
threshold (method 1).
08 = Max height (mm) Upper height threshold value (method 2). Derivative
threshold (method 1).
09 = Average pixels Available with evaluation method 2 only.
Allows to average over up to 10 pixels in the line
direction.
10 = Table index Works only for evaluation method 2.
Start index in table to write the found pixel coordi-
nates of transitions in the table.
11 = Max stored transitions Works only for evaluation method 2.
Upper limit for stored transitions in the table.
Counts from first found pixel.
12 = Destination bank Number of the destination bank in which to display
source bank, line and found points. Make sure that
Destination bank is different from Source bank.
Returned Values
01 = Found transitions Total number of found transitions.
02 = X transition X coordinate of the first found pixel.
Set to 0 if no transitions were found.
03 = Y transition Y coordinate of the first found pixel.
Set to 0 if no transitions were found.
Error Messages
Err. = 10 Error in Parameter 10.
Value has to be less than 11.

Reference Manual Chapter 4
IVC-3D
©SICK AG • Advanced Industrial Sensors • www.sick.com • All rights reserved 103
Edge
Find Subpixel Edge This tool scans the height values along a user defined line and detects a change of height
values that is at least of the amount of a user defined threshold. Evaluation begins at the
start point of line and returns the coordinates of the first found edge with subpixel resolu-
tion. All evaluation types use a relative threshold and Cartesian coordinates for start and
end point of the line.
Double-clicking on the input field for Threshold and double-clicking again on the button that
appears opens a larger image. In this new window you can set the threshold for the re-
quired relative changes of height values by using a slider on the left side. The first found
edge along the line is marked with a green dot in the image.
Input Parameters
01 = Source bank Image bank containing the image to be processed
02 = Type Always set to Cartesian.
03 = Start point X X coordinate for start point of line.
04 = Start point Y Y coordinate for start point of line.
05 = End point X, width, L
X coordinate for end point of line, delta X, distance.
06 = End point Y, height, angle
Y coordinate for end point of line, delta Y, angle.
07 = Threshold (mm) Threshold for required relative change in height to detect an
edge.
08 = Destination Bank Image bank in which to draw the line that was searched
along, and lines for the returned X and Y coordinates.
Returned Values
01 = X transition X coordinate of the found edge with subpixel resolution.
02 = Y transition Y coordinate of the found edge with subpixel resolution.

Chapter 4 Reference Manual
IVC-3D
104 ©SICK AG • Advanced Industrial Sensors • www.sick.com • All rights reserved
Edge
Find Multiple Edges This tool evaluates the variation of height values and detects edges along a user defined
line. In general two evaluation types are available.
Relative Detects pixels with a height value variation above a relative height value
threshold. Additional it’s possible to select the type of transition to detect
only transitions from high to low height values, from low to high height val-
ues or any transition.
Absolute Detects pixels with a height value variation above or below two absolute
height value thresholds.
For each evaluation type there exist specific input parameters to optimize the edge detec-
tion. The definition of these input parameters is shown in the figures below.
The evaluation starts at start point of line and continues along the line to end point of line.
The tool writes the X and Y coordinates of the detected pixels into a user defined row in
the table. Additionally the tool returns the total number of found transitions along the line.
Double-click the input field for the height value thresholds and click the button to set the
upper and lower thresholds for the height values with a slider. Additionally it is possible to
set length and position of the line with the left mouse button. All found edges along the line
with transitions from low to high height values are marked with a blue cross and transitions
from high to low height values with a red cross.
Figure – Edge finding with evaluation type Relative, which detects a relative change of height values. Note that the Min edge distance value should be greater than the Scan interval value to avoid misplaced results.
1 234
Average pixels:
Value 2 means values will
be averaged out
of two pixels.
Scan interval: Distance of pixels that
will be compared.
Min edge distance:
Number of pixels that
will be skipped if one
edge is found.
Scan interval

Reference Manual Chapter 4
IVC-3D
©SICK AG • Advanced Industrial Sensors • www.sick.com • All rights reserved 105
Edge
Figure – Edge finding with evaluation type Absolute, which detects an absolute change of height values.
Input Parameters
01 = Source bank Image bank containing the image to be proc-
essed.
02 = Type Selected type of threshold and transition type:
Bright -> dark
Relative threshold and only transitions from
high to low height values will be detected.
Dark –> bright
Relative threshold and only transitions from low
to high height values will be detected.
Any relative transition
Relative threshold and any transition will be
detected
Absolute
Absolute threshold and any transitions above
or below the two thresholds will be detected.
03 = Start point X X coordinate for start point of line.
04 = Start point Y Y coordinate for start point of line.
05 = End point X X coordinate for end point of line.
06 = End point Y Y coordinate for end point of line.
07 = Min height (mm) Lower height value threshold.
Using any evaluation type with relative thresh-
old this value is the required changes in height
values.
08 = Max height (mm) Upper height value threshold.
Available only with evaluation type absolute
threshold.
Note that this value will be ignored when using
evaluation type relative threshold.
1 2
Scan interval: Distance of pixels that
will be compared.
Min width:
Number of consecutive pixels
with values that must be in-
between selected thresholds
Average pixels:
Value 2 means values will
be averaged out
of two pixels.

Chapter 4 Reference Manual
IVC-3D
106 ©SICK AG • Advanced Industrial Sensors • www.sick.com • All rights reserved
Edge
09 = Average pixels Number of averaged pixels for height value.
10 = Min edge distance / Min width Min edge distance
Number of pixels that will be skipped if a
transition is found.
Used with evaluation type relative threshold.
Min width
Number of consecutive pixels that must have
height values between lower and upper
threshold.
Used with evaluation type absolute threshold.
11 = Scan interval Distance of compared pixels (in pixels).
12 = Table index Start index in table to write the found coordi-
nates.
13 = Max stored transitions Upper limit for number of stored transition
coordinates in table.
Note that only transitions up to this number will
be marked with a cross in the image bank. If
Max stored transitions = 0 no found transition
will be marked in the image.
14 = Destination bank Number of the image bank in which to display
the circle (ellipse) with red marked crosses to
indicate found transitions.
Returned Values
01 = Found transitions Total number of found edges.
Error Messages
Error 135 The line is too short.
Error 136 The line is too long.

Reference Manual Chapter 4
IVC-3D
©SICK AG • Advanced Industrial Sensors • www.sick.com • All rights reserved 107
Edge
Find Mean of Edges This tool performs a linear fit on certain pixels in the image. Return values are the mean
position on the fitted line and the deviation from the line of the found pixels.
The pixels for the fit are generated by a height value evaluation either along selected
columns or selected rows. Beginning at the starting point of the column or row the first
pixel showing a change in height that is at least of the amount of a user defined value is
indicated. In general the direction of evaluation is either along the columns or the rows and
is selected by an input parameter.
This tool requires a rectangular non-rotated ROI from a previously performed step. Note
that only ROIs generated by the ‘ROI Rectangle’ tool can be used. Do not use ROIs from
any other ROI tool. Only the columns or rows inside the ROI are considered.
To speed up processing time it is possible to select how many columns or rows inside the
ROI that should be evaluated. The input parameter Scan interval in pixel defines the
equidistant gap between each column or row in pixels. The precision of the linear fit is
increased with the number of columns or rows.
After the height value evaluation is performed further conditions select the pixels that are
considered for the linear fit. To ignore a single outlier it is possible to allow a maximum
distance from the next found neighbor pixel. To ignore connected pixels it is possible to
define a cluster build with a minimum number of connected pixels. Clusters of this size and
a distance of more than the allowed maximum distance to the next cluster are ignored for
the fit.
Double clicking the input field for the Threshold parameter and double clicking an appear-
ing button opens a larger image. This new window allows setting of the Threshold parame-
ter and displays the found pixels and the fitted line in the image.
The tool returns the coefficients of the equation for the line that represents the edge. The
equation is on the form y = kx+m.
Input Parameters 01 = Source bank Image bank containing the image to be processed.
02 = ROI definition step Step number where the ROI to use was created.
Note that only ROIs generated by the 'ROI rectangle'
tool can be used.
03 = Analysis direction Direction of the evaluation to generate pixels for the
fit. The choices are: Left -> right Down -> up Right -> left Up -> down
04 = Scan interval Define gap between equidistant spaced columns or
rows in pixels.
To evaluate each column (row) type in 0.
05 = Threshold (mm) Amount of the minimum required change in height.
06 = Pixel distance Maximum allowed distance in pixel from next found
neighbor pixel.
07 = Average pixels Allows to average height values over up to 16 pixels
along the scan direction.
08 = Min connected transitions Defines minimum required number of connected
pixels with the allowed distance from next neighbor
pixel (combination with the input parameter Pixel
distance).
09 = Destination bank Number of the destination bank in which to display
source bank, selected pixels and fitted line. Make
sure that Destination bank is different from Source
bank.

Chapter 4 Reference Manual
IVC-3D
108 ©SICK AG • Advanced Industrial Sensors • www.sick.com • All rights reserved
Edge
Returned Values
01 = Mean of transition Returns the mean X respectively Y
coordinate of all fitted pixels (depends
on the evaluation direction).
02 = Max derivation of regression Maximum distance from the fitted line
in pixel (depends on the evaluation
direction).
03 = Points out of tolerance (%) Percentage of the found pixels which
will not be considered for the linear fit
04 = Lines without transition (%) Percentage of evaluated columns
(rows) without the required transitions
in height.
05 = Slope This is the slope of the line, i.e. the
value of k in the line equation.
06 = Y-intercept Indicates where the line crosses the
Y-axis, i.e. the value of m in the line
equation.
Example
The following example is for IVC-2D, but the principle is the same when using IVC-3D. The
only difference is that the threshold is a height value in millimeters instead of a gray level
value.
The figure below shows an example to Find mean line and margin. Note that red circles are
ignored and are not considered for the linear fit. Chosen input parameters: Tolerance in
pixel = 5 and Filter in steps on isolated points = 3. Due to the fact that all pixels with a
distance of more than 5 pixels to the next found neighbor pixel are ignored (indicated with
A in the figure). Additionally all clusters with less than 4 connected pixels and a distance of
more than 5 pixels to the next found neighbor pixel are ignored as well (indicated with B in
the figure).
Figure – Evaluation direction is from top to bottom. Dashed yellow box indicates selected ROI. Blue circles: found pixels which will be considered for the linear fit, red circles: found pixels but ignored and not considered for the linear fit, green circles: fitted mean line. The table below the image shows the result parameters.
A
B

Reference Manual Chapter 4
IVC-3D
©SICK AG • Advanced Industrial Sensors • www.sick.com • All rights reserved 109
Edge
Find Circle Edges This tool evaluates the variation of height values and detects edges along the circumfer-
ence of a circle or ellipse. In general two evaluation types are available.
Relative evaluation: This type detects pixels with a height variation above a relative
height value threshold.
Absolute evaluation: This type detects pixels with a height variation above or below
two absolute height value thresholds.
Each evaluation type has specific input parameters to optimize the edge detection. The
definition of these input parameters is shown in the figures below.
The evaluation starts at the horizontal axis of the circle (ellipse) and continues counter
clockwise along the circumference.
The tool writes the X and Y coordinates of the detected pixels into a user defined row in
the table. Additionally the tool returns the total number of indicated pixels and sets an error
flag to control the correct execution.
To set the thresholds with a slider, double-click the input field for the height value threshold
and click the appearing button that opens a larger image. Use the left mouse button to
move the slider. It is also possible to set the shape and position of the circle (ellipse) with
the left mouse button in this window. All found edges on the circumference are marked
with red crosses.
Figure – Edge finding using relative evaluation. A relative change of height values is detected. Note that the Min edge distance value should be greater than the Scan interval value to avoid misplaced results.
1 234
Average pixels:
Value 2 means values will
be averaged out
of two pixels.
Scan interval: Distance of pixels that
will be compared.
Min edge distance:
Number of pixels that
will skipped if one edge
was found.
Scan interval

Chapter 4 Reference Manual
IVC-3D
110 ©SICK AG • Advanced Industrial Sensors • www.sick.com • All rights reserved
Edge
Figure – Edge finding using Absolute evaluation.
Input Parameters
01 = Source bank Selected image bank for the processing of this
function
02 = Type Selected type of threshold
Absolute sensitive to absolute variations of
height values.
Relative sensitive to relative variations of height
values (Input parameter Max height will
be ignored)
03 = X center X coordinate of the circle or ellipse center.
04 = Y center Y coordinate of the circle or ellipse center.
05 = X radius Value of the radius in X direction.
06 = Y radius Value of the radius in Y direction.
07 = Min height (mm) Lower height value threshold.
When using evaluation type Relative, this value
is the required change in height values.
08 = Max height (mm) Upper height value threshold.
Note that this value will be ignored when using
evaluation type Relative threshold.
09 = Type of transition Only available with evaluation type Relative. Note
that this value will be ignored when using evaluation
type absolute threshold.
Defines direction of evaluated height value transi-
tions.
1 = transitions from lower to higher.
–1 = transitions from higher to lower.
0 = transitions in both directions.
10 = Scan interval Distance of compared pixels (in pixels).
11 = Average pixels Number of averaged pixels for height value.
1 2
Scan interval: Distance of pixels that
will be compared.
Min width:
Number of consecutive pixels
with values that must be in-
between selected thresholds
Average pixels:
Value 2 means values will
be averaged out
of two pixels.

Reference Manual Chapter 4
IVC-3D
©SICK AG • Advanced Industrial Sensors • www.sick.com • All rights reserved 111
Edge
12 = Min edge distance Only available with evaluation type Relative. Note
that this value will be ignored when using evaluation
type Absolute.
Number of pixels that will be skipped if a transition
is found.
13 = Min width Only available with evaluation type Absolute. Note
that this value will be ignored when using evaluation
type Relative.
Number of consecutive pixels that must have height
values between lower and upper threshold.
14 = Table Index Start index in table to write the found coordinates.
15 = Max stored transitions Upper limit for number of stored transition coordi-
nates in table.
16 = Destination bank Number of image bank to display the circle (ellipse)
with red marked crosses to indicate found transi-
tions.
Returned Values
01 = Error flag Flag = 0 if the function was executed correctly.
02 = Found edges Total number of found transitions.
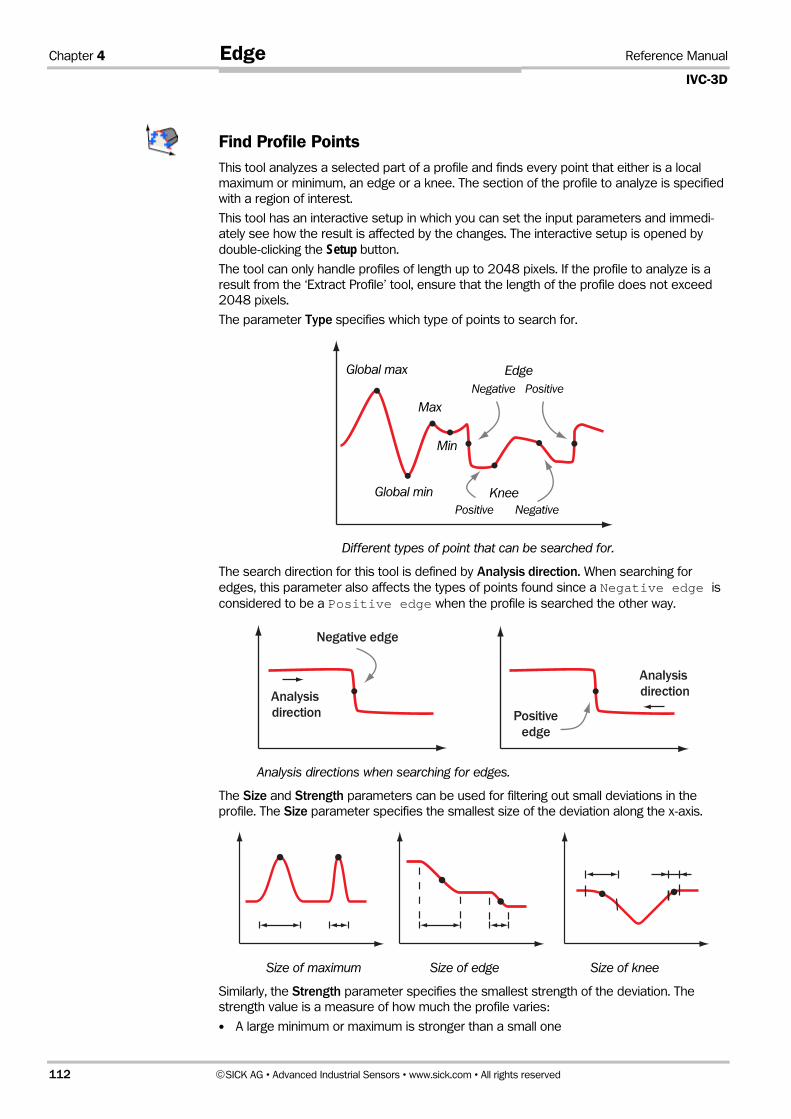
Chapter 4 Reference Manual
IVC-3D
112 ©SICK AG • Advanced Industrial Sensors • www.sick.com • All rights reserved
Edge
Find Profile Points This tool analyzes a selected part of a profile and finds every point that either is a local
maximum or minimum, an edge or a knee. The section of the profile to analyze is specified
with a region of interest.
This tool has an interactive setup in which you can set the input parameters and immedi-
ately see how the result is affected by the changes. The interactive setup is opened by
double-clicking the Setup button.
The tool can only handle profiles of length up to 2048 pixels. If the profile to analyze is a
result from the ‘Extract Profile’ tool, ensure that the length of the profile does not exceed
2048 pixels.
The parameter Type specifies which type of points to search for.
Different types of point that can be searched for.
The search direction for this tool is defined by Analysis direction. When searching for
edges, this parameter also affects the types of points found since a Negative edge is
considered to be a Positive edge when the profile is searched the other way.
Negative edge
Analysis direction
Analysis direction
Positiveedge
Analysis directions when searching for edges.
The Size and Strength parameters can be used for filtering out small deviations in the
profile. The Size parameter specifies the smallest size of the deviation along the x-axis.
Size of maximum Size of edge Size of knee
Similarly, the Strength parameter specifies the smallest strength of the deviation. The
strength value is a measure of how much the profile varies:
A large minimum or maximum is stronger than a small one
Global max Edge Negative Positive
Max
Min
Knee Global min Positive Negative

Reference Manual Chapter 4
IVC-3D
©SICK AG • Advanced Industrial Sensors • www.sick.com • All rights reserved 113
Edge
A steep edge is stronger than a flat edge
A sharp knee is stronger than a dull knee
Strength of minimum Strength of edge Strength of knee
For each found point, the x coordinate and the strength value are stored in the table,
starting at row Table index. Each found point will thus occupy two rows in the table. The
number of points stored in the table can be limited by setting the Max stored points
parameter.
Input Parameters
01 = Source bank Image bank containing the profile to analyze.
02 = ROI definition step The program step where the ROI was defined.
03 = Analysis direction The direction in which the analysis shall be performed:
Left –> right Right –> left
04 = Type The type of points to find: Global Min Global Max Min Max Positive edge Negative edge Positive knee Negative knee
05 = Size The approximate size of the deviation in pixels along the
x-axis; width of edge, width of maximum, etc. Allowed
values are 1 through 128.
06 = Min strength Minimum strength for deviations to be detected. A high
maximum, low minimum, steep edge or sharp knee
corresponds to high strength. Allowed values are 0
through 100.
07 = Table index Position in the table where the results – x coordinate and
strength – are stored.
08 = Max stored points Maximum number of points that the tool will find
10 = Backwards com-patible
See note below.
Returned Values
01 = Found points The number of points that were found and stored in
the table.
Error Messages
Err. = 7704 The region of interest has parts that are outside the
source bank.
This error is also returned if the ROI ends past pixel

Chapter 4 Reference Manual
IVC-3D
114 ©SICK AG • Advanced Industrial Sensors • www.sick.com • All rights reserved
Edge
2048 of the profile.
Important note:
Changed behaviour since IVC 3.2 release:
1. The tool could sometimes miss valid points above the min strength value, even if the
max number of points had not been reached.
2. Previously, the tool returned the first valid found points, but could miss stronger points
farther along the profile. Now, the tool is changed to return the points with the largest
strengths, still sorted in the order of occurrence according to the search direction.
A new parameter called Backwards Compatibility is added to the tool. If this parameter is
set to false, the correct behaviour as described above is enabled, and if it is set to true the
previous behaviour is retained.

Reference Manual Chapter 4
IVC-3D
©SICK AG • Advanced Industrial Sensors • www.sick.com • All rights reserved 115
Measure
4.5 Measure
Centroid This tool finds all pixels inside a ROI with height values between a lower and an upper
threshold. The tool returns the coordinates of the center of gravity (centroid) of the found
pixels area.
Double-click the input field for lower and upper threshold and double-click the appearing
button. This opens an interactive window. This new window allows setting lower and upper
threshold with a slider and shows the image with the found pixels colored.
If no pixels with height values between Min height and Max height are found inside the
ROI, the resulting coordinates of the centroid are (0,0).
Input Parameters
01 = Source bank Selected image bank for the processing of
this tool.
02 = ROI definition step Select ROI from a previously program step.
03 = Min height (mm) Threshold for lower height value.
04 = Max height (mm) Threshold for upper height value.
05 = Destination bank Number of the image bank in which to
show the image with colored pixels and
calculated centroid.
Returned Values
01 = X center X coordinate of calculated center of gravity.
02 = Y center Y coordinate of calculated center of gravity.
Note:

Chapter 4 Reference Manual
IVC-3D
116 ©SICK AG • Advanced Industrial Sensors • www.sick.com • All rights reserved
Measure
Single Blob Analysis This tool counts all connected pixels with height values between a lower and an upper
threshold beginning at a defined starting point in the image. It is possible to mark all found
pixels with a color. Return values are the total number of found pixels and the centroid
coordinates of the found pixels.
The lower and upper threshold for the height values can be set with a slider in an interac-
tive setup window, which also shows the image with the found pixels marked with the
selected color. To open the interactive window, double-click on the input field for lower or
upper threshold and double-click again on the button that is displayed by the field.
If the starting point is at a place at which the height value is not in between Min height and
Max height, the resulting centroid is (0,0) and the number of counted pixels is of course 0.
Input Parameters
01 = Source bank Image bank containing the image to analyze.
02 = Start point X X coordinate to start evaluation of height values.
03 = Start point Y Y coordinate to start evaluation of height values.
04 = Min height (mm) Threshold for lower height value.
05 = Max height (mm) Threshold for upper height value.
06 = Color Select color to mark found pixels. Double-clicking
opens a color table.
07 = Destination bank Number of image bank to show image with colored
pixels and calculated centroid.
Returned Values
01 = Found pixels Total number of found pixels between lower and
upper threshold.
02 = X center X coordinate of calculated centroid.
03 = Y center Y coordinate of calculated centroid.
Example
Note:
Max height = 28
Min height = 5
Starting point
Max height = 20
Min height = 5

Reference Manual Chapter 4
IVC-3D
©SICK AG • Advanced Industrial Sensors • www.sick.com • All rights reserved 117
Measure
Area This tool calculates how many pixels inside a ROI that have a height value between a lower
and an upper threshold. All found pixels inside the lower and upper threshold are defined
as “pixels in range” and all pixels outside this region of height values are defined as “pixels
out of range”. Return values are the total number of pixels in range (within the region of
height values) and pixels out of range (outside the region of height values).
Double-click the input field for Min height and Max height and click the appearing button to
set the height values with a slider. All pixels inside the ROI with height values in between
the two thresholds are colored according to the parameter Color for marking pixels in range and the pixels outside the thresholds are not affected.
Input Parameters
01 = Source bank Selected image bank for the processing of this
tool
02 = ROI definition step Select ROI from a previous program step.
03 = Min height (mm) Threshold for lower height value.
04 = Max height (mm) Threshold for upper height value.
05 = Color for marking pixels in range
The pixels inside the ROI that are between the
two thresholds are marked with this color
Returned Values
01 = Pixels in range Total number of found pixels between the
lower and upper threshold.
02 = Pixels out of range Total number of found pixels outside the lower
and upper threshold.

Chapter 4 Reference Manual
IVC-3D
118 ©SICK AG • Advanced Industrial Sensors • www.sick.com • All rights reserved
Measure
Perimeter This tool traces the contour of a blob. It requires an input starting point which should be
located inside or to the left of the blob. The contour of the blob must be completely inside
the image. The coordinates of the input starting point are usually a result from a previously
executed step, for example of the Edge category. Beginning at the starting point this tool
starts searching from left to right for the nearest edge on the horizontal line through this
point. The search is done in a binarized image which set by the thresholds Min height and
Max height. When the edge is found the perimeter is traced along the object.
Double-click on the input field for the height value thresholds and double-click again on the
appearing button. This opens an interactive window. This new window allows setting the
upper and lower thresholds for the height values with a slider. The found contour pixels are
displayed in red color in the image.
This tool is useful for generating object specific ROIs in combination with the 'ROI perime-
ter' tool.
1. The input starting point is not necessarily on the found contour (see examples below).
2. If the input starting point is outside of the blob, this tool finds white blobs best if the
starting point is at the left of the blob and black blobs best, if the starting point is on the
right of the blob. However, it is strongly recommended not to use any starting point out-
side of the contour.
Input Parameters 01 = Source bank Selected image bank for the processing of this tool.
02 = Start point X X coordinate of starting point to trace contour. Normally
this value is a result value form a previously executed step
of the Edge category.
03 = Start point Y Y coordinate of starting point to trace contour. Normally
this value is a result value form a previously executed step
of the Edge category.
04 = Min height (mm) Threshold for lower height value of allowed contour pixels.
05 = Max height (mm) Threshold for upper height value of allowed contour pixels.
06 = Destination bank Number of image bank to plot the found contour pixels.
Returned Values
01 = Error flag Flag = 0 if the tool was executed correctly
Flag = -1 if no contour was found or in case of an error.
02 = Perimeter length Total number of pixels along the perimeter of the traced
contour. The upper limit is 2500 pixels.
Error Messages Err. = 119 Parts of the contour are out of the FOV or no start point to
trace the contour was found. Check thresholds for height
values.
Err. = 118 Number of found contour pixels is less then 20. Check
thresholds for height values.
Examples
Notes:
input starting point
contour starting point

Reference Manual Chapter 4
IVC-3D
©SICK AG • Advanced Industrial Sensors • www.sick.com • All rights reserved 119
Measure
Line Intersection This tool calculates the intersection, cross point, of two straight lines. Each line is defined
by the coordinates of two points. Return values are the coordinates of the lines cross
point.
Cross points can be outside of the FOV but are still calculated correctly.
An error occurs if two points for one line coincide or in cases of parallel lines. In these
cases the step terminates with an error and the returned coordinates are set to 0.
Input Parameters
01 = Line A start point X X coordinate one on line A.
02 = Line A start point Y Y coordinate one on line A.
03 = Line A end point X X coordinate two on line A.
04 = Line A end point Y Y coordinate two on line A.
05 = Line B start point X X coordinate one on line B.
06 = Line B start point Y Y coordinate one on line B.
07 = Line B end point X X coordinate two on line B.
08 = Line B end point Y Y coordinate two on line B.
Returned Values
01 = X intersection X coordinate of cross point
02 = Y intersection Y coordinate of cross point
Errors
Err. 112 No cross point found.
Check that selected points for one line are different.
Check that lines are not parallel.
Note:

Chapter 4 Reference Manual
IVC-3D
120 ©SICK AG • Advanced Industrial Sensors • www.sick.com • All rights reserved
Measure
Distance and Angle This tool calculates the distance and the angle between two points. Return values are the
absolute value of the distance and the angle.
Notes:
1. The definition of the geometrical interpretation of the angle means that the direction of
rotation is counterclockwise in respect to the corresponding X-axis going through the
first point.
2. If both points are identical, both result values are 0.
This tool is useful for example for generating offset parameters in a ROI tool.
Input Parameters
01 = Start point X X coordinate of the first point.
02 = Start point Y Y coordinate of the first point.
03 = End point X X coordinate of the second point.
04 = End point Y Y coordinate of the second point.
Returned Values
01 = Distance Absolute value of the distance between the points in pixels.
02 = Line angle Angle between the points in degrees ( ).
Example
Geometrical interpretation of the angle between two points.
Figure – Geometrical interpretation of the angel between points.
α X-axis
first point
second point

Reference Manual Chapter 4
IVC-3D
©SICK AG • Advanced Industrial Sensors • www.sick.com • All rights reserved 121
Measure
Curve Intersection This tool finds all intersection points between two curves. The supported curve types are
lines, second-degree curves (parabolas) and circles.
The coordinates of the intersection points are written to the table, starting with x1 at Table
index, and y1 at Table index+1, then x
2 and so on. A maximum of 4 intersection points can
be found, as in the case of a parabola intersecting with a circle.
Note that the found points are not displayed in the previews in IVC Studio.
Input Parameters
01 = Curve A definition step The program step where the curve A is defined.
02 = Curve B definition step The program step where the curve B is defined.
03 = Table index The table row in which to start storing the coor-
dinates of the calculated intersections.
Returned Values
01 = Number of intersections The number of found intersections
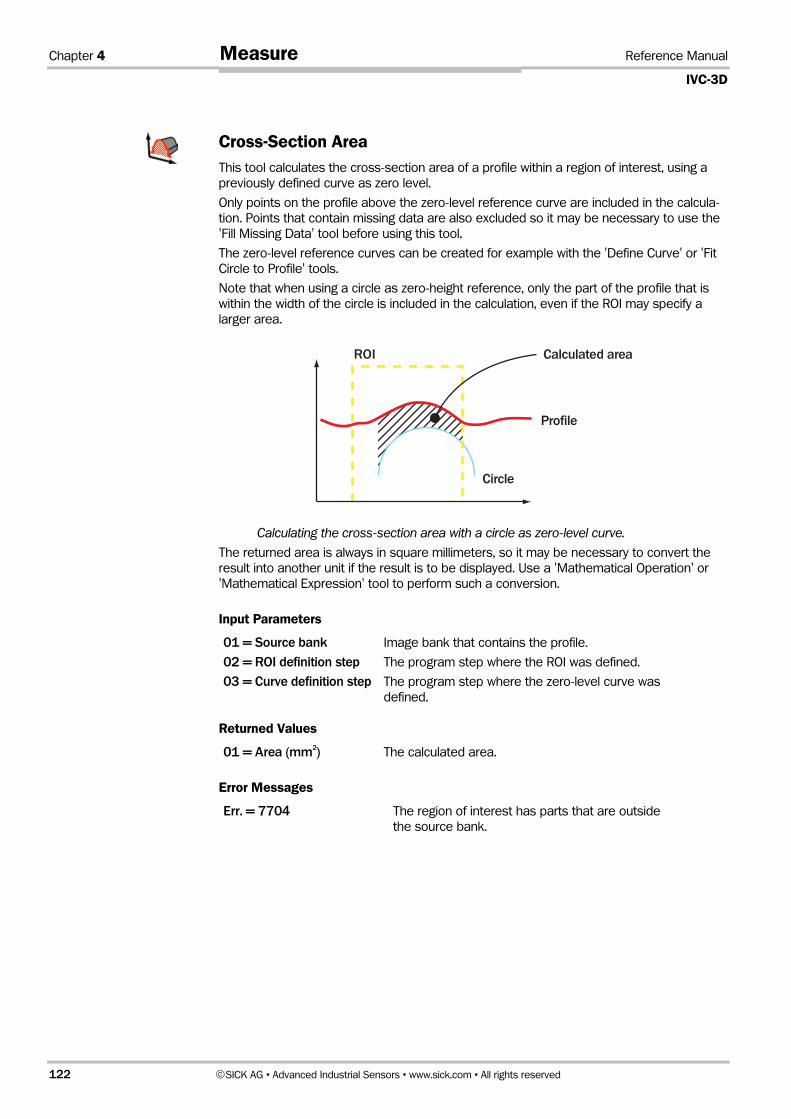
Chapter 4 Reference Manual
IVC-3D
122 ©SICK AG • Advanced Industrial Sensors • www.sick.com • All rights reserved
Measure
Cross-Section Area This tool calculates the cross-section area of a profile within a region of interest, using a
previously defined curve as zero level.
Only points on the profile above the zero-level reference curve are included in the calcula-
tion. Points that contain missing data are also excluded so it may be necessary to use the
'Fill Missing Data' tool before using this tool.
The zero-level reference curves can be created for example with the 'Define Curve' or 'Fit
Circle to Profile' tools.
Note that when using a circle as zero-height reference, only the part of the profile that is
within the width of the circle is included in the calculation, even if the ROI may specify a
larger area.
ROI
Profile
Circle
Calculated area
Calculating the cross-section area with a circle as zero-level curve. The returned area is always in square millimeters, so it may be necessary to convert the
result into another unit if the result is to be displayed. Use a 'Mathematical Operation' or
'Mathematical Expression' tool to perform such a conversion.
Input Parameters
01 = Source bank Image bank that contains the profile.
02 = ROI definition step The program step where the ROI was defined.
03 = Curve definition step The program step where the zero-level curve was
defined.
Returned Values
01 = Area (mm2) The calculated area.
Error Messages
Err. = 7704 The region of interest has parts that are outside
the source bank.

Reference Manual Chapter 4
IVC-3D
©SICK AG • Advanced Industrial Sensors • www.sick.com • All rights reserved 123
Measure
Volume This tool calculates the volume of a 3D object within a region of interest, using a previously
defined surface as zero level.
Any pixels that miss data will not be included in the volume calculation. Consider interpolat-
ing missing data before using this tool.
The volume is given in cubic millimeters and may sometimes need conversion if the value
is to be presented to a user. Use the math tools to perform such a conversion.
Input Parameters
01 = Source bank Image bank that contains a 3D image of the
object whose volume will be calculated.
02 = ROI definition step Program step where the ROI was defined.
03 = Surface definition step Program step where the zero-level surface was
defined.
Returned Values
01 = Volume (mm3) The calculated volume.

Chapter 4 Reference Manual
IVC-3D
124 ©SICK AG • Advanced Industrial Sensors • www.sick.com • All rights reserved
Measure
Distance This tool calculates the distance between two points, given their calibrated x, y and z
coordinates.
To convert the coordinates of a pixel in a 3D image into calibrated x, y and z coordinates,
the 'Get Calibrated Point' tool can be used.
Input Parameters
01 = X1 (mm) The calibrated X coordinate of the first point.
02 = Y1 (mm) The calibrated Y coordinate of the first point.
03 = Z1 (mm) The calibrated Z coordinate of the first point.
04 = X2 (mm) The calibrated X coordinate of the second point.
05 = Y2 (mm) The calibrated Y coordinate of the second point.
06 = Z2 (mm) The calibrated Z coordinate of the second point.
Returned Values
01 = Distance (mm) The Euclidian distance between point 1 and point 2
Reference Manual Chapter 4
IVC-3D
©SICK AG • Advanced Industrial Sensors • www.sick.com • All rights reserved 125
Measure
Deviation This tool finds the maximum and the mean values of the absolute deviation along the z-
axis between a selected part of a 3D image and a surface.
The part of the 3D image to analyze is specified by the region of interest in ROI definition step, and the surface to use as reference is specified in Surface definition step.
If necessary, an Outlier distance can be used for removing noise in the 3D image. The
points that deviate more than Outlier distance from the surface are discarded, and the
mean and max deviation is based on the remaining points only.
If Outlier distance is set to zero, every point in the 3D image will be included in the calcula-
tions. Note that this tool usually runs faster when Outlier distance is set to 0.
The deviation can be used for measuring defects on plane surfaces. It can also be used
for measuring the quality of the result from the 'Fit Surface' tool.
Input Parameters
01 = Source bank Image bank containing the 3D image to be com-
pared with a surface
02 = ROI definition step The program step where the ROI was defined.
03 = Surface definition step The program step where the surface was defined.
04 = Outlier distance (mm) The maximum distance between a point in the 3D
image and the surface.
Returned Values
01 = Mean deviation (mm) The mean deviation from the reference surface.
02 = Max deviation (mm) The maximum deviation from the reference
surface.
Error Messages
Err. = 7807 There are no valid values in the specified ROI. Use
a different ROI or decrease Outlier distance.

Chapter 4 Reference Manual
IVC-3D
126 ©SICK AG • Advanced Industrial Sensors • www.sick.com • All rights reserved
Measure
Blob Finder This tool finds regions of connected pixels, called blobs, based on their values. The values
of the blobs are defined with an upper and a lower threshold.
It is recommended to use the interactive setup to customize the parameters. Double-click
on the Setup button to open the interactive setup window. For more information on the
interactive setup, see Blob Finder Setup on page 272.
Input Parameters
01 = Source bank Image bank containing the image to be proc-
essed by this tool.
02 = ROI definition step The number of a previous program step where
an arbitrarily shaped ROI has been generated.
This may be a ROI rectangle, circle, union or
even a blob analyzer step.
03 = Destination Bank Image bank in which the found blobs are
rendered if Generate blob image is enabled.
04 = Generate Blob Image If enabled, generates a blob image in the
destination bank. A blob image is an image
where all blobs are white (high) and all other
pixels are black (low). The image can be used
as input to other program steps for any kind of
processing. Note that the actual values of the
pixels in the image have no meaning in terms
of mm after blob binarization.
05 = Threshold Low (mm) Sets the minimum height threshold limit. Pixels
lower than this value are ignored.
06 = Threshold High (mm) Sets the maximum height threshold limit. Pixels
higher than this value are ignored.
07 = Threshold Mode Choose to look for lowered objects, raised
objects or to manually set the limits.
08 = Min Blob Area (pixels) Lower area limits for a found blob. Smaller
blobs are ignored.
09 = Max Blob Area (pixels) Upper area limits for a found blob. Larger blobs
are ignored.
10 = Timeout (ms) Sets the maximum time the tool is searching
for blobs. If this time limit is exceeded and the
tool has not yet scanned the entire ROI for
blobs, the result found so far will be returned.
Note that the actual elapsed time will be
somewhat longer than the timeout time since
the Blob finder needs to perform some clean-
ing up operations before returning.
11 = Ignore Edge Blobs If enabled, blobs on the edge of the ROI are
ignored.
If disabled, edge blobs are included, but
only the part of the blob inside the ROI is
considered.
Reference Manual Chapter 4
IVC-3D
©SICK AG • Advanced Industrial Sensors • www.sick.com • All rights reserved 127
Measure
12 = Fill Holes in Blobs If enabled, a blob is defined as all pixels
inside its external perimeter. Internal holes are
then considered part of the blob.
If disabled, holes will be kept and the blob
will only consist of pixels with original values in
range.
13 = Sort By Blobs can be sorted according to:
- Area
- Horizontal position (of centroid)
- Vertical position (of centroid)
- Distance to sorting point
- None (unsorted)
This option is used together with Sorting order to determine in which order to store the blobs.
For example, if sorting the blobs by area in
descending order, the largest blob is num-
bered 0, the second largest is number 1m etc.
If you want to find only the largest blob you can
thus sort by descending area and only analyze
the first blob (with index 0).
14 = Sorting Order Choose Ascending (smallest first) or De-scending (largest first). Use in conjunction
with Sort by to determine in which order to
store the blobs.
15 = Sorting Point X X position of sorting point. Only used when
sorting by Distance to sorting point
in the Sort by option.
16 = Sorting Point Y
Y position of sorting point. Only used when
sorting by Distance to sorting point
in the Sort by option.
17 = Table Index Blob centroid and blob area can be stored in
the table. Defines where in the table to start
saving blobs.
18 = Max Blobs in Table Maximum number of blobs to store in the
table. All blobs are stored internally and can be
accessed by the Blob analyzer tool even if no
blobs are stored in the table. Note, however, if
you use the interactive setup to configure your
blob finder step, you will need to use the table
to store blobs if you want to display the list of
blobs beneath the preview window.
Returned Values
01 = Number of Found Blobs The amount of blobs found.
02 = Low Threshold Used (mm) The lower threshold used when looking for
blobs.
03 = High Threshold Used (mm) The upper threshold used when looking for
blobs.

Chapter 4 Reference Manual
IVC-3D
128 ©SICK AG • Advanced Industrial Sensors • www.sick.com • All rights reserved
Measure
Blob Analyzer This tool analyzes the blobs found by the ‘Blob Finder’ tool. The Blob analyzer analyzes one
blob at a time and is typically used in a for loop. A range of different analysis methods can
be used as described below.
To use the Blob Analyser the step program must contain a ‘Blob Finder’ step, and a valid
Blob Index number must be pointed out by the ‘Blob Finder’ step number and the Blob
Index parameter.
It is recommended to use the interactive setup to customize the parameters. Double-click
on the Setup button to open the interactive setup window. For more information on the
interactive setup, see Blob Analyzer Setup on page 275.
Input Parameters
01 = Blob Finder Step Number The step number of the used ‘Blob Finder’.
02 = Blob Index The number of the blob to analyze. Valid values
are 0 to the number of found blobs -1 Note that
the first blob has number 0.
03 = Destination Bank Image bank where the analysis results are
visualized.
04 = Visualize Results If enabled, the results are visualized in the
destination bank.
If disabled, the results are not visualized.
05 = Display Centroids Determines if the blob centroid is displayed (with
a + sign) or not.
06 = Orientation Method The method to compute the blob orientation:
none, Area based or Boundary based. See
the Compute bounding box parameter for more
information.
07 = Compute Bounding Box Determines if a bounding box is computed or
not. If Enabled, the Orientation Method pa-
rameter determines how to orient the bounding
box:
If the orientation method is None, only the XY-
aligned bounding box is returned.
If the orientation method is Area based or
Boundary based, a graphical representation
of the bounding box is generated in the destina-
tion bank.
08 = Compute Diameters If Enabled, computes the maximum, the
minimum and the average diameters for the
found blobs. Currently no visualization (En-abled + Visualized) is available for diame-
ters.
09 = Angular Resolution (degrees) An advanced feature which determines what
resolution that will be used when computing the
orientation in Boundary based mode The
default value of 1 (degree) is a reasonable value
for most applications. Increasing the value
makes the analysis a bit faster at the cost of
lower angular resolution.
10 = Compute Perimeter If Enabled, calculates the perimeter length of
the blob in pixels. Select Enabled + Visu-alized to vizualize the result.
Note:

Reference Manual Chapter 4
IVC-3D
©SICK AG • Advanced Industrial Sensors • www.sick.com • All rights reserved 129
Measure
11 = Create Blob ROI Creates a ROI of the blob. The blob ROI can be
referenced by other tools by giving the Blob
Analyzer step number as ROI Definition step.
12 = Source Bank Only used when computing blob volume or
height. Determines which image to use as input
to the measurement.
13 = Surface Definition Step Only used when computing blob volume or
height. Determines which surface definition step
to use as reference in computing the volume or
the height.
14 = Compute Volume If enabled, the blob volume (mm3) between
the data in Source Bank and the surface in
Surface Definition Step is computed. That is, the
height difference between each blob pixel and
the reference surface at that point is multiplied
by the pixel area and accumulated to a volume.
15 = Compute Height If enabled, the blob height (mm) is computed.
The blob height is the distance between the
reference surface (from the Surface Definition Step) and the image data. The measurement
uses the Height Percentile parameter to deter-
mine what pixel values to consider.
16 = Height Percentile (%) Determines what pixel values to be used when
computing a blob height. If set to 95%, the top
5% of the pixels are removed. The height is then
determined by finding the maximum deviation
from the reference surface.
Returned Values
01 = Blob Area (pixels) The number of pixels in the blob.
02 = Left Edge of Blob The horizontal position of the leftmost pixel of the
blob That is, the left edge of the blob in pixels
along the X-axis.
03 = Top Edge of Blob The vertical position of the topmost pixel of the
blob. That is, the top edge of the blob in pixels
along the Y-axis.
04 = Blob Width (pixels) The total width of the blob, defined as the right-
most pixel - the leftmost pixel + 1.
05 = Blob Length (pixels) The total length of the blob, defined as the bot-
tommost pixel - the topmost pixel + 1.
06 = Blob Centroid X The x-coordinate of the blob centroid (area-based
mass centre).
07 = Blob Centroid Y The y-coordinate of the blob centroid (area-based
mass centre).
08 = Blob Orientation (degrees) The orientation angle of the blob in degrees. 0
means that the blob is horizontally aligned. The
angle increases counter clock-wise. The valid
range is 0-180 degrees.
09 = Blob Ovality A measure of how oval (non-isotropic) a blob is. A
perfect circle (or square) has the value 1 whereas
a straight line has a very low value. Valid range is
0-1.

Chapter 4 Reference Manual
IVC-3D
130 ©SICK AG • Advanced Industrial Sensors • www.sick.com • All rights reserved
Measure
10 = Max Diameter of Blob (pixels)
The largest diameter found in the blob, where
diameter is defined as the distance between the
two most distant points on a line through the blob
centroid.
11 = Min Diameter of Blob (pixels)
The smallest diameter found in the blob.
12 = Average Diameter of Blob (pixels)
The average of the diameters found in the blob.
13 = Blob Perimeter Length (pixels)
The length of the external perimeter of the blob
(in pixels). If the blob has internal holes, their
perimeters are not considered as part of the
perimeter.
Note: Perimeters are difficult to measure and
are affected by a lot of factors. Make sure that
the value returned by this measure is relevant to
your application.
14 = Bounding Box Centre X The horizontal position of the centre of a rotated
bounding box. Rotated bounding boxes are
obtained when enabling the Compute Bounding Box option and use an orientation mode different
from None. Note that if you use orientation mode
None, the bounding box will be defined by the left
edge, the top edge, the width and the length of
the blob.
15 = Bounding Box Centre Y The vertical position of the centre of a rotated
bounding box.
16 = Bounding Box Width (pix-els)
The width of the bounding box (along the major
axis of the blob).
17 = Bounding Box Length (pixels)
The length of the bounding box (along the minor
axis of the blob).
18 = Blob Volume (mm3) The volume between the reference surface and
the image data in Source Bank inside the blob
region.
19 = Blob Height above Surface (mm)
The maximum blob height above the reference
surface after removing the 100 minus the height
percentile % topmost pixels of the blob.

Reference Manual Chapter 4
IVC-3D
©SICK AG • Advanced Industrial Sensors • www.sick.com • All rights reserved 131
Measure
Co-Planarity This tool calculates the angle between the normal vectors of two planes. It’s typically used
to see if two surfaces are co-planar (parallel) or not.
Figure – The deviation angle between two fitted planes.
The two planes are fitted to the data pointed out by the Source Bank 1 and 2, and the ROI
definition Step 1 and 2.
Input Parameters
01 = Source Bank 1 Image bank containing the first image to be processed.
02 = ROI Definition Step 1 Previous program step defining the first ROI to be used
by this tool.
03 = Source Bank 2 Image bank containing the second image to be proc-
essed.
04 = ROI Definition Step 2 Previous program step defining the second ROI to be
used by this tool.
05 = Outlier Distance (mm) The maximum distance between a point in the 3D
image and the surface.
Returned Values
01 = Deviation Angle (degrees)
The angle between the two planes.
Notes:
Deviation angle

Chapter 4 Reference Manual
IVC-3D
132 ©SICK AG • Advanced Industrial Sensors • www.sick.com • All rights reserved
Matching
4.6 Matching
Shape Locator The Shape Locator tool finds a reference shape in an image. The reference shape is
created from a reference image and is then located (searched for by matching) in live
images.
Matching shapes or parts of shapes is complicated and it is essential to have a good set
of input parameters for this tool to compute a result in reasonable time. This tool has an
interactive setup to help you create reference shapes and fine tune input parameters so
that the locating algorithm will work as fast and efficient as possible. For more information
on the interactive setup, see Shape Locator Interactive Setup on page 251.
The section Locating Shapes (tips and tricks) on page 256 describes the algorithm used
when searching for shapes, and the section Examples on workflows on page 258 shows
some examples on how to use the suite of tools together in an efficient way.
The tool will return information about the first shape (according to the selected sorting
order). If a table index is specified, information about all found shapes is stored in the table
beginning at the specified index. For each shape, five entries are written in the table: x
position of the reference point, y position of the reference point, rotation angle, scale and
finally score of the located shape.
The coordinates of the reference point are given in pixels in the destination image. The
rotation and scale are given relative to the reference image.
Reference shapes can also be created in runtime using the ‘Add Shape Runtime’ tool.
The supplementary tools Get Shape on page 136, Transform Image on page 137 and
Transform ROI on page 139 can be used to traverse the list of found shapes.
Input Parameters
01 = Source bank The image bank where to search for matching shapes.
02 = Data block The slot in the memory where the reference shape is
stored.
03 = Search full image Controls if the whole image shall be used to search for the
shape, or if the ROI parameters shall be used to limit the
search area.
04 = ROI X coordinate The x coordinate of the upper left corner of the region to
search for matching shapes.
05 = ROI Y coordinate The y coordinate of the upper left corner of the region to
search for matching shapes.
06 = ROI width The width of the region to search.
07 = ROI height The height of the region to search.
08 = Allow scale Search for shapes with another scale compared to the
reference shape. Shapes with a scale variation of ±20%
can be found.
09 = Allow rotation Search for shapes with another rotation angle compared
to the reference shape.
10 = Rotation tolerance (degrees)
The greatest angle the search for a match should be
performed for.
Example: 180 means ±180 degrees, i.e. full rotation.
11 = Max number of The maximum number of shapes that the tool shall search

Reference Manual Chapter 4
IVC-3D
©SICK AG • Advanced Industrial Sensors • www.sick.com • All rights reserved 133
Matching
shapes for in the live image. The shapes with the highest score are
selected if there are more shapes in the image. Maximum
value is 32.
12 = Min score The tool will only return shapes with a score above or
equal to this value.
13 = Overlap distance (pixels)
Threshold in pixels determining when two close matches
shall be considered to belong to the same shape. A higher
value will in many cases help to reduce the execution time.
14 = Sort by Defines how the returned shapes shall be sorted. The
default sort order is with the highest score first in descend-
ing order.
15 = Sort order Defines if the sort order shall be ascending or descending.
16 = Table index The start position for result output to the table.
The value -1 indicates that no values shall be written to the
table.
17 = Timeout (ms) Sets the maximum time the tool is searching for shapes. If
this time limit is exceeded, the result found so far will be
returned. The status code will indicate if the tool has
exceeded the timeout. A value of -1 will let the algorithm
run to completion without any timeout limitation.
18 = Visualization Type of result visualization in the destination bank;
No visualization, First shape (according to specified sorting
order), All shapes.
19 = Destination bank The image bank where matched shapes are visualized.
The value -1 indicates that no visualization is performed.
This will help to reduce the execution time.
20 = Sorting point X The x coordinate of the sorting point. This value is only
used when the Sort by parameter is set to Sorting Point.
21 = Sorting point Y The y coordinate of the sorting point. This value is only
used when the Sort by parameter is set to Sorting Point.
Returned Values
01 = Search status The status of the execution of the shape locator.
02 = Number of shapes The total number of found shapes of satisfactory similarity
to the reference shape.
03 = Ref. point X coor-dinate
The x coordinate of the point that corresponds to the
reference point in the reference shape.
04 = Ref. point Y coor-dinate
The y coordinate of the point that corresponds to the
reference point in the reference shape.
05 = Angle (degrees) The angle of the found shape in the coordinate system
defined in the reference image.
06 = Scale The scale of the found shape compared to the scale of the
shape defined in the reference image.
07 = Score A measure of the resemblance of the shape found and the
reference shape. The score has an interval of 0 through
100, but it does not represent the similarity in percent.

Chapter 4 Reference Manual
IVC-3D
134 ©SICK AG • Advanced Industrial Sensors • www.sick.com • All rights reserved
Matching
Note: The results 3 through 7 refer to the first located shape according to the specified
sorting order.
SEARCH STATUS
0 All OK
8823 No shape found.
8824 Failure when writing results to the table.
8825 The reference point of one or more shapes is located outside the image.
8828 Failure when visualizing results.
8833 Search aborted due to timeout. The resulting shape may be less accurate.
ERROR CODES
7704 The ROI is partly or completely outside the image.
8828 Error in visualization of the located shape(-s)

Reference Manual Chapter 4
IVC-3D
©SICK AG • Advanced Industrial Sensors • www.sick.com • All rights reserved 135
Matching
Add Shape Runtime When creating reference objects in runtime, i.e. during the execution of the step program,
the Add Shape Runtime tool is used. The tool defines a reference shape that can later be
compared to other shapes with the 'Shape Locator' tool. The ‘Add Shape Runtime’ tool has
no interactive setup and it is intended to be used for on-line teaching. The interactive setup
of the 'Shape Locator' tool contains the same functionality as the ‘Add Shape Runtime’ tool
and has a user interface used to manually create reference shapes. For details on pa-
rameters and optimization of the algorithm, please refer to Add/Edit Shape Interactive
Setup on page 254.
Input Parameters
01 = Source bank The image bank holding an image of the reference
shape.
02 = ROI definition step An arbitrary shaped Teach ROI from a previous pro-
gram step.
03 = Data block The number of the slot in the memory (RAM) where
information of the reference shape will be stored
temporarily.
04 = Edge strength The edge strength is the image contrast needed for
defining shape edges. A higher value gives fewer edges
in the shape. Valid range 0-100
05 = Robustness vs. Speed This setting controls the tradeoff between execution
time and robustness when running the Shape Locator
tool. A high value prioritizes a short execution time.
Valid range 0-4
06 = Accuracy vs. Speed This setting controls the tradeoff between execution
time and the accuracy with which the shape is located
when running the Shape Locator tool. A high value
prioritizes a short execution time. Valid range 0-4
07 = Ref. point X coordi-nate
The x coordinate of the reference point.
08 = Ref. point Y coordi-nate
The y coordinate of the reference point.
09 = Destination bank The image bank where a visualization of the edges of
the reference shape shall be made. If set to -1 no
visualization will be made.
ERROR CODES
7704 The ROI is partly or completely outside the image.
8800 Initialization of the shape locating algorithm failed.
8838 The ROI Perimeter must have the parameter Filling set to 0=Internal. Otherwise,
the ROI will only contain the pixels on the circumference of the perimeter.

Chapter 4 Reference Manual
IVC-3D
136 ©SICK AG • Advanced Industrial Sensors • www.sick.com • All rights reserved
Matching
Get Shape The Get Shape tool is used together with the Shape Locator tool to retrieve information
about a located shape.
The tool refers to a previous Shape Locator step and the zero-based index of a located
shape. It is possible to visualize the position of the specified shape if a destination bank is
specified. Note that only the green edges of the shape are drawn in the destination bank.
The actual live image must be copied separately to the image bank before calling this tool.
Input Parameters
01 = Shape locator step The Shape Locator step that was used to find shapes.
02 = Shape index The zero-based index of the shape to retrieve information
about.
03 = Visualization Determines how the result shall be visualized in the desti-
nation bank.
04 = Destination bank The image bank where the result shall be visualized. Set to
-1 if no visualization is used.
Returned Values
01 = Status code The status of the execution of the 'Shape Locator' step.
02 = Ref. point X coor-dinate
The x coordinate of the point that corresponds to the
reference point in the reference shape.
03 = Ref. point Y coor-dinate
The y coordinate of the point that corresponds to the
reference point in the reference shape.
04 = Angle (degrees) The angle of the found shape in the coordinate system
defined in the reference image.
05 = Scale The scale of the found shape compared to the scale of the
shape defined in the reference image.
06 = Score A measure of the resemblance of the shape found and the
reference shape. The score has an interval of 0 through
100, but it does not represent the similarity in percent.
SEARCH STATUS
The result Search status can have one of the following values
0 All OK
8825 The reference point of the shape is located outside the image.
ERROR CODES
8810 The referenced step is not a Shape Locator step.
8812 The index of the shape is not valid, e.g. larger than the number of located
shapes.
8813 No results found from the Shape Locator tool. This can happen if the execution
of the Shape Locator tool failed for some reason.
8833 Timeout in the shape locating algorithm

Reference Manual Chapter 4
IVC-3D
©SICK AG • Advanced Industrial Sensors • www.sick.com • All rights reserved 137
Matching
Transform Image The Transform Image tool is used together with the Shape Locator tool. This tool trans-
forms the image from the source bank so that the located shape is moved to the same
position as the reference shape had in the reference image. It is possible to specify a ROI
so that only the interesting part of the image is transformed.
This functionality can be useful in applications where the inspections must be made in the
same position and rotation as in the reference image, for instance when using tools that
only handle non-rotated rectangle ROI:s. The tool is also useful when presenting results to
an operator.
However, it must be stressed that the transformation of the live image will affect the
information in the image, and that exact measurements cannot be performed on the
transformed image.
The parameter Interpolation method controls how the pixel values are calculated in the
destination image. It is possible to choose between bilinear interpolation (gives higher
image quality) or nearest neighbor (gives faster execution time).
The images below show an example where the upper image is used as a reference to
specify the shape of the clock. The lower images show the live image (to the left), and the
transformed live image. The shape of the clock in the transformed image is placed in the
same position as in the reference image.
Reference image Reference shape visualized.
Live image Transformed Live image
The ROI specifies what part of the live image that shall be visible in the transformed image.
Pixels outside the ROI will be black in the transformed image.
Input Parameters
01 = Source bank The image bank where the live image is stored.

Chapter 4 Reference Manual
IVC-3D
138 ©SICK AG • Advanced Industrial Sensors • www.sick.com • All rights reserved
Matching
02 = ROI definition step A ROI that limits the part of the live image to transform.
03 = Shape locator step The Shape Locator step that was used to find shapes.
04 = Shape index The zero-based index of the shape to retrieve information
about.
05 = Interpolation method
The interpolation method to use when calculating the pixel
values in the destination image.
06 = Destination bank The image bank where the result shall be visualized. Set to
-1 if no visualization is used.
Returned Values
01 = Search status The status of the execution of the 'Shape Locator' step.
SEARCH STATUS
The result Search status can have one of the following values
0 All OK
8825 The reference point of the shape is located outside the image.
ERROR CODES
8810 The referenced step is not a Shape Locator step.
8812 The index of the shape is not valid, e.g. larger than the number of located
shapes.
8813 No results found from the Shape Locator tool. This can happen if the execution
of the Shape Locator tool failed for some reason.
8833 Timeout in the shape locating algorithm

Reference Manual Chapter 4
IVC-3D
©SICK AG • Advanced Industrial Sensors • www.sick.com • All rights reserved 139
Matching
Transform ROI The Transform ROI tool is used together with the Shape Locator tool. This tool moves and
rotates a ROI so that it is placed relative to the located shape as it was in the reference
image.
This functionality is useful when exact measurements must be performed relative to the
located shape. The transformed ROI will be moved, rotated, and possibly scaled to the
position of the located shape.
The tool refers to a previous Shape Locator step and the zero-based index of a located
shape. The tool itself can be referred to as a ROI for all tools that can handle arbitrary
shaped ROI:s.
Reference image Position of ROI in reference image
Live image ROI transformed to the position of a located
shape.
Input Parameters
01 = ROI definition step The step where an arbitrary shaped ROI was created.
02 = Shape locator step The Shape Locator step that was used to find shapes.
03 = Shape index The zero-based index of the shape to retrieve information
about.

Chapter 4 Reference Manual
IVC-3D
140 ©SICK AG • Advanced Industrial Sensors • www.sick.com • All rights reserved
Matching
Returned Values
01 = Search status The status of the execution of the 'Shape Locator' step.
SEARCH STATUS
The result Search status can have one of the following values
0 All OK
8825 The reference point of the shape is located outside the image.
ERROR CODES
8810 The referenced step is not a Shape Locator step.
8812 The index of the shape is not valid, e.g. larger than the number of located
shapes.
8813 No results found from the Shape Locator tool. This can happen if the execution
of the Shape Locator tool failed for some reason.
8833 Timeout in the shape locating algorithm

Reference Manual Chapter 4
IVC-3D
©SICK AG • Advanced Industrial Sensors • www.sick.com • All rights reserved 141
Matching
Teach Rotation This tool is used to learn the features of an object in order to calculate its rotation in
relation to the learnt position. The calculation of rotation is based on a comparison be-
tween the patterns along concentric circles centered in the rotation point. Two different
sized circles over the object to be learned are compared to the circles over the matching
object. The first of the circles is used for the measurement itself unless there is a symme-
try problem in which case the other one is used.
Input Parameters
01 = Source bank The image bank with the object you want to teach the
device.
02 = X centre X coordinate of the concentric circles that hold the
height information about the object. This should be
also be the x coordinate of the center of rotation.
03 = Y centre Y coordinate of the concentric circles that hold the
height information about the object. This should be
also be the y coordinate of the center of rotation.
04 = Radius A The radius of the outer most circle.
05 = Radius B The radius of the inner most circle.
06 = Destination bank The image bank with your resulting teach object.
Returned Values
None

Chapter 4 Reference Manual
IVC-3D
142 ©SICK AG • Advanced Industrial Sensors • www.sick.com • All rights reserved
Matching
Match Rotation Match shape is a tool designed to find the rotation of a previously learnt object in a region
of interest. Simply set the parameters in the same fashion as in the ‘Teach Rotation’ tool
and specify where in the step program that step is located with the Rotation definition step parameter.
Input Parameters
01 = Source bank The image bank with the object you want to match
with your teach object.
02 =Rotation definition step The step in your program which you have defined
your reference object.
03 = X center The x coordinate of the center of rotation.
04 = Y center The y coordinate of the center of rotation.
05 = Destination bank The image bank where the result of the matching will
end up.
Returned Values
01 = Angle The resulting angle of the object in reference to the
object of your teach object.
02 = Similarity (%) A measurement of the resemblance of the height
information along the circles used.

Reference Manual Chapter 4
IVC-3D
©SICK AG • Advanced Industrial Sensors • www.sick.com • All rights reserved 143
Matching
Teach Pattern The Pattern tools are used to locate and inspect patterns, for example labels, keypads and
fiducial marks.
The functionality is divided into two parts:
1. The Teach Pattern tool teaches the camera a pattern in a reference image.
2. The Inspect Pattern tool locates and inspects the pattern in a live image.
This page describes the specifics for the Teach Pattern tool. For a general introduction and
detailed explanation of the Pattern functionality and its use, see the Inspect Pattern tool
description on page 145.
A ROI (Region of Interest) determines the area in which to teach the pattern. When the tool
executes, the taught pattern is stored in a data block in the camera’s working memory.
This data block will be used by the Inspect Pattern tool.
The tools Save Data Block to Flash and Load Data Block from Flash, see pages 197 and
196, can be used to store and retrieve the taught pattern in a stand-alone application.
Each pattern has a reference point that defines the position of the pattern. The default
position is the centroid of the ROI, but it can be set to any position in the reference image.
Default, centroid position of
the reference point (red cross).
The reference point can be moved, for example to a key feature on the object.
When the Inspect Pattern step refers to a Shape Locator step, the expected position of
the reference point will move with the located object’s pose.
The reference point is not visualized, but it can be done with drawing tools right after the
Teach step if needed. To find suitable coordinates manually, double-click the preview bank,
and then hover with the mouse pointer to find the coordinate of the desired feature point.
Input Parameters
01 = Source Bank The image bank that contains the reference pattern to be
taught.
02 = ROI Definition Step The reference to the region of interest that defines which
part of the source bank shall be taught.
03 = Data Block The data block number in the working memory, where the
reference pattern shall be stored.
04 = Ref. Point X Coordinate
The X coordinate of the pattern’s reference point.
05 = Ref. Point Y Coordinate
The Y coordinate of the pattern’s reference point.

Chapter 4 Reference Manual
IVC-3D
144 ©SICK AG • Advanced Industrial Sensors • www.sick.com • All rights reserved
Matching
Returned Values
None.
ERROR CODES
7300 Memory allocation problem
8835 Error in internal ROI handling
8838 ROI type error, please use ROI perimeter with filling “0 – Internal”
9010 General error for pattern inspection algorithm

Reference Manual Chapter 4
IVC-3D
©SICK AG • Advanced Industrial Sensors • www.sick.com • All rights reserved 145
Matching
Inspect Pattern The Pattern tools are used to locate and inspect patterns, for example labels, keypads and
fiducial marks:
Label inspection.
Keypad inspection. Fiducial mark positioning.
The functionality is divided into two parts:
1. The Teach Pattern tool teaches the camera a pattern in a reference image.
2. The Inspect Pattern tool locates and inspects the pattern in live images.
The pattern is searched for inside a search rectangle. The main results of the Inspect
Pattern tool are the found pattern’s position, angle and score. The reported coordinates
are the position of the pattern’s reference point. For an explanation of the reference point,
see the Teach Pattern tool description on page 143.
The pattern is defined by its teach ROI in the reference image.
In run mode, the pattern (green) is found
inside the search rectangle (blue).
Large pattern defects can either be found by setting the score threshold high, so that
defective patterns won’t be found, or by applying a pass/fail criterion to the score result.
Small defects can only be identified robustly by the score parameter if the pattern ROI is
small. For finding small defects in larger patterns, the difference image concept should be
used.
Difference Image
The tool has an optional visualization output called difference image, which is useful to find
defects that are too small to affect the score. They are found by post-processing of the
difference image, for example using Detail Extraction, Blob Finder or pixel counting.

Chapter 4 Reference Manual
IVC-3D
146 ©SICK AG • Advanced Industrial Sensors • www.sick.com • All rights reserved
Matching
Reference label.
Label with defect.
Difference image.
There are four options for the difference image:
1. Diff The absolute value of the intensity difference in each pixel. This option is prefer-
able if the pattern’s mean intensity is part of the inspection purpose.
2. Normalized diff Like the Diff mode, but compensated for changes in mean intensity and contrast.
This option is preferable if uniform contrast variations shall be disregarded. (It is
not effective to remove local illumination changes in the image.)
3. Diff with edge suppression
Like the Diff mode, but less sensitive to edge artifacts from the pattern.
4. Normalized diff with edge suppression
Like the Normalized diff mode, but less sensitive to edge artifacts from the pat-
tern.
To high-light small defects on a pattern visually, for example in an HMI or demo, the follow-
ing steps can be used:
1. Enable the parameter Create Pattern ROI
2. Generate the difference image with option Normalized diff with edge suppression
3. Locate the defects in the difference image by using Blob Finder. Optionally, pre-
process further with Erode and/or Stretch Gray
4. FOR each blob/defect, use the Blob Analyzer to create a blob ROI
5. Inside the FOR loop, draw the blob ROI by using Draw ROI
High-lighted defects for HMI display or demo purposes.
An advanced use of the difference image is to enhance features by suppressing back-
ground print, for example increasing robustness of a barcode application.

Reference Manual Chapter 4
IVC-3D
©SICK AG • Advanced Industrial Sensors • www.sick.com • All rights reserved 147
Matching
Referencing to a Shape Locator Pose
When inspecting several small patterns on a large object, for example keys on a keypad,
use the Shape Locator first and refer to it by the “Shape Locator step” parameter. This
way, small defects can be found, according to the rule of thumb: “Search big, inspect
small”.
In this mode:
• The Inspect Pattern search rectangle will automatically move with the Shape Loca-
tor pose and resize according to its scale.
• The position and angle of the found pattern relative to the Shape Locator pose will
be reported as “Delta X”, “Delta Y” and “Delta angle”. These results are useful for
example to determine that a pattern has the correct position on an object, rather
than in the image.
Technical Comparison with Shape Locator
The Pattern tools are based on a normalized cross-correlation (NCC) method, which is very
robust to variable contrast and ambient light conditions. The method is suitable for finding
any type of pattern and it allows inspection of small defects. It performs best at small
rotation tolerances, although full rotational search is supported at the cost of processing
time.
The Shape Locator tools are based on a geometric pattern matching method, which is the
best choice for locating large patterns (objects) in any rotation. This method is more toler-
ant to occlusion, noise and clutter than the normalized cross-correlation.
The following table provides a selection guide by describing several key aspects of the
different algorithms:
Pattern Shape Locator
Information used in search Intensity in all pixels Edges
Soft edges tolerance Very good Limited
Poor contrast tolerance Very good Limited
Ambient light robustness Very good Good
Occlusion tolerance Limited Very good
Noise and clutter tolerance Good
Very good
Distortion sensitivity Locate pattern: Medium
Difference image: High
Medium
Scale tolerance • 20% with affect on the
score
• 20% without affecting
the score when referring
to a Shape Locator
• 20%
Processing time Some variation Constant
Accuracy* (mean error) Sub-pixel (~0.05 pix)
Sub-degree (~0.1 deg)
Sub-pixel (~0.1 pix)
Sub-degree (~0.1 deg)
Multiple patterns/objects No Yes
Large search rectangle Slow Fast
Full rotation search Slow Fast
Difference image Yes No
* Accuracy testing procedure: Simple (Pac-Man) shape of radius 50 pixels as reference pattern. Search rectangle
size 400x400 pixels. Pose measurement on 100 images, where the reference pattern has been synthetically
moved and rotated to known poses. 3x3 smooth filter as pre-processing. Robustness parameter set to robust
(Pattern). Accuracy parameter set to high (Shape Locator). No image distortion or noise added.
Chapter 4 Reference Manual
IVC-3D
148 ©SICK AG • Advanced Industrial Sensors • www.sick.com • All rights reserved
Matching
Optimizing Robustness and Speed
The parameter settings have a large impact on the tool’s processing time.
The concept of image pyramids (down-sampling) is used to speed up the initial, coarse
search for the pattern. The number of pyramid levels (max 8) is chosen automatically by
the algorithm, based on a combination of the Robustness vs. Speed parameter and the
pattern ROI size. The refined, final search is typically performed on the original image.
Rules-of-thumb:
• Small patterns (relative to search rectangle) make the tool very slow in the robust
mode. Try to reduce the search rectangle size and use the normal mode
• Large patterns (relative to search rectangle) with solid features are well-suited for
the fast search mode
• Patterns that consist of fine details or lines, i.e. lack solid features, require the ro-
bust mode, otherwise the characteristic details may get lost in the down-sampling
• To optimize speed, only use the rotation tolerance interval that the application re-
quires. If the pattern is expected at different fixed angles, for example around 0
• 5 and 180 • 5 , it is faster and more robust to use the tool twice (once for
each interval) than to search • 180
The Robustness vs. Speed parameter has some effect on the accuracy of the pattern
pose, where the robust and normal modes are twice as accurate as the fast mode.
Input Parameters
01 = Source Bank The image bank where to search for the pattern.
02 = Data Block The data block number in the working memory, where the
reference pattern is stored.
03 = Shape Locator Step
Reference to a Shape Locator step, to enable automatic
pose adjustment of the search rectangle. The default value
-2 means that no Shape Locator pose is used.
04 = Shape Index A number that specifies which of the Shape Locator’s
found shapes to refer to. The default value 0 means the
first shape found by the Shape Locator.
05 = ROI X Coordinate The x coordinate of the search rectangle’s left edge.
06 = ROI Y Coordinate The y coordinate of the search rectangle’s top edge.
07 = ROI Width The width of the search rectangle.
08 = ROI Height The height of the search rectangle.
09 = Rotation Tolerance (degrees)
The greatest angle the search for a match should be
performed for. The value is symmetric, so that for example
the value 180 means ±180 degrees, i.e. full rotation.
10 = Rotation Offset (degrees)
Expected angle offset of the pattern in the live image
compared to the reference pattern. For example, if the
offset is 45 and the tolerance is 5, the pattern will be
searched for in the interval from 40 to 50 degrees.
11 = Min Score The minimum score in % that will result in a match. If the
best match is below the threshold, the pose and score will
still be returned, but the status flag and visualization will
indicate that no valid match was found.
12 = Robustness vs. Speed
The trade-off between robustness and speed: Robust,
Normal and Fast.
13 = Create Pattern ROI If enabled (true), the found pattern will generate a ROI in

Reference Manual Chapter 4
IVC-3D
©SICK AG • Advanced Industrial Sensors • www.sick.com • All rights reserved 149
Matching
the found position. Other steps can then refer to the
Inspect Pattern step as a ROI definition step.
14 = Visualization Defines how the result shall be visualized in the preview
and destination banks:
0 = Off
1 = ROI perimeter
2 = Diff (absolute diff image)
3 = Normalized diff (normalized absolute diff image)
4 = Diff with edge suppression (removes thin edges of 1
pixel width)
5 = Normalized diff with edge suppression
15 = Destination Bank Image bank in which the visualization is drawn.
Returned Values
01 = Search Status The status of the execution of the tool, see explanation list
below.
02 = Ref. Point X Coor-dinate
The X coordinate of the found pattern’s reference point.
03 = Ref. Point Y Coor-dinate
The Y coordinate of the found pattern’s reference point.
04 = Angle The angle of the found pattern relative to the reference
image, which is defined as 0 .
04 = Delta X Not using Shape Locator:
The pattern’s X movement relative to the reference image.
Using Shape Locator:
The pattern’s X movement relative to the reference image,
adjusted for the Shape Locator pose.
05 = Delta Y Not using Shape Locator:
The pattern’s Y movement relative to the reference image.
Using Shape Locator:
The pattern’s Y movement relative to the reference image,
adjusted for the Shape Locator pose.
06 = Delta Angle (de-grees)
Not using Shape Locator:
The pattern’s angle relative to the reference image.
Using Shape Locator:
The pattern’s angle relative to the reference image, ad-
justed for the Shape Locator pose.
07 = Score The similarity between the found pattern and the reference
pattern in %.
SEARCH STATUS
0 Pattern found
8980 Pattern found, but partly outside the image bank borders
8981 No matching pattern is found
9015 A pattern is found, but the score is below threshold

Chapter 4 Reference Manual
IVC-3D
150 ©SICK AG • Advanced Industrial Sensors • www.sick.com • All rights reserved
Matching
ERROR CODES
7300 Memory allocation problem
8983 Packing datablock failed
8984 Unpacking datablock failed
8985 No usable result from the Shape Locator step, please re-run the Shape Locator
step
8986 Shape index is too high, the Shape Locator step does not contain enough Num-
ber of Shapes
8994 Referenced step is of wrong type, please use a Shape Locator as reference or
use -1 for no reference
8995 General visualization error, please change visualization type
8997 No ROI data in the referenced step, please re-run the step or change the refer-
ence
8998 Cannot use filled ROI as input, please use a ROI perimeter
8999 General error for pattern inspection datablock, please re-teach a pattern
9010 General error for pattern inspection algorithm
9012 There is no reference pattern stored in the datablock, please re-teach a pattern
9013 The reference pattern is not configured correctly, please re-teach a pattern
9014 Could not allocate memory when generating ROI

Reference Manual Chapter 4
IVC-3D
©SICK AG • Advanced Industrial Sensors • www.sick.com • All rights reserved 151
Circular
4.7 Circular
External Perimeter This tool traces the external contour of an object and is similar to the tool 'Internal Perime-
ter'. Return values are the center of gravity coordinates of the area inside the contour.
First this tool scans the height values along a user defined line to find a point on the exter-
nal contour of the object. Beginning at the starting point of the line the first change in
height values that is greater than a defined threshold is indicated as a point on contour.
Note that the line must be drawn from left to right to achieve correct results. The tool then
traces pixels with the required change of height value starting at the point on the contour.
To make the algorithm more robust it is necessary to define a range of heights with an
upper and lower threshold.
Recommend steps to set up the input parameters:
1. Double-click the input field for Relative threshold and double-click the appearing
button. This opens an interactive window. Set the line in the image with the left mouse
button. Remember that the line must be drawn from left to right. Modify the Relative threshold with the slider on the left side until a point on the contour is found. This point
is marked with a cross. Close this window.
2. Double-click the input field for Min height or Max height threshold and double-click the
appearing button. This opens an interactive window. Modify the lower and upper
threshold with the slider on the left side until the external contour of the object is
traced completely. Control the traced contour in the image and make sure that the
traced contour is robust against small variations of the upper and lower thresholds.
The results of this tool can be used for the following tools:
Circular perimeter ROI
Circular analysis
Check circular shape
Input Parameters
01 = Source bank Image bank containing the image to be processed.
02 = Start point X X coordinate for start point of line.
03 = Start point Y Y coordinate for start point of line.
04 = End point X X coordinate for end point of line.
05 = End point Y Y coordinate for end point of line.
06 = Relative threshold (mm) Required absolute change of height value to find
contour points.
07 = Min height (mm) Minimum height value of pixels along the contour.
08 = Max height (mm) Maximum height value of pixels along the contour.
09 = Angular interval Resolution for re-sampling the contour in degrees.
10 = Destination bank Image bank in which to show the image with colored
contour and calculated centroid of the external
area.

Chapter 4 Reference Manual
IVC-3D
152 ©SICK AG • Advanced Industrial Sensors • www.sick.com • All rights reserved
Circular
Returned Values
01 = Error flag Flag = 0 external perimeter found
Flag = -1 no external perimeter found
02 = X center X coordinate of calculated center of gravity.
If no external perimeter was found
X center = 0.
03 = Y center Y coordinate of calculated center of gravity.
If no external perimeter was found
Y center = 0.
Example
The following example is for IVC-2D, but the principle is the same when using IVC-3D. The
only difference is that the threshold is a height value in millimeters instead of gray level
value.
Figure – Example of a successfully found external contour. Displayed is the line to find a contour point (yellow line), the found contour (yellow circle) and the center of mass (red cross).

Reference Manual Chapter 4
IVC-3D
©SICK AG • Advanced Industrial Sensors • www.sick.com • All rights reserved 153
Circular
Internal Perimeter This tool traces the internal contour of an object and is similar to the tool 'External Perime-
ter'. Return values are the center of gravity coordinates of the area inside the contour. The
operation can be described as follows: First, the tool scans the height values along a user
defined line to find a point on the internal contour of the object. Beginning at the starting
point of the line the first change in height values that is greater than a defined threshold is
indicated as a point on the contour. Note that the line must be drawn from left to right to
achieve correct results. Then the tool traces pixels with the required change of height value
starting at the found point on the contour. To make the algorithm more robust it is neces-
sary to define a range of heights with an upper and lower threshold.
Recommend steps to set up the input parameters:
1. Double-click the input field for Relative threshold and double-click the appearing
button. This opens an interactive window. Set the line in the image with the left mouse
button. Remember that the line must be drawn from left to right. Modify the Relative threshold with the slider on the left side until a point on the contour is found. This point
is marked with a cross. Close the window.
2. Double-click the input field for Min height or Max height threshold and double-click the
appearing button. This opens an interactive window. Modify the lower and upper
threshold with the slider on the left side until the internal contour of the object is
traced completely. Control the traced contour in the image and make sure that the
traced contour is robust against small variations of the upper and lower thresholds.
The results of this tool can be used for the following tools:
Circular perimeter ROI
Circular analysis
Check circular shape
Input Parameters
01 = Source bank Image bank containing the image to be processed.
02 = Start point X X coordinate for start point of line.
03 = Start point Y Y coordinate for start point of line.
04 = End point X X coordinate for end point of line.
05 = Endpoint Y Y coordinate for end point of line.
06 = Relative threshold (mm) Required absolute change of height value to find
contour points.
07 = Min height (mm) Minimum height value of pixels along the contour.
08 = Max height (mm) Maximum height value of pixels along the contour.
09 = Angular interval Resolution for re-sampling the contour in degrees.
10 = Destination bank Image bank in which to show the image with colored
contour and calculated centroid of the internal area.

Chapter 4 Reference Manual
IVC-3D
154 ©SICK AG • Advanced Industrial Sensors • www.sick.com • All rights reserved
Circular
Returned Values
01 = Error flag Flag = 0 internal perimeter found
Flag = -1 no internal perimeter found
02 = X center X coordinate of the calculated center of gravity.
If no internal perimeter was found
X center = 0.
03 = Y center Y coordinate of the calculated center of gravity.
If no internal perimeter was found
Y center = 0.
Example
The following example is for IVC-2D, but the principle is the same when using IVC-3D. The
only difference is that the threshold is a height value in millimeters instead of gray level
value.
Figure – Example of a successfully found internal contour. Displayed is the line to find a contour point (yellow line), the found contour (yellow circle) and the center of grav-ity (red cross).

Reference Manual Chapter 4
IVC-3D
©SICK AG • Advanced Industrial Sensors • www.sick.com • All rights reserved 155
Circular
Circular Perimeter ROI This tool generates a ROI with the shape of a processed external contour. Additionally it is
possible to cut out up to three different internal contours. This tool must have the result of
a previously performed ‘External perimeter’ tool to define the external shape of the ROI. To
cut out an internal contour from the ROI it is necessary to execute the tool ‘Internal Perime-
ter’ in a previous program step.
Input Parameters
01 = External perimeter step Refer to step number which executes the
‘External perimeter‘.tool
02 = Internal perimeter step A Refer to step number which executes the
‘Internal perimeter‘tool to perform the first
cut out.
03 = Internal perimeter step B Refer to step number which executes the
‘Internal perimeter‘tool to perform the
second cut out.
04 = Internal perimeter step C Refer to step number which executes the
‘Internal perimeter‘tool to perform the third
cut out.
05 = Destination bank Image bank in which to display the resulting
ROI.
Returned Values
01 = Error flag flag = 0 tool terminated correctly.
flag = -1 an error occurred.
Example
Figure – Example of a ROI generated by an external contour with cut outs of three different internal contours.

Chapter 4 Reference Manual
IVC-3D
156 ©SICK AG • Advanced Industrial Sensors • www.sick.com • All rights reserved
Circular
Circular Analysis This tool provides several measurements of circularly shaped contours. It is possible to
perform the measurement for one external and one internal contour at the same time or
for one external contour only. This tool needs the results of an ‘External perimeter’ tool and
/or an ‘Internal perimeter’. tool
Input Parameters
01 = External perimeter step Refer to program step number which
executes the ‘External perimeter‘.tool
02 = Internal perimeter step Refer to program step number which
executes the ‘Internal perimeter‘ tool.
Type 0 to use ‘Circular analysis‘ for meas-
urements of an external perimeter only.
03 = Angular interval Angular resolution of the measurements.
Range: 1 – 90 in units of 0.5 .
Note that a high resolution increases the
processing time considerably.
04 = Destination bank Image bank in which to show the results.
Returned Values
01 = Error flag flag = 0 tool terminated correctly.
flag = -1 an error occurred.
02 = Mean external diameter Averaged external diameter.
03 = Max external diameter Maximum found external diameter.
04 = Min external diameter Minimum found external diameter.
05 = Mean internal perimeter Averaged internal diameter.
06 = Max internal perimeter Maximum found internal diameter.
07 = Min internal perimeter Minimum found internal diameter.
08 = Ovalization Performed for external perimeter only.
Ratio between minimum external perimeter
and maximum external perimeter. Perfect
circle will yield 1.
09 = Concentricity Distance between external and internal
center of gravity in pixels.
10 = Mean difference radius Distance between internal and external
contour.

Reference Manual Chapter 4
IVC-3D
©SICK AG • Advanced Industrial Sensors • www.sick.com • All rights reserved 157
Circular
Check Circular Surface This tool performs a homogeneity check of height values inside a circularly shaped ROI.
The tool works similarly to 'Count Deviating Points' in the Measure category. It is possible
to select the height values of pixels that should be considered for the homogeneity check.
Only pixels with height values between an upper and a lower threshold are evaluated.
The ROI must be generated by the 'Circular Perimeter ROI' tool. Note that only ROIs gener-
ated by this tool can be used.
Double-click on the input field for Sensitivity and double-click again on the appearing
button. This opens an interactive window. Set the minimum required difference in height
values to detect a pixel as surface defect. Control the results in the image.
Double-click on the input fields for Min height/Max height and double-click again on the
appearing button. This opens an interactive window. Set region of allowed height values.
Control the results in the image.
Input Parameters
01 = Source bank Image bank containing the image to be
processed.
02 = Perimeter ROI definition step Refer to step number which executes the
'Circular perimeter ROI' tool. This ROI
defines the region where the surface check
is performed. Note that only ROIs gener-
ated by this tool can be used.
03 = Min height (mm) Minimum required height value for a pixel to
be considered by the check.
04 = Max height (mm) Maximum required height value for a pixel
to be considered by the check.
05 = Sensitivity Minimum required difference in height
values to detect a pixel as surface defect.
06 = Grid distance Dimension of the matrix in pixels. It is
recommended to use uneven values only. If
you enter an even value x the dimension is
set to x+1.
07 = Destination bank Image bank in which to display the image
and any found defects as colored pixels.
Returned Values
01 = Error flag Flag = 0 tool terminated correctly.
Flag = -1 an error occurred.
02 = Found pixels Total number of detected pixels inside ROI.

Chapter 4 Reference Manual
IVC-3D
158 ©SICK AG • Advanced Industrial Sensors • www.sick.com • All rights reserved
Circular
Check Circular Shape This tool checks the shape of a circular contour for defects. The contour for the shape
check must be generated by either the ‘External Perimeter’ or ‘Internal Perimeter’ tool. Due
to the fact that the tool is designed for circular shaped contours the considered contour
should have a circular shape as well.
Defects are classified in two different categories: spikes and dents (see the figure below).
It is possible to detect either spikes or dents or both of them. Basically the algorithm
calculates for a contour pixel the distance from the center of gravity and compares this
result with the distance to the center of gravity of other contour pixels. Input parameter
Sensitivity defines the accepted variation in distance. Average pixels are the number of
pixels whose distances are averaged for the comparison.
The evaluation starts at the point on the contour which is defined in the tool External or
Internal perimeter. Beginning at this point the algorithm follows the contour counterclock-
wise until the first defect is found. If a defect is detected the tool terminates and returns
the coordinates of the first found defect.
Figure – Example for the two categories of defects on an external circular shape: a) category dent, b) category spike.
Input Parameters
01 = Perimeter definition step Select the desired contour for the shape check.
Refer to step program which executes either
Internal perimeter or External perimeter.
02 = Type Set which shape defects that will be detected.
-1 detect dents only
1 detect spikes only
0 detect both.
03 = Sensitivity Sensitivity to detect shape defects.
Range: 0 .. 100.
0 is most sensitive to defects.
04 = Scan interval The interval between scanned pixels for compari-
son.
05 = Average pixels Number of pixels to calculate mean distance from
center of gravity.
06 = Destination bank Image bank to display image and the point with
the first defect.
Returned Values
01 = Transition flag 0 at least one defect was found
-1 no defect was found
02 = X transition X coordinate of the first found defect.
03 = Y transition Y coordinate of the first found defect.
a) b)

Reference Manual Chapter 4
IVC-3D
©SICK AG • Advanced Industrial Sensors • www.sick.com • All rights reserved 159
Calculation
4.8 Calculation
Mathematical Operation This tool offers basic mathematical operations of two input parameters.
Note that division by 0 will return the value 2147483647.
Input Parameters
01 = Variable A First value for operation.
02 = Variable B Second value for operation.
03 = Mathematical operation Operator
Basic mathematical operations
or Boolean operation.
Double click on input box and select one of follow-
ing operation:
= : writes parameter A in the specified table row
+, - , ×, / (basic mathematical operations)
OR Max Min Mean Absolute value of difference unsigned subtraction And
Square root: the square root of variable A.
Variable B can be used for setting the num-
ber of decimals in the result:
-1 Do not round off the result
0 - 9 Number of decimals in the result
04 = Table index Row in table where the result should be written.
Returned Values
01 = Operation result Result

Chapter 4 Reference Manual
IVC-3D
160 ©SICK AG • Advanced Industrial Sensors • www.sick.com • All rights reserved
Calculation
Mathematical Expression This tool performs a calculation based on the mathematical expression given as input
parameter. The evaluation is performed in the same way as when a mathematical expres-
sion is written directly in a tool’s parameter field. It can be used to enhance readability of
the step program by commenting the calculation in a meaningful way.
To maintain good readability when multiple mathematical expression steps are used after
one another, it is suggested to group them together by using Edit Increase tabulation.
Input Parameters
01=Expression Mathematical expression. Always starts with a “=”, for example
=2*(S5R1-S4R1).
Returned Values
01=Result The result of the evaluated expression.
Example
Result values are sent from the camera to the PC by the tool ‘Display’. Instead of writing an
expression in each of the tool’s parameter fields, it can be useful to refer to previous
mathematical expression steps that are clearly commented.

Reference Manual Chapter 4
IVC-3D
©SICK AG • Advanced Industrial Sensors • www.sick.com • All rights reserved 161
Calculation
In Range This tool checks whether or not a value is within a defined range. Usually the value is the
result from a previously performed program step. To set the range use Min value allowed
for the lower bound and Max value allowed for the upper bound. If the value has to be
exact the value, lower and upper bound values should be identical.
If you want to continue your step program on a certain step depending on the comparison
result (conditional jump) you could use the ‘If in range goto’ tool from the Program cate-
gory.
Input Parameters
01 = Value Value to be compared if it’s within the range or not.
02 = Min value allowed Lower bound of the range
02 = Max value allowed Upper bound of the range
Returned Values
01 = Comparison result Return value = 1 if the Reference value is within the
range
Return value = 0 if the Reference value is out of the
range

Chapter 4 Reference Manual
IVC-3D
162 ©SICK AG • Advanced Industrial Sensors • www.sick.com • All rights reserved
Calculation
Polar to Cartesian Coordinates This tool calculates the Cartesian coordinates for any point on a circumference of a given
circle. Typically the input parameters for the coordinates of the circle center will come as a
result from a previously performed program step. To define a point on the circumference
you need values for the radius and an angle. Note that the direction of rotation is for
positive and negative input values always counterclockwise in respect to the x-axes.
The circle is displayed in the preview. The size and position of the circle can also be set in the preview using the left mouse button. Double-clicking the preview image opens a larger image in which the circle can be set with higher accuracy.
This function is useful if you want to define a specific point on the circumference of a circle.
In particular if the center of the circle is calculated from a previously performed program
step such as the ‘Fit Circle’ tool or a tool from the Measurement or Edge category.
Input Parameters
01 = X center X coordinate of the center of the circle.
02 = Y center Like above but for Y direction.
03 = Radius Radius
04 = Angle Radius. Direction of rotation is counter clockwise
independently if the input value is positive or negative.
Returned Values
01 = X coordinate Cartesian coordinate in X-direction
02 = Y coordinate Cartesian coordinate in Y-direction
Example
α X-axes
Returned Values:
Cartesian coordinates:
(X1,Y1)
Input Parameters:
Center of circle: (X,Y)
Angle α and radius
(X,Y)
Reference Manual Chapter 4
IVC-3D
©SICK AG • Advanced Industrial Sensors • www.sick.com • All rights reserved 163
Calculation
Fit Circle This tool fits a circle to four input coordinates and outputs the coordinates of the center of
the fitted circle and the radius in pixel units.
Note that you must enter all four coordinates; if you just type three coordinates the fourth
coordinates is set to the default values (X4=0, Y4=0).
If the circumference is touching the border of the FOV or if parts of the circle are outside
the FOV, the circle is not plotted in the destination bank. The calculation results for the
center of the circle and the radius are calculated anyway.
The result of the error flag may be used to check if the tool was executed correctly during
run mode.
Input Parameters
01 = Source bank Number of the source bank. In this case just to copy
02 = X1 X coordinate of the first point
03 = Y1 Y coordinate of the first point
04 = X2 X coordinate of the second point
05 = Y2 Y coordinate of the second point
06 = X3 X coordinate of the third point
07 = Y3 Y coordinate of the third point
08 = X4 X coordinate of the fourth point
09 = Y4 Y coordinate of the fourth point
10 = Destination bank Image bank in which to plot the fitted circle as an overlay on
the copied image from the source bank. Only executed at
debug mode.
Returned Values
01 = X center X coordinate of the circle center
02 = Y center Y coordinate of the circle center
03 = Radius Circle radius in pixels.
Error Messages
Error 2 Input parameter values are "impossible" (e.g. negative or
out of field of view)
Error 114 At least two points of the four input points are identical
Error 140 At least three points of the four input points are on the same
line

Chapter 4 Reference Manual
IVC-3D
164 ©SICK AG • Advanced Industrial Sensors • www.sick.com • All rights reserved
Calculation
Fit Ellipse This tool fits an ellipse to six input coordinates and outputs the coordinates of the center of
the fitted ellipse and the minor and major axes radiuses in pixel units.
Note that you must enter all six coordinates; if you just type five coordinates the sixth
coordinates are set to the default values (X6=0, Y6=0).
The result of an error flag may be used to check if the tool was executed correctly during
the run modus.
Input Parameters
01 = Source bank Number of the source bank. In this case just to copy the
source bank into the destination bank.
02 = X1 X coordinate of the first point
03 = Y1 Y coordinate of the first point
04 = X2 X coordinate of the second point
05 = Y2 Y coordinate of the second point
06 = X3 X coordinate of the third point
07 = Y3 Y coordinate of the third point
08 = X4 X coordinate of the fourth point
09 = Y4 Y coordinate of the fourth point
10 = X5 X coordinate of the fifth point
11 = Y5 Y coordinate of the fifth point
12 = X6 X coordinate of the sixth point
13 = Y6 Y coordinate of the sixth point
14 = Destination bank Image bank in which to plot the fitted circle as an overlay
on the copied image from the source bank.
Returned Values
01 = X center X coordinate of the ellipse center.
02 = Y center Y coordinate of the ellipse center.
03 = Minor diameter Radius of the minor axes.
04 = Major diameter Radius of the major axes.

Reference Manual Chapter 4
IVC-3D
©SICK AG • Advanced Industrial Sensors • www.sick.com • All rights reserved 165
Calculation
Sort This tool sorts a number of values or groups of values in the table in ascending or de-
scending order. When groups of values are sorted, the sorting is based on a certain ele-
ment in each group.
Note. Only table values are sorted, whereas table descriptions remain unsorted.
Input Parameters
01 = Table index Start index in the table, i.e. the position of the first
value of the first group
02 = Number of groups Number of groups stored in the table
03 = Elements per group Number of table values per group
04 = Element to order The element in each group by which the groups
should be sorted.
05 = Sort order Select the sorting order:
0= ascending order
1= descending order
Returned Values
None.
Example
A blob analysis tool found three blobs and wrote the result to the table, starting at row 5.
For each blob, the tool wrote three values; x coordinate of the centroid, y coordinate of the
centroid and area.
Now we would like to sort the blobs according to their size (area) with the largest blob first,
that is sort the groups in descending order by the third element in each group.
Tool settings: Input parameter Value
01=Table index 5
02=Number of groups 3
03=Elements per group 3
04=Element to order 3
05=Sort order 1
Table before sort Table after sort
Index Value Index Value
X of blob 1 5 410 5 120
Y of blob 1 6 230 6 145
Area of blob 1 7 80 7 210
X of blob 2 8 120 8 304
Y of blob 2 9 145 9 190
Area of blob 2 10 210 10 135
X of blob 3 11 304 11 410
Y of blob 3 12 190 12 230
Area of blob 3 13 135 13 80

Chapter 4 Reference Manual
IVC-3D
166 ©SICK AG • Advanced Industrial Sensors • www.sick.com • All rights reserved
Calculation
Update Statistics This tool enables statistical operations on up to ten selected values. Typically these values
are results of previously performed program steps.
The statistical results are calculated for each value separately and in the following order:
1. Minimum out of all monitored values
2. Maximum out of all monitored values
3. Average value
4. Standard deviation
5. Number of collected values for the statistical operations on that specific value
The results are placed in the table and are ordered in blocks. The first block in the table
contains all 5 results for the first values followed by the second block for the 5 results for
the second value and so on. You need to select the start index on the table for the first
value of the first block. Please note that you need 5 rows for each monitored value in the
table for the results. Thus, the number of rows you need from the starting index is equal to:
Number of monitored values* 5.
The result parameter Counter starts at zero at program start or after a ‘Reset Statistics’
tool is executed, and is increased by 1 each time this step is performed (=number of
repetitions). By the help of this parameter it is easy to update the statistic if the desired
number of repetitions have been performed, simply by using this result in an ‘If then GoTo’
tool from the Program category.
If you would like to restart the statistical evaluation and delete the old data it is essential to
execute the ‘Reset Statistics’ tool before the new evaluation.
This tool is useful for teaching results from program steps that slightly change or to control
the process and stability of the results.
Input Parameters
01 = Number of variables Number of different values for the statistical evaluation.
02 = Table index Starting index of table for the statistical result values. The
first value (=Minimum) from the first block starts at that
row.
03 = Variable A
…
12 = Variable J
Value for statistical evaluation.
Returned Values
01 = Counter Number of executions since program start or last ’Reset
statistics’ tool.

Reference Manual Chapter 4
IVC-3D
©SICK AG • Advanced Industrial Sensors • www.sick.com • All rights reserved 167
Calculation
Reset Statistics This tool resets a previously performed statistical evaluation executed by the ‘Update
statistics’ tool.
It sets the values in the rows of the table that the ‘Update statistics’ tool refers to, to
default values, which are not zero except for the average values. Furthermore it sets the
result value Counter of the ‘Update statistics’ tool to zero.
Make sure that this tool is not performed during your statistical evaluation loop since this
constantly resets your statistics.
Input Parameters
01 = Step with statistics to reset
Select the update statistics tool in your step program
which you would like to reset.
Returned Values
None

Chapter 4 Reference Manual
IVC-3D
168 ©SICK AG • Advanced Industrial Sensors • www.sick.com • All rights reserved
Calculation
Fit Circle to Profile This tool finds the circle that fits best to a selected part of a profile. The part of the profile
to which to fit the circle is specified by a region of interest. If the region of interest does not
contain at least 8 pixels with valid height data, an error message will be returned.
The Min radius and Max radius parameters are used to force the resulting circle to have a
radius that is within a certain interval. If these values are set to zero, the radius will not be
bound to any interval.
If necessary, an Outlier distance can be used for removing noise in the profile. In this case
a normal circle fit is carried out first, resulting in a reference circle. The points that deviate
more than Outlier distance from the reference circle are then discarded, and a new circle
fit is made with the remaining points.
r1
r
These pointsare ignored
Referencecircle
First curve fit Discarding points outside r1 ± outlier distance
Second curve fit
When specifying an Outlier Distance, points that deviate too much from the fitted curve are ignored and a new curve is then fitted.
If Outlier distance is set to zero, every point on the profile will be included when fitting the
circle. Note that this tool usually runs faster when Outlier distance is set to 0.
Optionally, the curve can be visualized by choosing a Destination Bank.
Input Parameters
01 = Source bank Image bank that contains the profile to which a
circle is fitted.
02 = ROI definition step The program step where the ROI was defined.
03 = Min radius (mm) Minimum radius to be found.
04 = Max radius (mm) Maximum radius to be found.
05 = Outlier distance (mm) The maximum distance between the profile and
the fitted circle.
06 = Destination Bank Image bank in which to draw the resulting circle.
-1 suppresses visualization.

Reference Manual Chapter 4
IVC-3D
©SICK AG • Advanced Industrial Sensors • www.sick.com • All rights reserved 169
Calculation
Returned Values
01 = X center (mm) Calibrated x coordinate of the circle center.
02 = Z center (mm) Calibrated y coordinate of the circle center.
03 = Radius (mm) Circle radius.
Error Messages
Err. = 7704 The region of interest has parts that are outside
the source bank.
Err. = 7801 The region of interest does not contain enough
valid data to perform a fitting.
Err. = 7808 A fitting cannot be carried out since the height
data within the ROI is singular.

Chapter 4 Reference Manual
IVC-3D
170 ©SICK AG • Advanced Industrial Sensors • www.sick.com • All rights reserved
Calculation
Fit Curve This tool finds the straight line or a second-degree curve that fits best to a selected part of
a profile. The part of the profile to which the curve is fitted is specified by a region of
interest.
The region of interest must contain a sufficient number of points with valid height data,
since using too few points may produce unreliable results. The lowest acceptable number
of valid height data points is specified by the Min valid points parameter.
If necessary, an Outlier distance can be used for removing noise in the profile. In this case,
a normal curve fit is carried out first, resulting in a reference curve. The points that deviate
more than Outlier distance from the reference curve are then discarded, and a new curve
fit is made with the remaining points.
These pointsare ignored
Referencecurve
First curve fit Discarding points outside z ± outlier distance
Second curve fit
Outlier distance
When specifying an Outlier Distance, points that deviate too much from the fitted curve are ignored and a new curve is then fitted.
If Outlier distance is set to zero, every point on the profile will be included when fitting the
curve. Note that this tool usually runs faster when Outlier distance is set to 0.
The resulting curve can be used in subsequent steps by using the step number of this step
as input parameter (Curve definition step).
Additionally, the coefficients of the curve can be stored in the table starting at row Table index. The curve’s equation is given in the following form (in millimeters):
z = a0 + a
1·x + a
2·x
2
and each coefficient is stored sequentially in the table:
a0 Table index
a1 Table index + 1
a2 Table index + 2 (only if a second-degree curve was fit)
The equation for the curve is based on calibrated coordinates, that is both x and z in the
equation has the unit millimeters.

Reference Manual Chapter 4
IVC-3D
©SICK AG • Advanced Industrial Sensors • www.sick.com • All rights reserved 171
Calculation
Input Parameters
01 = Source bank Image bank that contains the profile to which the
curve is fitted.
02 = ROI definition step The program step where the ROI was defined.
03 = Curve type Constant height line
Straight line parallel with the x-axis.
Line
Straight line.
Parabola
Second-degree polynomial curve.
04 = Min valid points The lowest acceptable number of valid height data
points within the ROI
05 = Outlier distance (mm) The maximum distance between the profile and the
curve.
06 = Table index Position in the table where the curve’s coefficients
are written. If set to -1 the coordinates will not be
stored in table.
07 = Destination bank Image bank in which to draw the resulting curve.
-1 suppresses visualization.
Error Messages
Err. = 7704 The region of interest has parts that are outside
the source bank.
Err. = 7801 The region of interest does not contain enough
valid data to perform a fitting.
Err. = 7808 A fitting cannot be carried out since the height
data within the ROI is singular.

Chapter 4 Reference Manual
IVC-3D
172 ©SICK AG • Advanced Industrial Sensors • www.sick.com • All rights reserved
Calculation
Fit Surface This tool finds the surface that best fits a selected part of a 3D image. Typically, this tool is
used for defining the zero-level surface for volume calculations or deviation measurements.
The part of the 3D image to which the surface is fitted is specified by the region of interest
in ROI definition step. If the region of interest does not contain enough pixels with valid
height data, an error message will be returned.
There are four types of surfaces that can be fitted to the 3D image:
• Constant height surface fits a plane that is parallel with the xy-plane
• Plane surface fits an ordinary plane surface
• Second degree surface can be fitted to slightly more complicated shapes
• Background plane – this automatically fits a planar surface to the ‘Background
ration’ lower pixels
The tool runs significantly faster when fitting a plane compared with a second-degree
surface.
Constant height surface Plane surface Second degree surface If necessary, an Outlier distance can be used for removing noise in the 3D image. In this
case, a standard surface fit is carried out first, resulting in a reference surface. The points
in the 3D image that deviate more than Outlier distance from the reference surface are
then discarded, and a new surface fit is made with the remaining points.
If Outlier distance is set to zero, every point in the 3D image will be included when fitting
the surface. Note that this tool usually runs faster when Outlier distance is set to 0.
The resulting surface can be used in subsequent steps by using the step number of this
step as input parameter (Surface definition step).
The Output parameter makes it possible to draw the fitted surface in the ROI or in the full
image. It also makes it possible to draw a compensated image in either one. A surface
compensated image is an image where the fitted surface has been subtracted from the
original data to generate a ‘flattened’ image. This is very useful as a pre-processing to e.g.
the Blob Finder. Note that when output is set to one of the compensating options (Com-
pensated in ROI or Compensated in full image) the surface is always a constant height
surface. This surface refers to the compensated image rather than the original one.
The fitted surface model is internally stored and the user does not need to consider how it
is represented. However, in some applications it may be interesting to use the fitted coeffi-
cients to e.g. compute a normal vector to a fitted plane. For that purpose the tool returns
the surface coefficients as results. To obtain the height value Z of a surface at a point (X,
Y) the following formula is used:
Z = Ao + X * Ax + Y * Ay +X^2 * Axx + X * Y * Axy + Y^2 * Ayy
Input Parameters
01 = Source bank Image bank containing the 3D image to which the
surface is fitted.
02 = ROI definition step The program step where the ROI was defined.
Advanced:

Reference Manual Chapter 4
IVC-3D
©SICK AG • Advanced Industrial Sensors • www.sick.com • All rights reserved 173
Calculation
03 = Surface type Constant height surface Plane surface parallel to the xy-plane
Plane surface First order ploynomial surface
Second degree surface
Second degree surface
04 = Outlier distance (mm) The maximum distance between a point in the 3D
image and the surface.
05 = Destination bank Image bank in which to draw the resulting surface.
-1 suppresses visualization.
06 = Background ration (0-100%)
A rough estimate of how much of the image
consist of background.
07 = Output Determines what to put in the destination bank.
See description above.
08 = Fill missing data When enabled, missing data will be replaced with
the value of the fitted surface at that point.
Returned Values 01 = Ao (mm) Surface coefficients
02 = Ax (mm/pixel) Surface coefficients
03 = Ay (mm/pixel) Surface coefficients
04 = Axx (mm2/pixel2) Surface coefficients
05 = Axy (mm2/pixel2) Surface coefficients
06 = Ayy (mm2/pixel2) Surface coefficients
Error Messages
Err. = 7801 The region of interest does not contain enough valid
data to perform a fitting.
Err. = 7808 A fitting cannot be carried out since the height data
within the ROI is singular.
Err. = 7811 The ROI is too small. It must be at least 2 x 2 pixels.
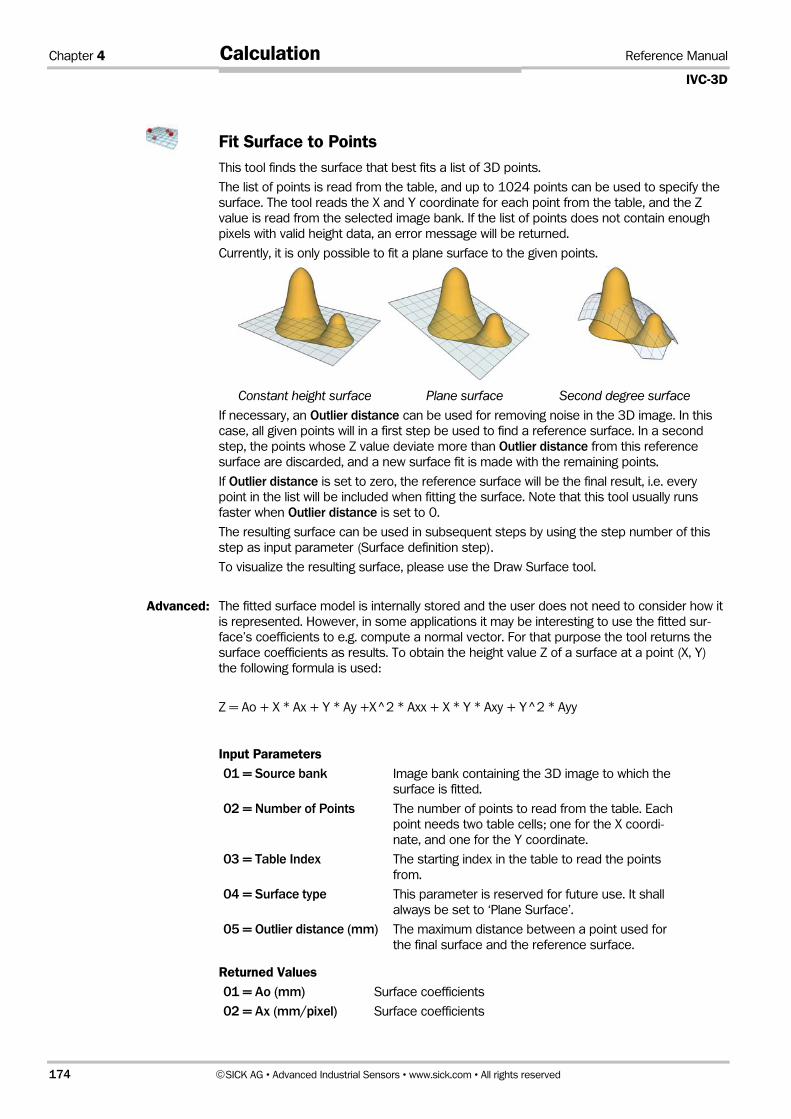
Chapter 4 Reference Manual
IVC-3D
174 ©SICK AG • Advanced Industrial Sensors • www.sick.com • All rights reserved
Calculation
Fit Surface to Points This tool finds the surface that best fits a list of 3D points.
The list of points is read from the table, and up to 1024 points can be used to specify the
surface. The tool reads the X and Y coordinate for each point from the table, and the Z
value is read from the selected image bank. If the list of points does not contain enough
pixels with valid height data, an error message will be returned.
Currently, it is only possible to fit a plane surface to the given points.
Constant height surface Plane surface Second degree surface If necessary, an Outlier distance can be used for removing noise in the 3D image. In this
case, all given points will in a first step be used to find a reference surface. In a second
step, the points whose Z value deviate more than Outlier distance from this reference
surface are discarded, and a new surface fit is made with the remaining points.
If Outlier distance is set to zero, the reference surface will be the final result, i.e. every
point in the list will be included when fitting the surface. Note that this tool usually runs
faster when Outlier distance is set to 0.
The resulting surface can be used in subsequent steps by using the step number of this
step as input parameter (Surface definition step).
To visualize the resulting surface, please use the Draw Surface tool.
The fitted surface model is internally stored and the user does not need to consider how it
is represented. However, in some applications it may be interesting to use the fitted sur-
face’s coefficients to e.g. compute a normal vector. For that purpose the tool returns the
surface coefficients as results. To obtain the height value Z of a surface at a point (X, Y)
the following formula is used:
Z = Ao + X * Ax + Y * Ay +X^2 * Axx + X * Y * Axy + Y^2 * Ayy
Input Parameters
01 = Source bank Image bank containing the 3D image to which the
surface is fitted.
02 = Number of Points The number of points to read from the table. Each
point needs two table cells; one for the X coordi-
nate, and one for the Y coordinate.
03 = Table Index The starting index in the table to read the points
from.
04 = Surface type This parameter is reserved for future use. It shall
always be set to ‘Plane Surface’.
05 = Outlier distance (mm) The maximum distance between a point used for
the final surface and the reference surface.
Returned Values
01 = Ao (mm) Surface coefficients
02 = Ax (mm/pixel) Surface coefficients
Advanced:

Reference Manual Chapter 4
IVC-3D
©SICK AG • Advanced Industrial Sensors • www.sick.com • All rights reserved 175
Calculation
03 = Ay (mm/pixel) Surface coefficients
04 = Axx (mm2/pixel2) Surface coefficients
05 = Axy (mm2/pixel2) Surface coefficients
06 = Ayy (mm2/pixel2) Surface coefficients
Error Messages Err. = 7403 Grab setup must be executed before this step is
executed.
Err. = 7801 The list of points does not contain enough valid data
to perform a fitting. The algorithm requires at least
three valid points.
Err. = 7808 The calculation resulted in an attempt to divide by
zero. This can happen if the points are too close to
each other.

Chapter 4 Reference Manual
IVC-3D
176 ©SICK AG • Advanced Industrial Sensors • www.sick.com • All rights reserved
Calculation
Coordinate Alignment The Coordinate alignment tool is used for aligning the IVC-3D’s coordinate system to an
external coordinate system (world coordinates).
The result from the tool is a transform, which is stored in a data block in the IVC-3D, and
can be used later by the 'Get calibrated point' tool to get aligned measurement values.
This tool is used through an interactive setup. Therefore, the program step can be re-
moved from or disabled in the program after creating the transform.
Input Parameters
None.
This tool is used through the interactive setup, which is opened by double-clicking the
Setup button. See “Coordinate Alignment” on page 262 for more information on the
interactive setup.
Returned Values
None.
The Emulator does
not emulate this
tool. See section
Handling the
Emulator for more
information.

Reference Manual Chapter 4
IVC-3D
©SICK AG • Advanced Industrial Sensors • www.sick.com • All rights reserved 177
Calculation
Get Calibrated Point This tool calculates the calibrated coordinates X, Y, Z (in mm) for a pixel in either a profile
or a 3D image. The height value is acquired from the image in the specified Source bank.
The tool has a built-in filter that can be used when calculating the height value (Z coordi-
nate) in noisy images. The parameter Filter type is used for setting the filter to use either
the mean or the median value of a matrix of 3x3 pixels (1x3 for profiles) or 5x5 pixels (1x5
for profiles) surrounding the specified pixel.
If the coordinates should be aligned with an external coordinate system (world coordi-
nates), the Transform data block parameter specifies which transform that should be
used for the alignment. This transform is created using the interactive setup for the 'Coor-
dinate Alignment' tool. Setting the parameter to -1 means that the coordinates should not
be aligned.
When a profile is used as source image, the parameter Y pixel is ignored. The returned
calibrated y coordinate will always be 0 for a profile.
When a 3D image is used as source image, the tool requires that the y coordinate sam-
pling distance is set, by using the 'Grab setup' tool. This sampling distance can be set
either manually or indirectly by an external encoder device. See the documentation for the
'Grab setup' tool for more information.
If this tool is applied on a profile that was extracted from a 3D image with the 'Extract
Profile' tool, the returned coordinates are relative to the profile and not the original 3D
image.
Input Parameters
01 = Source bank The image bank containing a 3D image or profile that
contains the value of the point.
02 = X pixel The x coordinate of the pixel.
03 = Y pixel The y coordinate of the pixel.
04 = Filter Type Specifies how to calculate the height value (z coordi-
nate)
No filter The height value for the pixel Mean 3 The mean value of 3x3 pixels (3x1
for profiles)
Median 3 The median value of 3x3 pixels (3x1
for profiles)
Mean 5 The mean value of 5x5 pixels (5x1
for profiles)
Median 5 The median value of 5x5 pixels (5x1
for profiles)
05 = Transform data block
The number of the data block in which the transform
to use is stored.
-1 means that the coordinates should not be aligned
to world coordinates.
Returned Values
01 = Calibrated X (mm) Calibrated X coordinate in millimeters
02 = Calibrated Y (mm) Calibrated Y coordinate in millimeters
03 = Calibrated Z (mm) Calibrated Z coordinate in millimeters

Chapter 4 Reference Manual
IVC-3D
178 ©SICK AG • Advanced Industrial Sensors • www.sick.com • All rights reserved
Program
4.9 Program
Goto This tool jumps to the selected step in the step program. The program continues execution
from that point.
Input Parameters
01 = Goto step Step number where the program continues.
If selected step was deleted during the setup of the
program this row is marked red and the previously
set value changes to –1.
Returned Values
None

Reference Manual Chapter 4
IVC-3D
©SICK AG • Advanced Industrial Sensors • www.sick.com • All rights reserved 179
Program
If Then Goto This tool jumps to a defined program step if the condition in Control expression is true
(Conditional jump).
Input Parameters
01 = Control expression Condition.
Definition: 0 = false.
For example = (v2 > v5).
02 = Goto step Step number where the program continues
if condition is true.
Returned Values
None

Chapter 4 Reference Manual
IVC-3D
180 ©SICK AG • Advanced Industrial Sensors • www.sick.com • All rights reserved
Program
If Error Goto This tool handles upcoming errors in program steps. It is recommended to handle poten-
tially occurring errors in critical program blocks with this tool. This avoids that the program
stops due to an error.
If a program step returns an error the program either skips this step and continues with
the following step or jumps to a defined program step.
Please select the Goto step carefully to avoid accidentally creating an infinite loop.
Return parameters are the step number where the last error occurred and the error code.
Input Parameters
01 = Goto step Step number where to continue in case of an error.
02 = Continue to next step? False The program continues at step number
given by Goto step.
True The step with error is skipped and the
program continues with the next step. In
this case parameter Goto step is ig-
nored.
Returned Values
01 = Last step with error Step number which evoked the last error.
02 = Last error code Error code of last error.

Reference Manual Chapter 4
IVC-3D
©SICK AG • Advanced Industrial Sensors • www.sick.com • All rights reserved 181
Program
If in Range Goto This tool checks if a value is inside a certain range. Depending on the setting of the Goto if parameter the tool jumps to a defined step number if the value is within or outside the
range.
Input Parameters
01 = Value to be compared Value to be checked.
02 = Min value allowed Lower range.
03 = Max value allowed Upper range.
04 = Goto if Condition for jump.
In range perform jump if value in
range.
Out of range perform jump if value
out of range.
05 = Goto step Step number to which the program will
jump and continue if value in range.
Returned Values
01 = Comparison result 1 if condition in Goto if is true.
0 if condition in Goto if is false.

Chapter 4 Reference Manual
IVC-3D
182 ©SICK AG • Advanced Industrial Sensors • www.sick.com • All rights reserved
Program
If All in Range Goto This tool is similar to the ‘If in range goto’ tool. It checks if up to four values are inside their
individual range or not. If all values are inside their ranges the tool jumps to a defined step
number.
Input Parameters
01 = Value A First value to be checked.
02 = A min value Lower range first value.
03 = A max value Upper range first value.
04 = Value B Second value to be checked.
05 = B min value Lower range second value.
06 = B max value Upper range second value.
07 = Value C Third value to be checked.
08 = C min value Lower range third value.
09 = C max value Upper range third value.
10 = Value D Fourth value to be checked.
11 = D min value Lower range fourth value.
12 = D max value Upper range fourth value.
13 = If all in range goto step Step number to which the program jumps
and continues at if all values are in range.
Returned Values
01 = Comparison result 1 all values are in range.
0 at least one value is out of range.

Reference Manual Chapter 4
IVC-3D
©SICK AG • Advanced Industrial Sensors • www.sick.com • All rights reserved 183
Program
If The 'If' tool is used together with an 'End' tool and optionally an 'Else' tool for enclosing
programs steps that should only be executed if a certain condition is fulfilled:
If the condition in the Control expression is true all program steps are executed be-
tween this tool and the tool referred to by the ELSE or END step parameter.
If the tool referred to is an 'Else' tool, the steps following that tool are skipped and the
program continues with the program steps following the 'End' tool referred to by the
'Else' step.
If the condition in the Control expression is false the following program steps are
skipped and the program continues with the program steps following the tool referred
to by the ELSE or END step parameter.
A construction with an 'If' tool must always end with an 'End' tool.
Input Parameters
01 = Control expression Definition: 0 = false.
Boolean operations and mathematical expres-
sions are allowed, for example = (v2 > v5)
02 = ELSE or END step Step number that refers to the corresponding
'Else' or 'End' tool. .
Returned Values
None
Example
tool : If
01 = Control expression: (condition)
02 = END step: 4
Step 1
Program step
Program step
Program step
Step 2
Step 3
Step 5
tool : End
01 = Start step : 1
Step 4
tool : If
01 = Control expression : (condition)
02 = END step: 4
Step 1
Program step
Program step
Step 2
Step 3
tool : End
01 = Start step : 1
Step 6
tool : Else
01 = IF step : 1
02 = END step: 6
Step 4
Chapter 4 Reference Manual
IVC-3D
184 ©SICK AG • Advanced Industrial Sensors • www.sick.com • All rights reserved
Program
Else This tool could be used after the ‘If’ tool and must be terminated with the ‘End’ tool. It
depends on the condition in the ‘If’ tool. If the condition is true all program steps between
‘Else‘ and ‘End’ are skipped. If the condition is false only the program steps between ‘Else‘
and ‘End' are executed. See figure below.
Input Parameters
01 = IF step This parameter refers to the step number
with corresponding ‘If‘ tool.
02 = END step This is the step number with the corre-
sponding ‘End‘ tool.
Note that no other step numbers are
allowed.
Returned Values
None
Example
Program step Step 5
tool: If
01 = Control expression : (condition)
02 = END step: 4
Step 1
Program step
Program step
Step 2
Step 3
tool: End
01 = Start step : 1
Step 6
tool: Else
01 = IF step : 1
02 = END step: 6
Step 4

Reference Manual Chapter 4
IVC-3D
©SICK AG • Advanced Industrial Sensors • www.sick.com • All rights reserved 185
Program
For This tool performs a for loop. It repeats the execution of program steps between ‘For‘ and
‘End’. It initializes the loop index with the start value and repeats program steps until Loop index is equal to or greater than Stop value. After each repetition the Increment value is
added to Loop index.
The repetition of program steps terminates if the Loop index is equal to or greater than the
Stop value.
Input Parameters
01 = Start value Initialize start value for Loop index.
02 = Stop value Set stop value for Loop index.
03 = Increment Increment for Loop index.
04 = END step Step number with corresponding End.
Returned Values
01 = Loop index Current loop index.
Example
Input Parameters Returned Values
Start value = 1
Stop value = 10
Increment = 4
Loop index = 1, 5, 9
Start value = 10
Stop value = -10
Increment = -3
Loop index = 10, 7, 4, 1, -2, -5, -8

Chapter 4 Reference Manual
IVC-3D
186 ©SICK AG • Advanced Industrial Sensors • www.sick.com • All rights reserved
Program
While This tool performs a while loop. It repeats all program steps between ‘While’ and ‘End’ until
the condition in Control Expression is false. Due to that this tool must be terminated with
an ‘End’ tool.
Input Parameters
01 = Control Expression Condition.
Boolean operations and mathematical expressions are
allowed. For example: = (v2 > v5).
02 = END step Step number that refer to the corresponding function
‘End’.
Note that no other step numbers are allowed.
Returned Values
None

Reference Manual Chapter 4
IVC-3D
©SICK AG • Advanced Industrial Sensors • www.sick.com • All rights reserved 187
Program
Subroutine Start This tool defines the beginning of a subroutine and must be followed by the ‘End’ tool.
When the subroutine is called it executes all program steps between Subroutine and End.
A subroutine can be called by the following tools:
- Goto
- If then go to
- If in range goto
- If all in range goto
After the subroutine is executed the program continues at the step following the step
calling the subroutine.
Input Parameters
01 = END step Step number of the ‘End‘ that belongs to the subroutine.
Returned Values
01 = Calling step Step number which called the subroutine
Example
Step number Step tool Execution order
1 Goto step 15 1
2 15
3 16
4 17
5 18
. 2
. 3
. 4
. 5
15 Subroutine Start .
16 Intermediate steps .
17 Intermediate steps .
18 End step .

Chapter 4 Reference Manual
IVC-3D
188 ©SICK AG • Advanced Industrial Sensors • www.sick.com • All rights reserved
Program
End The End tool must follow the following tools:
- If
- While
- For
- Subroutine
Input Parameters
01 = Start step Step number that refer to the corresponding
‘If‘, ‘While‘, ‘For‘, or ‘Subroutine‘ tool.
Returned Values
None

Reference Manual Chapter 4
IVC-3D
©SICK AG • Advanced Industrial Sensors • www.sick.com • All rights reserved 189
Program
Run Flash Program This tool is used for loading and running a step program that is stored in a program bank in
the flash memory of the device.
Execution of the loaded program starts at the program step specified by the Start step
parameter.
By setting the parameters Start load table index and Number of elements, you can specify
which rows of the table stored with the step program that should be loaded with the
program.
The loaded step program will entirely replace the program currently in the working memory.
If you want to continue running the previous program after loading a program from flash,
that program must also be stored in the flash memory, and the loaded program must
contain a 'Run flash program' step that loads the previous program from flash.
Input Parameters
01=Program number Number of the program bank in which the program
and table to load is saved.
02=Start step Step number in the loaded program where to start
the execution.
03=Start load table index Index of the first table row to be loaded from the
table stored with the step program and into the
active table.
04=Number of elements The number of table rows to be loaded from the
table saved with the step program and into the
active table.
Returned Values
None

Chapter 4 Reference Manual
IVC-3D
190 ©SICK AG • Advanced Industrial Sensors • www.sick.com • All rights reserved
Program
Program Protection The Program protection tool can be used for preventing a program from being imported
from the device and opened in IVC Studio, and for preventing a program to be copied to
and run in another device.
A program containing this tool cannot be imported from the Flash memory into IVC Studio.
If the Lock to device parameter is set, the program will only run on the device to which it
was loaded from IVC Studio. If the program is copied from one device to another, it will
refuse to run on the other device.
If the Lock to device parameter is not set, the program can be copied to other devices
through FTP and run on those devices, but never imported back into IVC Studio.
Note: If you use this program step in a program, make sure that you keep the original
project file, since there is no way to recover the program from a device if the project file is
lost.
Input Parameters
02=Lock to device If this parameter is set, the program will only run on the device
that it was written to flash from IVC Studio.
If you try to copy this program from one device to another, it
will refuse to run on the other device.
Returned Values
None.
The Emulator does
not emulate this
tool. See section
Handling the
Emulator for more
information.

Reference Manual Chapter 4
IVC-3D
©SICK AG • Advanced Industrial Sensors • www.sick.com • All rights reserved 191
System
4.10 System
Get Timer This tool allows monitoring of the system time. The total processing time or the processing
time of certain step sequences can be calculated by subtracting the results of two different
Get timer tools or of one tool in two cycles of the step program. Since it is not possible to
reset the timer the return value should be stored in the table to calculate cycle times of
step program sequences. The maximum value for system time is 1,157,627,903 (which correspond to 44FFFFFF hexadecimal). When maximum value is reached the value will be wrapped.
Input Parameters
None
Returned Values
01 = System time System time in microseconds (µs).

Chapter 4 Reference Manual
IVC-3D
192 ©SICK AG • Advanced Industrial Sensors • www.sick.com • All rights reserved
System
Wait This tool sets a time delay in the step program. The program stops at this step and contin-
ues after the specified waiting time.
Note that the displayed Time of execution has no meaning in this step. Please ignore this
value.
Input Parameters
01 = Wait time (ms) Desired time delay in milliseconds.
Maximum time delay = 9999 ms.
Returned Values
None

Reference Manual Chapter 4
IVC-3D
©SICK AG • Advanced Industrial Sensors • www.sick.com • All rights reserved 193
System
Read from Table This tool reads a value from the table. The return value of this tool is the selected value
from the table.
Input Parameters
01 = Table index Index number of the table in which to select
a value.
Returned Values
01 = Value Returns the read value from the table.

Chapter 4 Reference Manual
IVC-3D
194 ©SICK AG • Advanced Industrial Sensors • www.sick.com • All rights reserved
System
Write to Table This tool writes a value into the table.
Input Parameters
01 = Value Value to be written in the table.
02 = Table index Index in table where the value should be written.
Returned Values
None

Reference Manual Chapter 4
IVC-3D
©SICK AG • Advanced Industrial Sensors • www.sick.com • All rights reserved 195
System
Fill Table This tool fills a value into a selected array in the table. The array is defined by a Start table index at which this tool starts to fill the table and an End table index at which this tool
stops to fill the table. Either each cell in this array is filled with the value or only every nth
row.
Input Parameters
01 = Value Value to be filled in the table.
02 = Start table index Index number of the table to define first row of the
array.
03 =End table index Index number of the table with the last row of the array.
04 = Fill interval Number of skipped rows between each value. 1 means
all cells in the array are filled with the value.
Returned Values
None

Chapter 4 Reference Manual
IVC-3D
196 ©SICK AG • Advanced Industrial Sensors • www.sick.com • All rights reserved
System
Load Data Block from Flash This tool loads data that is stored in the flash memory into a data block in the working
memory.
The data is stored in a file on the flash memory, which is referred to by the File name
parameter.
Input Parameters
01 = File name Name of the file to be loaded.
02 = Data block The number of the data block in working
memory into which to load the data.
Returned Values
None
Error Messages
Err=2 A timeout occurred.
Err=159 Failed to read file from flash.

Reference Manual Chapter 4
IVC-3D
©SICK AG • Advanced Industrial Sensors • www.sick.com • All rights reserved 197
System
Save Data Block to Flash This tool writes a data block in the working memory to the flash memory. The flash memory
holds that data even if the power to the device is shut off.
When saved to the flash memory, the data is contained in a file whose name is specified in
the File Name parameter.
This tool is useful for example in combination with the ‘Shape Locator’, and ‘Add Shape
Runtime’ tools in the Matching category. These tools store data about an object in a data
block in the working memory. ‘Save Data Block‘ to flash allows this memory block to be in
the flash memory and be used by the ‘Shape Locator’ tool later – or in other programs –
without having to teach the object again.
Note: If a data block already exists on the flash with the same name as the one being
written, the existing one will be replaced by the new data block, and the amount of dead
space on the flash disk will increase with the size of the previous data block. For details
see section on page 282 in the Troubleshooting guide.
Note: This tool may perform an automatic defragmentation of the flash disk if the amount
of dead space exceeds the specified threshold. Please refer to section Setting Device Parameters in the appendix for information on how to set this threshold. This will signifi-
cantly increase the execution time of the tool. Note also that this is only the case when the
camera is running, not when executing the tool with F5/F8. In the latter situation, an error
code will be returned indicating that it is time to defragment the flash.
Input Parameters
01 = Data block The number of the data block in working memory in which the
data to be saved is stored.
02 = File name Name of the file in which to save the data.
Returned Values
None
Error Messages
ITF Error = 2 Timeout. The execution time to save the data block on
flash is too long. Increase the timeout limit (Options Configuration on the IVC Studio menu bar).
Err. = 8960 The amount of dead space on the flash exceeds the
specified threshold. Please defragment the disk by using
the Clear Unused Memory option on the Flash menu in the
Device list.
Err. = 8961 The automatic defragmentation failed. The camera may
need to be restarted to restore the flash.

Chapter 4 Reference Manual
IVC-3D
198 ©SICK AG • Advanced Industrial Sensors • www.sick.com • All rights reserved
System
Load Image from Flash This tool loads an image that has previously been stored in the flash memory into a speci-
fied image bank.
Note that when loading an image in an IVC-3D camera, the camera must have the same
settings for field-of-view (FOV) and length as when the image was saved.
Input Parameters
01 = Flash bank Number of the flash bank in which the image to be loaded
is stored.
Available numbers of flash banks: 0 – 9999.
02 = Destination bank Number of the image bank into which to load the image.
Returned Values
None
Error Messages
Err. = 361 Type of image to restore is different from image type
of bank.
Err. = 7304 The file could not be found.
Err. = 7306 The size of the image bank to be loaded from file
does not match current FOV settings.
Reference Manual Chapter 4
IVC-3D
©SICK AG • Advanced Industrial Sensors • www.sick.com • All rights reserved 199
System
Save Image to Flash This tool saves an image in an image bank into the flash memory. There are up to 9999
flash banks available for storage. The actual number of available banks is determined by
the size of the saved images.
Note: If the selected flash bank already contains a stored image, this image will be re-
placed by the new image without any warning.
The images can be saved in three different image formats:
Raw Saves the raw data of the image without compression.
Compressed raw Saves the raw data of the image with lossless compression.
Jpeg Saves the image in a compressed jpeg format, which is a lossy
compression. The amount of compression is set with the Quality fac-tor, where 100 means no compression.
The execution time of this tool depends on how much the image is
compressed, as described in the following table.
For IVC-3D, profiles cannot be saved in Jpeg format.
Note that the execution times can vary about several milliseconds, which can result in a
non-constant cycle time.
An example of the variation of execution time is listed in the following table:
Format Time of execution (min and max execution times in ms)
IVC-2DM1111 IVC-2DM1121 (HiRes) Raw 9.000 – 11.000 15.000 – 17.000
Compressed raw 9.000 – 10.000 15.000 – 17.000
Jpeg (Quality factor 100) 780 – 1.900 8.000 – 10.000
Jpeg (Quality factor 50) 185 – 500 1.000 – 1.500
Jpeg (Quality factor 1) 145 – 160 200 – 400
Note: This tool may perform an automatic defragmentation of the flash disk if the amount
of dead space exceeds the specified threshold. Please refer to section Setting Device Parameters in the appendix for information on how to set this threshold. This will signifi-
cantly increase the execution time of the tool. Note also that this is only the case when the
camera is running, not when executing the tool with F5/F8. In the latter situation, an error
code will be returned indicating that it is time to defragment the flash.
Input Parameters
01 = Source bank Image bank containing the image to be saved to flash.
02 = Flash bank Number of the flash bank in which the image will be
stored. Valid numbers for flash banks are 0 – 9999.
03 = Format Image format for the saved image:
Raw Jpeg Compressed raw
04 = Quality factor When Format is set to Jpeg, the amount of compression
of the image. Valid values: 1–100.
100 Highest quality of the image (no jpeg compression)
1 Low image quality and short execution time (maxi-
mum jpeg compression).
Returned Values
None

Chapter 4 Reference Manual
IVC-3D
200 ©SICK AG • Advanced Industrial Sensors • www.sick.com • All rights reserved
System
Error Messages
ITF Error = 2 Timeout. The execution time to save image bank on flash
is too long. Increase the timeout limit (Options Configura-tion on the IVC Studio menu bar).
Err. = 8960 The amount of dead space on the flash exceeds the
specified threshold. Please defragment the disk by using
the Clear Unused Memory option on the Flash menu in the
Device list.
Err. = 8961 The automatic defragmentation failed. The camera may
need to be restarted to restore the flash.

Reference Manual Chapter 4
IVC-3D
©SICK AG • Advanced Industrial Sensors • www.sick.com • All rights reserved 201
System
Web Status Page The parameters of this tool are written to a status page that is accessible via a web
browser. This enables to monitor the selected parameters during the runtime of the de-
vice. The page is accessed as http://xxx.yyy.zzz.qqq/status.html where the xxx.yyy.zzz.qqq
is the IP-number of the selected device.
Figure – Screen shot of a status page.
The web page will contain one image bank and it is possible to monitor up to five variables.
The selected image bank can be copied to a buffer to ensure that the included image on
the web page is synchronized with the execution of the Web Status Page in the step
program. If the image bank is not copied to a buffer the included image could be depend-
ing on the current stage of the step program when you update the status web page.
Note that copying an image bank to a buffer takes some time and so the execution time
will increase. Colors in the image bank will be displayed in white on the web page.
Also note that the description that can be added in the parameters Description A-E allows
only strings (no numerical values). If no description or numerical values is used the variable
will not be included in the web page.
To update the status page just click on the refresh button of your web browser.
Input Parameters
01 = Source bank Selected image bank that will be included on the web
page.
02 = Copy bank Option if the image bank should be copied or not.
True The image bank is copied to a buffer and syn-
chronic with the execution of the Web Status
Page tool in the step program.
False The image bank will not be copied to a buffer
and is dependent on when the status page is
accessed by the browser.
03 = Description A Description for variable A that will be included on the web
page (only strings).
http://xxx.yyy.zzz.qqq/status.html
xxx.yyy.zzz.qqq is the IP address
of the device
Included image bank
Included variables
The Emulator does
not emulate this
tool. See section
Handling the
Emulator for more
information.

Chapter 4 Reference Manual
IVC-3D
202 ©SICK AG • Advanced Industrial Sensors • www.sick.com • All rights reserved
System
04 = Variable A Parameter specifies variable that will be included on the
web page with Description A.
05 = Description B Description for variable B that will be included on the web
page (only strings).
06 = Variable B Parameter specifies variable that will be included on the
web page with Description B.
07 = Description C Description for variable C that will be included on the web
page (only strings).
08 = Variable C Parameter specifies variable that will be included on the
web page with Description C.
09 = Description D Description for variable D that will be included on the
web page (only strings).
10 = Variable D Parameter specifies variable that will be included on the
web page with Description D.
11 = Description E Description for variable E that will be included on the web
page (only strings).
12 = Variable E Parameter specifies variable that will be included on the
web page with Description E.
Returned Values
None
Errors
If you are unable to connect to the device with a web browser, try the following:
Check that the HTTP server is enabled
Go to: Options Configuration Ethernet Devices.
Click on button: Ethernet Device Configuration and check Device Parameters on the
right table. HTTP Server Enabled must set to 1.
Make a Proxy Server exception in the web browser If your computer is on a network using a proxy server (typical at large networks), a proxy
exception needs to be made to allow for direct communication between the computer
and camera. To know if your network uses a proxy server, look at the LAN Settings for
your web browser. Tools Internet Options Connections LAN Settings.
To make the exception in for example Internet Explorer, choose Tools Internet Options
Connections LAN Settings Proxy Server, Advanced. In the Exceptions list, add your
domain number, ;xxx.yyy.zzz.* Other browsers usually work similarly. If you still
have problems, contact your network technician.
For example, if your camera has IP address 10.162.8.100, the following should be
added in the exceptions list: ;10.162.8.*

Reference Manual Chapter 4
IVC-3D
©SICK AG • Advanced Industrial Sensors • www.sick.com • All rights reserved 203
System
Write Table To Flash This tool writes a section of the current table to the flash memory on the camera and the
data will be stored on a readable text file.
Frequent writing to flash devices will wear down the device. Never include a write table to
flash step which will run in every program cycle. This tool should only be used in a special
section of the step program which is only executed when e.g. an operator changes some
operation parameters. Failure to comply with this warning will eventually result in a broken
flash device.
Note: This tool may perform an automatic defragmentation of the flash disk if the amount
of dead space exceeds the specified threshold. Please refer to section Setting Device Parameters in the appendix for information on how to set this threshold. This will signifi-
cantly increase the execution time of the tool. Note also that this is only the case when the
camera is running, not when executing the tool with F5/F8. In the latter situation, an error
code will be returned indicating that it is time to defragment the flash.
Input Parameters
01 = Table index Index of the first table element to be stored on flash.
02 = Number of elements
The number of table elements to be stored on flash.
03 = File name Name of the file on flash where the data will be stored.
04 = Warning! Wears down flash
The tool will only work if this parameter is set to ‘Accept’. The
default value is ‘Do not accept’. This is a safety precaution to
reduce the risk of accidental inclusion of the step in your main
loop.
Returned Values
01 = Result 0 – Everything is ok.
-1 – Warning! Wears down flash was not set to Accept.
1 – The file could not be written, most likely because the flash
disk is full
Error Messages
ITF Error = 2 Timeout. The execution time to save image bank on flash
is too long. Increase the timeout limit (Options Configura-tion on the IVC Studio menu bar).
Err. = 8960 The amount of dead space on the flash exceeds the
specified threshold. Please defragment the disk by using
the Clear Unused Memory option on the Flash menu in the
Device list.
Err. = 8961 The automatic defragmentation failed. The camera may
need to be restarted to restore the flash.
Warning:

Chapter 4 Reference Manual
IVC-3D
204 ©SICK AG • Advanced Industrial Sensors • www.sick.com • All rights reserved
System
Read Table From Flash This tool reads a section of the table from flash. To be able to do this the file should previ-
ously be written by the Write Table To Flash tool.
Input Parameters
01 = Table Index The elements read from the flash will be stored in the current
table starting from this index.
02 = File Name Name of the file on flash
Returned Values
01 = Result 0 – Everything is ok.
1 – The file does not exist.
2 – The file could not be read and interpreted.

Reference Manual Chapter 4
IVC-3D
©SICK AG • Advanced Industrial Sensors • www.sick.com • All rights reserved 205
Communication
4.11 Communication
Setup RS485 This tool initializes the RS485 port. It must be executed in the step program before using
following tools:
‘Write RS485 Values’
‘Read RS485 Values’
‘Write RS 485 String’
‘Read RS 485 String’
Input Parameters
01 = Baud rate Select desired Baud rate (1200 – 115200).
02 = Parity Select parity:
None Even Odd
03 = Data bit Select how many data bits: 7 8
04 = Stop bit Select number of stop bits: 1 2
Returned Values
None
The Emulator does
not emulate this
tool. See section
Handling the
Emulator for more
information.

Chapter 4 Reference Manual
IVC-3D
206 ©SICK AG • Advanced Industrial Sensors • www.sick.com • All rights reserved
Communication
Read RS485 Values This tool receives data through port RS485 and writes the values in the table. The received
values are successive filled in the table beginning at a selected start row.
Only transmit values up to 8 bit. Do not transmit any other values.
Input Parameters
01 = Timeout (ms) Maximum time to receive one byte before an error
message occurs due to time out.
02 = Expected values Total number of expected values.
Since the number of rows in the table are limited to
2000 the Table index + Expected values < 2001.
03 = Table index Start row in table to write received values in a succes-
sive manner.
Returned Values
01 = Received bytes Total number received values.
Error Messages
Err. = 407 Serial protocol
Check if a ‘Setup RS485’ tool was executed before
using this tool.
Check Timeout in ms.
Check if the number of Expected values is equal to Received bytes.
The Emulator does
not emulate this
tool. See section
Handling the
Emulator for more
information.

Reference Manual Chapter 4
IVC-3D
©SICK AG • Advanced Industrial Sensors • www.sick.com • All rights reserved 207
Communication
Write RS485 Values This tool will send values form the table via the port RS485. The values will be sent in a
successive manner from the table beginning at the row defined by the parameter Table index. The parameter Number of values defines how many values that will be sent.
Note that only 8-bit values (0 .. 255) can be sent.
Input Parameters
01 = Table index Select row in table with the first value that will be
sent.
02 = Number of values Total number of values that will be sent in a suc-
cessive manner.
Since the number of rows in the table are limited to
2000 the Table index + Number of values < 2001.
Returned Values
None
Error Messages
Err. = 407 Serial protocol
Check if a 'Setup RS485' tool was executed before
using this tool.
Example
Figure – Example for sending values from table via RS485. Input Parameters: Table index: 21 and Number of values: 3.That means beginning at table index 21 three successive values will be send.
Table index:20
Table index:21
Table index:22
Table index:23
Table index:24
Table index:25
Only values from index 21 – 23
will be sent via RS485
The Emulator does
not emulate this
tool. See section
Handling the
Emulator for more
information.

Chapter 4 Reference Manual
IVC-3D
208 ©SICK AG • Advanced Industrial Sensors • www.sick.com • All rights reserved
Communication
Read RS485 String This tool will read a string with up to 4095 characters via port RS485. If there is no string
to read the tool waits up to the user defined time limit Timeout and then the program will
continue to the next step.
Note that the tool reads only up to 4095 characters at a time. If there are remaining
characters in the queue the next 4095 characters will be read the next time the tool is
executed. To ensure that the tool reads the first 4095 characters each time it is executed
the tool ‘Setup RS485’ should be inserted before ‘Read RS485 string’ to clear the queue
before a new string is transmitted.
The read string is found in the result value Received string.
Input Parameters4
01 = Timeout Time limit about how long the tool waits to read string
via the RS485 port.
Returned Values
01 = Received bytes Number of received bytes.
02 = Received string Received string.
Error Messages
Err. 407 Serial protocol
Check if a 'Setup RS485' tool was executed before
using this tool.
The Emulator does
not emulate this
tool. See section
Handling the
Emulator for more
information.

Reference Manual Chapter 4
IVC-3D
©SICK AG • Advanced Industrial Sensors • www.sick.com • All rights reserved 209
Communication
Write RS485 String This tool will write a string with up to 4095 characters via port RS485.
Input Parameters
01 = String String to write.
Note that only up to 4095 characters can be sent.
Returned Values
None
Error Messages
Err. 407 Serial protocol
Check if a 'Setup RS485' tool was executed in the step
program before using this tool.
Err. 8006 The string to send is too long (more than 4095 charac-
ters)
The Emulator does
not emulate this
tool. See section
Handling the
Emulator for more
information.

Chapter 4 Reference Manual
IVC-3D
210 ©SICK AG • Advanced Industrial Sensors • www.sick.com • All rights reserved
Communication
Enable Ethernet This tool handles transmission of result values and images from the device to PC via the
Ethernet port. Input parameter Status controls if the transmission will be enabled or dis-
abled. Transmission via Ethernet port = enabled is the default setting.
If Status = false transmission will be disabled. In this case the 'Display' tool will not be
updated with current result values and no image will be shown.
If Status = true transmission will be enabled again. After enable the transmission again it is
recommended to include a 'Wait' tool with a delay of at least 1 ms in the step program
before using tools that need result values or images. This ensures that the values will be
available for the following tool.
Input Parameters
01 = Status False Disable transmission of result values and images from
the device to PC via Ethernet port.
True Enable transmission of result values and images from
the device to PC via Ethernet port.
Returned Values
None

Reference Manual Chapter 4
IVC-3D
©SICK AG • Advanced Industrial Sensors • www.sick.com • All rights reserved 211
Communication
Open Ethernet Raw This tool is used for setting up a connection to a device over Ethernet. This connection can
be used later in the program for either sending or receiving data from that device.
It is possible to have several connections open at the same time. When sending or receiv-
ing data over the connection, the program step where the connection is opened is used as
one of the parameters.
The Transport Protocol parameter specifies which type of connection to open:
Outgoing TCP Connects to another device using the TCP protocol.
Incoming TCP Waits for other devices to connect using the TCP protocol.
UDP Sends and receives data using the UDP protocol.
The connection can be set up for communication using either the TCP or UDP protocol. A
TCP connection can always be used for both sending and receiving data. An UCP connection
can be limited to either sending or receiving by setting the other parameters for the tool.
Please note that the UDP protocol is not safe in that sense that there is no indication
whether or not the data was actually received by the other device.
When establishing a connection using TCP between two devices, one of the devices
initiates the connection by sending a connection request to the other device. If the other
device replies to the request, the connection can be established.
If the device should initiate the connection, the connection type should be set to Outgo-
ing TCP in the 'Open Ethernet Raw' step.
If the device should wait for other devices to connect, the connection type should be
set to Incoming TCP in the 'Open Ethernet Raw' step. A connection will be established
with any device that requests a connection.
For an outgoing connection to be established successfully, the device to which to connect
must be waiting for an incoming connection. If the device is an IVC-2D or IVC-3D camera,
this means that the camera must have executed an 'Open Ethernet Raw' tool with the
Transport Protocol parameter set to Incoming TCP.
Device B
Device C
Incoming TCPPort: 2610
Device A
Outgoing TCPPort: 2610
Outgoing TCPPort: 2610
Connection requests
Connection
1
2
3
1. Device A requests a connection to device B on the specified port.
2. If the device is waiting for incoming connections, the connection is established and the devices can send and receive data over the connection.
3. If another device tries to connect to the same device and on the same port, it will fail since the connection is already busy. The connection must be closed by device B before device C can establish a connection.
The Emulator does
not emulate this
tool. See section
Handling the
Emulator for more
information.

Chapter 4 Reference Manual
IVC-3D
212 ©SICK AG • Advanced Industrial Sensors • www.sick.com • All rights reserved
Communication
For Outgoing TCP connections, the Associated IP specifies which device to communi-
cate with and the Associated Port specifies which port the other device will listen on. The
IVC Device Port can be set to 0, in which case the camera’s port number will be set auto-
matically.
For Incoming TCP connections, the IVC Device Port must be set, while the parameters
Associated IP and Associated Port are ignored. This means that the camera will accept a
connection from any other device that connects to the IVC Device Port.
For UDP connections, setting the IVC Device Port to 0 will prevent the camera from receiv-
ing data over this connection. Likewise, leaving Associated IP empty and setting Associ-ated Port to 0 will prevent the camera from sending data over the connection. If the Asso-ciated IP is set, the camera will only receive data from that device.
If an Outgoing TCP or Incoming TCP connection could not be established before the
timeout, the camera will try to re-establish the connection on every subsequent read or
write operation. Furthermore, if a connection is closed for any reason, it cannot be used
again until it is closed (by using the 'Close Ethernet raw' tool) and reopened again.
Input Parameters
01=Timeout The time in milliseconds during which the camera will try to
establish the connection.
02=Transport Protocol Type of connection to be established and protocol (TCP or
UDP) for the connection.
Outgoing TCP Incoming TCP UDP
03=IVC Device Port The port number on which the camera will send or receive
data. Valid port numbers are 1500–65535.
For Outgoing TCP, this parameter can be set to 0. In this
case the port number will be set automatically.
For UDP, if this parameter is set to 0 the camera will not be
able to receive data on this connection.
04=Associated IP The IP address of the device to which to establish the
connection. If this parameter is set, the Associated Port must also be set.
For Incoming TCP, this parameter is ignored and can be
left empty.
For UDP, if this parameter is empty the camera will not be
able to send data on this connection.
05=Associated Port The port number used on the device to which to connect. If
this parameter is set, the Associated IP must also be set.
Valid port numbers are 1–65535, however port numbers
1–1023 are usually reserved for the system
For Incoming TCP, this parameter is ignored and can be
left empty.
For UDP, if this parameter is 0 the camera will not be able to
send data on this connection.
Returned Values
None.
Error Messages
Err. = 8002 No connection possible to the associated address.

Reference Manual Chapter 4
IVC-3D
©SICK AG • Advanced Industrial Sensors • www.sick.com • All rights reserved 213
Communication
Close Ethernet Raw This tool closes the Ethernet connection that has been established with a device.
For Incoming TCP and Outgoing TCP, any data that is queued will be received or
sent before the connection is actually closed, which may take an unspecified amount of
time.
Input Parameters
01=Open step The program step in which the connection was opened.
Returned Values
None.
Error Messages
Err. = 1 The program step referred to by the parameter Open step does
not contain an 'Open Ethernet raw' tool.
The Emulator does
not emulate this
tool. See section
Handling the
Emulator for more
information.

Chapter 4 Reference Manual
IVC-3D
214 ©SICK AG • Advanced Industrial Sensors • www.sick.com • All rights reserved
Communication
Read Ethernet Bytes This tool is used for receiving a number of bytes – that is, integer values between 0–255
– from another device over an Ethernet connection.
The received values are stored in the table as numerical values. The first received value is
stored in table row Table index, the next value in row Table index +1 etc, until a total
number of Expected bytes have been received.
If the other device sends more data than expected, the remaining bytes are queued and
will be read the next time a 'Read Ethernet' tool is used with the connection.
In order to receive data from a device, a connection to that device must have been
opened with the 'Open Ethernet Raw' tool. The program step in which the connection was
opened is used as the parameter Open step.
Input Parameters
01=Open step The program step in which the connection was opened.
02=Timeout The time in milliseconds during which the camera will try to
receive data. This includes the time it takes to establish the
connection, if necessary.
03=Expected bytes The number of values that are expected to be received.
04=Table index Table row in which to store the first received value.
The tool will store values in the table rows from Table index to
(Table index + Expected bytes -1)
Returned Values
01=Received bytes The number of bytes that have been received and stored in the
table.
Error Messages
Err. = 1 The program step referred to by Open step is not an 'Open
Ethernet Raw' step.
Err. = 8000 Connection timed out.
Err. = 8001 Connection is broken.
Err. = 8002 Not possible to connect to the specified device.
Err. = 8004 The specified connection is for sending data only.
The Emulator does
not emulate this
tool. See section
Handling the
Emulator for more
information.

Reference Manual Chapter 4
IVC-3D
©SICK AG • Advanced Industrial Sensors • www.sick.com • All rights reserved 215
Communication
Read Ethernet Bytes Formatted This tool is used for receiving a number of bytes from another device over an Ethernet
connection.
The received values are stored in the table as numerical values. The first received value is
stored in table row Table index, the next value in row Table index +1 etc, until all values
specified in the Format string have been received.
If the other device sends more data than expected, the remaining bytes are queued and
will be read the next time a 'Read Ethernet' tool is used with the connection.
In order to receive data from another device, a connection to that device must have been
opened with the 'Open Ethernet Raw' tool. The program step in which the connection was
opened is used as the parameter Open step.
Formatting string
The format of the information to receive is specified in a string where the type and preci-
sion is specified for each value. The binary data is formatted according to the IEEE-754
standard. The following formats are available:
Format Description
Ix Integer with x bytes (1, 2 or 4 bytes)
Fy Float with y bytes (4 or 8 bytes)
Uz Unsigned integer with z bytes (1, 2 or 4 bytes)
Pn Pad with n bytes (0-999 bytes). The padded bytes will be set to 0.
For padding bytes, no table cell is accessed.
Example:
If the telegram holds two integers with 2 bytes, one integer with 4 bytes and three floats
with 4 bytes, the string shall have the following format:
I2I2I4F4F4F4
Input Parameters
01=Open step The program step in which the connection was opened.
02=Timeout The time in milliseconds during which the camera will try to
receive data. This includes the time it takes to establish the
connection, if necessary.
03=Table index Table row in which to store the first received value.
04= Format string A string specifying how the values shall be formatted. See table
above.
05= Endian Controls Little or Big Endian for the byte order of the received
data.
Returned Values
01=Received bytes The total number of bytes that have been received.
Error Messages
Err. = 1 The program step referred to by Open step is not an 'Open
Ethernet Raw' step.
The Emulator does
not emulate this
tool. See section
Handling the
Emulator for more
information.

Chapter 4 Reference Manual
IVC-3D
216 ©SICK AG • Advanced Industrial Sensors • www.sick.com • All rights reserved
Communication
Err. = 8000 Connection timed out.
Err. = 8001 Connection is broken.
Err. = 8002 Not possible to connect to the specified device.
Err. = 8004 The specified connection is for sending data only.
Err. = 8970 Parsing error. The format string may be empty.
Err. = 8971 Syntax error. The format string does not have the correct
format, e.g. the string contains an invalid character.
Err. = 8972 Precision error. The number of bytes is not valid for the speci-
fied data type.
Err. = 8974 Buffer too long. The total number of bytes exceeds the size of
the Ethernet buffer (currently 4096 bytes).

Reference Manual Chapter 4
IVC-3D
©SICK AG • Advanced Industrial Sensors • www.sick.com • All rights reserved 217
Communication
Read Ethernet String This tool is used for receiving a string that may contain up to 4095 characters from an-
other device over an Ethernet connection. The received string is available in the returned
value Received string.
The received string consists of every character that was received until a timeout occurred.
If the string that was sent contained more than 4095 characters, the remaining characters
will be queued and can be received by using this tool once more with the connection.
In order to receive data from another device, a connection to that device must have been
opened with the 'Open Ethernet Raw' tool. The program step in which the connection was
opened is used as the parameter Open Step.
As the length of the string is not known in advance, this tool will always wait the time
specified in the parameter Timeout before returning the received string.
Input Parameters
01=Open step The program step in which the connection was opened.
02=Timeout The time in milliseconds during which the camera will try to
receive the string. This includes the time it takes to establish
the connection, if necessary.
Returned Values
01=Received bytes The length of the received string., that is the number of bytes
that was received.
02=Received string The received string.
Error Messages
Err. = 1 The program step referred to by 01=Open step is not an 'Open
Ethernet Raw' step.
Err. = 8000 Connection timed out.
Err. = 8001 Connection is broken.
Err. = 8002 Not possible to connect to the specified device.
Err. = 8004 The specified connection is for sending data only.
The Emulator does
not emulate this
tool. See section
Handling the
Emulator for more
information.

Chapter 4 Reference Manual
IVC-3D
218 ©SICK AG • Advanced Industrial Sensors • www.sick.com • All rights reserved
Communication
Write Ethernet Bytes This tool is used for sending bytes – integer values between 0–255 – to another device
over an Ethernet connection.
The tool sends the values in the table starting at row number Table index and the following
rows, until Number of bytes values has been sent. If a value is outside the valid range (0–
255), the least significant byte of that value will be sent.
In order to send data to a device, a connection to that device must have been opened with
the 'Open Ethernet Raw' tool. The program step in which the connection was opened is
used as the parameter Open Step.
Input Parameters
01=Open step The program step in which the connection was opened.
02=Timeout The time in milliseconds during which the camera will try to
send data. This includes the time it takes to establish the
connection, if necessary.
03= Table index Table row in which the first value to send is stored.
04= Number of bytes The number of values to send.
Returned Values
01=Sent bytes The number of bytes that was sent.
Error Messages
Err. = 1 The program step referred to by 01=Open step is not an
'Open Ethernet Raw' step.
Err. = 8000 Connection timed out.
Err. = 8001 Connection is broken.
Err. = 8002 Not possible to connect to the specified device
Err. = 8003 The specified connection is for receiving data only.
Err. = 7601 Some of the table entries that should be sent had an in-
compatible type (only numeric values are allowed).
The Emulator does
not emulate this
tool. See section
Handling the
Emulator for more
information.

Reference Manual Chapter 4
IVC-3D
©SICK AG • Advanced Industrial Sensors • www.sick.com • All rights reserved 219
Communication
Write Ethernet Bytes Formatted This tool is used for sending multiple bytes with a specified format to another device over
an Ethernet connection.
The tool sends the values from the table starting at row number Table index and continues
with the following rows until Number of value values has been sent.
In order to send data to a device, a connection to that device must have been opened with
the 'Open Ethernet Raw' tool. The program step in which the connection was opened is
used as the parameter Open Step.
Formatting string
The format of the information to send is specified in a string where the type and precision
is specified for each value. The binary data is formatted according to the IEEE-754 stan-
dard. The following formats are available:
Format Description
Ix Integer with x bytes (1, 2 or 4 bytes)
Fy Float with y bytes (4 or 8 bytes)
Uz Unsigned integer with z bytes (1, 2 or 4 bytes)
Pn Pad with n bytes (0-999 bytes). The padded bytes will be set to 0.
The format specified in the sting will have precedence over the format in the table cell. E.g.
if the table cell holds a float, and the string specifies an integer, the value will be truncated
to an integer.
For padding bytes, no table cell is accessed.
Example:
If the telegram holds two integers with 2 bytes, one integer with 4 bytes and three floats
with 4 bytes, the string shall have the following format:
I2I2I4F4F4F4
Input Parameters
01=Open step The program step in which the connection was opened.
02=Timeout The time in milliseconds during which the camera will try to
send data. This includes the time it takes to establish the
connection, if necessary.
03= Table index Table row in which the first value to send is stored.
04= Number of values The number of values to send.
05= Format string A string specifying how the values shall be formatted. See
table above.
06= Endian Controls Little or Big Endian for the byte order of the trans-
mitted data.
Returned Values
01=Sent bytes The total number of bytes that was sent.
Error Messages
Err. = 1 The program step referred to by 01=Open step is not an
'Open Ethernet Raw' step.
The Emulator does
not emulate this
tool. See section
Handling the
Emulator for more
information.

Chapter 4 Reference Manual
IVC-3D
220 ©SICK AG • Advanced Industrial Sensors • www.sick.com • All rights reserved
Communication
Err. = 8000 Connection timed out.
Err. = 8001 Connection is broken.
Err. = 8002 Not possible to connect to the specified device
Err. = 8003 The specified connection is for receiving data only.
Err. = 8970 Parsing error. The format string may be empty.
Err. = 8971 Syntax error. The format string does not have the correct
format, e.g. the string contains an invalid character.
Err. = 8972 Precision error. The number of bytes is not valid for the
specified data type.
Err. = 8974 Buffer too long. The total number of bytes to send exceeds
the size of the Ethernet buffer (currently 4096 bytes).

Reference Manual Chapter 4
IVC-3D
©SICK AG • Advanced Industrial Sensors • www.sick.com • All rights reserved 221
Communication
Write Ethernet String This tool is used for sending a string to another device over an Ethernet connection.
The maximum length of the string to send is 4095 charactes when using the TCP protocol.
When using the UDP protocol, the maximum number of characters to send is 1472.
Only the characters that are contained in the string are sent. No delimiting character –
such as a NUL or end-of-line character – is appended to the string.
In order to send strings to a device, a connection to that device must have been opened
with the 'Open Ethernet Raw' tool. The program step in which the connection was opened
is used as the parameter Open Step.
Input Parameters
01=Open step The program step in which the connection was opened.
02=Timeout The time in milliseconds during which the camera will try to send
data. This includes the time it takes to establish the connection, if
necessary.
03= String The string to send.
Returned Values
01=Sent bytes The number of characters (bytes) that were sent.
Error Messages
Err. = 1 The program step referred to by 01=Open step is not an 'Open
Ethernet Raw' step.
Err. = 8000 Connection timed out.
Err. = 8001 Connection is broken.
Err. = 8002 Not possible to connect to the specified device
Err. = 8003 The specified connection is for receiving data only.
Err. =8006 The string to send is too long (more than 4095 characters when
using TCP, more than 1472 characters when using UDP)
The Emulator does
not emulate this
tool. See section
Handling the
Emulator for more
information.

Chapter 4 Reference Manual
IVC-3D
222 ©SICK AG • Advanced Industrial Sensors • www.sick.com • All rights reserved
Communication
Communication Setup The Communication setup tool is used for specifying which parameters the device should
publish and subscribe to, using either the Ethernet/IP or the OPC protocol.
This tool only specifies the parameters that should be read from or written to the network.
The actual reading and writing of values occurs when a 'Communication Read/Write' tool is
executed.
The Communication setup tool can be used several times in a program, and it is possible
to change the definition of an already specified parameter. For example, if one Communi-
cation setup tool defines that the value from table row 1 should be published as a certain
parameter, and another Communication setup tool defines that table row 2 should be
published as the same parameter, the actual content of the parameter depends on which
Communication setup tool that was executed last.
Input Parameters
None.
This tool is set up by using the interactive setup, which is opened by double-clicking the
Setup button. See “Communication Setup” on page 266 for more information on the
interactive setup.
Returned Values
None.
Error Messages
Err. = 8101 There is a syntax error in the definition of the assembly.
The Emulator does
not emulate this
tool. See section
Handling the
Emulator for more
information.

Reference Manual Chapter 4
IVC-3D
©SICK AG • Advanced Industrial Sensors • www.sick.com • All rights reserved 223
Communication
Communication Read/Write The Communication read/write tool is used for updating values for parameters that are
read from the network, and to publish updated parameter values on the network, using
either the Ethernet/IP or the OPC protocol.
This tool is used for updating all values read from and published on the network. The
Read/write parameter specifies whether the tool should update the values of subscribed
parameters, publish updated values for other devices to read, or both.
To specify which parameters to subscribe to and publish, use the 'Communication setup'
tool.
Input Parameters
01 = Read/Write Specifies whether values should be read from the network,
written to the network, or both.
Read Read updated values for the subscribed
parameters.
Write Write updated values for the parameters
published on the network.
Read/Write Read and write updated values.
Returned Values
None.
Error Messages
Err. = 8103 The value to write was too large for the type of the published
parameter, or would need to be rounded (was real when ex-
pected integer).
Allowed value ranges are:
SINT: -128 … 127
INT: -32 768 … 32 767
DINT: -2 147 483 648 … 2 147 483 647
Err. = 8104 The value to write was a string when expecting a value, or a value
when expecting a string.
The Emulator does
not emulate this
tool. See section
Handling the
Emulator for more
information.

Chapter 4 Reference Manual
IVC-3D
224 ©SICK AG • Advanced Industrial Sensors • www.sick.com • All rights reserved
Communication
Send to FTP
This tool replaces the previous version of the Send to FTP tool. The previous version is
made obsolete in IVC 3.1 SR1, and we recommend that the new tool is used instead.
This tool is used for saving files on an FTP server, files that contain an image, a data block
or values from the table. The saved files can either be used for debugging purposes or
when developing programs using the Emulator as device.
The device will log on to the FTP server using the supplied user name and password. If
there is a firewall between the device and the FTP server and there are problems connect-
ing to the FTP server, setting Passive mode to True may help.
The files are saved in the location and with the name specified by the Directory and File-name parameters. You can use expressions to create filenames based on values from the
table and results from other steps. For example, by setting Directory to ‘images’, and
Filename to:
='image_no_' + str(V2) + '.jpg'
the image will be saved in the images directory on the FTP server with the file name
image_no_19.jpg, if the table row 2 contains the value 19.
Images can be saved in either raw, grayscale JPEG, or color JPEG format. Images saved in
raw format can be imported and used in IVC Studio. Use the raw format if the images are
to be used by the Emulator; make sure that the file names have the extension .raw (2D
and 3D images) or .img (3D images). Note that the raw format is no longer compatible with
bmp for 2D images. Use instead the bmp option for this. When saved in grayscale JPEG
the image is saved without any added graphics (such as ROIs and results added by other
tools), whereas they would be included if saved in color JPEG format.
The Quality factor parameter sets the compression ratio for the images when saving in
JPEG format.
When saving data, the tool saves the values from the table to the file, from row number
Table index and up to (but not including) row number Table index + Number of elements.
The tool can transmit images and table data in the same call. In this case, the filename and
folder will specify the location for the image file, and the table information will be stored in a
file called “TableData.txt”. This file will be stored in a folder called Data which is located in
the image folder. For example, if the image file is specified as ‘im-ages\110114\image_xx.jpg’, the table data will be stored in the file ‘im-ages\110114\data\TableData.txt’.
If a data block is transmitted, no other data type is allowed, and the parameters Table index and Image bank must be set to -1.
Note: the parameter Timeout refers to interruptions during the transfer of FTP data. E.g. if
the parameter is set to 1000 ms (1 second), the transfer will still be successful even if the
total time of the transfer exceeds 1 second. The transfer will in this case report timeout
only if the time between two consecutive data packets containing the image exceeds 1
second.
The parameter Quote command can be used to send a generic command to the FTP
server. If this parameter is used, the command text entered in the parameter will be sent
to the FTP server immediately after a successful connection. If the parameter is empty
(default), no command will be sent. If the FTP server fails to interpret or handle the com-
mand, the connection will be terminated and no data will be sent.
The tool can store table data in two formats:
Configuration This format is compatible with the Get from FTP tool and the table
data file can only hold one set of data. The first row in the file speci-
fies the number of data rows, and each of the following rows con-
tain datatype and actual data.
Note:
The Emulator does
not emulate this
tool. See section
Handling the
Emulator for more
information.
Reference Manual Chapter 4
IVC-3D
©SICK AG • Advanced Industrial Sensors • www.sick.com • All rights reserved 225
Communication
Example: 3 0 429 2 1.717000e+01 3 6 ‘Hello
The file contains three rows of data from the table. The first row
contains an integer, the second row a double float and the last row
contains a string. The length of the string is also specified.
The available data types are:
0: Long integer
1: Single float
2: Double float
3: String
CSV Append /
CSV Overwrite
This format is compatible with Excel and each value is separated by
a comma. When the Append format is specified, each call to the
tool will result in a new row in the file.
Example: 429,17.17,Hello 429,18.18,World
The file contains two rows. Decimal separator is always ‘.’ for floating
values.
Input Parameters
01=IP address The IP address of the FTP server to connect to.
02=Port The port number used on the FTP server to connect to.
03=Username A user name used for connecting to the FTP server.
04=Password The password for the user on the FTP server.
05=Timeout Timeout in milliseconds for connection and transmission
of the data.
06=Passive mode Specifies whether or not to use passive mode when
connecting to the FTP server.
07=Directory Directory on the FTP server where the file shall be
stored. The directory will be created if it does not exist.
The folder name cannot contain backslash ‘\’. Use the
slash ‘/’ character to separate folders.
08=Filename The name of the file where the information shall be
stored. The filename cannot contain slash nor backslash
characters.
09=Data block The ID of the data block to transmit. Set to -1 if not used.
10=Source bank The index of the image bank to transmit. Set to -1 if not
used.

Chapter 4 Reference Manual
IVC-3D
226 ©SICK AG • Advanced Industrial Sensors • www.sick.com • All rights reserved
Communication
11=Image format The image format in which the image should be saved:
raw jpeg color jpeg greyscale bmp color bmp greyscale
Choose raw or bmp greyscale if the images are to be
used by the Emulator.
12=Quality factor When Image format is set to Jpeg gray or Jpeg color, this sets the compression ratio of the saved
image. Possible input values: 1–100.
100 Highest quality of the image (no jpeg compression)
1 Low image quality and short execution time (maxi-
mum jpeg compression).
13=Table index Table index of the first row of data to send. Set to -1 if
not used.
14=Number of elements Number of table rows to send.
16=Quote command A generic command that can be sent to the FTP server.
17=Table format Specifies the format of the information stored in the table
data file. The parameter can have the following values:
Configuration – The contents of the file can be
reloaded using the Get from FTP tool. The file will always
be overwritten if it exists.
CSV Overwrite – The data is stored with each value
separated with a comma. The file is always overwritten.
CSV Append – The data is stored with each value
separated with a comma. The data is appended if the file
exists.
Returned Values
None
Error Messages Err=158 The specified data block is invalid or does not contain any data.
Err=8900 Could not connect to the FTP server.
Check IP address and port number.
Check user name and password.
Check firewall settings and try using Passive mode.
Err=8901 The account for the specified user name is invalid
Err=8902 Access denied.
Err=8903 Timeout
Err=8904 No connection to the FTP server
Err=8906 The specified directory was not found
Err=8907 The FTP server did not understand or could not handle the Quote
command.
Err=8909 At least one of the data types (datablock, image or table) must
be specified.

Reference Manual Chapter 4
IVC-3D
©SICK AG • Advanced Industrial Sensors • www.sick.com • All rights reserved 227
Communication
Get from FTP This tool retrieves a data block, an image, or a number of table rows from a file that is
stored on an external FTP of the camera.
Note that the information is only stored in the working memory of the camera (i.e. the
table, an image bank or a data block). The tools for saving information to flash (‘Save Data
Block to Flash’, ‘Save Image to Flash’, and ‘Write Table to Flash’) shall be used if the data
retrieved by this tool shall be persistently stored on the camera flash.
The camera will log on to the FTP server using the supplied user name and password. If
there is a firewall between the camera and the FTP server and there are problems con-
necting to the FTP server, setting Passive mode to True may help.
Note: the parameter Timeout refers to interruptions during the transfer of FTP data. E.g. if
the parameter is set to 1000 ms (1 second), the transfer will still be successful even if the
total time of the transfer exceeds 1 second. The transfer will in this case report timeout
only if the time between two consecutive data packets containing the image exceeds 1
second.
The tool can only retrieve one type of data from the specified file, e.g. if an image shall be
retrieved, the parameters Data block, and Table index shall be set to -1. If more than one
of these parameters have values that are not -1, an error will be reported.
The tool can also be used to transfer a file from an FTP server directly to the flash disk of
the camera. In this case, the parameters Image bank, Table index and Data block shall be
set to -1. The file will be copied to the flash with the same name as on the FTP server. The
length of the file name is limited to 15 characters (including extension) for the flash. Note
that the file will overwritten if it already exists in the flash. This behavior is controlled by the
parameter Save Mode.
Note: For IVC-2D grayscale bitmaps (*.bmp) and raw images (*.raw or *.img) are sup-
ported by the tool, and for IVC-3D only raw (*.raw or *.img) images are supported.
Input Parameters
01=IP address The IP address of the FTP server to connect to.
02=Port The port number used on the FTP server to connect to.
03=User name A user name used for connecting to the FTP server.
04=Password The password for the user on the FTP server.
05=Timeout Timeout in milliseconds for connection and transmission
of the data.
06=Passive mode Specifies whether or not to use passive mode when
connecting to the FTP server.
07=Directory The directory on the FTP server where the file is stored.
08=Filename The name of the file in which the information is stored.
09=Data block The number of the data block in working memory in
which the information shall be stored. Set to -1 if not
used.
10=Image bank The index of the image bank where to store the image
file. Set to -1 if not used.
11=Table index The index of the table where the elements from the file
shall be stored. Set to -1 if not used.
The Emulator does
not emulate this
tool. See section
Handling the
Emulator for more
information.

Chapter 4 Reference Manual
IVC-3D
228 ©SICK AG • Advanced Industrial Sensors • www.sick.com • All rights reserved
Communication
12=Save Mode Controls how the retrieved file shall be stored in the
camera:
RAM Only – The file will be stored in RAM only in an
image bank, data block or in the table.
FFS Only – The file will be stored only on the flash. The
parameters 9-11 must in this case be set to -1
RAM and FFS – The file will be stored both in RAM and
on the flash.
Returned Values
None
Error Messages Err=8900 Could not connect to the FTP server.
Check IP address and port number.
Check user name and password.
Check firewall settings and try using Passive mode.
Err=8901 The account for the specified user name is invalid
Err=8902 Access denied.
Err=8903 Timeout
Err=8904 No connection to the FTP server
Err=8905 The specified file was not found
Err=8906 The specified directory was not found
Err=8909 At least one datatype (image, datablock or table) must be speci-
fied.
Err=8910 When storing a file to the flash, the parameters Data block,
Image bank and Table index must be set to -1.
Err=8911 Only one datatype (image, datablock or table) can be specified in
the same call.
Err. = 8960 The amount of dead space on the flash exceeds the specified
threshold. Please defragment the disk by using the Clear Unused
Memory option on the Flash menu in the Device list.
Err. = 8961 The automatic defragmentation failed. The camera may need to
be restarted to restore the flash.

Reference Manual Chapter 4
IVC-3D
©SICK AG • Advanced Industrial Sensors • www.sick.com • All rights reserved 229
Communication
Get SNTP Time The IVC camera can be configured to synchronize with an external SNTP time server. The
IP address of the time server is configured in the Ethernet Device Settings dialog. Please
refer to Setting Device Parameters for details. The synchronization is then performed when
the camera is rebooted.
This tool is used to force synchronization with an SNTP server during execution of the step
program.
The parameter IP address shall hold the IP address of the SNTP server. If no address is
entered, the default value from the Ethernet Device Settings will be used.
The parameters Time format and Time zone control how the results from the tool are
calculated. Time zone specifies the offset from UTC time in hours, and the Time format specifies how the date shall be returned. The following table shows the available combina-
tions.
Format Value Example
YYYY-MM-DD hh:mi:ss 0 2010-09-02 20:51:33
DD.MM.YYYY hh:mi:ss 1 02.09.2010 20:51:33
MM/DD/YYYY hh:mi:ss AM/PM 2 09/02/2010 08:51:33 PM
The tool returns the synchronized time, both as seconds, and as a date/time string as
specified in the table above.
Input Parameters
01=IP address The IP address of the SNTP server to connect to.
02=Timeout Timeout in milliseconds to wait for the SNTP server to
respond.
03=Time format The format that the date/time string shall use.
04=Time zone The offset in hours from UTC.
Returned Values
01=Seconds The number of seconds since 1 January 1970.
02=Time A string holding date and time in the format specified in
the Time format parameter.
Error Messages Err=8002 Could not connect to the SNTP server.
Check IP address.
Check firewall settings, SNTP uses UDP on port 123.
Err=8000 The SNTP server did not respond within the specified timeout.
The Emulator does
not emulate this
tool. See section
Handling the
Emulator for more
information.

Chapter 4 Reference Manual
IVC-3D
230 ©SICK AG • Advanced Industrial Sensors • www.sick.com • All rights reserved
Input/Output
4.12 Input/Output
Read Input This tool reads the state of an input signal and returns the current status (High or Low).
This enables synchronization of the step program with an external input.
In addition, it is possible to set the tool to wait until the input signal has a specified state,
by setting the Wait parameter to True and Wait for to the state to wait for. Please note
that when running a program that contains such a step, the execution will be halted indefi-
nitely until the signal changes to the selected state. When executing the program step
using Execute Step or Step by Step, the tool will time out after 100 ms.
Input Parameters
01 = Input number The input signal to read the status of:
Value Signal Pin Color 0 Trigger In/In 0 Power connector, pin 1 White
*
1 In 1 Power connector, pin 5 Gray *
2 In 2 Power connector, pin 6 Pink *
3 In 3 (IVC-2D) RS485 connector, pin 8 Red **
* Color is valid for cable type DOL-1208-
** Color is valid for cable type STL-1208-
02 = Wait True Wait until the input signal is high or low, as specified by
Wait for. False Read the status immediately. The input parameter Wait
for is ignored.
03 = Wait for The input signal to wait for. High Low
Returned Values
01 = Signal value Actual status on selected pin.
0 = Low 1 = High
The Emulator does
not emulate this
tool. See section
Handling the
Emulator for more
information.

Reference Manual Chapter 4
IVC-3D
©SICK AG • Advanced Industrial Sensors • www.sick.com • All rights reserved 231
Input/Output
Set Output This tool sets an output status on a selected pin.
Input Parameters
01 = Output number Selects pin where to set output status.
Value Signal Pin Color 0 Out 0 Power connector, pin 3 Green
*
1 Out 1 Power connector, pin 4 Yellow *
2 Out 2 RS485 connector, pin 3 Green **
* Color is valid for cable type DOL-1208-
** Color is valid for cable type STL-1208-
02 = Signal value Status : High
Low
Returned Values
None

Chapter 4 Reference Manual
IVC-3D
232 ©SICK AG • Advanced Industrial Sensors • www.sick.com • All rights reserved
Input/Output
Set All Outputs This tool sets all outputs to individual user defined values at the same time.
Input Parameters
01 = Set all outputs Value Outputs
Out 0 Out 1 Out 2
0 Low Low Low
1 High Low Low
2 Low High Low
3 High High Low
4 Low Low High
5 High Low High
6 Low High High
7 High High High
Output Pin Color Out 0 Power connector, pin 3 Green
*
Out 1 Power connector, pin 4 Yellow *
Out 2 RS485 connector, pin 3 Green **
* Color is valid for cable type DOL-1208-
** Color is valid for cable type STL-1208-
Returned Values
None

Reference Manual Chapter 4
IVC-3D
©SICK AG • Advanced Industrial Sensors • www.sick.com • All rights reserved 233
Input/Output
Set Timed Output This tool sets an output status independent from the step program. It is useful to custom-
ize the status, duration and delay of outputs.
The output can be set in the following ways:
Delay from trigger After being triggered by the 'Trigger in' signal, it waits for a specified
time and then sets the output signal.
Delayed The output signal is set after a specified delay time.
Pulse on/Pulse off Pulse on starts a pulsed signal on the output, which alters between
high and low after specified duration times. This signal is stopped by
using another 'Set timed output' tool with Pulse off.
Fixed on/Fixed off Immediately sets the signal to high or low respectively.
Trigger
Time
Low
High
Output signal
DelayDelay from trigger
Signal value = High
On duration
Low
High
Delay
DelayedSignal value = High
On duration
Low
High
Fixed on Fixed off
Low
High
On duration
Pulse on
Off duration
Pulse off
Since this tool runs as independent task it does not affect the execution time of the pro-
gram steps.
The Emulator does
not emulate this
tool. See section
Handling the
Emulator for more
information.

Chapter 4 Reference Manual
IVC-3D
234 ©SICK AG • Advanced Industrial Sensors • www.sick.com • All rights reserved
Input/Output
Input Parameters
01 = Output number Specifies which output signal to set.
0 = Out 0
1 = Out 1
2 = Out 2
02 = Type Delay from trigger
When triggered by the Trigger In signal, it waits
for the Delay time before setting the output to
Signal Value. After the time in On duration, the
signal is reversed.
How and when to trigger is set in the 'Grab
setup' tool.
Delayed Waits for the Delay time before setting the
output to Signal Value. After the time in On du-ration, the signal is reversed.
Pulse on Starts a pulsing output. Immediately sets the
output to high for the time in On duration, then
sets it to low for the time in Off duration. This is
repeated until a 'Set timed output' tool is exe-
cuted with Type set to Pulse off, the output
is set by another tool, or the camera is powered
down.
Pulse off Stops a pulsing output that has been started by
a 'Set timed output' tool with Type set to
Pulse on,
Fixed on Immediately sets the output to high.
Fixed off Immediately sets the output to low.
03 = Delay time (ms) The delay time when Type is set to Delay from trigger
or Delayed. 0 – 10.000 ms.
04 = On duration (ms) The time during which the signal is set to Signal value (Type is
Delay from trigger or Delayed) or high (Type is Pulse
on). 0 – 10.000 ms.
05 = Off duration (ms) The time during which the signal is set to low when Type is set
to Pulse on. 0 – 10.000 ms.
06 = Signal value Specifies how to set the output signal when Type is set to
Delay from trigger or Delayed.
Can be set to High or Low.
Returned Values
None

Reference Manual Chapter 4
IVC-3D
©SICK AG • Advanced Industrial Sensors • www.sick.com • All rights reserved 235
Input/Output
Set Output by Distance This tool is used when an output shall be activated at a specified conveyor belt position
based on encoder pulse counting.
The method to use encoder pulses makes it possible to create applications that are
insensitive to different conveyor belt speeds or speed variations. It is possible to control
the length of the output signal either depending on encoder pulse counting or depending
on time.
The tool calculates the number of pulses between the start position and the requested
output position by using internal information about number of profiles per mm from the
Grab Setup tool and the delay distance input parameter. The encoder value for the start
position can be retrieved as an output from the Grab tool.
Each output number has a separate queue where up to a hundred encoder based output
requests can be waiting for activation to allow for several inspections between the camera
and the output position. The output requests of each queue are then activated when the
encoder pulse counter reaches the correct position. Each element in the queue holds
information about the Delay and Duration distances as well as the timeout.
The tool can operate in two modes; allowing only discrete outputs or allowing outputs to
overlap. This is controlled by the parameter Allow overlap. If the parameter is set to True,
two overlapping outputs will be merged into one. This mode can be useful in situations
where the output duration is set high outside the object (before and/or after) in combina-
tion with objects lying close together.
The tool returns the encoder positions where the output shall be activated and deacti-
vated. Note that if the parameter Allow overlap is set to True, the values may be for a
merged output.
The Encoder control must be selected in the Grab Setup in order to use this tool.
Input Parameters
01 = Delay distance (mm) The distance from the start position to the position
where the output should be activated.
02 = Start tick Encoder value at the start position.
03 = Signal value Indicates if the active period is a high or low value on
the output signal.
04 = Pulse on duration (mm) The distance during which the output should be
active. If the value is 0, only timeout will be used.
05 = Timeout (ms) The maximum time that the output shall be active. If
the value is 0, no timeout will be used.
06 = Output number The output that should be activated. There are three
available outputs 0, 1, 2.
07=Allow overlap If set to True, outputs may be merged if they overlap.
The default setting is False.
Returned Values
01 =ON tick Encoder value when the output will be activated.
02 = OFF tick Encoder value output will be de-activated.
Error Messages
Err. = 7950 Delay Distance is too long. The number of encoder pulses may
not be larger than the encoder wrap value (set in Grab Setup)
Note:
The Emulator does
not emulate this
tool. See section
Handling the
Emulator for more
information.

Chapter 4 Reference Manual
IVC-3D
236 ©SICK AG • Advanced Industrial Sensors • www.sick.com • All rights reserved
Input/Output
Err. = 7951 Invalid distance. Outputs may not be added too close to the
current position.
Err. = 7952 Invalid position. New output may not overlap current output.
Err. = 7953 The queue is full.
Err. = 7954 Synchronization error.
Err. = 7955 Invalid parameter in Grab Setup. Encoder control must be
selected.
Err .= 7956 The output queue already contains one or more elements with
a different setting of the Allow overlap parameter.

Reference Manual Chapter 4
IVC-3D
©SICK AG • Advanced Industrial Sensors • www.sick.com • All rights reserved 237
Input/Output
Clear Output Queues This tool will remove output requests added to the output request queues by the Set Output by Distance tool.
If the step program using the Set Output by Distance tool is stopped and restarted, the
queued elements will remain in the queues. This can lead to undefined behaviour if the
conveyor belt is moved, or items on the belt are moved during the time when the step
program was not executed.
Input Parameters
01 = Output queue 0 Ignore The contents of the queue and the
output will not be affected.
Signal High The queue will be cleared and the
output is set to high.
Signal Low The queue will be cleared and the
output is set to low.
02 = Output queue 1 The parameter can have the same values as Output queue 0
03 = Output queue 2 The parameter can have the same values as Output queue 0
Returned Values
None
The Emulator does
not emulate this
tool. See section
Handling the
Emulator for more
information.

Chapter 4 Reference Manual
IVC-3D
238 ©SICK AG • Advanced Industrial Sensors • www.sick.com • All rights reserved
Input/Output
Get Encoder Tick This tool returns the current encoder value and is used for synchronization with external
equipment.
This tool requires FPGA 1.5.0.12 that is available in IVC-Studio 2.6 SR1 or later versions.
Input Parameters
None
Returned Values
01 = Encoder Tick Current encoder value.
Note:
The Emulator does
not emulate this
tool. See section
Handling the
Emulator for more
information.

Reference Manual Chapter 4
IVC-3D
©SICK AG • Advanced Industrial Sensors • www.sick.com • All rights reserved 239
Input/Output
Encoder Difference This tool is used to calculate the difference between two encoder positions. It returns three
values:
• The difference in number of encoder ticks
• The distance in mm between the two positions
• The number of profiles captured between the two positions
The tool handles the case when the encoder has wrapped i.e. when value B is lower than
value A.
To use this tool in a program, Encoder controlled must have been selected in the Grab
setup tool and Pulses per mm must be set.
Encoder values can be taken from the returned values of the ‘Get Encoder Tick’ step, or
‘Grab’ step.
This tool requires FPGA 1.5.0.12 that is available in IVC-Studio 2.6 SR1 or later versions.
Input Parameters
01 = Encoder value A The first encoder value
02 = Encoder value B The second encoder value
Returned Values
01 = Difference in ticks
02 = Difference in mm
03 = Number of profiles
Notes:
The Emulator does
not emulate this
tool. See section
Handling the
Emulator for more
information.

Chapter 4 Reference Manual
IVC-3D
240 ©SICK AG • Advanced Industrial Sensors • www.sick.com • All rights reserved
Input/Output
Set LED This tool sets the color of the LED with the label “function” on the device, or turns it off.
Input Parameters
01 = Set LED Select one of the four options: Off Green on Red on Yellow on
Returned Values
None
Reference Manual Chapter 4
IVC-3D
©SICK AG • Advanced Industrial Sensors • www.sick.com • All rights reserved 241
Reader
4.13 Reader
Read Barcode The Read barcode tool is used for reading linear barcodes in images. The tool can read the
following barcode formats:
Pharmacode Code 32
EAN-8 Code 39
EAN-13 Code 128
UPC-A Interleaved 2of5
UPC-E Code 2/5 industrial
PDF417
This tool has an interactive setup in which you can set the input parameters and immedi-
ately see how the result is affected by the changes. The interactive setup is opened by
double-clicking the Setup button.
This tool has a number of options for improving the reliability of the reading, but which also
may affect the execution speed:
With the Interpolation method parameter you can choose which interpolation method
to use for analyzing the thickness of the bars.
Setting the Variable bar length parameter can compensate for differences in thickness
of the bars, for example if the barcodes are viewed from an angle, or if they are
wrapped around a bottle.
By setting the Normalization parameter, the images will be normalized before reading
the barcode to reduce variations in exposure, which may make the reading more accu-
rate.
If the barcode type supports checksums, the tool will verify the read barcode if the Use checksum parameter is set.
The tool returns the code that was read as a string in Read string. In addition Edge has defects indicates whether there was any dark areas found in the edge of the barcode.
When reading Pharmacode barcodes, the tool returns a quality factor for the reading in
Reading reliability. This quality factor is the percentage of the readings that were success-
ful, based on the number of reading set by the Max number of readings parameter.
The reading of PDF417 barcodes requires stable lighting conditions and at least 3.5 pixels
per “cell” in the barcode to perform reliably.
Input Parameters
01=Source bank Image bank containing the image with the barcode
to be read.
02=ROI definition step The program step where the ROI was defined.
03=Code type The type of barcode to read.
04=Max number of readings The maximum number of times the tool should try
to read the barcode before reporting an error.
Chapter 4 Reference Manual
IVC-3D
242 ©SICK AG • Advanced Industrial Sensors • www.sick.com • All rights reserved
Reader
05=Reading direction The direction in which to read the barcode.
Horizontal reads the barcode from both from
left to right and from right to left.
Vertical reads the barcode in both directions: up
and down.
Left->right reads the barcode left to right.
Right->Left reads the barcode right to left.
Down->up reads the barcode down and up.
Up->Down reads the barcode up and down.
06=Relative threshold Required change of height value between bars and
spaces.
07=Interpolation method Method to use when analyzing the thickness of the
bars:
Linear
Third-degree
08=Variable bar lengths Specifies whether or not the bars in the image of
the barcode can have different thickness.
09=Normalization Specifies whether or not the height value in the
image should be normalized before reading the
barcode.
10=Display code Specifies whether or not the read code should be
added to the image in the destination bank.
11=Use checksum Specifies whether or not the read code should be
verified using the checksum in the barcode.
Checksums are only used in certain barcode types.
12=Min number of characters The minimum number of characters to be read for
the barcode to be considered valid.
13=Destination bank Image bank in which the resulting image will be
stored.
Returned Values
01=Error flag Flag = 0 if the barcode was read without problems.
02=Read string A string containing the code that was read.
03=Reading reliability For Pharmacode barcodes, the percentage of the read-
ings that were sucessful.
04=Edge has defects Flag = 1 if there was any dark areas found in the edge
around the barcode

Reference Manual Chapter 5
IVC-3D
©SICK AG • Advanced Industrial Sensors • www.sick.com • All rights reserved 243
Grab Setup
5 Interactive Setups
Grab Setup The Grab setup tool is used for setting up the IVC-3D camera before capturing profiles or
3D images with it. The effects of the settings are previewed as the profile inside the white
box in the right pane in the window.
Figure – The Grab Setup interactive setup window The IVC-3D can be set up to capture either single profiles, or 3D images where each
image is made from a number of profiles. In addition it may be necessary to adjust the
measurement settings in order to improve the quality or rate of the images.
Even though the IVC-3D camera is capable of capturing a large number of profiles per
second, there is a limit for how much data the camera can handle. In a time critical applica-
tion it may be necessary to balance size, resolution and speed in order to get a satisfac-
tory result from the analysis. A large image takes longer time to capture, which will reduce
the maximum number of the images that the camera can produce per second.
The interactive setup helps keeping track of the limits of the camera. If a value is set
outside the currently valid range, it is marked with red. The same will happen if one setting
affects the valid range of another setting, so that the latter value comes outside the new
valid range.
Figure – Parameter values outside the valid range are marked with red
Valid range

Chapter 5 Reference Manual
IVC-3D
244 ©SICK AG • Advanced Industrial Sensors • www.sick.com • All rights reserved
Interactive Setups
Capturing Profiles
Field of View
The field-of-view (FOV) is the area within the laser plane in which the device will look for a
profile to capture. The parts of a profile that are outside the FOV are either ignored (if to
the right or the left of the FOV) or treated as missing data (if above or below the FOV).
Figure – The field of view (FOV) and captured profile Both the size and the location of the FOV affect the maximum profile rate.
The resolution of the resulting profile (width resolution) can be set in three ways:
Manually
Automatically – the resolution will be set to 75% of the maximum resolution.
Square pixels – used when capturing 3D images to get the same resolution along the X
axis as along the Y axis in the resulting images.
The maximum width resolution depends on which measurement method is use; Robust or
High resolution.
Note that the width of the FOV will be adjusted so that the width of a profile will always be a
multiple of 32 pixels.
FOV Height
FOV Width
Missing data
Ignored

Reference Manual Chapter 5
IVC-3D
©SICK AG • Advanced Industrial Sensors • www.sick.com • All rights reserved 245
Grab Setup
Reference Level
The reference level is a line across the profile where the height is considered to be the
same. This level can be rotated, for example to compensate for the device not being
mounted parallel with the axis along which the height should be measured.
Note that when the reference level is rotated, the IVC-3D will still be measuring in a FOV
that is aligned with the device, but that the captured profile will be adjusted before being
made available for the step program.
Figure –Measuring with a rotated IVC-3D
Triggering Profiles
The IVC-3D captures profiles in either free-running mode or triggered by an encoder:
In free-running mode, the device will capture a new profile after a constant time interval,
determined by the Profile rate setting. The actual distance between two profiles de-
pends on the speed of the object.
When triggered by an encoder, the device will capture a new profile when the object has
moved a constant distance, which is set by the Profile distance setting. The time between
capturing two profiles depends on the speed of the object.
The shortest time between two profiles is determined by the Max profile rate setting. If
the encoder runs faster than this – that is, triggers profiles faster than the device can
produce them – profiles may be lost.
The highest possible profile rate is shown in the interactive setup window as the upper limit
of the Profile rate/Max profile rate setting. This rate is affected by the size and location of the
FOV, and the measurement settings.
No measurement is made here
Without rotating the reference level
Rotating the reference level

Chapter 5 Reference Manual
IVC-3D
246 ©SICK AG • Advanced Industrial Sensors • www.sick.com • All rights reserved
Interactive Setups
Capturing 3D Images
3D images are generated from a sequence of captured profiles. The resolution of the 3D
image depends on settings for capturing profiles:
The resolution along the X-axis is the same as the
width resolution for the profiles.
The resolution along the Y-axis is defined by the
distance between two profiles, which is set by Profile distance.
When Profile triggering is set to Encoder controlled, this
will be the true distance between the profiles.
When set to Free-running, it is the assumed distance
between two profiles. The actual distance depends on
the speed of the object – that is, how far the object
has moved during the time between the profiles. This
time is specified by the Profile rate setting.
To capture 3D images where the objects have the right
proportions, set the width (X) resolution to Square pixels. Triggering 3D Images
There are three different ways to trigger an image – that is, when to capture the first profile
in the image:
Free running A new image will be started as soon as the previous image is
ready.
Trigger by input signal A new image is started when the Trigger In signal becomes
high.
Trigger by program step A new image is started when a 'Grab on command' tool is
executed in a step program.
Figure – Methods for triggering 3D images
Free running
Trigger by input signal or by program step
Overlapping (in free running)
Trigger In signal
X (width)
Y
(length)
Overlapping profiles

Reference Manual Chapter 5
IVC-3D
©SICK AG • Advanced Industrial Sensors • www.sick.com • All rights reserved 247
Grab Setup
When capturing 3D images in free-running mode, it is possible to capture overlapping
images, which means that a number of profiles will be included in both the current and the
next image.
If the device is triggered to capture a new image before it is finished capturing an image,
that trigger is ignored and the device will continue capturing the image until finished.
Adjusting Exposure
The Exposure amount specifies the exposure when capturing a profile. The exposure is
specified as a percentage of the maximum possible exposure, which is usually limited by
the Profile rate/Max profile rate setting.
This setting works different depending on whether or not Flashed laser is selected:
When not selected, the exposure is controlled by adjusting the sensitivity of the sensor
inside the device.
When selected, the sensitivity of the sensor is set to maximum and the exposure is
controlled by adjusting the duration of the flashes.
Too much laser light may cause overexposure in some parts of the object, which leads to
lower measurement accuracy in those parts. It is therefore recommended to adjust the
exposure so that no important parts of the object are overexposed. In the preview, over-
exposed parts of the profile are colored red.
If an encoder is used and the speed of the objects varies, it is recommended to use
flashed laser. Since the time between two profiles may vary, the exposure of the object
would also vary if the laser would be on all the time. This may lead to lower profile quality,
but is avoided if using flashed laser.
For setups with continuous laser, the first profile of the image will be discarded and set to
missing data. The reason for this is that the sensor has been exposed to light for an
“infinite” time, and the pixels of the sensor are saturated. This is not the case when using
overlapping images, as the exposure of images is performed continuously preventing the
sensor from being over exposed.
Reflection handling
In some situations reflections from the objects could by mistake be interpreted as the
profile. The best way to avoid this is to adjust the FOV so the reflections are outside the
FOV. If this is not sufficient there three different methods for how to treat any reflections:
Normal Choose the height value with the highest intensity.
Top-most Choose the highest height value with intensity higher than the specified
threshold.
Bottom-most Choose the lowest height value with intensity higher than the specified
threshold.
z
a
b
z
x
Figure – Methods for handling reflections
Raw profile Intensity along a-b
Reflections Top-most
Normal
Bottom-most
Threshold Intensity

Chapter 5 Reference Manual
IVC-3D
248 ©SICK AG • Advanced Industrial Sensors • www.sick.com • All rights reserved
Interactive Setups
Settings
Field of View
The Field of view settings are used for setting the area within the laser plane in which the
device will look for a profile to capture. The current field of view is shown in the right pane,
together with the profile that the IVC-3D currently reads inside the FOV.
Height (mm) Stand-off (mm) Profile width (mm)
Sets the size and location of the field of view (FOV).
Measurement
The Measurement settings can be used for adjusting the quality of the profiles, and the
rate at which profiles can be captured. Note that the size and location of the FOV also
affects the valid profile rates.
Measurement mode Specifies which measurement method to use for detecting
the profile. The method with the highest accuracy also takes
longest time and vice versa
Changing measurement method will affect the maximum
profile rate.
Profile rate / Max profile rate
When profile triggering is free running, Profile rate sets the time
to wait before capturing a new profile.
When using an encoder, Max profile rate sets the highest rate
at which profiles should be captured.
Exposure amount When Flashed laser is not selected, sets the sensitivity of the
sensor inside the IVC-3D.
When Flashed laser is selected, sets the duration of the flash
as a percentage of:
- The time between two profiles, as set by Profile rate when
profile triggering is Free-running.
- The shortest time between two profiles, as set by Max profile rate when using an encoder.
Missing data threshold Sets the minimum brightness of a point on the profile to be
considered a valid height. If the brightness is lower than this
threshold, that point will be set to missing data.
Flashed laser Specifies whether or not to use flashing laser.
Profile Triggering
The Profile triggering settings are used for selecting between capturing profiles in free-
running mode or triggered by an encoder.
When using an encoder, the IVC-3D counts the number of pulses – or ticks – since the
camera was rebooted. This encoder tick value is returned with the profile or image by the
'Grab' tool, and can be used for example to synchronize other devices.
Free-running Profiles are captured after a specified time interval. The time
is set by Profile rate.
Encoder controlled Profiles are captured after a specified number of pulses on
the Encoder input. The number of pulses is set by Pulses per mm and Profile distance (mm).
Encoder tick counter wraps around at
When using an encoder, sets the highest value of the encoder
tick counter. When this value is reached, the tick count is
reset to 0.

Reference Manual Chapter 5
IVC-3D
©SICK AG • Advanced Industrial Sensors • www.sick.com • All rights reserved 249
Grab Setup
Analysis
The Analysis settings are used for selecting between capturing profiles or 3D images.
Single profile Specifies that the IVC-3D should capture profiles.
3D image with ... profiles When capturing 3D images, the number of profiles to use for
each image is set. This will also be the size of the 3D images
in pixels along the Y axis. The resolution along the Y axis is
determined by Profile distance (mm).
Width Resolution
The Width resolution settings are used for setting the resolution along the X axis in the
captured profiles or 3D images. The maximum possible width resolution depends on which
measurement method is used.
When setting width resolution, the width of the FOV may be adjusted so that the width of a
profile is always a multiple of 32 pixels.
Square pixels Sets the resolution along the X axis to be the same as the
profile distance in mm.
Automatic Sets the resolution along the X axis to 75% of maximum.
Manual (mm/pixels) Sets the resolution along the X axis, in mm/pixels.
Measurement method Robust Less sensitive to reflections and noise than
the High resolution method.
High resolution Has higher maximum width resolution than
the Robust method.
Reflection Handling
The Reflection handling setting is used for specifying how to handle reflections within the
FOV when detecting the profiles.
Normal Always use the height value with the highest intensity.
Top-most Use the highest height value with intensity above the Intensity threshold.
Bottom-most Use the lowest height value with intensity above the Intensity threshold.
Intensity threshold When reflection handling is set to Top-most or Bottom-most, sets the lowest intensity for a height value to be considered a
point on the profile.
Profile Triggering
The Profile triggering settings affect the triggering of profiles when using an encoder. When
not using an encoder, Profile distance is still relevant for specifying millimetre- resolution
along the Y-axis.
Pulses per mm This parameter should be set to the number of pulses that the
connected encoder gives per millimetre. This setting is ignored
when no encoder is used (when Profile triggering is set to Free
running).
Profile distance (mm) This setting always decides the profile distance in millimetres
(Y-resolution), but has different effect for Free Running and
Encoder Controlled profile triggering.
When using an Encoder, the parameter defines the actual
distance between every profile the IVC-3D acquires, provided
Pulses per mm is correctly defined.
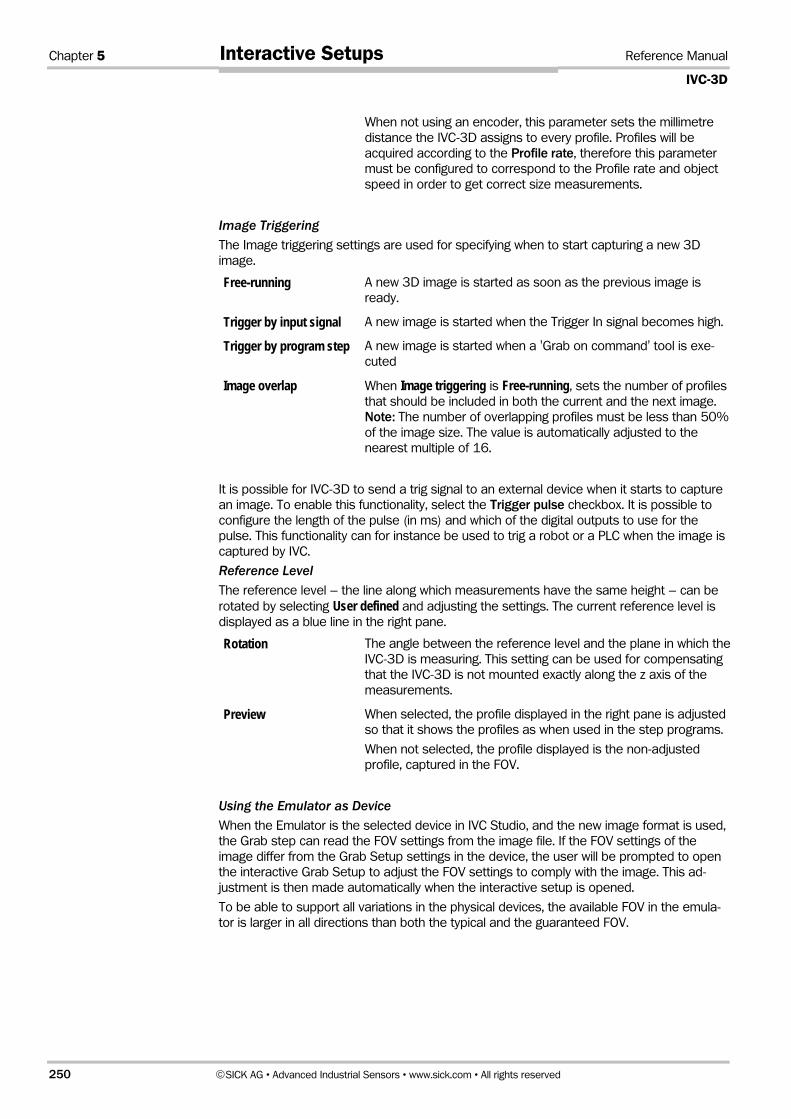
Chapter 5 Reference Manual
IVC-3D
250 ©SICK AG • Advanced Industrial Sensors • www.sick.com • All rights reserved
Interactive Setups
When not using an encoder, this parameter sets the millimetre
distance the IVC-3D assigns to every profile. Profiles will be
acquired according to the Profile rate, therefore this parameter
must be configured to correspond to the Profile rate and object
speed in order to get correct size measurements.
Image Triggering
The Image triggering settings are used for specifying when to start capturing a new 3D
image.
Free-running A new 3D image is started as soon as the previous image is
ready.
Trigger by input signal A new image is started when the Trigger In signal becomes high.
Trigger by program step A new image is started when a 'Grab on command' tool is exe-
cuted
Image overlap When Image triggering is Free-running, sets the number of profiles
that should be included in both the current and the next image.
Note: The number of overlapping profiles must be less than 50%
of the image size. The value is automatically adjusted to the
nearest multiple of 16.
It is possible for IVC-3D to send a trig signal to an external device when it starts to capture
an image. To enable this functionality, select the Trigger pulse checkbox. It is possible to
configure the length of the pulse (in ms) and which of the digital outputs to use for the
pulse. This functionality can for instance be used to trig a robot or a PLC when the image is
captured by IVC.
Reference Level
The reference level – the line along which measurements have the same height – can be
rotated by selecting User defined and adjusting the settings. The current reference level is
displayed as a blue line in the right pane.
Rotation The angle between the reference level and the plane in which the
IVC-3D is measuring. This setting can be used for compensating
that the IVC-3D is not mounted exactly along the z axis of the
measurements.
Preview When selected, the profile displayed in the right pane is adjusted
so that it shows the profiles as when used in the step programs.
When not selected, the profile displayed is the non-adjusted
profile, captured in the FOV.
Using the Emulator as Device
When the Emulator is the selected device in IVC Studio, and the new image format is used,
the Grab step can read the FOV settings from the image file. If the FOV settings of the
image differ from the Grab Setup settings in the device, the user will be prompted to open
the interactive Grab Setup to adjust the FOV settings to comply with the image. This ad-
justment is then made automatically when the interactive setup is opened.
To be able to support all variations in the physical devices, the available FOV in the emula-
tor is larger in all directions than both the typical and the guaranteed FOV.

Reference Manual Chapter 5
IVC-3D
©SICK AG • Advanced Industrial Sensors • www.sick.com • All rights reserved 251
Shape Locator Interactive Setup
Shape Locator Interactive Setup The interactive setup for the Shape Locator is used to fine tune the parameters for the
locator algorithm. The possibility to interactively teach the camera a reference shape is
available via the Add Shape and Edit Shape buttons.
Figure – The Shape Locator interactive setup
Image banks
The source bank holds the live image in which the matching is performed. The destination
bank will hold a visualization of the resulting shape (-s).
Reference shape
The reference shape used in the matching process is stored in a data block in the memory
of the camera. From the interactive setup it is possible to add a new data block containing
a reference shape, edit the contents of an existing data block, or permanently delete a
data block from the working memory.
The Add Shape and Edit shape buttons open the Add/Edit Shape Interactive Setup, see
page 254.
Note: A data block created by the Add Shape Runtime tool cannot be edited. The reason
for this is that the Teach ROI used in runtime can be of arbitrary shape and no definition of
this is stored in the data block.
ROI settings
It is possible to search the full image, or to specify a rectangle area in order to limit the
search. The tool behavior is depending on these settings; if the full image is searched,
shapes that are partly outside of the image are also found. If a search ROI rectangle is
specified, only shapes with all edges inside the ROI are returned.
Match Settings
In addition to the settings in the data block, there are some runtime parameters that affect
the performance of the tool. The scale of the shape can be allowed to vary up to ±20%. It

Chapter 5 Reference Manual
IVC-3D
252 ©SICK AG • Advanced Industrial Sensors • www.sick.com • All rights reserved
Interactive Setups
is also possible to allow the shapes to be rotated. The Rotation tolerance parameter is
specifying this tolerance in degrees. I.e. ±180 means that full rotation is allowed. By not
allowing scale or rotation tolerances it is possible to optimize the execution time of the tool. Limiting the number of shapes that the tool shall look for is also affecting the performance,
as poor matches are discarded early in the process. The same can be said for the Min score parameter.
The Overlap distance parameter is recommended only for advanced users. It controls the
performance of the tool in difficult situations, such as cluttered images. By reducing the
allowed overlap distance, matches that are too close (closer than the overlap distance) are
regarded as duplicates and only the one with the highest score will continue through the
process. The overlap distance is based on the center of gravity of the reference shape (i.e.
the center point of the Teach ROI). This point is visualized in the interactive setup for Add
Shape as a blue circle with a cross.
The example below shows how the Overlap Distance parameter affects the result of the
matching algorithm. The top image shows the reference shape with the center of gravity
marked with a blue cross. The two lower images show the results with different Overlap Distance settings.
Reference shape with center of gravity
Result with Overlap Distance set to 100
pixels
Result with Overlap Distance set to 200
pixels
Result Handling
If more than one shape is located, it is possible to specify the order in which the shapes
are returned by the tool. It is possible to sort the shapes by any of the attributes (x, y,
scale, angle, score), and if the shapes shall be returned in ascending or descending order.
It is also possible to sort the shapes by the distance to a user specified sorting point. In
this case, the shapes are sorted by the distance (measured in pixels) between the refer-
ence point of the shape and the specified sorting point.
If a table index is specified, information about all shapes will be stored in the table starting
at the specified index.
It is also possible to limit the execution time of the algorithm. This can be useful in situa-
tions where the total cycle time is limited. If the algorithm returns prematurely, the Search
Status result will indicate if the returned shapes are valid or not.

Reference Manual Chapter 5
IVC-3D
©SICK AG • Advanced Industrial Sensors • www.sick.com • All rights reserved 253
Shape Locator Interactive Setup
Finally, it is possible to determine how the results shall be visualized in the destination
bank. It is possible to show the first shape (by the specified sorting order), all shapes, or no
shapes at all.
Results
The tool will return information about the overall search status, and the number of shapes
that was found. In addition to this information about the first shape is returned. The interac-
tive setup can show information about all shapes, but this is only available in the GUI and
not in the step program.
Replacing the Source image
It is possible to replace the image currently stored in the Source bank. This is done by
clicking the Grab new image button. If the emulator is used, the next image from the
specified image folder will be retrieved. This functionality is not available if a camera is
used.
The Live button executes the Shape Locator tool and grabs new images continuously. The
result is displayed in the Interactive setup window. The continuous execution is stopped by
clicking the button once again. The Live button is only available for the emulator.

Chapter 5 Reference Manual
IVC-3D
254 ©SICK AG • Advanced Industrial Sensors • www.sick.com • All rights reserved
Interactive Setups
Add/Edit Shape Interactive Setup The interactive setup for Add/Edit Shape is used to create a reference shape. The image
below shows an example where the Teach ROI consists of one rectangular ROI and one
elliptical Mask. The edges included in the reference shape are marked with green, and the
reference point is marked as a red cross. The blue circle with a cross indicates the centre
of gravity for the Teach ROI and it is used for the Overlap Distance parameter in the Shape
Locator tool.
Figure – The Add/Edit shape interactive setup
Image Banks
The Source bank specifies where the reference image is stored. It is recommended to not
use the same source bank as for the Shape Locator tool as this may lead to the image
data being overwritten during the execution of the step program.
Reference Shape
The ID of the data block that holds the reference shape is specified in the Shape Locator
GUI and cannot be modified in this interactive setup. IT is however possible to edit the
name of the data block.
Teach ROI Settings
The Add ROI and Add Mask buttons are used to create a Teach ROI that specifies the part
of the shape or image that shall be included in the reference shape. The Teach ROI is
created by adding one or more ROI:s and Masks to the reference image. A Teach ROI can
consist of up to 16 ROI:s and Masks, and must contain at least one rectangular or elliptic
ROI. Preferably, the Teach ROI shall cover only the interesting shape, and as little as possi-
ble of the surrounding parts of the image.
Each ROI and Mask can be moved, resized and rotated using the mouse.
The edges defining the reference shape are marked with green in the reference image.
Note that only edges within the Teach ROI are included in the reference shape. The refer-
ence shape must not be too small. In order to get a stable matching result, it is recom-

Reference Manual Chapter 5
IVC-3D
©SICK AG • Advanced Industrial Sensors • www.sick.com • All rights reserved 255
Add/Edit Shape Interactive Setup
mended to arrange the setup so that the edges of the shape cover at least 5% of the
image size.
Performance
Some settings affecting the performance of the tool are necessary to perform already
when creating the reference shape. The Edge strength slider controls the number of edges
included within the Teach ROI. A reference shape containing too many edges may slow
down performance.
The sliders for Robustness and Accuracy are used for trade-off between execution per-
formance and the integrity of the results. For instance, in an application that is only used to
verify the presence of a shape within an image the Accuracy slider can safely be set to
High Speed. On the other hand, in an application where the exact position of the shape is
crucial, e.g. when picking objects, the slider will probably need to be pulled closer to High Accuracy. In situations where the image is cluttered with similar shapes or other forms of
distortion, the Robustness slider should be set to High Robustness.
Image handling
It is possible to zoom in and out of the image by using the Zoom buttons. E.g. if the Zoom in button is pressed, each mouse click in the image will zoom in around the clicked posi-
tion, and vice versa for the Zoom out button. The Pan button can be used to move the
visible part of the image when it is zoomed in. When the Pointer button is pressed, it is
possible to work with the ROI:s and Masks composing the Teach ROI using the mouse.
Reference point
This is an arbitrary point that can be specified anywhere in the reference image. The
reference point is marked with an encircled red cross. The position of the located shape
will refer to the position of this point. This point shall not be confused with the blue centre
of gravity of the Teach ROI which is used when discarding duplicate matches using the
Overlap Distance parameter in the Shape Locator tool.
The position of the reference point can either be specified by entering the exact coordi-
nates in the text boxes or by moving the point using the mouse. It is also possible to refer
to a table cell by entering “=Vn” where n is the index of the table cell.
Replacing reference image
It is possible to grab a new image to the reference bank by using the button Grab new image. In the emulator, the next image in the specified image folder will be fetched to the
source bank. This functionality is not available if a camera is used.

Chapter 5 Reference Manual
IVC-3D
256 ©SICK AG • Advanced Industrial Sensors • www.sick.com • All rights reserved
Interactive Setups
Locating Shapes (tips and tricks)
The purpose of the Shape Locator tool is to find the best possible match or matches of a
reference shape. This section holds important information on how to set up the tools, and
also some examples on how to use the combine the tools to achieve the best perform-
ance.
Basic description of the algorithm
The ‘Shape Locator’ tool identifies the major edges (contours) of any shape. These edges
are used to locate the position of the reference shape in a new image. The edge extraction
is based on local gray scale gradients and the tool is therefore relatively insensitive to
absolute gray scale level and shading effects.
The localization is performed in two steps
• Coarse pose (position, rotation, and scale) of the shape is found. This search only
considers the major edges of the shape, drawn green in the reference image. This
puts a lower limit on the size of the reference shapes and the details that can be
detected. The algorithm cannot locate shapes that cover less than 2% of the im-
age area.
• Fine tuning the coarse pose using the fine detail of the reference shape. So even
if the green major edges look somewhat rough, the fine-tuning will ensure sub-
pixel and sub-degree precision.
Different applications have different needs in trade-off between execution time on one
hand, and positioning robustness and accuracy on the other. The tool therefore has a
number of parameters to control this balance. The two most important settings are the
Robustness vs. Speed and Accuracy vs. Speed parameters. The Robustness trade-off
controls the first step, the coarse localization. For a clean high contrast image with a large
reference shape, the robustness trade-off can be set to high-speed. For cluttered or low
contrast images with a small reference shape, the robustness trade-off should be towards
high robustness.
The Accuracy trade-off controls the fine-tuning of the second step in a similar manner. For
applications where the sub-pixel accuracy requirements are high, the trade-off should be
set to high accuracy. For high speed applications, however, where precise positioning is
not needed, it can be set to high speed.
The tool may be sensitive to shape variations compared to the reference shape. Typical
causes of shape variations can be object variations or occlusion caused by lighting related
effects and/or partly covered objects. Moderate variations are handled, but affect the
score. Major variations may cause the tool to fail locating the shape.
The ‘Shape Locator’ tool can find several instances of the reference shape in one image
depending on the setting of the parameter Max number of shapes. The tool identifies the
shapes with the highest score and presents them in the search result.
Teach tips
The selection of edges defining the reference shape is an important key to a fast and
robust location of shapes. The reference shape edges are controlled by a combination of
the Region Of Interest (ROI) selecting a part of the reference image and the Edge strength
parameter setting the threshold for which gray scale gradients (i.e. variations in gray scale)
that should be regarded as an edge.
More edges will increase the execution time. Adjust the Edge strength parameter so that
the characteristic major edges of the shape are extracted but minor details are ignored.
Also select an Edge strength value where the extracted edges stay more or less constant
when the Edge strength value is varied around the selected value. This ensures that the
same edges will be extracted even if the illumination changes.

Reference Manual Chapter 5
IVC-3D
©SICK AG • Advanced Industrial Sensors • www.sick.com • All rights reserved 257
Locating Shapes (tips and tricks)
Excluding parts of the reference shape that may vary during runtime will improve the
robustness. Such variations may stem from the inspected objects themselves (e.g. varying
date codes on packages), from illumination effects (e.g. shadows or direct reflexes) or
from occlusion effects. Masks can be used to exclude the parts of the reference shapes
that are affected by variations.
If the ROI perimeter is used with the ‘Add Shape Runtime’ tool to define the ROI for the
reference shape, please use the filling 0 = internal to get all edges within the ROI.
Locate tips
The region of interest defines the area to be searched. If using a search ROI, only shapes
with all edges completely inside the ROI will be found.
If using the Search full image setting, also shapes with edges partly outside the image
may be returned in the search result. The criterion for being regarded inside using the
“Search full image” mode is that the center of gravity point of the ROI used when creating
the reference shape must be inside the image. Note that there therefore is a difference
between the “Search full image” mode and to search within a ROI covering the whole
image.
The value of the Edge strength parameter of the reference shape is also used when
searching for shapes. Having a similar contrast level in the reference image and in the
search image will therefore increase the robustness of the tool.
It is good practice to set the parameter Max number of shapes = 1 if only searching for
one shape. Using a higher value will lead to a longer execution time even if only one shape
is present in the image.
Advanced algorithm details
Lens distortion and perspective distortion of 2D images have a negative impact on both
the score and position results of the tools. Try to minimize these types of image distortion
if high robustness and accuracy is required.
The rotation handling of the tools is based on the assumption that the pixels are square.
Use the square pixels option in 3D grab setup. Encoder support is highly recommended for
3D applications if the Allow rotation option is used.
The polarity of an edge (going from dark to bright or vice versa) is significant for the locate
tool. The tool will give lower score if the polarity is switched for example by changing from a
bright to a dark background. The recommendation is to avoid edges that may change
polarity. One trick to improve robustness is to avoid outer edges and only include internal
edges if the background has variations.
The first steps of the algorithm only use the major edges to locate the position and orienta-
tion of the shapes. This may lead to problems for objects with rotational symmetry (more
than one possible match for the major edges) where the best rough match may turn out to
be in the wrong direction when later using all edges. This may result in the shape getting a
score below the score threshold.
Summary for improving speed and algorithm performance
To improve robustness and accuracy
Adjust the edge strength so that only the major edges of the shape are extracted.
Teach the whole shape to be found, not only a small detail.
Mask away edges that may vary between images.
Enable scale search.
Adjust the two trade-off parameters towards robustness and accuracy.
Increase the max number of shapes.
Reduce any clutter in the image.
To improve speed

Chapter 5 Reference Manual
IVC-3D
258 ©SICK AG • Advanced Industrial Sensors • www.sick.com • All rights reserved
Interactive Setups
Reduce the rotation search interval.
Disable the scale search.
Adjust the two trade-off parameters towards speed.
Decrease the max number of shapes.
Mask away extracted edges that are not part of the characteristic shape.
Reduce any background clutter in the image.
Environmental considerations
2D Select optics with low lens distortion.
Mount the camera straight to avoid perspective distortion.
Select an illumination that reduces direct reflections and shadows.
3D Use the square pixels option together with an encoder in the IVC-3D grab setup.
Mask away edges due to missing data areas that may vary between images.
Do not include edges that are result of occlusion.
Mount the camera straight to avoid skewed height data.
Examples on workflows
The suite of tools for locating shapes can be used in a number of various workflows. These
examples show some of the most common ways to use the tools. In all examples (exclud-
ing the last), the reference shape is created using the interactive setup Add/Edit Shape
available in the interactive setup for Shape Locator.
During the configuration phase of the development, the interactive setup for the Shape
Locator tool is used to create one or more reference shapes and to adjust the parameters
to the correct settings. Once the configuration is done, the Shape Locator tool is executed
directly from the step program, using the reference shape (-s) created during the configu-
ration.
Workflow Tools to use
Locate one object Shape Locator
Information about the shape is available as direct results
from the Shape Locator tool.
Locate multiple objects Shape Locator
Get Shape
Information about each shape is found either by calling Get
Shape for each shape or by reading the table.
Locate and inspect relative to the reference image Shape Locator
Transform Image
The image is moved and rotated so that the located shape
is placed in the same position as it was in the reference
image.

Reference Manual Chapter 5
IVC-3D
©SICK AG • Advanced Industrial Sensors • www.sick.com • All rights reserved 259
Locating Shapes (tips and tricks)
Locate and inspect relative to the located shape Shape Locator
Transform ROI
A ROI defined in the reference image is moved and rotated
to the position of the located shape.
Teach using external operator interface
ROI step
An arbitrary shaped ROI defined in the step program.
Add Shape Runtime
The reference shape is created during runtime by specify-
ing a source image and the ROI specified previously.
Shape Locator
Get Shape, Transform Image or Transform ROI

Chapter 5 Reference Manual
IVC-3D
260 ©SICK AG • Advanced Industrial Sensors • www.sick.com • All rights reserved
Interactive Setups
Find Line Edge This tool evaluates the changing of height values along a user defined straight line. This
enables to detect transitions/changes of height values along the line. The tool offers two
evaluation methods to detect transitions/changes of height values. You find the introduc-
tion of this tool in “Find line edge”.
Figure – Screenshot of interactive setup Find line edge. Upper left: input boxes for Input Parameters; upper right: displayed image with line and found transition points (red crosses) as overlay; lower left: result table with the coordinates of the found points; lower right: plots of a relative histogram, pixel values and derivation of pixel values along the line.
(This screenshot is for IVC-2D, but the principle is the same when using IVC-3D. The only difference is that the threshold values are in millimeters instead of gray level values.)
How to set Input Parameters:
Type the number of the source bank holding the desired image for evaluation and the
destination bank where the image, the line, and the found points are to be plotted. Make
sure that the evaluation bank is different from the destination bank.
Select the geometrical interpretation for the start and end points of the line by clicking the
input box with the caption Type. Select one of the three available options. The values are
shown in the four input boxes with the caption Line coordinates. Note that depending on
the selected geometrical interpretation the Line end X and Line end Y values have different
interpretations like delta X /delta Y or length and angle. You can setup the lines length and
position by directly editing the values in the input boxes, or more conveniently by using a
drag-and-drop operation. To use a drag-and-drop operation click the start or end point of
the line in the image and drag this point to the desired position. The starting point of the
line is indicated with a yellow dot.
To select the Evaluation Method select one of the options for threshold types.
Single meaning: Evaluation Method 1: Detect relative change of height values,
Multiple meaning: Evaluation Method 2: Detect absolute change of height values.

Reference Manual Chapter 5
IVC-3D
©SICK AG • Advanced Industrial Sensors • www.sick.com • All rights reserved 261
Find Line Edge
Depending on the chosen Evaluation Method set just one of or both the maximum and
minimum height threshold values by typing or selecting the values. A third option to set the
threshold is to move a horizontal line with the left mouse button in the plot of the height
values (lower right in the figure above). If you can’t see a horizontal line, pull it from the top
(upper threshold) or bottom (lower threshold) of the plot area.
Input Parameter Filter in pixels allows on average over up to 10 pixels in line direction. This
option is available with Evaluation Method 2: Detect absolute change of height values only.
To select an upper limit of how many found points should be stored in the table and the
table index for the first entry edit the input boxes with the caption Table settings.
Figure – Screenshot of the input boxes to set the Input Parameters.
Results
The total number of found transitions is displayed in the field Number of transitions found.
A table shows the table index number and the coordinates that are stored in the table
beginning with the first found pixel. The maximum number of shown and stored coordi-
nates depends on the selected value in the input field Max number of transitions.
Figure – Screenshot of the result table
Evaluation Method 2: Detect
absolute change of height
values
Selected geometrical interop-
eration for the start and end
points are Cartesian coordi-
nates
Line start point:
X and Y coordinates
Line end point:
X and Y coordinates
Values of coordinates start at table
index 1.
Up to 10 found points will be
Height values are averaged out
of “one” pixel along the line.

Chapter 5 Reference Manual
IVC-3D
262 ©SICK AG • Advanced Industrial Sensors • www.sick.com • All rights reserved
Interactive Setups
Coordinate Alignment The Coordinate alignment tool is used for aligning the IVC-3D’s coordinate system to an
external coordinate system (world coordinates).
The result from the tool is a transform, which is stored in a data block in the IVC-3D, and
can be used later by the 'Get calibrated point' tool to get aligned measurement values.
Figure –The Coordinate alignment interactive setup window.
To create a transform with the Coordinate alignment interactive setup, do the following:
• Grab a 3D image of a reference object, for example the SICK IVP Reference object.
1. You can use any 3D image stored in an image bank, or you can grab the 3D image
directly from the interactive setup window.
• Mark the reference points in the 3D image of the calibration object.
• Import the world coordinates for the reference points into the interactive setup.
• Click Save to calculate the transform and save it in a data block in the IVC-3D’s work-
ing memory. When the transform is calculated, the estimated transform error is dis-
played in the window.

Reference Manual Chapter 5
IVC-3D
©SICK AG • Advanced Industrial Sensors • www.sick.com • All rights reserved 263
Coordinate Alignment
Handling Movement of Objects
If the objects are moved between being inspected by the IVC-3D and being handled by the
external device, the external device should keep track of the movement, and should be
able to compensate the coordinates it receives from the IVC-3D with the movement.
The IVC-3D can send a trigger pulse to the device when it starts grabbing the image. The
device can use this trigger pulse to determine where the object is located at certain time,
for example by resetting an encoder counter. To have the IVC-3D to send the trigger pulse,
select the Trigger pulse option in the 'Grab setup' interactive setup.
1 2
3 4
2 0 6 230 0 0 0
4 3 0 9 4 3 0 9
x y z8 12 9
31 12 98 36 9
31 36 920 24 16...
x y z8 12 9
31 12 98 36 9
31 36 920 24 16...
Figure –Aligning the IVC-3D to a robot’s coordinates when objects move between being inspected and being handled by the robot:
1. Grab a 3D image of the reference object. The IVC-3D sends a trigger pulse to the robot when it starts grabbing.
2. Mark the reference points in the 3D image and move the object to the robot. The robot uses an encoder to keep track of the object’s movement.
3. Get the robot’s coordinates for the reference points.
4. Import the robot’s coordinates – if necessary, adjusted by the movement – to the IVC-3D, and calculate the transform.
Trigger pulse

Chapter 5 Reference Manual
IVC-3D
264 ©SICK AG • Advanced Industrial Sensors • www.sick.com • All rights reserved
Interactive Setups
Grabbing 3D Images
To grab a 3D image from the interactive setup window, an encoder must be connected to
the IVC-3D, and the IVC-3D must be set up in the following way:
Profile triggering is set to Encoder controlled
Analysis is set to 3D image
Image triggering is set to Trigger by input signal or Trigger by program step.
To grab a 3D image, click Grab image. If the IVC-3D is set to be triggered by a program
step, the image grabbing will start immediately; otherwise the IVC-3D will wait for the
external trigger input before the grabbing starts.
Note that the grabbed image will be stored in the image bank selected in the Image bank
field, replacing any previous mage in that bank.
Marking Reference Points in IVC Studio
There are two different methods used for marking the reference points, depending on
which calibration object that is used:
SICK (IVCAL) The interactive setup locates the reference points inside the ROIs that are
placed over each point.
For the best result, each ROI should be placed so that it almost covers the
cone. If the entire cone is inside the ROI, measurement data from the edge of
the cone may affect the locating of the top of the cone.
Custom Mark the reference points by placing a cross on each point.
A custom calibration object should have at least 4 reference points, which should not be
located in the same plane. Ideally, the reference points should put up the entire volume in
which to measure.
Regardless of which calibration is used, it is important that the order of the reference
points is the same as the order in which the points are measured in the external coordi-
nate system.
OK Not recommended
Reference point

Reference Manual Chapter 5
IVC-3D
©SICK AG • Advanced Industrial Sensors • www.sick.com • All rights reserved 265
Coordinate Alignment
Figure – A SICK (IVCAL) calibration object.
Importing Coordinates from the External System
The world coordinates for each reference point can either be entered into the table on the
Robot points tab in the interactive setup, or imported from a file.
To import external coordinates from a CSV file, do the following;
1. Make sure that the number of number of coordinates for each reference point is
entered in the Measurements/point field on the General tab.
2. Click Import coordinates on the Robot points tab.
You can edit the imported values for each point directly in the table. If you should need to
remove or add measurements from the list, you need to remove or add them in the file
and import that file again. Note that when importing coordinated from a file, any existing
values in the table will be replaced by the imported values.
The file containing the coordinates should have the following format:
xA1;yA1;zA1;xA2;yA2;zA2; ... ;xAn;yAn;zAn<return>
xB1;yB1;zB1;xB2;yB2;zB2; ... ;xBn;yBn;zBn<return>
xC1;yC1;zC1;xC2;yC2;zC2; ... ;xCn;yCn;zCn<return>
...
where:
xA1 is the x coordinate for the first measurement of reference point A,
xA2 is the x coordinate for the second measurement of reference point A,
xB1 is the x coordinate for the first measurement of reference point B,
etc.
Important: The following rules apply to the format of the file with external coordinates.
• Measurements for all reference points must be entered.
• All points must have the same number of measurements.
• There must be a <return> after the last line of values.
• Each value shall be separated by a semi-colon.
• There shall be no semi-colon after the last value on each line.

Chapter 5 Reference Manual
IVC-3D
266 ©SICK AG • Advanced Industrial Sensors • www.sick.com • All rights reserved
Interactive Setups
Communication Setup The Communication setup tool is used for specifying which values the device should
publish and subscribe to, and whether to use the Ethernet/IP or the OPC protocol for the
communication.
This tool only specifies the values that should be read from or written to the network. The
actual reading and writing of values occurs when a 'Communication Read/Write' tool is
executed.
Figure – The Communication Setup dialog box
The Interactive
Setup for this tool
is not available
when using the
Emulator.

Reference Manual Chapter 5
IVC-3D
©SICK AG • Advanced Industrial Sensors • www.sick.com • All rights reserved 267
Communication Setup
Subscribing to and Publishing Parameters
The IVC device uses an internal buffer for sharing parameter values with other devices on
the network. This buffer is divided into two parts:
Input External devices can write parameter values to this part, which are then
copied to the active table in the IVC device.
Output The IVC device writes table values, program step results, or constant
values to this part. The values can then be read from here by the external
devices.
The 'Communication setup' tool is used for specifying which parameter in the buffer that
should be mapped to a certain value in the IVC device’s working memory. The synchroniza-
tion between the buffer and the working memory is made when a 'Communication
read/write' tool is executed.
�����
�����
���
������
����
���
�����
�����
���
������
����
���
Figure – Reading and writing values in the IVC’s buffer.
Parameter Types
Each parameter in the buffer can store values of a certain type. The following types are
supported by the IVC devices:
Short integer SINT -128 … 127
Integer INT -32 768 … 32 767
Double integer DINT -2 147 483 648 … 2 147 483 647
Floating point REAL -3.40282347e+38 … 3.40282347e+38
Short string SSTRING 61 characters
Long string LSTRING 497 characters
Since an integer in the IVC’s working memory is always represented as a double integer
(4 bytes), integer values will automatically be converted when read or written between the
IVC’s working memory and the buffer, as long as the value fits into the value range of the
parameter type in the buffer.
In a similar manner, the IVC device will try to convert between floating point values and
integers, and between strings in the working memory (max 4096 characters), and
SSTRING:s (61 characters) and LSTRINGS (497 characters) in the buffer.
Ethernet/IP or OPC
PLC: get parameter value
PLC: set parameter value
Communication read/write Communication
read/write
Working Memory Table Program
Output Input
Buffer
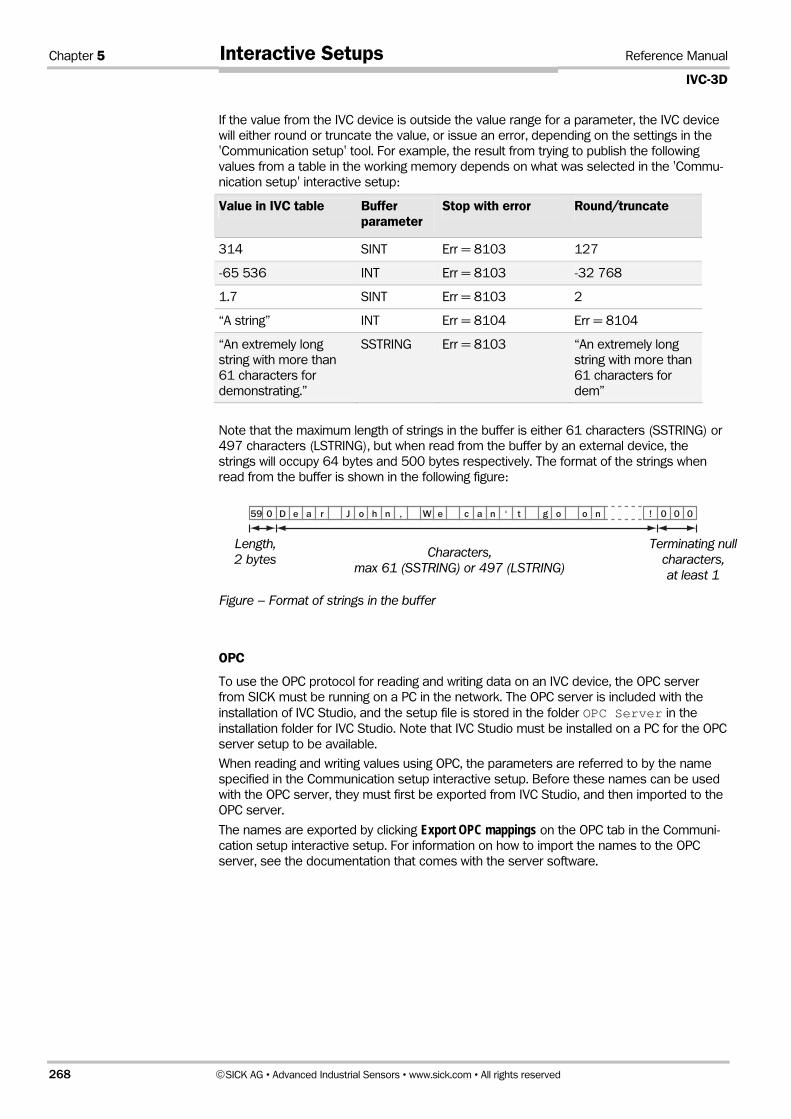
Chapter 5 Reference Manual
IVC-3D
268 ©SICK AG • Advanced Industrial Sensors • www.sick.com • All rights reserved
Interactive Setups
If the value from the IVC device is outside the value range for a parameter, the IVC device
will either round or truncate the value, or issue an error, depending on the settings in the
'Communication setup' tool. For example, the result from trying to publish the following
values from a table in the working memory depends on what was selected in the 'Commu-
nication setup' interactive setup:
Value in IVC table Buffer parameter
Stop with error Round/truncate
314 SINT Err = 8103 127
-65 536 INT Err = 8103 -32 768
1.7 SINT Err = 8103 2
“A string” INT Err = 8104 Err = 8104
“An extremely long
string with more than
61 characters for
demonstrating.”
SSTRING Err = 8103 “An extremely long
string with more than
61 characters for
dem”
Note that the maximum length of strings in the buffer is either 61 characters (SSTRING) or
497 characters (LSTRING), but when read from the buffer by an external device, the
strings will occupy 64 bytes and 500 bytes respectively. The format of the strings when
read from the buffer is shown in the following figure:
�� � � � � � � � � � � � � � � � � � � ��
Figure – Format of strings in the buffer
OPC
To use the OPC protocol for reading and writing data on an IVC device, the OPC server
from SICK must be running on a PC in the network. The OPC server is included with the
installation of IVC Studio, and the setup file is stored in the folder OPC Server in the
installation folder for IVC Studio. Note that IVC Studio must be installed on a PC for the OPC
server setup to be available.
When reading and writing values using OPC, the parameters are referred to by the name
specified in the Communication setup interactive setup. Before these names can be used
with the OPC server, they must first be exported from IVC Studio, and then imported to the
OPC server.
The names are exported by clicking Export OPC mappings on the OPC tab in the Communi-
cation setup interactive setup. For information on how to import the names to the OPC
server, see the documentation that comes with the server software.
Length, 2 bytes Characters,
max 61 (SSTRING) or 497 (LSTRING)
Terminating null characters, at least 1

Reference Manual Chapter 5
IVC-3D
©SICK AG • Advanced Industrial Sensors • www.sick.com • All rights reserved 269
Communication Setup
Ethernet/IP
When reading and writing to the IVC buffer using Ethernet/IP, there are a number of as-
semblies available that are defined in the IVC device.
When using the assemblies from a PLC, you select assembly type by specifying the as-
sembly instance number. This number is different depending on whether the assembly is
used for input or for output.
Note: “Input” and “output” here means from the IVC device’s point of view – that is,
the input assembly should be used when writing data to the IVC device, and the
output assembly is used for reading data from the IVC device.
The assemblies available when communicating with the IVC device using Ethernet/IP are
listed in the following table:
Name Description Input assembly instance
(to IVC device)
Output assembly instance
(from IVC device)
Allround All types represented (except
long string)
100 101
No strings More room for numbers 102 103
Large string One long string 104 105
Small Small set with all types 106 107
Please contact tech support if an assembly of another size/type is required.
Allround
Type No. of values Parameters Offset to first parameter
(bytes)
Size per value
SINT 10 SINT0 … 9 0 1 byte
INT 10 INT0 … 9 10 2 bytes
DINT 10 DINT0 … 9 30 4 bytes
REAL 10 REAL0 … 9 70 4 bytes
SSTRING 6 SSTRING0 … 5 110 64 bytes
LSTRING – – – 500 bytes
Total size 494 bytes
No strings
Type No. of values Parameters Offset to first parameter (bytes)
Size per value
SINT 50 SINT0 … 49 0 1 byte
INT 50 INT0 … 49 50 2 bytes
DINT 30 DINT0 … 29 150 4 bytes
REAL 50 REAL0 … 49 270 4 bytes
SSTRING – – – 64 bytes
LSTRING – – – 500 bytes
Total size 470 bytes

Chapter 5 Reference Manual
IVC-3D
270 ©SICK AG • Advanced Industrial Sensors • www.sick.com • All rights reserved
Interactive Setups
Large string
Type No. of values Parameters Offset to first parameter (bytes)
Size per value
SINT – – – 1 byte
INT – – – 2 bytes
DINT – – – 4 bytes
REAL – – – 4 bytes
SSTRING – – – 64 bytes
LSTRING 1 LSTRING0 0 500 bytes
Total size 500 bytes
Small
Type No. of values Parameters Offset to first parameter (bytes)
Size per value
SINT 10 SINT0 … 9 0 1 byte
INT 10 INT0 … 9 10 2 bytes
DINT 10 DINT0 … 9 30 4 bytes
REAL 10 REAL0 … 9 70 4 bytes
SSTRING 1 SSTRING0 110 64 bytes
LSTRING – – – 500 bytes
Total size 174 bytes
Using the Interactive Setup Dialog Box
Type Specifies the type of the parameter in the buffer,
Parameter (Ethernet/IP only) Specifies which parameter in the buffer to
map to. Parameters are made available by first selecting the
parameter type in the Type column.
Source/Destination The table row, program step result or constant value to be
written to the selected parameter in the output buffer, or the
table row in which to write the value from the parameter in the
input buffer.
Name For Ethernet/IP, the name is only used for display in the
interactive setup dialog box.
For OPC, the name is the name that is used for referring to
the parameter from the external device.
Preview Shows the current value of the selected parameter in the
buffer.
A 'Communication read/write' tool must have been executed
before opening the interactive setup dialog box, otherwise this
column will be empty.
Export mapping as text Saves the settings made in this interactive setup to a text file.
Rounding/truncation handling
Specifies whether the IVC device should, if necessary, round
or truncate the value before writing the value to the buffer.

Reference Manual Chapter 5
IVC-3D
©SICK AG • Advanced Industrial Sensors • www.sick.com • All rights reserved 271
Binarize Setup
Binarize Setup The Binarize Interactive Setup creates binary images based on images in the Source Bank.
For an introduction to the tool, see Binarize on page 83.
Figure – The Binarize Interactive Setup window.
Input/output
Choose an image for the Binarize tool by typing the number of the Source bank that
contains the desired image. Also choose a storage place for the resulting binarized image
by typing the number of a Destination bank.
Select a ROI from a previous program step.
Binarization Thresholds
Select a Threshold Mode for setting the upper and lower thresholds for the binarization
operation. Choose Manual to set the upper and lower thresholds yourself by dragging the
threshold bars. Choose an automatic mode when you know that the threshold level will
shift from scan to scan. You can use an automatic mode first to find suitable thresholds
while configuring the tool, and then switch to manual mode. The manual thresholds are
updated to the values found by the automatic method.
Using the automatic threshold options makes the tool a bit slower.
Display
Click the Display Source button to display the source image.
Click the Display Result button to display a visual representation of the results. Pixels
within the range are white, unless the inverted threshold mode is used.
The image is by default stretched to fill the preview window. Click the Fit to Window button
to toggle between showing a stretched image and showing the image in its original size.
The stretching does not preserve the aspect ratio of the image. It is only when showing the
image in its original size that one pixel on the screen represents one pixel of the image.
Note:

Chapter 5 Reference Manual
IVC-3D
272 ©SICK AG • Advanced Industrial Sensors • www.sick.com • All rights reserved
Interactive Setups
Blob Finder Setup The Blob Finder tool finds connected pixels, called blobs, within a specified value range. For
an introduction to the tool, see Blob Finder on page 126. All found blobs are stored inter-
nally, and can be analyzed by the Blob Analyzer tool.
Figure - The interactive setup window for Blob Finder. Left side Input parameters for the Blob Finder tool
Image area Displays either the source image or the result. In the figure, the area outside the Region of interest is blue. One blob is found with the cur-rent parameter settings, and it is marked in bright red. The dark red areas are blobs that are discarded, one because it is an edge blob and the others because their areas are too small.
Blob list The blobs found with the current settings are listed below the image, sorted according to the Sorting-settings. The number of blobs listed depends on the Max number of blobs in table setting.
Input/Output
Choose an image for the Blob Finder by typing the number of the Source bank that con-
tains the desired image. Also choose a storage place for the resulting image with found
blobs by typing the number of a Destination bank. Make sure that the evaluation bank is
different from the destination bank.
Select a ROI from a previous program step. ROIs of any form are possible to use. The
Timeout sets the maximum time for how long your program keeps looking for blobs.
Enable the parameter Generate Blob Image to store a binary image of the blobs (white) on
black background in the destination bank. This function makes the Blob Finder step suit-
able as a pre-processing step to other tools. You can create a binary image where only

Reference Manual Chapter 5
IVC-3D
©SICK AG • Advanced Industrial Sensors • www.sick.com • All rights reserved 273
Blob Finder Setup
objects of appropriate sizes are included. Disable this option to allow for faster execution
of the tool if you do not intend to use the output image.
Binarization Thresholds
Select a Threshold Mode for setting the upper and lower thresholds for the binarization
operation. Choose Manual to set the upper and lower thresholds yourself by dragging the
threshold bars. Choose an automatic mode when you know that the threshold level will
shift from scan to scan. You can use an automatic mode first to find suitable thresholds
while configuring the tool, and then switch to manual mode. The manual thresholds are
updated to the values found by the automatic method.
For 3D images: If there is a need to include missing data in the binarization, set the Lower
threshold to zero by typing 0 in the input field. For a better resolved scale, the range of the
slider only covers the height of the chosen FOV, and therefore the slider cannot be pulled
to zero.
Using the automatic threshold options makes the tool a bit slower.
Blob Selection
Limit the result to blobs of adequate sizes by setting a Maximum Blob Area and a Minimum
Blob Area. The area is measured in pixels. If holes are filled, the examined area includes
the holes.
Check the Discard edge blobs checkbox to ignore blobs that are partly outside the ROI or
that are touching the border of the ROI.
If edge blobs are not discarded, only the part of the blob inside the ROI is detected and
compared with the Minimum blob area and Maximum blob area parameters.
Check the Fill Holes in Blobs checkbox when you know that a part of the blob may consist
of missing data due to patterned or shadowed objects, or to occlusion or poor reflectance
on your scanned object. It is also useful if you wish to compute the area of the full object,
including the holes inside the blob.
Sorting
Blobs can be sorted in different ways using the parameter Sort By: The following options
are available:
Vertical position Horizontal position Distance to Sorting Point Blob Area No sorting
If Distance to Sorting Point is chosen, you must set the Sorting Point X- and Y-coordinates.
The Sorting Order has two options:
Ascending The sorting is done in increasing order, for example from small to large
or from bottom to top.
Descending The sorting is done in decreasing order, for example from large to
small or from top to bottom.
Display
Click the Display Source button to display the source image.
Click the Display Result button to display a visual representation of the results:
• Pixels within the threshold range are white.
• Pixels within the specified area range are red.
Note:
Note:
Note:

Chapter 5 Reference Manual
IVC-3D
274 ©SICK AG • Advanced Industrial Sensors • www.sick.com • All rights reserved
Interactive Setups
• Pixels out of range are left as they are in the source bank. This simplifies threshold
tuning.
• Pixels not part of the ROI are blue.
The image is by default stretched to fill the preview window. Click the Fit to Window button
to toggle between showing a stretched image and showing the image in its original size.
The stretching does not preserve the aspect ratio of the image. It is only when showing the
image in its original size that one pixel on the screen represents one pixel of the image.
Table
Use the Table Index to set the starting position (row number) in the table for where the
found blob centroids and areas are stored. The default value is 1000.
This is only an extra option. All blobs are always stored internally and are thus accessible
using the ‘Blob Analyzer’ tool. Storing in the table is intended for simple applications where
only centroids and area are desired.
The Max number of blobs in the table limits the number of blobs that are stored in the
table. This value also determines the number of listed blobs in the Interactive Setup win-
dow, since that list uses the table values for display. If the maximum number of blobs in
the table is set to 5, then the list will contain 5 blobs as well. However, all blobs are still
stored internally.
Note:

Reference Manual Chapter 5
IVC-3D
©SICK AG • Advanced Industrial Sensors • www.sick.com • All rights reserved 275
Blob Analyzer Setup
Blob Analyzer Setup This tool analyzes blobs found by the ‘Blob Finder’ tool. It analyzes one blob at a time and
is typically used in a for loop to analyze a number of blobs in sequence. For an introduction
to the tool, see Blob Analyzer on page 128.
Figure – The interactive setup window for the Blob Analyzer. The currently selected blob is shown in green. The blobs that are not selected is shown in red color. Use the input parameters on the left of the interactive setup window to select the blob to
be analyzed, and to select what features to compute for it. The results of the settings for a
specific blob can be visualized in the image display.
Setting input and output parameters
Enter the Blob Finder Step where the Blob Analyzer can find the blob information to use,
and a valid Blob Index number. The Destination Bank determines in which image bank the
resulting image will be stored. If you enable Visualization of Results, the results are visual-
ized in the Destination Bank. If Display Centroid is enabled the centroid of the blobs will be
displayed.
A ROI can be generated from the blob. The blob ROI can be referred to in later steps by
other tools. This means that you can perform any analysis or filtering operation that takes a
ROI as input, and run it on the blob area of the picture only. You can for instance run
another blob finder step on the current blob to find blobs inside the blob.
Only one blob at the time is analyzed. To analyze several blobs in an image, include it in a
for loop and use the loop index as blob index. For example, if your for loop is located in
step number 14, then type =s14r1 to refer to the current blob index number. If you want
to analyze all blobs in an image, set the for loop to loop from number 0 to the total number
of found blobs -1.

Chapter 5 Reference Manual
IVC-3D
276 ©SICK AG • Advanced Industrial Sensors • www.sick.com • All rights reserved
Interactive Setups
All numeric results in the setup are based on the blob that is currently selected (by using
the << and the >> navigation controls). Thus, the Blob Index number is not used when
running the tool from the interactive setup. This means that you can visualize one blob in
the interactive setup when configuring the tool, but use other blobs when running the
program, which is useful since the Blob Index number is likely to be a reference to a for
loop counter.
Blob Orientation and Bounding Box:
There are two Blob Orientation Methods to calculate the orientation of a blob. The Area Based method calculates the orientation based on all the pixels in the specific blob, while
the Boundary Based only uses the pixels on the external perimeter of the blob. An XY-
bounding box is always computed (based on results from the Left Edge, the Top Edge, the
Width and the Length) and is drawn if no blob orientation method is chosen.
Which method will be best suited for your application depends on the shape of your blobs.
For a rectangular blob containing holes, the boundary-based method is most suitable. For
solid objects of arbitrary shapes the area-based method is often good. For perfect circles
and squares it is not relevant to calculate an orientation since they have no orientation
(blob ovality = 1).
In the Compute Bounding Box field, choose if to calculate a boundary box and if to visual-
ize it. The bounding box will get different colors depending on which blob orientation
method is selected. The Boundary Based method renders green boundary boxes, the
Area Based method yellow, and if no blob orientation method is active the box will be
blue.
Blob Shape Features
The Compute Blob Diameters measure computes the maximum, the minimum and the
average diameters of the blob. It is only relevant for fairly circular blobs, since there simply
is no reasonable definition of diameter of, for example, a U shaped object. The measured
values are obtained by computing the diameter for all lines through the centroid of the
blob, starting and stopping at the two most distant points in the blob.
The Compute Blob Perimeter measure computes the length of the external perimeter of
the blob. Computing the perimeter length in a discrete image is an ambiguous task. The
measure returned by this function is fairly invariant to orientation, but the value may vary
with a few pixels from one scan to another on apparently identical objects due to sensor
noise, lighting conditions etc.
Height and Volume
To compute the height or the volume of a blob you must define which Source Bank that
contains the image, and which Surface Definition Step that defines the reference surface
for the measurement. The reference surface is typically the background (conveyor) plane
from which your blob is “sticking out”.
The Height Percentile defines what blob pixel values to consider when computing the blob
height. This parameter makes the measurement more robust to noise and to reflection
artefacts that typically appear along the borders of a 3D object.
For example, if you enter the height percentile value 95, then the top 5% of the pixel
values are removed before locating the maximum height above the reference surface.

Reference Manual Chapter 5
IVC-3D
©SICK AG • Advanced Industrial Sensors • www.sick.com • All rights reserved 277
Blob Analyzer Setup
Visualize This Blob in Interactive Setup
Click the << and the >> buttons to navigate between the blobs in the image, or enter a Blob Index number.
The visualization in the interactive setup is different from the visual results you get when
executing the Blob Analyzer step in RUN or DEBUG mode. The visual representation of the
results are interpreted as follows:
• The currently examined blob is green.
• All other blobs are red.
• The centroid of the currently examined blob is displayed as a red + sign.
• All other blob centroids are displayed as yellow + signs.
The blob visualization is only a setup aid. It is not related to which blob that is analyzed
when the tool executes. This means that you can visualize one blob in the interactive setup
when configuring the tool, but use other blobs when running the program.
The image is by default stretched to fill the preview window. Click the Fit to Window button
to toggle between showing a stretched image and showing the image in its original size.
The stretching does not preserve the aspect ratio of the image. It is only when showing the
image in its original size that one pixel on the screen represents one pixel of the image.
Note:

Chapter 5 Reference Manual
IVC-3D
278 ©SICK AG • Advanced Industrial Sensors • www.sick.com • All rights reserved
Interactive Setups
Detail Extraction Setup The Detail Extraction Setup finds details in images that "stick out" from the background.
For an introduction to the tool, see Detail Extraction on page 92.
Figure – The Interactive Setup window for Detail Extraction.
Input/Output
Choose an image for the Detail Extraction by typing the number of the Source bank that
contains the desired image. Also choose a storage place for the resulting filtered image by
typing the number of a Destination bank.
Select a ROI from a previous program step.
Extraction parameters
Use the extraction parameters to define which details to extract from the image. Details
that deviate from the background are extracted. To check if a point deviates from the
background, it is compared to all or a limited set of its neighbouring points. The Operator Type defines which set of neighbouring points that shall be considered, for example hori-
zontal, vertical or diagonal neighbours. Choose Horizontal to identify vertical patterns in
an image, and Vertical to identify horizontal patterns; choose Four points or
Eight points to identify smaller deviations of any form. It is also possible to consider
all points (Full region), but this slows down the program.
The Deviation Type defines in what way the details shall deviate from the background, that
is, if they are higher or lower than the background (or both).
Drag the Operator Radius bar to set the radius within which to pick neighbouring points for
comparison. Drag the Threshold bar to define the minimum difference between the current
point and the compared neighbours that is allowed to consider the point a detail. The
visual representation of the result image in the interactive setup window is of good help
when searching for suitable radius and threshold values.

Reference Manual Chapter 5
IVC-3D
©SICK AG • Advanced Industrial Sensors • www.sick.com • All rights reserved 279
Detail Extraction Setup
Display
Click the Display Source button to display the source image.
Click the Display Result button to display a visual representation of the results:
• Detail pixels are high.
• Other pixels are low.
The image is by default stretched to fill the preview window. Click the Fit to Window button
to toggle between showing a stretched image and showing the image in its original size.
The stretching does not preserve the aspect ratio of the image. It is only when showing the
image in its original size that one pixel on the screen represents one pixel of the image.

Chapter 6 Reference Manual
IVC-3D
280 ©SICK AG • Advanced Industrial Sensors • www.sick.com • All rights reserved
Troubleshooting
6 Troubleshooting This section contains information that may be helpful when troubleshooting problems with
the IVC camera.
If it is not possible to solve the problem using the information in this section, please con-
tact technical support in your SICK sales subsidiary. Ask your SICK sales representative for
guidance if needed.
When reporting a trouble, please write a trouble report as described at the end of this
section. The purpose of the trouble report is to shorten the response time and enable
more qualified support.
If technical support cannot assist, it may be necessary to send the camera in for repair. In
this case, the same type of trouble report information should be attached.
6.1 Connecting to Devices
No devices in the device list.
Only a few devices are listed, and everyone show error.
A firewall may be blocking all or some of the communication between
the device and IVC Studio.
If the PC has multiple network connections (for example has two
Ethernet cards, or is also equipped with wireless network) IVC may be
using the wrong network.
Solutions
Try the following:
• Check network connections.
The PC must be connected to the device either through a switch
or directly with a crossover cable. The IVC devices do not support
wireless connections or connections through a hub.
• Choose Options Configuration Ethernet Devices, and check
that the IP address shown in the dialog box (Local IP = ...) is cor-
rect.
If the address is wrong, choose the correct IP address from the
Local IP field if possible, or check the network settings on the PC.
• In the IVC Studio Configuration dialog box, click Ethernet Device Configuration.
If the devices are not in the list of connected devices, check the
network settings on the PC.
• If you know the IP address of the device, open a command
prompt (Start Programs Accessories Command Prompt), and
type the following command: ping <IP address>
where <IP address> is replaced with the IP address of the
device. If the device does not reply there may be something
wrong with the network configuration.
• Disable the firewall on the PC, or create an exception for IVC
Studio.

Reference Manual Chapter 6
IVC-3D
©SICK AG • Advanced Industrial Sensors • www.sick.com • All rights reserved 281
Troubleshooting
Device shows error and cannot be connected to. Restarting the device does not help.
If a program stored in bank 0 in the flash memory is malfunctioning,
for example not being compatible with new firmware, that program will
stop with an error, making it impossible to connect to the device.
Restarting the device will not help, since program 0 is automatically
started when the device is powered up.
Solution
1. Connect a high input signal (supply voltage) to pin 8 on the
IVC-3D RS485 connector, and restart the device.
The device should now start without running the program in
bank 0.
2. Connect to the device and delete the program in bank 0.
Connecting to a device results in a lot of error messages. Sometimes the PC will crash
Make sure that the device is not used from any other PC.
Only one PC at a time can be connected to a device, for viewing live
images or editing programs.
PLC communi-cation fails
The communication between the device and a PLC can be disturbed if
there is a lot of traffic on the network. Try the following:
• Use a separate network for the PLC communication, or at
least try to isolate the PLC-IVC network from the rest of the
network environment.
• Do not run the device with F6 from IVC Studio. In this mode,
there is a lot of communication between the device and IVC
Studio, e.g. images, and this may disturb the PLC communica-
tion. Try to start the device in standalone-mode instead by
choosing Start Program from the context menu in the Device
list).
Function LED is flashing Red, Green, Yellow and the camera cannot be accessed
If the initialization of the Flash File System (FFS) fails when the camera
is powered up, the camera stops and signals an error. In this situation
there are two options:
1. Restart the camera by cycling the power off and on. If the
problem with the FFS initialization was intermittent, the cam-
era will now start normally.
2. Apply 24V to the digital input In3. This will force a complete
formatting of the FFS, and all user specific information (e.g.
IP-configuration settings, programs and data blocks) will be
lost. After the formatting of the FFS, the camera will restart
automatically. Note that the calibration files for the IVC-3D
camera will also be lost. These files can be requested from
tech support by referring to the serial number of the camera.
If none of the above suggestions work, the camera must be sent to
repair, as the flash is permanently damaged.
Note that it is only in this flash error state, indicated by the LED color
switching, that the flash will be erased by setting In3 high. The normal
function of In3 remains, i.e. setting it high at power-up by-passes the
starting of program in flash position 0.

Chapter 6 Reference Manual
IVC-3D
282 ©SICK AG • Advanced Industrial Sensors • www.sick.com • All rights reserved
Troubleshooting
6.2 Saving to Flash
How the flash works
The flash disk consists of a number of sectors. A sector can only be written to once. This
means that if a file is edited, the sectors containing the previous version of the file are
marked as “dead space”, and a complete copy of the new version of the file is written to
one or more new sectors. I.e. the amount of “dead space” will increase each time some-
thing is written to the flash disk.
To be able to access the sectors marked as “dead space”, the flash must be “defrag-
mented”. This is normally performed using the “Clear Unused Memory” option from the
Flash menu of the device in the Device list.
Saving to Flash results in ”ITF Error = 2”.
The execution time for saving large data blocks or images to the
flash may be longer than the time-out that is set in IVC Studio. In
that case, IVC Studio will report that it lost contact with the device
when the device is in fact busy saving.
Solution
• Increase the R/W command timeout limit in Options Configura-tion Timeout.
When saving images, the values in the ‘Save Image to Flash’
tool description can be used as a rough guideline. Set the new
timeout to several 100 ms above the max value to avoid time-
out errors.
Saving to Flash suddenly takes much longer time.
If the execution time for saving to flash using 'Save data block to
flash' or 'Save image to flash' suddenly increases, the device may
have run out of free flash memory blocks (also known as sectors). In
this case the device needs to clear a previously used (but now
unused) memory block before saving, something that takes some
time. The execution time can in this case be shortened by manually
clearing the unused memory.
Solution
• Check the amount of free memory on the device by right-
clicking the device in the device list and choosing Device Man-agement Device information.
• If FFS free size is low and FFS dead size is large,
clear unused (dead) memory by right-clicking the device and
choosing Flash Clear unused memory.
Note that excessive writing to the flash memory may shorten its
working life. The flash memory is specified for 100 000 re-writings.
To access the flash disk of the Emulator
The flash disk of the Emulator is found on the PC under My Docu-
ments (Documents in Vista) for the current user. The default path to
the Emulator flash is:
My Documents\SICKIVP\SmartCameras\IVC Studio x.x\ Emula-
tor\flash
Automatic defragmentation
All tools that write to the flash disk can automatically clear dead space and perform a
defragmentation of the flash disk. This functionality is controlled by the parameter Dead-SpaceThreshold in the Smartreader.ini configuration file. It is also possible to configure the
parameter in the Ethernet Device Configuration dialog, available on the Op-tions Configuration Ethernet Devices menu of IVC Studio. If the amount of dead space
exceeds the threshold, the flash disk will be cleared from dead space before the informa-
tion is written to the disk. This means that the tools may take substantially longer to exe-
cute in some situations. In general, it is not recommended to use these tools in the normal
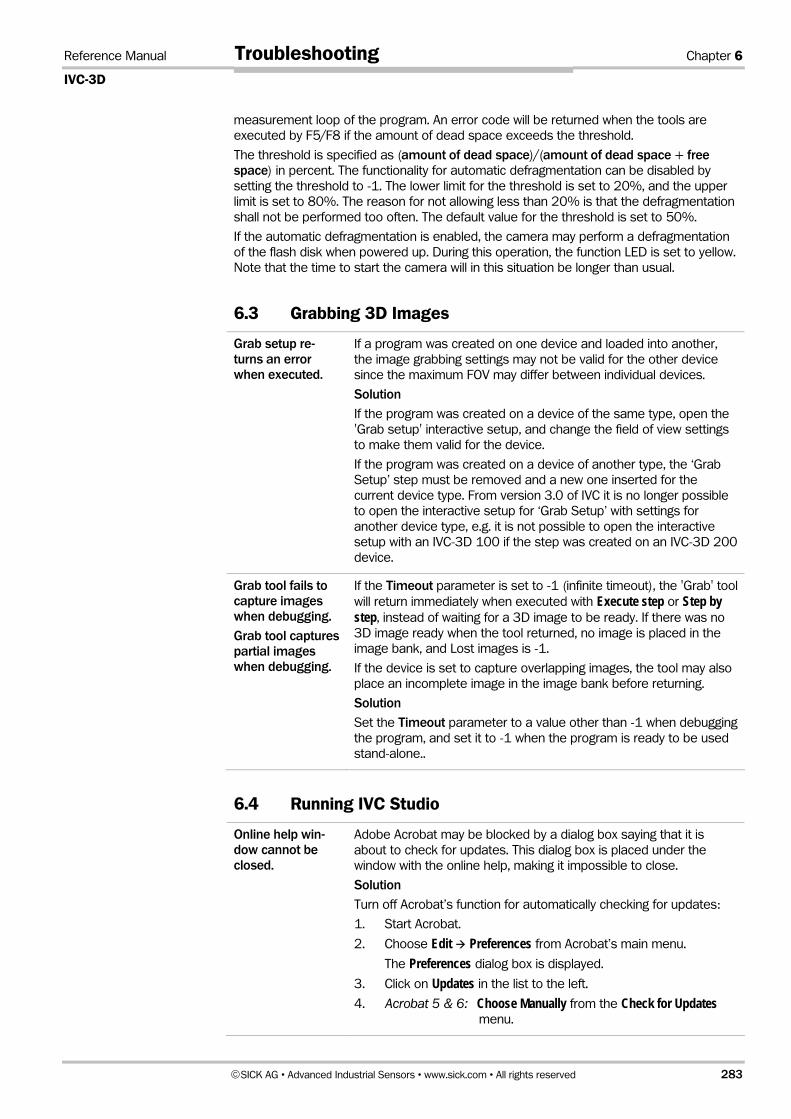
Reference Manual Chapter 6
IVC-3D
©SICK AG • Advanced Industrial Sensors • www.sick.com • All rights reserved 283
Troubleshooting
measurement loop of the program. An error code will be returned when the tools are
executed by F5/F8 if the amount of dead space exceeds the threshold.
The threshold is specified as (amount of dead space)/(amount of dead space + free space) in percent. The functionality for automatic defragmentation can be disabled by
setting the threshold to -1. The lower limit for the threshold is set to 20%, and the upper
limit is set to 80%. The reason for not allowing less than 20% is that the defragmentation
shall not be performed too often. The default value for the threshold is set to 50%.
If the automatic defragmentation is enabled, the camera may perform a defragmentation
of the flash disk when powered up. During this operation, the function LED is set to yellow.
Note that the time to start the camera will in this situation be longer than usual.
6.3 Grabbing 3D Images
Grab setup re-turns an error when executed.
If a program was created on one device and loaded into another,
the image grabbing settings may not be valid for the other device
since the maximum FOV may differ between individual devices.
Solution
If the program was created on a device of the same type, open the
'Grab setup' interactive setup, and change the field of view settings
to make them valid for the device.
If the program was created on a device of another type, the ‘Grab
Setup’ step must be removed and a new one inserted for the
current device type. From version 3.0 of IVC it is no longer possible
to open the interactive setup for ‘Grab Setup’ with settings for
another device type, e.g. it is not possible to open the interactive
setup with an IVC-3D 100 if the step was created on an IVC-3D 200
device.
Grab tool fails to capture images when debugging.
Grab tool captures partial images when debugging.
If the Timeout parameter is set to -1 (infinite timeout), the 'Grab' tool
will return immediately when executed with Execute step or Step by step, instead of waiting for a 3D image to be ready. If there was no
3D image ready when the tool returned, no image is placed in the
image bank, and Lost images is -1.
If the device is set to capture overlapping images, the tool may also
place an incomplete image in the image bank before returning.
Solution
Set the Timeout parameter to a value other than -1 when debugging
the program, and set it to -1 when the program is ready to be used
stand-alone..
6.4 Running IVC Studio
Online help win-dow cannot be closed.
Adobe Acrobat may be blocked by a dialog box saying that it is
about to check for updates. This dialog box is placed under the
window with the online help, making it impossible to close.
Solution
Turn off Acrobat’s function for automatically checking for updates:
1. Start Acrobat.
2. Choose Edit Preferences from Acrobat’s main menu.
The Preferences dialog box is displayed.
3. Click on Updates in the list to the left.
4. Acrobat 5 & 6: Choose Manually from the Check for Updates
menu.

Chapter 6 Reference Manual
IVC-3D
284 ©SICK AG • Advanced Industrial Sensors • www.sick.com • All rights reserved
Troubleshooting
Acrobat 7: Select Do not automatically check for critical updates.
5. Click OK to close the Preferences dialog box.
6.5 Debugging Step Programs
The results of previous steps are lost during editing and debugging
The entire contents of the step program are transmitted to the
camera when the step program name is clicked in the tree-view. If
this is done during editing of the step program, the results from
previous steps, e.g. ROI:s, may be lost.
Solution
Execute the step again to restore the result in the camera.
6.6 IVC Emulator
The IVC Emulator cannot be closed from IVC Studio
If the IVC Emulator is enabled while the active network is changed in
IVC Studio, it is not possible to disable the emulator from IVC Studio.
Solution
The emulator must be terminated using the Task Manager.
1. Open Task Manager (e.g. by pressing Ctrl+Alt+Del)
2. In the tab Processes, select IVCEmulator.exe in the column
Image Name.
3. Click End Process
4. Click Yes in the dialog with the warning message.
The IVC Emulator is not visible in IVC Studio
Some VPN clients and firewalls block the network traffic for the
emulator.
Solution
Contact your IT department for a solution how to configure your VPN
client or firewall in a safe way.
6.7 Trouble report The trouble report is the key to successful troubleshooting by somebody else. Therefore, if
you need help from technical support or repair, the quality of the trouble report will deter-
mine the quality of the help you will get.
The required detail and quality of the trouble report depends on the status of the trouble-
shooting, especially if it is before or after the point where the problem is reproducible.
Examples of content are:
• Brief application description
• System configuration
o Firmware version, i.e. IVC version
o Hardware type code and serial number
o Network architecture
• Expected behavior
• Observed symptoms
o What happens and how often does it happen
• How to reproduce, step by step
• Log files with system info from when the failure occurred

Reference Manual Chapter 6
IVC-3D
©SICK AG • Advanced Industrial Sensors • www.sick.com • All rights reserved 285
Troubleshooting
o The log file from IVC Studio can be found in the folder (on XP)
<My Documents\SICKIVP\SmartCameras\IVC Studio x.x\>
• Camera images, both normal and troublesome if possible
• Camera step program

Reference Manual
IVC-3D
286 ©SICK AG • Advanced Industrial Sensors • www.sick.com • All rights reserved
Appendix
Appendix
A Mathematical Expressions It is possible to create strings that contain mathematical expressions. This is useful for
performing calculations in a program that cannot be performed by the tools.
A mathematical expression always begins with an equal sign (=). String parameter values
that begin with an equal sign will be treated as expressions. If a string parameter needs to
begin with an equal sign, preceed it with a single quotation mark, for example '=Hello.
When using strings in expressions, the strings must always be enclosed in single quotation
marks, for example 'Hello world'. If you need to include a single quotation mark in a
string, preceed it with a backslash ('\'Hello\', she said.').
Note: If fractional values are used in expressions, the decimal delimiter must always be a
dot (.), regardless of any local settings made on the PC. Commas (,) are always used in
expressions for separating parameters.
The following operands are used for referring to table and parameter values:
Operand Meaning Vx Value in table row x
V(x*n) Value in table row (x * n)
SaAb Argument (input parameter)
b of Step a *
SaRb Result b of step a *
* a and b are arbitrary integers
A.1 Arithmetic Operators
You can use the following operators:
Symbol Meaning
- Subtraction
+ Addition
* Multiplication
/ Division
% Modulo, the remainder from a division of two integers. For
example: 10%3 = 1
^ Power. For example: 2^3 = 8
< Less than
> Greater than
Sin(x) Sine, x is the angle in radians
Cos(x) Cosine, x is the angle in radians
Tan(x) Tangent, x is the angle in radians
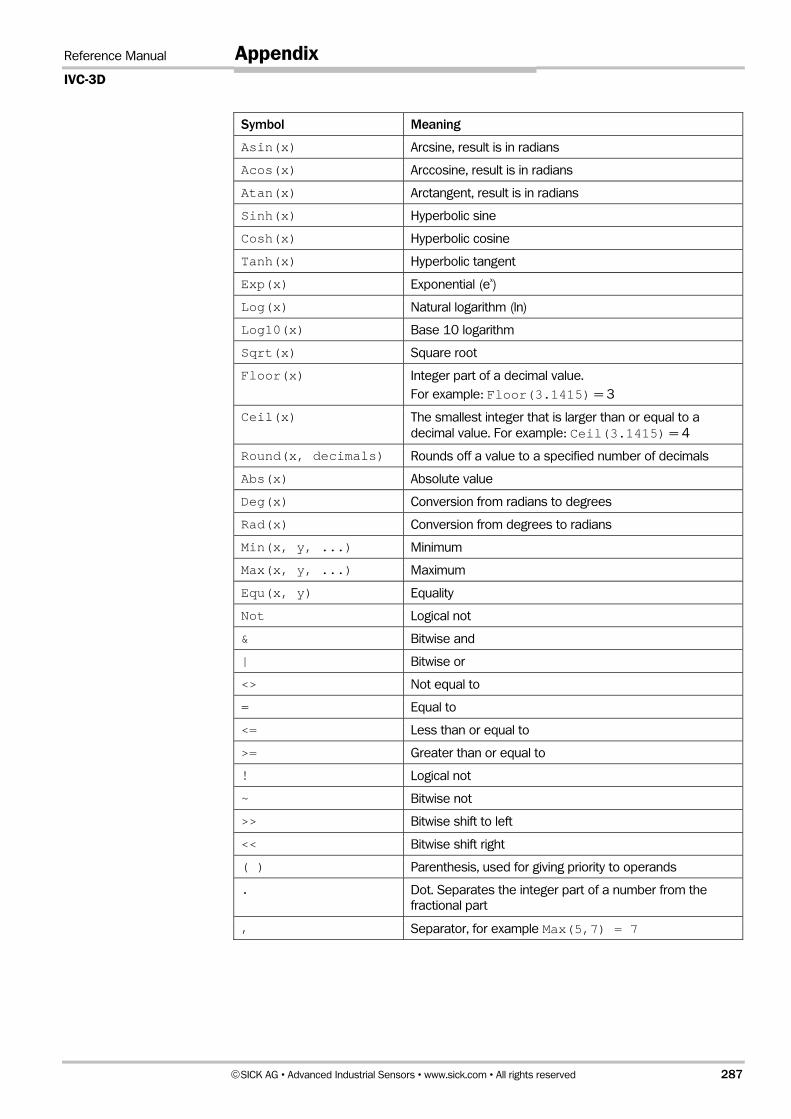
Reference Manual
IVC-3D
©SICK AG • Advanced Industrial Sensors • www.sick.com • All rights reserved 287
Appendix
Symbol Meaning
Asin(x) Arcsine, result is in radians
Acos(x) Arccosine, result is in radians
Atan(x) Arctangent, result is in radians
Sinh(x) Hyperbolic sine
Cosh(x) Hyperbolic cosine
Tanh(x) Hyperbolic tangent
Exp(x) Exponential (ex)
Log(x) Natural logarithm (ln)
Log10(x) Base 10 logarithm
Sqrt(x) Square root
Floor(x) Integer part of a decimal value.
For example: Floor(3.1415) = 3
Ceil(x) The smallest integer that is larger than or equal to a
decimal value. For example: Ceil(3.1415) = 4
Round(x, decimals) Rounds off a value to a specified number of decimals
Abs(x) Absolute value
Deg(x) Conversion from radians to degrees
Rad(x) Conversion from degrees to radians
Min(x, y, ...) Minimum
Max(x, y, ...) Maximum
Equ(x, y) Equality
Not Logical not
& Bitwise and
| Bitwise or
<> Not equal to
= Equal to
<= Less than or equal to
>= Greater than or equal to
! Logical not
~ Bitwise not
>> Bitwise shift to left
<< Bitwise shift right
( ) Parenthesis, used for giving priority to operands
. Dot. Separates the integer part of a number from the
fractional part
, Separator, for example Max(5,7) = 7

Reference Manual
IVC-3D
288 ©SICK AG • Advanced Industrial Sensors • www.sick.com • All rights reserved
Appendix
A.2 String Operators
Symbol Meaning
+ Concatenation
= Comparision. Returns 1 if both strings are identical.
Asc(char) Returns the ASCII code for the specified character. For exam-
ple asc(‘A’) returns the value 65.
Chr(number) Returns the character for the specified ASCII code. For exam-
ple chr(66) returns ’B’.
Sub(str, index) The character at position index. Note that the first character
in the string has index 0.
Negative values will count the positions from the end, for
example -1 will return the last character.
Sub(str, start, stop)
A substring with the characters at positions from start to
stop-1. Note that the first character in the string has index 0.
If start is empty, all characters from position 0 to stop are
returned.
If stop is empty, all characters from position start to the
end of the string are returned.
For example sub(‘Hello World’, 0, 5) returns
‘Hello’ and sub(‘Hello World’, 6, 11) returns
‘World’.
Len(str) The number of characters in the string.
Eval(str) Evaluates the string as if it were an expression. For example
eval('1+2+3') returns 6.
Str(number) A string representation of the number. For example
Str(1.23) returns the string '1.23'
Repr(number) A string representation of the number that can be re-evaluated
to its original value. For example Repr(1.23) returns the
string '1.230000e+000'
A.3 Time stamps
It is possible to access the current time from a step program by using a string operator.
Two operators are available, one that returns the UTC time and one that returns the time
and date as a string. For the string operators to return the correct time, a time server IP
address need to be set up (see Time server in Appendix B). If the Emulator is used the
time from the computer will be used and the supplied timezone will not be used.
Symbol Meaning
time(timeZone) Returns the local time in seconds, UTC time with offset. time-
Zone is the local offset from UTC time in hours.
timestr(timeZone, format)
Returns the local time and date as a string, timeZone is the
local offset from UTC time in hours. Three formats are possible:
Format value Example
0 2008-10-02 14:27:42
1 02.10.2008 14:27:42
2 10/02/2008 02:27:42 PM

Reference Manual
IVC-3D
©SICK AG • Advanced Industrial Sensors • www.sick.com • All rights reserved 289
Appendix
A.4 Operator Priority
The operators have the following priority:
Highest priority
( ) . Vx SaAb SaRb
Functions, for example sin(x)
* / % + - < >
Lowest priority ,
Example =Not( S3R1 * V( 5 * S2R1 ) < 10 )
This expression uses the first result from program step 3 (S3R1), and a value from the
table (V( 5 * S2R1 )). Which table row to get the value from is calculated by using a
result from program step 2.
Assume that we have the following values:
Variable Value
Result 1 from step 2 S2R1 7
Result 1 from step 3 S3R1 6
Row 35 in the table V35 2
The expression is resolved in the following way:
=Not( S3R1 * V( 5 * S2R1 ) < 10 ) =Not( S3R1 * V( 5 * 7 ) < 10 ) =Not( S3R1 * V35 < 10 ) =Not( S3R1 * 2 < 10 ) =Not( 6 * 2 < 10 ) =Not( 12 < 10 ) =Not( 0 ) 1(TRUE)

Reference Manual
IVC-3D
290 ©SICK AG • Advanced Industrial Sensors • www.sick.com • All rights reserved
Appendix
B Setting Device Parameters The parameters described in the table below are available in the dialog Ethernet Device Settings:
• Choose Options -> Configuration from the IVC Studio menu bar.
• A window containing a tree view is displayed.
• Select Ethernet Devices in the tree view.
• Ethernet devices are displayed in the right pane in the window.
• Click the Ethernet Device Configuration button.
• The Ethernet Device Settings window is displayed containing a list of available
devices.
• Select a device from the list. The parameters in the table below are displayed for
the selected device.
Modifications to the parameters are stored in the device by clicking the “Update” button.
Please note that this will restart the device.
Parameter category Parameter name Parameter explanation IP
Specifies the IP address of the
network interface. It can be set
manually or automatically
through the DHCP if this
protocol is enabled.
The number must be written in
the following format
aaa.bbb.ccc.ddd. The default
value is 192.168.0.110.
We recommend that the
number 255 is not used for
the four parts of the address
in order to avoid that the
device is not recognized.
Each device must have a
unique IP address.
Netmask
Specifies the netmask of the
sub-network. The number
must be written in the following
format aaa.bbb.ccc.ddd. The
default value is 0.0.0.0. In the
event that this parameter is
not necessary, it should be set
to 0.0.0.0 or an empty string.
Network Parameters
Gateway Specifies the network Gateway
address. The number must be
written in the following format
aaa.bbb.ccc.ddd. The default
value is 0.0.0.0. In the event
that this parameter is not
necessary, it should be set to
0.0.0.0 or an empty string.

Reference Manual
IVC-3D
©SICK AG • Advanced Industrial Sensors • www.sick.com • All rights reserved 291
Appendix
Parameter category Parameter name Parameter explanation DNS Specifies the Domain Name
Server address. The number
must be written in the following
format aaa.bbb.ccc.ddd. The
default value is 0.0.0.0. In the
event that this parameter is
not necessary, it should be set
to 0.0.0.0 or an empty string.
WINS Specifies the WINS server
address. The number must be
written in the following format
aaa.bbb.ccc.ddd. The default
value is 0.0.0.0. In the event
that this parameter is not
necessary, it should be set to
0.0.0.0 or an empty string.
Time Server Specifies the IP address of the
Time Server, in accordance
with the SNTP protocol (UDP
port 123). The number must
be written in the following
format aaa.bbb.ccc.ddd. The
default value is 0.0.0.0. In the
event that this parameter is
not necessary, it should be set
to 0.0.0.0 or an empty string.
DHCP Specifies if the DHCP is en-
abled. The default value is 1
(enabled). The accepted
values are 1 = enabled, 0 =
disabled. If the DHCP client is
enabled the following parame-
ters are set automatically: IP,
Netmask, Gateway, DNS,
WINS, TimeServer.
DHCP Wait Save Specifies the time, in seconds,
in which the network parame-
ters set by the DHCP are
saved in the configuration file.
DHCP IP Auto Configuration Specifies what the computer
does in the case DHCP does
not answer the camera or
does not assign it an IP ad-
dress. If the flag is 1 the
camera gets the IP 0.0.0.0.
If the flag is zero the camera
gets the IP that was last
assigned to it. The last as-
signed address is stored in the
device.ini file.
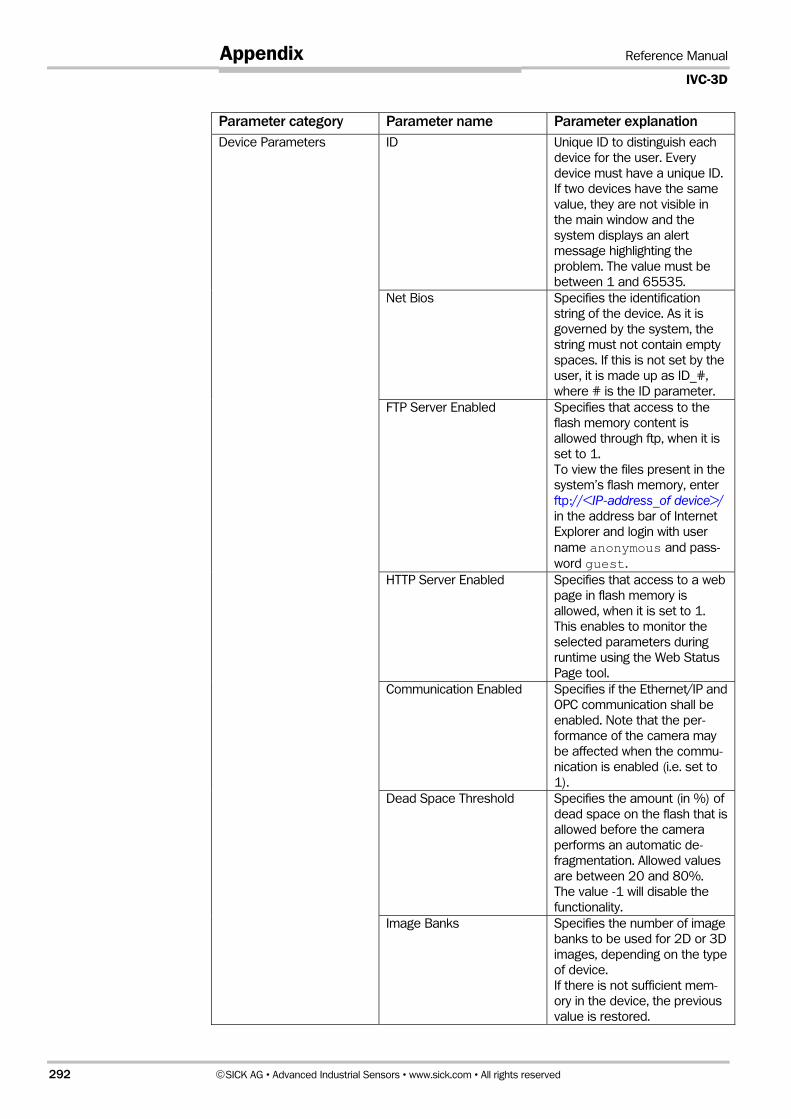
Reference Manual
IVC-3D
292 ©SICK AG • Advanced Industrial Sensors • www.sick.com • All rights reserved
Appendix
Parameter category Parameter name Parameter explanation ID
Unique ID to distinguish each
device for the user. Every
device must have a unique ID.
If two devices have the same
value, they are not visible in
the main window and the
system displays an alert
message highlighting the
problem. The value must be
between 1 and 65535.
Net Bios Specifies the identification
string of the device. As it is
governed by the system, the
string must not contain empty
spaces. If this is not set by the
user, it is made up as ID_#,
where # is the ID parameter.
FTP Server Enabled Specifies that access to the
flash memory content is
allowed through ftp, when it is
set to 1.
To view the files present in the
system’s flash memory, enter
ftp://<IP-address_of device>/
in the address bar of Internet
Explorer and login with user
name anonymous and pass-
word guest.
HTTP Server Enabled Specifies that access to a web
page in flash memory is
allowed, when it is set to 1.
This enables to monitor the
selected parameters during
runtime using the Web Status
Page tool.
Communication Enabled Specifies if the Ethernet/IP and
OPC communication shall be
enabled. Note that the per-
formance of the camera may
be affected when the commu-
nication is enabled (i.e. set to
1).
Dead Space Threshold Specifies the amount (in %) of
dead space on the flash that is
allowed before the camera
performs an automatic de-
fragmentation. Allowed values
are between 20 and 80%.
The value -1 will disable the
functionality.
Device Parameters
Image Banks
Specifies the number of image
banks to be used for 2D or 3D
images, depending on the type
of device.
If there is not sufficient mem-
ory in the device, the previous
value is restored.

Reference Manual
IVC-3D
©SICK AG • Advanced Industrial Sensors • www.sick.com • All rights reserved 293
Appendix
Parameter category Parameter name Parameter explanation Profile Banks
(IVC-3D only)
Specifies the number of image
banks to be used for profiles
in the IVC-3D camera.
The image banks with the
lowest numbers are used for
3D images, and the remaining
image banks are used for
profiles.
Handling of invalid IP addresses
The device verifies the IP address specified in the IP field. If the value is invalid, e.g. if an
invalid character is entered in the field, the device will set the default IP address
(192.168.0.110), and activate the FTP server. The FTP server is activated to allow direct
access to the configuration files of the device.
The following addresses are not allowed by the device
0.0.0.0 No address
127.0.0.1 Loopback address
255.255.255.255 Broadcast address
224.x.x.x –
239.x.x.x
This range holds multicast addresses

Reference Manual
IVC-3D
294 ©SICK AG • Advanced Industrial Sensors • www.sick.com • All rights reserved
Appendix
C Missing Data in Certain Tools The tools listed below handles pixels with missing data in a 3D image as having a height
value of 0.
If this is not desired, you can use the 'Missing data' tool to fill in the areas of missing data
and avoid having these tools being affected by the missing data.
In addition, these tools work with a height resolution that differs from the native resolution
of the used device. The used resolution depends on the height of the FOV, and can be
calculated with the following formula:
Height of FOV
243
Edge
Find Row Edge
Find Column Edge
Find Row
Find Column
Find Line Edge
Find Subpixel Edge
Find Multiple Edges
Find Mean of Edges
Find Circle Edges
Measure
Centroid
Single Blob Analysis
Area
Blob Analysis
Count Deviating Points
Perimeter
Matching
Teach Rotation
Match Rotation
Teach Shape
Match Shape
Circular
External Perimeter
Internal Perimeter
Check Circular Surface