Embed Size (px)
Citation preview

International Journal of Research Available at https://edupediapublications.org/journals
p-I SSN: 2348 -6848 e-ISSN: 2348-795X
Vol ume 03 I s s ue 1 4 Oc tober 2016
Available online: http://edupediapublications.org/journals/index.php/IJR/ P a g e | 620
Application of Three-Factor Factorial Experimental Design with 8
Replicates per Cell: A study of Maize Yield
1Sulaimon Mutiu O.;2Alakija Temitope O.;3Ajasa Adekunle O.;4Abe Joachim B.; 5Ale Olagoke
S.;6Tella Oluwaseun E.;7Ajayi Oluwatoyin
1,3Department of Statistics & Mathematics
Moshood Abiola Polytechnic, Abeokuta, Ogun State, Nigeria. 2,4Department of Statistics
Yaba College of Technology, Yaba, Lagos State, Nigeria.
[email protected] [email protected] [email protected]
[email protected] [email protected] [email protected] [email protected]
ABSTRACT
Factorial Experiments is one involving two or more factors in single experiments. Such designs are classified by the number of levels of each factors and the number of factors. Factorial experiments are efficient and provide extra information (the interactions between the factors) which cannot be obtained when using single factor design. This study examined the application of a three-factor factorial design in determine the significant difference in the mean yield of maize in Nigeria with respect to the effect of fertilizers, herbicides and water volumes. For the successful execution of this research work, primary data (yield of maize) were collected from farm land cultivated on half plot of land in the year 2016. The total ridges made were 216 which were segmented into (9), each containing 24 ridges. The 24 ridges were also segmented into 3, which makes it 8 replicates per factor level. This research work covers only three factors which are fertilizers at three levels {N:P:K(20:10:10), N:P:K(15:15:15), and UREA}, herbicides at three levels (Altraforce, Xtraforce and Metaforce) and water volumes at three levels (5litres, 7.5litres, and 10litres). The maize (Soar 1) was planted in June 2016, the herbicides (Altraforce, Xtraforce and Metaforce) were applied a day after planting, the water volumes (5Litres, 7.5Litres and 10Litres) were applied everyday according to how the ridges were segmented irrespective of rainfall. The fertilizers {N:P:K(20:10:10), N:P:K(15:15:15), and UREA} were applied in August and the maize were harvested in September on the farm land and weighed per ridge in kilogram (kg). Data collected was analyzed electronically using SPSS version 21. The analysis techniques employed was a 33 replicated factorial design with 8 replicates per cell. The hypotheses tests were carried out at α (5%) significance level and the decision rule was to reject the null hypothesis (H0) if the calculated Sig. value (p-value) is less than the α (5%). Results from the analyses revealed among others that there is significant difference in the fertilizers effect on the yield of maize with a Sig. value of 0.000 while there is no significant difference in the herbicides effect with a Sig. value of 0.505. Similarly, there is no significant difference in the water volumes effect on the yield of maize with a Sig. value of 0.866. In addition, there is significant interaction effect between "fertilizers and herbicides" (Sig. = 0.022) and between "herbicides and water volumes" (Sig. = 0.010) on the yield of maize. Keywords: Application, Cell, Design, Experimental, Factor, Factorial, Maize, Replicates, Yield.

International Journal of Research Available at https://edupediapublications.org/journals
p-I SSN: 2348 -6848 e-ISSN: 2348-795X
Vol ume 03 I s s ue 1 4 Oc tober 2016
Available online: http://edupediapublications.org/journals/index.php/IJR/ P a g e | 621
INTRODUCTION
Sir Ronald Fisher, the statistician, eugenicist, evolutionary biologist, geneticist, and father of modern experimental design, observed that experiments are ‘only experience carefully planned in advance, and designed to form a secure basis of new knowledge’ (Fisher, 1935). Experiments are characterized by the: (1) manipulation of one or more independent variables; (2) use of controls such as randomly assigning participants or experimental units to one or more independent variables; and (3) careful observation or measurement of one or more dependent variables. The first and second characteristics—manipulation of an independent variable and the use of controls such as randomization—distinguish experiments from other research strategies.
In an experiment, we deliberately change one or more process variables (or factors) in order to observe the effect the changes have on one or more response variables. The (statistical) design of experiment (DOE) is an efficient procedure for planning experiments so that the data obtained can be analyzed to yield objective conclusions.
An experimental design is a plan for assigning experimental units to treatment levels and the statistical analysis associated with the plan (Kirk, 1995)
Design of experiments begins with determining the objectives of an experiment and selecting the process factors for the study. An experimental design is the laying out of a detailed experimental plan in advance of doing the experiment. Well chosen experimental design maximizes the amount of “information” that can be obtained for a given amount of experimental effort.
The experimenter has control over certain effect called treatment populations, or treatment combinations. The experimenter generally controls the choice of the experimental unit of whether are to be into groups called BLOCKS.
Design and analysis of experiment involve the use of statistical methods in planning
and executing the research to ensure that necessary data are collected and processed to facilitate valid conclusions.
A factorial design as one of the areas of deign of experiment is often used by scientists wishing to understand the effect of two or more independent variables upon a single dependent variable.
Factorial experiments are experiments that investigate the effects of two or more factors or input parameters on the output response of a process. Factorial experimental design, or simply factorial design, is a systematic method for formulating the steps needed to successfully implement a factorial experiment. Estimating the effects of various factors on the output process with a minimal number of observations is crucial to being able to optimize the output of the process. In a factorial experiment, the effects of varying the levels of the various factors affecting the process output are investigated. Each complete trial or replication of the experiment takes into account all the possible combinations of the varying levels of these factors. Effective factorial design ensures that the least number of experiment runs are conducted to generate the maximum amount of information about how input variables affect the output of a process (Batra and Seema, 2012).
Traditionally research methods generally study the effect of one variable at a time, because it is statistically easier to manipulate. However, in many cases, two factors may be interdependent, and it is the impractical or false to attempt to analyze them in the traditional way.
Agricultural science researcher, with a need for field testing, often use factorial designs to test the effect of variables on crops. In such large scale studies, it is difficult and impracticable to isolate and test each variable individually.
Factorial experiment allows subtle manipulation of a large number of interdependent variables. Whilst the method has limitations, it is a useful method for streamlining research and letting powerful statistical methods highlight any correlations.

International Journal of Research Available at https://edupediapublications.org/journals
p-I SSN: 2348 -6848 e-ISSN: 2348-795X
Vol ume 03 I s s ue 1 4 Oc tober 2016
Available online: http://edupediapublications.org/journals/index.php/IJR/ P a g e | 622
Factorial design are extremely useful to field scientists as a preliminary study, allowing them to judge whether there is a link between variables, whilst reducing the possibility of experimental error and confounding variables.
The factorial design allows many levels of analysis as well as highlighting the relationship between variables. It also allows the effects of manipulating a single variable to be isolated and analyzed singly. A factorial design has to be planned meticulously, as an error in one of the levels or in the general operationalization will jeopardize a great amount of work. Other than these slight distractions, a factorial design is a mainstay of many scientific disciplines, delivering great result in the field.
It is to this effect that this research work aim to apply to the yield of maize, three-factor factorial design with “8” replicates per cell. STATEMENT OF PROBLEM Emphasis has been placed on maize yield research which involves the establishment of quantitative relationships between maize yields and multiple factors of production. Although numerous factors, both controlled and uncontrolled, affect maize production, the use of controlled variables such as plant nutrients from fertilizers has attracted the most attention.
It has been noted by many scientists that a particular maize may vary in its response to applied fertilizers depending on season and location effects. This presents a problem in extrapolating predicted yields from one experimental location to a larger geographical general area and, therefore, recommendations also. The causes of this uncertainty have, in general, been recognized, but not much attempts have been made to account for their effects on response of maize to applied fertilizers.
This uncertainty concerning the influence of uncontrolled variables accentuates the need to conduct yield research in a framework that will provide for the quantification of the effects of herbicides and water volume on the response of crops to applied fertilizers.
AIM AND OBJECTIVES OF THE STUDY The aim of this research work is
applying a three-factor factorial design in determine the significant effect of fertilizers, herbicides, and water volumes on the yield of maize.
The objectives are: 1. To determine the significant difference
in the effect of fertilizers on the yield of maize.
2. To determine the significant difference in the effect of herbicides on the yield of maize.
3. To determine the significant difference in the effect of water volumes on the yield of maize.
4. To determine the significant interaction effect between fertilizers and herbicides on the yield of maize.
5. To determine the significant interaction effect between fertilizers and water volumes on the yield of maize.
6. To determine the significant interaction effect between herbicides and water volumes on the yield of maize.
7. To determine the significant interaction effect among fertilizers, herbicides and water volumes on the yield of maize.
SCOPE OF THE STUDY There are many factors that can affect
the yield of maize. This research work covers only three factors which are fertilizers {N:P:K(20:10:10), N:P:K(15:15:15), and UREA}, herbicides (Altraforce, Xtraforce and Metaforce) and water volumes (5litres, 7.5litres, and 10litres). The purpose of this research is to determine how these factors affect the yield of maize independently and collectively. The factorial design employed is a 3 x 3 x 3 replicated factorial design with 8 replicates per cell. RESEARCH QUESTIONS
1. Is there significant difference in the fertilizers’ effect on the yield of maize?
2. Is there significant difference in the herbicides’ effect on the yield of maize?
International Journal of Research Available at https://edupediapublications.org/journals
p-I SSN: 2348 -6848 e-ISSN: 2348-795X
Vol ume 03 I s s ue 1 4 Oc tober 2016
Available online: http://edupediapublications.org/journals/index.php/IJR/ P a g e | 623
3. Is there significant difference in the water volumes’ effect on the yield of maize?
4. Do the fertilizers and herbicides jointly have significant effect on the yield of maize or Is there significant interaction effect between fertilizers and herbicides?
5. Do the fertilizers and water volumes jointly have significant effect on the yield of maize or Is there significant interaction effect between fertilizers and water volumes?
6. Do the herbicides and water volumes jointly have significant effect on the yield of maize or Is there significant interaction effect between herbicides and water volumes?
7. Do the fertilizers, herbicides and water volumes jointly have significant effect on the yield of maize or Is there significant interaction effect among fertilizers, herbicides and water volumes?
RESEARCH HYPOTHESES
Based on the conceptual frame work and objectives of this research work, the following hypotheses direct the conduct and analysis of this research.
𝑯𝟎: Null Hypothesis vs
𝑯𝟏: Alternative Hypothesis Let 𝑨𝒊 represents fertilizers’ effect
𝑩𝒋 represents herbicides’ effect
𝑪𝒌 represents water volumes’ effect 𝑨𝑩(𝒊𝒋) represents fertilizers and herbicides
interaction’s effect
𝑨𝑪(𝒊𝒌) represents fertilizers and water volumes
interaction’s effect 𝑩𝑪(𝒋𝒌) represents herbicides and water volumes
interaction’s effect
𝑨𝑩𝑪(𝒊𝒋𝒌) represents fertilizers, herbicides and
water volumes interaction’s effect
TEST FOR MAIN EFFECTS
Fertilizers
𝐻0: 𝑨𝒊 = 𝟎 (There is no significant difference in the fertilizers’ effect on the yield of maize)
𝐻1: 𝑨𝒊 ≠ 𝟎 (There is significant difference in the fertilizers’ effect on the yield of maize)
Herbicides
𝐻0: 𝑩𝒋 = 𝟎 (There is no significant
difference in the herbicides’ effect on the yield of maize)
𝐻1: 𝑩𝒋 ≠ 𝟎 (There is significant difference
in the herbicides’ effect on the yield of maize)
Water Volumes
𝐻0: 𝑪𝒌 = 𝟎 (There is no significant difference in the water volumes’ effect on the yield of maize)
𝐻1: 𝑪𝒌 ≠ 𝟎 (There is significant difference in the water volumes’ effect on the yield of maize)
TEST FOR INTERACTION EFFECTS
Fertilizers and Herbicides
𝐻0: 𝑨𝑩(𝒊𝒋) = 𝟎 (There is no significant
interaction between fertilizers and herbicides on the yield of maize)
𝐻1: 𝑨𝑩(𝒊𝒋) ≠ 𝟎 (There is significant
interaction between fertilizers and
International Journal of Research Available at https://edupediapublications.org/journals
p-I SSN: 2348 -6848 e-ISSN: 2348-795X
Vol ume 03 I s s ue 1 4 Oc tober 2016
Available online: http://edupediapublications.org/journals/index.php/IJR/ P a g e | 624
herbicides on the yield of maize)
Fertilizers and Water Volumes
𝐻0: 𝑨𝑪(𝒊𝒌) = 𝟎 (There is no significant
interaction between fertilizers and water volumes on the yield of maize)
𝐻1: 𝑨𝑪(𝒊𝒌) ≠ 𝟎 (There is significant
interaction between fertilizers and water volumes on the yield of maize)
Herbicides and Water Volumes
𝐻0: 𝑩𝑪(𝒋𝒌) = 𝟎 (There is no significant
interaction between herbicides and water volumes on the yield of maize)
𝐻1: 𝑩𝑪(𝒋𝒌) ≠ 𝟎 (There is significant
interaction between herbicides and water volumes on the yield of maize)
Fertilizers, Herbicides and Water Volumes
𝐻0: 𝑨𝑩𝑪(𝒊𝒋𝒌) = 𝟎 (There is no significant
interaction among fertilizers, herbicides and water volumes on the yield of maize)
𝐻1: 𝑨𝑩𝑪(𝒊𝒋𝒌) ≠ 𝟎 (There is significant
interaction among fertilizers, herbicides and water volumes on the yield of maize)
LITERATURE REVIEW
Maize (Zea mays L) is one of the major cereal crops grown in the humid tropics and
Sub-Saharan Africa. It is a versatile crop and ranks third following wheat and rice in world production as reported by Food and Agriculture Organization (FAO, 2002). Maize crop is a key source of food and livelihood for millions of people in many countries of the world. It is produced extensively in Nigeria, where it is consumed roasted, baked, fried, pounded or fermented (Agbato, 2003). In advanced countries, it is an important source of many industrial products such as corn sugar, corn oil, corn flour, starch, syrup, brewer’s grit and alcohol (Dutt, 2005). Corn oil is used for salad, soap-making and lubrication. Maize is a major component of livestock feed and it is palatable to poultry, cattle and pigs as it supplies them energy (Iken et al., 2001). The stalk, leaves, grain and immature ears are cherished by different species of livestock (Dutt, 2005).
In spite of the increasing relevance and high demand for maize in Nigeria, yield across the country continues to decrease with an average of about 1 t/ha which is the lowest African yield recorded (Fayenisin, 1993). The steady decline in maize yield can be attributed to:
1. Rapid reduction in soil fertility caused by intensive use of land and reduction of fallow period as reported by Directorate of Information and Publications of Agriculture (DIPA, 2006). 2. Failure to identify and plant high yielding varieties most suited or adapted to each agro-ecological zone (Kim, 1997). 3. Use of inappropriate plant spacing which determines plant population and final yield (Zeidan et al., 2006). Tolera et al., (1999) suggested that
breeders should select maize varieties that combine high grain yield and desirable stover characteristics because of large differences that exist between cultivars. Odeleye and Odeleye (2001) reported that maize varieties differ in their growth characters, yield and its components, and therefore suggested that breeders must select most promising combiners in their breeding programmes.

International Journal of Research Available at https://edupediapublications.org/journals
p-I SSN: 2348 -6848 e-ISSN: 2348-795X
Vol ume 03 I s s ue 1 4 Oc tober 2016
Available online: http://edupediapublications.org/journals/index.php/IJR/ P a g e | 625
Factorial Experiment Factorial Experiments is one involving
two or more factors in single experiments. Such designs are classified by the number of levels of each factors and the number of factors. Factorial experiments are efficient and provide extra information (the interactions between the factors) which cannot be obtained when using single factor design.
If the investigator confines his attention to any single factor we may infer either that he is the unfortunate victim of a doctrinaire theory as to how experimentation should proceed, or that the time, material or equipment at his disposal is too limited to allow him to give attention to more than one aspect of his problem.
Indeed in a wide class of cases (by using factorial designs) an experimental investigation, at the same time as it is made more comprehensive, may also be made more efficient if by more efficient we mean that more knowledge and a higher degree of precision are obtainable by the same number of observations” (Fisher R. A. 1960).
Replication
It is the repetition of the experimental situation by replicating the experimental unit. In the replication principle, any treatment is repeated a number of times to obtain a valid and more reliable estimate than which is possible with one observation only. Replication provides an efficient way of increasing the precision of an experiment. The precision increases with the increase in the number of observations. Replication provides more observations when the same treatment is used, so it increases precision.
Suppose variance of 𝑥 is 𝜎2, then
variance of sample mean 𝑥̅ based on 𝑛
observations is 𝜎2
𝑛 . So as 𝑛 increases 𝑉𝑎𝑟(𝑥̅)
decreases.
Three-factor factorial experiment with ‘n’ replicates per cell
From Table I below, the model for such an experiment is
𝑌𝑖𝑗𝑘𝑚 = 𝜇 + 𝐴𝑖 + 𝐵𝑗 + 𝐶𝑘 + (𝐴𝐵)𝑖𝑗 + (𝐴𝐶)𝑖𝑘 +
(𝐵𝐶)𝑗𝑘 + (𝐴𝐵𝐶)𝑖𝑗𝑘 + 𝑒𝑖𝑗𝑘𝑚 __(1)
𝑖 = 1, 2, … , 𝑎 At a level of factor A 𝑗 = 1, 2, … , 𝑏 At b level of factor B
𝑘 = 1, 2, … , 𝑐 At c level of factor C 𝑚 = 1, 2, … , 𝑛 At n replicates per cell 𝜇 is the base line mean. 𝐴𝑖, 𝐵𝑗 and 𝐶𝑘 are the main factors’ effects.
(𝐴𝐵)𝑖𝑗, (𝐴𝐶)𝑖𝑘 and (𝐵𝐶)𝑗𝑘 are the two-factors’
interaction effects.
(𝐴𝐵𝐶)𝐼𝐽𝐾 is the three-factor interaction effect.
𝑒𝑖𝑗𝑘𝑚 is the random error of the kth observation
from the (i, j, k)th treatment.
Where 𝑒𝑖𝑗𝑘𝑚 ~𝑁(0, 𝜎2) Partitioning the sum of square for three -factor factorial design with ‘n’ replicates per cell
The model is defined as:
𝑌𝑖𝑗𝑘𝑚 = 𝜇 + 𝐴𝑖 + 𝐵𝑗 + 𝐶𝑘 + (𝐴𝐵)𝑖𝑗 + (𝐴𝐶)𝑖𝑘
+ (𝐵𝐶)𝑗𝑘 + (𝐴𝐵𝐶)𝑖𝑗𝑘 + 𝑒𝑖𝑗𝑘𝑚
Let
𝜇 = �̄�….
𝐴𝑖 = �̄�𝑖…– �̄�…. 𝐵𝑗 = �̄�.𝑗.. – �̄�….
𝐶𝑘 = �̄�..𝑘. − �̄�…. (𝐴𝐵)𝑖𝑗 =
�̄�𝑖𝑗..– �̄�𝑖… – �̄�.𝑗.. + �̄�….
(𝐴𝐶)𝑖𝑘 = �̄�𝑖.𝑘.– �̄�𝑖… – �̄�..𝑘. + �̄�…. (𝐵𝐶)𝑗𝑘 = �̄�.𝑗𝑘. – �̄�.𝑗.. – �̄�..𝑘. + �̄�….
(𝐴𝐵𝐶)𝑖𝑗𝑘 = �̄�𝑖𝑗𝑘. – �̄�𝑖𝑗.. – �̄�𝑖.𝑘. – �̄�.𝑗𝑘. + �̄�𝑖… +
�̄�.𝑗.. + �̄�..𝑘. + �̄�….
𝑒𝑖𝑗𝑘𝑚 = 𝑦𝑖𝑗𝑘𝑚 – �̄�𝑖𝑗𝑘.
Thus, substituting the notations into the model we have:
𝑦𝑖𝑗𝑘𝑚 = 𝑦…. + ( �̄�𝑖…– �̄�….) + (�̄�.𝑗..–�̄�….) +
(�̄�..𝑘. – �̄�….) + (�̄�𝑖𝑗..– �̄�𝑖…– �̄�.𝑗.. + �̄�….) +
(�̄�𝑖.𝑘. – �̄�𝑖… – �̄�..𝑘. + �̄�….) + (�̄�.𝑗𝑘. – �̄�.𝑗..– �̄�..𝑘. +
�̄�….) + (�̄�𝑖𝑗𝑘.– �̄�𝑖𝑗.. – �̄�𝑖.𝑘.– �̄�.𝑗𝑘.. + �̄�𝑖… + �̄�.𝑗.. +
�̄�..𝑘. + �̄�….) + (𝑦𝑖𝑗𝑘𝑚 − �̄�𝑖𝑗𝑘.) __(2)
(𝑦𝑖𝑗𝑘𝑚 − �̄�….) = (�̄�𝑖…– �̄�….) + (�̄�.𝑗..–�̄�….) +
(�̄�..𝑘. + �̄�….) + (�̄�𝑖𝑗..– �̄�𝑖…– �̄�.𝑗.. + �̄�….) +
(�̄�𝑖.𝑘. – �̄�𝑖… – �̄�..𝑘. + �̄�….) + (�̄�.𝑗𝑘. – �̄�.𝑗..– �̄�..𝑘. +

International Journal of Research Available at https://edupediapublications.org/journals
p-I SSN: 2348 -6848 e-ISSN: 2348-795X
Vol ume 03 I s s ue 1 4 Oc tober 2016
Available online: http://edupediapublications.org/journals/index.php/IJR/ P a g e | 626
�̄�….) + ( �̄�𝑖𝑗𝑘.– �̄�𝑖𝑗.. – �̄�𝑖.𝑘.– �̄�.𝑗𝑘.. + �̄�𝑖… + �̄�.𝑗.. +
�̄�..𝑘. + �̄�….) + (𝑦𝑖𝑗𝑘𝑚 − �̄�𝑖𝑗𝑘.) __(3)
Let
(𝑦𝑖𝑗𝑘𝑚 − �̄�….) = 𝑝
(�̄�𝑖…– �̄�….) = 𝑞
(�̄�.𝑗..–�̄�….) = 𝑟
(�̄�..𝑘. + �̄�….) = 𝑠
(�̄�𝑖𝑗..– �̄�𝑖…– �̄�.𝑗.. + �̄�….) = 𝑡
(�̄�𝑖.𝑘. – �̄�𝑖… – �̄�..𝑘. + �̄�….) = 𝑢
(�̄�.𝑗𝑘. – �̄�.𝑗..– �̄�..𝑘. + �̄�….) = 𝑣
(�̄�𝑖𝑗𝑘.– �̄�𝑖𝑗.. – �̄�𝑖.𝑘.– �̄�.𝑗𝑘.. + �̄�𝑖… + �̄�.𝑗.. + �̄�..𝑘. +
�̄�….) = 𝑤
(𝑦𝑖𝑗𝑘𝑚 − �̄�𝑖𝑗𝑘.) = 𝑥
So that
𝑝 = 𝑞 + 𝑟 + 𝑠 + 𝑡 + 𝑢 + 𝑣 + 𝑤 + 𝑥 __(4)
Squaring both sides, we have: 𝑝2 = (𝑞 + 𝑟 + 𝑠 + 𝑡 + 𝑢 + 𝑣 + 𝑤 + 𝑥) 2 __(5) That is
𝑝2 = 𝑞2 + 2𝑞𝑟 + 2𝑞𝑠 + 2𝑞𝑡 + 2𝑞𝑢 + 2𝑞𝑣 +2𝑞𝑤 + 2𝑞𝑥 + 𝑟2 + 2𝑟𝑠 + 2𝑟𝑡 + 2𝑟𝑡 + 2𝑟𝑣 +
2𝑟𝑤 + 2𝑟𝑥 + 𝑠2 + 2𝑠𝑡 + 2𝑠𝑢 + 2𝑠𝑣 + 2𝑠𝑤 + 2𝑠𝑥 + 𝑡2 + 2𝑡𝑢 + 2𝑡𝑣 + 2𝑡𝑤 + 2𝑡𝑥 + 𝑢2 + 2𝑢𝑣 + 2𝑢𝑤 + 2𝑢𝑥 + 𝑣2 + 2𝑣𝑤 + 2𝑣𝑥 + 𝑤2 + 2𝑤𝑥 + 𝑥2 __(6) Summing equation __(6) across ith level of factor A, jth level of factor B, kth level of factor C and n replicates per cell respectively, we have it reduced to:
∑ ∑ ∑ ∑ 𝑝2
𝑛
𝑚=1
𝑐
𝑘=1
𝑏
𝑗=1
𝑎
𝑖=1
= 𝑏𝑐𝑛∑ 𝑞2
𝑎
𝑖=1
+ 𝑎𝑐𝑛 ∑ 𝑟2
𝑏
𝑗=1
+𝑎𝑏𝑛 ∑ 𝑠2
𝑐
𝑘=1
+ 𝑛𝑐 ∑∑ 𝑡2
𝑏
𝑗=1
𝑎
𝑖=1
+ 𝑛𝑏 ∑ ∑ 𝑢2
𝑐
𝑘=1
𝑎
𝑖=1
+𝑛𝑎 ∑ ∑ 𝑣2
𝑐
𝑘=1
𝑏
𝑗=1
+ 𝑛 ∑ ∑ ∑ 𝑤2
𝑐
𝑘=1
𝑏
𝑗=1
𝑎
𝑖=1
+ ∑ ∑ ∑ ∑ 𝑥2
𝑛
𝑚=1
𝑐
𝑘=1
𝑏
𝑗=1
𝑎
𝑖=1
__(7) Where,
𝑆𝑆𝑇 = ∑ ∑∑ ∑ (𝑦𝑖𝑗𝑘𝑚– �̄�….)2
𝑛
𝑚=1
𝑐
𝑘=1
𝑏
𝑗=1
𝑎
𝑖=1
__(8)
𝑆𝑆𝐴 = 𝑛𝑏𝑐 ∑(�̄�𝑖…– �̄�….)2
𝑎
𝑖=1
__(9)
𝑆𝑆𝐵 = 𝑛𝑎𝑐 ∑(�̄�.𝑗.. – �̄�….)2
𝑏
𝑗=1
__(10)
𝑆𝑆𝐶 = 𝑛𝑎𝑏 ∑(�̄�..𝑘. − �̄�….)2
𝑐
𝑘=1
__(11)
𝑆𝑆𝐴𝐵 = 𝑛𝑐 ∑∑(�̄�𝑖𝑗..– �̄�𝑖…– �̄�.𝑗.. + �̄�….)2
𝑏
𝑗=1
𝑎
𝑖=1
__(12)
𝑆𝑆𝐴𝐶 = 𝑛𝑏 ∑ ∑(�̄�𝑖.𝑘. – �̄�𝑖… – �̄�..𝑘. + �̄�….)2
𝑐
𝑘=1
𝑎
𝑖=1
__(13)
𝑆𝑆𝐵𝐶 = 𝑛𝑎 ∑ ∑ (�̄�.𝑗𝑘. – �̄�.𝑗..– �̄�..𝑘. + �̄�….)2
𝑐
𝑘=1
𝑏
𝑗=1
__(14)
𝑆𝑆𝐴𝐵𝐶 = 𝑛 ∑ ∑ ∑(�̄�𝑖𝑗𝑘.– �̄�𝑖𝑗.. – �̄�𝑖.𝑘.– �̄�.𝑗𝑘..
𝑐
𝑘=1
𝑏
𝑗=1
𝑎
𝑖=1
+ �̄�𝑖… + �̄�.𝑗.. + �̄�..𝑘. + �̄�….)2
__(15)
𝑆𝑆𝐸𝑅𝑅𝑂𝑅 = ∑ ∑ ∑ ∑ (𝑦𝑖𝑗𝑘𝑚 − �̄�𝑖𝑗𝑘.)2
𝑛
𝑚=1
𝑐
𝑘=1
𝑏
𝑗=1
𝑎
𝑖=1

International Journal of Research Available at https://edupediapublications.org/journals
p-I SSN: 2348 -6848 e-ISSN: 2348-795X
Vol ume 03 I s s ue 1 4 Oc tober 2016
Available online: http://edupediapublications.org/journals/index.php/IJR/ P a g e | 627
__(16) That is,
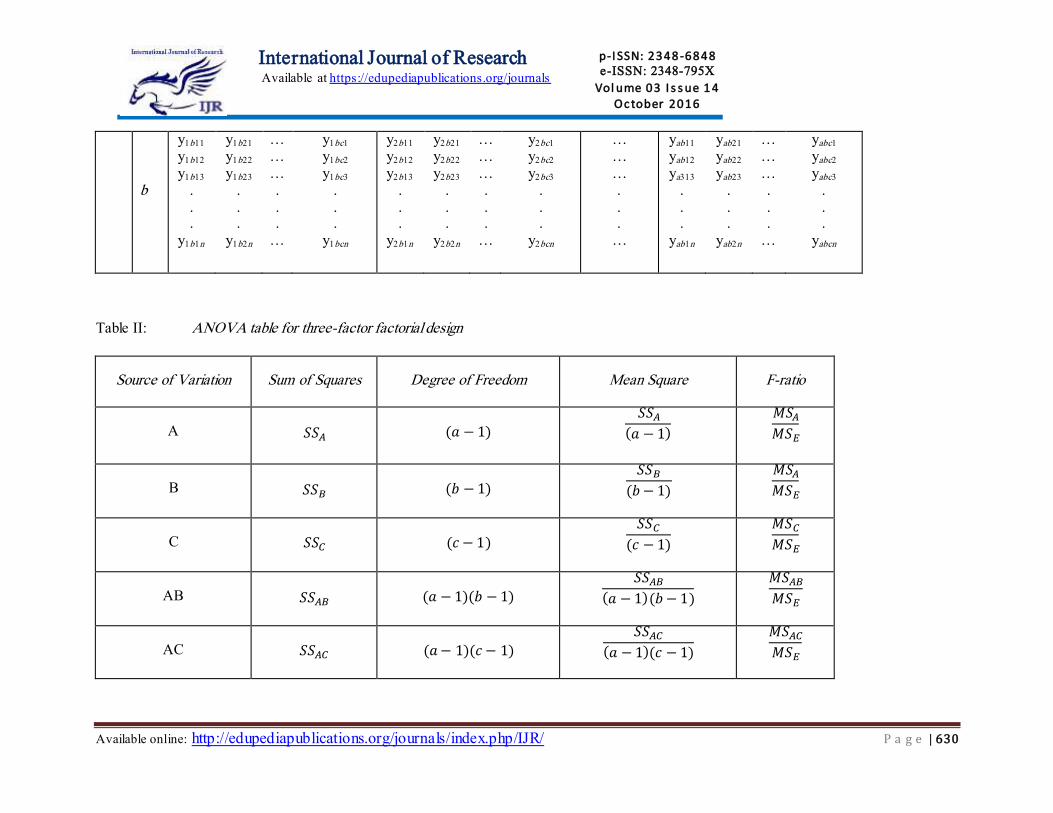
𝑆𝑆𝑇 = 𝑆𝑆𝐴 + 𝑆𝑆𝐵 + 𝑆𝑆𝐶 + 𝑆𝑆𝐴𝐵 + 𝑆𝑆𝐴𝐶 + 𝑆𝑆𝐵𝐶 + 𝑆𝑆𝐴𝐵𝐶 + 𝑆𝑆𝐸 __(17) METHODOLOGY Research Design
In this research work, primary data (yield of maize) were collected from farm cultivated on half plot of land in the year 2016. The half plot of land was first cleared before the ridges were made, the total ridges made were 216 which were segmented into (9), each containing 24 ridges. The 24 ridges were also segmented into 3, which makes it 8 replicates per factor level. The maize (Soar 1) was planted in June 2016, the herbicides (Altraforce, Xtraforce and Metaforce) were applied a day after planting, the water volumes (5Litres, 7.5Litres and 10Litres) were also applied everyday according to how the ridges were segmented irrespective of rainfall.
The fertilizers {N:P:K(20:10:10), N:P:K(15:15:15), and UREA} were applied in August and the maize were harvested in September on the farm land and weighed per ridge in kilogram (kg).
In this research work, there is one dependent variable (Maize yield) and three independent variables (Fertilizers, Herbicide and Water volume) each at three levels.
The experimental design employed was a 3×3×3 factorial experimental design with eight (8) replicates per cell.
The maize yield data collected was presented in Table III below.
Data collected were analyzed electronically using Statistical Package for Social Science (SPSS) version 21. Method of data collection and analysis
Data for this research was collected primarily via experimental/observation method. Collected data was analyzed using a factorial design analysis which involves partitioning the design model into appropriate Sum of Squares
(SS) with respective degree of freedoms as sampled in Table II below.
𝑆𝑆𝑇𝑂𝑇𝐴𝐿 = ∑ ∑ ∑ ∑ 𝑦𝑖𝑗𝑘𝑚2
𝑛
𝑚=1
𝑐
𝑘=1
𝑏
𝑗=1
𝑎
𝑖=1
− (𝑦….)
2
𝑛𝑎𝑏𝑐
𝑆𝑆𝐹𝐸𝑅𝑇𝐼𝐿𝐼𝑍𝐸𝑅 = ∑�̄�𝑖…
2
𝑛𝑏𝑐
𝑎
𝑖=1
− (𝑦….)
2
𝑛𝑎𝑏𝑐
With (3 – 1) = 2 degree of freedom.
𝑆𝑆𝐻𝐸𝑅𝐵𝐼𝐶𝐼𝐷𝐸 = ∑�̄�.𝑗..
2
𝑛𝑎𝑐
𝑏
𝑗=1
− (𝑦….)
2
𝑛𝑎𝑏𝑐
With (3 – 1) = 2 degree of freedom.
𝑆𝑆𝑊𝐴𝑇𝐸𝑅 𝑉𝑂𝐿𝑈𝑀𝐸 = ∑�̄�..𝑘.
2
𝑛𝑎𝑏
𝑐
𝑘=1
– (𝑦…. )
2
𝑛𝑎𝑏𝑐
With (3 – 1) = 2 degree of freedom.
𝑆𝑆𝐹𝐸𝑅𝑇𝐼𝐿𝐼𝑍𝐸𝑅 𝐴𝑁𝐷 𝐻𝐸𝑅𝐵𝐼𝐶𝐼𝐷𝐸
= ∑ ∑�̄�𝑖𝑗..
2
𝑛𝑐
𝑏
𝑗=1
𝑎
𝑖=1
−(𝑦….)
2
𝑛𝑎𝑏𝑐− 𝑆𝑆𝐹𝐸𝑅𝑇𝐼𝐿𝐼𝑍𝐸𝑅
− 𝑆𝑆𝐻𝐸𝑅𝐵𝐼𝐶𝐼𝐷𝐸 With 4 degree of freedom.
𝑆𝑆𝐹𝐸𝑅𝑇𝐼𝐿𝐼𝑍𝐸𝑅 𝐴𝑁𝐷 𝑊𝐴𝑇𝐸𝑅
= ∑ ∑�̄�𝑖.𝑘.
2
𝑛𝑏
𝑐
𝑘=1
𝑎
𝑖=1
−(𝑦….)
2
𝑛𝑎𝑏𝑐− 𝑆𝑆𝐹𝐸𝑅𝑇𝐼𝐿𝐼𝑍𝐸𝑅
− 𝑆𝑆𝑊𝐴𝑇𝐸𝑅 𝑉𝑂𝐿𝑈𝑀𝐸 With 4 degree of freedom.
𝑆𝑆𝐻𝐸𝑅𝐵𝐼𝐶𝐼𝐷𝐸 𝐴𝑁𝐷 𝑊𝐴𝑇𝐸𝑅
= ∑ ∑�̄�.𝑗𝑘.
2
𝑛𝑎
𝑐
𝑘=1
𝑏
𝑗=1
−(𝑦….)
2
𝑛𝑎𝑏𝑐− 𝑆𝑆𝐻𝐸𝑅𝐵𝐼𝐶𝐼𝐷𝐸
− 𝑆𝑆𝑊𝐴𝑇𝐸𝑅 𝑉𝑂𝐿𝑈𝑀𝐸 With 4 degree of freedom.
International Journal of Research Available at https://edupediapublications.org/journals
p-I SSN: 2348 -6848 e-ISSN: 2348-795X
Vol ume 03 I s s ue 1 4 Oc tober 2016
Available online: http://edupediapublications.org/journals/index.php/IJR/ P a g e | 628
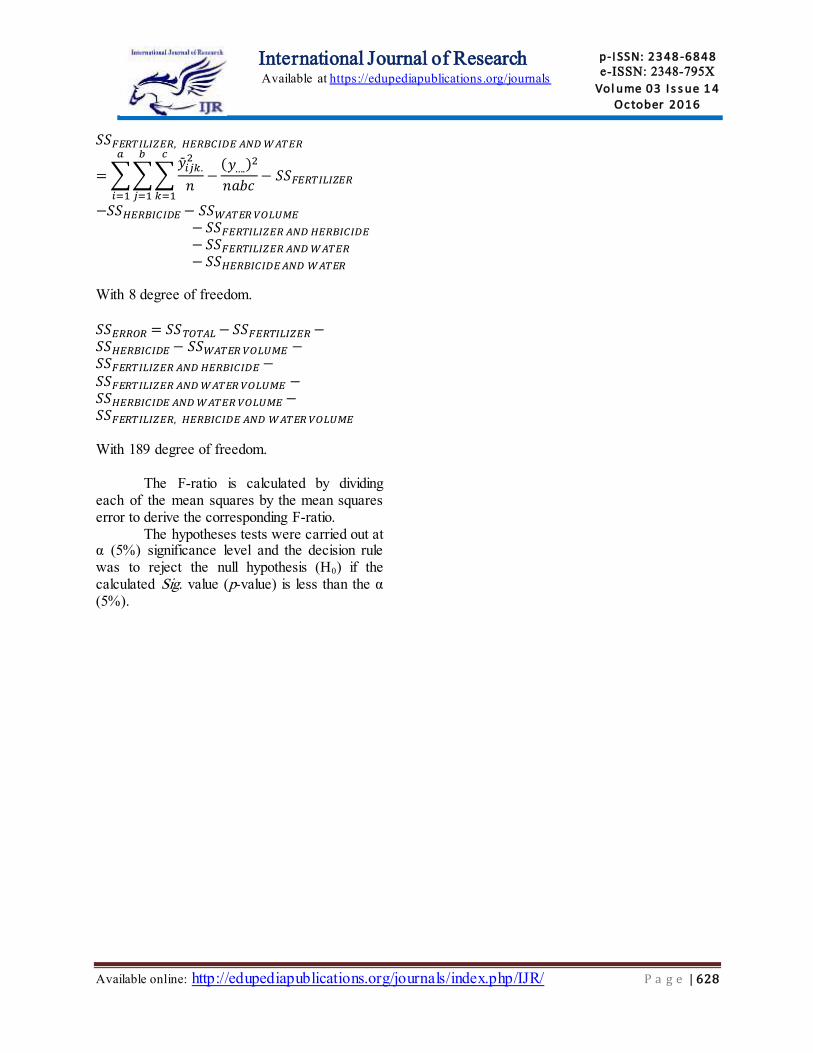
𝑆𝑆𝐹𝐸𝑅𝑇𝐼𝐿𝐼𝑍𝐸𝑅, 𝐻𝐸𝑅𝐵𝐶𝐼𝐷𝐸 𝐴𝑁𝐷 𝑊𝐴𝑇𝐸𝑅
= ∑ ∑ ∑�̄�𝑖𝑗𝑘.
2
𝑛
𝑐
𝑘=1
𝑏
𝑗=1
𝑎
𝑖=1
−(𝑦….)
2
𝑛𝑎𝑏𝑐− 𝑆𝑆𝐹𝐸𝑅𝑇𝐼𝐿𝐼𝑍𝐸𝑅
−𝑆𝑆𝐻𝐸𝑅𝐵𝐼𝐶𝐼𝐷𝐸 − 𝑆𝑆𝑊𝐴𝑇𝐸𝑅 𝑉𝑂𝐿𝑈𝑀𝐸
− 𝑆𝑆𝐹𝐸𝑅𝑇𝐼𝐿𝐼𝑍𝐸𝑅 𝐴𝑁𝐷 𝐻𝐸𝑅𝐵𝐼𝐶𝐼𝐷𝐸
− 𝑆𝑆𝐹𝐸𝑅𝑇𝐼𝐿𝐼𝑍𝐸𝑅 𝐴𝑁𝐷 𝑊𝐴𝑇𝐸𝑅
− 𝑆𝑆𝐻𝐸𝑅𝐵𝐼𝐶𝐼𝐷𝐸 𝐴𝑁𝐷 𝑊𝐴𝑇𝐸𝑅 With 8 degree of freedom.
𝑆𝑆𝐸𝑅𝑅𝑂𝑅 = 𝑆𝑆𝑇𝑂𝑇𝐴𝐿 − 𝑆𝑆𝐹𝐸𝑅𝑇𝐼𝐿𝐼𝑍𝐸𝑅 −𝑆𝑆𝐻𝐸𝑅𝐵𝐼𝐶𝐼𝐷𝐸 − 𝑆𝑆𝑊𝐴𝑇𝐸𝑅 𝑉𝑂𝐿𝑈𝑀𝐸 −𝑆𝑆𝐹𝐸𝑅𝑇𝐼𝐿𝐼𝑍𝐸𝑅 𝐴𝑁𝐷 𝐻𝐸𝑅𝐵𝐼𝐶𝐼𝐷𝐸 −𝑆𝑆𝐹𝐸𝑅𝑇𝐼𝐿𝐼𝑍𝐸𝑅 𝐴𝑁𝐷 𝑊𝐴𝑇𝐸𝑅 𝑉𝑂𝐿𝑈𝑀𝐸 −𝑆𝑆𝐻𝐸𝑅𝐵𝐼𝐶𝐼𝐷𝐸 𝐴𝑁𝐷 𝑊𝐴𝑇𝐸𝑅 𝑉𝑂𝐿𝑈𝑀𝐸 −𝑆𝑆𝐹𝐸𝑅𝑇𝐼𝐿𝐼𝑍𝐸𝑅, 𝐻𝐸𝑅𝐵𝐼𝐶𝐼𝐷𝐸 𝐴𝑁𝐷 𝑊𝐴𝑇𝐸𝑅 𝑉𝑂𝐿𝑈𝑀𝐸 With 189 degree of freedom.
The F-ratio is calculated by dividing each of the mean squares by the mean squares error to derive the corresponding F-ratio.
The hypotheses tests were carried out at α (5%) significance level and the decision rule was to reject the null hypothesis (H0) if the calculated Sig. value (p-value) is less than the α (5%).

International Journal of Research Available at https://edupediapublications.org/journals
p-I SSN: 2348 -6848 e-ISSN: 2348-795X
Vol ume 03 I s s ue 1 4 October 2016
Available online: http://edupediapublications.org/journals/index.php/IJR/ P a g e | 629
Table I: Typical table of a three-factor factorial experimental design with n replicates per cell
B
A
1 2 … a
C C C
1 2 … c 1 2 … c ... 1 2 … c
1
y1111
y1112
y1113
.
.
. y111n
y1121
y1122
y1123
.
.
. y112n
… … … . . .
…
y11c1
y11 c2
y11 c3
.
.
. y11 cn
y2111
y2112
y2113
.
.
. y211n
y2121
y2122
y2123
.
.
. y212n
… … … . . .
…
y21c1
y21c2
y21c3
.
.
. y21cn
… … … . . .
…
ya111
ya112
ya113
.
.
. ya111n
ya121
ya122
ya123
.
.
. ya12n
… … … . . .
…
ya1c1
ya1c 2
ya1c 3
.
.
. ya1cn
2
y1211
y1212
y1213
.
.
. y121n
y1221
y1222
y1223
.
.
. y122n
… … … . . .
…
y12c1
y12c2
y12c3
.
.
. y12cn
y2211
y2212
y2213
.
.
. y221n
y2221
y2222
y2223
.
.
. y222n
… … … . . .
…
y22c1
y22c2
y2233
.
.
. y22cn
… … … . . .
…
ya211
ya212
y3213
.
.
. ya31n
ya221
ya222
ya223
.
.
. ya22n
… … … . . .
…
ya2c1
ya2c2
ya2c3
.
.
. ya2cn
.
.
.
. . .
. . .
. . .
. . .
International Journal of Research Available at https://edupediapublications.org/journals
p-I SSN: 2348 -6848 e-ISSN: 2348-795X
Vol ume 03 I s s ue 1 4 October 2016
Available online: http://edupediapublications.org/journals/index.php/IJR/ P a g e | 630
b
y1b11
y1b12
y1b13
.
.
. y1b1n
y1b21
y1b22
y1b23
.
.
. y1b2n
… … … . . .
…
y1bc1
y1bc2
y1bc3
.
.
. y1bcn
y2b11
y2b12
y2b13
.
.
. y2b1n
y2b21
y2b22
y2b23
.
.
. y2b2n
… … … . . .
…
y2bc1
y2bc2
y2bc3
.
.
. y2bcn
… … … . . .
…
yab11
yab12
ya313
.
.
. yab1n
yab21
yab22
yab23
.
.
. yab2n
… … … . . .
…
yabc1
yabc2
yabc3
.
.
. yabcn
Table II: ANOVA table for three-factor factorial design
Source of Variation
Sum of Squares
Degree of Freedom
Mean Square
F-ratio
A
𝑆𝑆𝐴
(𝑎 − 1)
𝑆𝑆𝐴
(𝑎 − 1)
𝑀𝑆𝐴
𝑀𝑆𝐸
B
𝑆𝑆𝐵
(𝑏 − 1)
𝑆𝑆𝐵
(𝑏 − 1)
𝑀𝑆𝐴
𝑀𝑆𝐸
C
𝑆𝑆𝐶
(𝑐 − 1)
𝑆𝑆𝐶
(𝑐 − 1)
𝑀𝑆𝐶
𝑀𝑆𝐸
AB
𝑆𝑆𝐴𝐵
(𝑎 − 1)(𝑏 − 1)
𝑆𝑆𝐴𝐵
(𝑎 − 1)(𝑏 − 1)
𝑀𝑆𝐴𝐵
𝑀𝑆𝐸
AC
𝑆𝑆𝐴𝐶
(𝑎 − 1)(𝑐 − 1)
𝑆𝑆𝐴𝐶
(𝑎 − 1)(𝑐 − 1)
𝑀𝑆𝐴𝐶
𝑀𝑆𝐸

International Journal of Research Available at https://edupediapublications.org/journals
p-I SSN: 2348 -6848 e-ISSN: 2348-795X
Vol ume 03 I s s ue 1 4 October 2016
Available online: http://edupediapublications.org/journals/index.php/IJR/ P a g e | 631
BC
𝑆𝑆𝐵𝐶
(𝑏 − 1)(𝑐 − 1)
𝑆𝑆𝐵𝐶
(𝑏 − 1)(𝑐 − 1)
𝑀𝑆𝐵𝐶
𝑀𝑆𝐸
ABC
𝑆𝑆𝐴𝐵𝐶
(𝑎 − 1)(𝑏 − 1)(𝑐 − 1)
𝑆𝑆𝐴𝐵𝐶
(𝑎 − 1)(𝑏 − 1)(𝑐 − 1)
𝑀𝑆𝐴𝐵𝐶
𝑀𝑆𝐸
Error
𝑆𝑆𝐸𝑅𝑅𝑂𝑅
𝑎𝑏𝑐 (𝑛 − 1)
𝑆𝑆𝐸𝑅𝑅𝑂𝑅
𝑎𝑏𝑐 (𝑛 − 1)
Total
𝑆𝑆𝑇𝑂𝑇𝐴𝐿
𝑁 − 1
Table III: 33 Factorial design of maize yield (kg) with 8 replicates per cell
HE
RB
ICID
ES
FERTILIZER
NPK 201010 NPK 151515 UREA
WATER VOLUME
WATER VOLUME WATER VOLUME
5
liters 7.5
liters 10
liters 5
liters 7.5
liters 10
liters 5
liters 7.5
liters 10
liters

International Journal of Research Available at https://edupediapublications.org/journals
p-I SSN: 2348 -6848 e-ISSN: 2348-795X
Vol ume 03 I s s ue 1 4 October 2016
Available online: http://edupediapublications.org/journals/index.php/IJR/ P a g e | 632
AL
TR
AF
OR
CE
0.10 0.03 0.24 0.09 0.07 0.15 0.18 0.12
0.10 0.10 0.33 0.05 0.30 0.05 0.10 0.14
0.16 0.10 0.09 0.12 0.11 0.11 0.11 0.11
0.17 0.13 0.10 0.12 0.03 0.24 0.10 0.17
0.19 0.14 0.90 0.13 0.23 0.15 0.15 0.15
0.19 0.30 0.24 0.15 0.37 0.50 0.20 0.20
0.04 0.05 0.15 0.13 0.04 0.04 0.12 0.12
0.02 0.22 0.15 0.10 0.15 0.15 0.15 0.15
0.15 0.20 0.11 0.15 0.15 0.15 0.15 0.15
XT
RA
FO
RC
E
0.17 0.24 0.15 0.16 0.18 0.04 0.19 0.19
0.25 0.19 0.11 0.26 0.20 0.20 0.20 0.20
0.14 0.08 0.29 0.19 0.09 0.10 0.01 0.11
0.35 0.37 0.35 0.26 0.05 0.12 0.30 0.12
0.16 0.13 0.34 0.17 0.10 0.70 0.05 0.16
0.11 0.19 0.24 0.09 0.26 0.47 0.24 0.08
0.13 0.11 0.10 0.13 0.15 0.05 0.12 0.91
0.15 0.11 0.16 0.10 0.06 0.13 0.13 0.13
0.07 0.16 0.05 0.12 0.03 0.04 0.08 0.08
ME
TA
FO
RC
E
0.04 0.34 0.44 0.24 0.13 0.25 0.16 0.27
0.04 0.06 0.10 0.12 0.12 0.12 0.12 0.12
0.14 0.14 0.16 0.14 0.15 0.19 0.09 0.11
0.06 0.09 0.16 0.06 0.25 0.24 0.17 0.17
0.11 0.11 0.07 0.02 0.05 0.10 0.16 0.29
0.19 0.17 0.29 0.27 0.03 0.13 0.17 0.18
0.24 0.10 0.15 0.06 0.13 0.08 0.15 0.15
0.20 0.12 0.14 0.15 0.10 0.11 0.16 0.20
0.04 0.08 0.15 0.16 0.10 0.14 0.15 0.14
Source: Field Experiment (2016).
International Journal of Research Available at https://edupediapublications.org/journals
p-I SSN: 2348 -6848 e-ISSN: 2348-795X
Vol ume 03 I s s ue 1 4 Oc tober 2016
Available online: http://edupediapublications.org/journals/index.php/IJR/ P a g e | 633
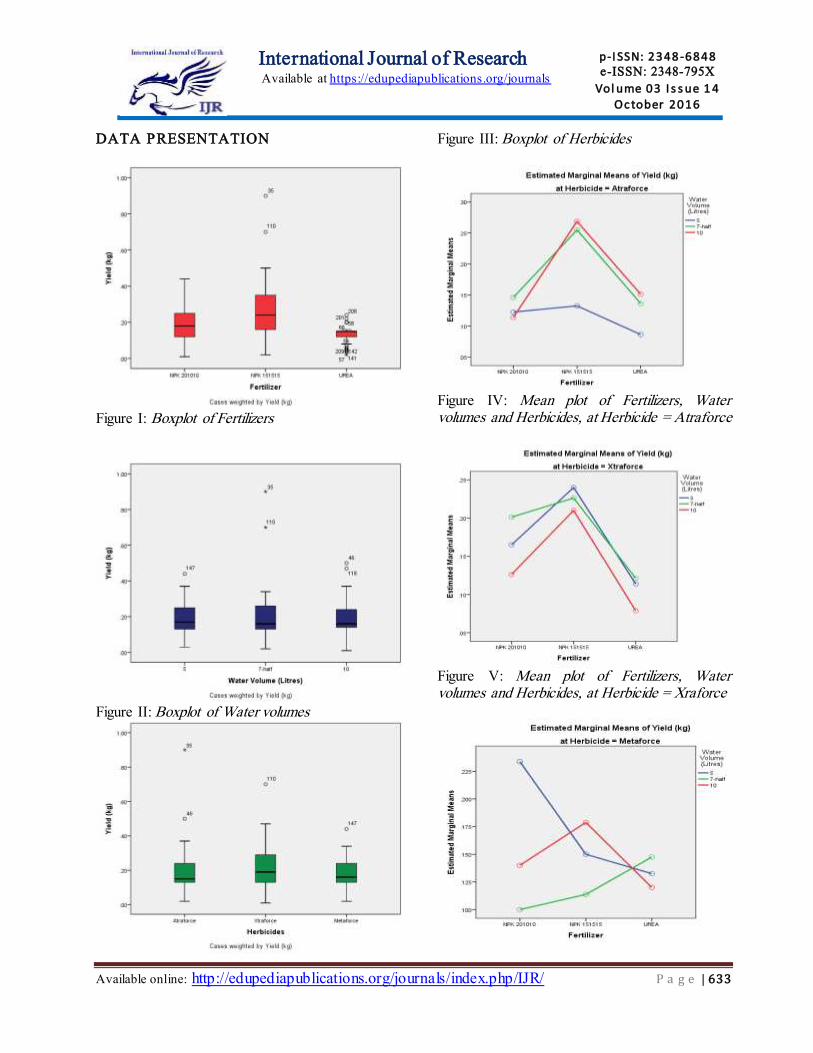
DATA PRESENTATION
Figure I: Boxplot of Fertilizers
Figure II: Boxplot of Water volumes
Figure III: Boxplot of Herbicides
Figure IV: Mean plot of Fertilizers, Water volumes and Herbicides, at Herbicide = Atraforce
Figure V: Mean plot of Fertilizers, Water volumes and Herbicides, at Herbicide = Xraforce
International Journal of Research Available at https://edupediapublications.org/journals
p-I SSN: 2348 -6848 e-ISSN: 2348-795X
Vol ume 03 I s s ue 1 4 Oc tober 2016
Available online: http://edupediapublications.org/journals/index.php/IJR/ P a g e | 634
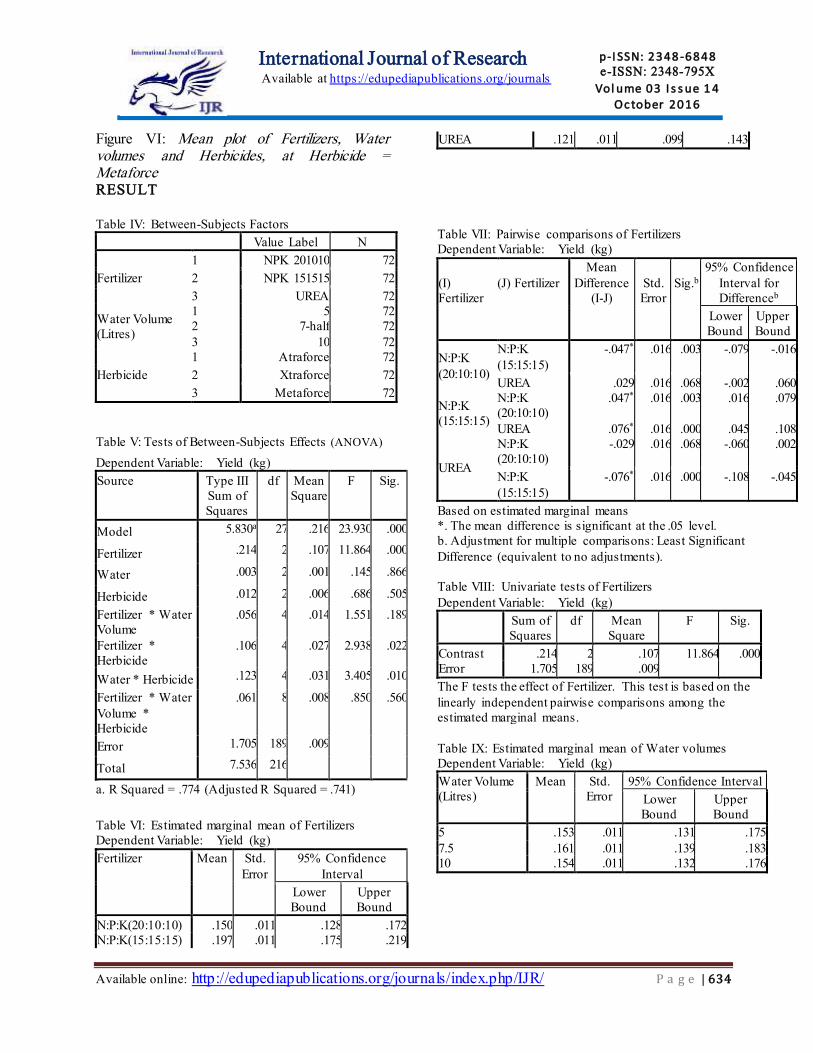
Figure VI: Mean plot of Fertilizers, Water volumes and Herbicides, at Herbicide = Metaforce RESULT Table IV: Between-Subjects Factors
Value Label N
Fertilizer
1 NPK 201010 72
2 NPK 151515 72
3 UREA 72
Water Volume
(Litres)
1 5 72
2 7-half 72
3 10 72
Herbicide
1 Atraforce 72
2 Xtraforce 72
3 Metaforce 72
Table V: Tests of Between-Subjects Effects (ANOVA)
Dependent Variable: Yield (kg)
Source Type III
Sum of
Squares
df Mean
Square
F Sig.
Model 5.830a 27 .216 23.930 .000
Fertilizer .214 2 .107 11.864 .000
Water .003 2 .001 .145 .866
Herbicide .012 2 .006 .686 .505
Fertilizer * Water
Volume
.056 4 .014 1.551 .189
Fertilizer *
Herbicide
.106 4 .027 2.938 .022
Water * Herbicide .123 4 .031 3.405 .010
Fertilizer * Water
Volume *
Herbicide
.061 8 .008 .850 .560
Error 1.705 189 .009
Total 7.536 216
a. R Squared = .774 (Adjusted R Squared = .741)
Table VI: Estimated marginal mean of Fertilizers
Dependent Variable: Yield (kg)
Fertilizer Mean Std.
Error
95% Confidence
Interval
Lower
Bound
Upper
Bound
N:P:K(20:10:10) .150 .011 .128 .172
N:P:K(15:15:15) .197 .011 .175 .219
UREA .121 .011 .099 .143
Table VII: Pairwise comparisons of Fertilizers
Dependent Variable: Yield (kg)
(I)
Fertilizer
(J) Fertilizer
Mean
Difference
(I-J)
Std.
Error
Sig.b
95% Confidence
Interval for
Differenceb
Lower
Bound
Upper
Bound
N:P:K
(20:10:10)
N:P:K
(15:15:15)
-.047* .016 .003 -.079 -.016
UREA .029 .016 .068 -.002 .060
N:P:K
(15:15:15)
N:P:K
(20:10:10)
.047* .016 .003 .016 .079
UREA .076* .016 .000 .045 .108
UREA
N:P:K
(20:10:10)
-.029 .016 .068 -.060 .002
N:P:K
(15:15:15)
-.076* .016 .000 -.108 -.045
Based on estimated marginal means
*. The mean difference is significant at the .05 level.
b. Adjustment for multiple comparisons: Least Significant
Difference (equivalent to no adjustments).
Table VIII: Univariate tests of Fertilizers
Dependent Variable: Yield (kg)
Sum of
Squares
df Mean
Square
F Sig.
Contrast .214 2 .107 11.864 .000
Error 1.705 189 .009
The F tests the effect of Fertilizer. This test is based on the
linearly independent pairwise comparisons among the
estimated marginal means.
Table IX: Estimated marginal mean of Water volumes
Dependent Variable: Yield (kg)
Water Volume
(Litres)
Mean Std.
Error
95% Confidence Interval
Lower
Bound
Upper
Bound
5 .153 .011 .131 .175
7.5 .161 .011 .139 .183
10 .154 .011 .132 .176

International Journal of Research Available at https://edupediapublications.org/journals
p-I SSN: 2348 -6848 e-ISSN: 2348-795X
Vol ume 03 I s s ue 1 4 Oc tober 2016
Available online: http://edupediapublications.org/journals/index.php/IJR/ P a g e | 635
Table X: Pairwise comparisons of Water volumes
Dependent Variable: Yield (kg)
(I) Water
Volume
(Litres)
(J) Water
Volume
(Litres)
Mean
Differe
nce
(I-J)
Std.
Error
Sig.a
95% Confidence
Interval for
Differencea
Lower
Bound
Upper
Bound
5 7.5 -.008 .016 .618 -.039 .023
10 -.001 .016 .937 -.032 .030
7.5 5 .008 .016 .618 -.023 .039
10 .007 .016 .674 -.025 .038
10 5 .001 .016 .937 -.030 .032
7.5 -.007 .016 .674 -.038 .025
Based on estimated marginal means
a. Adjustment for multiple comparisons: Least Significant
Difference (equivalent to no adjustments).
Table XI: Univariate tests of Water volumes
Sum of
Squares
df Mean
Square
F Sig.
Contrast .003 2 .001 .145 .866
Error 1.705 189 .009
The F tests the effect of Water Volume (Litres). This
test is based on the linearly independent pairwise
comparisons among the estimated marginal means.
Table XII: Estimated marginal mean of Herbicides
Dependent Variable: Yield (kg)
Herbicide Mean Std.
Error
95% Confidence
Interval
Lower
Bound
Upper
Bound
Atraforce .157 .011 .135 .179
Xtraforce .165 .011 .143 .187
Metaforce .146 .011 .124 .168
Table XIII: Pairwise comparisons of Herbicides
Dependent Variable: Yield (kg)
(I)
Herbicide
(J)
Herbicide
Mean
Differe
nce
(I-J)
Std.
Error
Sig.a
95% Confidence Interval for
Differencea
Lower
Bound
Upper
Bound
Atraforce Xtraforce -.008 .016 .624 -.039 .023
Metaforce .011 .016 .500 -.021 .042
Xtraforce Atraforce .008 .016 .624 -.023 .039
Metaforce .018 .016 .245 -.013 .050
Metaforce Atraforce -.011 .016 .500 -.042 .021
Xtraforce -.018 .016 .245 -.050 .013
Based on estimated marginal means
a. Adjustment for multiple comparisons: Least
Significant Difference (equivalent to no adjustments).
Table XIV: Univariate tests of Herbicide
Dependent Variable: Yield (kg)
Sum of
Squares
df Mean
Square
F Sig.
Contrast .012 2 .006 .686 .505
Error 1.705 189 .009
The F tests the effect of Herbicide. This test is based on the
linearly independent pairwise comparisons among the
estimated marginal means.
Table XV: Pairwise comparisons of Fertilizers and
Water volumes
Dependent Variable: Yield (kg)
Fertilizer Water
Volume
(Litres)
Mean Std.
Error
95% Confidence
Interval
Lower
Bound
Upper
Bound
N:P:K(20:10:10)
5 .174 .019 .136 .212
7.5 .149 .019 .111 .187
10 .127 .019 .088 .165
N:P:K(15:15:15)
5 .174 .019 .136 .212
7.5 .198 .019 .160 .237
10 .219 .019 .181 .257
UREA
5 .111 .019 .073 .149
7.5 .135 .019 .097 .173
10 .117 .019 .078 .155
Table XVI: Pairwise comparisons of Fertilizers and
Herbicides
Dependent Variable: Yield (kg)
Fertilizer Herbicide Mean Std.
Error
95% Confidence
Interval
Lower
Bound
Upper
Bound
N:P:K(20:10:10)
Atraforce .128 .019 .089 .166
Xtraforce .164 .019 .126 .202
Metaforce .158 .019 .120 .196
N:P:K(15:15:15)
Atraforce .219 .019 .181 .257
Xtraforce .225 .019 .187 .264
Metaforce .148 .019 .109 .186
UREA
Atraforce .125 .019 .086 .163
Xtraforce .105 .019 .066 .143
Metaforce .133 .019 .095 .172

International Journal of Research Available at https://edupediapublications.org/journals
p-I SSN: 2348 -6848 e-ISSN: 2348-795X
Vol ume 03 I s s ue 1 4 Oc tober 2016
Available online: http://edupediapublications.org/journals/index.php/IJR/ P a g e | 636
Table XVII: Pairwise comparisons of Water volumes
and Herbicides
Dependent Variable: Yield (kg)
Water
Volume
(Litres)
Herbicide Mean Std.
Error
95%
Confidence
Interval
Lower
Bound
Upper
Bound
5
Atraforce .114 .019 .076 .152
Xtraforce .173 .019 .135 .211
Metaforce .172 .019 .134 .210
7.5
Atraforce .179 .019 .141 .217
Xtraforce .183 .019 .145 .221
Metaforce .120 .019 .082 .159
10
Atraforce .178 .019 .140 .216
Xtraforce .138 .019 .100 .177
Metaforce .146 .019 .108 .184
Table XVIII: Pairwise comparisons of Fertilizers,
Water volumes and Herbicides
Dependent Variable: Yield (kg)
Fertilizer Water
Volume
(Litres)
Herbi
cide
Mean Std.
Error
95%
Confidence
Interval
Lower
Bound
Upper
Bound
N:P:K
(20:10:10)
5
Atra
force
.123 .034 .056 .189
Xtra
force
.165 .034 .099 .231
Meta
force
.234 .034 .168 .300
7.5
Atra
force
.146 .034 .080 .212
Xtra
force
.201 .034 .135 .267
Meta
force
.100 .034 .034 .166
10
Atra
force
.114 .034 .048 .180
Xtra
force
.126 .034 .060 .192
Meta
force
.140 .034 .074 .206
N:P:K
(15:15:15) 5
Atra
force
.133 .034 .066 .199
Xtra
force
.240 .034 .174 .306
Meta
force
.150 .034 .084 .216
7.5
Atra
force
.255 .034 .189 .321
Xtra
force
.226 .034 .160 .292
Meta
force
.114 .034 .048 .180
10
Atra
force
.269 .034 .203 .335
Xtra
force
.210 .034 .144 .276
Meta
force
.179 .034 .113 .245
UREA
5
Atra
force
.086 .034 .020 .152
Xtra
force
.114 .034 .048 .180
Meta
force
.133 .034 .066 .199
7.5
Atra
force
.136 .034 .070 .202
Xtra
force
.121 .034 .055 .187
Meta
force
.148 .034 .081 .214
10
Atra
force
.151 .034 .085 .217
Xtra
force
.079 .034 .013 .145
Meta
force
.120 .034 .054 .186

International Journal of Research Available at https://edupediapublications.org/journals
p-I SSN: 2348 -6848 e-ISSN: 2348-795X
Vol ume 03 I s s ue 1 4 October 2016
Available online: http://edupediapublications.org/journals/index.php/IJR/ P a g e | 637
Table XIX: Summary of results
Source Sig. Remark
Fertilizer .000 Significant
Water .866 Insignificant Herbicide .505 Insignificant
Fertilizer * Water Volume .189 Insignificant Fertilizer * Herbicide .022 Significant
Water * Herbicide .010 Significant
Fertilizer * Water Volume * Herbicide .560 Insignificant
FERTILIZER
N:P:K (20:10:10) N:P:K (15:15:15) .003 Significant
UREA .068 Insignificant
N:P:K (15:15:15) N:P:K (20:10:10) .003 Significant
UREA .000 Significant
UREA N:P:K (20:10:10) .068 Insignificant
N:P:K (15:15:15) .000 Significant
WATER VOLUME
5 7.5 .618 Insignificant 10 .937 Insignificant
7.5 5 .618 Insignificant
10 .674 Insignificant
10 5 .937 Insignificant
7.5 .674 Insignificant
HERBICIDE
Atraforce Xtraforce .624 Insignificant Metaforce .500 Insignificant
Xtraforce Atraforce .624 Insignificant Metaforce .245 Insignificant
Metaforce Atraforce .500 Insignificant Xtraforce .245 Insignificant

International Journal of Research Available at https://edupediapublications.org/journals
p-I SSN: 2348 -6848 e-ISSN: 2348-795X
Vol ume 03 I s s ue 1 4 Oc tober 2016
Available online: http://edupediapublications.org/journals/index.php/IJR/ P a g e | 638
DISCUSSION OF RESULTS From the ANOVA table (Table V), the
Sig. value of 0.000 for Fertilizers implies that the null hypothesis of no significant difference in the fertilizers effect on the yield of maize is rejected. The Sig. value of 0.866 for Water volumes implies that the null hypothesis of no significant difference in the water volumes effect on the yield of maize is not rejected. The Sig. value of 0.505 for Herbicides implies that the null hypothesis of no significant difference in the herbicides effect on the yield of maize is not rejected. The Sig. value of 0.189 for Fertilizers and Water volumes interaction implies that the null hypothesis of no significant interaction between fertilizers and water volumes on the yield of maize is not rejected. The Sig. value of 0.022 for Fertilizers and Herbicides interaction implies that the null hypothesis of no significant interaction between fertilizers and herbicides on the yield of maize is rejected. The Sig. value of 0.001 for Water volumes and Herbicides interaction implies that the null hypothesis of no significant interaction between fertilizers and herbicides on the yield of maize is rejected. The Sig. value of 0.560 for Fertilizers, Water volumes and Herbicides interaction implies that the null hypothesis of no significant interaction between fertilizers, water volumes and herbicides on the yield of maize is not rejected.
From Table VI, the mean yield of maize by N:P:K(20:10:10), N:P:K(15:15:15) and UREA is 0.150kg, 0.197kg and 0.121kg respectively. From Table VII, the mean maize yield difference between N:P:K(20:10:10) and N:P:K(15:15:15), N:P:K(20:10:10) and UREA, N:P:K(15:15:15) and UREA is 0.047kg, 0.029 and 0.076 respectively. Of these mean yield difference between the fertilizers, only the differences between N:P:K(20:10:10) and N:P:K(15:15:15), N:P:K(15:15:15) and UREA are significant with a Sig. value of 0.003 and 0.000 respectively.
From Table IX, mean yield of maize by 5litres, 7.5litres and 10litres of water is 0.153kg, 0.161kg and 0.154kg respectively. From Table X, the mean maize yield difference between 5litres and 7.5litres, 5litres and 10litres, 7.5litres
and 10litres is 0.008kg, 0.001kg and 0.007kg respectively. However none of the mean yield differences is significant.
From Table XII, the mean yield of maize by Atraforce, Xtraforce and Metaforce is 0.157kg, 0.165kg and 0.146kg respectively. From Table XIII, the mean maize yield difference between Atraforce and Xtraforce, Atraforce and Metaforce, Xtraforce and Metaforce is 0.008kg, 0.011kg, and 0.018kg respectively. However none of the mean yield difference is significant.
CONCLUSIONS
On the basis of the scope, methodology and analysis of the data, it can be concluded that at 5% significant level: 1. There is significant difference in the
fertilizers effect on the yield of maize. 2. There is no significant difference in the
herbicides effect on the yield of maize. 3. There is no significant difference in the
water volumes effect on the yield of maize.
4. There is significant interaction effect between fertilizers and herbicides on the yield of maize.
5. There is no significant interaction effect between fertilizers and water volumes on the yield of maize.
6. There is significant interaction effect between herbicides and water volumes on the yield of maize.
7. There is no significant interaction effect between fertilizers, herbicides and water volumes on the yield of maize.
RECOMMENDATIONS
In the light of the findings of this study, the following recommendations are made for adequate maize yield in Nigeria. 1. The significant difference in the
fertilizers effect on the yield of maize implies that the three fertilizers do not perform equally on the yield. A look at the fertilizers’ marginal means therefore suggest that N:P:K(15:15:15) performs better with a mean of 0.197. Hence, it is

International Journal of Research Available at https://edupediapublications.org/journals
p-I SSN: 2348 -6848 e-ISSN: 2348-795X
Vol ume 03 I s s ue 1 4 Oc tober 2016
Available online: http://edupediapublications.org/journals/index.php/IJR/ P a g e | 639
recommended for maize planting for optimal yield.
2. Any of the three herbicides is recommended for maize weed control since they have equal effect on the yield.
3. Any of the three water levels is suitable for maize planting since they have equal effect on the yield.
4. The significant difference in the interaction effect of fertilizers and herbicides implies that they do not have equal effect on the yield. A look at the marginal means therefore suggests that combination of N:P:K(15:15:15) fertilizer and Xtraforce herbicide interact better with a mean of 0.225. Hence, it is recommended for maize planting for optimal yield.
5. Any of the fertilizers and water volumes combination is recommended for maize planting since they have equal effect on the yield.
6. The significant difference in the interaction effect of herbicides and water volume implies that they do not have equal effect on the yield. A look at the marginal means therefore suggests that combination of 7.5litres of water volume and Xtraforce herbicide interact better with a mean of 0.183. Hence, it is recommended for maize planting for optimal yield.
7. Any of the fertilizers, herbicides and water volumes combination is recommended for maize planting since they have equal effect on the yield.
REFERENCES [1] Agbato, S. O. (2003). Principles and
Practices of crop production. Odumatt press publisher, Oyo, pp. 57-62.
[2] Batra, P. K. and Seema J. (2012). Factorial Experiments. Indian Agricultural Statistics Research Institute, New Delhi.
[3] DIPA (2006). Handbook of Agriculture: facts and figures for farmers, students
and all interested in farming. Directorate of Information and Publications of Agriculture. Indian Council of Agricultural Research, New Delhi, p. 435.
[4] Dutt, S. (2005). A Handbook of Agriculture. ABD Publishers, India. Pp 116-118.
[5] FAO (2002). Fertilizer and the future. IFA/FAO Agriculture Conference on Global food security and the role of Sustainability Fertilization. Rome, Italy. 16th-20th March, 2003, pp 1-2.
[6] Fayenisin, O. (1993). Search for Improved maize varieties for farmers in Nigeria. 3rd National Workshop of Maize Centre. NASPP, Ibadan December, 6th - 10th 1976.
[7] Fisher, R. A. (1960). The Design of Experiments, New York: Hafner Publishing Company.
[8] Fisher, R.A. (1935). The Design of Experiments. Edinburgh and London: Oliver and Boyd.
[9] Iken, J. E., Anusa, A. and Obaloju, V. O. (2001). Nutrient Composition and Weight Evaluation of some Newly Developed maize Varieties in Nigeria. Journal of Food Technology, 7: 25-28.
[10] Kirk, R.E. (1995) Experimental Design: Procedures for the Behavioral Sciences (3rd edn.). Pacific Grove, CA: Brooks/Cole.
[11] Odeleye, F. O. and Odeleye, M. O. (2001). Evaluation of morphological and agronomic characteristics of two exolic and two adapted varieties of tomato (Lycopersicom esculentum) in South West Nigeria. Proceedings of the 19th Annual Conference of HORTSON. (1): 140-145.
[12] Tolera, A., Berg, T. and Sundstol, F. (1999). The effect of variety on maize

International Journal of Research Available at https://edupediapublications.org/journals
p-I SSN: 2348 -6848 e-ISSN: 2348-795X
Vol ume 03 I s s ue 1 4 Oc tober 2016
Available online: http://edupediapublications.org/journals/index.php/IJR/ P a g e | 640
grain and crop residue yield and nutritive value of the Stover. Journal of Animal feed Science and Technology 79(3): 165-177.
[13] Zeidan, M. S., Amany, A. and Balor El-Kramany, M. F. (2006). Effect of N-
Fertilizer and plant Density on Yield and Quality of maize in Sandy Soil. Research Journal of Agriculture and Biological Sciences, 2(4): 156-161.
APPENDIX
Images from the Field Experiment (Maize P lanting)
THE MAIZE SEED (SOAR 1)
HERBICIDES
WATER VOLUMES
RIDGES MAKING
PLANTING PROCESS

International Journal of Research Available at https://edupediapublications.org/journals
p-I SSN: 2348 -6848 e-ISSN: 2348-795X
Vol ume 03 I s s ue 1 4 Oc tober 2016
Available online: http://edupediapublications.org/journals/index.php/IJR/ P a g e | 641
APPLICATION OF HERBICIDES
APPLICATION OF FERTILIZERS
MAIZE GERMINATION

International Journal of Research Available at https://edupediapublications.org/journals
p-I SSN: 2348 -6848 e-ISSN: 2348-795X
Vol ume 03 I s s ue 1 4 Oc tober 2016
Available online: http://edupediapublications.org/journals/index.php/IJR/ P a g e | 642
HARVESTING AND WEIGHING