Embed Size (px)
Citation preview

APPLICATION OF THERMAL IR IMAGERY FOR CONCRETE BRIDGE INSPECTION
Khatereh Vaghefi, Michigan Technological University, Houghton, MI
Henrique A. de Melo e Silva, Michigan Technological University, Houghton, MI Devin K. Harris, Michigan Technological University, Houghton, MI
Theresa (Tess) M. Ahlborn, Michigan Technological University, Houghton, MI ABSTRACT
Detecting subsurface cracks and delaminations within concrete bridges has been always a challenge for bridge inspectors and transportation authorities. This type of subsurface deterioration can appear either on the bridge deck or girder; however, delaminated areas underneath the bridge can be more critical as it raises safety issues for passing by traffic. Visual inspection, which is a common practice technique for bridge condition evaluation, is not able to provide enough information of internal defects and deteriorations. Although, recent developments in non-destructive techniques provide bridge inspectors with advanced tools and methods for bridge inspection, most of these methods are either expensive or difficult to apply. Thermal Infrared imagery is a technology based on measuring the radiant temperature of an element, such as a bridge deck. Subsurface delaminations and anomalies appear as hot spots on the thermal IR image during the day as they interrupt the heat transfer through the concrete. In this way, delaminations can be detected before turning to spalls on the bridge. Applying this technology can enhance the current bridge inspection practice as well as providing useful information for maintenance and repair decision making. The purpose of this paper is to review the recent developments in this field and to investigate the feasibility of thermal IR application for regular bridge inspections.
Keywords: Non-destructive testing, Delaminations, Prestressed concrete girder, Bridge condition evaluation, Remote sensing

K. Vaghefi, H.A. de Melo e Silva, D.K. Harris, T.M. Ahlborn 2011 PCI/NBC
1
INTRODUCTION Accurate inspection and assessment of the transportation infrastructure has become a critical issue for bridge inspectors and transportation authorities in recent years. Specifically in concrete bridge components, the accurate assessment of subsurface delaminations and cracks has become a burden due to the difficulties in detecting these types of defects during the biennial visual inspections. Subsurface delaminations mostly occur within reinforced or prestressed concrete bridges as a result of the corrosion of reinforcement and eventually develop into spalls on the bridge. This evolution of decay highlights the importance of detecting this type of deterioration, especially underneath the bridge and within the precast prestressed girders as it raises safety issues for passing traffic under the bridge. While non-destructive technologies such as ground penetrating radar (GPR), ultrasound echo (UE) and impact echo (IE) can support bridge inspectors in detecting subsurface anomalies, their high cost and complicated interpretation procedures limit the application of these technologies during routine bridge inspection. Thermal infrared (IR) imagery is a non-destructive technology that can help in detecting delaminations. Ease of data collection and interpretation of thermal IR images are the main features that distinguish this technology for bridge inspections. This paper will review the recent developments in thermal IR imagery application and present the results of a preliminary study for regular concrete bridge inspections. CURRENT PRACTICE FOR DETECTING DELAMINATIONS Delaminations are the separation of concrete layers within the cover of the top layer of rebar and can occur as a set of horizontal cracks through the depth of concrete. As these gaps are invisible to the human eye, determining the exact location and area of delamination during regular visual bridge inspection involves numerous challenges and difficulties, especially for adjacent prestressed box beams. Corrosion of reinforcing steel in concrete bridges has been highlighted as the main cause of delamination in literature1, 2. Freeze-thaw cycles and overstress in a member are other factors that can also cause delaminations1, 2. Delaminated areas can completely separate from the concrete bridge elements and develop into spalls; thus, it is important to identify the location and size of these areas accurately. Because these separated layers can cause an interruption in sound wave transmission through the concrete, sounding methods are the most common techniques for detecting delaminated areas. Sounding concrete with a hammer is the most economical method for detecting delaminations during a bridge inspection. Delaminated areas reveal hollow sounds when tapped with a hammer compared to intact concrete and this can indicate the defective area. Chain drag, impact echo, ultrasound echo and GPR are other non-destructive methods that can be used for identifying delaminations; however, these methods are not cost effective and require significant data interpretation1.
K. Vaghefi, H.A. de Melo e Silva, D.K. Harris, T.M. Ahlborn 2011 PCI/NBC
2
In an investigation of the reliability of routine and in-depth visual inspection for highway bridges, Moore et al. (2000) reported significant variability in deck delamination surveys conducted by 22 bridge inspection teams. Basic hammer and chain dragging were the only tools used in this survey and the range of delamination percentage results varied from 2 to 35%3. Studies, such as this, highlight some of the limitations of current techniques and reveal the need for an easy to use inspection tool to help bridge inspectors locate and sketch delaminations more accurately. CONCEPTS OF THERMAL IR APPLICATION FOR BRIDGE EVALUATION ACI 2224 lists “thermal infrared survey” as one of the evaluation methods for detecting delaminations induced by corrosion within concrete. Because gaps and horizontal cracks can be filled with water or air, which have different material properties than concrete, they impact the thermal gradient of the concrete surface and appear as anomalies in the thermal IR image. Thermal infrared imagery is a technology based on the measurement of radiant temperature of a material and converting that temperature measurement into a visual image. Thermal infrared radiant energy is emitted from all objects that have a temperature greater than absolute zero. Radiant temperature of a material is defined by the amount of electromagnetic energy exiting the object in two electromagnetic spectrum windows: 3-5μm and 8-14μm. This value is slightly lower than the true kinetic temperature of any object due to the fact that objects are not perfect emitters5. A thermal IR camera is a tool for collecting the surface radiant temperature data of an object and generating a thermal IR image. Radiation, conduction and convection are three methods of heat transfer that can affect the heat flow through concrete. Although radiated energy is the parameter that can be measured by a thermal IR camera, the heat conductivity within the concrete and heat convection around the concrete can also influence this measurement. The concept behind the application of this technology in concrete bridge evaluation is that the anomalies and subsurface delaminations interrupt the heat transfer through the concrete and appear with different radiant temperatures on the thermal IR image compared to the area of sound concrete around them. During the day, as the ambient temperature increases, concrete absorbs heat and starts emitting radiant energy. Delaminations and air voids within the concrete will resist the heat transfer and warm up at a faster rate compared to the area of sound concrete around them, thus delaminations will appear as hot areas on the thermal IR image. However, during the night, as the ambient temperature decreases, the area of the sound concrete around the delaminations loses heat at a lower rate compared to the delaminations, thus the delaminations appear as cold areas on the thermal IR images6. Emissivity of the material is another factor that affects the radiant temperature measurement of the material surface. In fact, emissivity defines the correlation between the true kinetic
K. Vaghefi, H.A. de Melo e Silva, D.K. Harris, T.M. Ahlborn 2011 PCI/NBC
3
temperature and the radiant temperature of an object and helps as a factor to distinguish two objects with the same kinetic temperature. Emissivity depends on the amount of radiant flux (the amount of electromagnetic energy exiting an object) emitted from a material and has the value between 0 and 1. This value is typically greater than 0.9 for concrete. Surface roughness, color, moisture content, viewing angle and field of view are some of the factors that can influence the emissivity of materials. ASTM D47887 describes the test method, equipment and environmental conditions for detecting delaminations in concrete bridge decks with thermal IR technology. A thermal IR camera (0.1˚F thermal resolution), video recorder, video camera, distance measurement device, test vehicle and contact thermometer are the equipment required for this test. A vehicle mounted thermal IR camera and a video recorder are driven over the center of each lane on a bridge deck. The thermal IR camera needs to be mounted on the vehicle in a way that allows the minimum image width of 14ft. The conventional video image camera is used with the infrared image to separate patches and surface defects. One of the factors that needs to be considered in this test is the bridge deck dryness; as moisture on the surface can affect emissivity and reduce the thermal contrast on the thermal IR image. Time of data collection is the most critical factor in a thermal IR test. Not all materials in the environment have the same response to ambient temperature change; this causes the variation of the objects’ radiant temperature during a 24-hour period for different materials. The term thermal inertia refers to the thermal response of a material to temperature changes. Thermal conductivity, density and thermal capacity are factors that can influence the thermal inertia of the materials. Two thermal crossover times can be identified in the diurnal graphs of radiant temperature of different materials. These two times are the local sunrise and local sunset; when the radiant temperatures of the materials are the same and appear with the same temperature on the thermal IR image. Concrete materials and delaminated areas on a bridge have similar behavior with respect to ambient temperature changes. In a study conducted by Washer et al. (2009) on developing thermal IR inspection technology for bridges, it was found that the effective time to perform a thermal IR test depends on the depth of the delamination. The most contrast appears on the thermal IR image approximately 4 hours after sunrise for a 2 inch deep delamination and 7 hours after sunrise for a 3 inch deep delamination6. LIMITATIONS OF THERMAL IR APPLICATION AND ENVIRONMENTAL EFFECTS Previous studies on thermal IR applications for bridge inspection have reported several limitations that should be considered for thermal IR bridge inspection. Clark et al. (2003) highlighted the fact that emissivity of the concrete surface can vary based on the extra materials on the surface, thus the brightness of the materials on the surface does not necessarily correlate with the subsurface concrete defects8. Dirt, moisture, oil spills, and

K. Vaghefi, H.A. de Melo e Silva, D.K. Harris, T.M. Ahlborn 2011 PCI/NBC
4
staining on the concrete surface can appear as hot spots and affect the results of thermal imagery; therefore, taking optical (visible) images of the concrete surface is necessary to enable the inspector to separate these areas from delaminations. Wind speed, solar energy, ambient temperature and humidity are environmental factors which influence thermal IR images9. More advanced thermal IR cameras models have the option to adjust the image based on the relevant humidity and ambient temperature occurring at the time of data collection. The minimum ambient temperature of 32˚F and the maximum wind velocity of 30 mph have been highlighted as upper limits on environmental criteria for performing thermal IR imagery of concrete bridge decks in ASTM D47887. Washer et al. (2009) investigated the effects of variable environmental conditions on concrete bridge inspections and suggested a maximum wind speed of 8 mph on a sunny day and 10 mph when the surface is not directly exposed to solar energy. Also, it has been noted that consistent solar loading on the concrete can provide a better contrast on a thermal IR image9. Thermal IR inspection is mostly applied for shallow delaminations. The maximum depth of 3 inches has been mentioned in the literature as a limitation of this technology in detecting delaminations. What needs to be considered when interpreting a thermal IR image is the fact that deeper delaminations manifest as areas with less temperature values compared to shallower delaminations. ADVANTAGES OF THERMAL IR BRIDGE INSPECTION Capability of detecting subsurface defects and delaminations, commercial availability, remote sensing, ease of data collection and image interpretation are the advantages of thermal IR technology that highlights the benefits of applying thermal IR imagery in regular/biennial bridge inspection practices10. Lab studies of thermal IR imagery for concrete slabs show that this technique is capable of detecting shallow (up to 2 inches from the top surface) delaminations which can help bridge inspectors identify areas of unsound concrete before they turn into spalls. Evaluating the top surface of concrete bridge decks has been mentioned in literature as the main application of thermal IR imagery for bridge inspection as this element is exposed to direct sunlight. However, several studies have demonstrated that this technology can also be applied to detecting delamination and damage underneath the deck and within the bridge soffits which can be critical for passing traffic under the bridge11. Remote sensing characteristics of thermal IR imagery can reduce traffic disruption and lane closures on and underneath the bridge, as no direct contact is required. This highlights the fact that this technology can also be applied for inspecting prestressed concrete bridge girders without closing traffic lanes. Although most of the previous research on the application of this technology has focused on passive thermal IR techniques, Pollock et al. (2008) investigated the possibility of using

K. Vaghefi, H.A. de Melo e Silva, D.K. Harris, T.M. Ahlborn 2011 PCI/NBC
5
external heaters to warm up prestressed concrete bridge girders before collecting the thermal IR images. Two methods were considered to perform this test on the bridge. In the first method, a heater was placed inside the prestressed box girder and thermal IR images were taken from the external box girder surface underneath the bridge. In this method, irregularities appeared as cold spots in the thermal IR images. Performing this test with this method is not always possible, as it requires access inside the box beams. The second method involved heating the underneath of the bridge box girders by placing a heater on a lift truck platform and heating the girders for one to three hours before taking thermal IR images. Both of these methods showed promise for detecting delaminations in prestressed girders; however cost and accessibility are two factors that need to be considered in applying active thermal IR imaging for bridge inspection12. LABORATORY EXPERIMENT Laboratory experiments for this study included two phases; (1) Monitoring the variation in surface temperature of a concrete slab and determining the percentage of delamination in a controlled laboratory condition and (2) Investigating the effects of environmental conditions and time of data collection as well as determining the depth of delamination that can be measured. PHASE 1 A research and development grade thermal IR camera (FLIR SC640) and proprietary software were used to monitor the change in temperature and determine the subsurface anomalies within a concrete slab. Laboratory testing was conducted on a thin (6 inches deep) concrete slab which was built with simulated delaminations. The layout and size of the inclusions are given in Figure 1.
Fig. 1 Layout plan of 48”x48”x6” slab with simulated defects
K. Vaghefi, H.A. de Melo e Silva, D.K. Harris, T.M. Ahlborn 2011 PCI/NBC
6
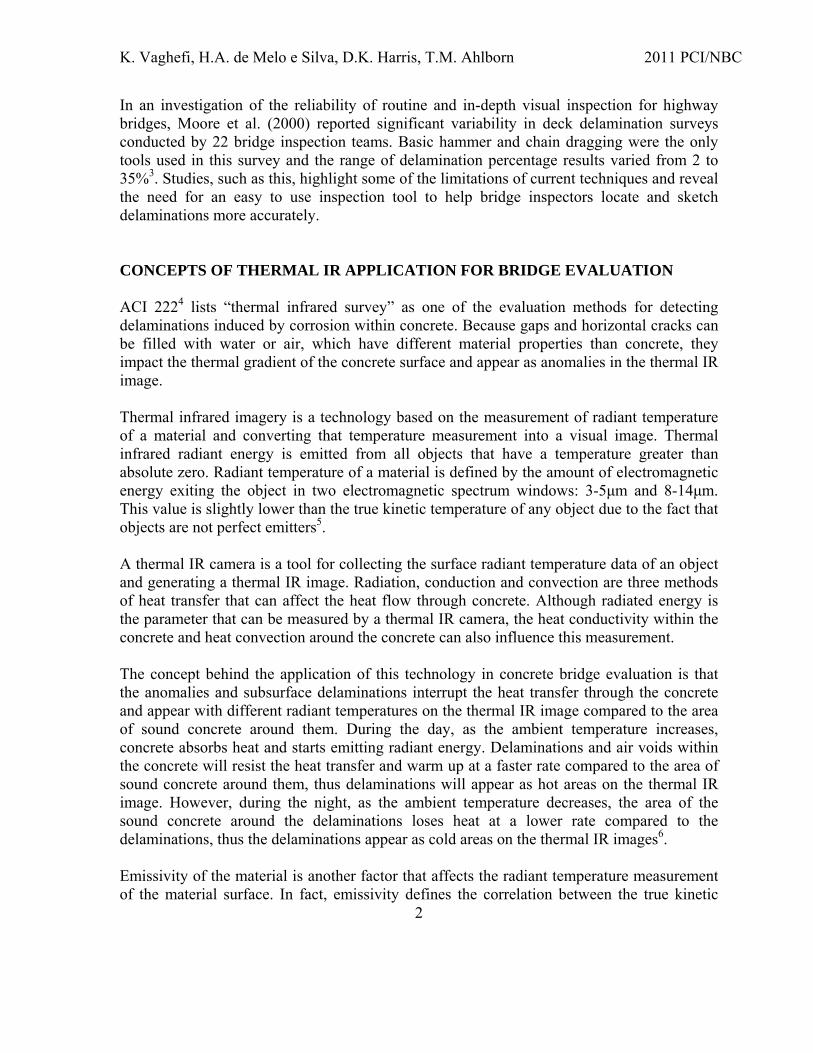
The slab was placed outside during winter (around 10 to 20˚F) for over 24 hours and then brought in to the lab, which was at a significantly higher temperature than outside. Thermal IR images were taken inside as the specimen was warming up. Figure 2 shows the set-up of this test.
Fig. 2 Laboratory experimental set-up for thermal IR test
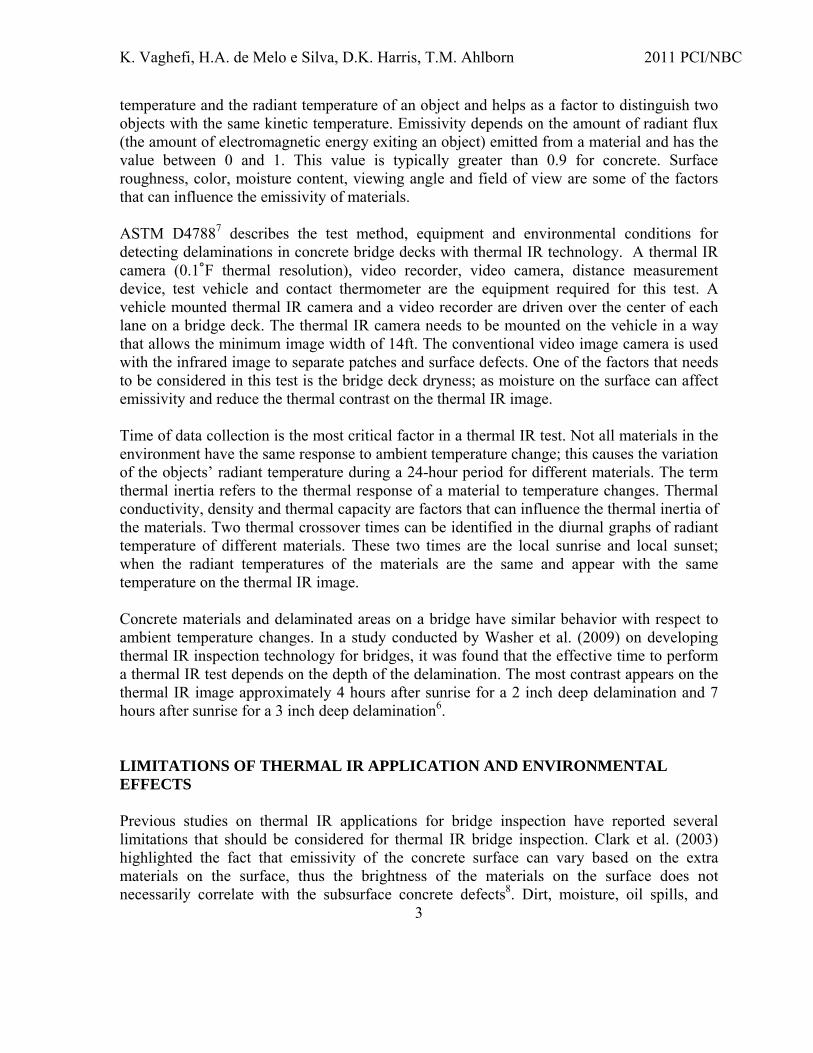
The thermal IR camera was set up at a distance of 16.67ft above the slab to take images every 10 minutes during a seven hour period (9:28am to 4:30pm). The indoor lab temperature was 72.3˚F and the relative humidity was 13%. The emissivity was assumed to be 0.95 for the concrete slab. Figure 3 shows the thermal IR image of the test specimen and the graphs of the temperature change during the seven hour period. Areas 3 and 4 (AR03 and AR04) on the thermal IR image correspond to the F1 and F2 delaminations. These areas were selected for the temperature graph because they were similar materials embedded in the slab at different depths. Area 2 (AR02) and spot 1 (SP01) correspond to simulated delaminations A and D2, but they did not have the required contrast for further analysis. Area 1 (AR01) corresponds to the whole slab area and average temperature within this area. The rest of the simulated delaminations, rebars and metal plates did not appear in thermal IR image because they were either too deep in the concrete or contained conductive materials.
Fig. 3 Thermal IR image and graphs showing the temperature change of each defect compared to the average temperature of the slab
K. Vaghefi, H.A. de Melo e Silva, D.K. Harris, T.M. Ahlborn 2011 PCI/NBC
7
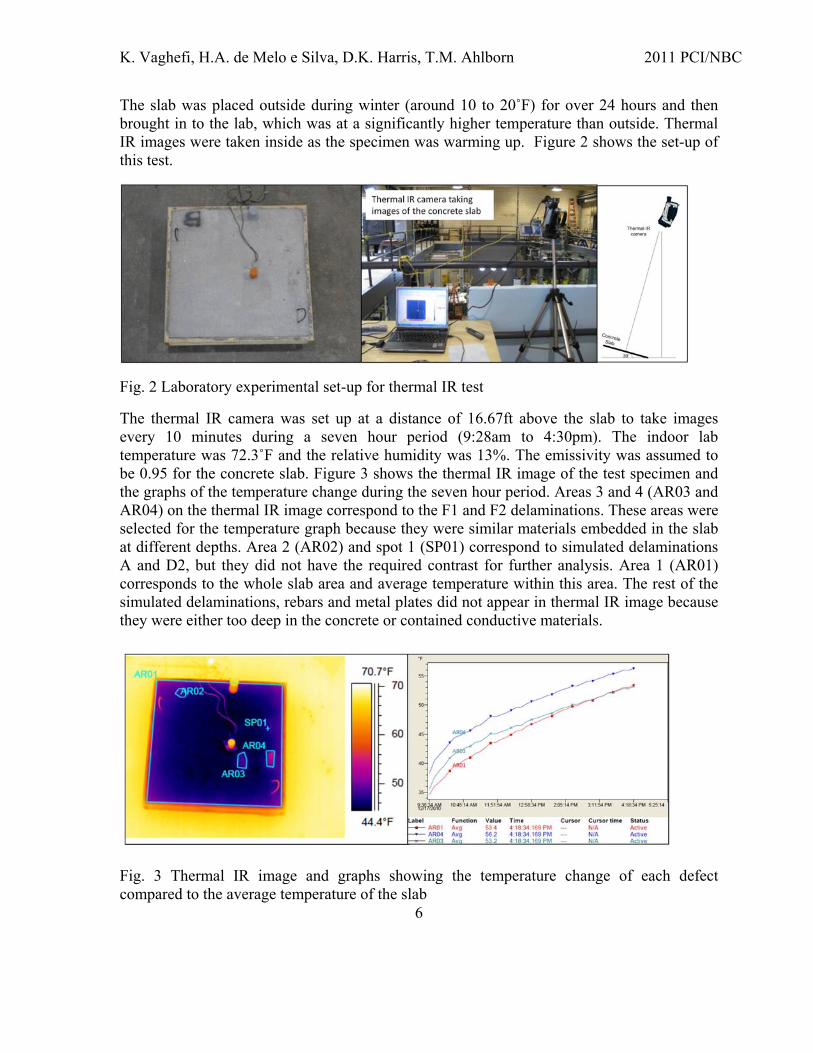
CALCULATING THE AREA OF DELAMINATION Determining the percentage of delaminated area was one of the objectives of this phase of study to provide valuable information for determining the deficient areas on the concrete bridge deck, soffits and prestressed girders. Note that taking thermal IR images at a normal angle to the slab (camera perpendicular to the slab) provides more accurate results than any other angles. Two methods were considered to calculate the percentage of delaminated areas. The first one used the thermal IR camera proprietary software to draw the box around the hot areas and count the number of pixels within the box. The percentage of delaminated area in this test was determined by using the formula below.
The second method involved saving the data in a comma separated format (.csv) and using a spreadsheet to count the number of pixels. In this test, the spreadsheet was set up to highlight the number of pixels within the specific temperature range that best fit and counted the number of pixels. One of the errors that appeared in this test was the effect of the thermal gradient from the edge which made it difficult to assign a pixel to delaminated areas close to the edges. The percentage of delaminated areas can be calculated by using the same equation as the first method. The results from these two methods were compared to the actual percentage of delamination in Table 1. A sample thermal IR image and the associated highlighted MS Excel spreadsheet are presented in Figure 4.
Fig. 4 Thermal IR image and the associated Excel spreadsheet
Number of pixels within the hot areaPercentage of delaminated areas ? x 100 Number of pixels within the slab
=
K. Vaghefi, H.A. de Melo e Silva, D.K. Harris, T.M. Ahlborn 2011 PCI/NBC
8
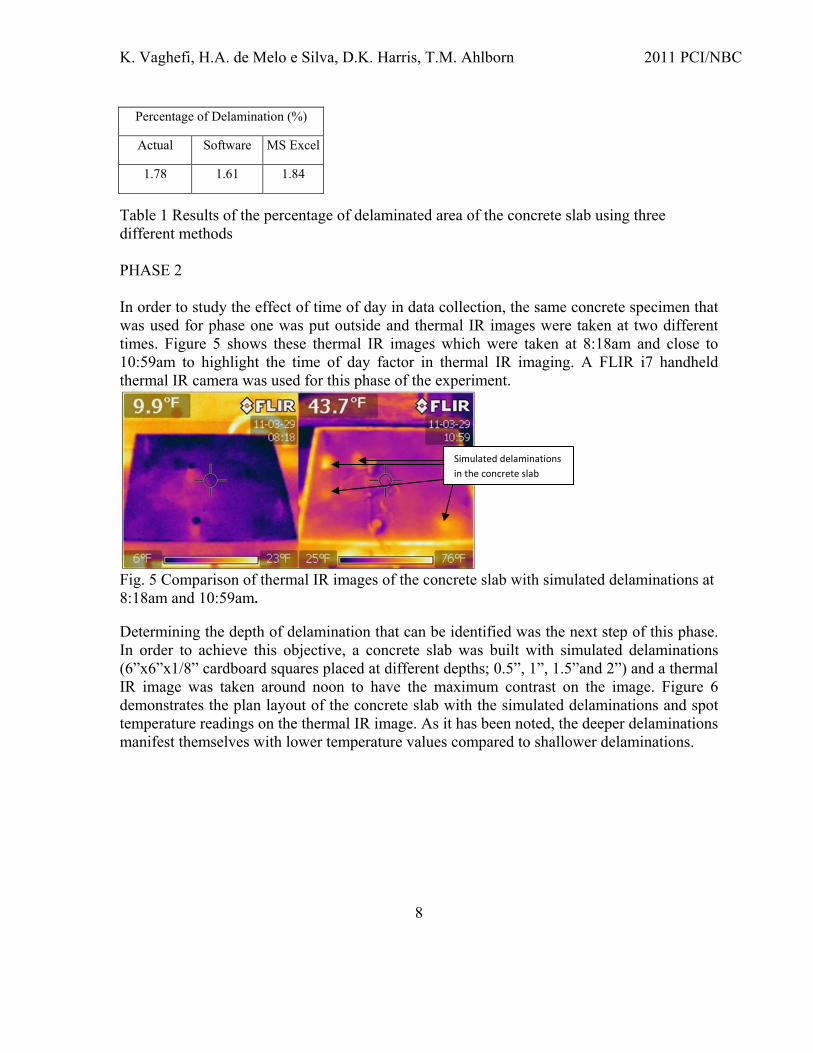
Table 1 Results of the percentage of delaminated area of the concrete slab using three different methods PHASE 2 In order to study the effect of time of day in data collection, the same concrete specimen that was used for phase one was put outside and thermal IR images were taken at two different times. Figure 5 shows these thermal IR images which were taken at 8:18am and close to 10:59am to highlight the time of day factor in thermal IR imaging. A FLIR i7 handheld thermal IR camera was used for this phase of the experiment.
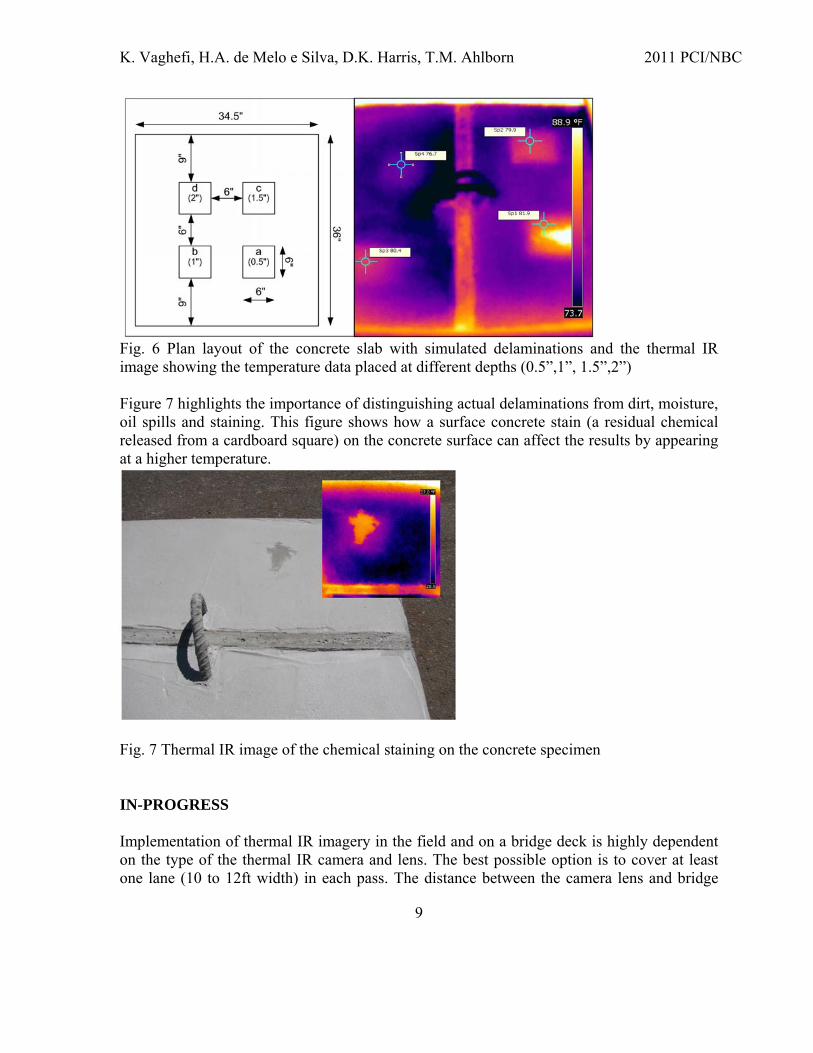
Fig. 5 Comparison of thermal IR images of the concrete slab with simulated delaminations at 8:18am and 10:59am. Determining the depth of delamination that can be identified was the next step of this phase. In order to achieve this objective, a concrete slab was built with simulated delaminations (6”x6”x1/8” cardboard squares placed at different depths; 0.5”, 1”, 1.5”and 2”) and a thermal IR image was taken around noon to have the maximum contrast on the image. Figure 6 demonstrates the plan layout of the concrete slab with the simulated delaminations and spot temperature readings on the thermal IR image. As it has been noted, the deeper delaminations manifest themselves with lower temperature values compared to shallower delaminations.
Percentage of Delamination (%)
Actual Software MS Excel
1.78 1.61 1.84
Simulated delaminations in the concrete slab
K. Vaghefi, H.A. de Melo e Silva, D.K. Harris, T.M. Ahlborn 2011 PCI/NBC
9
Fig. 6 Plan layout of the concrete slab with simulated delaminations and the thermal IR image showing the temperature data placed at different depths (0.5”,1”, 1.5”,2”) Figure 7 highlights the importance of distinguishing actual delaminations from dirt, moisture, oil spills and staining. This figure shows how a surface concrete stain (a residual chemical released from a cardboard square) on the concrete surface can affect the results by appearing at a higher temperature.
Fig. 7 Thermal IR image of the chemical staining on the concrete specimen IN-PROGRESS Implementation of thermal IR imagery in the field and on a bridge deck is highly dependent on the type of the thermal IR camera and lens. The best possible option is to cover at least one lane (10 to 12ft width) in each pass. The distance between the camera lens and bridge
K. Vaghefi, H.A. de Melo e Silva, D.K. Harris, T.M. Ahlborn 2011 PCI/NBC
10
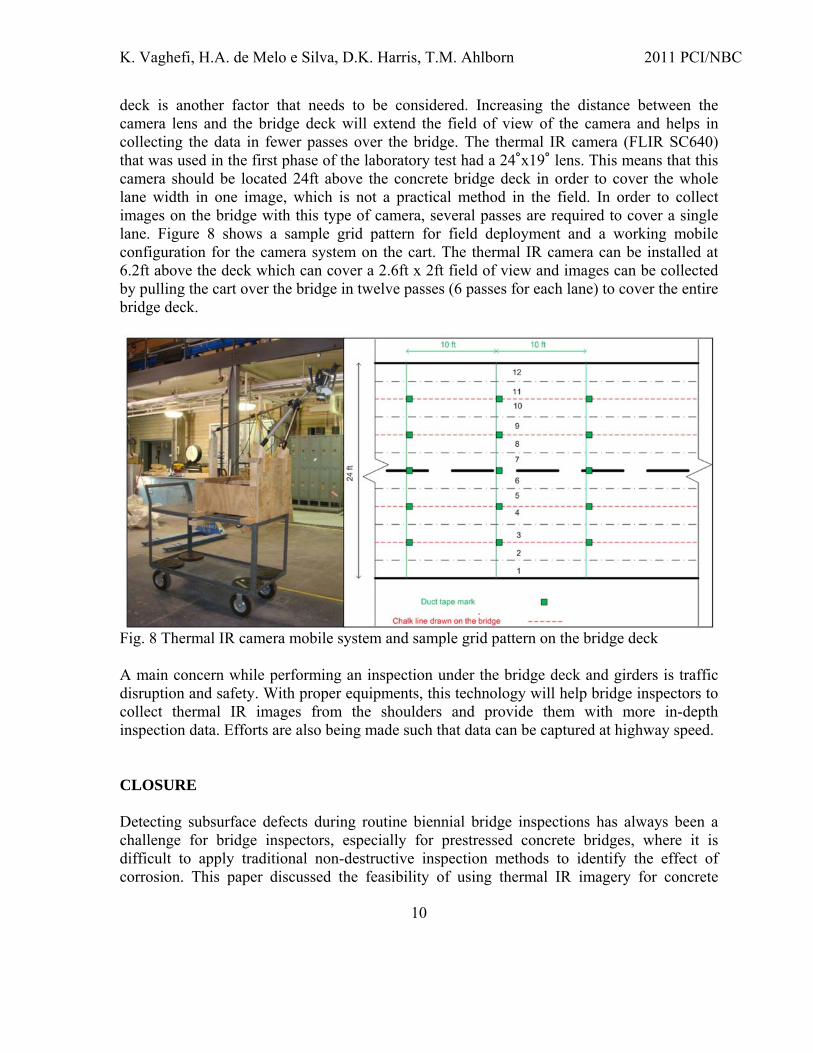
deck is another factor that needs to be considered. Increasing the distance between the camera lens and the bridge deck will extend the field of view of the camera and helps in collecting the data in fewer passes over the bridge. The thermal IR camera (FLIR SC640) that was used in the first phase of the laboratory test had a 24˚x19˚ lens. This means that this camera should be located 24ft above the concrete bridge deck in order to cover the whole lane width in one image, which is not a practical method in the field. In order to collect images on the bridge with this type of camera, several passes are required to cover a single lane. Figure 8 shows a sample grid pattern for field deployment and a working mobile configuration for the camera system on the cart. The thermal IR camera can be installed at 6.2ft above the deck which can cover a 2.6ft x 2ft field of view and images can be collected by pulling the cart over the bridge in twelve passes (6 passes for each lane) to cover the entire bridge deck.
Fig. 8 Thermal IR camera mobile system and sample grid pattern on the bridge deck A main concern while performing an inspection under the bridge deck and girders is traffic disruption and safety. With proper equipments, this technology will help bridge inspectors to collect thermal IR images from the shoulders and provide them with more in-depth inspection data. Efforts are also being made such that data can be captured at highway speed. CLOSURE Detecting subsurface defects during routine biennial bridge inspections has always been a challenge for bridge inspectors, especially for prestressed concrete bridges, where it is difficult to apply traditional non-destructive inspection methods to identify the effect of corrosion. This paper discussed the feasibility of using thermal IR imagery for concrete

K. Vaghefi, H.A. de Melo e Silva, D.K. Harris, T.M. Ahlborn 2011 PCI/NBC
11
bridge inspection and a laboratory experiment for calculating the percentage of delaminations on a concrete slab. The percentage of delamination and deficiency of each bridge element can help in the repair and maintenance decision making process and provide bridge inspectors with a better understanding of the individual elements and overall condition of a bridge. Research is ongoing with further field testing on prestressed concrete bridges along with an investigation of the potential for this technology to be combined with other technologies to provide a more thorough bridge condition assessment system. ACKNOWLEDGEMENTS This work is supported by the Commercial Remote Sensing and Spatial Information Technologies program of the Research and Innovative Technology Administration (RITA), U.S. Department of Transportation (USDOT), Cooperative Agreement # DTOS59-10-H-00001, with additional support provided by the Michigan Department of Transportation, the Michigan Tech Transportation Institute, the Michigan Tech Research Institute, and the Center for Automotive Research. The views, opinions, findings, and conclusions reflected in this paper are the responsibility of the authors only and do not represent the official policy or position of the RITA/USDOT, or any state or other entity. REFERENCES
1. Federal Highway Adminstration (FHWA), “Bridge Inspector’s Reference Manual”, Washington, D.C., 2006.
2. Shokouhi, P., Wostmann, J., Schneider, G., Milmann, B., and Taffe, A., “Nondestructive detection of delamination in conceret slabs: a multi-method investigation”, TRB 90th Annual Meeting, January 2011.
3. Moore, M., Phares, B., Graybeal, B., Rolander, D., and Washer, G., “Reliability of visual inspection for highway bridges”, NDE Validation Center/FHWA, September 2000
4. ACI, “Protection of Metals in Concrete against Corrosion (ACI 222)”, American Concrete Institute, 2001.
5. Jensen J., Remote sensing of the environment: an earth resource perspective, second edition, 2007, Pearson Education, Inc.
6. Washer, G. Fenwick, R., and Bolleni, N., “Development of hand-held thermographic inspection technologies”, Missouri Department of Transportation, September 2009.
7. ASTM D4788-03, “Standard test method for detecting delaminations in bridge decks using infrared thermography”, American Society for Testing Materials, 2007.
8. Clark, M. R., McCann, D. M. and Forde, M. C., "Application of Infrared thermography to the non-destructive testing of concrete and masonary bridges", NDT & E International, vol.36, 2003, pp. 265 - 275.
K. Vaghefi, H.A. de Melo e Silva, D.K. Harris, T.M. Ahlborn 2011 PCI/NBC
12
9. Washer, G., Fenwick, R., Bolleni, N. and Harper, J., “Effects of environmental variable on infrared imaging subsurface features of concrete bridges”, Journal of the Transportation Research Board, No. 2108, 2009, pp. 107-114.
10. Ahlborn, T. M., Shuchman, R., Sutter, L. L., Brooks, C. N., Harris, D. K., Burns, J. W., Endsley, K. A., Evans, D. C., Vaghefi, K. and Oats, R. C., “An Evaluation of Commercially Available Remote Sensors for Assessing Highway Bridge Condition”, 2010, from: http://www.mtri.org/bridgecondition/doc/RITA_BCRS_Commercial_Sensor_Evaluation.pdf
11. Washer, G., “Thermal Imaging of Damage in Bridge Soffits”, NDE/NDT for Highways and Bridges: Structural Materials Technology (SMT), NYC, 2010, pp. 528-532.
12. Pollock, D., Dupuis, K., Lacour, B., and Olsen, K., “Detection of voids in prestressed concrete bridges using thermal imaging and ground-penetrating radar”, Washington State Department of Transportation, December 2008.