Embed Size (px)
Citation preview
416
Journal of Sport & Exercise Psychology, 2011, 33, 416-440© 2011 Human Kinetics, Inc.
Sarah Elizabeth Williams and Jennifer Cumming are with the School of Sport and Exercise Sciences, University of Birmingham, Edgbaston, Birmingham, United Kingdom.
Measuring Athlete Imagery Ability: The Sport Imagery Ability Questionnaire
Sarah E. Williams and Jennifer CummingUniversity of Birmingham
This research aimed to develop and provide initial validation of the Sport Imagery Ability Questionnaire (SIAQ). The SIAQ assesses athletes’ ease of imaging dif-ferent types of imagery content. Following an extensive pilot study, 375 athletes completed a 20-item SIAQ in Study 1. Exploratory factor analysis revealed a 4-factor model assessing skill, strategy, goal, and affect imagery ability. Confir-matory factor analysis (CFA) established this 4-factor structure in Study 2 (N = 363 athletes). In Study 3 (N = 438 athletes), additional items were added to create a fifth mastery imagery subscale that was confirmed through CFA. Study 4 (N = 220 athletes) compared the SIAQ to the Movement Imagery Questionnaire-3. Significant bivariate correlations (p < .05) confirmed the SIAQ’s concurrent valid-ity but demonstrated differences in imagery ability of different content. Overall, the SIAQ demonstrates good factorial validity, internal and temporal reliability, invariance across gender, and an ability to distinguish among athletes of differ-ent competitive levels. Findings highlight the importance of separately assessing imagery ability of different content.
Keywords: ease of imaging, imagery content, scale development, sport psychology
Imagery is a popular and well-established strategy used to improve performance (for reviews, see Cumming & Ramsey, 2009; Murphy, Nordin, & Cumming, 2008). Its effect, however, is influenced by an individual’s capacity to create and control vivid images (Martin, Moritz, & Hall, 1999). The effectiveness of an imagery intervention increases for those reporting a higher ability to image (Hall, Buckolz, & Fishburne, 1992). For example, Robin et al. (2007) demonstrated that individu-als with higher imagery ability experienced greater improvement in the accuracy of their tennis serve return compared with poorer imagers. In addition, Martin et al. (1999) hypothesized imagery ability would moderate the relationship between imagery use and its intended outcome—a proposal that has received support (Goss, Hall, Buckolz, & Fishburne, 1986; Cumming, 2008).
Kosslyn (1994) explains that imaging involves the generation/formation, maintenance, and transformation of images, with an individual’s imagery ability likely capturing their proficiency in performing each of these processes. Ease of
Sport Imagery Ability Questionnaire 417
imaging is a characteristic thought to reflect these processes, and as such, is com-monly referred to when discussing and wanting to assess imagery ability (e.g., Hall & Martin, 1997; Gregg & Hall, 2006). Vividness is another characteristic indicative of these processes (Kosslyn, 1994). Roberts, Callow, Hardy, Markland, and Bringer (2008) describe image formation as occurring through the activation of working memory, and images displayed from working memory are represented by its vividness (see Baddeley & Andrade, 2000). Imagery ability can be therefore reflected by any number of characteristics that represent an individual’s capacity to form, maintain, and transform images, including ease and/or vividness.
It has become commonplace for researchers to measure participants’ imagery ability as an inclusion criteria for experiments and field-based interventions (Cum-ming & Ramsey, 2009). Athletes displaying poor imagery ability are excluded from studies or provided with training exercises to aid their image generation (e.g., Cumming, Olphin, & Law, 2007; Williams, Cumming, & Balanos, 2010). Although termed “ability,” imagery can be developed through investment of time and effort (Hall, 2001). For this reason, researchers also monitor changes in athletes’ imag-ery ability over the course of an intervention (e.g., Cumming & Ste-Marie, 2001; Rodgers, Hall, & Buckolz, 1991).
Due to these many uses, it is necessary for researchers to have valid and reliable means to assess imagery ability. Self-report questionnaires are the most regularly used method, with the revised versions of the Movement Imagery Questionnaire (MIQ-R; Hall & Martin, 1997) and the Vividness of Movement Imagery Question-naire (VMIQ-2; Roberts et al., 2008) being the two current popular choices. The MIQ-R and VMIQ-2 are fairly quick and easy to administer, and both instruments display good psychometric properties. They also share the similarity of assessing an individual’s ability to image specific movements (e.g., knee lift) and actions (e.g., jumping off a high wall).
The extant literature indicates that movement imagery ability questionnaires are often used beyond their intended purpose. For example, Ramsey, Cumming, Edwards, Williams, and Brunning (2010) screened participants using the MIQ-R. However, their intervention involved sport-specific images (kicking a soccer ball from the penalty spot), stimulus information about the environment (e.g., the goalkeeper, the net), and physical and emotional responses to the situation (e.g., butterflies in the stomach, feeling confident). Although the MIQ-R has proven valuable for controlling individual differences in imagery interventions involving motor skill acquisition (Hall, 1998), it does not likely fully capture the imagery ability needed by participants in Ramsey et al.’s intervention as well as the many sport imagery interventions conducted in research and applied set-tings (e.g., Callow & Waters, 2005; Cumming & Ste-Marie, 2001). Hall (1998) explained this problem by saying, “Just because athletes might be able to easily and vividly imagine themselves performing a skill (e.g., ‘throwing a ball’), does not mean they can just as easily and vividly imagine receiving a medal or being in control of difficult situations” (p. 171). He suggested the need for developing a new instrument to more comprehensively measure athletes’ ability to generate images of their sport experiences.
It is well documented that athletes use imagery for other purposes such as to modify cognitions and regulate arousal and anxiety (Martin et al., 1999). These reasons are classed as serving a motivational general (MG; i.e., images
418 Williams and Cumming
of arousal and cognition) function for athletes (Paivio, 1985). The learning and enhancement of movement performance, on the other hand, is categorized as a cognitive-specific (CS; i.e., images of skills) function. Other functions are cognitive general (CG; i.e., images of strategies, game plans, and routines) and motivational specific (MS; i.e., images of process, performance, and outcome goals). Hall, Mack, Paivio, and Hausenblas (1998) further subdivided the MG function into motivational general-arousal imagery (MG-A; i.e., images of affect, mood, and emotions) and motivational general-mastery imagery (MG-M; i.e., images of mastery cognitions). Athletes report using imagery for all five of these functions, with motivational imagery the most frequently reported (Cumming & Hall, 2002; Hall et al., 1998).
The imagery functions are thought to elicit different types of imagery content following the principle outlined by Martin et al. (1999) of “what you see, really is what you get” (p. 260). For example, athletes intending to improve performance of a specific skill will image themselves executing this skill. However, Murphy et al. (2008) and others (e.g., Cumming & Ramsey, 2009; Callow & Hardy, 2001) argue that these concepts are not identical and there is a need to separate function (i.e., why athletes image) from content (i.e., what athletes image). This is because research has demonstrated that images can serve multiple functions for athletes (Nordin & Cumming, 2008; Short, Monsma, & Short, 2004). For example, two hurdlers may image performing the correct hurdling technique, but one may use this image to improve their hurdling performance (CS func-tion) while the same content may be used to improve the other’s confidence at hurdling (MGM function).
With regards to imagery ability, the focus is on measuring the individual’s ability to generate imagery content, not why they are imaging this content. How-ever, a gap currently exists between the imagery content commonly reported by athletes and how their ability to generate this content is typically assessed (Hall, 1998). As stated by Paivio (1985), “[t]here is no single best measure [when assessing imagery ability] and the trick is to find [a method] that is most directly related to the specific task under consideration” (p. 27S). For example, Cumming and Ste-Marie’s (2001) five-week cognitive and motivational imagery intervention led to significant improvements in participants’ ability to image skate specific images. However, these changes did not generalize to increased MIQ-R scores, which remained the same as baseline. This finding reinforces the need for an imagery ability measure of sport related content that can be used to more accurately screen participants, thus more effectively controlling for individual differences, as well as detecting improvements. To our knowledge, the literature currently lacks a valid and reliable measure to assess athletes’ ability to image content reflecting the five imagery functions (i.e., CS, CG, MS, MGA, and MGM imagery).
In recent years, Gregg and Hall (2006) have made progress toward filling this gap by developing the Motivational Imagery Ability Measure for Sport (MIAMS). The MIAMS assesses participants’ ease and level of emotion experienced follow-ing the generation of eight motivational general images (i.e., four MGA and four MGM images). Although the authors have provided evidence to support the valid-ity and reliability of the questionnaire, the MIAMS is limited to the assessment of motivational general imagery only, to the exclusion of MS imagery and both forms of cognitive imagery.
Sport Imagery Ability Questionnaire 419
To overcome these issues, the aim of the present investigation was to develop a valid, reliable, and comprehensive assessment of athletes’ imagery ability called the Sport Imagery Ability Questionnaire (SIAQ). The SIAQ was designed to differ from existing questionnaires by (1) assessing sport-specific images rather than the generic movements/actions, and (2) simultaneously measuring cognitive and motiva-tional imagery ability to allow for direct comparisons of different imagery content.
Pilot StudyAn extensive pilot study was carried out to identify a suitable pool of items and rating scale to use in the development of the SIAQ. It has been suggested that image formation, transformation, and maintenance can be assessed in terms of ease (e.g., MIQ-R) and vividness (e.g., VMIQ-2; see Roberts et al., 2008). Consequently, both ease and vividness ratings were included to determine whether these would appropriately measure sport imagery ability.
Methods
Instrument Development. The initial items were drawn from the Sport Imagery Questionnaire (SIQ; Hall et al., 1998), which assesses the frequency of athletes’ imagery. Each of the SIQ’s 30 items represents one of the five imagery functions: (1) CS (e.g., “When learning a new skill, I imagine performing it perfectly”), (2) CG (e.g., “I imagine entire plays/programs/sections just the way I want them to happen in an event/game), (3) MS (e.g., “I image others applauding my performance”), (4) MG-A (e.g., “I image the stress and anxiety associated with my sport”), and (5) MG-M (e.g., “I imagine myself appearing self-confident in front of my opponents”). Because the SIAQ is intended to assess imagery content rather than function, item wording was modified to remove reference to the reasons why athletes image. For example, the SIQ item “I imagine myself handling the arousal and excitement associated with my sport” was changed to “the anticipation and excitement associated with my sport.” All SIAQ items stemmed from “I image. . . .” In total, 35 items designed to assess five types of imagery content were distributed to participants, including items tapping imagery that was cognitive specific and general in nature (i.e., images associated with performing various skills, and performing strategies, routines, and game plans). The remaining items reflected motivational specific and general imagery, including images concerned with achieving goals and outcomes (MS imagery), experiencing the feelings and emotions associated with performance (MG-A imagery), and thoughts associated with persistence and performing well in the face of adversity (MG-M imagery). Content validity was assessed by five sport psychology research experts, who have experience designing questionnaires, and five athletes. All researchers and athletes systematically examined the wording and content of items, and rated the extent they believed each item matched its intended subscale description. Ratings were made on a 7-point Likert type scale ranging from 1 (poor match) to 6 (excellent match). From these ratings, the Content Validity Index (CVI; Lynn, 1986) was calculated for each item by dividing the number of athletes and researchers who rated the item as a good match, very good match, or excellent match to a subscale, by the total number of athletes and researchers taking part in the rating exercise
420 Williams and Cumming
(i.e., 10). Only nine items were below the .80 criteria believed to be indicative of a valid item (Lynn, 1986). These potentially problematic items were revised as per suggestions made by the raters and were included in the pilot test. All other items had a CVI ranging between .80 (8/10) and 1 (10/10), and were therefore retained. During the pilot test, athletes were asked to first image each item, then rate both the ease they could image the scenario described and its vividness. Ratings were made on a 7-point Likert-type scale ranging from 1 (ease: very hard to image, vividness: no image at all, just thinking about it) to 7 (ease: very easy to image, vividness: perfectly clear & vivid as normal vision or feeling).
Demographic Information. Participants provided information regarding their age, gender, type of sport (i.e., team or individual), sport played, competitive level, and years of playing experience.
Participants. For participant details, see Table 1.
Procedure. Following ethical approval, a heterogeneous sample of participants was recruited from UK sports clubs. Individuals were contacted directly by an investigator who provided them with an information sheet and explained the nature of the study. Those agreeing to participate understood it was voluntary and signed a written consent form. Next, participants completed the SIAQ and provided their demographic information in a quiet environment, usually before or after a typical training session. Participants were asked to complete the questionnaire as honestly as possible and not to confer with any other athletes. Once finished, all completed materials were returned to the investigators.
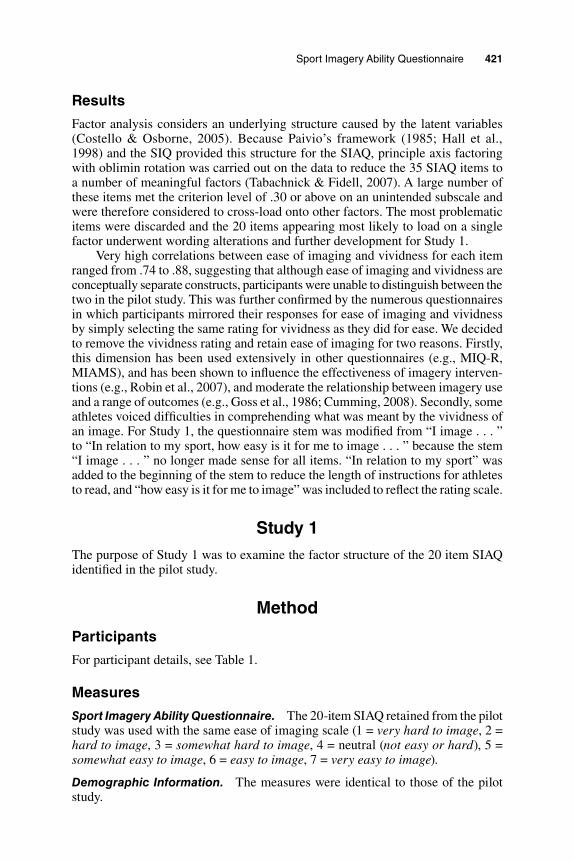
Table 1 Participant Characteristics for the Pilot Study and Studies 1 Through 4
Pilot Study Study 1 Study 2 Study 3 Study 4N 403 375 363 438 220
Male 198 179 175 207 86
Female 205 196 188 231 134
Mage (SD) 20.16 (3.44) 24.73 (8.84) 24.79 (9.31) 21.55 (6.91) 19.50 (.99)
Number of Sports 33 31 33 38 30
Sport Type
Team 249 272 217 259 127
Individual 154 103 146 179 93
Competitive Level
Recreational 48 54 44 66 40
Club 246 220 236 205 130
Regional 88 87 72 94 31
Elite 21 14 11 73 19
Experience (SD) 8.66 (4.36) 10.96 (8.51) 10.93 (8.21) 9.06 (5.85) 8.23 (3.82)
Note. All reported values represent the number of participants, with the exception of the values for mean age and experience, which are reported in years.
Sport Imagery Ability Questionnaire 421
Results
Factor analysis considers an underlying structure caused by the latent variables (Costello & Osborne, 2005). Because Paivio’s framework (1985; Hall et al., 1998) and the SIQ provided this structure for the SIAQ, principle axis factoring with oblimin rotation was carried out on the data to reduce the 35 SIAQ items to a number of meaningful factors (Tabachnick & Fidell, 2007). A large number of these items met the criterion level of .30 or above on an unintended subscale and were therefore considered to cross-load onto other factors. The most problematic items were discarded and the 20 items appearing most likely to load on a single factor underwent wording alterations and further development for Study 1.
Very high correlations between ease of imaging and vividness for each item ranged from .74 to .88, suggesting that although ease of imaging and vividness are conceptually separate constructs, participants were unable to distinguish between the two in the pilot study. This was further confirmed by the numerous questionnaires in which participants mirrored their responses for ease of imaging and vividness by simply selecting the same rating for vividness as they did for ease. We decided to remove the vividness rating and retain ease of imaging for two reasons. Firstly, this dimension has been used extensively in other questionnaires (e.g., MIQ-R, MIAMS), and has been shown to influence the effectiveness of imagery interven-tions (e.g., Robin et al., 2007), and moderate the relationship between imagery use and a range of outcomes (e.g., Goss et al., 1986; Cumming, 2008). Secondly, some athletes voiced difficulties in comprehending what was meant by the vividness of an image. For Study 1, the questionnaire stem was modified from “I image . . . ” to “In relation to my sport, how easy is it for me to image . . . ” because the stem “I image . . . ” no longer made sense for all items. “In relation to my sport” was added to the beginning of the stem to reduce the length of instructions for athletes to read, and “how easy is it for me to image” was included to reflect the rating scale.
Study 1The purpose of Study 1 was to examine the factor structure of the 20 item SIAQ identified in the pilot study.
Method
Participants
For participant details, see Table 1.
Measures
Sport Imagery Ability Questionnaire. The 20-item SIAQ retained from the pilot study was used with the same ease of imaging scale (1 = very hard to image, 2 = hard to image, 3 = somewhat hard to image, 4 = neutral (not easy or hard), 5 = somewhat easy to image, 6 = easy to image, 7 = very easy to image).
Demographic Information. The measures were identical to those of the pilot study.
422 Williams and Cumming
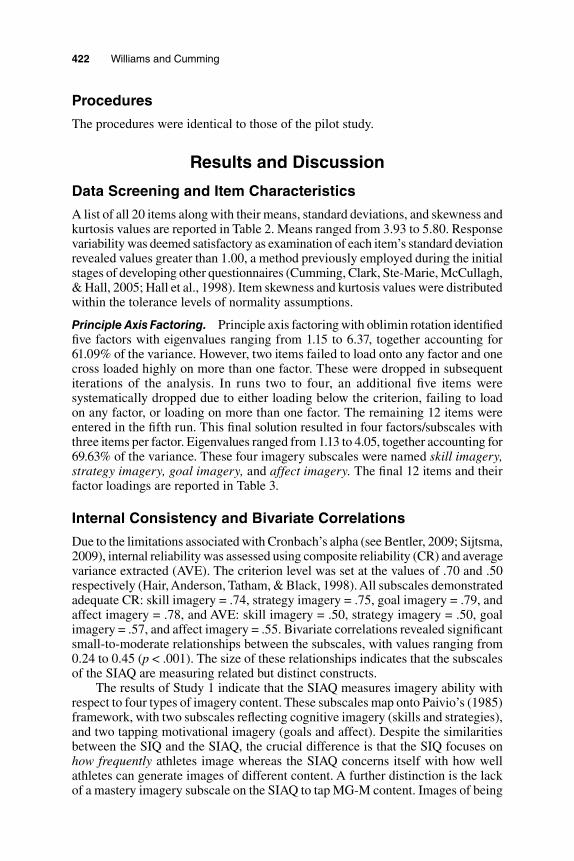
Procedures
The procedures were identical to those of the pilot study.
Results and Discussion
Data Screening and Item Characteristics
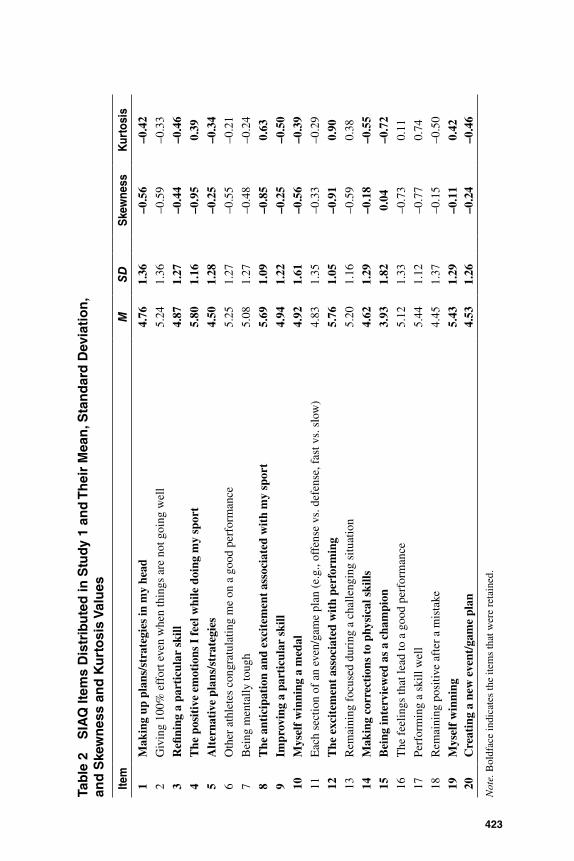
A list of all 20 items along with their means, standard deviations, and skewness and kurtosis values are reported in Table 2. Means ranged from 3.93 to 5.80. Response variability was deemed satisfactory as examination of each item’s standard deviation revealed values greater than 1.00, a method previously employed during the initial stages of developing other questionnaires (Cumming, Clark, Ste-Marie, McCullagh, & Hall, 2005; Hall et al., 1998). Item skewness and kurtosis values were distributed within the tolerance levels of normality assumptions.
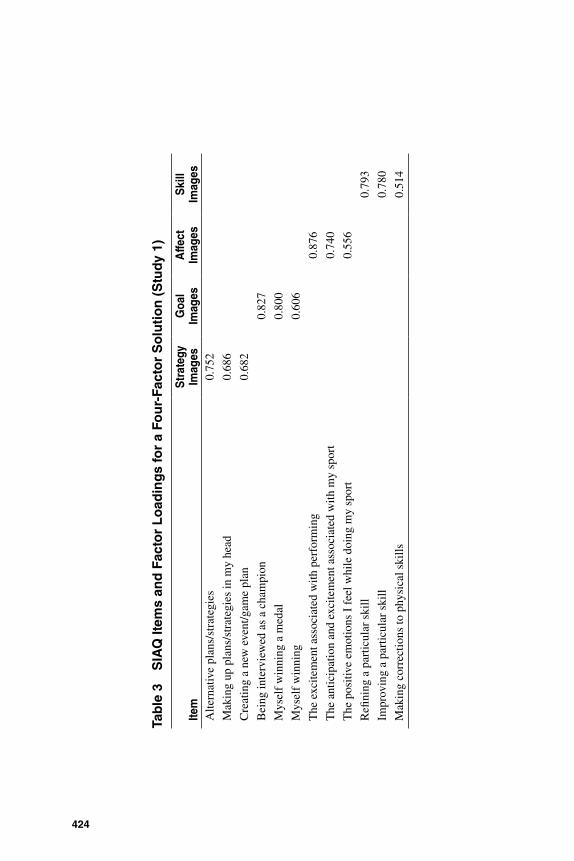
Principle Axis Factoring. Principle axis factoring with oblimin rotation identified five factors with eigenvalues ranging from 1.15 to 6.37, together accounting for 61.09% of the variance. However, two items failed to load onto any factor and one cross loaded highly on more than one factor. These were dropped in subsequent iterations of the analysis. In runs two to four, an additional five items were systematically dropped due to either loading below the criterion, failing to load on any factor, or loading on more than one factor. The remaining 12 items were entered in the fifth run. This final solution resulted in four factors/subscales with three items per factor. Eigenvalues ranged from 1.13 to 4.05, together accounting for 69.63% of the variance. These four imagery subscales were named skill imagery, strategy imagery, goal imagery, and affect imagery. The final 12 items and their factor loadings are reported in Table 3.
Internal Consistency and Bivariate Correlations
Due to the limitations associated with Cronbach’s alpha (see Bentler, 2009; Sijtsma, 2009), internal reliability was assessed using composite reliability (CR) and average variance extracted (AVE). The criterion level was set at the values of .70 and .50 respectively (Hair, Anderson, Tatham, & Black, 1998). All subscales demonstrated adequate CR: skill imagery = .74, strategy imagery = .75, goal imagery = .79, and affect imagery = .78, and AVE: skill imagery = .50, strategy imagery = .50, goal imagery = .57, and affect imagery = .55. Bivariate correlations revealed significant small-to-moderate relationships between the subscales, with values ranging from 0.24 to 0.45 (p < .001). The size of these relationships indicates that the subscales of the SIAQ are measuring related but distinct constructs.
The results of Study 1 indicate that the SIAQ measures imagery ability with respect to four types of imagery content. These subscales map onto Paivio’s (1985) framework, with two subscales reflecting cognitive imagery (skills and strategies), and two tapping motivational imagery (goals and affect). Despite the similarities between the SIQ and the SIAQ, the crucial difference is that the SIQ focuses on how frequently athletes image whereas the SIAQ concerns itself with how well athletes can generate images of different content. A further distinction is the lack of a mastery imagery subscale on the SIAQ to tap MG-M content. Images of being
423
Tab
le 2
S
IAQ
Item
s D
istr
ibu
ted
in S
tud
y 1
and
Th
eir
Mea
n, S
tan
dar
d D
evia
tio
n,
and
Ske
wn
ess
and
Ku
rto
sis
Val
ues
Item
MS
DS
kew
ness
Kur
tosi
s
1M
akin
g up
pla
ns/s
trat
egie
s in
my
head
4.76
1.36
–0.5
6–0
.42
2G
ivin
g 10
0% e
ffor
t eve
n w
hen
thin
gs a
re n
ot g
oing
wel
l5.
241.
36–0
.59
–0.3
3
3R
efini
ng a
par
ticu
lar
skill
4.87
1.27
–0.4
4–0
.46
4T
he p
osit
ive
emot
ions
I f
eel w
hile
doi
ng m
y sp
ort
5.80
1.16
–0.9
50.
395
Alt
erna
tive
pla
ns/s
trat
egie
s4.
501.
28–0
.25
–0.3
46
Oth
er a
thle
tes
cong
ratu
latin
g m
e on
a g
ood
perf
orm
ance
5.25
1.27
–0.5
5–0
.21
7B
eing
men
tally
toug
h5.
081.
27–0
.48
–0.2
4
8T
he a
ntic
ipat
ion
and
exci
tem
ent
asso
ciat
ed w
ith
my
spor
t5.
691.
09–0
.85
0.63
9Im
prov
ing
a pa
rtic
ular
ski
ll4.
941.
22–0
.25
–0.5
010
Mys
elf
win
ning
a m
edal
4.92
1.61
–0.5
6–0
.39
11E
ach
sect
ion
of a
n ev
en/g
ame
plan
(e.
g., o
ffen
se v
s. d
efen
se, f
ast v
s. s
low
)4.
831.
35–0
.33
–0.2
9
12T
he e
xcit
emen
t as
soci
ated
wit
h pe
rfor
min
g5.
761.
05–0
.91
0.90
13R
emai
ning
foc
used
dur
ing
a ch
alle
ngin
g si
tuat
ion
5.20
1.16
–0.5
90.
38
14M
akin
g co
rrec
tion
s to
phy
sica
l ski
lls4.
621.
29–0
.18
–0.5
515
Bei
ng in
terv
iew
ed a
s a
cham
pion
3.93
1.82
0.04
–0.7
216
The
fee
lings
that
lead
to a
goo
d pe
rfor
man
ce5.
121.
33–0
.73
0.11
17Pe
rfor
min
g a
skill
wel
l5.
441.
12–0
.77
0.74
18R
emai
ning
pos
itive
aft
er a
mis
take
4.45
1.37
–0.1
5–0
.50
19M
ysel
f w
inni
ng5.
431.
29–0
.11
0.42
20C
reat
ing
a ne
w e
vent
/gam
e pl
an4.
531.
26–0
.24
–0.4
6
Not
e. B
oldf
ace
indi
cate
s th
e ite
ms
that
wer
e re
tain
ed.
424
Tab
le 3
S
IAQ
Item
s an
d F
acto
r L
oad
ing
s fo
r a
Fou
r-Fa
cto
r S
olu
tio
n (
Stu
dy
1)
Item
Str
ateg
yIm
ages
Goa
lIm
ages
Affe
ctIm
ages
Ski
llIm
ages
Alte
rnat
ive
plan
s/st
rate
gies
0.75
2
Mak
ing
up p
lans
/str
ateg
ies
in m
y he
ad0.
686
Cre
atin
g a
new
eve
nt/g
ame
plan
0.68
2
Bei
ng in
terv
iew
ed a
s a
cham
pion
0.
827
Mys
elf
win
ning
a m
edal
0.
800
Mys
elf
win
ning
0.
606
The
exc
item
ent a
ssoc
iate
d w
ith p
erfo
rmin
g
0.
876
The
ant
icip
atio
n an
d ex
cite
men
t ass
ocia
ted
with
my
spor
t
0.
740
The
pos
itive
em
otio
ns I
fee
l whi
le d
oing
my
spor
t
0.
556
Refi
ning
a p
artic
ular
ski
ll
0.79
3
Impr
ovin
g a
part
icul
ar s
kill
0.
780
Mak
ing
corr
ectio
ns to
phy
sica
l ski
lls
0.51
4
Sport Imagery Ability Questionnaire 425
confident and in control cross loaded on different subscales, and were removed from the final solution.
Study 2After establishing the SIAQ’s four-factor structure in Study 1, the purpose of Study 2 was to use confirmatory factor analysis (CFA) to validate these findings with a new sample. Imagery modality was also considered to determine whether athletes’ ratings represented their ease of seeing, ease of feeling, or a combination of the two. Athletes report experiencing kinesthetic imagery in conjunction with visual imagery (Glisky, Williams, & Kihlstrom, 1996), and research suggests imaged feelings can include physiological responses, emotions, rhythm and timing, weight, and spatial awareness (Callow & Waters, 2005; Nordin & Cumming, 2005). Consequently, we predicted that, based on the content of SIAQ items, ease of imaging ratings would reflect an image generated with both visual and kinesthetic imagery.
Method
Participants
For participant details, see Table 1.
Measures
Demographic Information. The measures were identical to those of the pilot study and Study 1.
Sport Imagery Ability Questionnaire (SIAQ). The final 12 items from Study 1 were retained for Study 2 and rated with the same ease-of-imaging scale.
See and Feel Ratings. A subsample of 132 participants also rated the extent their generated images were composed of being able to see and feel the scenario. These ratings were made on a 7-point Likert-type scale ranging from 1 (completely see, no feel) to 7 (completely feel, no see). Mean scores were calculated by averaging the items representing each subscale to examine modality composition by imagery type.
Procedures
The procedures were identical to those of the pilot study and Study 1.
Results and Discussion
Data Screening and Item Characteristics
All item skewness and kurtosis values were distributed within the tolerance levels of normality assumptions. A total of 23 missing data cases were deleted from the data set resulting in a final sample of 340 (n = 156 males, n = 184 females).
426 Williams and Cumming
Confirmatory Factor Analysis (CFA)
Data were analyzed via structural equation modeling with maximum likelihood estimations using the computer package AMOS 16.0 (Arbuckle, 1999).1 Based on the significant correlations between subscales in Study 1, a model in which subscales were allowed to correlate (i.e., correlated traits model) was created. The model’s overall goodness of fit was tested using the chi-squared likeli-hood ratio statistic (χ2), with a larger value indicating a poorer fit (Jöreskog & Sörbom, 1993).
Although a nonsignificant χ2 value represents a good model fit, this is very rarely obtained in practice (MacCallum, 2003). Consequently, based on Hu and Bentler’s (1999) recommendations, two types of additional fit indices are reported, the standardized root mean square residual (SRMR; Bentler, 1995) and a supplementary incremental fit index (e.g., Tucker–Lewis index, comparative fit index, or root mean square error of approximation). The SRMR, used to calculate the average difference between the sample variances and covariances and the estimated population variances and covariance, is a measure of absolute fit index (Tabachnick & Fidell, 2007). An adequate fit is indicated by a value close to 0.08 (Hu & Bentler, 1999). The Comparative Fit Index (CFI; Bentler, 1990) and the Tucker–Lewis index (TLI; Bollen, 1989) compare the estimated model to an independence model using different approaches (Jöreskog & Sörbom, 1993). For both fit indices, a cut-off value of close to 0.95 has been suggested to indicate an adequate fit (Hu & Bentler, 1999). Finally, an assessment of how well the model approximates the data is calculated by the root mean square error of approxima-tion (RMSEA; Steiger, 1990). The RMSEA determines the model’s estimated lack of fit to a population covariance matrix expressed as the discrepancy per degree of freedom (Browne & Cudeck, 1993). A cut-off value close to 0.06 indi-cates an adequate fit (Hu & Bentler, 1999). Finally, standardized factor loadings, standardized residuals, and modification indices were examined to investigate any model misspecification. It is important to note there is some debate in the literature with regards to how appropriate the values indicative of adequate model fit are (see Markland, 2007; Marsh, Hau, & Wen, 2004). For this reason, caution is advised when interpreting results. Despite this issue, these criteria are still the most commonly reported as indications of an adequate model fit.
Inspection of Mardia’s coefficient (Mardia, 1970) revealed data did not display multivariate normality (Mardia’s multivariate kurtosis = 19.37; normal-ized estimate = 9.74). Consequently, the bootstrapping technique was employed. This method enables the creation of multiple subsamples from the original data and then parameter distributions examined relative to each of these samples (Byrne, 2010).
The four-factor model identified in Study 1 demonstrated an adequate fit to the data in Study 2, χ2 (48) = 96.19, p < .05, CFI = .96, TLI = .95, SRMR = .05, RMSEA = .05 (90% CI = 0.04–0.07). Inspection of the standardized factor load-ings (ranging from 0.58 to 0.86), modification indices, and standardized residu-als revealed all values were within acceptable limits and no offending estimates existed (Hair et al., 1998). Consequently, each item meaningfully contributed to its intended subscale.
Sport Imagery Ability Questionnaire 427
Internal Consistency and Interfactor Correlations
Adequate internal reliability was demonstrated for all four subscales with CR values ranging from .76 to .80 and AVE values ranged from .52 to .58. Interfactor correlations revealed significant correlations ranging from 0.12 to 0.45 (p < .001).
See and Feel
Mean scores for modality composition of ease ratings were 3.63 (SD = 1.08) for skill imagery, 3.48 (SD = 1.02) for strategy imagery, 3.59 (SD = 1.04) for goal imagery, and 5.15 (SD = .86) for affect imagery. Values demonstrate that when athletes image SIAQ items, these are composed of both being able to see and feel the scenario. A repeated-measures ANOVA revealed that compared with the other types of imagery, affect images were composed significantly more of being able to feel the image, F(3, 393) = 87.87, p < .001, η2 = .40, observed power = 100%. This is likely due to affect imagery items referring to feelings and emotions associated with sport. As such, it is likely that when participants image this type of content, the image is expressed to a greater extent in terms of being able to experience these feelings within the image compared with seeing it. Despite this difference, results demonstrate that “ease of imaging” is reflective of an athlete’s capacity to see and feel the image.
Results of Study 2 cross-validate the findings in Study 1 with an independent sample by demonstrating a good fit to the data for the four-factor model. Findings suggest it would be redundant to separately assess “ease to see” and “ease to feel” each image, with the likelihood of high correlations existing between the two similar to previous studies (e.g., Cumming, 2008; Nordin and Cumming, 2008).
Study 3To further assess the validity and reliability of the SIAQ, a third study was carried out. In the earlier stages of analyses undertaken in Study 1, and in conjunction with Paivio’s (1985) revised theoretical framework (Hall et al., 1998), results suggested the possibility of a fifth factor (mastery). But due to item cross loading, further refinement to the wording of these items was necessary. The purpose of Study 3 was to revise the SIAQ to include a fifth factor by introducing three mastery items reworded from Study 1. A second aim was to compare the final CFA solution with alternative models and investigate gender invariance to determine whether the final factor structure was sustained for males and females. The third purpose was to examine the test-retest reliability of the SIAQ by administering the questionnaire on two separate occasions. The final purpose of Study 3 was to see if the SIAQ is able to distinguish between populations of athletes based on previous research suggesting that certain athlete characteristics such as competitive level will influ-ence imagery ability (e.g., Roberts et al., 2008). Specifically, we examined whether the SIAQ would distinguish between males and females, and higher- and lower-level athletes based on their reported ease of imaging scores. Based on previous research, it was hypothesized that there would be no gender differences but athletes of a higher competitive level would display greater imagery ability compared with those competing at a lower level (e.g., Gregg & Hall, 2006; Roberts et al., 2008).
428 Williams and Cumming
Method
Participants
For participant details, see Table 1.
Measures
Demographic Information. The measures were identical to those of the pilot study and Studies 1 and 2.
Sport Imagery Ability Questionnaire (SIAQ). To create a fifth mastery subscale, the SIAQ for Study 3 was composed of the same items and rating scale used in Study 2, but with three additional items: “giving 100% effort even when things are not going well,” “staying positive after a setback,” and “remaining confident in a difficult situation”. The wording of the new items came from a combination of existing SIQ items along with rewording of items from Study 1 that showed a potential for loading together to represent the mastery subscale.
Procedures
The procedures were identical to the pilot study, Study 1, and Study 2 with the exception that approximately 3 months after the SIAQ was completed a random sample of 26% of the athletes (n = 116) completed the SIAQ for a second time.
Results and Discussion
Data Screening and Item Characteristics
All item skewness and kurtosis values were distributed within the tolerance levels of normality assumptions. Twelve missing data cases were deleted resulting in a final sample of 426 (n = 199 males, n = 227 females).
Confirmatory Factor Analysis
Similarly to Study 2, CFA was conducted using AMOS 16.0 (Arbuckle, 1999) with maximum likelihood estimation procedures. Inspection of Mardia’s coefficient revealed that the data did not display multivariate normality. Similarly to Study 2, the bootstrapping technique was employed. The model’s overall goodness of fit was tested using the χ2, SRMR, TLI, CFI, and RMSEA. Based on the same crite-ria as in Study 2, an adequate fit to the data was established for a final five-factor model, χ2 (80) = 204.53, p < .05, CFI = .96, TLI = .95, SRMR = .04, RMSEA = .06 (90% CI = 0.05–0.07). All factor loadings (0.62–0.88), modification indices, and standardized residuals were within acceptable limits and no offending estimates existed in the data (Hair et al., 1998).
Internal Consistency and Interfactor Correlations
The SIAQ demonstrated good internal reliability for all five subscales with CR values ranging from .76 to .86, and AVE values ranging from .51 to .68. Signifi-
Sport Imagery Ability Questionnaire 429
cant interfactor correlations between the five subscales ranged from 0.26 to 0.46 (p < .001).
Alternative Models
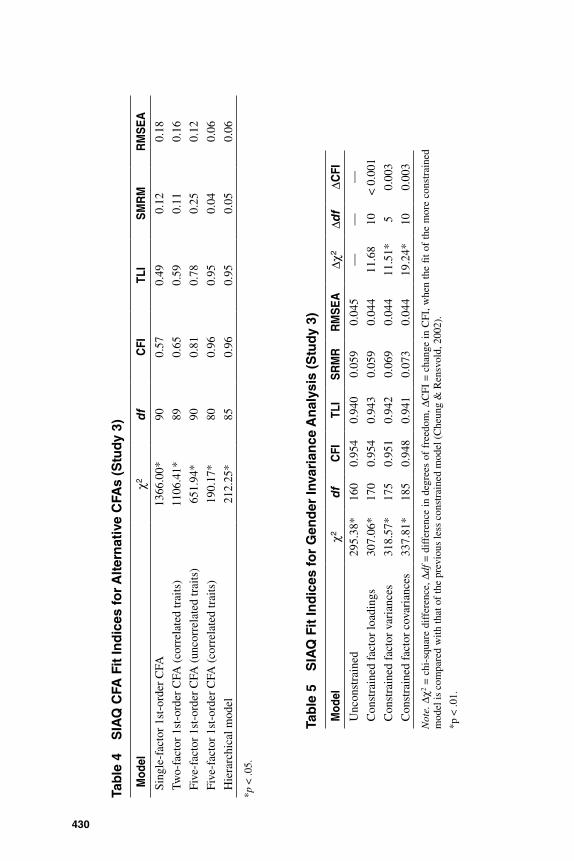
The five-factor model with correlated traits was compared with four other models to ensure that an alternate model would not provide a better fit to the data. A one-factor model with all 15 items loading on one imagery subscale, and a five-factor uncorrelated traits model (without correlations between the five latent variables) revealed a poor fit to the data using the same criteria as employed previously. These poor fitting models indicate that sport imagery ability is a multidimensional construct best represented by an individual’s ability to image a number of separate, but related, types of imagery. A two-factor correlated traits model was examined in which skill and strategy items were forced onto a cognitive subscale, and goal, affect, and mastery items forced onto a motivational subscale.2 Similarly to the one-factor model and uncorrelated traits model, results revealed a poor fit indicat-ing skill and strategy imagery to measure different types of content not represented by a higher order cognitive factor. Similarly, goal, affect, and mastery images are not better represented by a higher order motivational factor. Finally, a hierarchical model was tested in which the five first-order latent factors (i.e., skill, strategy, goal, affect, and mastery images) were represented by a higher order latent factor (i.e., global sport imagery ability). Results revealed an adequate model fit similar to the first-order model with correlated traits, which suggests that the hierarchical model should be preferred because it is considered more parsimonious (Koufteros, Babbar, & Kaighobadi, 2009). However, to separately assess an athlete’s imagery ability of the five types of imagery, or investigate the effect of each on various outcomes, we suggest using the first-order correlated traits model. Results for all five CFAs are presented in Table 4.
Gender Invariance
To examine whether the SIAQ factor structure was sustained for both males and females, analysis of invariance was conducted using a sequential testing approach via multisample CFA. After a baseline model was established, two additional models were devised that were increasingly constrained. The first examined the equality of the measurement through constraining the factor loadings, the second constrained the factor variances, and the third examined the equality of the structural parameters through constraining the factor covariances across the male and female samples (Byrne, 2010). The relative goodness of fit between increasingly constrained models was investigated using the χ2 difference test (Satorra & Bentler, 2001). The stringent test of invariance resulting from the χ2 difference test is suggested to be too exces-sive for structural equation modeling that can be described as approximations of reality (e.g., Cudeck & Brown, 1983). Based on the recommendations of Cheung and Rensvold (2002), we also considered a change in CFI of ≤ .01 to be reflective of model invariance. Goodness of fit results for the four models of the invariance analysis is reported in Table 5. Although the χ2 difference was only nonsignificant between the unconstrained model and the constrained factor loadings model, the change in CFI was < .01 between all four steps, supporting the scale’s factorial invariance across gender.
430
Tab
le 4
S
IAQ
CFA
Fit
Ind
ices
for
Alt
ern
ativ
e C
FAs
(Stu
dy
3)
Mod
elχ2
df
CFI
TLI
SM
RM
RM
SE
A
Sing
le-f
acto
r 1s
t-or
der
CFA
1366
.00*
900.
570.
490.
120.
18
Two-
fact
or 1
st-o
rder
CFA
(co
rrel
ated
trai
ts)
1106
.41*
890.
650.
590.
110.
16
Five
-fac
tor
1st-
orde
r C
FA (
unco
rrel
ated
trai
ts)
651.
94*
900.
810.
780.
250.
12
Five
-fac
tor
1st-
orde
r C
FA (
corr
elat
ed tr
aits
)19
0.17
*80
0.96
0.95
0.04
0.06
Hie
rarc
hica
l mod
el21
2.25
*85
0.96
0.95
0.05
0.06
*p <
.05.
Tab
le 5
S
IAQ
Fit
Ind
ices
for
Gen
der
Inva
rian
ce A
nal
ysis
(S
tud
y 3)
Mod
elχ2
df
CFI
TLI
SR
MR
RM
SE
AΔχ
2Δd
fΔC
FI
Unc
onst
rain
ed29
5.38
*16
00.
954
0.94
00.
059
0.04
5—
——
Con
stra
ined
fac
tor
load
ings
307.
06*
170
0.95
40.
943
0.05
90.
044
11.6
810
< 0
.001
Con
stra
ined
fac
tor
vari
ance
s31
8.57
*17
50.
951
0.94
20.
069
0.04
411
.51*
50.
003
Con
stra
ined
fac
tor
cova
rian
ces
337.
81*
185
0.94
80.
941
0.07
30.
044
19.2
4*10
0.00
3
Not
e. Δχ2
= c
hi-s
quar
e di
ffer
ence
, Δdf
= d
iffe
renc
e in
deg
rees
of
free
dom
, ΔC
FI =
cha
nge
in C
FI, w
hen
the
fit o
f th
e m
ore
cons
trai
ned
mod
el is
com
pare
d w
ith th
at o
f th
e pr
evio
us le
ss c
onst
rain
ed m
odel
(C
heun
g &
Ren
svol
d, 2
002)
.
*p <
.01.
Sport Imagery Ability Questionnaire 431
Test–Retest Reliability
Intraclass correlation coefficients were calculated using a two-way random effect model (Ntoumanis, 2001) to establish test–retest reliability, and the coefficients for skill (.83), strategy (.86), goal (.86), affect (.75), and mastery (.85) images were all above the acceptable cutoff (Vincent, 1999). Consequently, results demonstrate temporal reliability of the SIAQ over a 3-month period.
Group Differences
Additional validity of the SIAQ was established through two multivariate analyses of variance (MANOVAs) to examine whether ease of imaging varied according to gender, competitive level (i.e., high- vs. low-level athletes). For each analysis, the five SIAQ subscales served as the dependent variables, and gender or competitive level was the independent variable. Follow-up analysis of significant multivari-ate results were investigated through discriminant function analyses to examine specifically which types of imagery (i.e., skill, strategy, goal, affect, and mastery) could predict gender and competitive level (i.e., low- vs. high level athletes). The five SIAQ subscales served as the predictor variables, and gender or competitive level was the dependent variable. For competitive level recreational and club level athletes were athlete classified as low-level athletes and regional and elite-level athletes were classified as high-level athletes. Note that regional is equivalent to state-level athletes in the USA or provincial-level athletes in Canada.
Gender. A one-way MANOVA revealed imagery ability differed between males and females, Pillai’s trace = .04, F(5, 420) = 3.64, p = .003, η2 = .04, observed power = 93%. Results of the follow-up discriminant function analysis revealed a significant mean difference in mastery images (p < .001) when comparing male scores (M = 5.10, SD = 1.06) with female scores (M = 4.73, SD = 1.01). A significant association was revealed between gender and all predictors that accounted for 5.7% of between group variability. Closer analysis of the structural matrix confirmed only mastery images (.74) predicted gender, with skill, strategy, goal, and affect imagery acting as poor predictors. Cross-validated classification showed that overall only 62.0% were correctly classified. Although contrary to our hypothesis, this result is in accordance with some previous studies that have identified gender differences in imagery ability (e.g., Campos, Pérez-Fabello, & Gómez-Juncal, 2004). Future research is encouraged to investigate the similarities and differences between male and female athletes’ skill, strategy, goal, affect, and mastery imagery ability.
Competitive Level. A one-way MANOVA revealed imagery ability differed with competitive level, Pillai’s trace = .067, F(5, 420) = 6.04, p < .001, η2 = .07, observed power = 100%. Discriminant function analysis revealed significant mean differences for skill, strategy, goal, and mastery SIAQ subscales when predicting competitive level (p < .001). A significant association was revealed between competitive level and all predictors that accounted for 6.7% of between group variability. Closer analysis of the structural matrix confirmed skill (.76), strategy (.67), goal (.80), and mastery images (.56) predicted competitive level. Cross-validated classification showed that overall 64.3% were correctly classified. This supports the SIAQ’s ability to distinguish between groups of athletes and is consistent with previous research
432 Williams and Cumming
demonstrating that athletes competing at a higher level can display greater imagery ability (e.g., Roberts et al., 2008).
SIAQ Imagery Content
A repeated-measures ANOVA investigated any differences in ease of imaging across SIAQ subscales. Mauchly’s test of sphericity was examined to investigate the equality of the within-subject factor (SIAQ subscales). The data violated this assumption (p < .05), so the Greenhouse–Geisser correction was reported. Results revealed significant differences in ease of imaging between the imagery content measured by the SIAQ, F(3.66, 1556.43) = 124.31, p < .001, η2 = .23, observed power = 100%. Post hoc analysis revealed that participants found it significantly easier to image affect images (M = 5.92, SD = .83) compared with skill images (M = 5.16, SD = .96), which were significantly easier to image than strategy (M = 4.83, SD = 1.18), goal (M = 4.83, SD = 1.30), and mastery (M = 4.90, SD = 1.05) images. Similarly to athletes using functions of imagery to varying extents (e.g., Cumming & Hall, 2002; Hall et al., 1998), athletes also diverge in their ability to image different content. This finding reinforces the need to capture an athlete’s range of sport imagery ability.
Study 4Despite Studies 1, 2, and 3 validating the factor structure of the SIAQ, it is yet to be compared with other imagery ability questionnaires to establish its concurrent validity. Investigating the correlations between the SIAQ and another measure would establish how SIAQ subscales relate to imagery ability assessed by other measures. The purpose of Study 4 was to therefore examine the concurrent validity of the SIAQ by investigating relationships between the SIAQ ease of imaging sport images and ease of imaging movement images measured by the most recent version of the Movement Imagery Questionnaire, the Movement Imagery Questionnaire-3 (MIQ-3; Williams, Cumming, & Edwards, in press). A secondary purpose of Study 4 was to examine the five-factor model fit of the SIAQ on a second population of athletes. A priori hypothesized relationships were thought to exist between the SIAQ and MIQ-3 due to both questionnaires measuring ease of imaging. However, it was thought these would be moderate in size due to the SIAQ assessing imagery ability of a different content to that assessed by the MIQ-3.
Method
Participants
For participant details, see Table 1.
Measures
Demographic Information. The measures were identical to those of the pilot study and Studies 1, 2, and 3.
Sport Imagery Ability Questionnaire 433
Sport Imagery Ability Questionnaire (SIAQ). The same 15-item SIAQ used in Study 3 was distributed in Study 4.
Movement Imagery Questionnaire-3 (MIQ-3). The MIQ-3 (Williams et al., in press) is a 12-item questionnaire designed to measure individuals’ ease of imaging external visual, internal visual, and kinesthetic images of specific movements. Developed from the Movement Imagery Questionnaire-Revised (MIQ-R; Hall & Martin, 1997), it requires athletes to image 4 movements; a knee lift, jump, arm movement, and waist bend. Participants are asked to physically perform, and then image, the movement. Each movement is imaged three times, once from an external visual perspective, once from an internal visual perspective, and once kinesthetically, resulting in a total of 12 movements physically performed and then imaged. Following each image, participants rate the ease they are able to produce the image on a 7-point Likert-type scale ranging from 1 (very hard to see/feel) to 7 (very easy to see/feel). A higher score therefore represents a higher ability to perform visual or kinesthetic imagery. Williams et al. (2011) identified the MIQ-3 to be a valid and reliable questionnaire.
Procedures
The procedures were identical to Study 3, with the exception that participants also completed the MIQ-3. This questionnaire administration was done either in small groups or in isolation. Overall, participation took no longer than 30 min.
Results and Discussion
Data Screening
All data were inspected for missing cases, skewness, and kurtosis based on previous recommendations (Tabachnick & Fidell, 2007).
Confirmatory Factor Analysis
Similarly to previous studies, CFA was conducted using AMOS 16.0 (Arbuckle, 1999) with maximum likelihood estimation procedures and the same fit criteria were used. The data did not display multivariate normality so the bootstrapping technique was employed. Similarly to Study 3, an adequate fit to the data were established for a five-factor model, χ2 (80) = 108.59, p < .05, CFI = .98, TLI = .97, SRMR = .04, RMSEA = .04 (90% CI = 0.02–0.06), and factor loadings (0.61–0.88), modifica-tion indices, and standardized residuals were within acceptable limits (Hair et al., 1998). This adequate model fit demonstrating similar results to those obtained in Study 3 support the consistency of a five-factor model.
Internal Consistency
Both the SIAQ and MIQ-3 demonstrated good internal reliability for each subscale. The SIAQ’s CR ranged between .78 and .86 and its AVE ranged between .55 and .67. CR of the MIQ-3 ranged from .80 to .87 and its AVE ranged from .51 to .62.
434 Williams and Cumming
Correlations
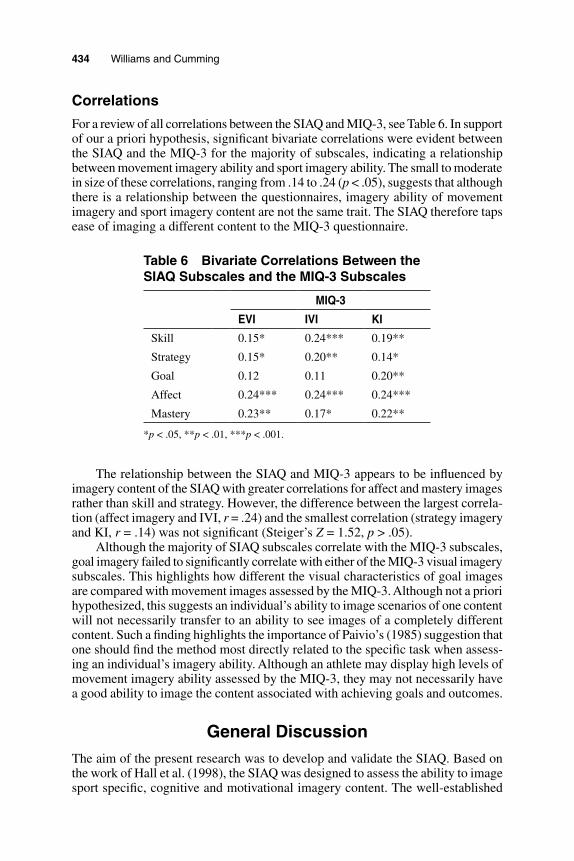
For a review of all correlations between the SIAQ and MIQ-3, see Table 6. In support of our a priori hypothesis, significant bivariate correlations were evident between the SIAQ and the MIQ-3 for the majority of subscales, indicating a relationship between movement imagery ability and sport imagery ability. The small to moderate in size of these correlations, ranging from .14 to .24 (p < .05), suggests that although there is a relationship between the questionnaires, imagery ability of movement imagery and sport imagery content are not the same trait. The SIAQ therefore taps ease of imaging a different content to the MIQ-3 questionnaire.
Table 6 Bivariate Correlations Between the SIAQ Subscales and the MIQ-3 Subscales
MIQ-3
EVI IVI KI
Skill 0.15* 0.24*** 0.19**
Strategy 0.15* 0.20** 0.14*
Goal 0.12 0.11 0.20**
Affect 0.24*** 0.24*** 0.24***
Mastery 0.23** 0.17* 0.22**
*p < .05, **p < .01, ***p < .001.
The relationship between the SIAQ and MIQ-3 appears to be influenced by imagery content of the SIAQ with greater correlations for affect and mastery images rather than skill and strategy. However, the difference between the largest correla-tion (affect imagery and IVI, r = .24) and the smallest correlation (strategy imagery and KI, r = .14) was not significant (Steiger’s Z = 1.52, p > .05).
Although the majority of SIAQ subscales correlate with the MIQ-3 subscales, goal imagery failed to significantly correlate with either of the MIQ-3 visual imagery subscales. This highlights how different the visual characteristics of goal images are compared with movement images assessed by the MIQ-3. Although not a priori hypothesized, this suggests an individual’s ability to image scenarios of one content will not necessarily transfer to an ability to see images of a completely different content. Such a finding highlights the importance of Paivio’s (1985) suggestion that one should find the method most directly related to the specific task when assess-ing an individual’s imagery ability. Although an athlete may display high levels of movement imagery ability assessed by the MIQ-3, they may not necessarily have a good ability to image the content associated with achieving goals and outcomes.
General DiscussionThe aim of the present research was to develop and validate the SIAQ. Based on the work of Hall et al. (1998), the SIAQ was designed to assess the ability to image sport specific, cognitive and motivational imagery content. The well-established
Sport Imagery Ability Questionnaire 435
SIQ and its underlying framework (Hall et al., 1998; Paivio, 1985) formed the basis of the initial SIAQ items. Item modifications were made to deemphasize imagery function and ensure the ability to image the scenario’s content was assessed. Results from Study 1 identified four types of imagery (skill, strategy, goal, and affect), which were confirmed in Study 2 through the use of CFA. The third study provided further confirmation of the four factors already established as well as identifying, with the inclusion of additional items, a fifth factor of mastery images, that was replicated and confirmed in Study 4. Study 3 also confirmed the gender invariance of the SIAQ and its temporal reliability, and distinguished between athletes based on characteristics such as competitive level. Finally, a comparison between the SIAQ and the MIQ-3 demonstrated concurrent validity of the SIAQ.
Although the SIAQ was not able to distinguish between ease of imaging and vividness, it is important to point out that while these dimensions appear to share a measured overlap in the processes they reflect (i.e., image formation, mainte-nance, and transformation; Roberts et al., 2008), these are conceptually different characteristics of imagery ability. Ease of imaging refers to the extent an individual is readily able to image a scenario, whereas vividness refers to the clarity and rich-ness associated with an image. There is likely to be a positive association between the two dimensions. For example, an individual who finds it easier to image a scenario is also likely to be able to image it more clearly and vividly. However, it is also possible for an individual to image a scenario easily, but with less vividness. Likewise, an individual learning to make an image more vivid may find this image more difficult to generate. Future research must attempt to tease these characteristics apart to provide a more comprehensive assessment of imagery ability.
The SIAQ provides a comprehensive assessment of athlete imagery ability by assessing five types of imagery content closely associated with the five functions of athlete imagery use. Study 4 demonstrated this content is different to movement imagery ability. CFA results and factor correlations in Studies 2, 3, and 4 identified that skill, strategy, goal, affect, and mastery imagery are all different but related types of imagery content. Study 2 demonstrated that ease of imaging was reflective of being able to see and feel the imagery scenario, which was also confirmed by the similar correlations found between SIAQ subscales and MIQ-3 EVI, IVI, and KI in Study 4. The lack of significant differences in the fit of the first-order corre-lated traits model and hierarchical model suggests either can be used depending on whether researchers want to separately assess each type of imagery content or not.
Results from Study 3 reveal athletes significantly differ in their imagery ability depending on the content imaged, further supporting the importance and relevance of separately assessing the various images athletes’ experience, rather than assess-ing one type and generalizing it to other imagery scenarios. Notably skill imagery ability, which may be thought to be comprised of content most closely associated to movement imagery, was significantly easier to image compared with strategy, goal, and mastery imagery, yet it was significantly more difficult to image compared with affect imagery. If the MIQ-3 or VMIQ-2 is used to assess imagery ability before an intervention that incorporates imagery content more reflective of that assessed by the SIAQ, an overestimation of the ability to image strategies, goals and outcomes, and mastery type images, and an underestimation of the ability to image scenarios encompassing feelings and emotions associated with performance may occur. Con-sequently, it is important for researchers to select the imagery ability measure that
436 Williams and Cumming
is most appropriate for the upcoming intervention. For example, the SIAQ should be used if the intervention encompasses sport related images whereas the VMIQ-2 or MIQ-3 would be preferred if separate assessment of both visual perspectives is needed or if the intervention includes imagery of movement content that is not sport related. Separately assessing different types of imagery ability at the outset enables researchers to tailor the content of an imagery intervention to be reflective of the type of imagery an athlete is most capable of performing.
Athletes of a higher competitive level found it significantly easier to generate sport images. Although various studies have established competitive level differ-ences as a result of movement imagery ability (e.g., Gregg & Hall, 2006; Roberts et al., 2008), very few have demonstrated the influence competitive level has on imagery ability of sporting content. Research has identified athletes competing at a higher level use imagery more frequently (e.g., Hall et al., 1998), and athletes who use imagery more frequently, tend to display higher levels of imagery ability. Consequently, athletes of a higher competitive level would be expected to be able to generate images with greater ease than their lower level counterparts. Therefore, as well as extending previous research, this finding further validates the SIAQ as a measure of sport imagery ability.
The SIAQ’s temporal reliability was supported by test-rest reliability over a 3-month period suggesting any increases in reported SIAQ scores following an inter-vention of three months or less are likely to result from improvements in imagery ability. Study 4 established the SIAQ’s concurrent validity and demonstrated that imagery ability reflected by one questionnaire will not necessarily generalize to another. Both the SIAQ and the MIQ-3 assess imagery ability in terms of ease of imaging on a similar 7-point Likert-type scale. This provides further support for the suggestion that discrepancies between the two questionnaires are a result of differing content rather than other factors such as the construct of imagery ability being assessed or the discrepancy in the rating scales.
Development of the SIAQ has opened various avenues of future research. As a new questionnaire, it should undergo further validation. Although the SIAQ has been compared with the MIQ-3 as a measure of imagery ability, there are other valid and reliable imagery ability questionnaires such as the VMIQ-2 that assess other characteristics of imagery ability (e.g., vividness). Because the SIAQ evolved from the five types of imagery identified by the SIQ (Hall et al., 1998), it would also be logical to examine relationships between the SIAQ and SIQ subscales in future research. In addition, potential moderating effects of imagery ability, proposed by the applied model of imagery use (Martin et al., 1999), can be more extensively examined due to the SIAQ’s capacity to assess different types of imagery outlined in the model.
Finally, as well as performance improvements, imagery has been associated with various motivational processes and outcomes (for review, see Cumming & Ramsey, 2009). With the existence of a valid and reliable questionnaire providing a comprehensive assessment of the ability to image athlete imagery content, the relationship between imagery ability and psychological characteristics associated with sporting success/failure can be more extensively explored.
In conclusion, the present investigation established and validated a reliable questionnaire assessing skill, strategy, goal, affect, and mastery sport imagery ability, the content of which reflects the five functions of imagery used by athletes
Sport Imagery Ability Questionnaire 437
(Hall et al., 1998). Therefore, a much wider range of imagery content athletes experience in relation to their sport can now be assessed. Through the validation process, novel contributions were also made to imagery ability research. Results replicate and extend findings of Roberts et al. (2008) and others (e.g., Gregg & Hall, 2006), revealing a higher competitive level is associated with greater sport specific imagery ability of varying content. Secondly, this is the first study to our knowledge that has identified imagery ability to differ depending on imagery con-tent. The SIAQ demonstrated concurrent validity through its comparison with the MIQ-3, but these findings along with those in Study 3, demonstrate an ability to generate movement imagery cannot be generalized to other imagery content such as goal images. Future research should continue to validate the SIAQ through other means such as investigating SIAQ imagery ability with other measures of imagery ability, imagery use represented by the SIQ, and other characteristics that influence sporting performance. Demonstrating the SIAQ’s predictive validity of imagery use and other outcomes would further establish this questionnaire as an effective assessment of athlete imagery ability.
Notes
1. A covariance matrix was factor analyzed. However, the Likert-scaled items were also treated as ordinal data at the request of an anonymous reviewer and the CFA solutions in Studies 2, 3, and 4 were also analyzed using polychoric correlations. Comparisons of the factor loadings for the model when the data were treated as ordinal and interval were very similar (mean difference: Study 2 = 0.007, Study 3 = 0.005, Study 4 = 0.01). As such, in line with the majority of published psychometric papers, we treated the data as interval throughout the article.
2. We would like to thank the anonymous reviewer for this suggestion.
Acknowledgments
The authors would like to thank Ian Chappell, Charlene Cox, Juliette Stebbings, and Neil Weaver for their help with data collection.
ReferencesArbuckle, J.L. (1999). AMOS (Version 16.0). Chicago: Smallwaters Corporation. ([Com-
puter software])Baddeley, A.D., & Andrade, J. (2000). Working memory and the vividness of imagery.
Journal of Experimental Psychology. General, 129, 126–145.Bentler, P.M. (1990). Comparative fit indexes in structural models. Psychological Bulletin,
107, 238–246.Bentler, P.M. (1995). EQS structural equations program manual. Encino, CA: Multivariate
Software Inc.Bentler, P.M. (2009). Alpha, dimension-free, and model-based internal consistency reliability.
Psychometrika, 74, 137–143.Bollen, K.A. (1989). Structural equations with latent variables. New York: Wiley.Browne, M.W., & Cudeck, R. (1993). Alternative ways of assessing model fit. In K.A.
Bollen & J.S. Long (Eds.), Testing structural equation models (pp. 136–162). Newbury Park, CA: Sage.
438 Williams and Cumming
Byrne, B.M. (2010). Structural equation modeling with AMOS: basic concepts, applications, and programming (2nd ed.). New York: Taylor and Francis.
Callow, N., & Hardy, L. (2001). Types of imagery associated with sport confidence in netball players of varying skill levels. Journal of Applied Sport Psychology, 13, 1–17.
Callow, N., & Waters, A. (2005). The effect of kinesthetic imagery on the sport confidence of flat-race horse jockeys. Psychology of Sport and Exercise, 6, 443–459.
Campos, A., Pérez-Fabello, M.J., & Gómez-Juncal, R. (2004). Gender and age differences in measured and self-perceived imaging capacity. Personality and Individual Differ-ences, 37, 1383–1389.
Cheung, G.W., & Rensvold, R.B. (2002). Evaluating goodness-of-fit indexes for testing measurement invariance. Structural Equation Modeling, 9, 233–255.
Costello, A.B., & Osborne, J.W. (2005). Best practices in exploratory factor analysis: Four recommendations for getting the most from your analysis. Practical Assessment. Research Evaluation, 10, 1–9.
Cudeck, R., & Brown, M.W. (1983). Cross-validation of covariance structures. Multivariate Behavioral Research, 18, 147–167.
Cumming, J. (2008). Investigating the relationship between exercise imagery, leisure time exercise behavior, and self-efficacy. Journal of Applied Sport Psychology, 20, 184–198.
Cumming, J., Clark, S.E., Ste-Marie, D.M., McCullagh, P., & Hall, C. (2005). The Functions of Observational Learning Questionnaire. Psychology of Sport and Exercise, 6, 517–537.
Cumming, J., & Hall, C. (2002). Athletes’ use of imagery in the off-season. The Sport Psychologist, 16, 160–172.
Cumming, J., & Ramsey, R. (2009). Sport imagery interventions. In S. Mellalieu & S. Hanton (Eds.), Advances in applied sport psychology: A review (pp. 5–36). London: Routledge.
Cumming, J., Olphin, T., & Law, M. (2007). Self-reported psychological states and physi-ological responses to different types of motivational general imagery. Journal of Sport & Exercise Psychology, 29, 629–644.
Cumming, J., & Ste-Marie, D.M. (2001). The cognitive and motivational effects of imagery training: A matter of perspective. The Sport Psychologist, 15, 276–287.
Glisky, M. L., Williams, J. M., & Kihlstrom, J. F. (1996). Internal and external imagery perspectives and performance on two tasks. Journal of Sport Behavior, 19, 3–18.
Goss, S., Hall, C., Buckolz, E., & Fishburne, G. (1986). Imagery ability and the acquisition and retention of movements. Memory & Cognition, 14, 469–477.
Gregg, M., & Hall, C. (2006). Measurement of motivational imagery abilities in sport. Journal of Sports Sciences, 24, 961–971.
Hair, J. F., Anderson, R. E., Tatham, R. L., & Black, W. C. (1998). Multivariate data analysis. Upper Saddle River, NJ: Prentice Hall.
Hall, C.R. (1998). Measuring imagery abilities and imagery use. In J.L. Duda (Ed.), Advances in sport and exercise psychology measurement (pp. 165–172). Morgantown, WV: Fit-ness Information Technology.
Hall, C.R. (2001). Imagery in sport and exercise. In R.N. Singer, H.A. Hausenblas, & C.M. Janelle (Eds.), The handbook of sport psychology (2nd ed., pp. 529–549). New York: John Wiley & Sons Inc.
Hall, C.R., Buckolz, E., & Fishburne, G. (1992). Imagery and the acquisition of motor skills. Canadian Journal of Sport Sciences, 17, 19–27.
Hall, C., Mack, D., Paivio, A., & Hausenblas, H. (1998). Imagery use by athletes: Develop-ment of the sport imagery questionnaire. International Journal of Sport Psychology, 29, 73–89.
Hall, C., & Martin, K. A. (1997). Measuring movement imagery abilities: A revision of the Movement Imagery Questionnaire. Journal of Mental Imagery, 21, 143–154.
Hu, L., & Bentler, P.M. (1999). Cutoff criteria for fit indices in covariance structure analysis: Conventional criteria versus new alternatives. Structural Equation Modeling, 6, 1–55.
Sport Imagery Ability Questionnaire 439
Jöreskog, K.G., & Sörbom, D. (1993). LISREL 8 user’s reference guide. Chicago: Scientific Software.
Kosslyn, S.M. (1994). Image and brain. Cambridge, MA: MIT Press.Koufteros, X., Babbar, S., & Kaighobadi, M. (2009). A paradigm for examining second-
order factor models employing structural equation modeling. International Journal of Production Economics, 120, 633–652.
Lynn, M.R. (1986). Determination and quantification of content validity. Nursing Research, 35, 382–385.
MacCallum, R.C. (2003). Working with imperfect models. Multivariate Behavioral Research, 38, 113–139.
Mardia, K.V. (1970). Measures of multivariate skewness and kurtosis with applications. Biometrika, 57, 519–530.
Markland, D. (2007). The golden rule is that there are no golden rules: A commentary on Paul Barrett’s recommendations for reporting model fit in structural equation model-ling. Personality and Individual Differences, 42, 851–858.
Marsh, H.W., Hau, K-T., & Wen, Z. (2004). In search of golden rules: Comment on hypoth-esis-testing approaches to setting cutoff values for fit indexes and dangers in overgener-alizing Hu and Bentler’s (1999) findings. Structural Equation Modeling, 11, 320–341.
Martin, K.A., Moritz, S.E., & Hall, C. (1999). Imagery use in sport: A literature review and applied model. The Sport Psychologist, 13, 245–268.
Murphy, S., Nordin, S.M., & Cumming, J. (2008). Imagery in sport, exercise and dance. In T. Horn (Ed.), Advances in sport and exercise psychology (3rd ed., pp. 297–324). Champaign, IL: Human Kinetics.
Nordin, S.M., & Cumming, J. (2005). Professional dancers describe their imagery: Where, when, what, why, and how. The Sport Psychologist, 19, 395–416.
Nordin, S.M., & Cumming, J. (2008). Types and functions of atheltes’ imagery: Testing prediction from the applied model of imagery use by examining effectiveness. Inter-national Journal of Sport and Exercise Psychology, 6, 189–206.
Ntoumanis, N. (2001). A step-by-step guide to SPSS for sport and exercise studies. London: Routledge.
Paivio, A. (1985). Cognitive and motivational functions of imagery in human performance. Canadian Journal of Applied Sport Sciences, 10, 22S–28S.
Ramsey, R., Cumming, J., Edwards, M.E., Williams, S., & Brunning, C. (2010). Examining the emotion aspect of PETTLEP based Imagery and penalty taking performance in football. Journal of Sport Behavior, 33, 295–315.
Roberts, R., Callow, N., Hardy, L., Markland, D., & Bringer, J. (2008). Movement imagery ability: Development and assessment of a revised version of the vividness of move-ment imagery questionnaire. Journal of Sport & Exercise Psychology, 30, 200–221.
Robin, N., Dominique, L., Toussaint, L., Blandin, Y., Guillot, A., & Le Her, M. (2007). Effect of motor imagery training on service return accuracy in tennis: The role of imagery ability. International Journal of Sport and Exercise Psychology, 2, 175–186.
Rodgers, W., Hall, C., & Buckolz, E. (1991). The effect of an imagery training program on imagery ability, imagery use, and figure skating performance. Journal of Applied Sport Psychology, 3, 109–125.
Satorra, A., & Bentler, P.M. (2001). A scaled difference chi-square test statistic for moment structure analysis. Psychometrika, 66, 507–514.
Short, S.E., Monsma, E.V., & Short, M.W. (2004). Is what you see really what you get? Athletes’ perceptions of imagery’s functions. The Sport Psychologist, 18, 341–349.
Sijtsma, K. (2009). On the use, the misuse, and the very limited usefulness of Cronbach’s alpha. Psychometrika, 74, 107–120.
Steiger, J.H. (1990). Structural model evaluation: An interval estimation approach. Multi-variate Behavioral Research, 25, 173–180.
440 Williams and Cumming
Tabachnick, B.G., & Fidell, L.S. (2007). Using multivariate statistics (5th ed.). Boston: Allyn and Bacon.
Vincent, W.J. (1999). Statistics in kinesiology. Champaign, IL: Human Kinetics.Williams, S.E., Cumming, J., & Balanos, G.M. (2010). The use of imagery to manipulate
challenge and threat appraisal states in athletes. Journal of Sport & Exercise Psychol-ogy, 32, 339–358.
Williams, S.E., Cumming, J., & Edwards, M.G. (in press).Does the functional equivalence between movement imagery, observation, and execution influence imagery ability? Investigating different modes of MIQ-R delivery. Research Quarterly for Exercise and Sport.
Williams, S.E., Cumming, J., Ntoumanis, N., Nordin, S.M., Ramsey, R., & Hall, C.R. (2011). Further validation and development of the Movement Imagery Questionnaire. Submitted for publication.
Manuscript submitted: September 16, 2010Revision accepted: March 2, 2011