Embed Size (px)
Citation preview
CIBW062 Symposium 2013
1
Application of the siphonic drainage system to longplumbing intended for use in plants
T. Mitsunaga (1), K. Sakaue (2), T. Inada (3), S. Yoshihama (4)1. [email protected]. [email protected]. [email protected]. [email protected]. Yamashita Sekkei Inc, Japan2. School of Science and Technology, Meiji University, Japan3. SUGA Co, Ltd, Japan4. HASEKO Corporation, Japan
Abstract
Studies on the siphonic drainage system intended for fixture discharge in buildings have
seen some progress in recent years particularly on the subjects such as flow
characteristics, and there have been several examples of application to fixture drainage
in actual apartment complexes.
On the other hand, a large piping space (height) is required in the conventional drainage
method based on slope when a water use places are isolated in buildings such as plants
where the floor planning tend to be large. The use of the siphonic drainage system
makes it possible to construct long plumbing with small pipe diameters and no slope,
which could shorten a large piping space.
In this study we conducted experiments on flow characteristics using actual scale
experimental models with a 20 m long horizontal pipe and analyzed the results of the
experimental data to study application of the siphonic drainage system to long plumbing
intended for use in plants.
Keywords
Drainage system, siphon, the long plumbing, plant, fixture discharge
CIBW062 Symposium 2013
2
1 Introduction
The study of the siphonic drainage system intended for fixture discharge in Japan began
in 1999 based on the concept of SI housing, which was grown out of the impetus to
promote long life apartment houses. High expectation is held for the siphonic drainage
system as a low-cost, highly flexible system that can replace the existing system when
the layouts of fixtures in buildings are renewed. The application of the system is now
evolving from laboratories and desk plans to field experiment with test applications to
existing apartment houses with tenants having already been made.
Having advantages of fitting in with smaller diameter piping than the conventional
drainage system and not requiring sloped horizontal drain pipes, the system may have
wider applications other than the use in apartment houses. One possibility is the use in
plants and factories. The conventional drainage system, if installed in buildings where
the floor planning is large and water use places are isolated in buildings, requires a large
piping space (height). On the other hand, the use of the siphonic drainage system is
expected to reduce such space.
In the previous study in 2008 on the application of the siphonic drainage to fixture
discharge, Sakaue demonstrated how the differences in discharge style affected flow
characteristics by calculating equivalent lengths of the pipes that made up the system
and flow velocity in piping. In 2010, Tanaka, Sakaue, et al. evaluated the performance
of riser elbow pipes that contributed to induce a siphonic effect with its raised
horizontal pipe ends. They confirmed the validity of the equation for calculating
siphonic negative pressure as well as that of the equation for calculating velocity.
In this present study we conducted a real scale experiment using a 20 m long horizontal
pipe to obtain data for application of the siphonic system to long piping. We used the
equation for calculating velocity and the equation for calculating siphonic negative
pressure obtained in the previous study to make comparison with experimental data and
confirm the validity of these equations.
In Chapter 2, we investigated how flow characteristics were influenced by the shapes of
inflow sections of the indirect waste pipes that receive discharge from production
facilities of plants.
In Chapter 3, we investigated the influence that different diameters (20A and 25A) of
U-PVC pipes had on flow characteristics.
CIBW062 Symposium 2013
3
2 Influence of Shapes of Inflow Sections on Flow Characteristics
2.1 Outline of Experiment
2.1.1 Purpose
The purpose of this experiment is to examine the influence of the shapes of inflow
sections that receives discharge from production facilities of plants and to determine the
most appropriate shape of inflow sections.
2.1.2 Experimental apparatus
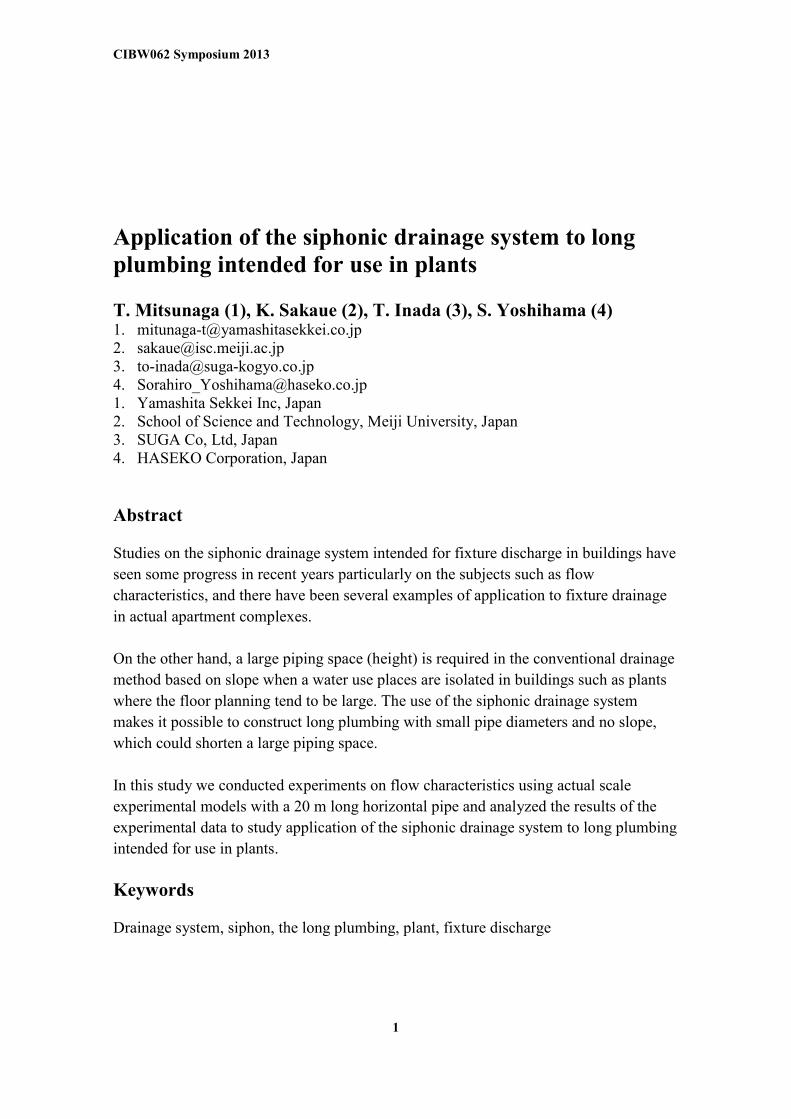
The outline of the piping model is shown in Figure 1. The inflow section is a tube
shaped part (referred to as inflow part below) which is made up of the combination of a
drainage hopper and a straight pipe, and two diameter patterns 100A and 150A were
prepared (Figure 2). A U-PVC pipe (25A) with a horizontal length of 20 m and variable
outflow heads of 500, 1,000, 1,500 and 2,000 mm were used. Two patterns of piping
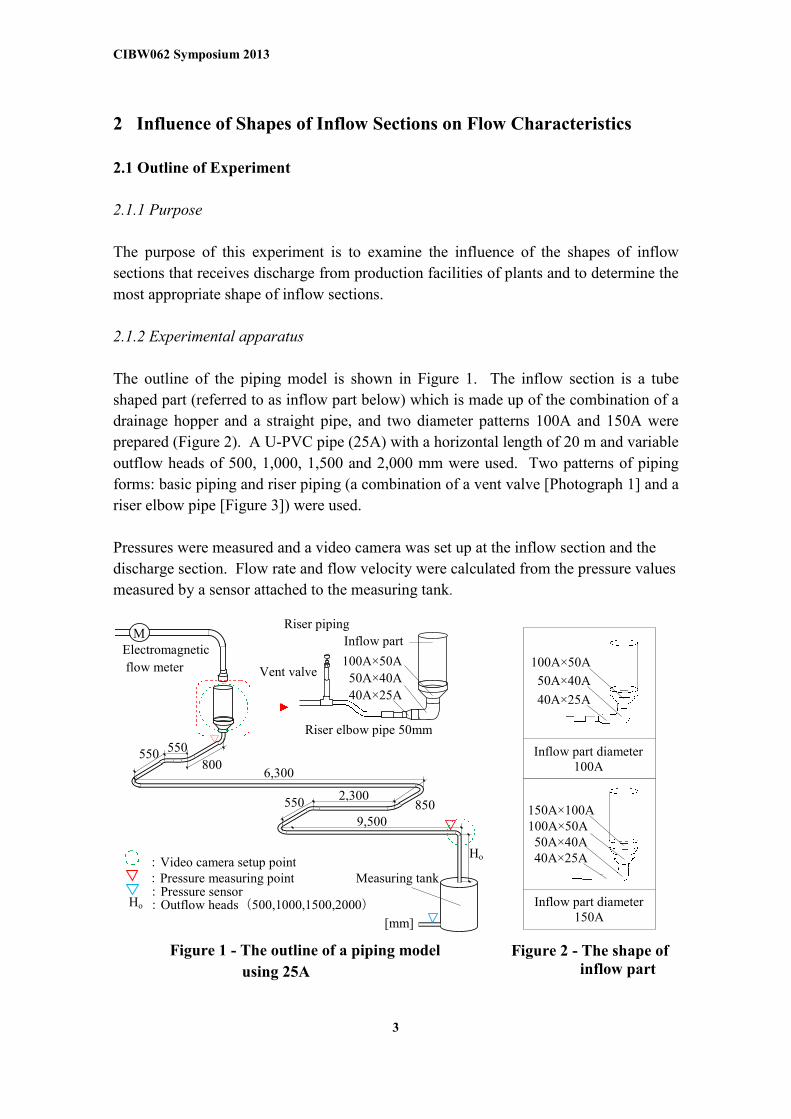
forms: basic piping and riser piping (a combination of a vent valve [Photograph 1] and a
riser elbow pipe [Figure 3]) were used.
Pressures were measured and a video camera was set up at the inflow section and the
discharge section. Flow rate and flow velocity were calculated from the pressure values
measured by a sensor attached to the measuring tank.
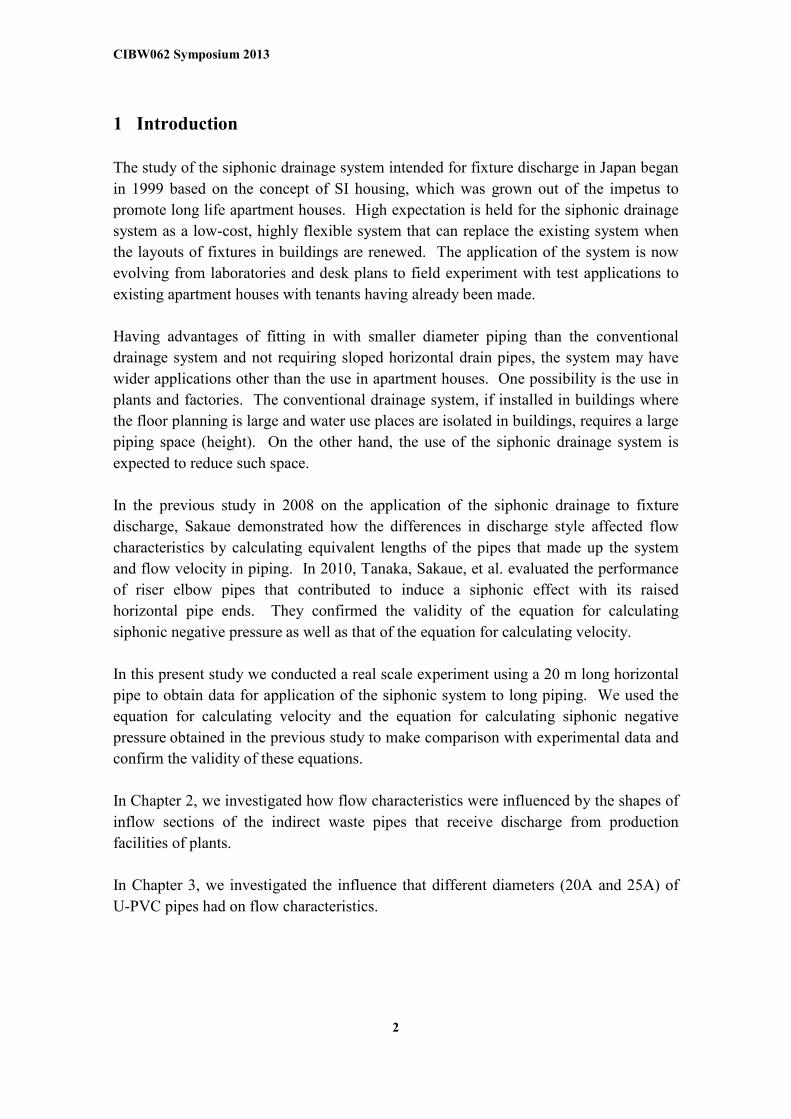
Figure 2 - The shape ofinflow part
Inflow part diameter100A
100A×50A
50A×40A
40A×25A
Inflow part diameter150A
100A×50A50A×40A40A×25A
150A×100A
550
Figure 1 - The outline of a piping model
using 25A
6,300
Inflow part
100A×50A
50A×40A
40A×25A
Vent valve
Riser elbow pipe 50mm
MElectromagnetic
flow meter
800550
8505502,300
9,500
Ho
Measuring tank
Riser piping
Ho
:Pressure measuring point
:Outflow heads(500,1000,1500,2000):Pressure sensor
:Video camera setup point
[mm]
CIBW062 Symposium 2013
4
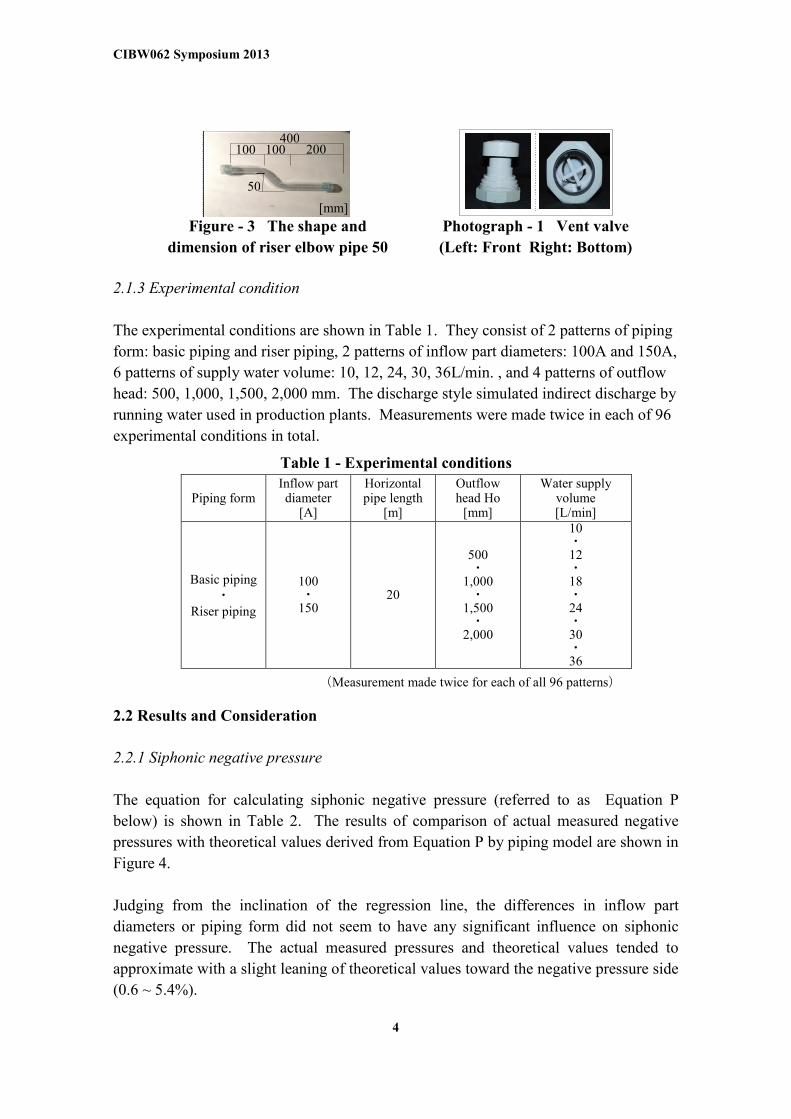
2.1.3 Experimental condition
The experimental conditions are shown in Table 1. They consist of 2 patterns of piping
form: basic piping and riser piping, 2 patterns of inflow part diameters: 100A and 150A,
6 patterns of supply water volume: 10, 12, 24, 30, 36L/min. , and 4 patterns of outflow
head: 500, 1,000, 1,500, 2,000 mm. The discharge style simulated indirect discharge by
running water used in production plants. Measurements were made twice in each of 96
experimental conditions in total.
2.2 Results and Consideration
2.2.1 Siphonic negative pressure
The equation for calculating siphonic negative pressure (referred to as Equation P
below) is shown in Table 2. The results of comparison of actual measured negative
pressures with theoretical values derived from Equation P by piping model are shown in
Figure 4.
Judging from the inclination of the regression line, the differences in inflow part
diameters or piping form did not seem to have any significant influence on siphonic
negative pressure. The actual measured pressures and theoretical values tended to
approximate with a slight leaning of theoretical values toward the negative pressure side
(0.6 ~ 5.4%).
Photograph - 1 Vent valve
(Left: Front Right: Bottom)
Figure - 3 The shape and
dimension of riser elbow pipe 50
[mm]
400200100 100
50
Table 1 - Experimental conditions
Piping formInflow partdiameter
[A]
Horizontalpipe length
[m]
Outflowhead Ho
[mm]
Water supplyvolume[L/min]
Basic piping・
Riser piping
100・
15020
500・
1,000・
1,500・
2,000
10・12・18・24・30・36
(Measurement made twice for each of all 96 patterns)
CIBW062 Symposium 2013
5
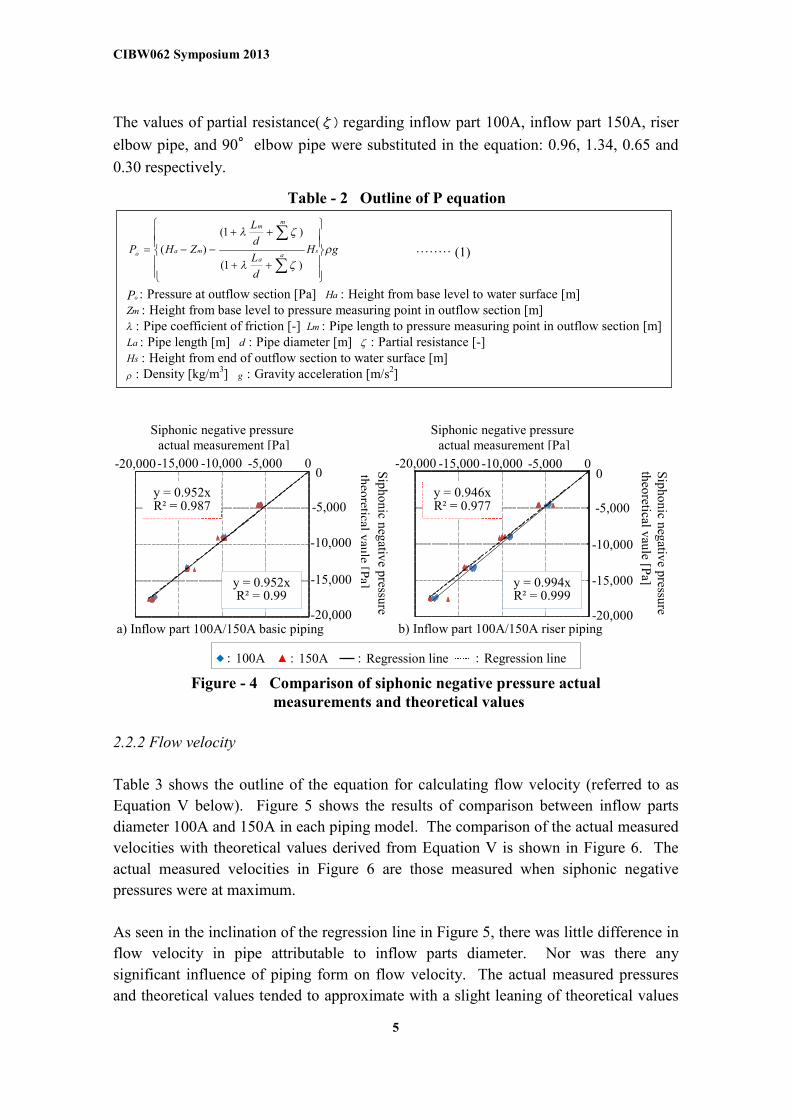
The values of partial resistance(ζ) regarding inflow part 100A, inflow part 150A, riser
elbow pipe, and 90°elbow pipe were substituted in the equation: 0.96, 1.34, 0.65 and
0.30 respectively.
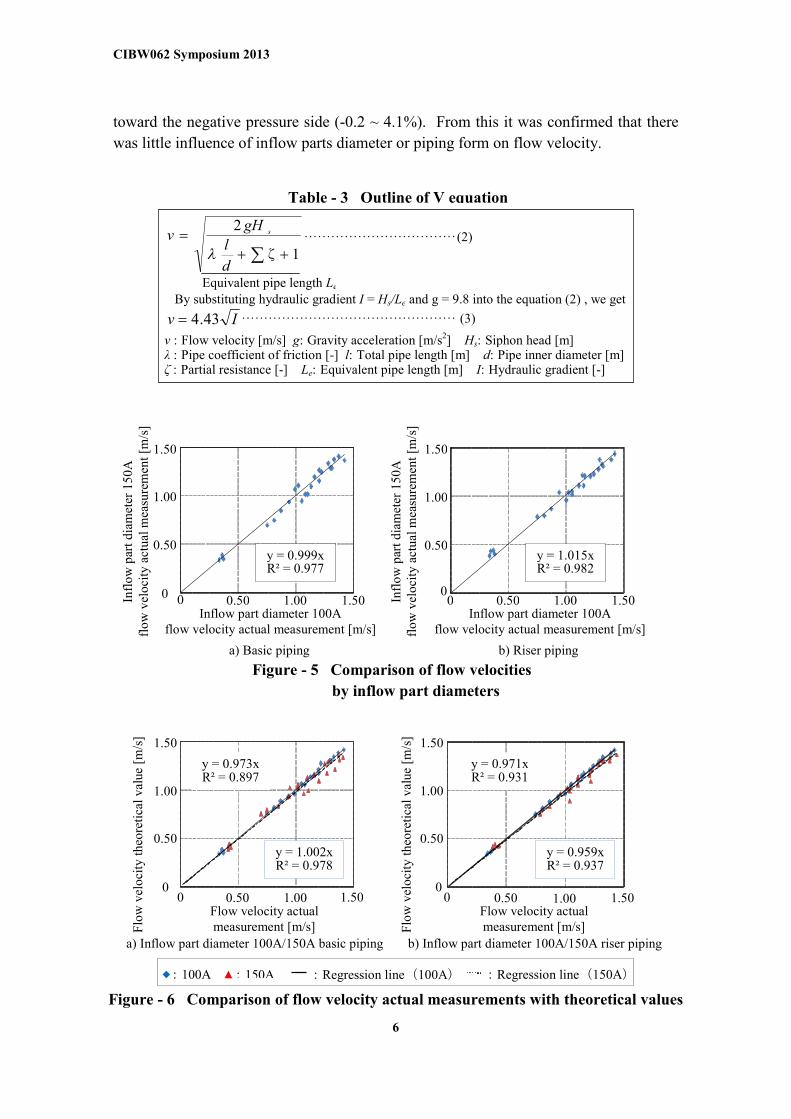
2.2.2 Flow velocity
Table 3 shows the outline of the equation for calculating flow velocity (referred to as
Equation V below). Figure 5 shows the results of comparison between inflow parts
diameter 100A and 150A in each piping model. The comparison of the actual measured
velocities with theoretical values derived from Equation V is shown in Figure 6. The
actual measured velocities in Figure 6 are those measured when siphonic negative
pressures were at maximum.
As seen in the inclination of the regression line in Figure 5, there was little difference in
flow velocity in pipe attributable to inflow parts diameter. Nor was there any
significant influence of piping form on flow velocity. The actual measured pressures
and theoretical values tended to approximate with a slight leaning of theoretical values
Figure - 4 Comparison of siphonic negative pressure actualmeasurements and theoretical values
-5,000
Sip
ho
nic
neg
ative
pressu
reth
eoretical
vau
le[P
a]
Sip
ho
nic
neg
ative
pressu
re
theo
reticalv
aule
[Pa]y = 0.952x
R² = 0.99
Siphonic negative pressureactual measurement [Pa]
-20,000-15,000 -10,000 -5,000 0
-20,000
-15,000
-10,000
0
Siphonic negative pressureactual measurement [Pa]
-20,000 -15,000 -10,000 -5,000 0
-20,000
-15,000
-10,000
-5,000
0
a) Inflow part 100A/150A basic piping b) Inflow part 100A/150A riser piping
y = 0.952xR² = 0.987
y = 0.946xR² = 0.977
:150A:100A :Regression line
y = 0.994xR² = 0.999
:Regression line
Table - 2 Outline of P equation
gH
d
L
d
L
ZHP sa
a
mm
mao
)1(
)1(
)(
oP : Pressure at outflow section [Pa] aH : Height from base level to water surface [m]mZ : Height from base level to pressure measuring point in outflow section [m] : Pipe coefficient of friction [-] mL : Pipe length to pressure measuring point in outflow section [m]
aL : Pipe length [m] d : Pipe diameter [m] : Partial resistance [-]sH : Height from end of outflow section to water surface [m]
: Density [kg/m3] g : Gravity acceleration [m/s2]
········ (1)
CIBW062 Symposium 2013
6
toward the negative pressure side (-0.2 ~ 4.1%). From this it was confirmed that there
was little influence of inflow parts diameter or piping form on flow velocity.
Table - 3 Outline of V equation
··································(2)
1
2
ζd
l
gHv s
Equivalent pipe length Le
By substituting hydraulic gradient I = Hs/Le and g = 9.8 into the equation (2) , we get
v : Flow velocity [m/s] g: Gravity acceleration [m/s2] Hs: Siphon head [m]λ : Pipe coefficient of friction [-] l: Total pipe length [m] d: Pipe inner diameter [m]ζ : Partial resistance [-] Le: Equivalent pipe length [m] I: Hydraulic gradient [-]
Iv 43.4 ················································ (3)
Figure - 6 Comparison of flow velocity actual measurements with theoretical values
0 01.501.000.500
1.50
1.00
0.50
Flow velocity actualmeasurement [m/s]F
low
vel
oci
tyth
eore
tica
lv
alue
[m/s
] 1.50
1.501.000.50
0.50
0
1.00
y = 0.959xR² = 0.937
y = 1.002xR² = 0.978
y = 0.973xR² = 0.897
y = 0.971xR² = 0.931
a) Inflow part diameter 100A/150A basic piping b) Inflow part diameter 100A/150A riser piping
Flo
wv
elo
city
theo
reti
cal
val
ue[m
/s]
Flow velocity actualmeasurement [m/s]
:150A:100A :Regression line(100A) :Regression line(150A)
0
1.50
1.501.000.50
0.50
0Inflow part diameter 100A
flow velocity actual measurement [m/s]
1.00
0
1.50
1.501.000.50
0.50
0
Inflow part diameter 100Aflow velocity actual measurement [m/s]
Infl
ow
par
td
iam
eter
15
0A
flo
wv
elo
city
actu
alm
easu
rem
ent
[m/s
]
1.00
a) Basic piping b) Riser piping
Figure - 5 Comparison of flow velocities
by inflow part diameters
y = 1.015xR² = 0.982
y = 0.999xR² = 0.977
Infl
ow
par
td
iam
eter
15
0A
flo
wv
elo
city
actu
alm
easu
rem
ent
[m/s
]
CIBW062 Symposium 2013
7
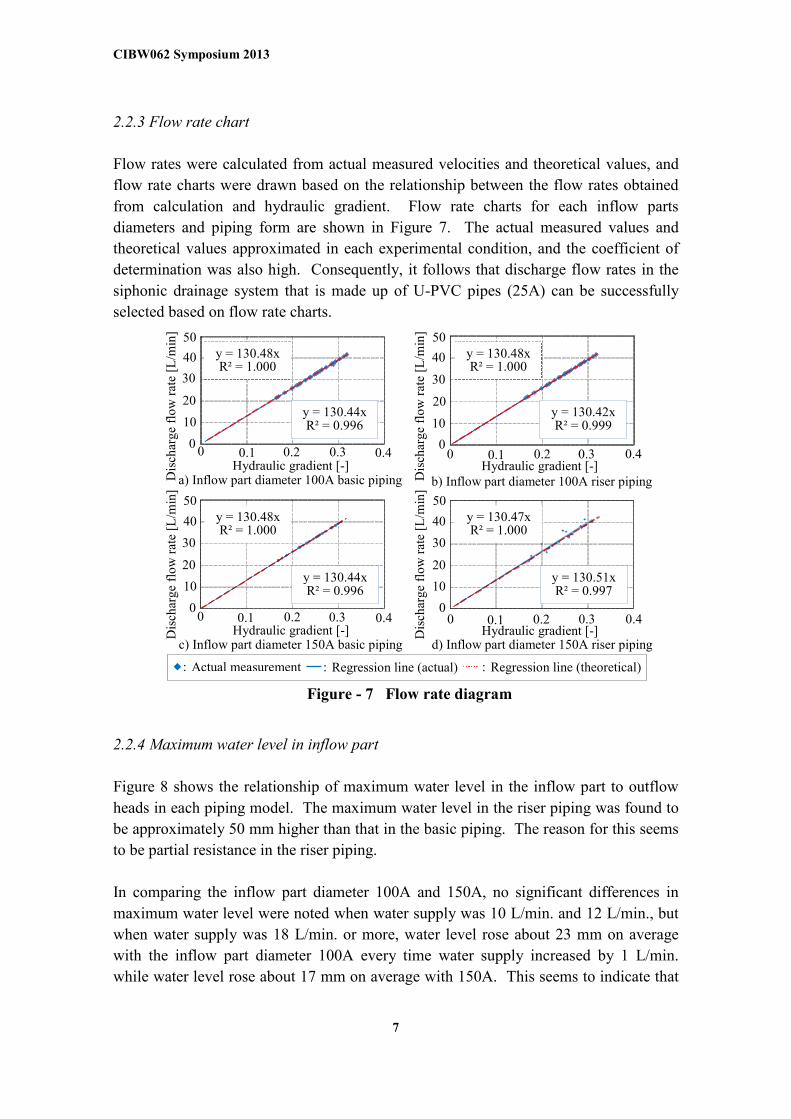
2.2.3 Flow rate chart
Flow rates were calculated from actual measured velocities and theoretical values, and
flow rate charts were drawn based on the relationship between the flow rates obtained
from calculation and hydraulic gradient. Flow rate charts for each inflow parts
diameters and piping form are shown in Figure 7. The actual measured values and
theoretical values approximated in each experimental condition, and the coefficient of
determination was also high. Consequently, it follows that discharge flow rates in the
siphonic drainage system that is made up of U-PVC pipes (25A) can be successfully
selected based on flow rate charts.
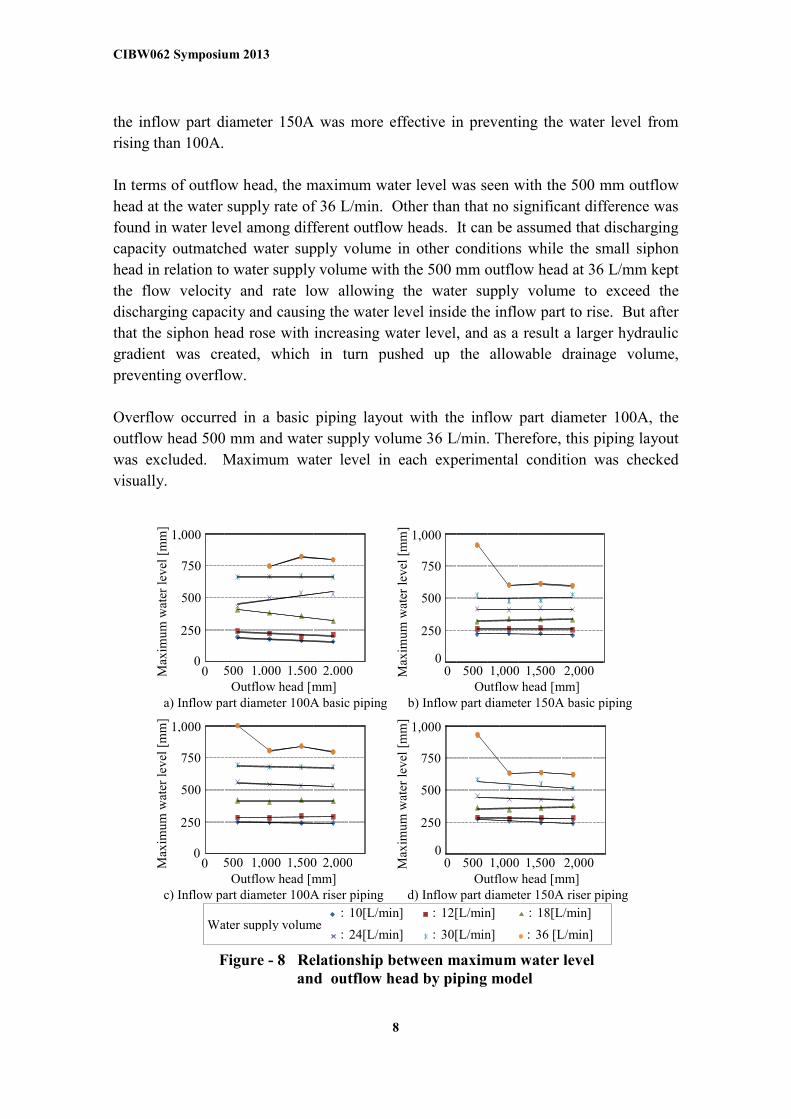
2.2.4 Maximum water level in inflow part
Figure 8 shows the relationship of maximum water level in the inflow part to outflow
heads in each piping model. The maximum water level in the riser piping was found to
be approximately 50 mm higher than that in the basic piping. The reason for this seems
to be partial resistance in the riser piping.
In comparing the inflow part diameter 100A and 150A, no significant differences in
maximum water level were noted when water supply was 10 L/min. and 12 L/min., but
when water supply was 18 L/min. or more, water level rose about 23 mm on average
with the inflow part diameter 100A every time water supply increased by 1 L/min.
while water level rose about 17 mm on average with 150A. This seems to indicate that
Figure - 7 Flow rate diagram
20
40y = 130.48xR² = 1.000
y = 130.48xR² = 1.000
Dis
char
ge
flo
wra
te[L
/min
]
0.4
30
0.40
0.1
a) Inflow part diameter 100A basic piping
0 0.30.2
50
40
10
20
b) Inflow part diameter 100A riser piping
0
30
00.30.1 0.2
50
10y = 130.42xR² = 0.999
y = 130.44xR² = 0.996
Hydraulic gradient [-]
Dis
char
ge
flo
wra
te[L
/min
]
Hydraulic gradient [-]
20
40y = 130.48xR² = 1.000
y = 130.47xR² = 1.000
Dis
char
ge
flo
wra
te[L
/min
]
0.4
30
0.40
0.1
c) Inflow part diameter 150A basic piping
0 0.30.2
50
40
10
20
d) Inflow part diameter 150A riser piping
0
30
00.30.1 0.2
50
10y = 130.51xR² = 0.997
y = 130.44xR² = 0.996
Hydraulic gradient [-] Dis
char
ge
flo
wra
te[L
/min
]
Hydraulic gradient [-]
:Actual measurement :Regression line (actual) :Regression line (theoretical)
CIBW062 Symposium 2013
8
the inflow part diameter 150A was more effective in preventing the water level from
rising than 100A.
In terms of outflow head, the maximum water level was seen with the 500 mm outflow
head at the water supply rate of 36 L/min. Other than that no significant difference was
found in water level among different outflow heads. It can be assumed that discharging
capacity outmatched water supply volume in other conditions while the small siphon
head in relation to water supply volume with the 500 mm outflow head at 36 L/mm kept
the flow velocity and rate low allowing the water supply volume to exceed the
discharging capacity and causing the water level inside the inflow part to rise. But after
that the siphon head rose with increasing water level, and as a result a larger hydraulic
gradient was created, which in turn pushed up the allowable drainage volume,
preventing overflow.
Overflow occurred in a basic piping layout with the inflow part diameter 100A, the
outflow head 500 mm and water supply volume 36 L/min. Therefore, this piping layout
was excluded. Maximum water level in each experimental condition was checked
visually.
Figure - 8 Relationship between maximum water leveland outflow head by piping model
Max
imu
mw
ater
lev
el[m
m]
2,0001,5001,0005000
Outflow head [mm]
250
750
1,000
500
0
a) Inflow part diameter 100A basic piping b) Inflow part diameter 150A basic piping
2,0001,5001,00050000
250
750
1,000
500
:12[L/min] :18[L/min]
:36 [L/min]:30[L/min]
:10[L/min]
:24[L/min]Water supply volume
Max
imu
mw
ater
lev
el[m
m]
Outflow head [mm]
Max
imu
mw
ater
lev
el[m
m]
2,0001,5001,0005000
Outflow head [mm]
250
750
1,000
500
0
c) Inflow part diameter 100A riser piping d) Inflow part diameter 150A riser piping
2,0001,5001,00050000
250
750
1,000
500
Max
imu
mw
ater
lev
el[m
m]
Outflow head [mm]
CIBW062 Symposium 2013
9
3Comparison of Flow Characteristics in 20A and 25A Horizontal Pipes
3.1 Outline
3.1.1 Purpose
The purpose of the experiment was to investigate the effect of pipe diameter on flow
characteristics by comparing horizontal pipes 20A and 25A.
3.2 Results and Consideration
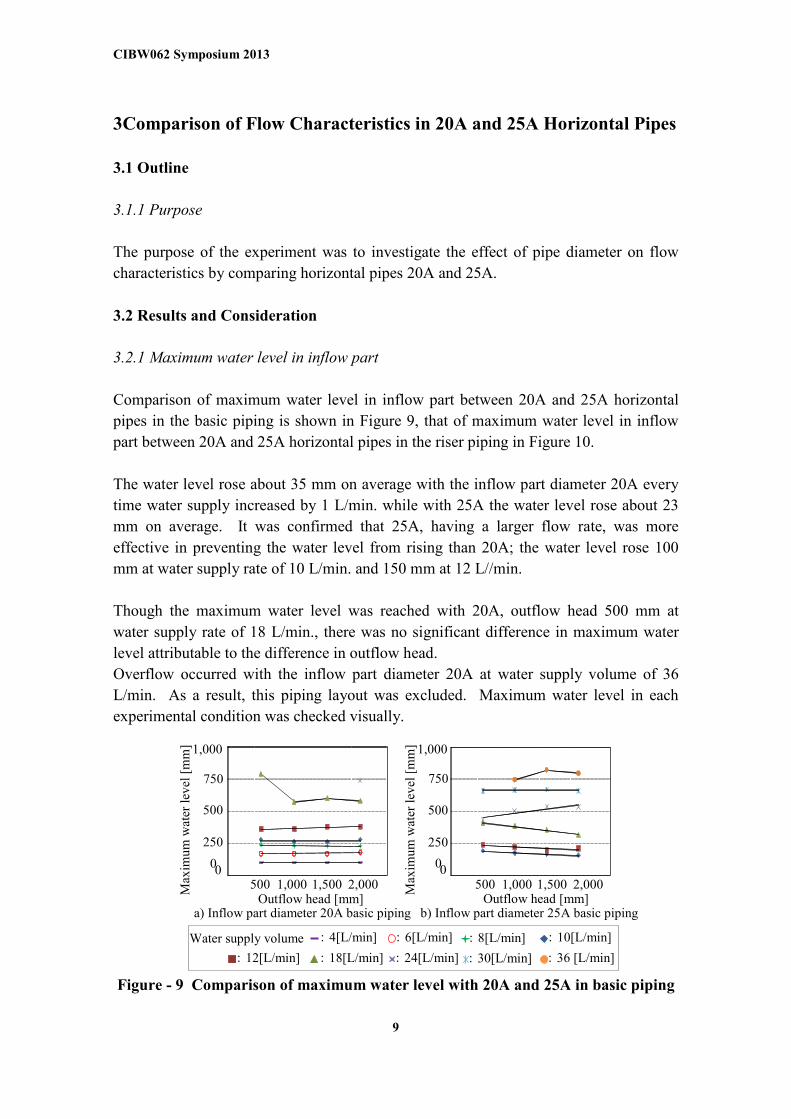
3.2.1 Maximum water level in inflow part
Comparison of maximum water level in inflow part between 20A and 25A horizontal
pipes in the basic piping is shown in Figure 9, that of maximum water level in inflow
part between 20A and 25A horizontal pipes in the riser piping in Figure 10.
The water level rose about 35 mm on average with the inflow part diameter 20A every
time water supply increased by 1 L/min. while with 25A the water level rose about 23
mm on average. It was confirmed that 25A, having a larger flow rate, was more
effective in preventing the water level from rising than 20A; the water level rose 100
mm at water supply rate of 10 L/min. and 150 mm at 12 L//min.
Though the maximum water level was reached with 20A, outflow head 500 mm at
water supply rate of 18 L/min., there was no significant difference in maximum water
level attributable to the difference in outflow head.
Overflow occurred with the inflow part diameter 20A at water supply volume of 36
L/min. As a result, this piping layout was excluded. Maximum water level in each
experimental condition was checked visually.
Figure - 9 Comparison of maximum water level with 20A and 25A in basic piping
Water supply volume
a) Inflow part diameter 20A basic piping
2,0001,5001,00050000
250
750
1,000
500
Outflow head [mm]
Max
imu
mw
ater
lev
el[m
m]
b) Inflow part diameter 25A basic piping
2,0001,5001,00050000
250
750
1,000
500
Outflow head [mm]
Max
imu
mw
ater
lev
el[m
m]
:12[L/min]
:8[L/min]:6[L/min]:4[L/min]
:30[L/min]:18[L/min] :24[L/min] :36 [L/min]
:10[L/min]
CIBW062 Symposium 2013
10
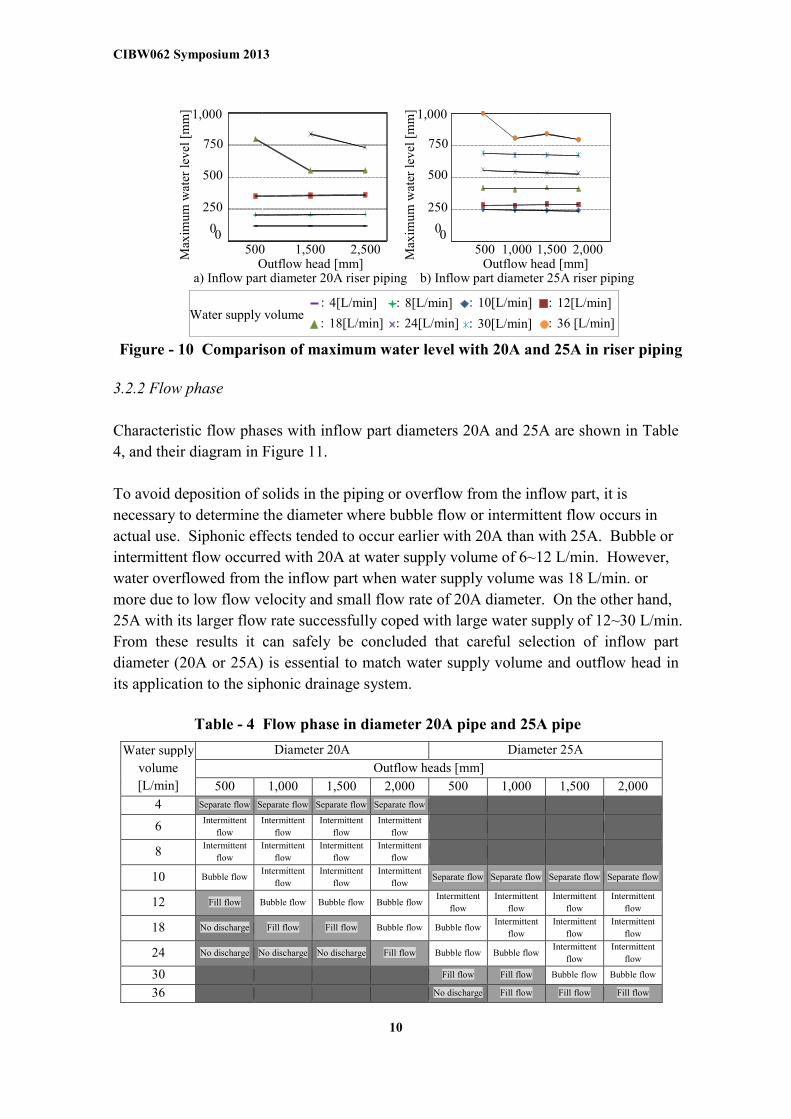
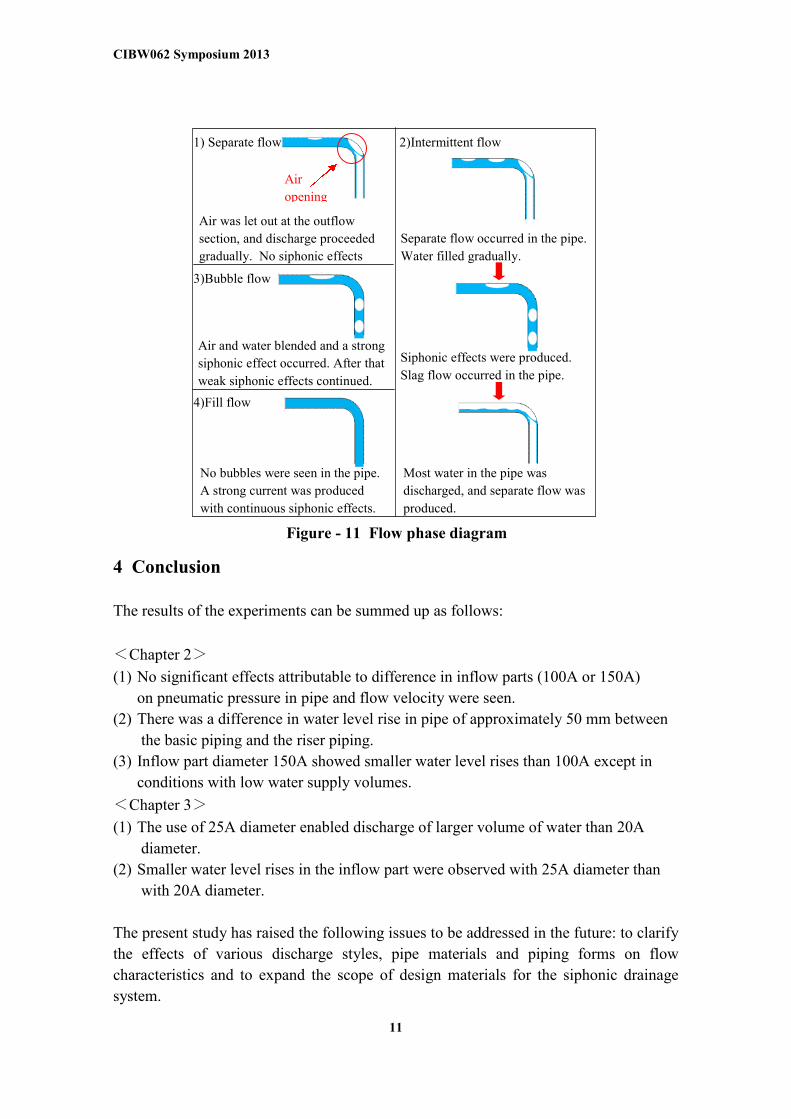
3.2.2 Flow phase
Characteristic flow phases with inflow part diameters 20A and 25A are shown in Table
4, and their diagram in Figure 11.
To avoid deposition of solids in the piping or overflow from the inflow part, it is
necessary to determine the diameter where bubble flow or intermittent flow occurs in
actual use. Siphonic effects tended to occur earlier with 20A than with 25A. Bubble or
intermittent flow occurred with 20A at water supply volume of 6~12 L/min. However,
water overflowed from the inflow part when water supply volume was 18 L/min. or
more due to low flow velocity and small flow rate of 20A diameter. On the other hand,
25A with its larger flow rate successfully coped with large water supply of 12~30 L/min.
From these results it can safely be concluded that careful selection of inflow part
diameter (20A or 25A) is essential to match water supply volume and outflow head in
its application to the siphonic drainage system.
Water supply
volume
[L/min]
Diameter 20A Diameter 25A
Outflow heads [mm]
500 1,000 1,500 2,000 500 1,000 1,500 2,000
4 Separate flow Separate flow Separate flow Separate flow
6Intermittent
flow
Intermittent
flow
Intermittent
flow
Intermittent
flow
8Intermittent
flow
Intermittent
flow
Intermittent
flow
Intermittent
flow
10 Bubble flowIntermittent
flow
Intermittent
flow
Intermittent
flowSeparate flow Separate flow Separate flow Separate flow
12 Fill flow Bubble flow Bubble flow Bubble flowIntermittent
flow
Intermittent
flow
Intermittent
flow
Intermittent
flow
18 No discharge Fill flow Fill flow Bubble flow Bubble flowIntermittent
flow
Intermittent
flow
Intermittent
flow
24 No discharge No discharge No discharge Fill flow Bubble flow Bubble flowIntermittent
flow
Intermittent
flow
30 Fill flow Fill flow Bubble flow Bubble flow
36 No discharge Fill flow Fill flow Fill flow
Table - 4 Flow phase in diameter 20A pipe and 25A pipe
Figure - 10 Comparison of maximum water level with 20A and 25A in riser piping
a) Inflow part diameter 20A riser piping
2,5001,50050000
250
750
1,000
500
Outflow head [mm]
Max
imu
mw
ater
lev
el[m
m]
b) Inflow part diameter 25A riser piping
2,0001,5001,00050000
250
750
1,000
500
Outflow head [mm]
Max
imu
mw
ater
lev
el[m
m]
Water supply volume:12[L/min]:8[L/min]:4[L/min]
:30[L/min]:18[L/min] :24[L/min] :36 [L/min]
:10[L/min]
CIBW062 Symposium 2013
11
4 Conclusion
The results of the experiments can be summed up as follows:
<Chapter 2>
(1) No significant effects attributable to difference in inflow parts (100A or 150A)
on pneumatic pressure in pipe and flow velocity were seen.
(2) There was a difference in water level rise in pipe of approximately 50 mm between
the basic piping and the riser piping.
(3) Inflow part diameter 150A showed smaller water level rises than 100A except in
conditions with low water supply volumes.
<Chapter 3>
(1) The use of 25A diameter enabled discharge of larger volume of water than 20A
diameter.
(2) Smaller water level rises in the inflow part were observed with 25A diameter than
with 20A diameter.
The present study has raised the following issues to be addressed in the future: to clarify
the effects of various discharge styles, pipe materials and piping forms on flow
characteristics and to expand the scope of design materials for the siphonic drainage
system.
Air was let out at the outflow
section, and discharge proceeded
gradually. No siphonic effects
Air and water blended and a strong
siphonic effect occurred. After that
weak siphonic effects continued.
1) Separate flow
3)Bubble flow
4)Fill flow
2)Intermittent flow
No bubbles were seen in the pipe.
A strong current was produced
with continuous siphonic effects.
Most water in the pipe was
discharged, and separate flow was
produced.
Siphonic effects were produced.
Slag flow occurred in the pipe.
Separate flow occurred in the pipe.
Water filled gradually.
Air
opening
Figure - 11 Flow phase diagram
CIBW062 Symposium 2013
12
Particularly of interest are verification of flow characteristics in 50 m and 100 m long
piping layouts made up of U-PVC pipes and that of flow characteristics in long piping
made up of 20A diameter stainless steel pipes. Also it is necessary to consider
appropriate pipe cleaning methods to counteract pipe clogging that is likely to occur in
pipes with small diameters.
5 Reference
1. Sakaue,K.,Mitsunaga,T.,Tsukagoshi,N.,Kojima,K(2008),Experimental Studies on FlowCharacteristics of Siphon Drainage System, Proceedings of InternationalSymposium,CIBW062,(F4)
2. Tanaka,Y., Sakaue,K.,Mitsunaga,T.,Iizuka,H(2010),Experimental Studies on Flow and PressureCharacteristics of Siphon Drainage System for Waste Water, Proceedings of InternationalSymposium,CIBW062,(E1)
3. Inada,T.,Sakaue,K.,Nakamura,T.,Mitsunaga,T.,Tanaka,Y.,Yoshihama,S.(2011),A Study on Characteristics of Filled Flow in Siphonic Drainage Systems(Part. 8),Technicalpapers of Annual meeting, SHASE,(pp.827-830).
6 Presentation of Authors
Takehiko Mitunaga is an engineer at Yamashita Sekkei Inc.He belongs to Mechanical Systems Design Development.He finished the master's course in Architecture at Meiji Universityin Japan.
Kyosuke Sakaue (Dr. Eng.) is a professorat Department of Architecture, School of Science & Technology,and head of New Plumbing System Institute, Meiji University.His fields of specialization include water environment,building services and plumbing system.
Tomoo Inada (M. Eng.) works for SUGA Co, Ltd,.He specializes in plumbing and sanitation.
Sorahiro Yoshihama(M. Eng.) works for HASEKO Corporation.He specializes in plumbing and air-conditioning system.