Embed Size (px)
Citation preview
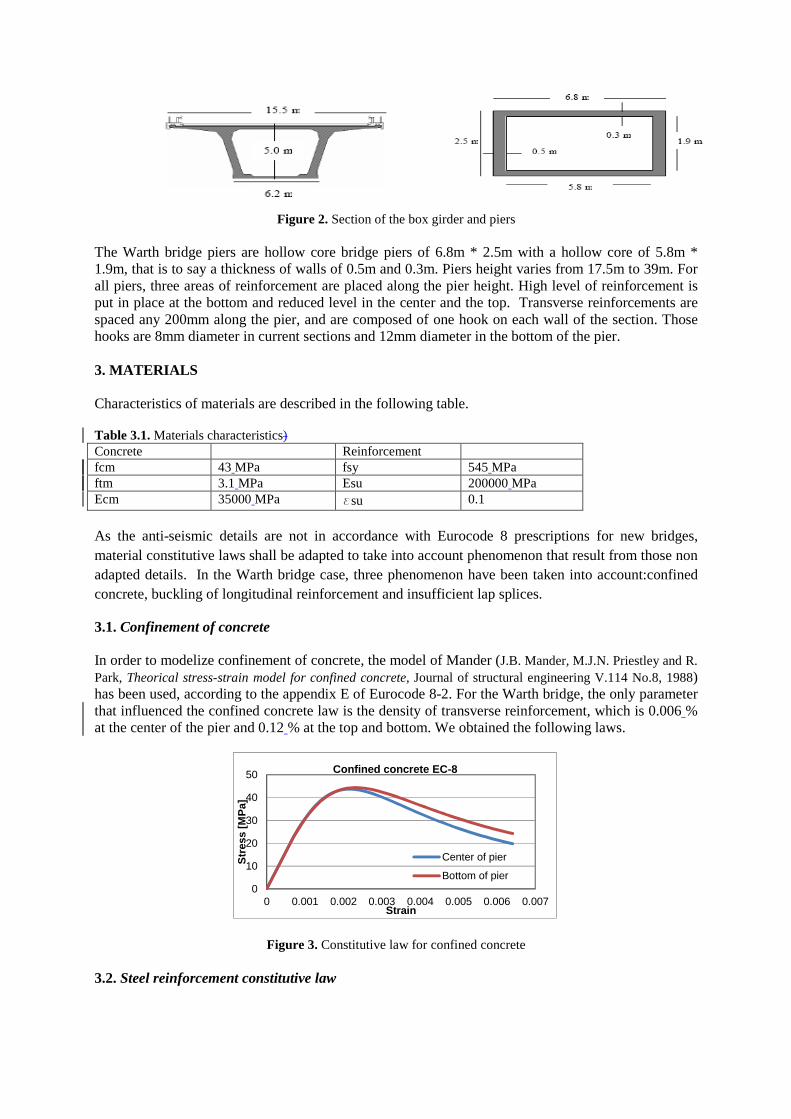
Figure 2. Section of the box girder and piers The Warth bridge piers are hollow core bridge piers of 6.8m * 2.5m with a hollow core of 5.8m * 1.9m, that is to say a thickness of walls of 0.5m and 0.3m. Piers height varies from 17.5m to 39m. For all piers, three areas of reinforcement are placed along the pier height. High level of reinforcement is put in place at the bottom and reduced level in the center and the top. Transverse reinforcements are spaced any 200mm along the pier, and are composed of one hook on each wall of the section. Those hooks are 8mm diameter in current sections and 12mm diameter in the bottom of the pier. 3. MATERIALS Characteristics of materials are described in the following table.
Table 3.1. Materials characteristics) Concrete Reinforcement fcm 43 MPa fsy 545 MPa ftm 3.1 MPa Esu 200000 MPa Ecm 35000 MPa εsu 0.1
As the anti-seismic details are not in accordance with Eurocode 8 prescriptions for new bridges, material constitutive laws shall be adapted to take into account phenomenon that result from those non adapted details. In the Warth bridge case, three phenomenon have been taken into account:confined concrete, buckling of longitudinal reinforcement and insufficient lap splices.
3.1. Confinement of concrete In order to modelize confinement of concrete, the model of Mander (J.B. Mander, M.J.N. Priestley and R. Park, Theorical stress-strain model for confined concrete, Journal of structural engineering V.114 No.8, 1988) has been used, according to the appendix E of Eurocode 8-2. For the Warth bridge, the only parameter that influenced the confined concrete law is the density of transverse reinforcement, which is 0.006 % at the center of the pier and 0.12 % at the top and bottom. We obtained the following laws.
Figure 3. Constitutive law for confined concrete 3.2. Steel reinforcement constitutive law
0
10
20
30
40
50
0 0.001 0.002 0.003 0.004 0.005 0.006 0.007
Str
ess
[MP
a]
Strain
Confined concrete EC-8
Center of pier
Bottom of pier

For an existing bridge, as the Warth bridge, the constitutive law of reinforcement shall take into account the lack of transverse reinforcement, which can lead to a premature buckling of longitudinal reinforcement. This phenomenon can be taken into account by the “Gomes and Appleton” model (Augusto Gomes & Julio Appleton, Nonlinear cyclic stress-strain relationship of reinforcing bars including buckling, Engineering structure) for buckling between two transversal reinforcements. The reduction of capacity of the longitudinal reinforcement can be estimated considering the articulation of the longitudinal reinforcement between two transversal reinforcements:
�� � �√�����
�� �
(3.1)
As : area of the longitudinal reinforcement bar, Mp: Plastic moment of the bar :, Mp=0.424πR3fy, s : spacing of transversal reinforcement, εs: strain of the bar, fy : yield strength of the longitudinal reinforcements, R : radius of longitudinal reinforcement
Figure 4. Buckling principle between two layers of reinforcement (Gomes and Appleton)
For buckling under several transversal reinforcement layers, the Gomes and Appleton model have been adapted in the Setra guideline “Diagnostic et renforcement sismiques des ponts existants”, as following:
�� � 1.5 ��� ��� �������� ��� ������
�√�����
�� �
(3.2)
With
�������é !��"#$ � ∑�&
�.'(�(��
(3.3)
ΣAL: sections of longitudinal rebars maintained by hooks (mm²),fyt yield strength of the ties,fys : yield strength of the longitudinal rebars, At : section of one tie, st : distance between ties.
For the Warth bridge, this leads to the following constitutive law (20mm diameter longitudinal rebars)
Figure 5. Constitutive law for steel reinforcement, 20mm diameter in compression
As the previous curves for constitutive laws are very unfavorable, we considered that ultimate capacity of reinforcement in compression is reached when 20 % of capacity has been lost.
For tension in steel reinforcement, the following law is considered. In this case, oligocyclic fatigue is
0
200
400
600
800
1000
0 0.02 0.04 0.06 0.08 0.1 0.12
Str
ess
[MP
a]
Strain
Buckling of reinforcement HA 20
Steel law from Eurocode 2Buckling between several layersCorrected law
0
100
200
300
400
500
600
0 0.02 0.04 0.06 0.08 0.1 0.12
Str
ess
[M
Pa]
Strain
Reinforcement constitutive law
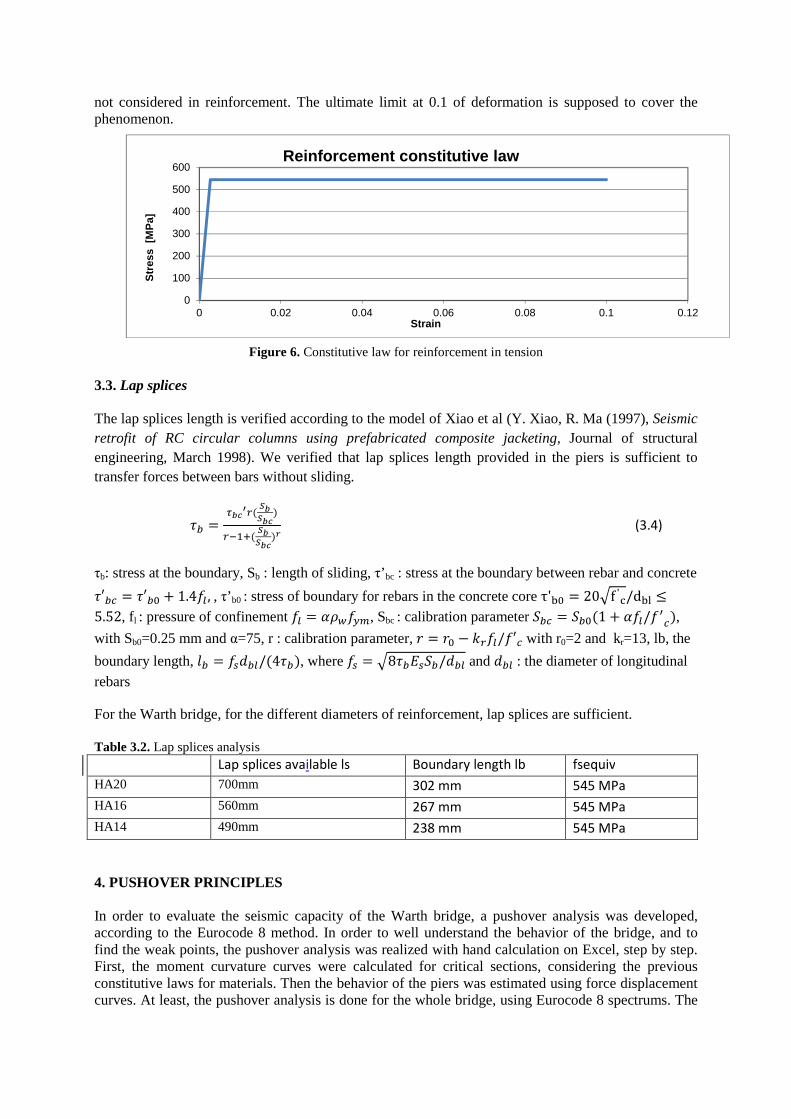
not considered in reinforcement. The ultimate limit at 0.1 of deformation is supposed to cover the phenomenon.
Figure 6. Constitutive law for reinforcement in tension
3.3. Lap splices The lap splices length is verified according to the model of Xiao et al (Y. Xiao, R. Ma (1997), Seismic retrofit of RC circular columns using prefabricated composite jacketing, Journal of structural engineering, March 1998). We verified that lap splices length provided in the piers is sufficient to transfer forces between bars without sliding.
)* �+,�-#�
�,�,�
�
#.�/� �,�,���
(3.4)
τb: stress at the boundary, Sb : length of sliding, τ’ bc : stress at the boundary between rebar and concrete
)′* � )′*1 + 1.445 ,, τ’ b0 : stress of boundary for rebars in the concrete core τ'91 � 20�f '=/d9@ ≤5.52, fl : pressure of confinement 45 � BCD4$E, Sbc : calibration parameter F* � F*1�1 + B45/4G
�, with Sb0=0.25 mm and α=75, r : calibration parameter, H � H1 − J#45/4′ with r0=2 and kr=13, lb, the
boundary length, K* � 4�L*5/�4)*�, where 4� � �8)*N�F*/L*5 and L*5 : the diameter of longitudinal
rebars
For the Warth bridge, for the different diameters of reinforcement, lap splices are sufficient. Table 3.2. Lap splices analysis Lap splices available ls Boundary length lb fsequiv
HA20 700mm 302 mm 545 MPa
HA16 560mm 267 mm 545 MPa
HA14 490mm 238 mm 545 MPa
4. PUSHOVER PRINCIPLES In order to evaluate the seismic capacity of the Warth bridge, a pushover analysis was developed, according to the Eurocode 8 method. In order to well understand the behavior of the bridge, and to find the weak points, the pushover analysis was realized with hand calculation on Excel, step by step. First, the moment curvature curves were calculated for critical sections, considering the previous constitutive laws for materials. Then the behavior of the piers was estimated using force displacement curves. At least, the pushover analysis is done for the whole bridge, using Eurocode 8 spectrums. The

general principles of the analysis are summarized in the following figure. Moreover, in this study, we supposed that the bottoms of the piers control the behavior. It is not really the case, because there is a brutal stop of the longitudinal bars between bottom sections and central sections, which creates the weak sections.
Figure 7. Pushover analysis developed with hand calculation
Concrete law Steel law Section geometry Spectrum A-T
Moment-Curvature curves
M-φ
Idealization of the M-φ curvse
Moment-Rotation curves
M-θ
Force-displacement curves
F-D
F-D curves corrected
(shear, bearings, P-Δ)
Spectrum A-D
Mass
M
Acceleration- Displacement
curves (A-D)
Research of the an acceleration in
spectrum to reach the damage level
considered
For a P point of the A-D curve,
calculation of Keq, Teq, ξeq, ηeff
Correction of the A-D spectrum
Damage curves

5. RESULTS 5.1. Moment-curvature curves The moment curvature curves were determined using the previous constitutive laws corrected to take into account no-conform detailing. For A40 and A70 piers, we obtained the following results:
Figure 8. Moment curvature curves for A40 and A70 piers in longitudinal and transversal direction
As it can be observed, moment curvature curves are very unfavorable, because of the buckling consideration for steel, and because, for simplification in calculation, compressive law for steel has been considered for compression and tension in reinforcement. Nevertheless, as the curve is considered to be stopped when 20% of the capacity is lost, this phenomenon is weakened for the rest of the calculation. 5.2. Force displacement curves The Eurocode 8 relations were used to calculate the force displacement curves from the moment curvature ones, using the following parameters: Elastic displacementL$ � O$P�/3 (5.1) Ultimate displacement LR � LS + LT,R � OSP2/3 + �OR − OS�UT�P − 0.5UT�V�BW� (5.2)
Elastic strength X$ � Y$/P (5.3) Ultimate strength XZ � YZ/P (5.4) Moreover force-displacement curves have to be corrected to take into account shear, elastomeric bearings and P-Delta effects. Shear is taken into account using Eurocode 8 formulas.Then, bearings are taken into account in force-displacement curves of the piers, considering the increase of
0
10000
20000
30000
40000
50000
60000
70000
0 0.02 0.04 0.06 0.08
Mo
me
nt[
KN
.m]
Curvature[/m]
Moment curvature curve A40/A70
Longitudinal direction
A40, idealized curve
A40, real curve
A70, idealised curve
A70 pier, real curve
0
50000
100000
150000
200000
0 0.001 0.002 0.003 0.004
Mo
me
nt[
KN
.m]
Curvature[/m]
Moment curvature curve A40/A70
Transversal direction
A40, realized curve
A40, idealized curve
A70, real curve
A70, idealized curve

displacement they provide. Last, P-delta effect are taken into account using the 1st order theory :
X [##! \!] � X − ^∆` ( 5.5)
Figure 9. P-Delta theory
As a consequence, we obtained :
Figure 10. Force-displacement curves for A40 and A70 piers in longitudinal and transversal directions
For A40 piers, maximum displacements are very high, in particular in longitudinal direction. This is due to the fact, that for the present calculation, rotations have not been limited. Moreover, we can observe that in transversal direction, a large part of the displacement is given by the elastomeric bearings, whereas in longitudinal direction, as A40 pier is very flexible in longitudinal direction, the maximum displacement is provided by the pier. For A70 pier, conclusions are the same.
0
200
400
600
800
1000
1200
1400
1600
1800
0 1 2 3 4
Fo
rce
[KN
]
Displacement[m]
Force displacement curve A40
Longitudinal direction
Without shear
With shear
P-Delta
Corrected curve
0
1000
2000
3000
4000
5000
0 0.2 0.4 0.6 0.8 1 1.2
Fo
rce
[KN
]
Displacement[m]
Force displacement curve A40
Transversal direction
Without shear
With shear
P-Delta
Corrected curve
0
500
1000
1500
2000
2500
0 0.5 1 1.5 2 2.5
Fo
rce
[KN
]
Displacement[m]
Force displacement curve A70
Longitudinal direction
Without shear
With shear
P-Delta
Corrected curve0
1000
2000
3000
4000
5000
6000
7000
0 0.2 0.4 0.6 0.8
Fo
rce
[KN
]
Displacement[m]
Force displacement curve A70
Transversal direction
Without shear
With shear
P-Delta
Corrected curve
0
0.2
0.4
0.6
0.8
1
0 5 10 15 20 25
Da
ma
ge
D/D
u
Acceleration an(m/s2)
Damage curves Pile A20
Pile A30
Pile A40
Pile A50
Pile A60
Pile A70
Ouvrage
complet
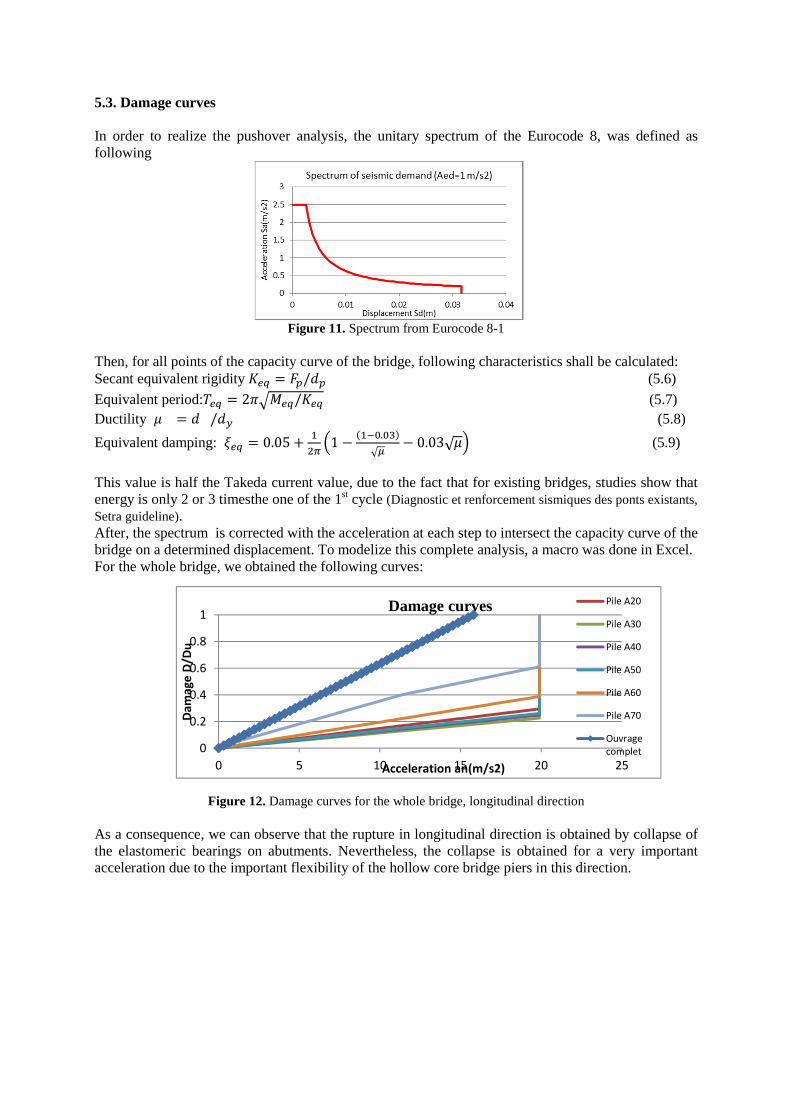
5.3. Damage curves In order to realize the pushover analysis, the unitary spectrum of the Eurocode 8, was defined as following
Figure 11. Spectrum from Eurocode 8-1
Then, for all points of the capacity curve of the bridge, following characteristics shall be calculated: Secant equivalent rigidity a!b � Xc/Lc (5.6)
Equivalent period:d!b � 2e�Y!b/a!b (5.7) Ductility f � L /L$ (5.8)
Equivalent damping: g!b � 0.05 + ��h i1 − ��.1.1j�
√k− 0.03√fl (5.9)
This value is half the Takeda current value, due to the fact that for existing bridges, studies show that energy is only 2 or 3 timesthe one of the 1st cycle (Diagnostic et renforcement sismiques des ponts existants, Setra guideline). After, the spectrum is corrected with the acceleration at each step to intersect the capacity curve of the bridge on a determined displacement. To modelize this complete analysis, a macro was done in Excel. For the whole bridge, we obtained the following curves:
Figure 12. Damage curves for the whole bridge, longitudinal direction As a consequence, we can observe that the rupture in longitudinal direction is obtained by collapse of the elastomeric bearings on abutments. Nevertheless, the collapse is obtained for a very important acceleration due to the important flexibility of the hollow core bridge piers in this direction.

0
0.2
0.4
0.6
0.8
1
0 5 10 15 20 25
Da
ma
ge
(d/D
u)
Acceleration(m/s2)
Damage curvesPile A20
Pile A30
Pile A40
Pile A50
Pile A60
Pile A70
Figure 13. Damage curves for the whole bridge, transverse direction
In this case, the collapse is obtained for an acceleration of 6m/s² in the shortest pier, the A70 one.
6. COMPARISON WITH SOFISTIK SOFTWARE RESULTS Results are obtained using second order theory calculation in Sofistik, using constitutive laws defined previously. For the A40 pier, we obtained the following results:
Figure 14. Comparison of Force Displacement curves from Sofistik analysis and hand calculation
We can observe several differences: The difference of the initial stiffness is due to idealization of the moment-curvature curve done in hand calculation. In the case of the Warth bridge, we can note that this idealization is very important, this is because piers is cracking a lot thanks to their thin walls. The ultimate displacement is very low in Sofistik calculation, this is due to an internal limitation on stresses on materials (0.6 on concrete and 0.75 on steel) At least, the modelisation as a beam is not realistic because of the thickness of the wall, a modelisation with shell elements would have been better (e<<b/8, Eurocode criterion for hollow core bridge piers). 7. CONCLUSION We can conclude that the Warth bridge, regards to the hypothesis done on plastic hinge sections and elastomeric bearings free on abutments, has a great capacity under seismic solicitations (6m/s² in the critical transversal direction). Moreover this study permitted to develop pushover analysis tools and to better understand the real influence of parameters. In fact, this study put in light the important influence of idealization of the moment-curvature curves for high dimensions sections, as the hollow core bridge piers of the Warth

bridge. Moreover, for such structure, cracking is a very important parameter and the way to take it into account better shall be investigated, in order to affine the parameters for idealization. At least the method to take into account buckling shall be also affined, in order not to be so unfavorable. To conclude, the case of the Warth bridge was very interesting because with their specified piers shape, it permitted to put in light the limit of present pushover method with simplified modelisation, as described in Eurocode 8 and in literature. REFERENCES J.B. Mander, M.J.N. Priestley and R. Park, Theorical stress-strain model for confined concrete, Journal of
structural engineering V.114 No.8, 1988 Augusto Gomes & Julio Appleton, Nonlinear cyclic stress-strain relationship of reinforcing bars including
buckling, Engineering structure, 1997, vol 19 Xiao et al (Y. Xiao, R. Ma (1997), Seismic retrofit of RC circular columns using prefabricated composite
jacketing, Journal of structural engineering, March 1998 Diagnostic et renforcement sismiques des ponts existants, Setra guideline. Eurocode 8 : Design of structures for earthquake resistance