Embed Size (px)
Citation preview
Pushover analysis with ZSOIL
Stéphane Commend
GeoMod Ing. SA, Lausanne

Pushover analysis with ZSOIL
Stéphane Commend, GeoMod SA
08.2014, Lausanne (Switzerland)
Why pushover?
Brief recall of pushover theory
Application: 2-storey RC frame
Nonlinear time history analysis (reference solution)
Nonlinear pushover analysis
Taking soil into account
Example: D0211 building
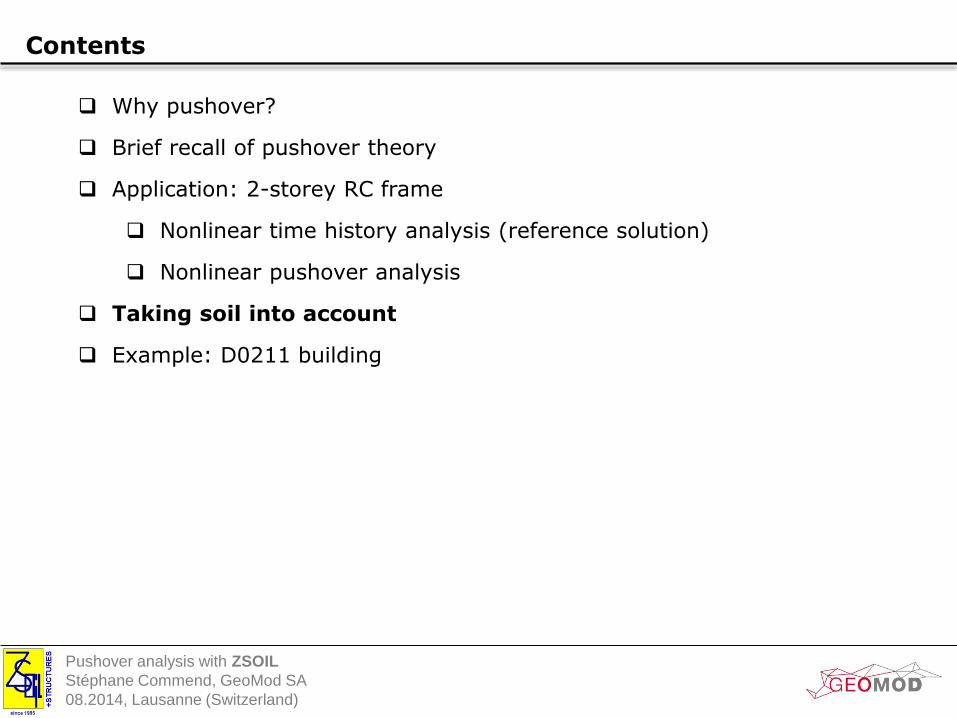
Contents
Pushover analysis with ZSOIL
Stéphane Commend, GeoMod SA
08.2014, Lausanne (Switzerland)
Why pushover?
Brief recall of pushover theory
Application: 2-storey RC frame
Nonlinear time history analysis (reference solution)
Nonlinear pushover analysis
Taking soil into account
Example: D0211 building
Contents

Pushover analysis with ZSOIL
Stéphane Commend, GeoMod SA
08.2014, Lausanne (Switzerland)
Motivation: why pushover?
Seismic analysis To design (new structures) or assess (existing structures): - Linear simplified static analysis (replacement forces) - Linear modal analysis - Nonlinear pushover analysis - Nonlinear time-history analysis -Nonlinear pushover analysis represents a good compromise between
- replacement forces, where nonlinearity is taken into account by a single behavior coefficient q (too simple) - nonlinear time-history, very time consuming

Pushover analysis with ZSOIL
Stéphane Commend, GeoMod SA
08.2014, Lausanne (Switzerland)
Motivation: why pushover?
Nonlinear pushover analysis - Until now, applies mainly to buildings and bridges (structural only) Future: include soil (=> tunnels, retaining walls, ... ?)
- Consists in applying a lateral load distribution, increase it (see theory recall)
- Returns a target displacement = maximal displacement during a certain earthquake, used in displacement-based seismic assessment (in Switzerland, since 2004, documented in CT SIA 2018) aeff = wRd /wd (SIA CT 2018)
aeff compliance factor
wRd allowable displacement (capacity of deformation) wd deformation during earthquake
aeff < amin intervention necessary
amin ≤ aeff ≤ aadm intervention if proportionate
aadm ≤ aeff no intervention
amin, aadm= f(structure type, lifetime)
Pushover analysis with ZSOIL
Stéphane Commend, GeoMod SA
08.2014, Lausanne (Switzerland)
Why pushover?
Brief recall of pushover theory
Application: 2-storey RC frame
Nonlinear time history analysis (reference solution)
Nonlinear pushover analysis
Taking soil into account
Example: D0211 building
Contents
Pushover analysis with ZSOIL
Stéphane Commend, GeoMod SA
08.2014, Lausanne (Switzerland)
Theory
Nonlinear pushover analysis in ZSOIL -Based on N2 method developed by Fajfar et al.
- 2D or 3D are possible (2D only if building is « regular »)
- Load pattern is applied in one direction at a time, meaning several calculations have to be conducted to fully assess the structure:
- in x and z direction, in plus and minus directions - with different load patterns (uniform, linear or modal)
Pushover analysis with ZSOIL
Stéphane Commend, GeoMod SA
08.2014, Lausanne (Switzerland)
Theory
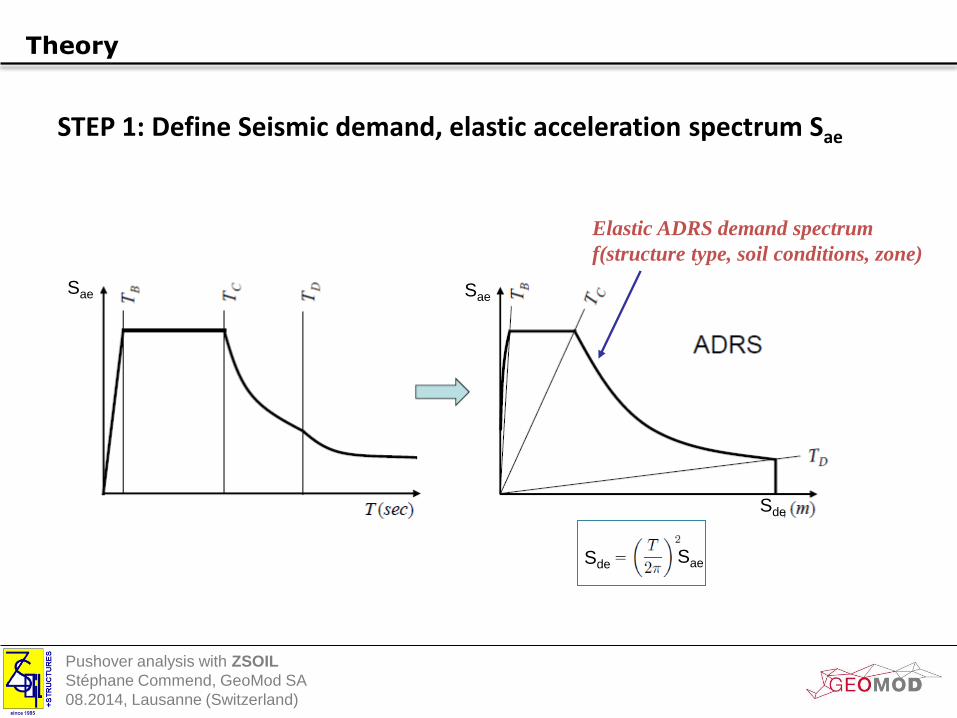
STEP 1: Define Seismic demand, elastic acceleration spectrum Sae
Elastic ADRS demand spectrum
f(structure type, soil conditions, zone)
Sae Sae
Sde
Sde Sae
Pushover analysis with ZSOIL
Stéphane Commend, GeoMod SA
08.2014, Lausanne (Switzerland)
Theory
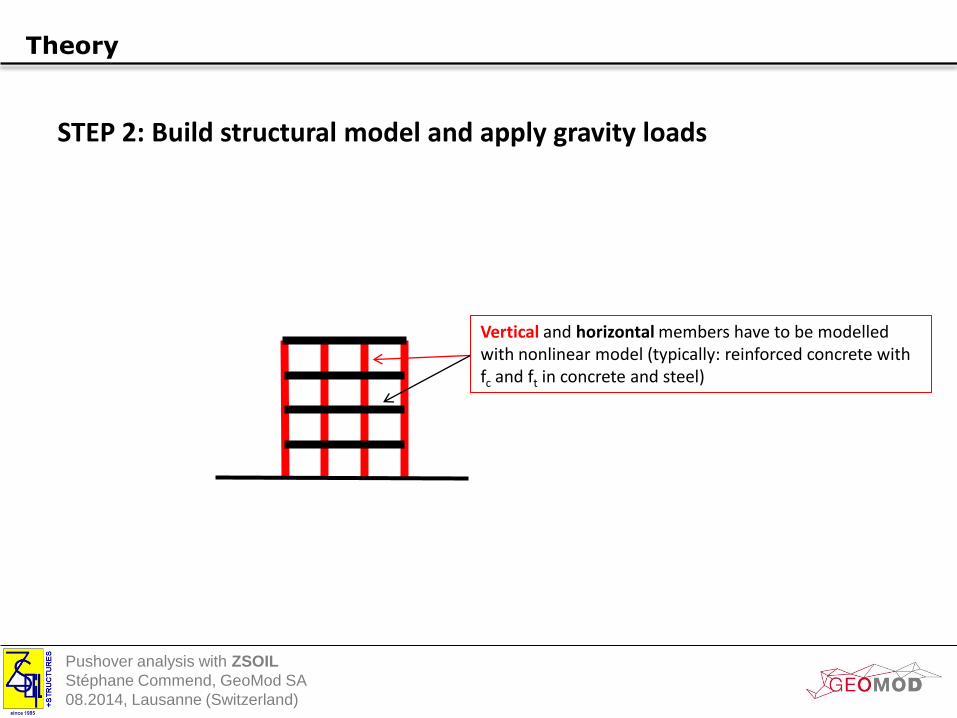
STEP 2: Build structural model and apply gravity loads
Vertical and horizontal members have to be modelled with nonlinear model (typically: reinforced concrete with fc and ft in concrete and steel)
Pushover analysis with ZSOIL
Stéphane Commend, GeoMod SA
08.2014, Lausanne (Switzerland)
Theory
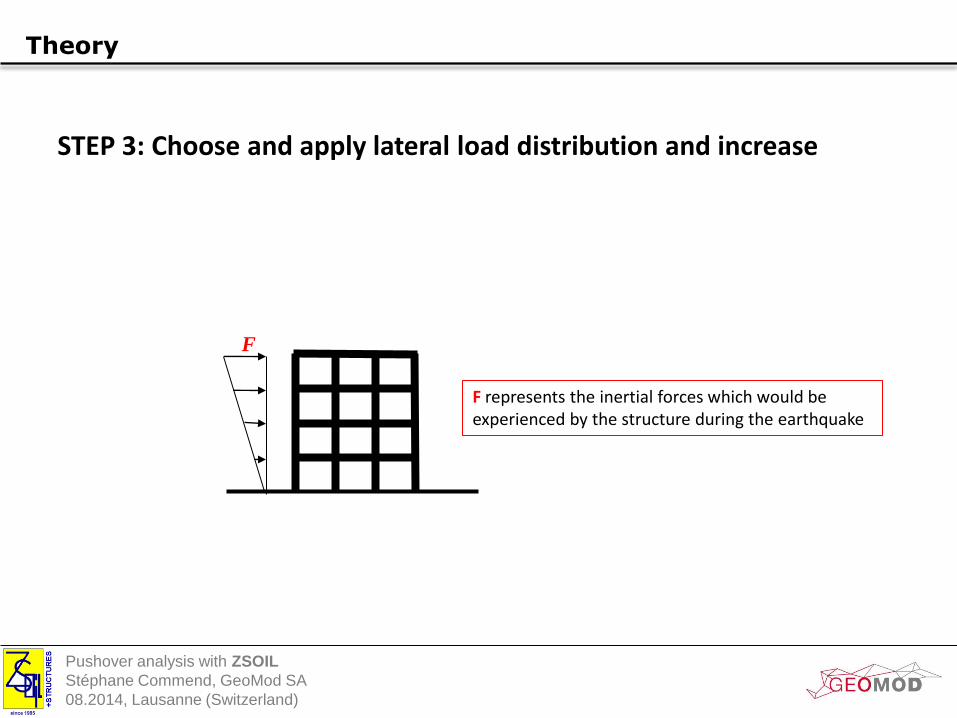
STEP 3: Choose and apply lateral load distribution and increase
F
F represents the inertial forces which would be experienced by the structure during the earthquake
Pushover analysis with ZSOIL
Stéphane Commend, GeoMod SA
08.2014, Lausanne (Switzerland)
Theory
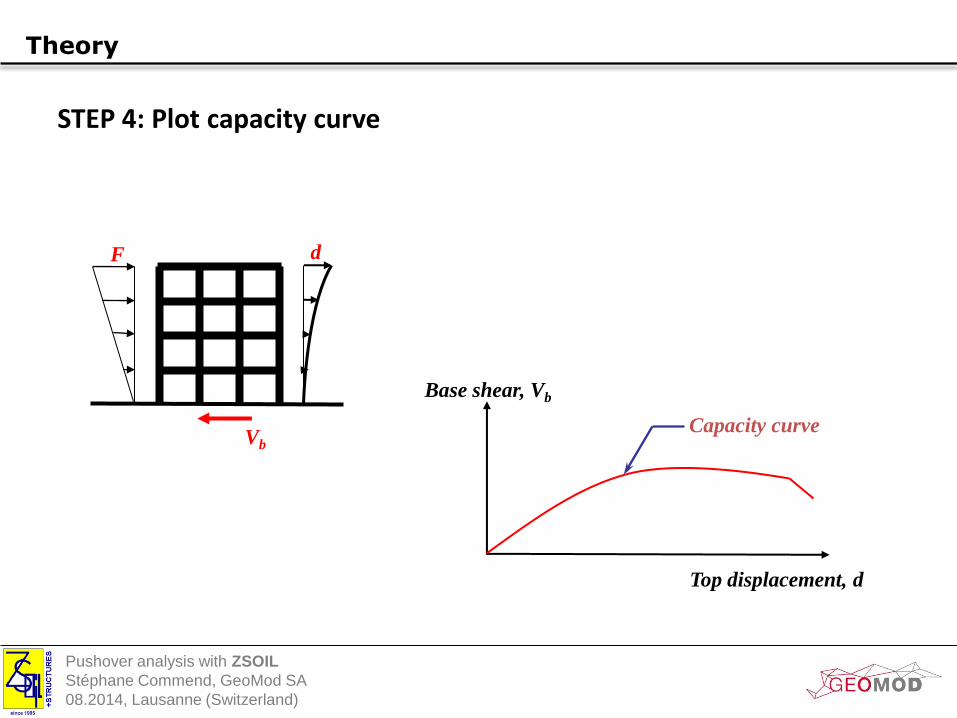
STEP 4: Plot capacity curve
d F
Vb
Base shear, Vb
Top displacement, d
Capacity curve
Pushover analysis with ZSOIL
Stéphane Commend, GeoMod SA
08.2014, Lausanne (Switzerland)
Theory
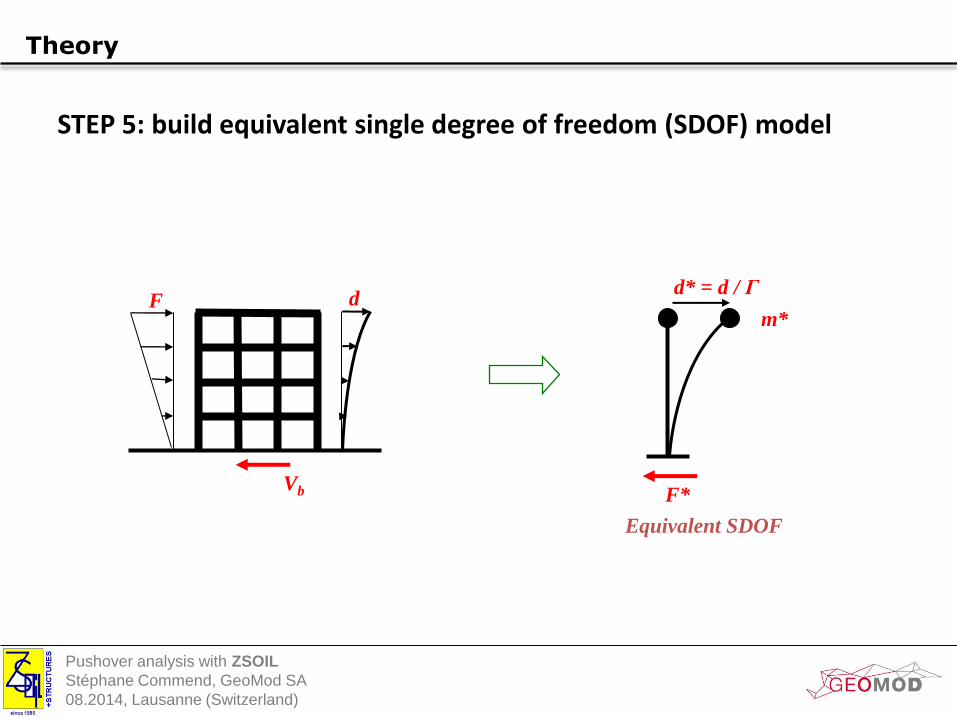
STEP 5: build equivalent single degree of freedom (SDOF) model
d F
Vb
m*
d* = d / Γ
F*
Equivalent SDOF
Pushover analysis with ZSOIL
Stéphane Commend, GeoMod SA
08.2014, Lausanne (Switzerland)
Theory
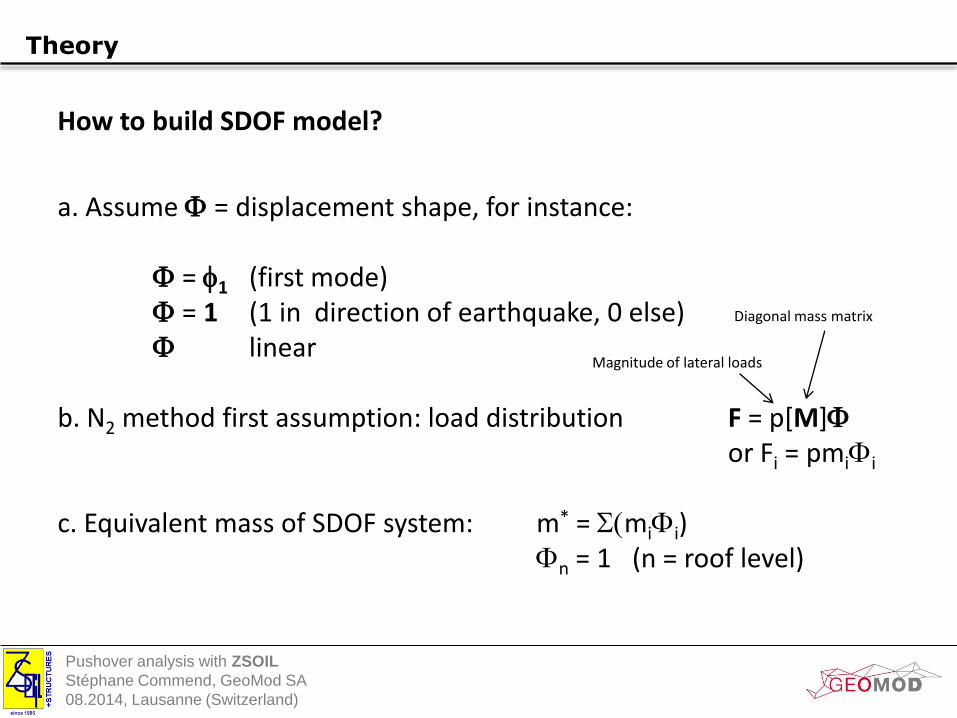
How to build SDOF model?
a. Assume F = displacement shape, for instance: F = f1 (first mode) F = 1 (1 in direction of earthquake, 0 else) F linear b. N2 method first assumption: load distribution F = p[M]F or Fi = pmiFi
c. Equivalent mass of SDOF system: m* = S(miFi) Fn = 1 (n = roof level)
Magnitude of lateral loads
Diagonal mass matrix
Pushover analysis with ZSOIL
Stéphane Commend, GeoMod SA
08.2014, Lausanne (Switzerland)
Theory
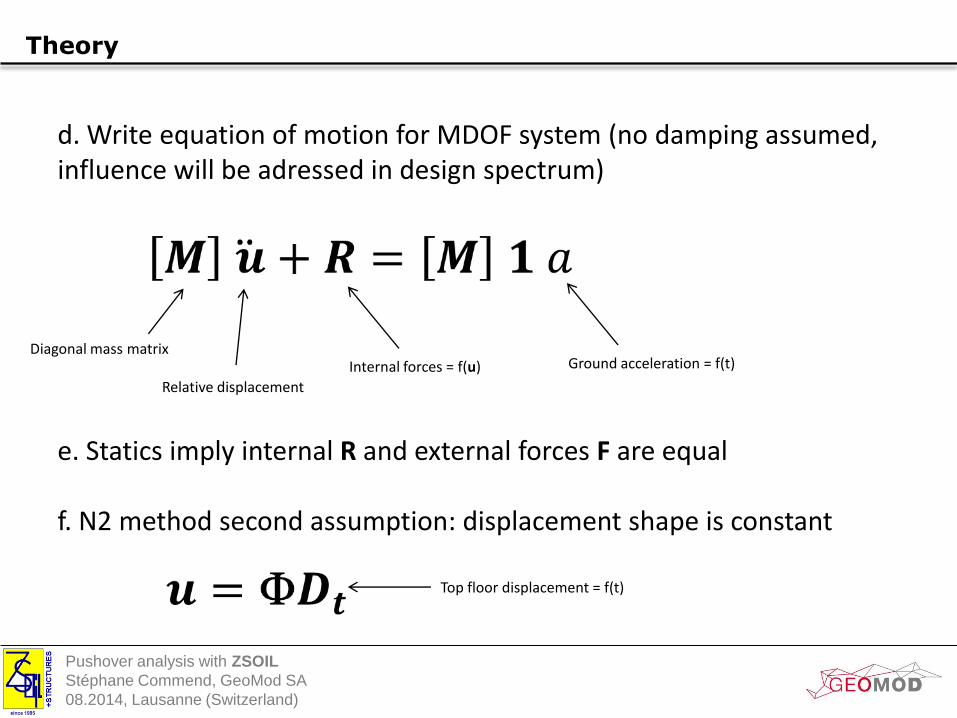
d. Write equation of motion for MDOF system (no damping assumed, influence will be adressed in design spectrum) e. Statics imply internal R and external forces F are equal f. N2 method second assumption: displacement shape is constant
Diagonal mass matrix
Relative displacement
Internal forces = f(u) Ground acceleration = f(t)
Top floor displacement = f(t)
Pushover analysis with ZSOIL
Stéphane Commend, GeoMod SA
08.2014, Lausanne (Switzerland)
Theory
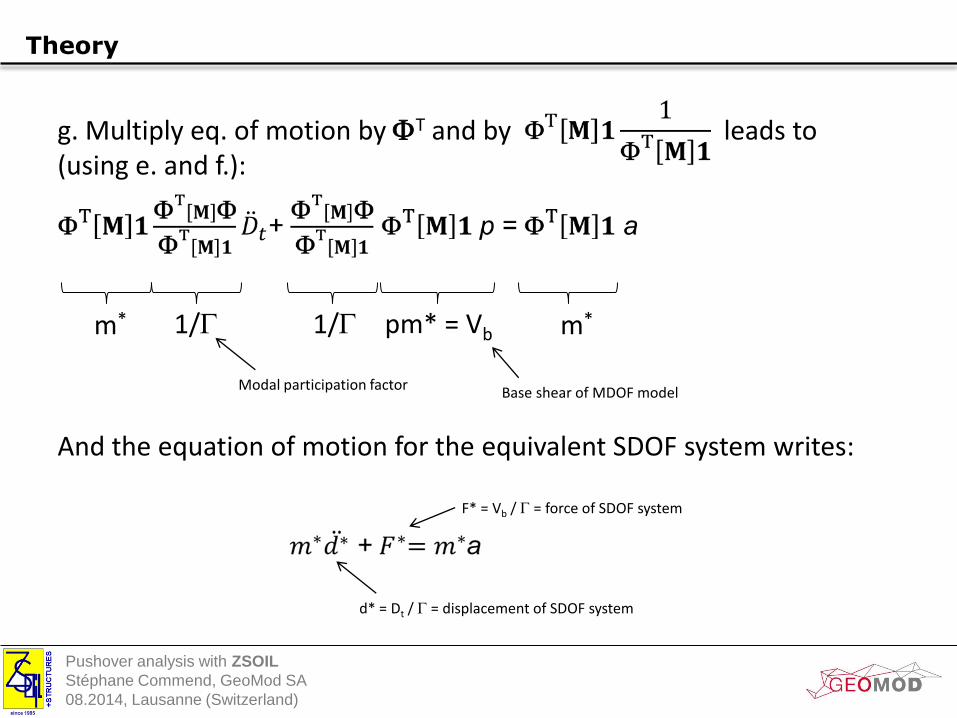
g. Multiply eq. of motion by FT and by leads to (using e. and f.): And the equation of motion for the equivalent SDOF system writes:
m* m* 1/G 1/G pm* = Vb
Modal participation factor Base shear of MDOF model
d* = Dt / G = displacement of SDOF system
F* = Vb / G = force of SDOF system
Pushover analysis with ZSOIL
Stéphane Commend, GeoMod SA
08.2014, Lausanne (Switzerland)
Theory
Base shear, Vb
Top displacement, d
Capacity curve
F*
d*
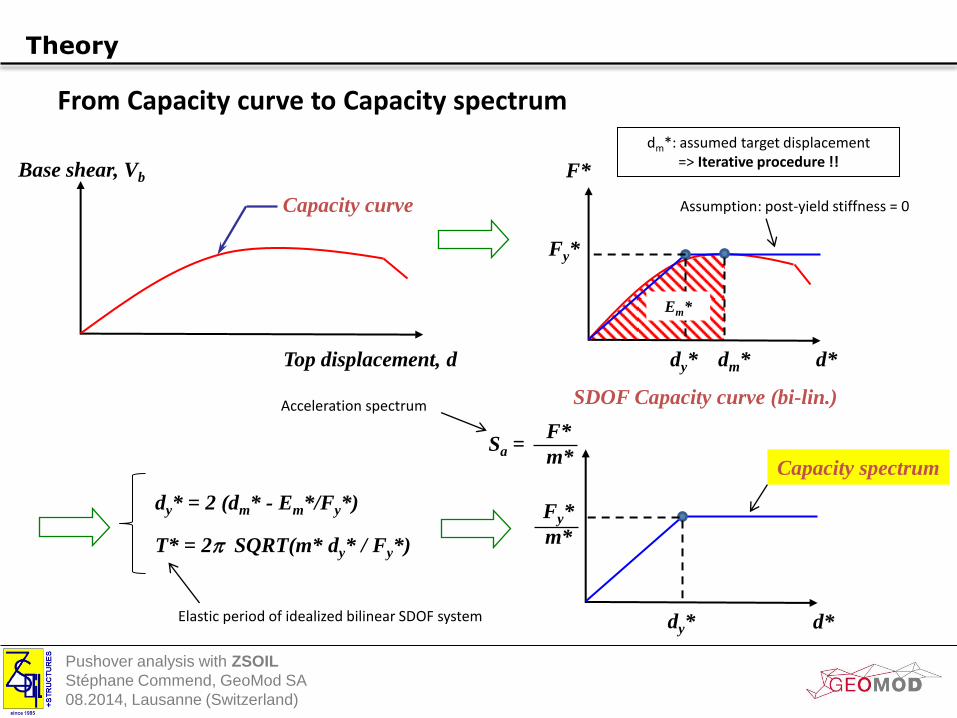
SDOF Capacity curve (bi-lin.)
F*
m*
d*
Capacity spectrum
dm* dy*
dy*
Sa =
dy* = 2 (dm* - Em*/Fy*)
T* = 2p SQRT(m* dy* / Fy*)
dm*: assumed target displacement => Iterative procedure !!
Fy*
Fy*
m*
From Capacity curve to Capacity spectrum
Em*
Acceleration spectrum
Elastic period of idealized bilinear SDOF system
Assumption: post-yield stiffness = 0
Pushover analysis with ZSOIL
Stéphane Commend, GeoMod SA
08.2014, Lausanne (Switzerland)
Theory
d*
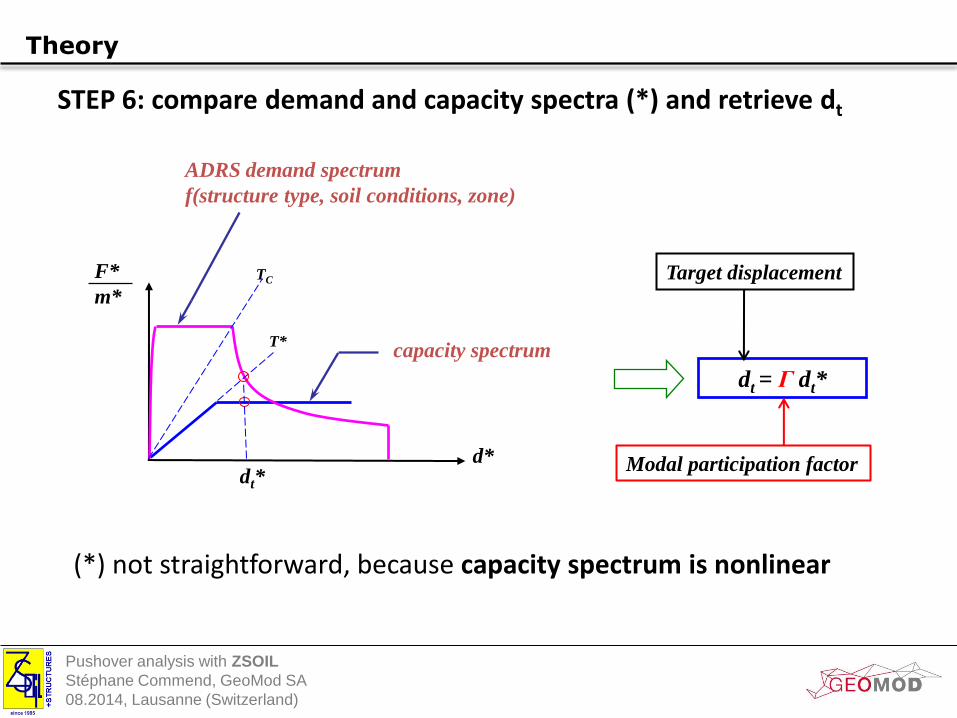
ADRS demand spectrum
f(structure type, soil conditions, zone)
capacity spectrum
F*
m*
TC
T*
dt*
dt = Γ dt*
Target displacement
Modal participation factor
STEP 6: compare demand and capacity spectra (*) and retrieve dt
(*) not straightforward, because capacity spectrum is nonlinear

Pushover analysis with ZSOIL
Stéphane Commend, GeoMod SA
08.2014, Lausanne (Switzerland)
Why pushover?
Brief recall of pushover theory
Application: 2-storey RC frame
Nonlinear time history analysis (reference solution)
Nonlinear pushover analysis
Taking soil into account
Example: D0211 building
Contents
Pushover analysis with ZSOIL
Stéphane Commend, GeoMod SA
08.2014, Lausanne (Switzerland)
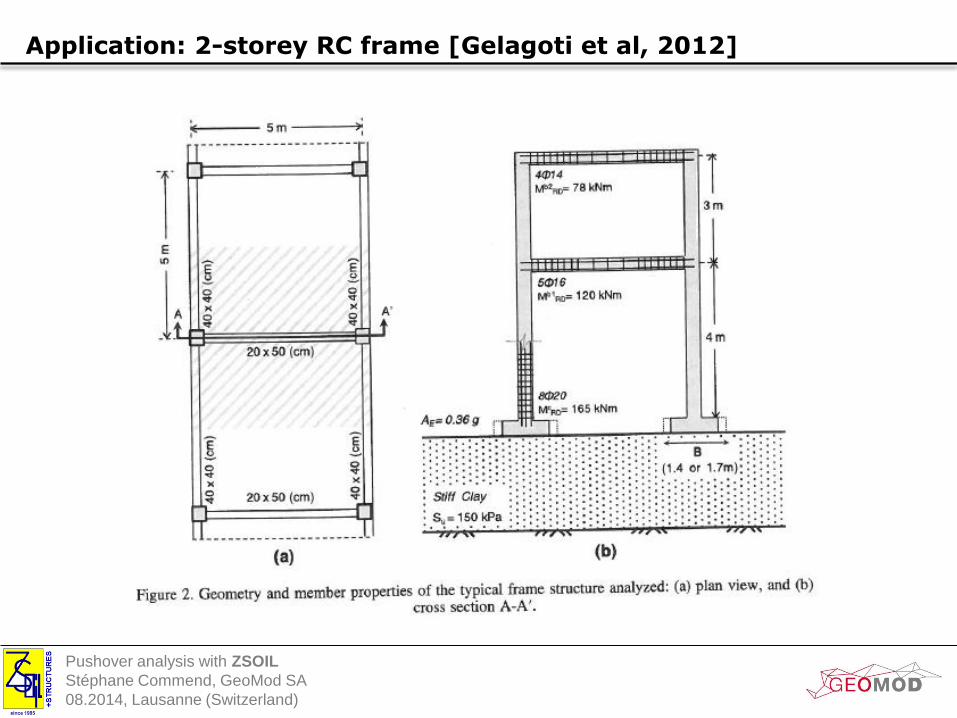
Application: 2-storey RC frame [Gelagoti et al, 2012]
Pushover analysis with ZSOIL
Stéphane Commend, GeoMod SA
08.2014, Lausanne (Switzerland)
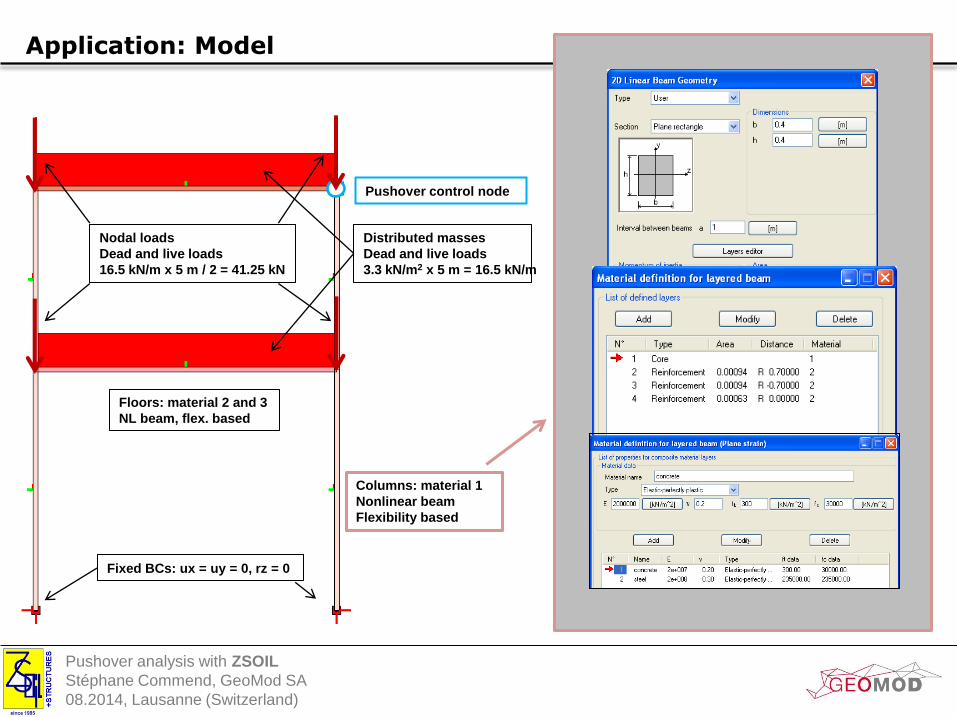
Application: Model
Distributed masses
Dead and live loads
3.3 kN/m2 x 5 m = 16.5 kN/m
Nodal loads
Dead and live loads
16.5 kN/m x 5 m / 2 = 41.25 kN
Fixed BCs: ux = uy = 0, rz = 0
Columns: material 1
Nonlinear beam
Flexibility based
Floors: material 2 and 3
NL beam, flex. based
Pushover control node
Pushover analysis with ZSOIL
Stéphane Commend, GeoMod SA
08.2014, Lausanne (Switzerland)
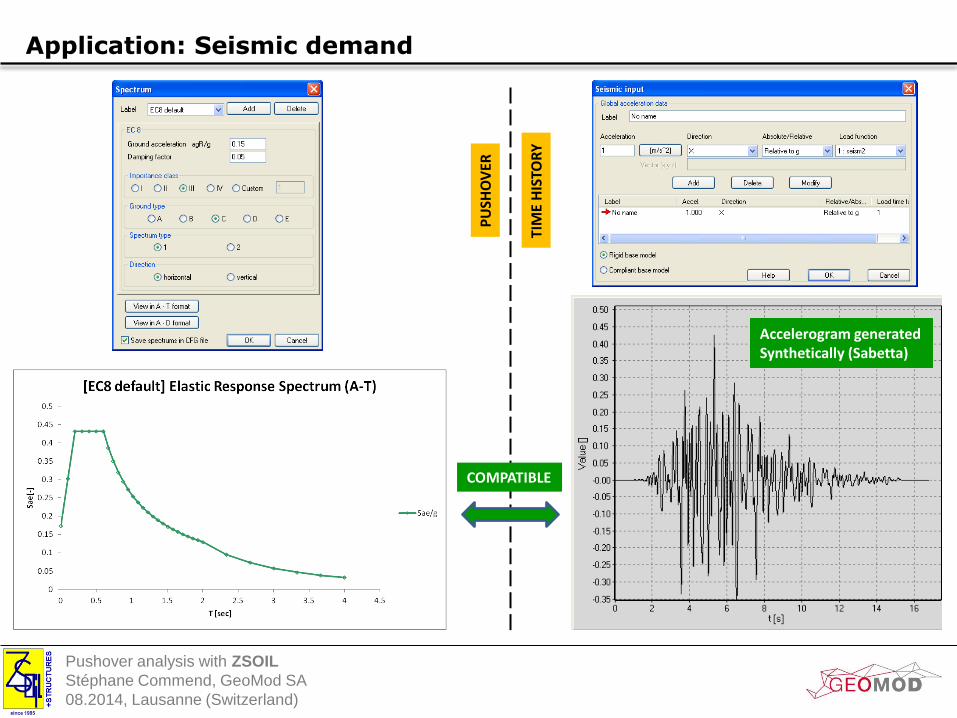
Application: Seismic demand
COMPATIBLE P
USH
OV
ER
TIM
E H
ISTO
RY
Accelerogram generated Synthetically (Sabetta)
Pushover analysis with ZSOIL
Stéphane Commend, GeoMod SA
08.2014, Lausanne (Switzerland)
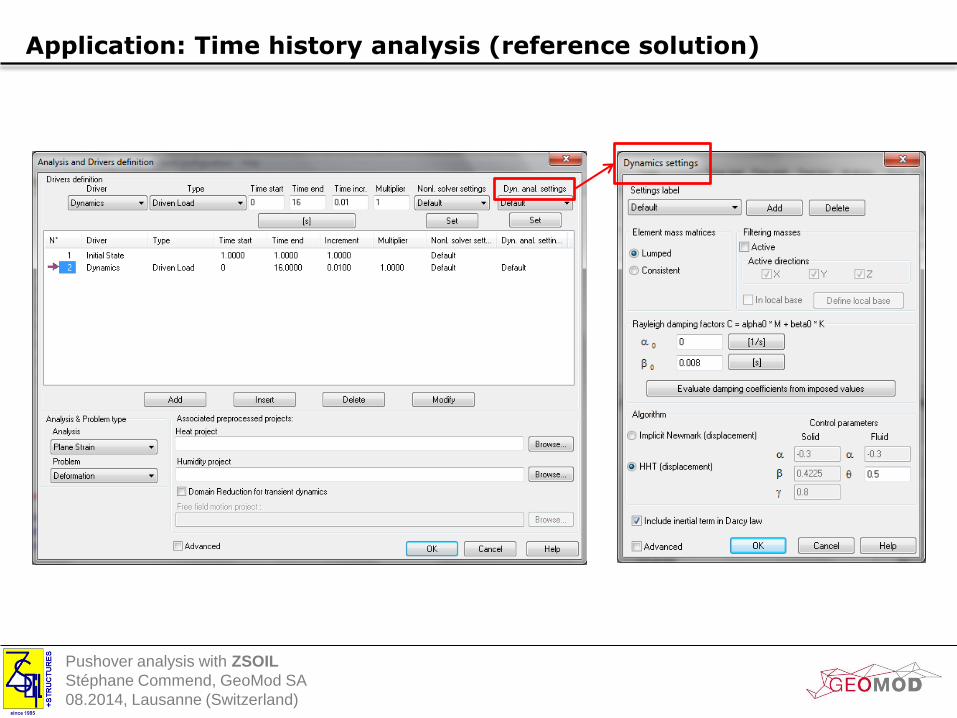
Application: Time history analysis (reference solution)
Pushover analysis with ZSOIL
Stéphane Commend, GeoMod SA
08.2014, Lausanne (Switzerland)
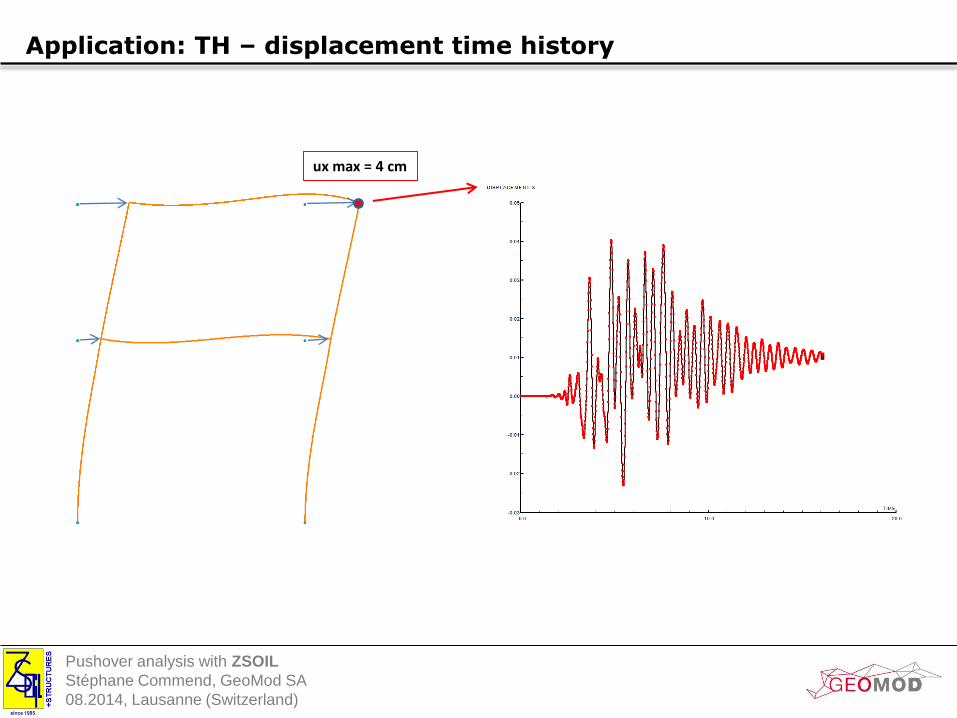
Application: TH – displacement time history
ux max = 4 cm
Pushover analysis with ZSOIL
Stéphane Commend, GeoMod SA
08.2014, Lausanne (Switzerland)
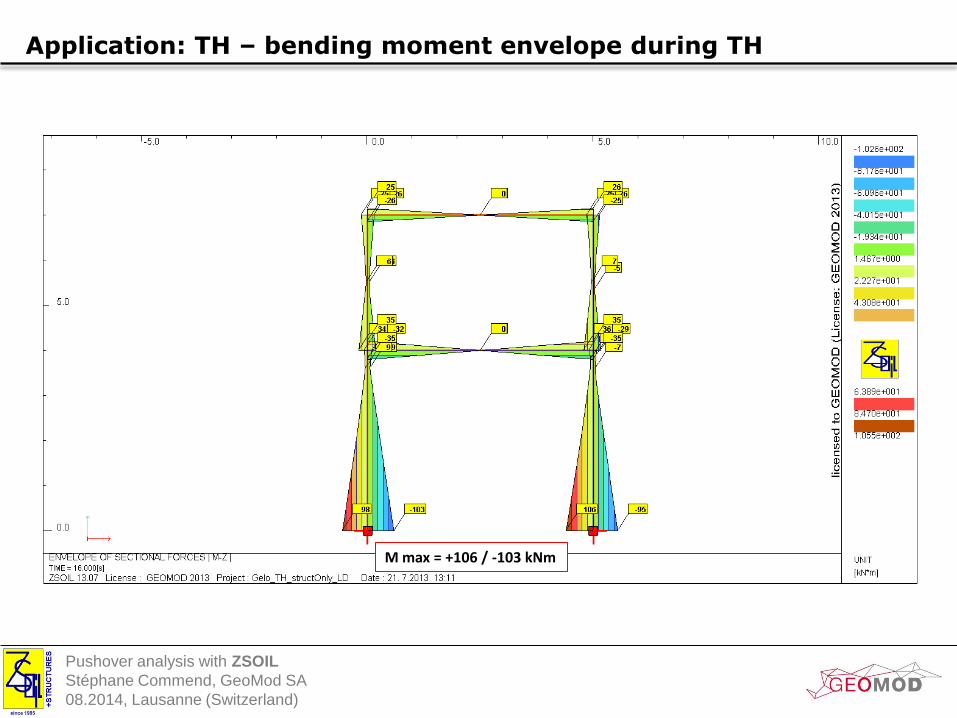
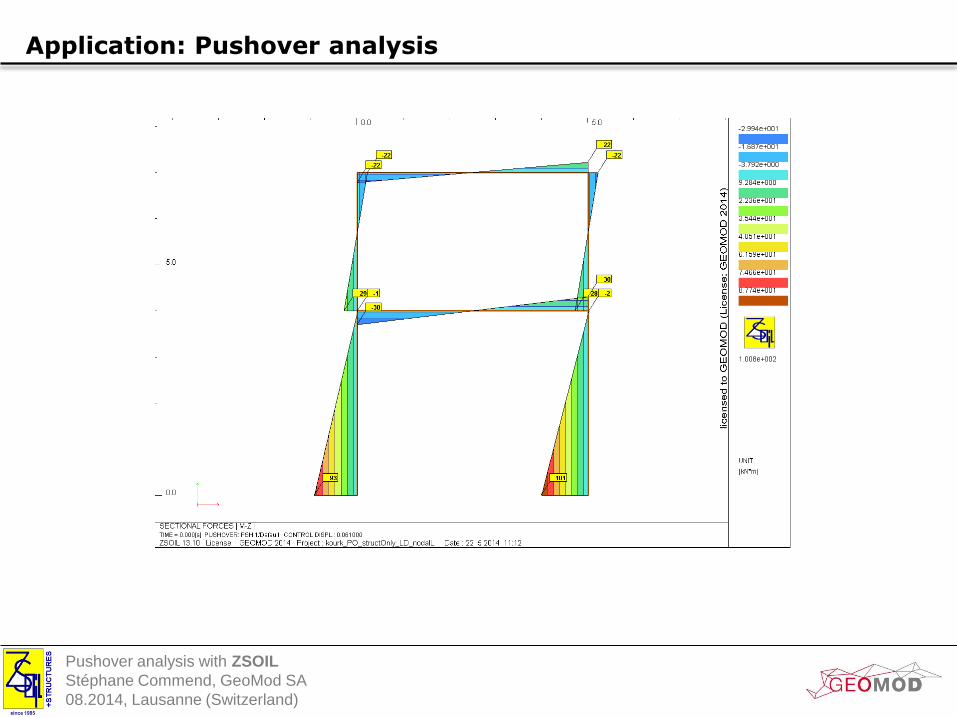
Application: TH – bending moment envelope during TH
M max = +106 / -103 kNm
Pushover analysis with ZSOIL
Stéphane Commend, GeoMod SA
08.2014, Lausanne (Switzerland)
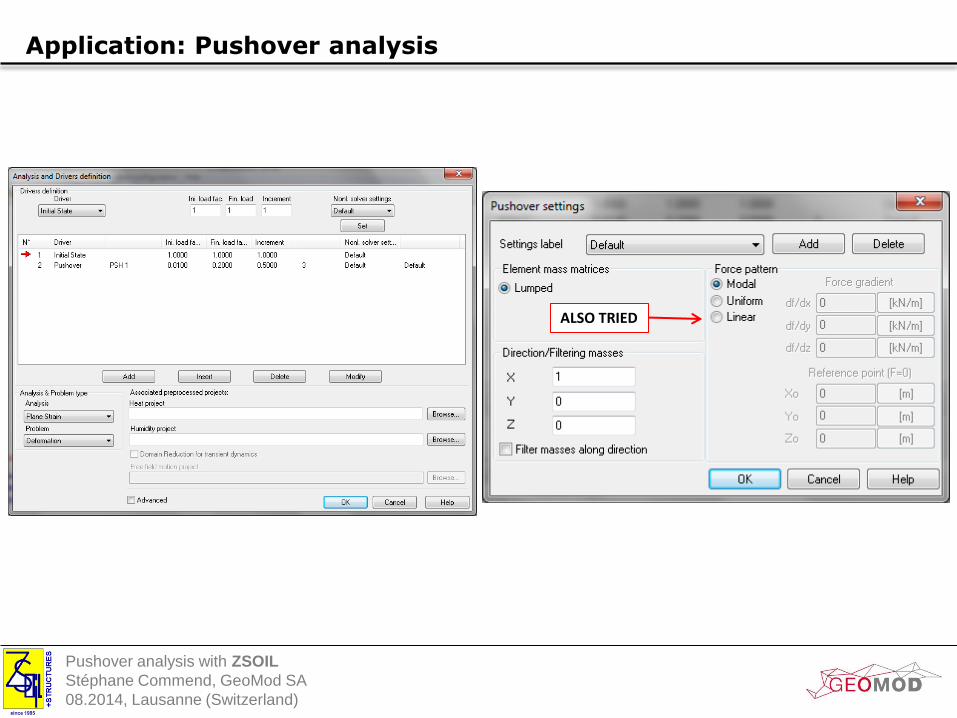
Application: Pushover analysis
ALSO TRIED
Pushover analysis with ZSOIL
Stéphane Commend, GeoMod SA
08.2014, Lausanne (Switzerland)
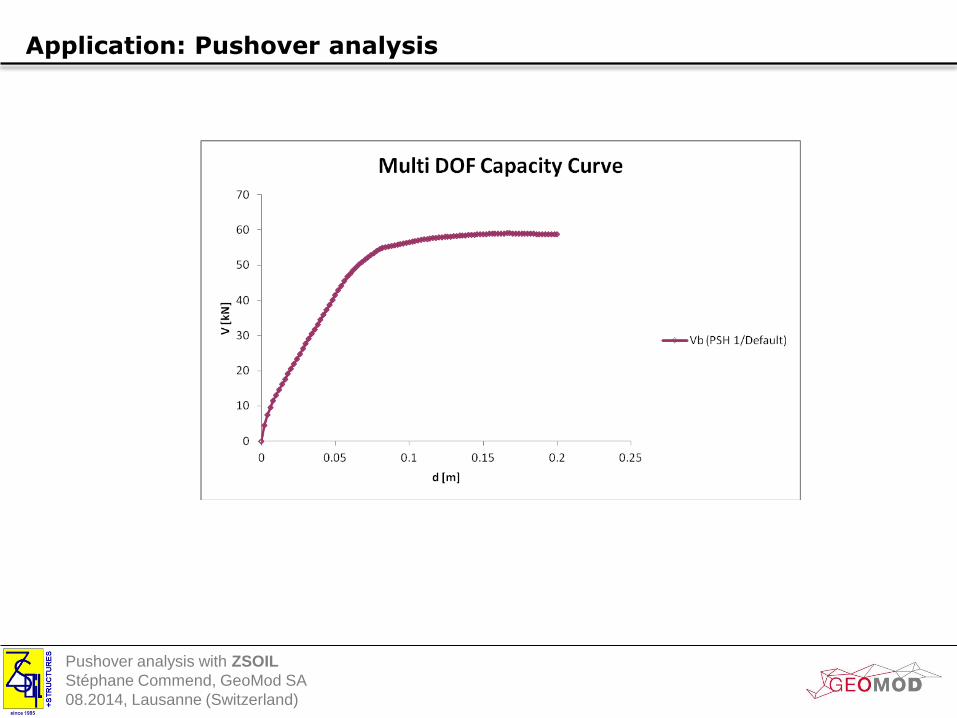
Application: Pushover analysis
Pushover analysis with ZSOIL
Stéphane Commend, GeoMod SA
08.2014, Lausanne (Switzerland)
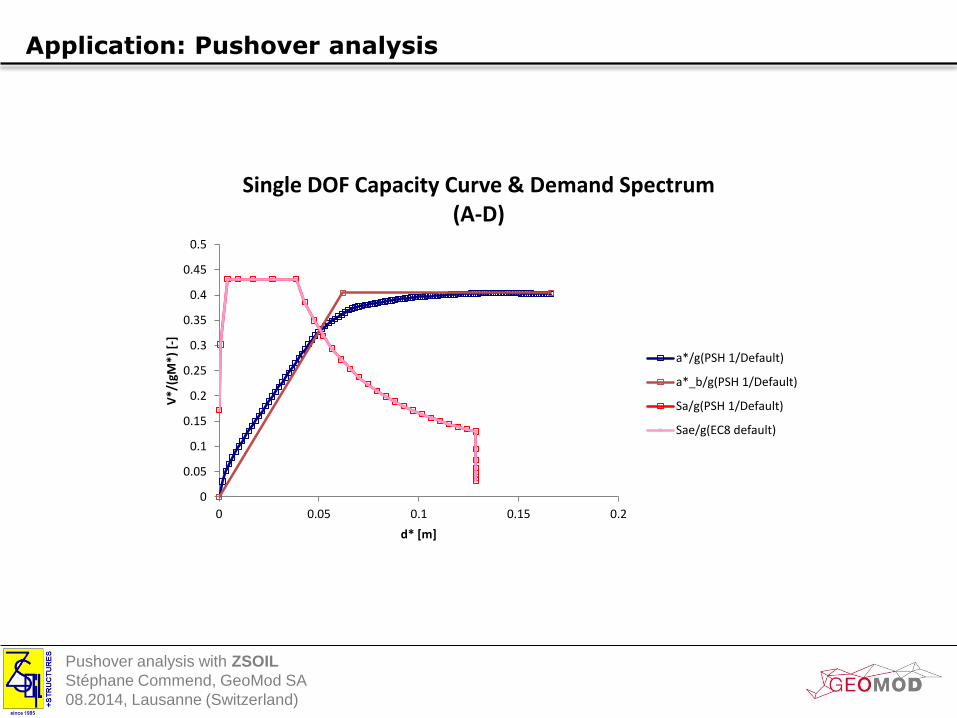
Application: Pushover analysis
0
0.05
0.1
0.15
0.2
0.25
0.3
0.35
0.4
0.45
0.5
0 0.05 0.1 0.15 0.2
V*/
(gM
*) [
-]
d* [m]
Single DOF Capacity Curve & Demand Spectrum (A-D)
a*/g(PSH 1/Default)
a*_b/g(PSH 1/Default)
Sa/g(PSH 1/Default)
Sae/g(EC8 default)
Pushover analysis with ZSOIL
Stéphane Commend, GeoMod SA
08.2014, Lausanne (Switzerland)
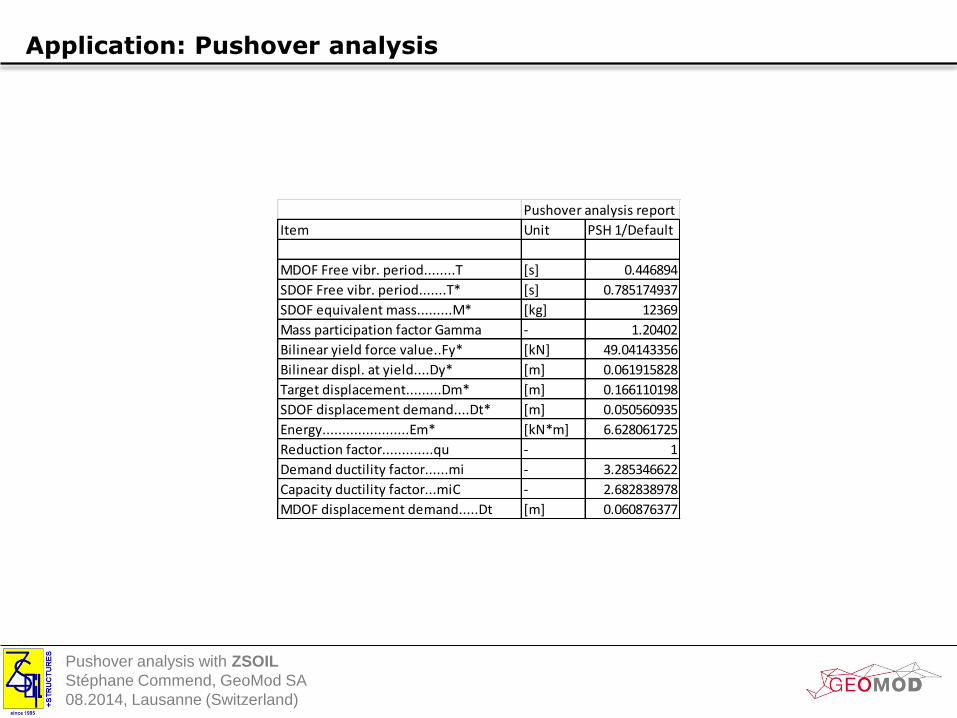
Application: Pushover analysis
Pushover analysis report
Item Unit PSH 1/Default
MDOF Free vibr. period........T [s] 0.446894
SDOF Free vibr. period.......T* [s] 0.785174937
SDOF equivalent mass.........M* [kg] 12369
Mass participation factor Gamma - 1.20402
Bilinear yield force value..Fy* [kN] 49.04143356
Bilinear displ. at yield....Dy* [m] 0.061915828
Target displacement.........Dm* [m] 0.166110198
SDOF displacement demand....Dt* [m] 0.050560935
Energy......................Em* [kN*m] 6.628061725
Reduction factor.............qu - 1
Demand ductility factor......mi - 3.285346622
Capacity ductility factor...miC - 2.682838978
MDOF displacement demand.....Dt [m] 0.060876377
Pushover analysis with ZSOIL
Stéphane Commend, GeoMod SA
08.2014, Lausanne (Switzerland)
Application: Pushover analysis
Pushover analysis with ZSOIL
Stéphane Commend, GeoMod SA
08.2014, Lausanne (Switzerland)
Why pushover?
Brief recall of pushover theory
Application: 2-storey RC frame
Nonlinear time history analysis (reference solution)
Nonlinear pushover analysis
Taking soil into account
Example: D0211 building
Contents
Pushover analysis with ZSOIL
Stéphane Commend, GeoMod SA
08.2014, Lausanne (Switzerland)
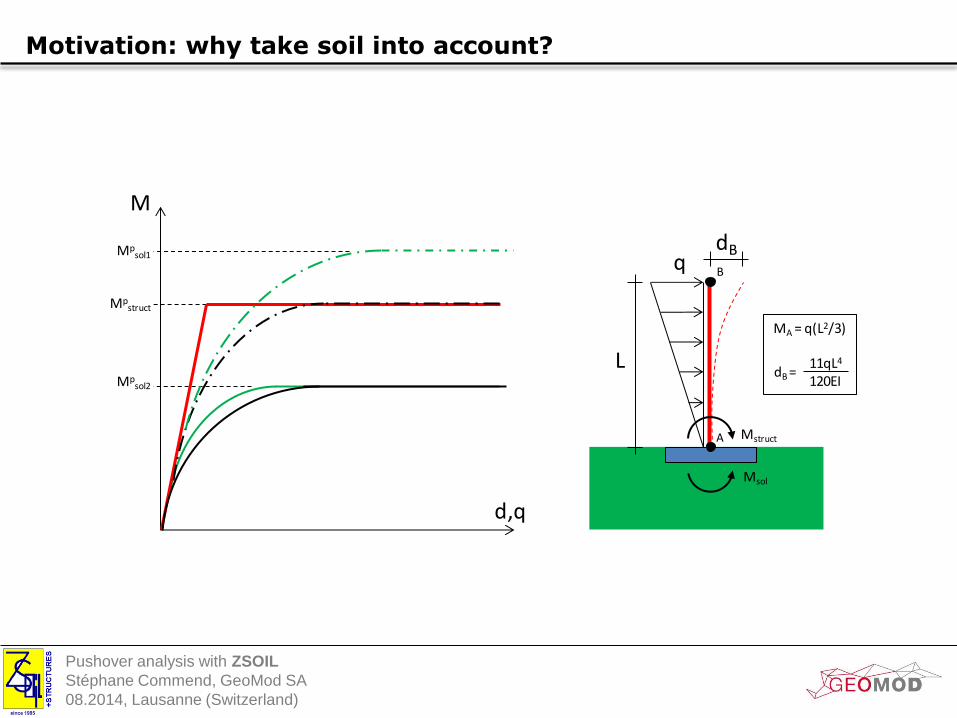
Motivation: why take soil into account?
qdB
B
A
MA = q(L2/3)
11qL4
120EIdB =
L
Mstruct
Msol
M
d,q
Mpstruct
Mpsol2
Mpsol1
Pushover analysis with ZSOIL
Stéphane Commend, GeoMod SA
08.2014, Lausanne (Switzerland)
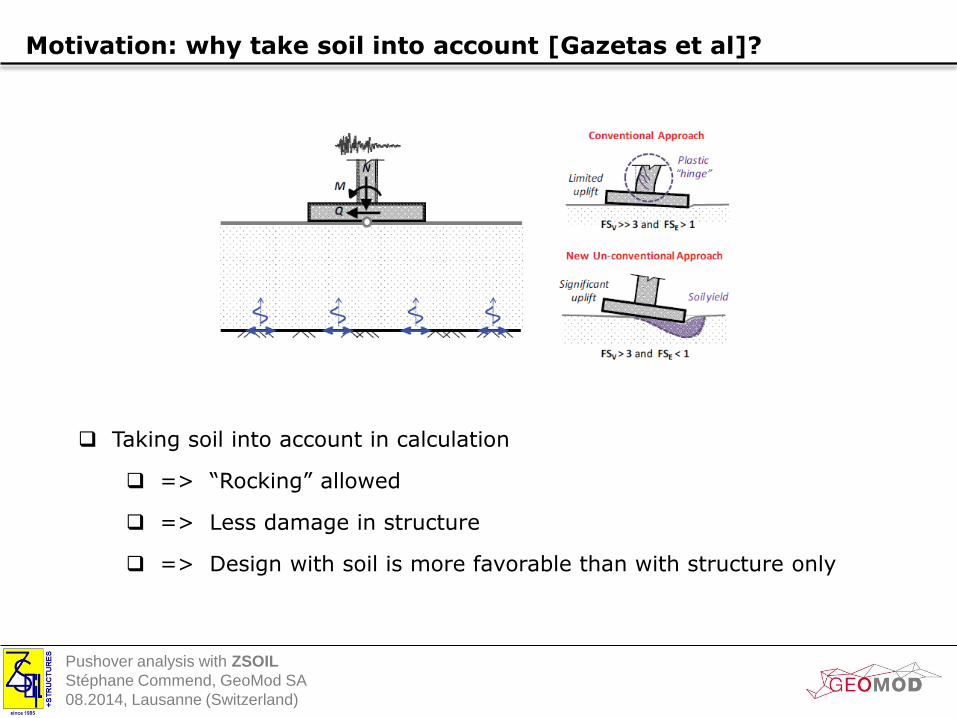
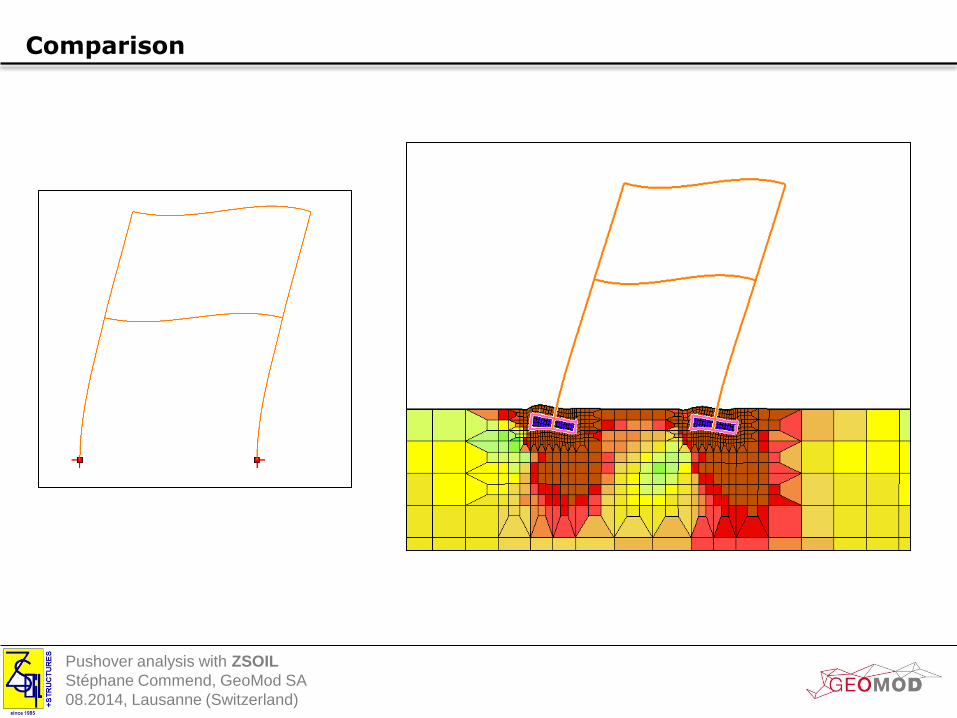
Motivation: why take soil into account [Gazetas et al]?
Taking soil into account in calculation
=> “Rocking” allowed
=> Less damage in structure
=> Design with soil is more favorable than with structure only
Pushover analysis with ZSOIL
Stéphane Commend, GeoMod SA
08.2014, Lausanne (Switzerland)
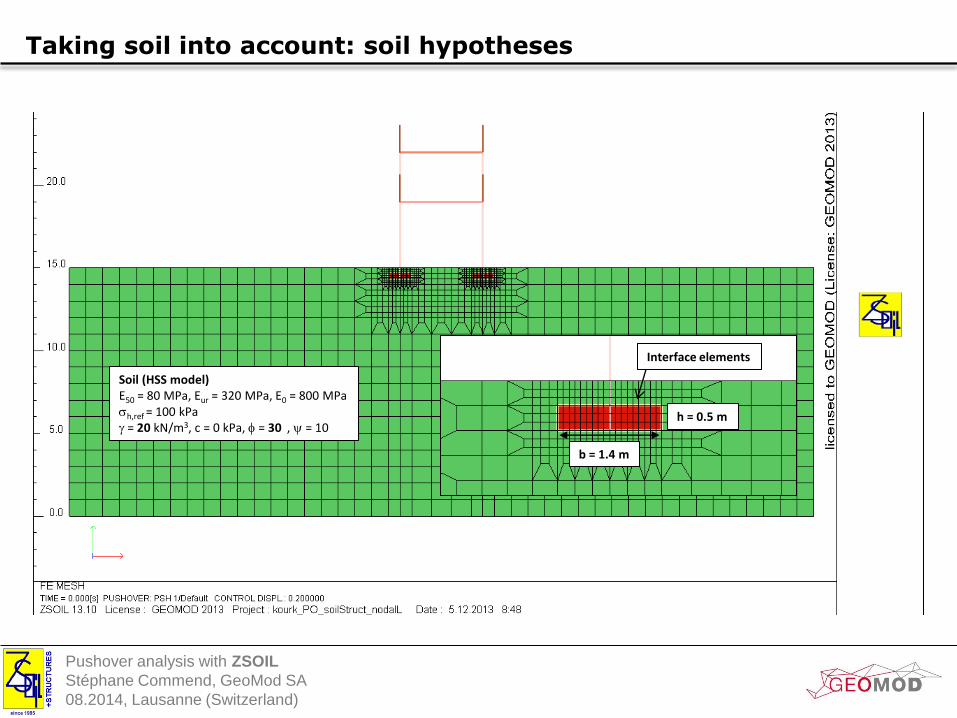
Taking soil into account: soil hypotheses
Soil (HSS model) E50 = 80 MPa, Eur = 320 MPa, E0 = 800 MPa sh,ref = 100 kPa g = 20 kN/m3, c = 0 kPa, f = 30 , y = 10
b = 1.4 m
h = 0.5 m
Interface elements
Pushover analysis with ZSOIL
Stéphane Commend, GeoMod SA
08.2014, Lausanne (Switzerland)
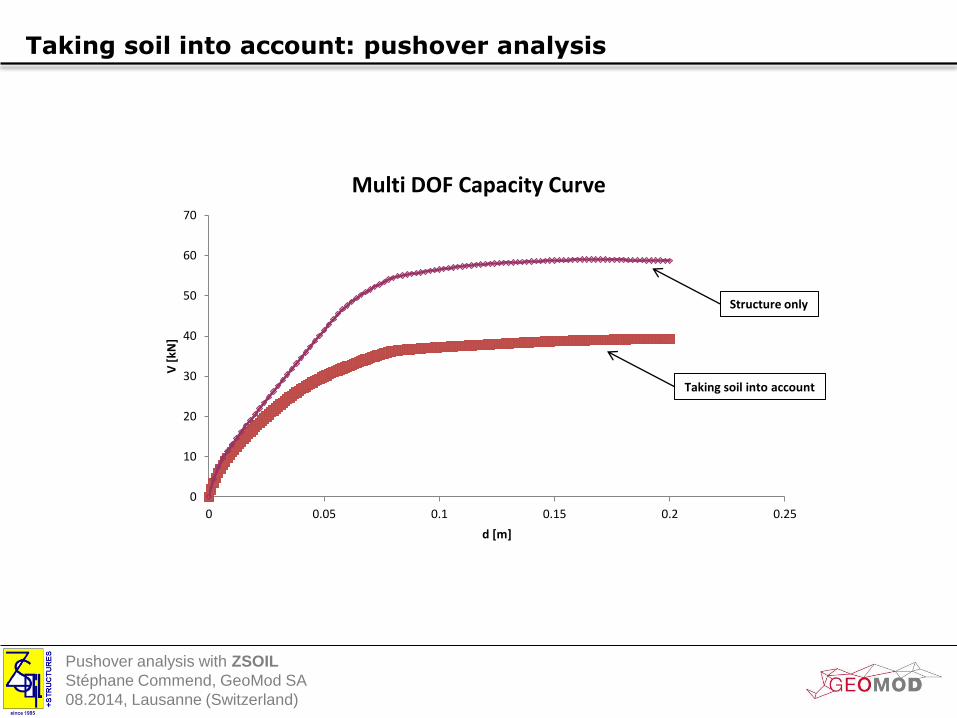
Taking soil into account: pushover analysis
0
10
20
30
40
50
60
70
0 0.05 0.1 0.15 0.2 0.25
V [
kN]
d [m]
Multi DOF Capacity Curve
Structure only
Taking soil into account
Pushover analysis with ZSOIL
Stéphane Commend, GeoMod SA
08.2014, Lausanne (Switzerland)
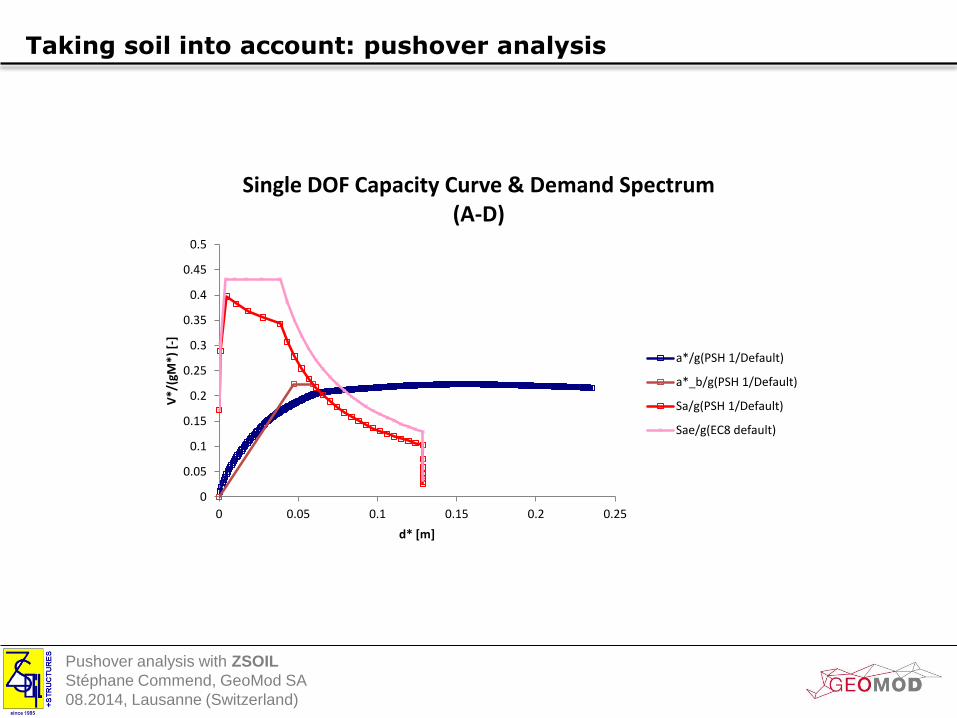
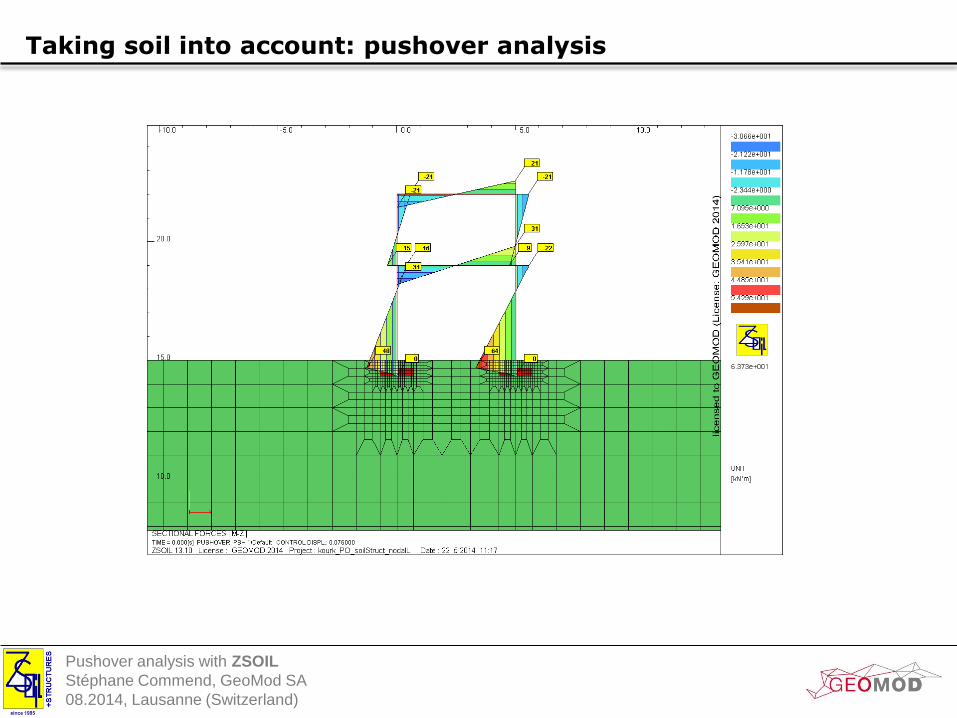
Taking soil into account: pushover analysis
0
0.05
0.1
0.15
0.2
0.25
0.3
0.35
0.4
0.45
0.5
0 0.05 0.1 0.15 0.2 0.25
V*/
(gM
*) [
-]
d* [m]
Single DOF Capacity Curve & Demand Spectrum (A-D)
a*/g(PSH 1/Default)
a*_b/g(PSH 1/Default)
Sa/g(PSH 1/Default)
Sae/g(EC8 default)
Pushover analysis with ZSOIL
Stéphane Commend, GeoMod SA
08.2014, Lausanne (Switzerland)
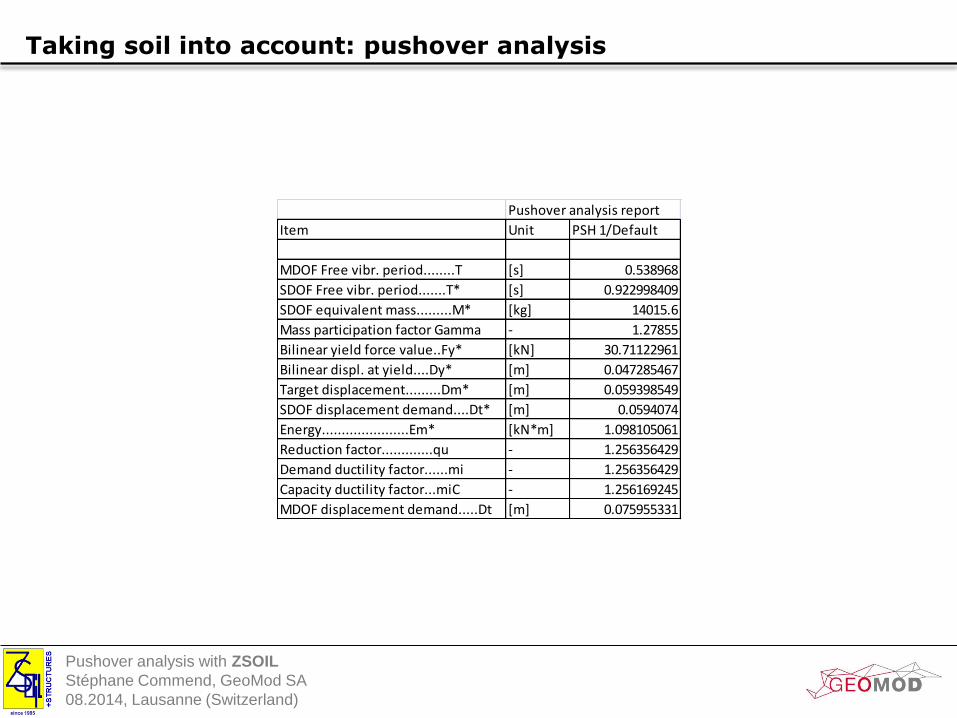
Taking soil into account: pushover analysis
Pushover analysis report
Item Unit PSH 1/Default
MDOF Free vibr. period........T [s] 0.538968
SDOF Free vibr. period.......T* [s] 0.922998409
SDOF equivalent mass.........M* [kg] 14015.6
Mass participation factor Gamma - 1.27855
Bilinear yield force value..Fy* [kN] 30.71122961
Bilinear displ. at yield....Dy* [m] 0.047285467
Target displacement.........Dm* [m] 0.059398549
SDOF displacement demand....Dt* [m] 0.0594074
Energy......................Em* [kN*m] 1.098105061
Reduction factor.............qu - 1.256356429
Demand ductility factor......mi - 1.256356429
Capacity ductility factor...miC - 1.256169245
MDOF displacement demand.....Dt [m] 0.075955331
Pushover analysis with ZSOIL
Stéphane Commend, GeoMod SA
08.2014, Lausanne (Switzerland)
Taking soil into account: pushover analysis
Pushover analysis with ZSOIL
Stéphane Commend, GeoMod SA
08.2014, Lausanne (Switzerland)
Comparison
Pushover analysis with ZSOIL
Stéphane Commend, GeoMod SA
08.2014, Lausanne (Switzerland)
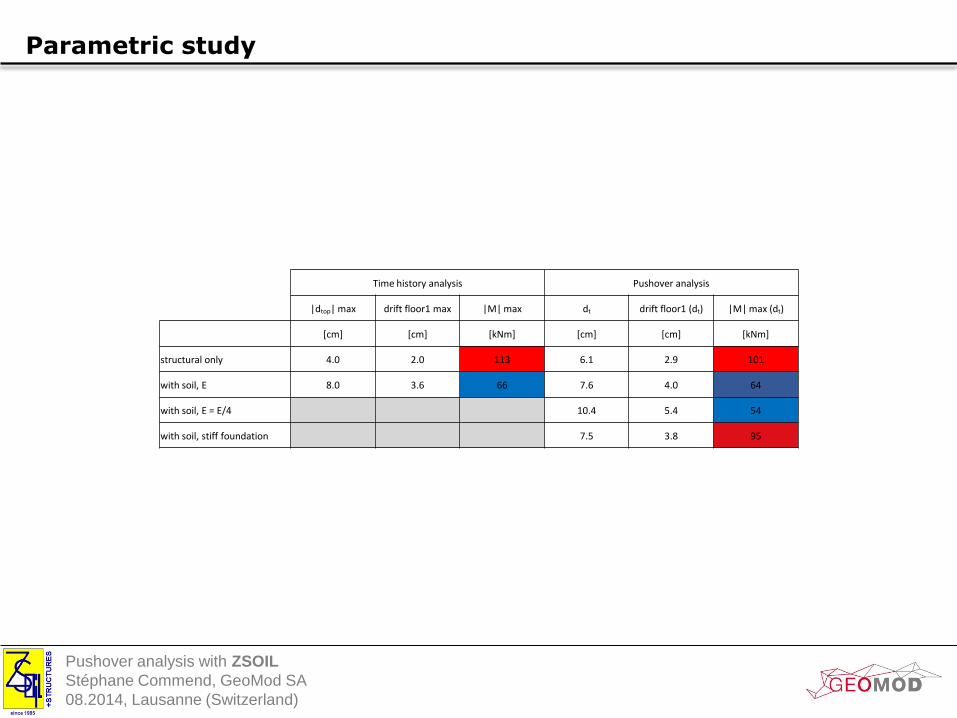
Parametric study
Time history analysis Pushover analysis
|dtop| max drift floor1 max |M| max dt drift floor1 (dt) |M| max (dt)
[cm] [cm] [kNm] [cm] [cm] [kNm]
structural only 4.0 2.0 113 6.1 2.9 101
with soil, E 8.0 3.6 66 7.6 4.0 64
with soil, E = E/4 10.4 5.4 54
with soil, stiff foundation 7.5 3.8 95
Pushover analysis with ZSOIL
Stéphane Commend, GeoMod SA
08.2014, Lausanne (Switzerland)
Why pushover?
Brief recall of pushover theory
Application: 2-storey RC frame
Nonlinear time history analysis (reference solution)
Nonlinear pushover analysis
Taking soil into account
Example: D0211 building
Contents
Pushover analysis with ZSOIL
Stéphane Commend, GeoMod SA
08.2014, Lausanne (Switzerland)
D0211 buidling
Pushover analysis with ZSOIL
Stéphane Commend, GeoMod SA
08.2014, Lausanne (Switzerland)
D0211 buidling
Pushover analysis with ZSOIL
Stéphane Commend, GeoMod SA
08.2014, Lausanne (Switzerland)
D0211 buidling
Pushover analysis with ZSOIL
Stéphane Commend, GeoMod SA
08.2014, Lausanne (Switzerland)
D0211 buidling
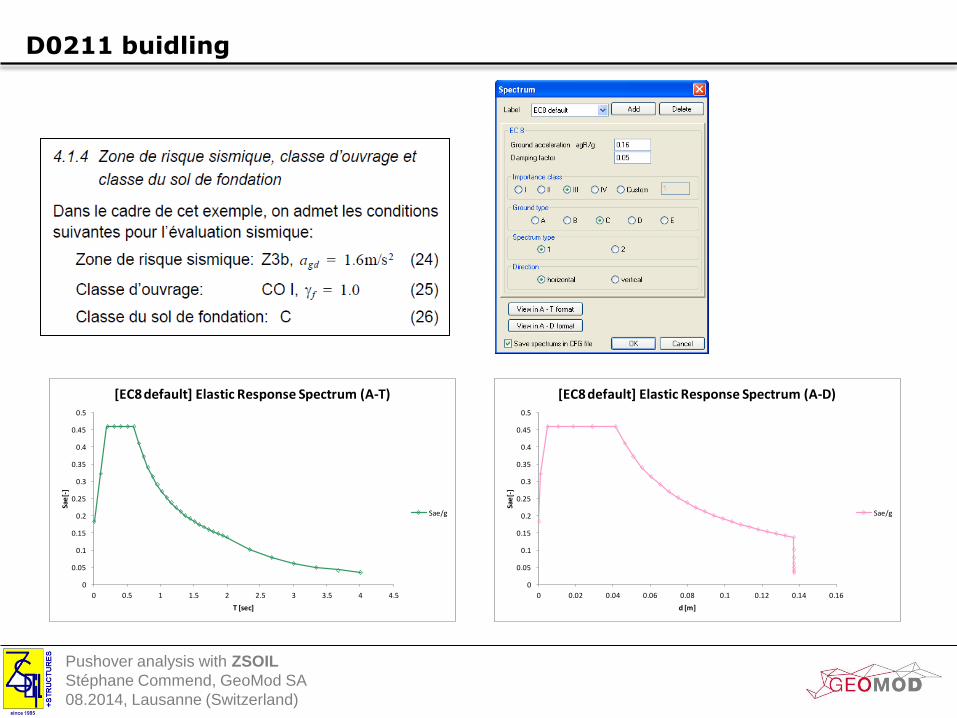
0
0.05
0.1
0.15
0.2
0.25
0.3
0.35
0.4
0.45
0.5
0 0.5 1 1.5 2 2.5 3 3.5 4 4.5
Sae
[-]
T [sec]
[EC8 default] Elastic Response Spectrum (A-T)
Sae/g
0
0.05
0.1
0.15
0.2
0.25
0.3
0.35
0.4
0.45
0.5
0 0.02 0.04 0.06 0.08 0.1 0.12 0.14 0.16
Sae
[-]
d [m]
[EC8 default] Elastic Response Spectrum (A-D)
Sae/g
Pushover analysis with ZSOIL
Stéphane Commend, GeoMod SA
08.2014, Lausanne (Switzerland)
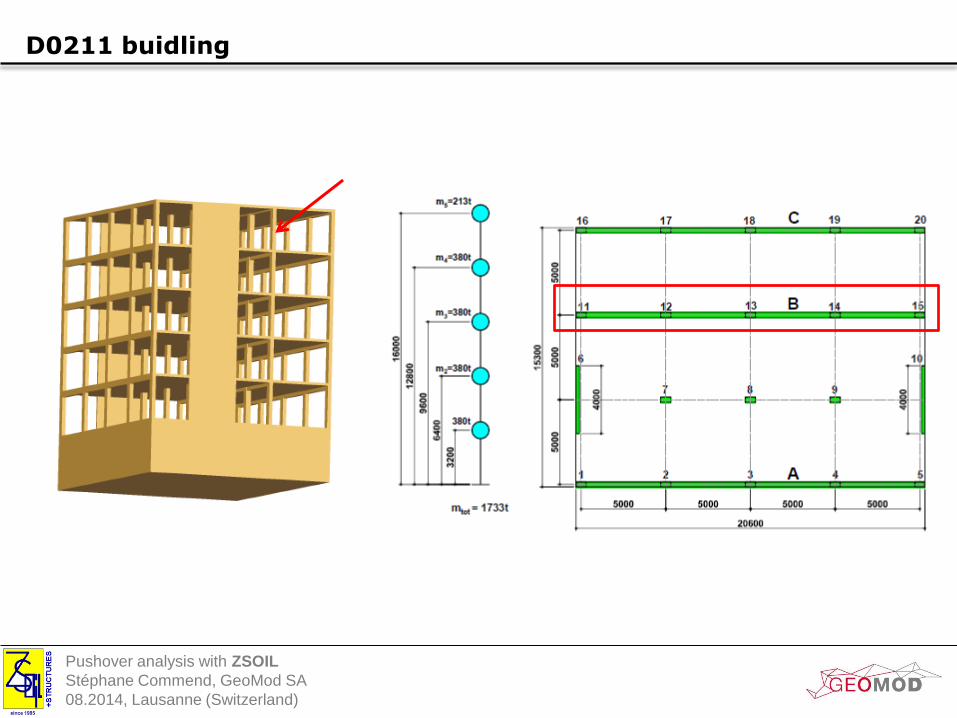
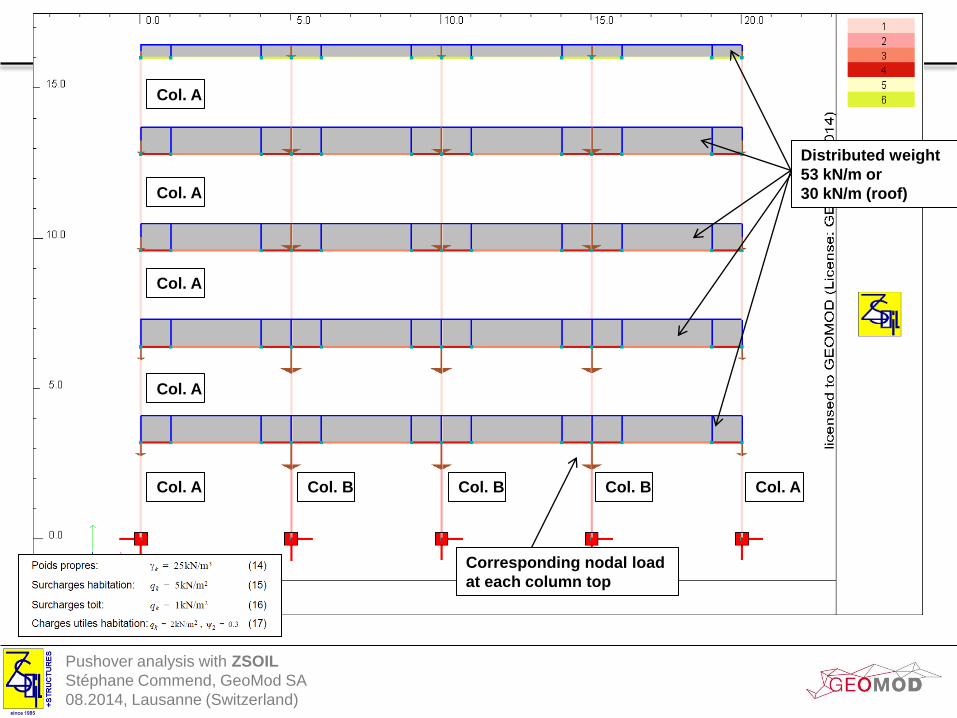
Distributed weight
53 kN/m or
30 kN/m (roof)
Corresponding nodal load
at each column top
Col. B Col. B Col. B Col. A
Col. A
Col. A
Col. A
Col. A
Col. A
Pushover analysis with ZSOIL
Stéphane Commend, GeoMod SA
08.2014, Lausanne (Switzerland)
D0211 buidling
0
100
200
300
400
500
600
700
800
900
1000
0 0.05 0.1 0.15 0.2 0.25
V [
kN]
d [m]
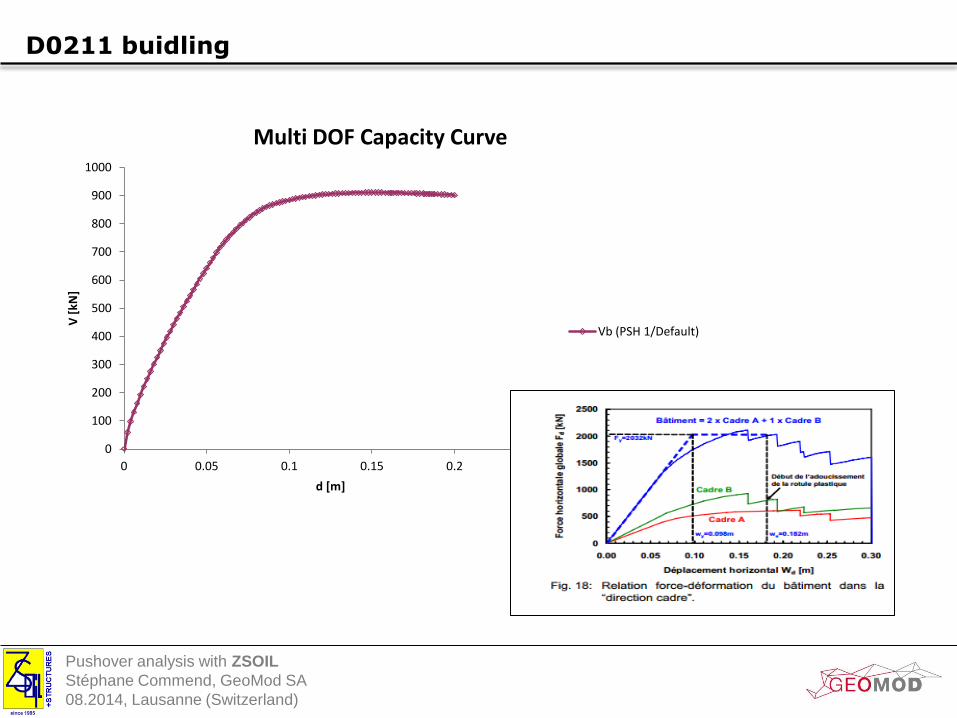
Multi DOF Capacity Curve
Vb (PSH 1/Default)
Pushover analysis with ZSOIL
Stéphane Commend, GeoMod SA
08.2014, Lausanne (Switzerland)
D0211 buidling
Pushover analysis with ZSOIL
Stéphane Commend, GeoMod SA
08.2014, Lausanne (Switzerland)
D0211 buidling
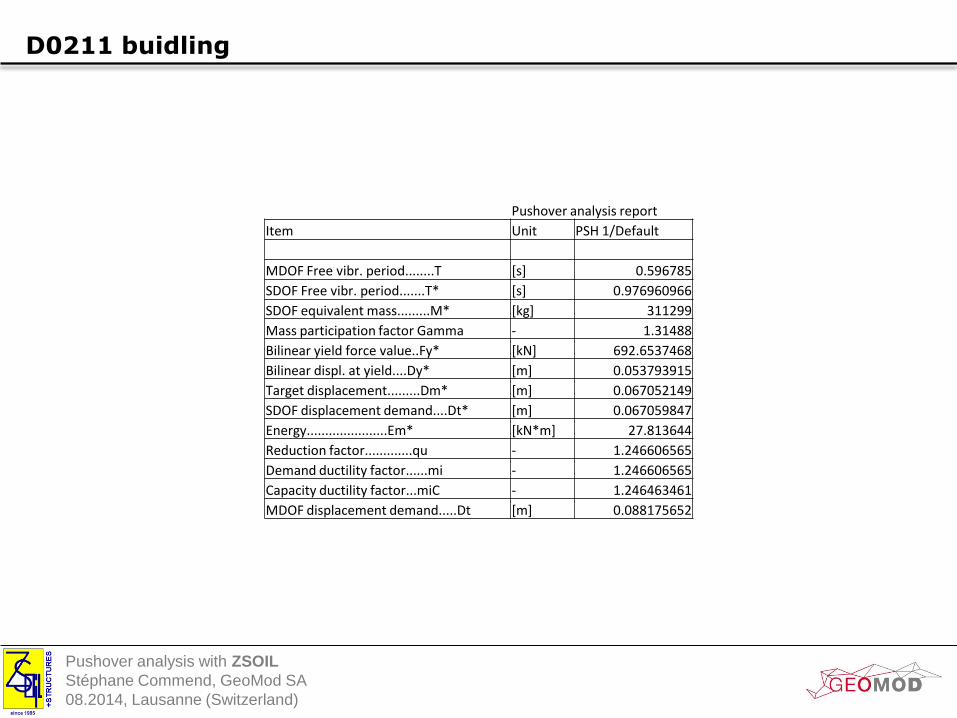
Pushover analysis report
Item Unit PSH 1/Default
MDOF Free vibr. period........T [s] 0.596785
SDOF Free vibr. period.......T* [s] 0.976960966
SDOF equivalent mass.........M* [kg] 311299
Mass participation factor Gamma - 1.31488
Bilinear yield force value..Fy* [kN] 692.6537468
Bilinear displ. at yield....Dy* [m] 0.053793915
Target displacement.........Dm* [m] 0.067052149
SDOF displacement demand....Dt* [m] 0.067059847
Energy......................Em* [kN*m] 27.813644
Reduction factor.............qu - 1.246606565
Demand ductility factor......mi - 1.246606565
Capacity ductility factor...miC - 1.246463461
MDOF displacement demand.....Dt [m] 0.088175652
Pushover analysis with ZSOIL
Stéphane Commend, GeoMod SA
08.2014, Lausanne (Switzerland)
D0211 buidling
Pushover analysis with ZSOIL
Stéphane Commend, GeoMod SA
08.2014, Lausanne (Switzerland)
D0211 buidling
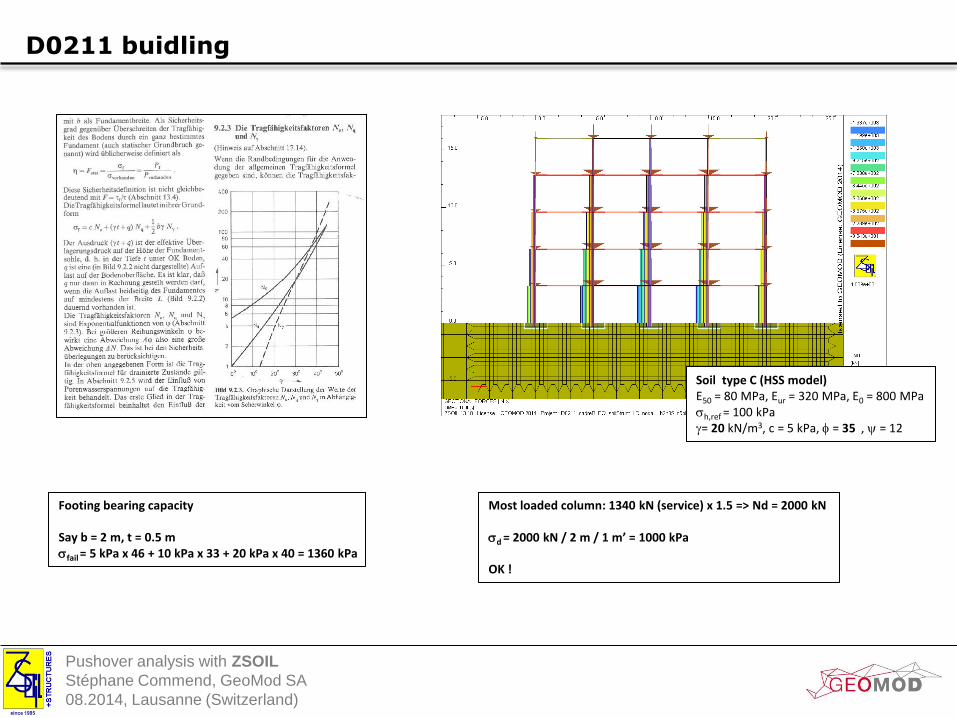
Footing bearing capacity Say b = 2 m, t = 0.5 m sfail = 5 kPa x 46 + 10 kPa x 33 + 20 kPa x 40 = 1360 kPa
Most loaded column: 1340 kN (service) x 1.5 => Nd = 2000 kN
sd = 2000 kN / 2 m / 1 m’ = 1000 kPa OK !
Soil type C (HSS model) E50 = 80 MPa, Eur = 320 MPa, E0 = 800 MPa sh,ref = 100 kPa g= 20 kN/m3, c = 5 kPa, f = 35 , y = 12
Pushover analysis with ZSOIL
Stéphane Commend, GeoMod SA
08.2014, Lausanne (Switzerland)
D0211 buidling
Pushover analysis with ZSOIL
Stéphane Commend, GeoMod SA
08.2014, Lausanne (Switzerland)
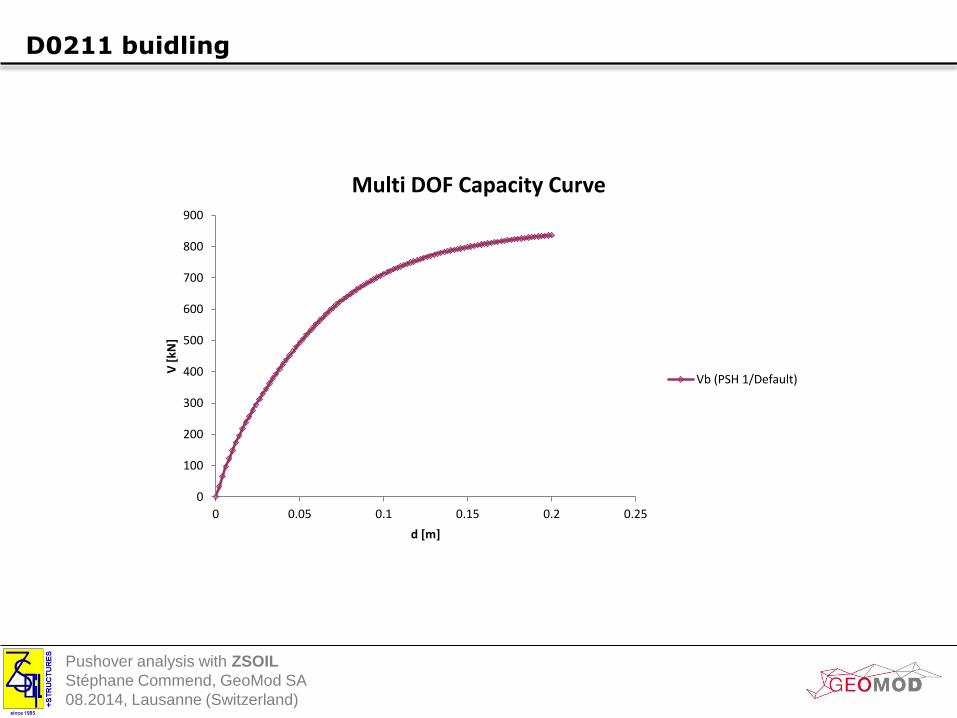
D0211 buidling
0
100
200
300
400
500
600
700
800
900
0 0.05 0.1 0.15 0.2 0.25
V [
kN]
d [m]
Multi DOF Capacity Curve
Vb (PSH 1/Default)
Pushover analysis with ZSOIL
Stéphane Commend, GeoMod SA
08.2014, Lausanne (Switzerland)
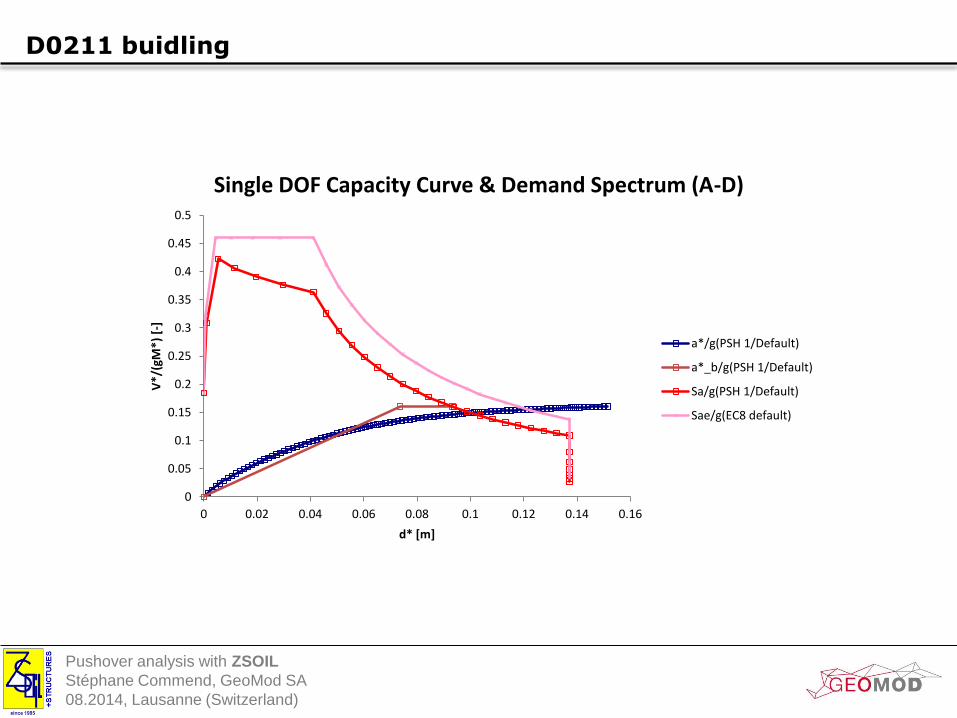
D0211 buidling
0
0.05
0.1
0.15
0.2
0.25
0.3
0.35
0.4
0.45
0.5
0 0.02 0.04 0.06 0.08 0.1 0.12 0.14 0.16
V*/
(gM
*) [
-]
d* [m]
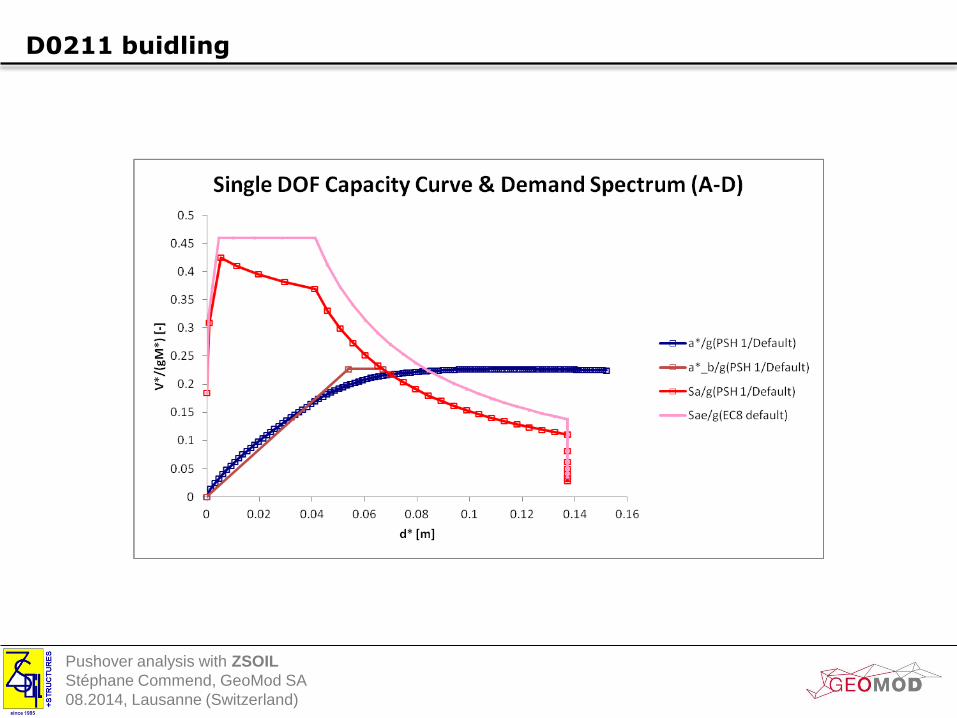
Single DOF Capacity Curve & Demand Spectrum (A-D)
a*/g(PSH 1/Default)
a*_b/g(PSH 1/Default)
Sa/g(PSH 1/Default)
Sae/g(EC8 default)
Pushover analysis with ZSOIL
Stéphane Commend, GeoMod SA
08.2014, Lausanne (Switzerland)
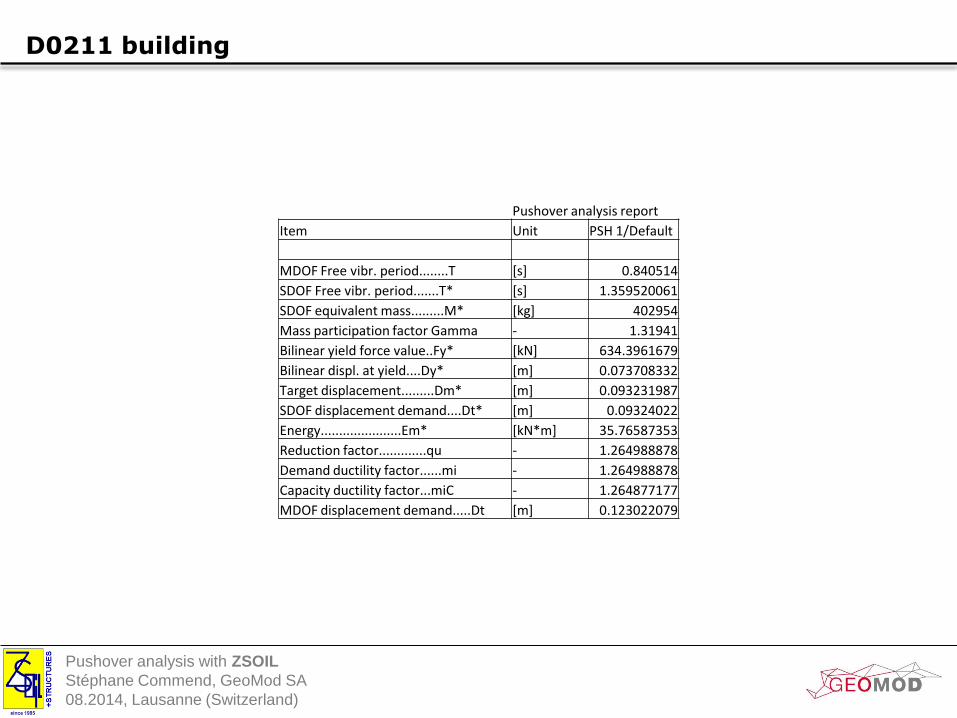
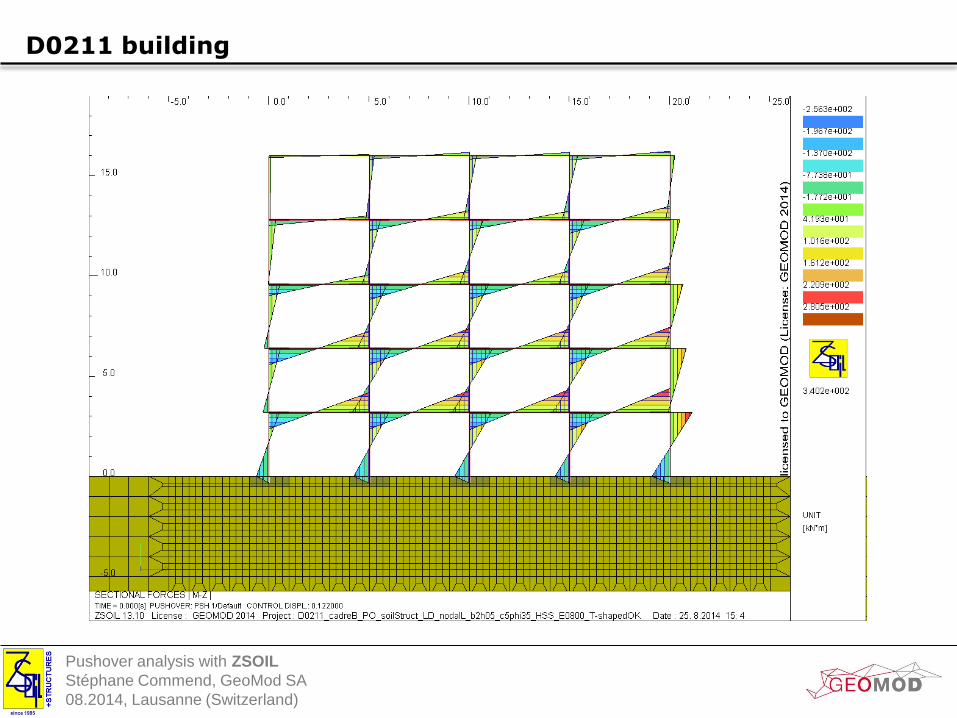
D0211 building
Pushover analysis report
Item Unit PSH 1/Default
MDOF Free vibr. period........T [s] 0.840514
SDOF Free vibr. period.......T* [s] 1.359520061
SDOF equivalent mass.........M* [kg] 402954
Mass participation factor Gamma - 1.31941
Bilinear yield force value..Fy* [kN] 634.3961679
Bilinear displ. at yield....Dy* [m] 0.073708332
Target displacement.........Dm* [m] 0.093231987
SDOF displacement demand....Dt* [m] 0.09324022
Energy......................Em* [kN*m] 35.76587353
Reduction factor.............qu - 1.264988878
Demand ductility factor......mi - 1.264988878
Capacity ductility factor...miC - 1.264877177
MDOF displacement demand.....Dt [m] 0.123022079
Pushover analysis with ZSOIL
Stéphane Commend, GeoMod SA
08.2014, Lausanne (Switzerland)
D0211 buidling
Pushover analysis with ZSOIL
Stéphane Commend, GeoMod SA
08.2014, Lausanne (Switzerland)
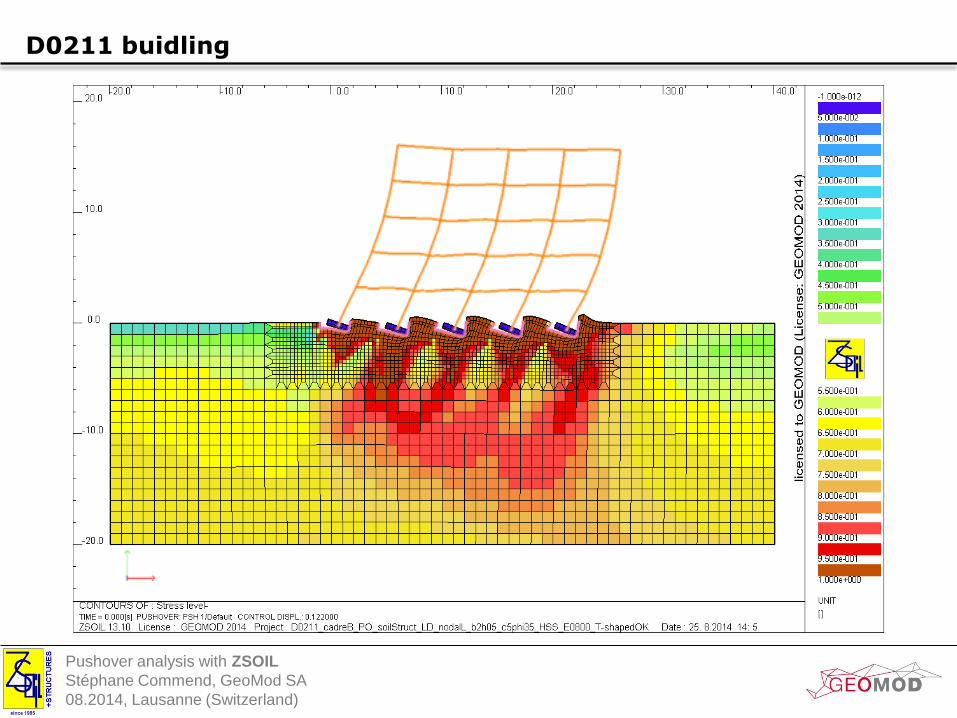
D0211 building
Pushover analysis with ZSOIL
Stéphane Commend, GeoMod SA
08.2014, Lausanne (Switzerland)
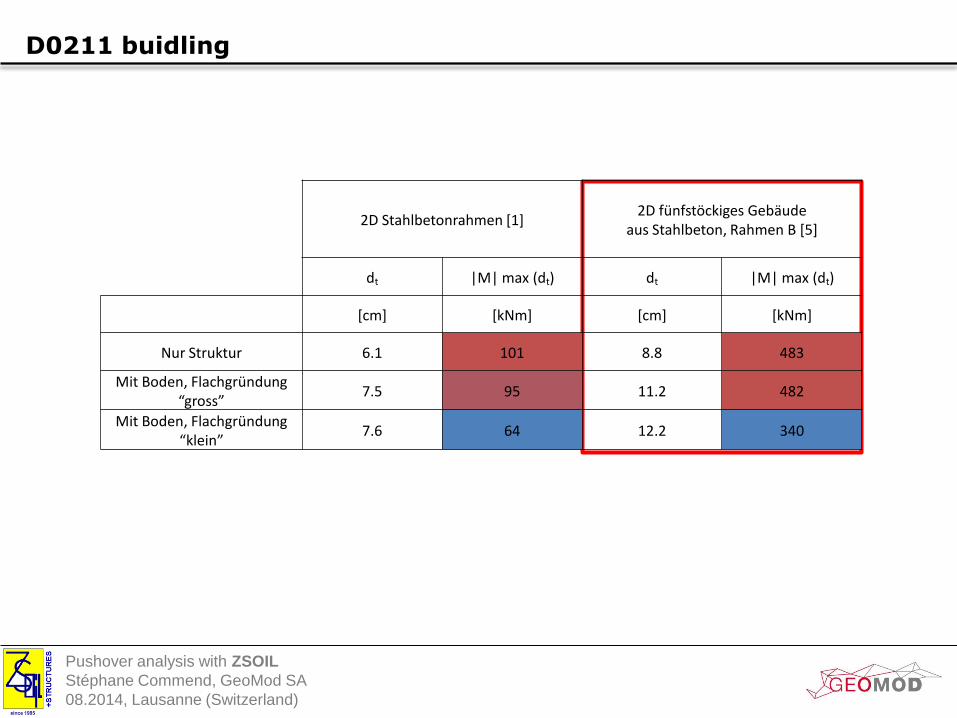
D0211 buidling
2D Stahlbetonrahmen [1]
2D fünfstöckiges Gebäude
aus Stahlbeton, Rahmen B [5]
dt |M| max (dt) dt |M| max (dt)
[cm] [kNm] [cm] [kNm]
Nur Struktur 6.1 101 8.8 483
Mit Boden, Flachgründung “gross”
7.5 95 11.2 482
Mit Boden, Flachgründung “klein”
7.6 64 12.2 340