Embed Size (px)
Citation preview

Application of Steam Turbine Driven
Chillers in CHP/DES System
Bradley Cochrane, M. Eng., P. Eng., CEM,
Director, Energy Management, York University.
Edy Chiarotto, HVAC Equipment Sales Manager,
Johnson Controls Canada.
1

Agenda
Introductions and Opening Remarks
York University Keele Campus & Energy Management Overview
YorkW!$E Energy Management Project Overview
Steam Chiller Cogeneration/Trigeneration Project
Equipment Overview

Keele Campus Overview
Founded in March 1959, and is now Canada's third-largest university Canada's leading interdisciplinary research and teaching university Over 53,000 students with the expansion of undergraduate engineering program. Over 7,000 employees Single largest contiguous campus in Canada > 8,000,000 sq. ft. 21 MW electrical peak load Over 14,000 tons of centralized chillers for air conditioning Prime opportunity for peak shaving Similar to scope of City of North Bay
• Motto – redefine THE POSSIBLE, • Tentanda Via: The Way must be tried

Energy Management Overview
• Energy Management Department’s primary function is to provide;
Heating,
Cooling,
Power, and
Water to all academic, administrative, retail, and residences on campus
Administer large energy retrofit project.
• Central Utilities:
Generates high pressure steam, 1,724kPa (250psi) for heating and 5oC (41oF) chilled water for cooling,
Delivers these by way of 3.6 km (2.24 Miles) underground service tunnels to mechanical rooms of each building for distribution
to the various heating, ventilating, and air conditioning (HVAC) units within the building
Generate and distribute power through our 10 megawatt co-generation plant and associated 13,800 volt electrical distribution
system.
The Energy Management unit is a 24-hour per day, 365 days per year operation that is
staffed by highly skilled technicians and management whose sole responsibility is to
provide the utilities requirements of our community in a safe and efficient manner and in
accordance with all regulatory requirements.

Energy Management Overview
• Historical Operating Budget - $25 million CDN (almost $70,000/day, $0.80/sec) Natural Gas 20%
Electricity 40%
Water 20%
Oil – backup <1%
Maintenance and Operations 20%
• Previous energy management projects: $17,000,000 CDN natural gas fired Solar Taurus 60 turbine co-generation facilities
5 MW in1997, and
additional 5 MW in 2003

YorkW!$E Energy Management Project
In September 2005, the concept of an Energy Performance Contracting Program
was finalized, which aimed to invest $41,500,000 CDN in plant and building system
renewal and retrofit projects so that annual energy costs and greenhouse gases
could be reduced by 25%.
In November 2005, MCW Custom Energy Solutions Ltd. was selected as the
successful contractor.
In February 2006, the pilot project for the YorkW!$E Energy Management
Program was brought forward for Board approval.
Since that time, numerous energy conservation measures were approved and
implemented in campus buildings and in the central plant and utility distribution
systems with >$4,400,000 CDN in utility company incentives to date being reinvested.

What next on the journey to reducing
consumption?
Completed review of possible next steps in early 2012 as natural gas prices had fallen drastically
making some of the remaining HVAC heating measures financially unattractive, were there now
better unforeseen options?
ANSWER: YES
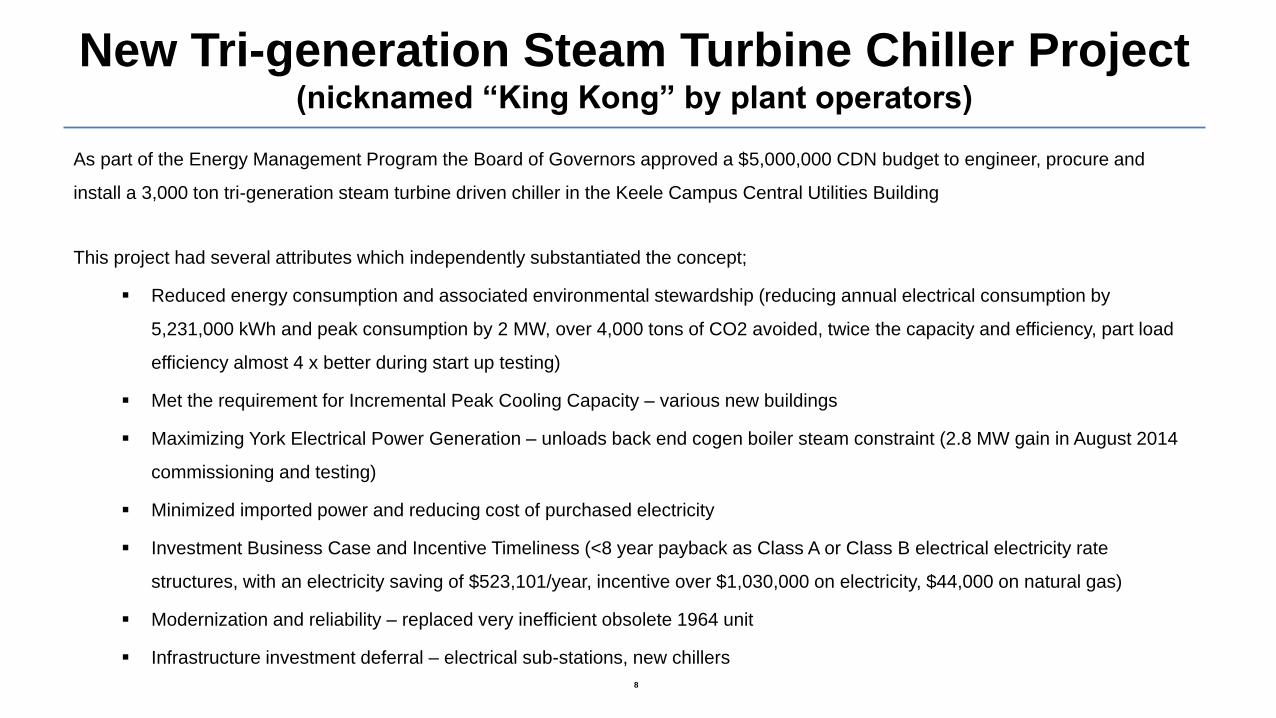
New Tri-generation Steam Turbine Chiller Project (nicknamed “King Kong” by plant operators)
8
As part of the Energy Management Program the Board of Governors approved a $5,000,000 CDN budget to engineer, procure and
install a 3,000 ton tri-generation steam turbine driven chiller in the Keele Campus Central Utilities Building
This project had several attributes which independently substantiated the concept;
Reduced energy consumption and associated environmental stewardship (reducing annual electrical consumption by
5,231,000 kWh and peak consumption by 2 MW, over 4,000 tons of CO2 avoided, twice the capacity and efficiency, part load
efficiency almost 4 x better during start up testing)
Met the requirement for Incremental Peak Cooling Capacity – various new buildings
Maximizing York Electrical Power Generation – unloads back end cogen boiler steam constraint (2.8 MW gain in August 2014
commissioning and testing)
Minimized imported power and reducing cost of purchased electricity
Investment Business Case and Incentive Timeliness (<8 year payback as Class A or Class B electrical electricity rate
structures, with an electricity saving of $523,101/year, incentive over $1,030,000 on electricity, $44,000 on natural gas)
Modernization and reliability – replaced very inefficient obsolete 1964 unit
Infrastructure investment deferral – electrical sub-stations, new chillers

Old 1964 Chiller on the way out!

Chiller Installation in the Central Utilities Building

Key Lessons Learned
• To achieve minimum flow (20%) on our primary
distribution piping system, we added a Chilled Water
recirculation line to keep minimum flow circulating
through the chiller, during low nighttime loads. This
minimum flow is needed to keep the chiller running.
• Turbine glad seals using line pressure steam not
desirable (Implemented Manufacture
recommendations).
• If a fast opening steam relief line is to be used so you
don’t trip boilers in the event of a turbine trip, then
incorporate that for cleaning the steam piping and start
up routine.
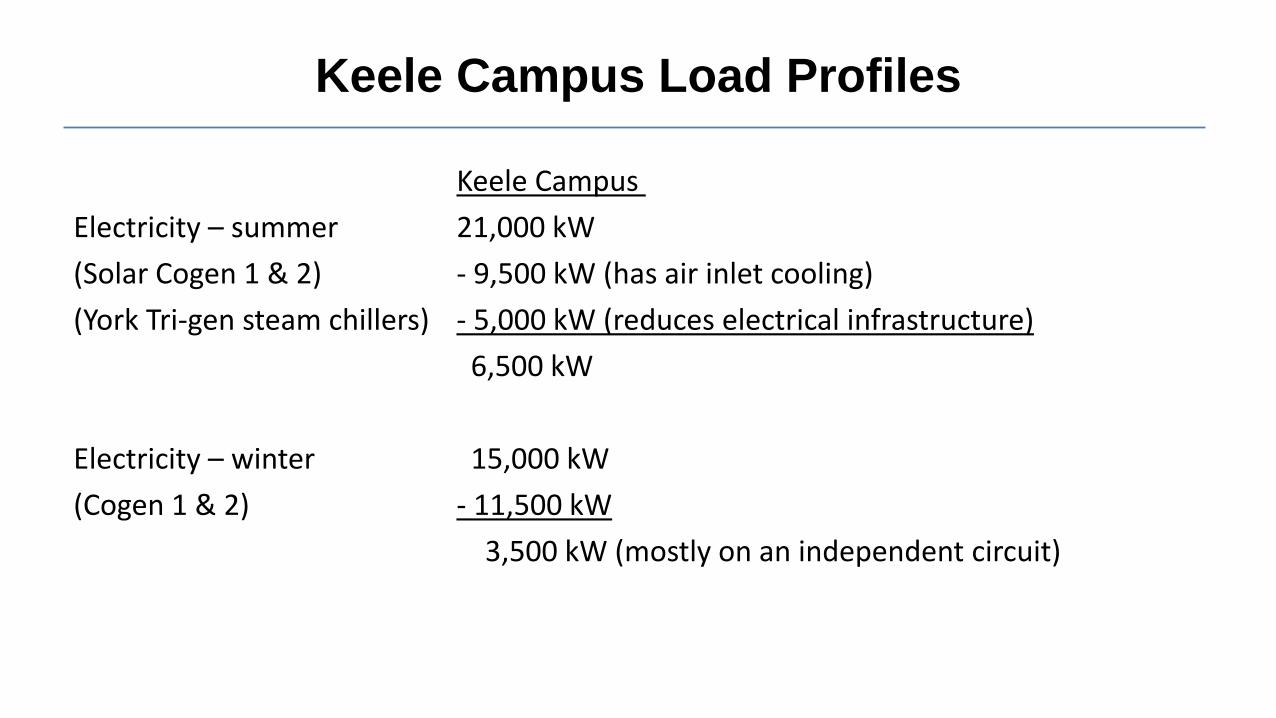
Keele Campus Load Profiles
Keele Campus
Electricity – summer 21,000 kW
(Solar Cogen 1 & 2) - 9,500 kW (has air inlet cooling)
(York Tri-gen steam chillers) - 5,000 kW (reduces electrical infrastructure)
6,500 kW
Electricity – winter 15,000 kW
(Cogen 1 & 2) - 11,500 kW
3,500 kW (mostly on an independent circuit)

Equipment Overview

Electric Motor Driven Centrifugal Chiller
Electric Motor
Compressor

Electric Motor Driven Centrifugal Chiller
Steam Turbine
Compressor

Key Components
Chilled Water InletChilled Water Outlet
Condenser Water Outlet
Steam Inlet
Marine Water Boxes
Condenser Water Inlet
Factory Insulated Evaporator
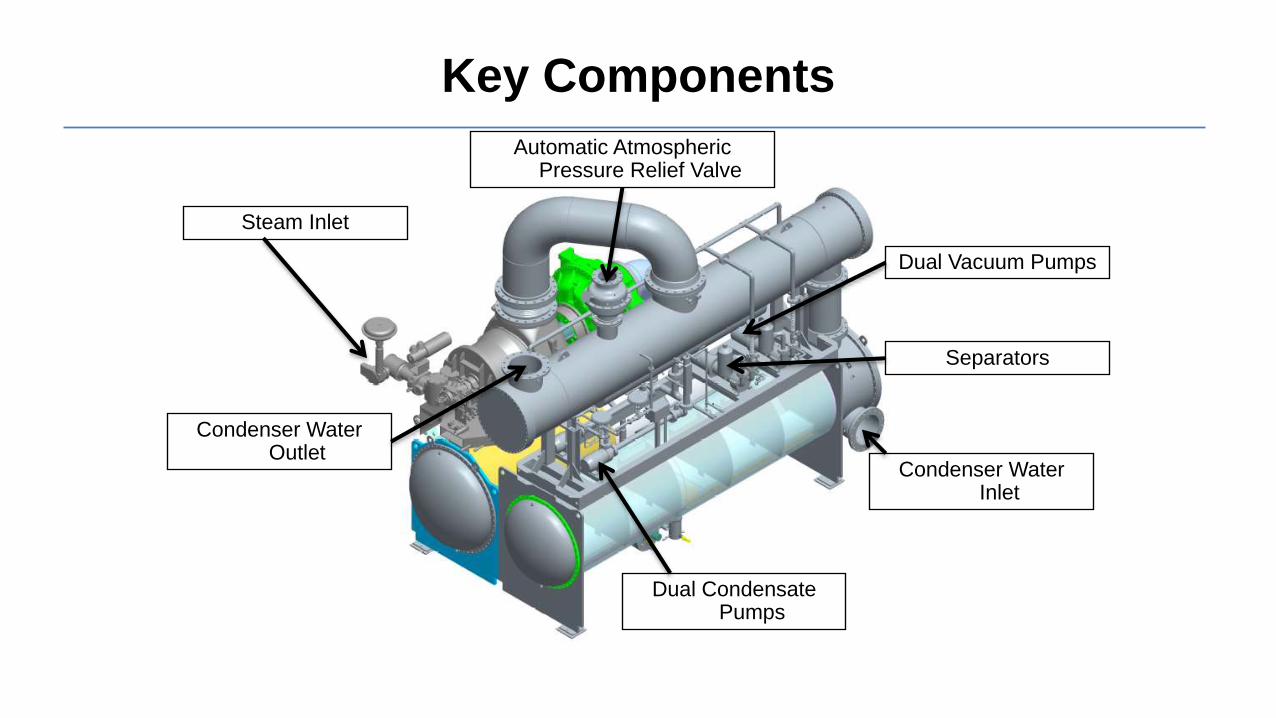
Key Components
Condenser Water Inlet
Condenser Water Outlet
Steam Inlet
Automatic Atmospheric Pressure Relief Valve
Dual Condensate Pumps
Separators
Dual Vacuum Pumps

Steam Turbine with Parallel Electric Drive

Floor Mounted Steam Turbine

Product Range
kw0 2100 4200 6300 8400 10500
0 600 1200 1800 2400 3000
600 - 2800 Tons
Tons Refrigeration

Typical Schematic – 2000 Tons
Condenser
Compressor
Steam
Steam Supply
Condensate
Wet Steam
Water
Supply
Water
Return
Evaporator
CondenserSteam
Turbine
Steam Source
3 gpm/ton, 85°F
94°F
99°F
150 psig, 366°F
42° F 97° F
50 psig
132 psig
2.8” Hg

Steam System
Exhaust Trunk
Steam Condenser
Turbine
Speed
Steam SupplyLevel
Control
Condensate ReturnCondensate Pump
Vacuum
Pump
Air Wet Steam
30-400 psigUp to 600°F
2.8” Hg
2.5” Hg 7 stages
4400 rpm

(.01/A) + (.42/B) + (.45/C) + (.12/D)
1IPLV/ =
NPLV
A = KW/Ton @ 100% Load @ 85.0 °F ECWT or 95.0 °F EDB
B = KW/Ton @ 75% Load @ 75.0 °F ECWT or 80.0 °F EDB
C = KW/Ton @ 50% Load @ 65.0 °F ECWT or 65.0 °F EDB
D = KW/Ton @ 25% Load @ 65.0 °F ECWT or 55.0 °F EDB
NPLV/IPLV Formula
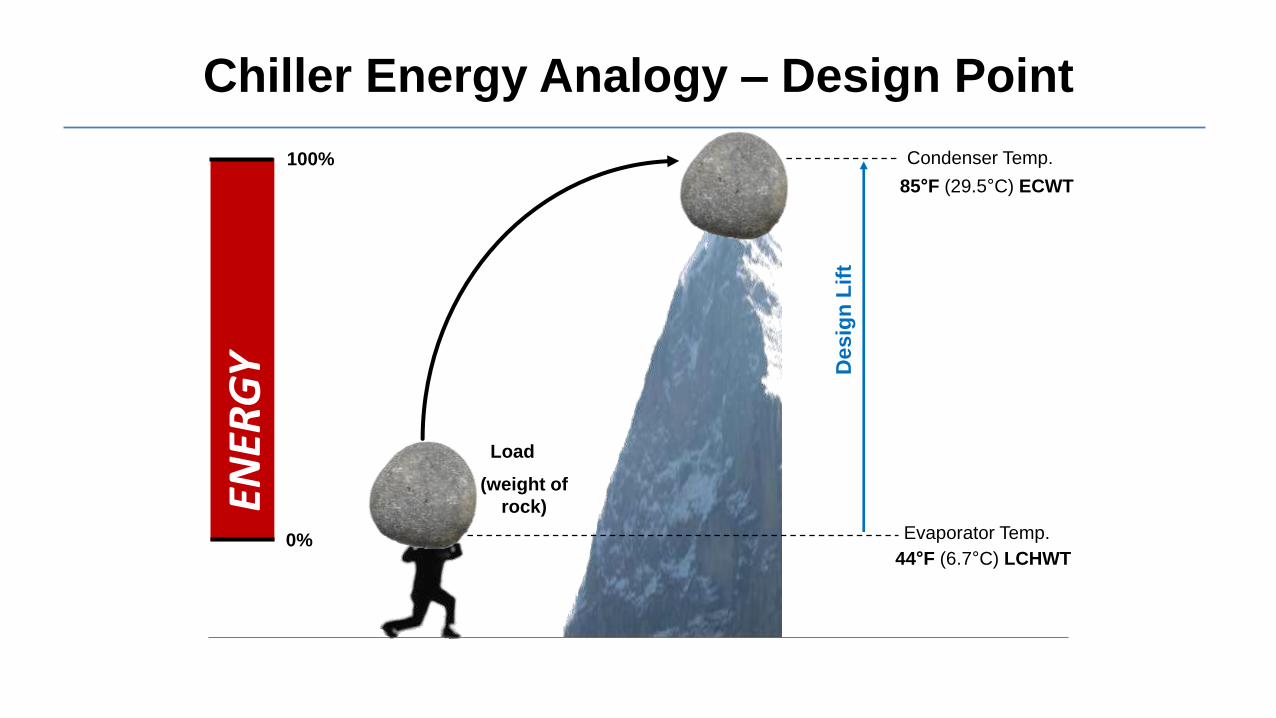
Chiller Energy Analogy – Design Point
100%
ENER
GY
0%
De
sig
n L
ift
Evaporator Temp.
Condenser Temp.
Load
(weight of
rock)
44°F (6.7°C) LCHWT
85°F (29.5°C) ECWT
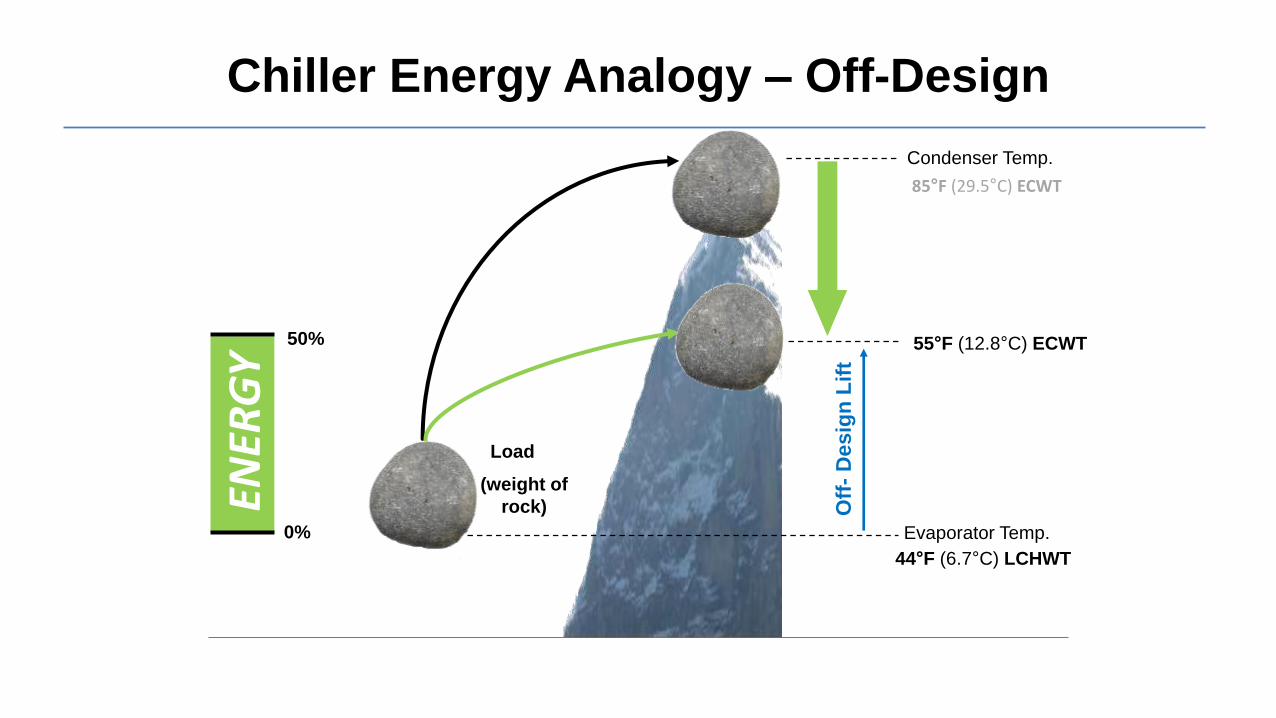
Chiller Energy Analogy – Off-Design
50%
0%
ENER
GY
Evaporator Temp.
Condenser Temp.
Off
-D
es
ign
Lif
t
Load
(weight of
rock)
55°F (12.8°C) ECWT
44°F (6.7°C) LCHWT
85°F (29.5°C) ECWT

Unloading Per AHRI
ECWT – entering condenser water temperature, COP – coefficient of performance

Unloading with Constant ECWT (85°F)
ECWT – entering condenser water temperature, COP – coefficient of performance

Vancouver Weather (ASHRAE CWEC Weather)
22
151
496
1017
127412801242
1409
1155
537
155
20 250.0
55.0
60.0
65.0
70.0
75.0
80.0
85.0
0
200
400
600
800
1000
1200
1400
1600
95
+
85
+
75
+
65
+
55
+
45
+
35
+
25
+
15
+
5+
EC
WT
(°F) A
nn
ual H
ou
rs
Dry-bulb Temperature Bins (°F)
Note: ECWT = Avg WB + 8 approach
99%

Typical Performance –
AHRI Conditions 120 psig, 350° F steam
ParameterUnit of
Measure-ment
I II III IV V VI VII
Cooling Capacity
Tons 600 900 1100 1300 1600 2000 2800
Design Steam Rate
lb/hr/ton 9.6 9.3 9 8.8 8.7 8.9 8.6
Off-Design Steam Rate
lb/hr/ton 6.5 6.4 6.1 5.9 5.8 6 5.7

Achieving 20% Higher Capacity
With Lower ECWT with a typical 3000 Ton Chiller
ECWT – entering condenser water temperature, COP – coefficient of performance
ECWTDeg F
% Design Load% Steam Rate of
Design
85 100 100
80 105% 97
75 110% 95
70 115% 94
65 118% 91.3
60 121% 91.6
55 123% 92.5
Perhaps shut off a chiller in the plant room

Variable Primary Flow
Primary Pumps
Flow Meter
Typical
load
with
two
way
valve
Automatic
Isolation Valve
Bypass

Typical Combustion Turbine CHP

33
Questions?