Embed Size (px)
Citation preview
Procedia - Social and Behavioral Sciences 64 ( 2012 ) 574 – 583
1877-0428 © 2012 Published by Elsevier Ltd. Selection and/or peer-review under responsibility of The Association Science Education and Technologydoi: 10.1016/j.sbspro.2012.11.067
INTERNATIONAL EDUCATIONAL TECHNOLOGY CONFERENCE IETC2012
Application of polynomial trend in function of determining trend growth of container traffic in the Port of Koper*
Nela Jadrijević, Ph.D. studentaMarko Tomašević, Ph.D.docentbČedomir Dundović,Ph.D. professorc, Radovan Antonić. Ph.D. professor*aUniversity of Rijeka, Faculty of Maritime Studies, Studentska ulica 2, Rijeka, 51 000, Croatia
bUniversity of Split, Faculty of Maritime Studies, Zrinsko - Frankopanska 3, Split, 21 000, CroatiacUniversity of Rijeka, Faculty of Maritime Studies, Studentska ulica 2, Rijeka, 51 000, Croatia**University of Split, Faculty of Maritime Studies, Zrinsko - Frankopanska 3, Split, 21 000, Croatia
Abstract
The subject of this paper is the movement of container traffic in the port of Koper and consequently, the comparison was made with the container traffic in the port of Rijeka and Trieste in regard with the port of Koper. Container transport has a direct impact on the general prosperity of the area of Koper and Slovenia as a whole. It is, therefore, important to identify the factors influencing the container traffic in the Koper port and calculate the polynomial trend that approximates the movement of container traffic in the port of Koper, assuming that the container traffic will be moving the same way as in the previous period. From the proposed model with the processed data over the past twelve years via polynomial trend it is possible to predict the behaviour of container traffic in the next five years.© 2012 Published by Elsevier Ltd. Selection and/or peer-review under responsibility of The Association Science Education and TechnologyKeywords: Port of Koper; container traffic; polynomial trend; explained sum of squares and residual su m of squares
1. Introduction
In the EU port system, the ports of Trieste, Koper and Rijeka have been treated as a unique port system (multi-port gateway region) which are supposed to undertake a part of the traffic flows of a unique European TENT network in the unique European transport market in the near future. In addition, these ports compete with northern Europe ports (Antwerp, Rotterdam, Bremen, Hamburg) for Central Europe
*
*Correspondng author. Tel.:+385911010946; fax: +38521380759 E-mail address: [email protected]
Available online at www.sciencedirect.com
© 2012 Published by Elsevier Ltd. Selection and/or peer-review under responsibility of The Association Science Education and Technology
575 Nela Jadrijević et al. / Procedia - Social and Behavioral Sciences 64 ( 2012 ) 574 – 583
markets as one harbour region (north Adriatic). It's worth mentioning the Black Sea transport route and the Danube corridor which will also represent an influential factor in the central European markets in the future. The purpose and goal of this research is to predict the future movements of container traffic through the port of Koper via polynomial trend of degree k.
Using the previous dynamics of container traffic movement, the movement of container traffic will be estimated via trend-polynomial of degree k in the future. The results achieved may serve as guidelines for further capital investments into port container terminal in order to avoid terminal overcapacity. The paper presents the essential features influencing the attraction of container traffic in Koper traffic route.
The case study is to determine the relevant features of container traffic, quantify the elements of dependent variable Y and independent variable X, examine the movement of container traffic in the port of Koper, evaluate the movement of container traffic in the port of Koper.
In this case, the dependent variable Y is the number of TEU units in the port of Koper, while X represents the time (the value of the independent variable). In this paper container traffic has been analysed in the port of Koper by polynomial trend of degree k. A simple regression model was used and furthermore, regression parameters were evaluated using the least squares method, which consists in determining those estimates of parameters for which the residual sum of squares reaches a minimum.
2. Investments into the Koper port infrastructure and formation of inland container terminals
In response to the growing demand for port services, the port of Koper started a financially demanding infrastructure investment cycle in 2007. Capacities of container terminal were overloaded so it was decided to extend the shores of the container terminal. Investments into expansion of the quay I and introduction of post-Panamax container cranes provide leadership in the north Adriatic ports. Such equipment and sufficient depth allow the acceptance of large container ships with more than 7.000 TEUs. Ships with increasing capacities become regular visitors to the north Adriatic ports, and in addition, the ports without necessary infrastructure for their admission will not be competitive.
The port of Koper has a strategic goal to become a leading port and logistics centre for Central and Eastern Europe countries. Accordingly, modern logistics and distribution centres were founded in Sežana, Beltinci and Arad and they are located along the main European corridors and their intersections. Container terminals in Arad have been built in collaboration with two strategic partners, the Trade Trans Invest in the Slovak Republic and Hungarian railways MAV Cargo. The terminal is located on the strategic position of the European Corridor IV and is connected by block trains to the logistics centres in Sežana, which provides growth of container traffic in the port of Koper. The expansion of inland terminals in Slovenia as well as in the east of the continent provides a good basis for optimal management of new port infrastructure in combination with more intensive participation in rail freight business. The fact that the port of Koper is in the first strategic locations opens up the possibility of diverting flows of goods to the port of Koper. Competitive advantage that the port of Koper has realized by forming a network of inland terminals has been later supported by the state.
Despite the crisis, this continues to be containerized in the Mediterranean and the Adriatic, although less intense than in previous years. One can therefore expect that the competition among ports will become more intense. Adequate infrastructure and high service levels in such conditions represent a major competitive advantage. The port of Koper plans to build a brand new container terminal with a projected annual turnover of 1 million TEUs. A major step forward and increase of traffic in the port of Koper is the result of diverting the cargo (from North European ports) to logistic and distribution centres of large multinational companies located in Central Europe. The port of Koper has a leading part in the organization of efficient railway block-trains towards the destinations in Central Europe and thus provide an advantage in container traffic in relation to Trieste and Rijeka. These are the reasons where to seek an

576 Nela Jadrijević et al. / Procedia - Social and Behavioral Sciences 64 ( 2012 ) 574 – 583
answer why Koper achieved an increase of turnover by 38% in 2010 compared to the year 2009, while Rijeka and Trieste remained at almost the same turnover.
3. Analysis of time series
The aim of the analysis of time series is to choose and evaluate the parameters of functions f(X),i.e.Υwhich will be the best way to describe the relationship between the variables X and Y. Assuming the existence of dependent (regressand) variable Y and only one independent (regressor) variable X, it is a linear regression model whose general form is:
e+f(X)=Υ or e+Υ=Υ (1)
Since the variable e expresses the residual or by the function f(X) unexplained effects arising from the statistical relation between variables X and Y, the best model will be the one that minimizes the value of the variable e.
3.1. Polynomial trend of degree k
Polynomial trend of degree k belongs to the additive models, and it is as follows:
ikik
2i210i exβxβxββ
i+++++= LΥ n,...,2,1i = (2)
iΥ -idependent (regressand, explained) variable, ix -iindependent (regressor, explanatory) variable,
k1 β,,β,β0 K - regression parameters (regression coefficients) ie - stochastic variable that denotes the unsystematic effects on the dependent variable, n- sample size [1]. The system of equations in matrix notation is as [2] follows:
e+Χβ=Υ (3)
where:
n
21
k
10
kn
2nn
k2
222
k1
211
n
21
e
ee
e,β
ββ
β,
xxx1
xxx1xxx1
Χ,y
yy
YMMMMMMM
==== (4)
Hence Y is a vector of empirical values of the dependent variable, X is the matrix of regression variable value, βis the vector of unknown parameter values, eis the vector of unknown values of random variables ie , and hence [ ] 0eΕ i = is for each i. Based on the sample it is to find the best possible estimate ,β,...,β,β k10 of the corresponding coefficients of the polynomial trend k1 β,,β,β0 K and thus determine the polynomial trend in the sample:
,xβ+...+xβ+xβ+β=Υ kik
2i2i10i n1,2,...,=i (5)

577 Nela Jadrijević et al. / Procedia - Social and Behavioral Sciences 64 ( 2012 ) 574 – 583
where iΥ stands for the value Y which is located on the best adaptive regression spline, so it's called adaptive value of Y.
Polynomial trend of the basic set and the sample is usually different, because the assessed values,β,...,β,β k10 differ from real parameter values k1 β,,β,β0 K . Vertical deviation (difference) between
real value iΥ and adaptive value iΥ is called residual and is denoted as ie [1]:
( ),kik
2i2i10iiii xβ+...+xβ+xβ+βΥ=ΥΥ=e -- (6)
The parameters estimates ,β,...,β,β k10 of the required polynomials will be given by the least squares method, so, of all possible regression splines there will be selected the one with the smallest sum of squared residuals, i.e. find minimum expression [3]:
=SQ ∑n
1=i
2ie = ( )
2n
1=iii ΥΥ∑ - = ∑∑∑
n
1=ii
n
1=i
kik
n
1=ii1 y=xβ++xβ+βn 0 L iΥ (7)
To get the mimumum expression (7), (k +1) ... partial derivative ,ˆ0β
SQ∂∂
1βSQˆ∂
∂
kβSQˆ∂
∂ equals to zero,
which leads to the system (k+1)- nonlinear equation, i.e. the system [2]:
∑∑∑n
1=ii
n
1=i
kik
n
1=ii1 y=xβ++xβ+βn 0 L
i
n
1=ii
n
1=i
1+kik
n
1=i
2i1
n
1=ii0 yx=xβ++xβ+xβ ∑∑∑∑ L ¸ (8)
i
n
1=i
ki
n
1=i
2kik
n
1=i
1+ki1
n
1=i
ki0 yx=xβ++xβ+xβ ∑∑∑∑ L
or in matrix notation:
( ) ΥΧ=βΧΧ TT • , (9)
that is:
( ) ( )ΥΧΧΧ=β T1T •- , (10)
where:
∑∑∑
∑∑∑∑∑∑∑∑
===
+
+
iki
ii
i
T
k2i
1ki
ki
2ki
2ii
kii
T
k
1
0
yx
yx
y
YΧ;
xxx
xxx
xxn
XX;
β
ββ
βM
L
MMMM
L
L
M
(11)

578 Nela Jadrijević et al. / Procedia - Social and Behavioral Sciences 64 ( 2012 ) 574 – 583
Analysis of variance of regression is obtained in the following way:
SR+SP=ST (12)
=SP ( )2n
1=ii ΥΥ∑ - = ( )ΥΧβ TT - 2Υn • (13)
=SP sum of squares of explained part of deviation of the variable value iΥ from the arithmetic mean Υ ,
where ∑=
n
1i iYΝ1
=Υ .
=SR ( )2n
=1ii ΥΥ∑ - = ( )ΥΧβΥΥ TTT - =∑
n
1=i
2iΥ - ( )ΥTΧTβ (14)
=SR sum of residual part of deviation of the variable value iΥ from Υ.
( )2n
1=ii ΥΥ=ST ∑ - = 22
i Υn-Υ∑ (15)
=ST sum of squares of total deviations of the variable value iΥ from the arithmetic mean Υ .
The representativeness of regression is measured by the coefficient of determination, which is the ratio of explained sum of squares and total sum of squares deviation. It shows how much percent of the sum of squares deviation is explained by regression model, and is obtained like this:
( )
( )∑
∑
-
-
n
1=i
2i
n
1=i
2i
2
ΥΥ
ΥΥ=R (16)
The coefficient of determination ranges in the interval 1R0 2 ≤≤ . The regression model will be more representative if 2R is closer to the unit and vice versa. It's also necessary to point out that it's a point estimate of the real determination coefficient based on the sample. That is a biased estimate of the determination coefficient of the basic set, while for the unbiased estimate one should take into account the sample size or number of degrees of freedom. The resulting coefficient of determination, called the corrected coefficient of determination and represents an asymptotic unbiased estimate of real coefficient
of determination, which is obtained as follows [3]:
2R =( )1+kn
1n1 -
-- ⋅( )2R1 - (17)
Lack of this coefficient stands in the fact that it can take even a negative value, depending on the size of the sample and determination coefficient estimate which is then meaningless.
If the sample size increases indefinitely, corrected coefficient of determination tends towards realcoefficient of determination. Below there is analysed movement of container traffic in the port of Koper

579 Nela Jadrijević et al. / Procedia - Social and Behavioral Sciences 64 ( 2012 ) 574 – 583
and furthermore approximation of the data given in Table 1 has been done so the movement of container traffic approximated generally by polynomial trend of degree k, i.e. formula (2).
Table 1. Container traffic in the ports of Rijeka, Trieste and Koper (in TEU)
Year Port of Rijeka Port of Koper Port of Trieste Total
1997 16474 66869 204318 287661
1998 14814 72826 174080 261720
1999 6866 78204 185163 270233
2000 8925 86679 206134 301738
2001 12711 100000 182379 295090
2002 15215 115000 163472 293687
2003 28205 120000 120768 268973
2004 60864 153347 131200 345411
2005 76258 179745 198319 454322
2006 94390 218970 220310 533670
2007 145040 305648 265863 716551
2008 168761 353880 335943 858584
2009 130740 343165 276957 750862
2010 137048 476731 281629 895408
Total 916311 2671064 2946535 6533910
Source: Port of Rijeka authority, Koper, Trieste
Polynomial trend of degree k was found in the example of container traffic in the port of Koper from 1997 to 2008 in the TEU (see table 2), and second-degree-polynomial was obtained.
Table 2. Calculated values of iΥ , 1,2,...,19=i for the port of Koper according to second-degree-polynomial trend in the
period from 1997 to 2015

580 Nela Jadrijević et al. / Procedia - Social and Behavioral Sciences 64 ( 2012 ) 574 – 583
Year ix iy ix iy ii yx 2iy
1997 1 66869 66869 66869 80785
1998 2 72826 145652 291304 72835
1999 3 78204 234612 703836 71277
2000 4 86679 346716 1386864 76113
2001 5 100000 500000 2500000 87342
2002 6 115000 690000 4140000 104964
2003 7 120000 840000 5880000 128978
2004 8 153347 1226776 9814208 159386
2005 9 179745 1617705 14559345 196187
2006 10 218970 2189700 21897000 239382
2007 11 305648 3362128 36983408 288969
2008 12 353880 4246560 50958720 344949
2009 13 407322
2010
2011
2012
2013
2014
2015
14
15
16
17
18
19
476089
551248
632801
720747
815085
915817
Total 1851168 15466718 149181554 5454460
Fig. 1. Second-degree-polynomial trend for the port of Koper in the period from 1999 to 2010
For the port of Koper, second-degree-polynomial trend is optimal (see figure 1), where 2R =0.976. Thus, 97.6% of the total sum of deviation squares of the variable value Υfrom the arithmetic mean is explained by using second-degree-polynomial trend, while the remaining 2.4% of the sum of squares
581 Nela Jadrijević et al. / Procedia - Social and Behavioral Sciences 64 ( 2012 ) 574 – 583
remained unexplained. Since the value of determination coefficient is very close to 1, it can be concluded that the second-degree-polynomial trend is very representative. As 2R is a biased estimate of the coefficient of determination, corrected asymptotical unbiased coefficient of determination will be calculated and will be equal to:
2R = ( )1+kn1n
1 --
- ⋅( )2R1 - = 0,970667
The coefficient ( )2R1 - is called the coefficient of alienation and represents a share of the sum of squared deviation, which is not explained by the model in total sum of squared deviations. In this case the coefficient of alienation is 0.029333.
4. The movement of container traffic in the north Adriatic ports
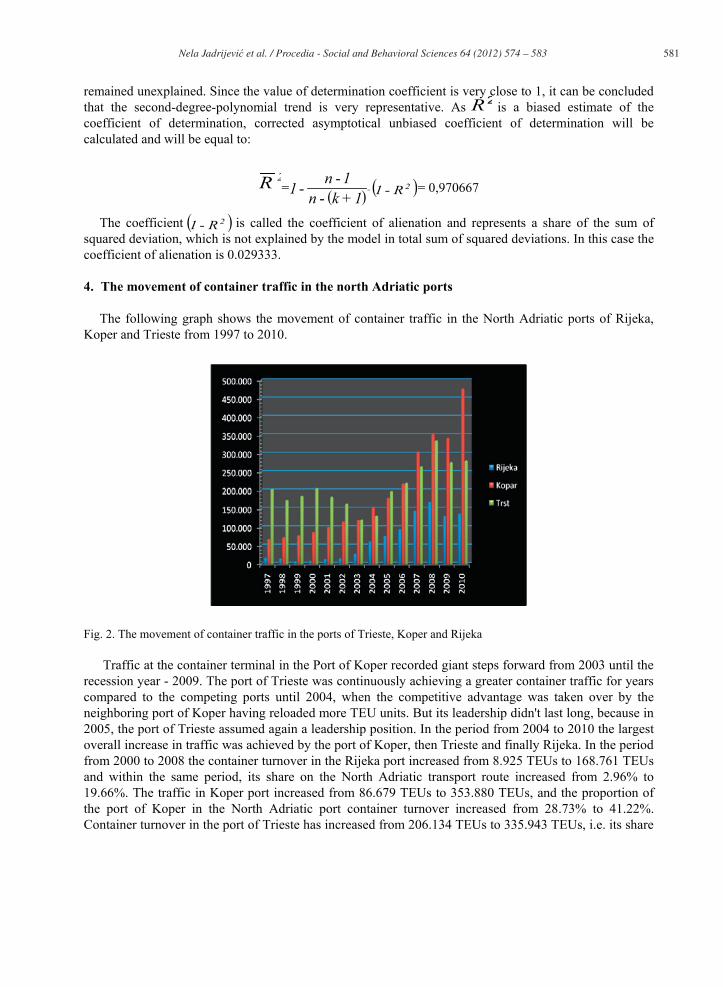
The following graph shows the movement of container traffic in the North Adriatic ports of Rijeka, Koper and Trieste from 1997 to 2010.
Fig. 2. The movement of container traffic in the ports of Trieste, Koper and Rijeka
Traffic at the container terminal in the Port of Koper recorded giant steps forward from 2003 until the recession year - 2009. The port of Trieste was continuously achieving a greater container traffic for years compared to the competing ports until 2004, when the competitive advantage was taken over by the neighboring port of Koper having reloaded more TEU units. But its leadership didn't last long, because in 2005, the port of Trieste assumed again a leadership position. In the period from 2004 to 2010 the largest overall increase in traffic was achieved by the port of Koper, then Trieste and finally Rijeka. In the period from 2000 to 2008 the container turnover in the Rijeka port increased from 8.925 TEUs to 168.761 TEUs and within the same period, its share on the North Adriatic transport route increased from 2.96% to 19.66%. The traffic in Koper port increased from 86.679 TEUs to 353.880 TEUs, and the proportion of the port of Koper in the North Adriatic port container turnover increased from 28.73% to 41.22%. Container turnover in the port of Trieste has increased from 206.134 TEUs to 335.943 TEUs, i.e. its share

582 Nela Jadrijević et al. / Procedia - Social and Behavioral Sciences 64 ( 2012 ) 574 – 583
in container turnover of North Adriatic route decreased from 68.32% to 39.13%.A noteworthy fact is that the port of Trieste was forefront in container traffic until 2004 when the port of Koper took over the leading position; however, in 2005 and 2006 the port of Trieste retook the lead and in 2007 the leadership was taken over by the port of Koper, which continued in 2010.
In comparison to 2009, Koper achieved an increase in turnover of 38% in 2010, while Rijeka and Trieste remained at almost the same traffic.
In 2010 the port of Koper achieved the container turnover of 476.731 TEU units, the port of Rijeka had a turnover of 137.048 TEU units, while the Port of Trieste made 281.629 TEU units. The port of Koper had the largest share of container traffic in the North Adriatic ports in 2010 which formed multi-port gateway region. Thus, the share of the port of Koper in the North Adriatic port container turnover is 53%, port Trieste makes 32% share and finally port Rijeka is with the lowest share of 15%.Total container turnover for the ports of Rijeka, Koper and Trieste had a drop of 2.2% in 2001 with respect to year 2000, then a slight decline from 0.47% in 2002 with respect to 2001 and a significant decrease of 8.4% in 2003 with respect to 2002, an increase of 28.4% in 2004 with respect to 2003, growth of 31.5% in 2005 with respect to 2004, and finally, from 2005 until 2008 there was an increase ranging from 17% to 34%. However, there was a decline of 12.55% in 2009 with respect to 2008 and finally, increase of turnover to 19.25% in 2010 with respect to 2009. Average growth in total turnover for all three ports in the period from 1999 to 2010 was 12%.
Within the same period, the port of Koper had a turnover growth of 11%, 15%, 15%, 4%, 28%, 17%, 22%, 39%, 16%, one drop of 3% in 2009 with respect to 2008 and eventually, an increase of 40% in 2010 with respect to 2009.
Thus, the average growth of traffic in the port of Koper from 1999 to 2010 was 18% for each year.
AcknowledgementsThe results presented in the paper have been derived from the scientific research project „New
Technologies in Diagnosis and Control of Marine Propulsion Systems“ supported by the Ministry of Science, Education and Sports of the Republic of Croatia.
Conclusion
The increase of container traffic in the port of Koper can be attributed to a number of factors, including the revival of the economy in central Europe, increasing the storage and handling capacities at the terminal Koper. The establishment of new direct services with Far East, competitive logistics services on the hinterland markets (shorter transit time, lower costs in comparison with the ports of Northwest Europe, quality cargo handling, well-organized regular rail transport of containers). The port is also connected to a feeder service to major hub ports in the Mediterranean (Gioia Tauro, Malta, Piraeus, Haifa, Taranto).
In 2010 there was a record of the highest increase of traffic at the container terminal where 476.731 container units (TEU) were overloaded. The table in Annex 1 shows that the regression analysis using data from the container traffic in TEUs from 1997 to 2008, may well predict the movement of container traffic over the next five years. The Koper port was investing for years in building roads so it is now very well connected by road and rail routes, which greatly contributes to development and prolific port business. Confidence of business partners, competitiveness, good organization and effective performance of employees have undoubtfully contributed to better results. The results achieved in container transshipment have placed the port of Koper into a circle of the most important container ports of the Adriatic. Given the current trends and forecasts about the global economy further transshipment of containers is expected to rise. However, to gain optimal results there should be provided further

583 Nela Jadrijević et al. / Procedia - Social and Behavioral Sciences 64 ( 2012 ) 574 – 583
investment into equipment and storage facilities. It has begun to rapidly grow the number of containers in the port of Koper since 2000. In the period from 2000 to 2008 the port of Koper's container traffic increased from 86.679 TEUs to 353.880 TEUs and in the same period, its share on the North Adriatic transport route increased from 28.73% to 41.22%. The total storage space at the terminal covers 180.000 m2, and the estimated annual capacity of cargo traffic is 700.000 TEUs. According to the defined model it is estimated that in 2013 container traffic would be expected to move at approximately 720.747 TEU units. Such conditions will require new investments in port infrastructure and storage facilities, which is closely related to the adoption of a new national spatial plan for the port of Koper.
The ports providing efficient and competitive services, and enjoy a favorable position will be the most successful in coping with the challenges and uncertainties brought by the global recession.
References
Hess, S. (2010). Planning the traffic demand. Rijeka: Faculty of Maritime Studies, pg. 53-55, 89
Kesić, B., Jugović, A., Poletan-Jugović T., & Perić-Hadžić A.(2008). The projection of maritime development of Croatian economy, with special reference to the possibility of cooperation with neighbouring maritime countries/ports (especially on the coast), The study, Faculty of Maritime Studies in Rijeka
Kesić, B., Jugovic, A. (2003). Rijeka traffic route. CPG, Rijeka
Kmenta, J. (1997). The principles of econometrics.Zagreb:MATE
S. Kos, D. Brčić, & Karmelić J. (2010). Structural analysis of containerisation of Croatian ports, scientific article, Maritime business, 24, 189-209
Salvatore, D.(1994). Managerial Economics. Zagreb: McGraw - Hill Inc., MATE
Dundović, Č., Poletan-Jugović. T. Jugović A., & Hess S.(2006). Integration and coordination of port and transport system of Croatia. Rijeka:University of Rijeka, Faculty of Maritime Studies
Šošic, I.(2004). Applied Statistics. Zagreb: Školska knjiga, pg. 447
Tomašević,M.(2009).Regression analysis and approximation using Čebiševljev's Polynomial, Informatology, 42, 166-172.
Tomašević, M.(2007). Statistical methods in research. Split: University of Split, Maritime Faculty, pg. 375-376
Valenčić M., Barić S., & Devčić I. (2008). Analysis of container traffic of the port of Rijeka compared to the competing ports of Koper and Trieste, Maritime Code, 45, 165-179
www.luka-kp.sihttp://www.lukarijeka.hr/hr/press_room/vijesti/brajdici_novi_kapaciteti_2012/default.aspxhttp://www.business.hr/hr/Kompanije/Vijesti/ICTSI-u-Luku-Rijeka-ulaze-70-milijuna-eurahttp://www.adriatic-gate.hr/en/news/83-ukupni-kontejnerski-promet-u-2009godini-130740-teu-a.html