Embed Size (px)
Citation preview
Abstract!
This article presents the utility of mass spectrom-etry with a MALDI ionization source in naturalproducts analysis. The advantages and drawbacksof this technique for natural products analyseswill be presented and discussed. In addition, thestructural determination of secondary metabo-lites using MALDI‑MS/MSwill be explored, whichcan guide MALDI experimental methods andstimulate new research in this area. Finally, sev-eral important approaches for MALDI data pro-cessing will be discussed.
Abbreviations!
4NA: 4-nitroaniline9-AA: 9-aminoacridineAPCI: atmospheric pressure chemical ioniza-
tionCHCA: α-cyano-4-hydroxycinnamic acidCID: collision induced disassociationDAN: 1,5-diaminonaphthalene
DHAP: 2,5-dihydroxyacetophenoneDHB: 2,5-dihydroxybenzoic acidDIT: dithranolEI: electron ionizationFAB: fast atom bombardmentFT: Fourier transformIAA: trans-3-indoleacrylic acidICR: ion cyclotron resonanceIMS: imaging mass spectrometryIT: ion trapLDI: laser desorption/ionizationLiDHB: lithium 2,4-dihydroxybenzoateHABA: 2-(4-hydroxyphenylazo)benzoic acidMALDI: matrix-assisted laser desorption/ioni-
zationNALDI: nanostructure-assisted laser desorp-
tion/ionizationPSD: post source decayQ: quadrupoleReTOF: reflectron time-of-flightSA: sinapinic acidSELDI: surface-enhanced laser desorption/
ionizationTHAP: 2,4,6-trihydroxyacetophenone
Application of MALDI Mass Spectrometryin Natural Products Analysis
Authors Ricardo Silva1, Norberto Peporine Lopes1, Denise Brentan Silva1,2
Affiliations 1 Núcleo de Pesquisa em Produtos Naturais e Sintéticos (NPPNS), Faculdade de Ciências Farmacêuticas de Ribeirão Preto,Universidade de São Paulo, Ribeirão Preto, SP, Brazil
2 Laboratório de Produtos Naturais e Espectrometria de Massas (LAPNEM), Centro de Ciências Biológicas e da Saúde (CCBS),Universidade Federal de Mato Grosso do Sul (UFMS), Campo Grande, MS, Brazil
Key wordsl" MALDIl" dereplicationl" natural productsl" fragmentationl" data processing
received May 3, 2015revised March 1, 2016accepted March 2, 2016
BibliographyDOI http://dx.doi.org/10.1055/s-0042-104800Published online April 28, 2016Planta Med 2016; 82: 671–689© Georg Thieme Verlag KGStuttgart · New York ·ISSN 0032‑0943
CorrespondenceNorberto Peporine LopesNúcleo de Pesquisa emProdutos Naturais e Sintéticos(NPPNS)Faculdade de Ciências Farma-cêuticas de Ribeirão PretoUniversidade de São PauloAvenida do Café s/n14040903 Ribeirão Preto, SPBrazilPhone: + 551636024168Fax: + [email protected]
CorrespondenceDenise Brentan SilvaLaboratório de ProdutosNaturais e Espectrometriade Massas (LAPNEM)Centro de Ciências Biológicase da Saúde (CCBS)Universidade Federal deMato Grosso do Sul (UFMS)Avenida Costa e Silva s/n79070-900 Campo Grande MSBrazilPhone: + 556733457366Fax: + [email protected]
671Reviews
Thi
s do
cum
ent w
as d
ownl
oade
d fo
r pe
rson
al u
se o
nly.
Una
utho
rized
dis
trib
utio
n is
str
ictly
pro
hibi
ted.
Introduction!
In the late 1950s, Roland Gohlke and FredMcLafferty hyphenated an EI mass spectrometeras the detector in gas chromatography [1], whichhad a tremendous influence on natural productschemistry. The impact of this innovation can bemeasured by the number of reviews written dur-ing the 1960s about the application of mass spec-trometry in natural products analysis. In the sameperiod, another technique based on laser desorp-tion/ionization mass spectrometry appeared andwas applied to the ionization of organic moleculesby irradiation with a high-intensity laser pulse.This method had a lower impact on the naturalproducts research than electron ionization be-
Silva R e
tween 1950 and 1970. Research by Michael Karasand Franz Hillenkamp led to the new and alterna-tive use of a matrix in the laser ionization processin 1987 [2]. The authors demonstrated the appli-cation of MALDI in the analysis of high-molarmass compounds by the combination of the ana-lyteʼs solubilization in an organic matrix and itsexcitation by a laser. In this process, the matrixmust have a strong absorbance at a specific wave-length and must be easily sublimated [3]. Ioniza-tion generally occurs through acid-base reactions(protonation and deprotonation) of the analyteand the matrix in a hot plume of ablated gases,but coordination and oxidation reactions mayalso occur [3,4]. Considering the chemical prop-erties of the matrix, the initial studies were dedi-
t al. Application of MALDI… Planta Med 2016; 82: 671–689
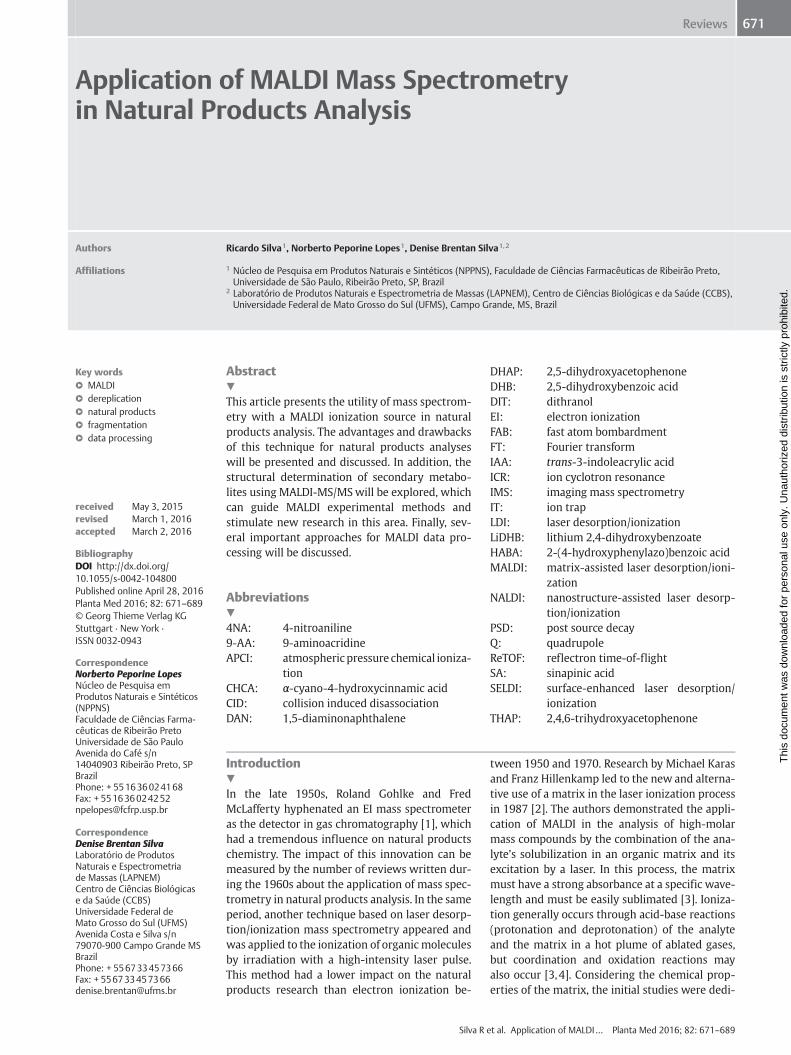
Fig. 1 Bibliographic search in Chemical Abstracts Service (CAS) bySciFinder Scholar. The terms electron ionization (EI), electrospray ionization(ESI), and matrix-assisted laser desorption/ionization (MALDI) were used askeywords in the search in a first step (A), and theywere refinedwith the termnatural products in a second step (B). (Color figure available online only.)
672 Reviews
Thi
s do
cum
ent w
as d
ownl
oade
d fo
r pe
rson
al u
se o
nly.
Una
utho
rized
dis
trib
utio
n is
str
ictly
pro
hibi
ted.
cated to biomolecules (DNA, proteins, peptides, sugars, andothers), with few applications in natural products chemistry.In 2006, Crotti and coworkers published a review that comparedthe growth of several ionization processes from 1992 to 2004 [5].At that time, ESI was greatly increasing, and the total number ofpublished studies using ESI was twice the number of those usingMALDI in 1994. The use of EI was largely constant during theanalysis period, which is likely due to the requirement of thermo-stability and volatilization of the analytes. Natural productschemistry was responsible for only 5% of all mass spectrometrypublications, and the majority of them were related to ESI [5].An update on the impact of ESI, EI, and MALDI ionization tech-niques on natural products chemistry is shown in l" Fig. 1. Thebibliographic search was of the Chemical Abstracts Service(CAS) by SciFinder Scholar (March 13th, 2015) using MALDI, ESI,and EI ionization as keywords in the first step (l" Fig. 1A). ESIapplications increased from 2004 to 2008, but the number ofarticles remained at approximately 5000 publications per yearfrom 2008 to 2014. EI exhibited a slight increase compared withthe previous compilation [5] but remained constant at approxi-mately 2500 publications per year. Conversely, MALDI publica-tions increased annually, and no stabilization was observed(l" Fig. 1A).The bibliographic search refined with the term natural productsin the second step showed another behavior (l" Fig. 1B). ESI isstill growing, but MALDI remains constant, similar to EI. Thistrend likely reflects the enormous expansion of metabolomicsstudies, which utilizes ESI [6], and the limited knowledge or per-spective of MALDI in natural products investigations. The sameeffect can be observed in a recent volume of Natural ProductsReports that was dedicated to the mass spectrometry of naturalproducts, coordinated by Pieter Dorrestein [7]. This report dis-cussed the applications and advances in the instruments, the im-
Silva R et al. Application of MALDI… Planta Med 2016; 82: 671–689
proved experimental workflows, and the important mass spec-trometry tools from the perceptive of increased performance ofstructural elucidation and natural products functional character-ization. The majority of publications were focused on new per-spectives of ESI and other atmospheric pressure ionization pro-cesses in addition to the well-established use of EI. MALDI wasonly highlighted in tissue imaging studies applications [8–10],thus confirming the tendency of uses previously discussed andpresented in l" Fig. 1. Outside the reduced focus on the MALDIapplication, various successful studies have been published onthe application of MALDI‑MS in natural products analysis, whichwill be discussed throughout this article. Therefore, significantand exciting progress inMALDI‑MS natural products applicationsis expected in the coming years.
MALDI‑MS Analyses of Natural Products!
MALDI techniqueMALDI is a soft ionization technique initially developed formacromolecule analyses, which is greatly expanding due to itsadvantages, although more research is required to understandthe processes involved, primarily the reactions in the ionizationsteps and fragmentation, especially for methods with a highenergy transfer [11–13]. Basically, the ionization processes inMALDI can be explained through three basic steps: 1) the incor-poration and isolation of analytes in a matrix, 2) the excitation ofthe matrix producing the plume by physics desorption/ablation,and 3) the ionization of the analytes by ion-molecules reactions[11–13]. There are different models that try to explain theMALDIionization process, but they are crude, and no method is univer-sally accepted. One widely discussed model is the cluster model,originally called the “lucky survivors” model. One commonagreement is the function of the matrix, which includes the iso-lation of analyte molecules, the absorption of laser energy, theco-desorption of analytes and the charge transfer. In addition,the matrix can be useful to protect the analyte molecules, reduc-ing their in-source dissociations [3].After laser energy deposition, photons from the laser are ab-sorbed by the matrix molecules and a conversion of most of theenergy to heat occurs. Subsequently, thematrix-analyte solid dis-integrates and a plume is produced, in which the secondarychemical reactions occur, promoting the ionization of the ana-lytes by charge transfer. It can be of three types: proton, electron,and cation transfer. These ion-molecule reactions happen in theplume and they are reduced significantly with the plume expan-sion, thus the secondary reactions did not run to completion andmany matrix ions are not neutralized, being observed in thespectra. The high-plume density is an important parameter to in-crease the secondary reactions and to reduce the matrix ions inthe spectra. It can be targeted by a higher laser fluence (relatedto the concentration of primary ions) [3,11–13]. Besides laser in-tensity, the secondary plume reactions can be additionally con-trolled by analyte concentration and matrix choice [3,11,12].Thematrix excitation occurs electronically by ultraviolet lasers orvibrational stages by infrared lasers. And there are different kindof used lasers in MALDI, such as nitrogen, Nd:YAG, CO2, Er:YAG,ArF, KrF, and others. The lasers work using different wavelengthsand amount of single-photon energy that influences the ioniza-tion efficiency, mainly for LDI analyses (without matrix). Themost common lasers are nitrogen (337 nm, single-photon energyof 3.6 V) and frequency-tripled Nd:YAG (355 nm, single-photon
673Reviews
Thi
s do
cum
ent w
as d
ownl
oade
d fo
r pe
rson
al u
se o
nly.
Una
utho
rized
dis
trib
utio
n is
str
ictly
pro
hibi
ted.
energy of 3.3 V). Different to the nitrogen laser, Nd:YAG has ahigher laser frequency, enabling very fast data acquisition, andthe Gaussian energy profile (not equally distributed) that couldrepresent some problems of sensitivity and resolution. However,a modified Nd:YAG laser was developed without this disadvan-tage, showing a well-structured energy profile [13–15].Moreover, the choice of mass analyzer is an important decision toget good results according its specific features, which include thefollowing: resolution, mass accuracy, mass range extension, sen-sitivity, dynamic range, quantification, speed, and handling. Themost common analyzers applied for MALDI are IT, quadrupole(Q), Orbitrap, FT‑ICR, and TOF, and there also are hybrid massspectrometers from these analyzers. As important reviews andbooks have described the analyzers [6,16,17], an extensive de-scription is not shown here, and only the special applications inthe area are reported. In addition, there are mass spectrometerscoupled to ion mobility spectrometry; an electrophoretic tech-nique that separates the ions based on their mobilities in the gasphase, allowing the chemical study of conformations, separationof isomers, and isobars ions. The ion mobility spectrometry is atheme of many review articles, describing the mass spectrome-ters available, their advantages, and disadvantages [18,19].Different conventional matrices have been used for several pur-poses, such as DHB, CHCA, DHAP, SA, 4NA, THAP, nicotinic acid,picolinic acid, ferulic acid, and others, but fewmatrices were wellcharacterized and many points are still unclear, for example, adeep explanation about their efficiencies, the chemical speciesproduced in the plume for each matrix, and the informationabout the physics and chemistry properties of plume expansionand reactions [12,20]. The good features for matrices are linkedto their solubility, absorptivity, reactivity, volatility, and desorp-tion and a considerable number of reports provide details onpreparation methods of different matrices, which includes drieddroplet, crushed crystal, fast evaporation, overlayer method, spincoating, and electrospray [20]. Some matrices have known appli-cations, such as for oligonucleotides, proteins, lipids, polymers,and carbohydrates (l" Table 1), while indication guides for specif-ic natural product classes have not been reported [11] that stim-ulates more studies in this area, since there are innumerous ad-vantages of MALDI (described on next item). The main analysesof natural products by MALDI, including the applied matrices,are summarized in l" Tables 1 and 2. Another important pointfor choice matrix is variable amounts of energy are transferredto analytes, which depends on the matrix and can represent dif-ferent effects on ion fragmentation due to changes of their inter-nal energy [21], but these effects are underexplored, mainly fornatural products.LDI analyses without a matrix have also been described, mainlyfor conjugated compounds, which is possible for ionization with-out a matrix since they can absorb the laser radiation. Some nat-ural products were already analyzed by LDI, such as flavonoidsand carotenoids, but the role of the matrix is fundamental in re-ducing the in-source dissociation as well as increasing the effi-ciency of ionization and thereby increasing sensitivity [22,23],as confirmed in the investigation of ionization and in-source dis-sociation of twenty-six flavonoids [22] and others studies (sec-tion Application – for more examples and details).
Drawbacks and advantagesThe main disadvantages reported for MALDI analyses include thebackground matrix ions, which are observed in the mass rangeused for small compounds (< 1000 Da), the possibility of sample
photodegradation, the in-source dissociations of analytes, andthe difficulty in working on line with liquid chromatography,which is not yet commonly applied but yields additional infor-mation about isomers [6,11]. Some alternatives have been de-scribed to reduce this background, for example, carbon nano-tubes, ionic liquids, graphene, surfactants with traditional matri-ces, and a low proportion of matrix (matrix:analyte) [24–26]. Inaddition, there have been great efforts to reduce the fragmenta-tion of analytes in the source [22]. This information is relevantfor improving MALDI results and applications in many studyareas, such as metabolomics, dereplication, quantification, bio-logical fingerprinting analyses, and IMS, stimulating its utility innatural products research. The low reproducibility is anotherdrawback already reported, but several approaches have beendescribed to improve it, many of which are related to crystal ho-mogeneity in different matrices, sample preparation methods,and/or increasing the number of runs per sample [24,26–30].The methods to improve the cocrystallization of the analyte-ma-trix mixture include procedures such as fast evaporation prepa-ration, electrospray sample deposition, and others [6,26,31,32].So MALDI has also been successfully applied to quantitative stud-ies for alkaloids [33–35], anthocyanins [36–38], flavonoids [39],acetogenins [40], spirolides [41], curcuminoids [42], and rote-noids [43].From new technologies overcoming the bottlenecks of MALDIanalyses, the scientific community can have access to all its ben-efits and the application of it can be enlarged in the natural prod-ucts area, mainly because the MALDI technique exhibits severaladvantages. They include the ability to analyze complexmixtureswith less ion suppression compared to ESI, high sensitivity, hightolerance of salts and contaminants, low sample consumption,high throughput, simple and rapid sample preparation, low timeconsumption to obtain the spectra (≈ 60 s), and the production ofsingly charged species [6,27].
ApplicationsMALDI‑MS has been applied to determine the molecular weightof some natural products, to identify the chemical structures, aswell as for metabolomic studies, quantification and others, how-ever, recently it has also been used to establish tissue distributionof the metabolites by MALDI imaging [6,25,27,31] (l" Fig. 2).Although there are several applications of MALDI in natural prod-ucts chemistry, the higher number of published articles is relatedto its use for molecular weight determination by lowor high reso-lution. Several glycosylated and non-glycosylated secondary me-tabolites havebeen analyzed, suchas hydrolysable and condensedtannins, anthocyanins, alkaloids, flavonoids, saponins, rotenoids,carotenoids, xanthophylls, glycosylated triterpenes, theaflavins,thearubigins, phenolics, sesquiterpene lactones, steroids, diter-penes, sesterterpenes, cyanogenic glycosides, and others(l" Fig. 3, Table 2) [22,23,36,37,44–49], demonstrating its hugeapplicability and ability to analyze secondarymetabolites. Amongglycosides analyzed by MALDI‑MS from the period 1999 to 2010[44–49], saponins, steroids, triterpenes, and flavonoids are theglycosylatedmetabolites predominantly described (l" Fig. 4).New studies have shown successful applications of MALDI formetabolic profiling in comparison to other techniques [27,50,51], for example, the analyses of fractions from Psoralea corylifo-lia L. (Fabaceae). They were analyzed by different analyticalmethods, such as LC‑DAD, LC-APCI‑MS, and MALDI‑TOF MS, withthe use of oxidized carbon nanotubes as the matrix. The LC-APCI-MS increased the number of detected substances compared to
Silva R et al. Application of MALDI… Planta Med 2016; 82: 671–689
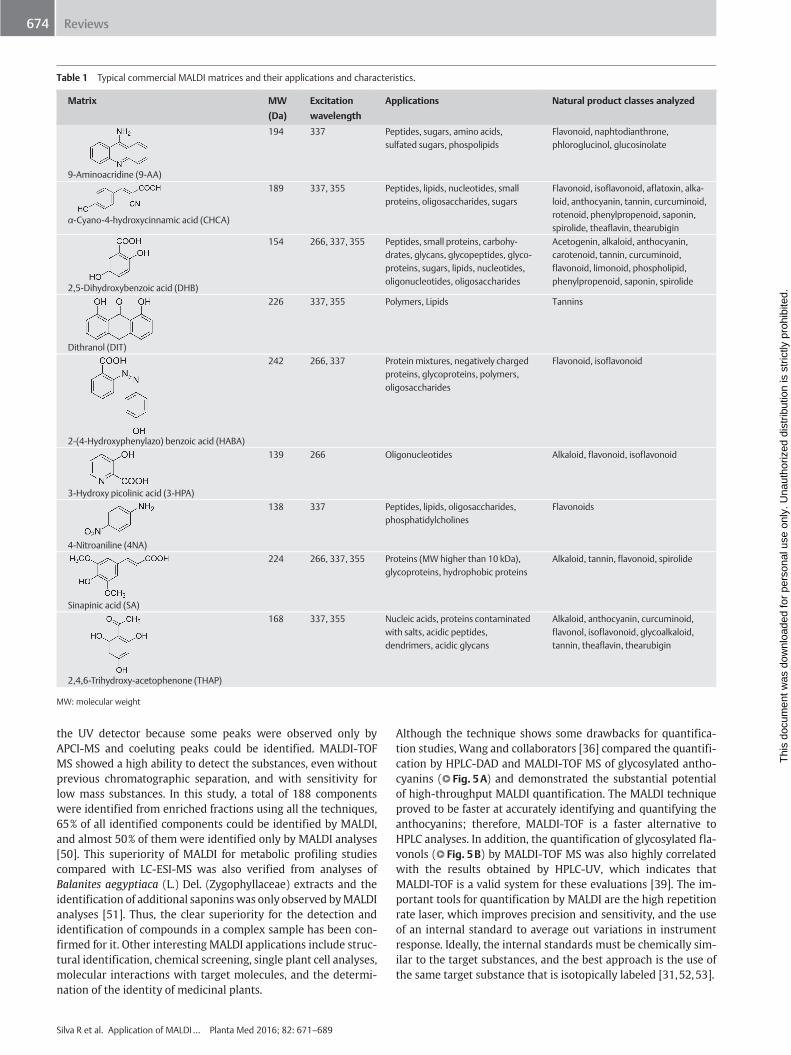
Table 1 Typical commercial MALDI matrices and their applications and characteristics.
Matrix MW
(Da)
Excitation
wavelength
Applications Natural product classes analyzed
9-Aminoacridine (9-AA)
194 337 Peptides, sugars, amino acids,sulfated sugars, phospolipids
Flavonoid, naphtodianthrone,phloroglucinol, glucosinolate
α-Cyano-4-hydroxycinnamic acid (CHCA)
189 337, 355 Peptides, lipids, nucleotides, smallproteins, oligosaccharides, sugars
Flavonoid, isoflavonoid, aflatoxin, alka-loid, anthocyanin, tannin, curcuminoid,rotenoid, phenylpropenoid, saponin,spirolide, theaflavin, thearubigin
2,5-Dihydroxybenzoic acid (DHB)
154 266, 337, 355 Peptides, small proteins, carbohy-drates, glycans, glycopeptides, glyco-proteins, sugars, lipids, nucleotides,oligonucleotides, oligosaccharides
Acetogenin, alkaloid, anthocyanin,carotenoid, tannin, curcuminoid,flavonoid, limonoid, phospholipid,phenylpropenoid, saponin, spirolide
Dithranol (DIT)
226 337, 355 Polymers, Lipids Tannins
2-(4-Hydroxyphenylazo) benzoic acid (HABA)
242 266, 337 Proteinmixtures, negatively chargedproteins, glycoproteins, polymers,oligosaccharides
Flavonoid, isoflavonoid
3-Hydroxy picolinic acid (3-HPA)
139 266 Oligonucleotides Alkaloid, flavonoid, isoflavonoid
4-Nitroaniline (4NA)
138 337 Peptides, lipids, oligosaccharides,phosphatidylcholines
Flavonoids
Sinapinic acid (SA)
224 266, 337, 355 Proteins (MW higher than 10 kDa),glycoproteins, hydrophobic proteins
Alkaloid, tannin, flavonoid, spirolide
2,4,6-Trihydroxy-acetophenone (THAP)
168 337, 355 Nucleic acids, proteins contaminatedwith salts, acidic peptides,dendrimers, acidic glycans
Alkaloid, anthocyanin, curcuminoid,flavonol, isoflavonoid, glycoalkaloid,tannin, theaflavin, thearubigin
MW: molecular weight
674 Reviews
Thi
s do
cum
ent w
as d
ownl
oade
d fo
r pe
rson
al u
se o
nly.
Una
utho
rized
dis
trib
utio
n is
str
ictly
pro
hibi
ted.
the UV detector because some peaks were observed only byAPCI-MS and coeluting peaks could be identified. MALDI‑TOFMS showed a high ability to detect the substances, even withoutprevious chromatographic separation, and with sensitivity forlow mass substances. In this study, a total of 188 componentswere identified from enriched fractions using all the techniques,65% of all identified components could be identified by MALDI,and almost 50% of them were identified only by MALDI analyses[50]. This superiority of MALDI for metabolic profiling studiescompared with LC‑ESI‑MS was also verified from analyses ofBalanites aegyptiaca (L.) Del. (Zygophyllaceae) extracts and theidentification of additional saponinswas only observed byMALDIanalyses [51]. Thus, the clear superiority for the detection andidentification of compounds in a complex sample has been con-firmed for it. Other interesting MALDI applications include struc-tural identification, chemical screening, single plant cell analyses,molecular interactions with target molecules, and the determi-nation of the identity of medicinal plants.
Silva R et al. Application of MALDI… Planta Med 2016; 82: 671–689
Although the technique shows some drawbacks for quantifica-tion studies, Wang and collaborators [36] compared the quantifi-cation by HPLC‑DAD and MALDI‑TOF MS of glycosylated antho-cyanins (l" Fig. 5A) and demonstrated the substantial potentialof high-throughput MALDI quantification. The MALDI techniqueproved to be faster at accurately identifying and quantifying theanthocyanins; therefore, MALDI‑TOF is a faster alternative toHPLC analyses. In addition, the quantification of glycosylated fla-vonols (l" Fig. 5B) by MALDI‑TOF MS was also highly correlatedwith the results obtained by HPLC‑UV, which indicates thatMALDI-TOF is a valid system for these evaluations [39]. The im-portant tools for quantification by MALDI are the high repetitionrate laser, which improves precision and sensitivity, and the useof an internal standard to average out variations in instrumentresponse. Ideally, the internal standards must be chemically sim-ilar to the target substances, and the best approach is the use ofthe same target substance that is isotopically labeled [31,52,53].
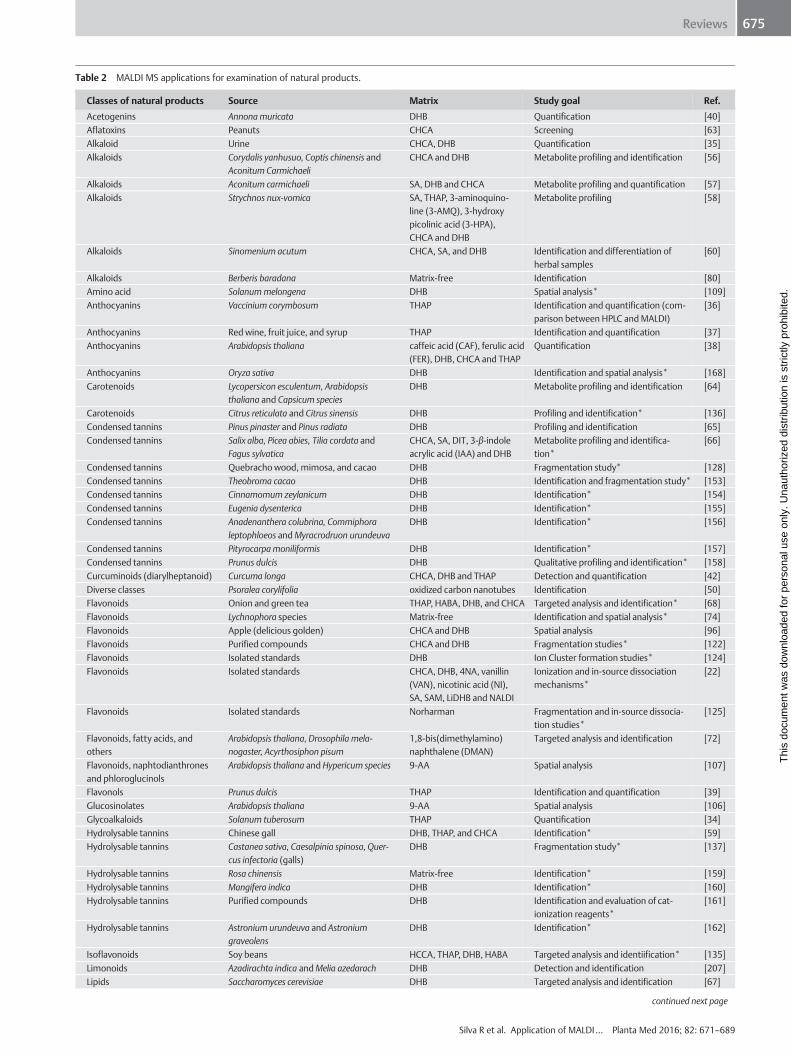
Table 2 MALDI MS applications for examination of natural products.
Classes of natural products Source Matrix Study goal Ref.
Acetogenins Annonamuricata DHB Quantification [40]
Aflatoxins Peanuts CHCA Screening [63]
Alkaloid Urine CHCA, DHB Quantification [35]
Alkaloids Corydalis yanhusuo, Coptis chinensis andAconitum Carmichaeli
CHCA and DHB Metabolite profiling and identification [56]
Alkaloids Aconitum carmichaeli SA, DHB and CHCA Metabolite profiling and quantification [57]
Alkaloids Strychnos nux-vomica SA, THAP, 3-aminoquino-line (3-AMQ), 3-hydroxypicolinic acid (3-HPA),CHCA and DHB
Metabolite profiling [58]
Alkaloids Sinomenium acutum CHCA, SA, and DHB Identification and differentiation ofherbal samples
[60]
Alkaloids Berberis baradana Matrix-free Identification [80]
Amino acid Solanummelongena DHB Spatial analysis* [109]
Anthocyanins Vaccinium corymbosum THAP Identification and quantification (com-parison between HPLC andMALDI)
[36]
Anthocyanins Red wine, fruit juice, and syrup THAP Identification and quantification [37]
Anthocyanins Arabidopsis thaliana caffeic acid (CAF), ferulic acid(FER), DHB, CHCA and THAP
Quantification [38]
Anthocyanins Oryza sativa DHB Identification and spatial analysis* [168]
Carotenoids Lycopersicon esculentum, Arabidopsisthaliana and Capsicum species
DHB Metabolite profiling and identification [64]
Carotenoids Citrus reticulata and Citrus sinensis DHB Profiling and identification* [136]
Condensed tannins Pinus pinaster and Pinus radiata DHB Profiling and identification [65]
Condensed tannins Salix alba, Picea abies, Tilia cordata andFagus sylvatica
CHCA, SA, DIT, 3-β-indoleacrylic acid (IAA) and DHB
Metabolite profiling and identifica-tion*
[66]
Condensed tannins Quebrachowood, mimosa, and cacao DHB Fragmentation study* [128]
Condensed tannins Theobroma cacao DHB Identification and fragmentation study* [153]
Condensed tannins Cinnamomum zeylanicum DHB Identification* [154]
Condensed tannins Eugenia dysenterica DHB Identification* [155]
Condensed tannins Anadenanthera colubrina, Commiphoraleptophloeos andMyracrodruon urundeuva
DHB Identification* [156]
Condensed tannins Pityrocarpa moniliformis DHB Identification* [157]
Condensed tannins Prunus dulcis DHB Qualitative profiling and identification* [158]
Curcuminoids (diarylheptanoid) Curcuma longa CHCA, DHB and THAP Detection and quantification [42]
Diverse classes Psoralea corylifolia oxidized carbon nanotubes Identification [50]
Flavonoids Onion and green tea THAP, HABA, DHB, and CHCA Targeted analysis and identification* [68]
Flavonoids Lychnophora species Matrix-free Identification and spatial analysis* [74]
Flavonoids Apple (delicious golden) CHCA and DHB Spatial analysis [96]
Flavonoids Purified compounds CHCA and DHB Fragmentation studies* [122]
Flavonoids Isolated standards DHB Ion Cluster formation studies* [124]
Flavonoids Isolated standards CHCA, DHB, 4NA, vanillin(VAN), nicotinic acid (NI),SA, SAM, LiDHB and NALDI
Ionization and in-source dissociationmechanisms*
[22]
Flavonoids Isolated standards Norharman Fragmentation and in-source dissocia-tion studies*
[125]
Flavonoids, fatty acids, andothers
Arabidopsis thaliana, Drosophila mela-nogaster, Acyrthosiphon pisum
1,8-bis(dimethylamino)naphthalene (DMAN)
Targeted analysis and identification [72]
Flavonoids, naphtodianthronesand phloroglucinols
Arabidopsis thaliana and Hypericum species 9-AA Spatial analysis [107]
Flavonols Prunus dulcis THAP Identification and quantification [39]
Glucosinolates Arabidopsis thaliana 9-AA Spatial analysis [106]
Glycoalkaloids Solanum tuberosum THAP Quantification [34]
Hydrolysable tannins Chinese gall DHB, THAP, and CHCA Identification* [59]
Hydrolysable tannins Castanea sativa, Caesalpinia spinosa, Quer-cus infectoria (galls)
DHB Fragmentation study* [137]
Hydrolysable tannins Rosa chinensis Matrix-free Identification* [159]
Hydrolysable tannins Mangifera indica DHB Identification* [160]
Hydrolysable tannins Purified compounds DHB Identification and evaluation of cat-ionization reagents*
[161]
Hydrolysable tannins Astronium urundeuva and Astroniumgraveolens
DHB Identification* [162]
Isoflavonoids Soy beans HCCA, THAP, DHB, HABA Targeted analysis and identiification* [135]
Limonoids Azadirachta indica andMelia azedarach DHB Detection and identification [207]
Lipids Saccharomyces cerevisiae DHB Targeted analysis and identification [67]
continued next page
675
Silva R et al. Application of MALDI… Planta Med 2016; 82: 671–689
Reviews
Thi
s do
cum
ent w
as d
ownl
oade
d fo
r pe
rson
al u
se o
nly.
Una
utho
rized
dis
trib
utio
n is
str
ictly
pro
hibi
ted.
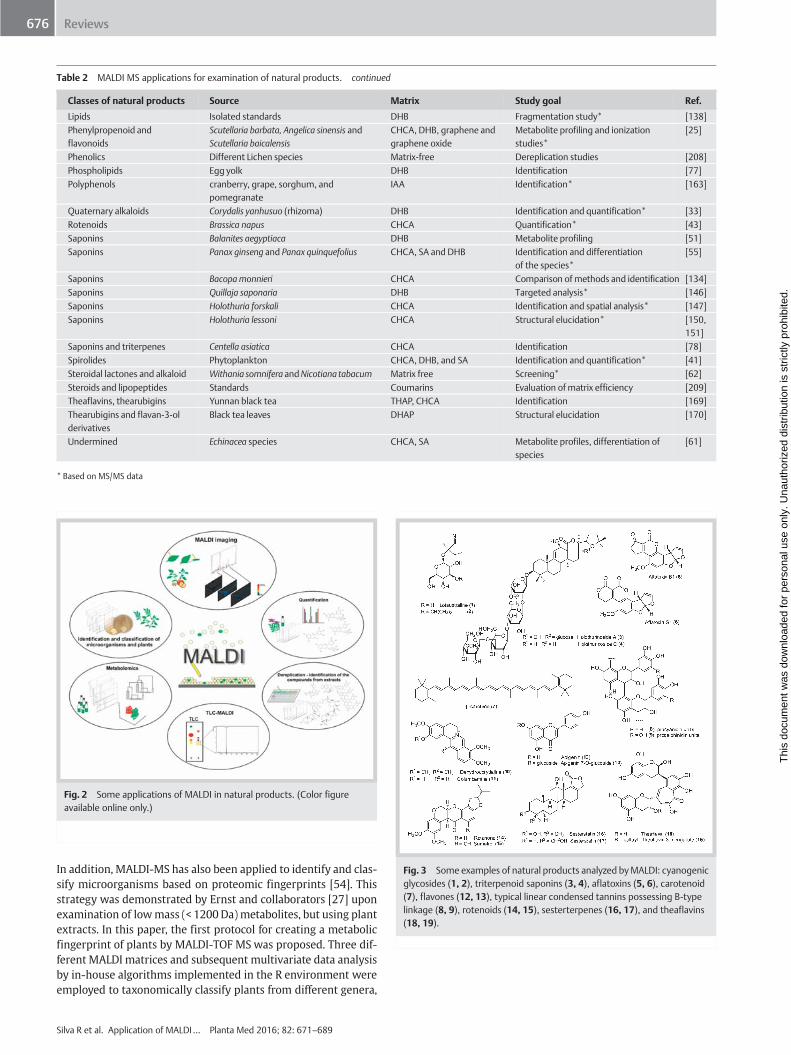
Table 2 MALDI MS applications for examination of natural products. continued
Classes of natural products Source Matrix Study goal Ref.
Lipids Isolated standards DHB Fragmentation study* [138]
Phenylpropenoid andflavonoids
Scutellaria barbata, Angelica sinensis andScutellaria baicalensis
CHCA, DHB, graphene andgraphene oxide
Metabolite profiling and ionizationstudies*
[25]
Phenolics Different Lichen species Matrix-free Dereplication studies [208]
Phospholipids Egg yolk DHB Identification [77]
Polyphenols cranberry, grape, sorghum, andpomegranate
IAA Identification* [163]
Quaternary alkaloids Corydalis yanhusuo (rhizoma) DHB Identification and quantification* [33]
Rotenoids Brassica napus CHCA Quantification* [43]
Saponins Balanites aegyptiaca DHB Metabolite profiling [51]
Saponins Panax ginseng and Panax quinquefolius CHCA, SA and DHB Identification and differentiationof the species*
[55]
Saponins Bacopamonnieri CHCA Comparison ofmethods and identification [134]
Saponins Quillaja saponaria DHB Targeted analysis* [146]
Saponins Holothuria forskali CHCA Identification and spatial analysis* [147]
Saponins Holothuria lessoni CHCA Structural elucidation* [150,151]
Saponins and triterpenes Centella asiatica CHCA Identification [78]
Spirolides Phytoplankton CHCA, DHB, and SA Identification and quantification* [41]
Steroidal lactones and alkaloid Withania somnifera andNicotiana tabacum Matrix free Screening* [62]
Steroids and lipopeptides Standards Coumarins Evaluation ofmatrix efficiency [209]
Theaflavins, thearubigins Yunnan black tea THAP, CHCA Identification [169]
Thearubigins and flavan-3-olderivatives
Black tea leaves DHAP Structural elucidation [170]
Undermined Echinacea species CHCA, SA Metabolite profiles, differentiation ofspecies
[61]
* Based on MS/MS data
Fig. 3 Some examples of natural products analyzed byMALDI: cyanogenicglycosides (1, 2), triterpenoid saponins (3, 4), aflatoxins (5, 6), carotenoid(7), flavones (12, 13), typical linear condensed tannins possessing B-typelinkage (8, 9), rotenoids (14, 15), sesterterpenes (16, 17), and theaflavins(18, 19).
Fig. 2 Some applications of MALDI in natural products. (Color figureavailable online only.)
676 Reviews
Thi
s do
cum
ent w
as d
ownl
oade
d fo
r pe
rson
al u
se o
nly.
Una
utho
rized
dis
trib
utio
n is
str
ictly
pro
hibi
ted.
In addition, MALDI‑MS has also been applied to identify and clas-sify microorganisms based on proteomic fingerprints [54]. Thisstrategy was demonstrated by Ernst and collaborators [27] uponexamination of lowmass (< 1200Da)metabolites, but using plantextracts. In this paper, the first protocol for creating a metabolicfingerprint of plants by MALDI‑TOF MSwas proposed. Three dif-ferent MALDI matrices and subsequent multivariate data analysisby in-house algorithms implemented in the R environment wereemployed to taxonomically classify plants from different genera,
Silva R et al. Application of MALDI… Planta Med 2016; 82: 671–689
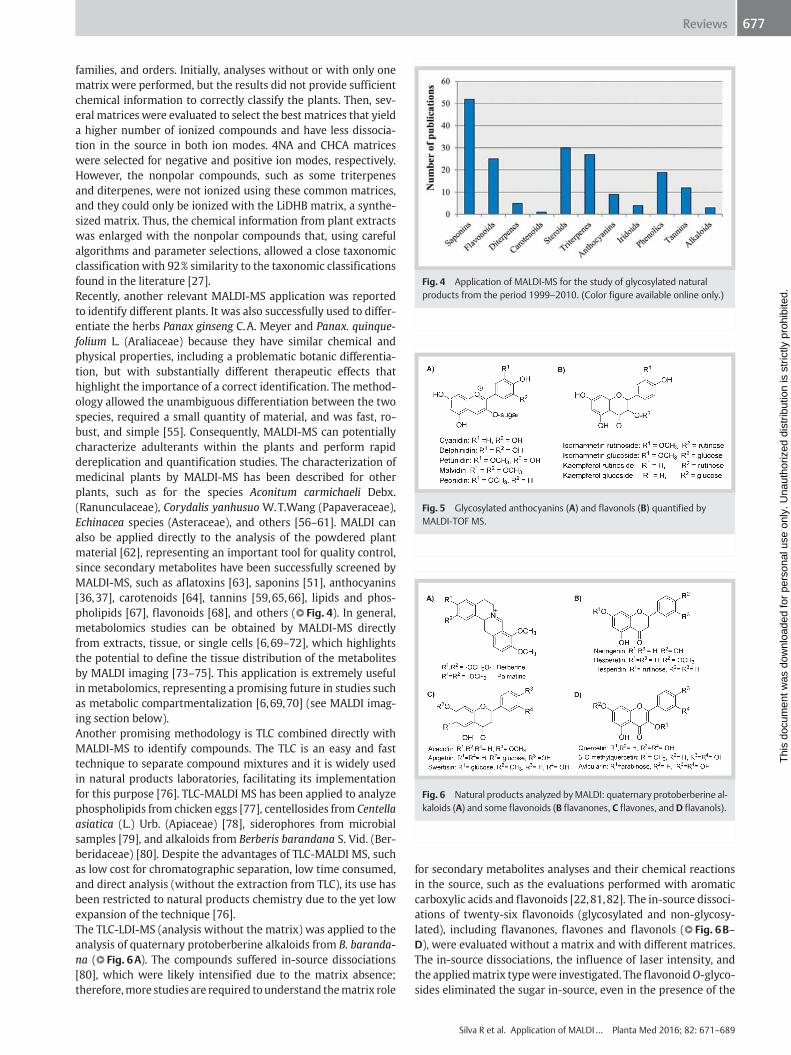
Fig. 6 Natural products analyzed byMALDI: quaternary protoberberine al-kaloids (A) and some flavonoids (B flavanones, C flavones, and D flavanols).
Fig. 4 Application of MALDI‑MS for the study of glycosylated naturalproducts from the period 1999–2010. (Color figure available online only.)
Fig. 5 Glycosylated anthocyanins (A) and flavonols (B) quantified byMALDI‑TOF MS.
677Reviews
Thi
s do
cum
ent w
as d
ownl
oade
d fo
r pe
rson
al u
se o
nly.
Una
utho
rized
dis
trib
utio
n is
str
ictly
pro
hibi
ted.
families, and orders. Initially, analyses without or with only onematrix were performed, but the results did not provide sufficientchemical information to correctly classify the plants. Then, sev-eral matrices were evaluated to select the best matrices that yielda higher number of ionized compounds and have less dissocia-tion in the source in both ion modes. 4NA and CHCA matriceswere selected for negative and positive ion modes, respectively.However, the nonpolar compounds, such as some triterpenesand diterpenes, were not ionized using these common matrices,and they could only be ionized with the LiDHB matrix, a synthe-sized matrix. Thus, the chemical information from plant extractswas enlarged with the nonpolar compounds that, using carefulalgorithms and parameter selections, allowed a close taxonomicclassification with 92% similarity to the taxonomic classificationsfound in the literature [27].Recently, another relevant MALDI‑MS application was reportedto identify different plants. It was also successfully used to differ-entiate the herbs Panax ginseng C.A. Meyer and Panax. quinque-folium L. (Araliaceae) because they have similar chemical andphysical properties, including a problematic botanic differentia-tion, but with substantially different therapeutic effects thathighlight the importance of a correct identification. The method-ology allowed the unambiguous differentiation between the twospecies, required a small quantity of material, and was fast, ro-bust, and simple [55]. Consequently, MALDI‑MS can potentiallycharacterize adulterants within the plants and perform rapiddereplication and quantification studies. The characterization ofmedicinal plants by MALDI‑MS has been described for otherplants, such as for the species Aconitum carmichaeli Debx.(Ranunculaceae), Corydalis yanhusuo W.T.Wang (Papaveraceae),Echinacea species (Asteraceae), and others [56–61]. MALDI canalso be applied directly to the analysis of the powdered plantmaterial [62], representing an important tool for quality control,since secondary metabolites have been successfully screened byMALDI‑MS, such as aflatoxins [63], saponins [51], anthocyanins[36,37], carotenoids [64], tannins [59,65,66], lipids and phos-pholipids [67], flavonoids [68], and others (l" Fig. 4). In general,metabolomics studies can be obtained by MALDI‑MS directlyfrom extracts, tissue, or single cells [6,69–72], which highlightsthe potential to define the tissue distribution of the metabolitesby MALDI imaging [73–75]. This application is extremely usefulin metabolomics, representing a promising future in studies suchas metabolic compartmentalization [6,69,70] (see MALDI imag-ing section below).Another promising methodology is TLC combined directly withMALDI‑MS to identify compounds. The TLC is an easy and fasttechnique to separate compound mixtures and it is widely usedin natural products laboratories, facilitating its implementationfor this purpose [76]. TLC-MALDI MS has been applied to analyzephospholipids from chicken eggs [77], centellosides from Centellaasiatica (L.) Urb. (Apiaceae) [78], siderophores from microbialsamples [79], and alkaloids from Berberis barandana S. Vid. (Ber-beridaceae) [80]. Despite the advantages of TLC-MALDI MS, suchas low cost for chromatographic separation, low time consumed,and direct analysis (without the extraction from TLC), its use hasbeen restricted to natural products chemistry due to the yet lowexpansion of the technique [76].The TLC‑LDI‑MS (analysis without the matrix) was applied to theanalysis of quaternary protoberberine alkaloids from B. baranda-na (l" Fig. 6A). The compounds suffered in-source dissociations[80], which were likely intensified due to the matrix absence;therefore,more studies are required tounderstand thematrix role
for secondary metabolites analyses and their chemical reactionsin the source, such as the evaluations performed with aromaticcarboxylic acids and flavonoids [22,81,82]. The in-source dissoci-ations of twenty-six flavonoids (glycosylated and non-glycosy-lated), including flavanones, flavones and flavonols (l" Fig. 6B–D), were evaluated without a matrix and with different matrices.The in-source dissociations, the influence of laser intensity, andthe appliedmatrix typewere investigated. The flavonoidO-glyco-sides eliminated the sugar in-source, even in the presence of the
Silva R et al. Application of MALDI… Planta Med 2016; 82: 671–689
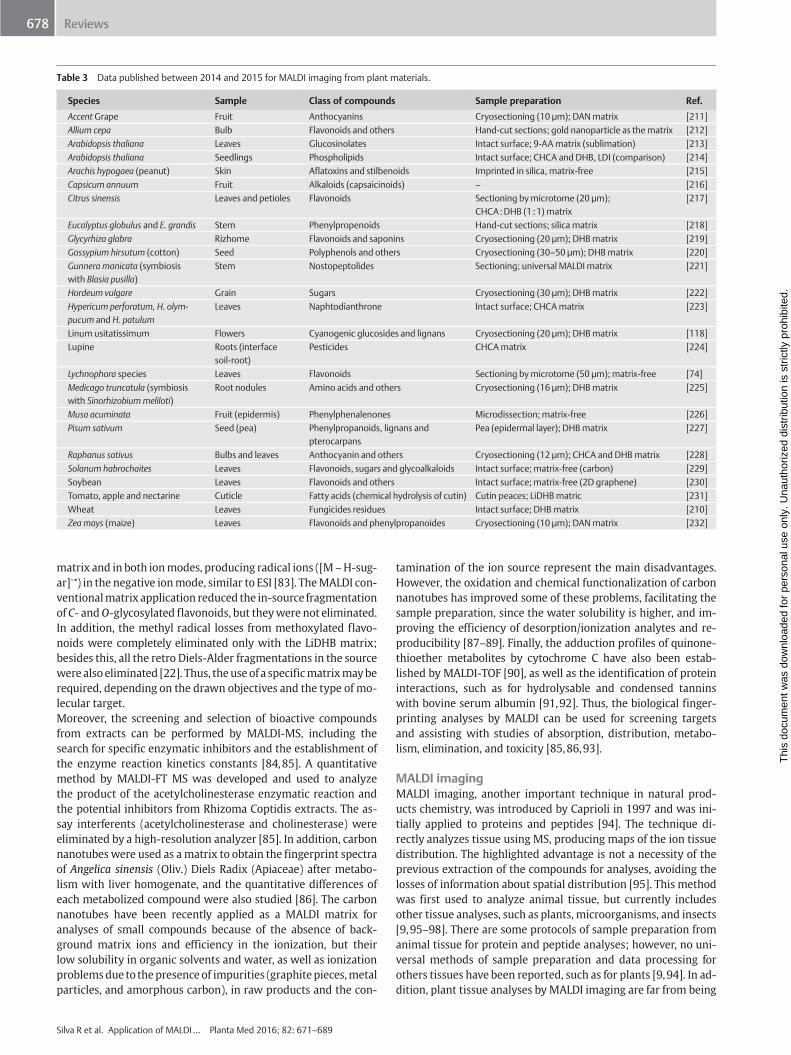
Table 3 Data published between 2014 and 2015 for MALDI imaging from plant materials.
Species Sample Class of compounds Sample preparation Ref.
Accent Grape Fruit Anthocyanins Cryosectioning (10 µm); DANmatrix [211]
Allium cepa Bulb Flavonoids and others Hand-cut sections; gold nanoparticle as thematrix [212]
Arabidopsis thaliana Leaves Glucosinolates Intact surface; 9-AAmatrix (sublimation) [213]
Arabidopsis thaliana Seedlings Phospholipids Intact surface; CHCA and DHB, LDI (comparison) [214]
Arachis hypogaea (peanut) Skin Aflatoxins and stilbenoids Imprinted in silica, matrix-free [215]
Capsicum annuum Fruit Alkaloids (capsaicinoids) – [216]
Citrus sinensis Leaves and petioles Flavonoids Sectioning bymicrotome (20 µm);CHCA:DHB (1 :1) matrix
[217]
Eucalyptus globulus and E. grandis Stem Phenylpropenoids Hand-cut sections; silica matrix [218]
Glycyrhiza glabra Rizhome Flavonoids and saponins Cryosectioning (20 µm); DHBmatrix [219]
Gossypium hirsutum (cotton) Seed Polyphenols and others Cryosectioning (30–50 µm); DHBmatrix [220]
Gunnera manicata (symbiosiswith Blasia pusilla)
Stem Nostopeptolides Sectioning; universal MALDI matrix [221]
Hordeum vulgare Grain Sugars Cryosectioning (30 µm); DHBmatrix [222]
Hypericum perforatum, H. olym-pucum and H. patulum
Leaves Naphtodianthrone Intact surface; CHCAmatrix [223]
Linum usitatissimum Flowers Cyanogenic glucosides and lignans Cryosectioning (20 µm); DHBmatrix [118]
Lupine Roots (interfacesoil-root)
Pesticides CHCAmatrix [224]
Lychnophora species Leaves Flavonoids Sectioning bymicrotome (50 µm); matrix-free [74]
Medicago truncatula (symbiosiswith Sinorhizobiummeliloti)
Root nodules Amino acids and others Cryosectioning (16 µm); DHBmatrix [225]
Musa acuminata Fruit (epidermis) Phenylphenalenones Microdissection; matrix-free [226]
Pisum sativum Seed (pea) Phenylpropanoids, lignans andpterocarpans
Pea (epidermal layer); DHBmatrix [227]
Raphanus sativus Bulbs and leaves Anthocyanin and others Cryosectioning (12 µm); CHCA and DHBmatrix [228]
Solanum habrochaites Leaves Flavonoids, sugars and glycoalkaloids Intact surface; matrix-free (carbon) [229]
Soybean Leaves Flavonoids and others Intact surface; matrix-free (2D graphene) [230]
Tomato, apple and nectarine Cuticle Fatty acids (chemical hydrolysis of cutin) Cutin peaces; LiDHBmatric [231]
Wheat Leaves Fungicides residues Intact surface; DHBmatrix [210]
Zeamays (maize) Leaves Flavonoids and phenylpropanoides Cryosectioning (10 µm); DANmatrix [232]
678 Reviews
Thi
s do
cum
ent w
as d
ownl
oade
d fo
r pe
rson
al u
se o
nly.
Una
utho
rized
dis
trib
utio
n is
str
ictly
pro
hibi
ted.
matrix and in both ionmodes, producing radical ions ([M –H-sug-ar]−•) in the negative ionmode, similar to ESI [83]. TheMALDI con-ventionalmatrix application reduced the in-source fragmentationof C- andO-glycosylated flavonoids, but theywere not eliminated.In addition, the methyl radical losses from methoxylated flavo-noids were completely eliminated only with the LiDHB matrix;besides this, all the retro Diels-Alder fragmentations in the sourcewere also eliminated [22]. Thus, theuse of a specificmatrixmayberequired, depending on the drawn objectives and the type of mo-lecular target.Moreover, the screening and selection of bioactive compoundsfrom extracts can be performed by MALDI‑MS, including thesearch for specific enzymatic inhibitors and the establishment ofthe enzyme reaction kinetics constants [84,85]. A quantitativemethod by MALDI‑FT MS was developed and used to analyzethe product of the acetylcholinesterase enzymatic reaction andthe potential inhibitors from Rhizoma Coptidis extracts. The as-say interferents (acetylcholinesterase and cholinesterase) wereeliminated by a high-resolution analyzer [85]. In addition, carbonnanotubes were used as amatrix to obtain the fingerprint spectraof Angelica sinensis (Oliv.) Diels Radix (Apiaceae) after metabo-lism with liver homogenate, and the quantitative differences ofeach metabolized compound were also studied [86]. The carbonnanotubes have been recently applied as a MALDI matrix foranalyses of small compounds because of the absence of back-ground matrix ions and efficiency in the ionization, but theirlow solubility in organic solvents and water, as well as ionizationproblemsdue to thepresence of impurities (graphite pieces,metalparticles, and amorphous carbon), in raw products and the con-
Silva R et al. Application of MALDI… Planta Med 2016; 82: 671–689
tamination of the ion source represent the main disadvantages.However, the oxidation and chemical functionalization of carbonnanotubes has improved some of these problems, facilitating thesample preparation, since the water solubility is higher, and im-proving the efficiency of desorption/ionization analytes and re-producibility [87–89]. Finally, the adduction profiles of quinone-thioether metabolites by cytochrome C have also been estab-lished by MALDI‑TOF [90], as well as the identification of proteininteractions, such as for hydrolysable and condensed tanninswith bovine serum albumin [91,92]. Thus, the biological finger-printing analyses by MALDI can be used for screening targetsand assisting with studies of absorption, distribution, metabo-lism, elimination, and toxicity [85,86,93].
MALDI imagingMALDI imaging, another important technique in natural prod-ucts chemistry, was introduced by Caprioli in 1997 and was ini-tially applied to proteins and peptides [94]. The technique di-rectly analyzes tissue using MS, producing maps of the ion tissuedistribution. The highlighted advantage is not a necessity of theprevious extraction of the compounds for analyses, avoiding thelosses of information about spatial distribution [95]. This methodwas first used to analyze animal tissue, but currently includesother tissue analyses, such as plants, microorganisms, and insects[9,95–98]. There are some protocols of sample preparation fromanimal tissue for protein and peptide analyses; however, no uni-versal methods of sample preparation and data processing forothers tissues have been reported, such as for plants [9,94]. In ad-dition, plant tissue analyses by MALDI imaging are far from being
679Reviews
Thi
s do
cum
ent w
as d
ownl
oade
d fo
r pe
rson
al u
se o
nly.
Una
utho
rized
dis
trib
utio
n is
str
ictly
pro
hibi
ted.
a routine technique, since there aremany difficulties in preparingthe samples and the requirements to adapt protocols for specificsamples.IMS has been successfully applied to diverse studies due to itshigh sensitivity (compounds of very low concentration can be an-alyzed; attomole to low femtomole range), selectivity (similarcompounds can be differentiated), and ability to identify struc-turally themetabolites, sincemass spectrometric data give chem-ical information useful to identify them [9,69,73,75,99]. Thehigh mass accuracy obtained by high-resolution analyzers canbe used to differentiate similar compounds that show differencesonly in their exact masses, as well as a reduction of the interfer-ence of matrix ions in the images. In addition, the images of tis-sue distributions of metabolites produced fromMS/MS data havea higher selectivity, since the isomers (compounds with the samemolecular formula) with unlike fragmentation pathways can bedistinguished, producing images with high reliability [9,73,100].Although IMS has been performed by other ionization methods,such as desorption electrospray ionization (DESI), laser ablationelectrospray ionization (LAESI), and secondary ion mass spec-trometry (SIMS), most studies applied MALDI and LDI techniquesthat are explainable because of their advantages, such as goodspatial resolutions (around 20 µm) and a high speed of data ac-quisition (lasers with high frequency) [9,75]. The huge challengeof MALDI analysis is still the background matrix ions in the lowmass range, the size crystals of the matrix, since it is directly re-lated to spatial resolution, as well as the scarce information aboutthe ionization and in-source dissociation of secondary metabo-lites to improve the data and result qualities.The tissue distribution of specific metabolites can be establishedby MALDI imaging, unlike classical histochemical methods (un-specific) applied for plant tissue, making it possible to distinguishbetween individual compounds, which can be confirmed by MS/MS data, and it has a high accuracy, which reduces the problemsrelated to isobaric matrix ions and creates more reliable imagedata.However,most studies did not useMS/MSdata and theyonlyoperate in full scan mode [9]. Some articles, including relevantreviews, have shown the application of MALDI imaging for planttissues, food, and microorganisms (for example, to elucidate theinteraction between them). They described diverse details aboutsample preparation, spectra acquisition, post-acquisition analy-sis, and data evaluation related to biosynthesis, spatial dynamic,ecology, physiology, and morphology [9,73,75,101–105]. So,new issues are reported here to extend the information not yetaddressed in other review articles.MALDI and LDI imaging have been used for analyses of fruits,leaves, stems, sepals, seeds, roots, tubers, flowers, pollen grains,and rhizomes [9,73,75], such as from the leaves of Arabidopsisthaliana (L.) Heynh. (Brassicaceae – glucosinolates) [106], Lych-nophora species (Asteraceae) [74], Hypericum perforatum L. andHypericum reflexum L. f. (Hypericaceae) [107], apples [108], egg-plant [109], and others. The details of MALDI imaging of plant tis-sue are not described here because excellent review articles havealready been published in this area [9,73,75,101,102,110,111].Recently, Bjarnholt and collaborators performed an extensive re-vision (up to 2013) about IMS from plant tissue, and almost 65%applied MALDI and LDI for image acquisition using mainly CHCAand DHB as the matrix and cryosectioning to slice the materials[9]. The published articles, applying MALDI imaging from plants,between 2014 and 2015 are summarized in l" Table 3 and somespecial review articles have been published from analytical strat-egies for data obtainment, including higher spatial resolution and
sample preparation [112–116]. In addition, a recent publishedreview summarized the advances of IMS for lipidomics, showingthe insights related to the spatial compartmentalization of lipidsand their metabolism in plants, and the matrices DHB and 9-AAare predominantly used for these analyses [117].A critical step in MALDI imaging experiments is the sample prep-aration, which requires some special care to avoid the degrada-tion or metabolization of the compounds. In addition, the vac-uum in the source (not for atmospheric pressure MALDI) makesthe analyses of transversal plant sections (in natura) difficult be-cause of water losses in vacuum due to the tissue contraction,which makes the correlation between the MALDI imaging andanatomical data difficult, as well as the flatness of the tissue thatmay interfere in the accuracy. Another important point is aboutthe spatial resolution of images, since the higher resolution (fewmicrons) only has been presented by prototype machines pro-duced in specialized research laboratories. The images at resolu-tions of 10–20 µm are possible for commercial equipment, butthe focus laser beam should be considered an experimental pa-rameter and the size of the matrix crystals are also relevant [9,73]. Nowadays, the use of MALDI imaging from plants is still lim-ited, but it can give valuable information about surface metabo-lite and tissue distribution maps, which can assist in understand-ing the pathway biosynthetic, metabolite translocations, defenseof plants, and others [9,73,118]. Although there are huge chal-lenges for small compound analyses and plant tissues, MALDIimaging is a technique with many advantages and gives new per-spectives in the natural products area, helping to explore andunderstand diverse issues, such as ecological and physiological.
MALDI‑MS/MS to identify natural productsMALDI has been coupled to different analyzers such as quadru-pole (Q), IT, orbitrap, TOF, and FT‑ICR. The mass accuracy, resolu-tion, m/z range, sensitivity, speed, and other characteristics aredifferent for each analyzer and should be selected to best fit thespecific requirements of each experiment [6,16,102,119,120].MS/MS is performed in two stages: the first includes ion precur-sor isolation and its activation, which subsequently leads to thefragment ions being separated and detected. The activation stepinvolves increasing the internal energies of ions, resulting in therupture of chemical bonds by homolytic and/or heterolytic fis-sions. Different ion activation methods are available such aslow- and high-energy CID, electron capture dissociation (ECD),blackbody infrared dissociation (BIRD), surface-induced dissocia-tion (SID), ultraviolet photodissociation (UVPD), electron transferdissociation (ETD), electron-induced dissociation (EID), infraredmultiphoton dissociation (IRMPD), and PSD [121]; however, notall of the methods are available for the MALDI system, and CID ismost often applied.AlthoughMALDI‑MS/MS is widely used to identify and character-ize peptides, there is little information on its use for small com-pound natural products, especially on the in-source fragmenta-tion and the gas reactions for ion activation methods with a highenergy transfer. In addition, the influence of the amount of en-ergy transferred in the ionization processes by MALDI and thesubsequent fragmentation is poorly understood. Therefore, thisreview explored the use of MALDI‑MS/MS for natural productsidentification and the principal considerations reported, whichstimulates future studies to expand its applications.The fragmentation of nine flavonoids (two aglycone flavones, oneisoflavone, three aglycone flavonols, two O-glycosylated flavo-nols, and one flavanone) were compared by ESI-QTOF, MALDI-
Silva R et al. Application of MALDI… Planta Med 2016; 82: 671–689
680 Reviews
Thi
s do
cum
ent w
as d
ownl
oade
d fo
r pe
rson
al u
se o
nly.
Una
utho
rized
dis
trib
utio
n is
str
ictly
pro
hibi
ted.
QIT, and MALDI TOF ReTOF; this latter method refers to thecurved field reflectron or post-source decay, using the conven-tional MALDI matrices CHCA and DHB. The fragmentation usinglow energy, such as ESI-QTOF and MALDI‑QIT, was similar, show-ingmany similarities in the spectra related to the product ion andthe relative ion signal intensity. MALDI TOF ReTOF applies highenergy to ions, since the center-of-mass energy (Ecm) of the pre-cursor ions produced by MALDI are reaccelerated to 20000 eV(Ecm ≈ 150–310 eV). Thus, MALDI TOF ReTOF works at a higherenergy than ESI-QTOF (accelerated to 30 eV, Ecm = 1–4 eV) andMALDI‑QIT (Ecm≤2 eV) when compared to a specific ion [122].The rare loss of a hydrogen radical from typical flavonoid frag-ments (for example, from ions produced by retro-Diels-Aldercleavages) was only observed in MALDI TOF ReTOF at high cen-ter-of-mass energies and included other radical ions, and nocompeting fragmentation processes at low center-of-mass ener-gies have been observed [121,122]. The high center-of-mass en-ergies have been described to induce charge-remote fragmenta-tion and diverse fragmentation pathways, which may be usefulin dereplication studies because they offer additional informa-tion for structural elucidation.Through previous fragmentation studies of standards, com-pounds such as ferulic acid, wogonin (a flavone), and scutellarin(a glycoside flavone) could be identified in extracts of traditionalChinese medicine herbs by MALDI‑MS/MS with graphene andgraphene oxide matrices, which improved the limit of detectionand reduced the in-source fragmentation. The graphene belongsto the multidimensional carbon nanomaterial family, which iscomposed of two dimensional layers of sp2 bonded carbon andrecently it has been applied as a MALDI matrix for small com-pound analyses, since a low background interference of matrixions is also observed in the spectra. In addition, the graphene ox-ide is easily produced by oxiding graphite, showing hydroxyl andepoxide groups on the base of the structural plane of grapheneoxide sheets that confer strong hydrophilic properties and helpwater dispersion and swelling. The excellent results could be re-lated to their properties such as thermal, electronic, andmechan-ical [25,123]. Specific matrices can reduce the in-source dissocia-tion and significantly influence the final results. However, thereis little information about ionization processes, in-source dissoci-ations, and fragmentation by MALDI with high-energy CID, PSD,and LIFT. Fragmentation studies using high-energy CID, PSD, andLIFT are in demand because, as reported byMarch and coworkers[122], only fragmentation data obtained by low-energy CID aresimilar to ESI and MALDI for flavonoids, and such data are widelyavailable for ESI.Silva and Lopes [22] evaluated the in-source dissociations of var-ious glycosylated and non-glycosylated flavonoids (flavanones,flavones, flavonols) without a matrix and with different matricesin addition to the influence of the laser intensity on these in-source reactions. The flavonoid-matrixcluster ions,whichdependon the structure of the flavonoid, were elucidated by MALDI-MS/MS, confirming the formation of cluster ions involving fragmentsproduced by retro-Diels-Alder fragmentation [124]. The forma-tion of radical fragments in-source and MS/MS experiments areevident [22,81,122,125], and increasing the understanding ofthese reactions will enlarge the application of MALDI as a tool inhigh-throughput chemical analysis and the identification of nat-ural products [25,27,51,55,68,126].Although the O-glycosylated flavonoids easily lose the sugar inthe source, Wang and Sporns [68] thoroughly studied the frag-mentation pathway of glycosylated flavonols with up to three
Silva R et al. Application of MALDI… Planta Med 2016; 82: 671–689
glycosides. The best matrix reported by the authors was THAP,because it had good repeatability (spot-to-spot), produced ionsin both positive and negative ion modes, and exhibited a high af-finity for alkali metals in the ionization process. The main frag-ment ions were generated from sugar losses, as observed in ESI[127]. However, the fragment ions produced from the aglyconewere not described [68], which is important for its elucidation.PSD for TOF analyzers and the LIFT system have been employed inMS/MS experiments, and both can be associated with CID to in-crease the internal energy of the ions, thus increasing fragmentions [128,129]. Metastable fragments are produced from ionswith excess internal energy during ion acceleration from thesource in the free field region, and the reflector voltage is set todetect these fragments in the PSD technique. However, PSD istime consuming, and difficulties exist in mass calibration andthe detection of fragments with a low m/z (< 150) [129]. In LIFTexperiments, a low voltage of 8 kV is applied to a precursor ionfor acceleration; the ion is then isolated and raised to a higherpotential in the LIFT cell. Subsequently, the fragment ions arereaccelerated toward the detector, and changes in the reflectorvoltage are not required [129]. PSD and LIFTwere used to analyzeclusters of the CHCAmatrix, demonstrating the many advantagesof the LIFT technique, with a better detection of ions with a lowabundance and mass, and a relatively fast acquisition time [130].Initially, PSDwas applied in peptides [131,132] and carbohydratesequencing [133], and currently, there are some applications innatural products studies. It was used to identify saponins [134],flavonoids [122], isoflavones [135], carotenoids [136], and hydro-lysable and condensed tannins [66,137] as well as to examine tri-acylglycerols and phosphatidylethanolamines from plants, algae,and animal tissue [138–140].Different carotenes (polyenes without oxygen) and xanthophylls(polyenes with oxygen) were analyzed by MALDI and producedradical ions (molecular ions) through the removal (M•+) of oneelectron (l" Fig. 7) [136], which is similar to ESI and FAB. The in-crease of a conjugation extension is a relevant factor for electronloss and radical stability, and produces spectra complexes fromsequential in-source homolytic cleavages, as observed in theMALDI source [4,23,141–143]. The fragmentation patterns ofcarotenoids and xanthophylls were proposed based on MALDI-PDS data [23,136]. The loss of one molecule of water [M-18]•+
confirms the presence of a hydroxyl group (such as for luteolin),and [M-92]•+ and [M-106]•+ ions are diagnostic of toluene andxylene losses, respectively. The intensity relation between thesefragment ions (I[M-92]•+/I[M-106]•+) is important to define the pres-ence of double bonds, and when this relation is > 10, the carote-noids contain nine double bonds. The loss of fatty acids ([M-RCOOH]•+) is common for carotenoid fatty acid esters (such as forβ-cryptoxanthin palmitate) and characterizes their presence inthe carotenoid structures, while the epoxy species can be con-firmed by the fragment ion [M-80]•+. Other diagnostic carotenoidfragment ions have been described in detail and are useful forelucidating their chemical structures [23,136].The O-glycosylated isoflavones from soy [Glycine max L. (Faba-ceae)] showed fragments with structural importance by PSD, in-cluding the main fragment that occurs through the loss of sugars,which is similar to ESI. In addition, the DHB and THAP matriceswere evaluated, and DHB showed better ionization results and ahigher number of fragments in MS/MS spectra [135]. PSD wasalso applied in the study of peracetylated isoflavone glycosidesfrom their protonated and cationized different metal ions tounderstand the gas phase molecule cluster complexes. A reduc-
681Reviews
Thi
s do
cum
ent w
as d
ownl
oade
d fo
r pe
rson
al u
se o
nly.
Una
utho
rized
dis
trib
utio
n is
str
ictly
pro
hibi
ted.
tion in the number of fragments was detected in the order of Li+ >Na+ > Ag+ > Cu+ > H+ > K+ > Rb+ ≈ Cs+ [144]. Fragmentation waslower for Ag3+ clusters than Ag+, demonstrating a stronger gasphase interaction with Ag3+ [145].Saponins have been studied using different fragmentation tech-niques and, in some cases, the fragmentation was applied indereplication studies. MALDI has limited applications in this areaand is sometimes used together with LC‑ESI‑MS/MS data becausemore saponins can be identified and detected by MALDI [51,146,147]. ESI‑IT, MALDI‑IT, MALDI‑IT/TOF, and MALDI‑TOF/TOF, in-cluding high-energy CID, were applied for dammarane-type tri-terpenoid saponins from Bacopa monnieri (L.) Wettst. (Plantagi-naceae) [134]. In low energy techniques, the spectra were similarfor ESI and MALDI ionization, and their product ions are appliedto elucidate the sequence and branching of the sugar moieties[134,147]. The useful fragment ions from the aglycones and theglycosidic moiety were obtained from high-energy CID, whichyielded the same fragments observed by PSD [134] and showeda similar charge-remote fragmentation described for high-energyCID for conjugated steroids and others [148,149]. These diagnos-tic fragment ions were also observed by the LIFT system, whichassisted in the structural identification of saponins from the seacucumber Holothuria forskali [150,151].Hydrolysable and condensed tannins are another group of sec-ondary metabolites analyzed by MALDI due to its advantages,such as sensitivity, the formation of singly charged molecularions, and lower ion suppression for complex mixture analysis[66,128,137,152]. Several articles have reported the potential toidentify such compounds byMALDI‑MS, which contains differentcombinations and connectivity between the monomers and pro-duces tannins of the same molecular weight. However, unambig-uous identification can only be completed with MS/MS data, es-tablishing the linkage between the specific monomers. Monomerlosses involving fragment ions by hydrogen transfer and typicalretro-Diels-Alder fragmentations are observed from eacholigomer, followed bywater elimination, but the radical fragmentions are less visible in the spectra [153–157]. These observationswere applied to identify condensed tannins of A-type and B-typelinkages from different species described from Theobroma cacaoL. (Sterculiaceae) [153], Salix alba L. (Salicaceae), Picea abies (L.)H. Karst (Pinaceae), Fagus sylvatica L) (Fagaceae), Tilia cordataMill. (Malvaceae) [66], Cinnamomum zeylanicum L. (Lauraceae)[154], Eugenia dysenterica DC. (Myrtaceae) [155], quebrachowood [128], Commiphora leptophloeos (Mart.) J. B. Gillett (Burser-aceae), Anadenanthera colubrina (Vell.) Brenan var. colubrina(Fabaceae), Myracrodruon urundeuva Allemão (Anacardiaceae)[156], Pityrocarpa moniliformis (Benth.) Luckow & R.W. Jobson(Fabaceae) [157], almond [158], and others. In addition, it allowedfor the identification of a rare polymeric series of up to eight fla-van-3-ol units with pentose and hexose sugars by MALDI-TOF/TOF LIFT [153].MS/MS data obtained by MALDI QIT‑TOF, PSD, and CID have beenapplied to determine the chemical structure of hydrolysable tan-nins from Rosa chinensis Jacq. (Rosaceae) [159], Chinese galls [59],tara, Turkey gall, chestnut woods [137], Mangifera indica L. (Ana-cardiaceae) [160], and others, which are preferentially acquiredin the positive ion mode due to the visualization of fewer signalpeaks in the negative ion mode for gallotannins [59]. However,an extensive application of different matrices must be evaluatedto confirm this statement. The hydrolysable tannins were alsoevaluated by MALDI‑TOF/TOF (positive ion mode) with twocationizing agents, sodium and cesium, but significant differences
in the fragmentation pathwaywere not observed [160,161]. First,the galloyltannins lost one or more galloyl moieties (152 Da), ac-companied by the loss of one or more molecules of H2O. Themol-ecules of gallic acid (170 Da) or ellagic acid, when present, can belost with the hydrogen transfer, and a double bond in the glucoseis formed [137]. Many important fragment ions were not ob-served by ESI‑MS/MS, which could complicate their structuralidentification [162–165]. A complex fragmentation pattern ob-tained from < 300 Da is observed, which complements the infor-mation to identify them [59,137,160]. The fragment ions fromsugar core tannins can be observed, occurring by the internalcleavage of the glycosidic ring, with a similar fragmentation al-ready reported for carbohydrates by MALDI‑CID [166,167].MALDI‑MS is an advantageous technique for macromoleculeanalyses due to the characteristics described previously, and cur-rently, its application to small molecules is just beginning [24,26,28]. Although more research in this area is required, MALDI‑MShas demonstrated valorous contributions to secondary metabo-lites over other analytical techniques [50]. Many publications de-scribed the use of MALDI‑MS for establishing metabolic finger-prints [6,27,168,169]. A chemical profile of the compounds andthe use of MALDI‑MS/MS to identify the chemical structure ofnatural products are recent and not extensively applied in theidentification of tannins (hydrolysable and condensed) and sapo-nins. In addition, few studies by MALDI‑MS/MS have been de-scribed for a restricted number of natural compounds, such asanthocyanins, carotenoids, xanthophylls, betaines, glycosylatedisoflavones, phenolic acids, flavonoids, theaflavins and thearubi-gins, limonoids, alkaloids, and others, which are sometimes com-bined with LC‑ESI‑MS/MS data [23,25,68,74,122,125,126,136,143,153,159,168–171].All the statements appointed here confirm the relevant MALDIapplications in the natural products area, stimulating its applica-tions in wide studies such as the research of biomarkers, hier-archical clustering, taxonomy, imaging from tissues, and others.However, the data processing is fundamental to improve thequality of results and to avoid mistaken conclusions. So, the dataanalysis can be divided into the steps of preprocessing and statis-tical analysis. The preprocessing will be described here, since it isextremely important and restrictedly described in the literature.
Data Processing!
In the previous section, we have shown a broad range of MALDIionization applications to natural products. Due to themass spec-trometer hardware and the advances in applications, many au-thors consider that data analysis is going to play an importantrole in most of these applications and will become a bottleneckfor many inquiry fields [172,173].In many cases, specific techniques are required to analyze a sam-ple and to answer a scientific question, for example, by MALDIimaging or a MALDI‑MS/MS data set. Each spectrum in an exper-imental data set, usually composed of many samples and repli-cates, should be processed to improve the results and thus guidethe study to correct conclusions [174]. For this reason, a commonmodular analysis flow diagramwas proposed here, and some ap-plications toMALDI‑MS datawere described to exemplify the ad-dressed points. Following this flux analysis, here the similaritieswith MS data obtained by other ionization methods and moregenerically for other large-scale data sampling techniques arehighlighted. The optimization of data analysis steps described be-
Silva R et al. Application of MALDI… Planta Med 2016; 82: 671–689
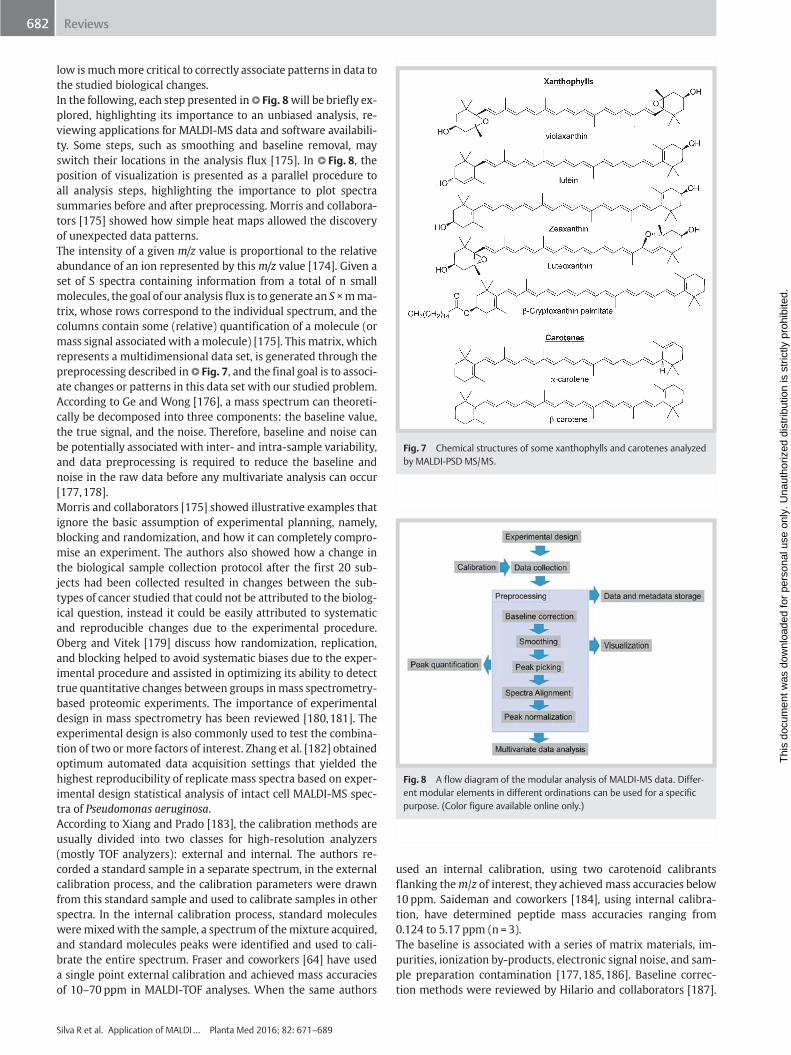
Fig. 7 Chemical structures of some xanthophylls and carotenes analyzedby MALDI‑PSD MS/MS.
Fig. 8 A flow diagram of the modular analysis of MALDI‑MS data. Differ-ent modular elements in different ordinations can be used for a specificpurpose. (Color figure available online only.)
682 Reviews
Thi
s do
cum
ent w
as d
ownl
oade
d fo
r pe
rson
al u
se o
nly.
Una
utho
rized
dis
trib
utio
n is
str
ictly
pro
hibi
ted.
low is muchmore critical to correctly associate patterns in data tothe studied biological changes.In the following, each step presented inl" Fig. 8will be briefly ex-plored, highlighting its importance to an unbiased analysis, re-viewing applications for MALDI‑MS data and software availabili-ty. Some steps, such as smoothing and baseline removal, mayswitch their locations in the analysis flux [175]. In l" Fig. 8, theposition of visualization is presented as a parallel procedure toall analysis steps, highlighting the importance to plot spectrasummaries before and after preprocessing. Morris and collabora-tors [175] showed how simple heat maps allowed the discoveryof unexpected data patterns.The intensity of a given m/z value is proportional to the relativeabundance of an ion represented by this m/z value [174]. Given aset of S spectra containing information from a total of n smallmolecules, the goal of our analysis flux is to generate an S ×mma-trix, whose rows correspond to the individual spectrum, and thecolumns contain some (relative) quantification of a molecule (ormass signal associatedwith a molecule) [175]. This matrix, whichrepresents a multidimensional data set, is generated through thepreprocessing described inl" Fig. 7, and the final goal is to associ-ate changes or patterns in this data set with our studied problem.According to Ge and Wong [176], a mass spectrum can theoreti-cally be decomposed into three components: the baseline value,the true signal, and the noise. Therefore, baseline and noise canbe potentially associated with inter- and intra-sample variability,and data preprocessing is required to reduce the baseline andnoise in the raw data before any multivariate analysis can occur[177,178].Morris and collaborators [175] showed illustrative examples thatignore the basic assumption of experimental planning, namely,blocking and randomization, and how it can completely compro-mise an experiment. The authors also showed how a change inthe biological sample collection protocol after the first 20 sub-jects had been collected resulted in changes between the sub-types of cancer studied that could not be attributed to the biolog-ical question, instead it could be easily attributed to systematicand reproducible changes due to the experimental procedure.Oberg and Vitek [179] discuss how randomization, replication,and blocking helped to avoid systematic biases due to the exper-imental procedure and assisted in optimizing its ability to detecttrue quantitative changes between groups inmass spectrometry-based proteomic experiments. The importance of experimentaldesign in mass spectrometry has been reviewed [180,181]. Theexperimental design is also commonly used to test the combina-tion of two or more factors of interest. Zhang et al. [182] obtainedoptimum automated data acquisition settings that yielded thehighest reproducibility of replicate mass spectra based on exper-imental design statistical analysis of intact cell MALDI‑MS spec-tra of Pseudomonas aeruginosa.According to Xiang and Prado [183], the calibration methods areusually divided into two classes for high-resolution analyzers(mostly TOF analyzers): external and internal. The authors re-corded a standard sample in a separate spectrum, in the externalcalibration process, and the calibration parameters were drawnfrom this standard sample and used to calibrate samples in otherspectra. In the internal calibration process, standard moleculesweremixedwith the sample, a spectrum of themixture acquired,and standard molecules peaks were identified and used to cali-brate the entire spectrum. Fraser and coworkers [64] have useda single point external calibration and achieved mass accuraciesof 10–70 ppm in MALDI‑TOF analyses. When the same authors
Silva R et al. Application of MALDI… Planta Med 2016; 82: 671–689
used an internal calibration, using two carotenoid calibrantsflanking them/z of interest, they achieved mass accuracies below10 ppm. Saideman and coworkers [184], using internal calibra-tion, have determined peptide mass accuracies ranging from0.124 to 5.17 ppm (n = 3).The baseline is associated with a series of matrix materials, im-purities, ionization by-products, electronic signal noise, and sam-ple preparation contamination [177,185,186]. Baseline correc-tion methods were reviewed by Hilario and collaborators [187].
683Reviews
Thi
s do
cum
ent w
as d
ownl
oade
d fo
r pe
rson
al u
se o
nly.
Una
utho
rized
dis
trib
utio
n is
str
ictly
pro
hibi
ted.
TheMALDIquant package [188] implements different approachesto adjust the baseline. The packageʼs default is the Statistics-sen-sitive Non-linear Iterative Peak-clipping (SNIP) algorithm pro-posed by Ryan and collaborators [189] that yields a smooth base-line and leads to positive corrected intensities.Systematic shifts can appear in repeated experiments, and thespectra for two identical metabolites can have different m/z val-ues. The spectral alignment consists of aligning correspondingpeaks across samples to address this problem [190]. For a givenm/z value selected in different spectra, the peak position can dif-fer slightly, and generally, this effect cannot be corrected by theinstrument calibration [174].The spectral alignment is a theme of constant research. A simpleapproach for spectral alignment is presented by Pham and Jime-nez [172], in which peaks in individual spectra are matchedagainst the closest peak in a mean spectrum. He and coworkers[191] compared several algorithms currently in use for massspectrometry and showed that their correlations-based algo-rithm performed better in a SELDI‑MS dataset. The alignmentmethod described by He and coworkers [191] is also imple-mented in the MALDIquant package. Bloemberg and coworkers[192] wrote a comprehensive tutorial explaining the workingprinciples of several methods and provided implementations inR [193] and Matlab (The Mathworks Inc.) languages.Many spectral smoothingmethods generate an intensity value byaveraging the values within a span of data points. Smoothing isdirectly proportional to the span size (i.e., the segment size con-taining a specific number ofm/z ratio data points); therefore, caremust be taken when choosing the span size, as a large span sizemay lead to information loss. Smoothing is important to correctlyestimate the noise and to improve the peak picking process [187].Several algorithmic procedures for informative peak identifica-tion have been proposed, named as peak detection or peak pick-ing, that correspond to true signals. A comparative review ofsome of these algorithms, their principles, implementations, andperformance is presented by Yang and collaborators [194]. Theauthor concluded that continuous wavelet transform (CWT)-based algorithms provided the best performance. The peak pick-ing process is important in extracting the relevant signals from amass spectrum and for its significant reduction of the data setdimensionality. Different implementations are available in the Rpackage MALDIquant, as well as on XCMS [195], which can bestraightforwardly adapted for MALDI‑MS data.In repeated experiments, it is common to observe differencesarising from sample preparation and instrumental measure var-iation, which cannot be attributed to differences in the biologicalsamples. Normalization is the transformation of sample-wisemass intensities to the same scale, which enables the comparisonof different samples [196]. The impact of normalization was ad-dressed by Ejigu and collaborators [197] in an LC‑MS study. Theauthors state that normalization should be regarded more as aremedial measure, not to correct for all sources of variability in-troduced by different sources of biases. The authors also recom-mend data-driven (assuming that a large amount of the metabo-lites stay constant) normalization methods over model-driven(based on internal standards or intermediate quality controlruns) normalization methods. Deininger and coworkers [198]have shown the importance of normalization in MALDI imagingexperiments, where the incorrect normalization could com-pletely change the potential biomarker spatial distribution. Ac-cording to the same authors, median and noise level normaliza-tions were significantly more robust than TIC normalization.
The success of multivariate data analysis depends heavily on thecorrect execution of the previous analysis steps. For example, in-correct peak picking can leave out peaks from important mole-cules, incorrect alignment can merge peaks from different mole-cules, and incorrect normalization can show intensity differencescaused by the experimental procedure in place of biological dif-ferences. These mistakes impact the conclusions drawn frommultivariate methods.The multivariate analyses are commonly classified into twogroups: unsupervised and supervised methods. Unsupervisedmethods are used on exploratory data analysis and make use ofthe data latent structure, without any previous assumption ofsample classes. Supervised methods use information from thedata structure and sample classes to estimate the model parame-ters [199].From a large dataset, it is possible to predict the desired outcomeonly by chance. There are good confidence measures available tocheck the consistency of this analysis. For the most common un-supervised analysis, the hierarchical clustering, resampling, andregrouping techniques provide a consistence check [200]. Forclassification models (supervised analysis), care must be taken.A very popular model in the natural products community is PLS(partial least squares), which is prone to overfitting [201]. Toavoid overfitting, an important technique in the classificationmodels is the K-fold cross validation (CV) [175]. Many hybridexploration/classification approaches have been proposed onMALDI. Alexandrove and coworkers [202] developed a spatiallyaware clustering approach for MALDI imaging. Briefly, the spec-tra are grouped by a measure of similarity taking into accountits position, and then all pixels are pseudo-color coded accordingto the classification assignment. Pham and Jimenez [172] em-ployed a grid search with exponential spacing to find the optimalvalues for support vector machine model selection. The authorsreport a final accuracy of 83% on a separate validation set (BreastCancer Study with MALDI‑MS Data) of 78 samples.Tong and coworkers [177] argue that there is a lack of guidelinesfor data processing, and unexperienced practitioners can addvariation when handling complex models. The authors also statethat the functionalities of many tools designed for SELDI‑MS orLC‑ESI‑MS are not transferable to MALDI‑MS data analysis. Asthere is constant development of new computational statisticalmethods, many scientific communities are fostering the develop-ment of modular software in such a way that the modules can becombined to achieve different goals [203]. There is also an in-creasing realization of data standards, data storage, and exchange[204,205]. These good experimental practices will ultimatelyallow improvement in experimental reproducibility among dif-ferent research groups and promote faster improvements in thegroups that successfully adopt these practices.He and coworkers [185] have a similar opinion regarding thedifficulties of experimentalists in using software toolkits. Theauthors recommend the use of flexible software platforms thatenable new users to construct new fit-to-purpose workflows.The authors cite case-based reasoning (CBR), a process of solvingnew problems based on the solutions of similar past problems[206].There is also an agreement that most of the complex experimentsshould be performed by multidisciplinary groups and that dataanalysis in particular could benefit from the participation ofstatisticians, computer scientists, or more generally quantitativescientists. Their participation would be effective if they could be
Silva R et al. Application of MALDI… Planta Med 2016; 82: 671–689
684 Reviews
present in all phases from study design to interpretation of infor-mation extracted from experimental data [175,177,185].
Thi
s do
cum
ent w
as d
ownl
oade
d fo
r pe
rson
al u
se o
nly.
Una
utho
rized
dis
trib
utio
n is
str
ictly
pro
hibi
ted.
Conclusions!
MALDI‑MS is an underexplored technique in natural productschemistry, but the advantages encourage its use in the field. Itsadvantages include decreased ion suppression in complex mix-tures, increased speed, higher tolerance to impurities, increasedsensitivity, and low sample consumption compared to ESI. MALDItechniques can be applied to various fields of study, includingstudies of structural identification, tissue imaging, metabolom-ics, molecular interactions with target molecules, medicinalplant identification, quantification, and chemical screening.Although several points are unknown in secondary metaboliteanalysis, MALDI has been successfully applied, thus demonstrat-ing its potential and usefulness for the analyzed metaboliteclasses listed in this review. Several types of metabolites can beanalyzed byMALDI, such as hydrolysable and condensed tannins,alkaloids, saponins, flavonoids, anthocyanins, sesquiterpene lac-tones, carotenoids, steroids, diterpenes, and lipids, including gly-cosylated and non-glycosylated compounds. The development ofchemical analysis guidelines for different metabolite classes, as inthis review and others in the future, will assist in the planning ofthe experimental design, interpretation, and data processing. Inaddition, the MALDI‑MS/MS data obtained by low energy trans-fer methods can be easily compared to ESI fragmentation, facili-tating its use in the structural identification of compounds be-cause several ESI‑MS/MS fragmentation pathways have alreadybeen reported. Additionally, fragment ions are often differentdue to charge-remote fragmentation in the high energy transfermethods of MS/MS that are commonly applied in MALDI analy-ses. These fragment ions can give additional and useful informa-tion for structural identification, as observed, for example, incarotenoids, saponins, and tannins. However, more studies onthe fragmentation mechanisms for different metabolite classesare required.With the increasing availability of MALDI experimental applica-tions, dedicated software is needed; however, for most analyticalneeds, numerous powerful algorithms and free software imple-mentations are available. The scientistʼs main task is to under-stand the data structure and assumptions of an analytical meth-od and correctly apply it to their own data sets. Most readers maynot have experience with data analysis, and the availability ofdedicated software is important, but this review sought to recog-nize data analysis as an important point in the experimental pro-cess and emphasize the importance of data analysts in multidis-ciplinary groups.
Acknowledgments!
The authors thank FAPESP (Process: 2009/54098-6, 2012/18031-7, 2014/20302-4 and 2014/01884-2), CNPq, INCT_if, CAPES, andFUNDECT.
Conflict of Interest!
The authors declare that no conflicts of interest exist.
Silva R et al. Application of MALDI… Planta Med 2016; 82: 671–689
References1 Gohlke RS, McLafferty FW. Early gas chromatography/mass spectrome-try. J Am Soc Mass Spectrom 1993; 4: 367–371
2 Karas M, Bachmann D, Bahr U, Hillenkamp F.Matrix-assisted ultravioletlaser desorption of non-volatile compounds. Int J Mass Spectrom IonProcess 1987; 78: 53–68
3 Karas M, Krüger R. Ion formation in MALDI: the cluster ionizationmechanism. Chem Rev 2003; 103: 427–439
4 Guaratini T, Vessecchi RL, Lavarda FC, Maia Campos PM, Naal Z, Gates PJ,Lopes NP.New chemical evidence for the ability to generate radical mo-lecular ions of polyenes from ESI and HR-MALDI mass spectrometry.Analyst 2004; 129: 1223–1226
5 Crotti AEM, Vessecchi R, Lopes JLC, Lopes NP. Espectrometria de massascom ionização por “electrospray”: processos químicos envolvidos naformação de íons de substâncias orgânicas de baixo peso molecular.Quim Nova 2006; 29: 287–292
6 Ernst M, Silva DB, Silva RR, Vêncio RZN, Lopes NP. Mass spectrometry inplant metabolomics strategies: from analytical platforms to data ac-quisition and processing. Nat Prod Rep 2014; 31: 784–806
7 Dorrestein PC. Editorial: Mass spectrometry of small molecules andnatural products. Nat Prod Rep 2014; 31: 704–705
8 Bhardwaj C, Hanley L. Ion sources for mass spectrometric identificationand imaging of molecular species. Nat Prod Rep 2014; 31: 756–767
9 Bjarnholt N, Li B, DʼAlvise J, Janfelt C. Mass spectrometry imaging ofplant metabolites – principles and possibilities. Nat Prod Rep 2014;31: 818–837
10 Shih CJ, Chen PY, Liaw CC, Lai YM, Yang YL. Bringing microbial interac-tions to light using imaging mass spectrometry. Nat Prod Rep 2014;31: 739–755
11 Zenobi R, Knochenmuss R. Ion formation in MALDI mass spectrometry.Mass Spectrom Rev 1998; 17: 337–366
12 Knochenmuss R, Zenobi R. MALDI ionization: the role of in-plume pro-cesses. Chem Rev 2003; 103: 441–452
13 Dreisewerd K. The desorption process in MALDI. Chem Rev 2003; 103:395–426
14 Holle A, Haase A, Kayser M, Hohndorf J. Optimizing UV laser focus pro-files for improved MALDI performance. J Mass Spectrom 2006; 41:705–716
15 OʼConnor PB. The development of matrix-assisted laser desorption/ion-ization sources. In: Cole RB, editor. Electrospray and MALDI mass spec-trometry: fundamentals, instrumentation, practicalities, and biologi-cal applications. Hoboken: John Wiley & Sons; 2010: 185–213
16 Bier ME. Coupling ESI andMALDI sources to the quadrupole mass filter,quarupole ion trap, linear quadrupole ion trap, and orbitrap analyzers.In: Cole RB, editor. Electrospray andMALDI mass spectrometry: funda-mentals, instrumentation, practicalities, and biological applications.Hoboken: John Wiley & Sons; 2010: 265–344
17 El-Aneed A, Cohen A, Banoub J.Mass spectrometry, review of the basics:electrospray, MALDI, and commonly used mass analyzers. Appl Spec-trosc Rev 2009; 44: 210–230
18 Creaser CS, Griffiths JR, Bramwell CJ, Noreen S, Hill CA, Thomas CLP. Ionmobility spectrometry: a review. Part 1. Structural analysis bymobilitymeasurement. Analyst 2004; 129: 984–994
19 Kanu AB, Dwivedi P, Tam M, Matz L, Hill jr. HH. Ion mobility-mass spec-trometry. J Mass Spectrom 2008; 43: 1–22
20 Hossain M, Limbach PA. A comparison of MALDI matrices. In: Cole RB,editor. Electrospray and MALDI mass spectrometry: fundamentals,instrumentation, practicalities, and biological applications. Hoboken:John Wiley & Sons; 2010: 215–261
21 Gabelica V, Schulz E, Karas M. Internal energy build-up in matrix-assis-ted desorption/ionization. J Mass Spectrom 2004; 39: 579–593
22 Silva DB, Lopes NP. MALDI‑MS of flavonoids: a systematic investigationof ionization and in-source dissociation mechanisms. J Mass Spectrom2015; 50: 182–190
23 Kaufmann R, Wingerath T, Kirsch D, Stahl W, Sies H. Analysis of carote-noids and carotenol fatty acid esters by matrix-assisted laser desorp-tion ionization (MALDI) andMALDI post-source-decaymass spectrom-etry. Anal Biochem 1996; 238: 117–128
24 Dong X, Cheng J, Li J, Wang Y. Graphene as a novel matrix for the analy-sis of small molecules by MALDI‑TOF MS. Anal Chem 2010; 82: 6208–6214
25 Liu Y, Liu J, Yin P, Gao M, Deng C, Zhang X. High throughput identifica-tion of components from traditional Chinese medicine herbs by utiliz-ing graphene or graphene oxide as MALDI‑TOF‑MS matrix. J MassSpectrom 2011; 46: 804–815
685Reviews
Thi
s do
cum
ent w
as d
ownl
oade
d fo
r pe
rson
al u
se o
nly.
Una
utho
rized
dis
trib
utio
n is
str
ictly
pro
hibi
ted.
26 Cohen LH, Gusev AI. Small molecule analysis by MALDI mass spectrom-etry. Anal Bioanal Chem 2002; 373: 571–586
27 Ernst M, Silva DB, Silva R, Monge M, Semir J, Vêncio RZN, Lopes NP. Ame-tabolomic protocol for plant systematics by matrix-assisted laser-de-sorption/ionization time-of flight mass spectrometry. Anal Chim Acta2015; 859: 46–58
28 McCombie G, Knochenmuss R. Small-molecule MALDI using the matrixsuppression effect to reduce or eliminate matrix background interfer-ences. Anal Chem 2004; 76: 4990–4997
29 Liu R, Liu JF, Yin YG, Hu XL, Jiang GB. Ionic liquids in sample preparation.Anal Bioanal Chem 2009; 393: 871–883
30 Vorm O, Roepstorff P, Mann M. Improved resolution and very high sen-sitivity inMALDI TOF of matrix surfacesmade by fast evaporation. AnalChem 1994; 66: 3281–3287
31 Gobey J, Cole M, Janiszewski J, Covey T, Chau T, Kovarik P, Corr J. Charac-terization and performance of MALDI on a triple quadrupole massspectrometer for analysis and quantification of small molecules. AnalChem 2005; 77: 5643–5654
32 Dai Y, Whittal RM, Li L. Two-layer sample preparation: a method forMALDI‑MS analysis of complex peptide and protein mixtures. AnalChem 1999; 71: 1087–1091
33 Cheng ZH, Guo YL, Wang HY, Chen GQ.Qualitative and quantitative anal-ysis of quaternary ammonium alkaloids from Rhizoma Corydalis bymatrix-assisted laser desorption/ionization Fourier transform massspectrometry coupled with a selective precipitation reaction usingReinecke salt. Anal Chim Acta 2006; 555: 269–277
34 Abell DC, Sporns P. Rapid quantitation of potato glycoalkaloids by ma-trix-assisted laser desorption/ionization time-of-fight mass spectrom-etry. J Agric Food Chem 1996; 44: 2292–2296
35 Shrivas K, Patel DK. Quantitative determination of nicotinic acid inmicro liter volume of urine sample by drop-to-drop solvent microex-traction coupled to matrix assisted laser desorption/ionization massspectrometry. Spectrochim Acta A Mol Biomol Spectrosc 2011; 78:253–257
36 Wang J, Kalt W, Sporns P. Comparison between HPLC and MALDI‑TOFMS analysis of anthocyanins in highbush Blueberries. J Agric FoodChem 2000; 48: 3330–3335
37 Wang J, Sporns P. Analysis of anthocyanins in red wine and fruit juiceusing MALDI‑MS. J Agric Food Chem 1999; 47: 2009–2015
38 Marczak L, Kachlicki P, Kozniewski P, Skirycz A, Krajewski P, Stobiecki M.Matrix-assisted laser desorption/ionization time-of-flight mass spec-trometry monitoring of anthocyanins in extracts from Arabidopsisthaliana leaves. Rapid Commun Mass Spectrom 2008; 22: 3949–3956
39 Frison-Norrie S, Sporns P. Identification and quantification of flavonolglycosides in almond seedcoats using MALDI‑TOF MS. J Agric FoodChem 2002; 50: 2782–2787
40 Champy P, Melot A, Guérineau Eng V, Gleye C, Fall D, Höglinger GU,Ruberg M, Lannuzel A, Laprévote O, Laurens A, Hocquemiller R. Quantifi-cation of acetogenins in Annona muricata linked to atypical Parkinson-ism in Guadeloupe. Mov Disord 2005; 20: 1629–1633
41 Sleno L, Volmer DA. Toxin screening in phytoplankton: detection andquantitation using MALDI triple quadrupole mass spectrometry. AnalChem 2005; 77: 1509–1517
42 May LA, Tourkina E, Hoffman SR, Dix TA. Detection and quantitation ofcurcumin in mouse lung cell cultures by matrix-assisted laser desorp-tion ionization time of flight mass spectrometry. Anal Biochem 2005;337: 62–69
43 Ivanova B, Spiteller M. Simultaneous quantitation of naturally occurringinsecticides, acaricides, and piscicides in rapeseed oil by UV-MALDImass spectrometry. J Food Meas Charact 2014; 8: 15–28
44 Harvey DJ. Analysis of carbohydrates and glycoconjugates by matrix-assisted laser desorption/ionization mass spectrometry: an updatecovering the period 1999–2000. Mass Spectrom Rev 2006; 25: 595–662
45 Harvey DJ. Analysis of carbohydrates and glycoconjugates by matrix-assisted laser desorption/ionization mass spectrometry: an updatecovering the period 2001–2002. Mass Spectrom Rev 2008; 27: 125–201
46 Harvey DJ. Analysis of carbohydrates and glycoconjugates by matrix-assisted laser desorption/ionization mass spectrometry: an update for2003–2004. Mass Spectrom Rev 2009; 28: 273–361
47 Harvey DJ. Analysis of carbohydrates and glycoconjugates by matrix-assisted laser desorption/ionization mass spectrometry: an update forthe period 2005–2006. Mass Spectrom Rev 2011; 30: 1–100
48 Harvey DJ. Analysis of carbohydrates and glycoconjugates by matrix-assisted laser desorption/ionization mass spectrometry: an update for2007–2008. Mass Spectrom Rev 2012; 31: 183–311
49 Harvey DJ. Analysis of carbohydrates and glycoconjugates by matrix-assisted laser desorption/ionization mass spectrometry: an update for2009–2010. Mass Spectrom Rev 2015; 34: 268–422
50 Chen X, Kong L, Su X, Pan C, Ye M, Zou H. Integration of ion-exchangechromatography fractionation with reversed-phase liquid chromatog-raphy-atmospheric pressure chemical ionization mass spectrometerand matrix-assisted laser desorption/ionization time-of-flight massspectrometry for isolation and identification of compounds in Psoraleacorylifolia. J Chromatogr A 2005; 1089: 87–100
51 Chapagain BP, Wiesman Z.Metabolite profiling of saponins in Balanitesaegyptiaca plant tissues using LC (RI)-ESI/MS and MALDI‑TOF/MS.Metabolomics 2008; 4: 357–366
52 Duncan MW, Roder H, Hunsucker SW. Quantitative matrix-assistedlaser desorption/ionization mass spectrometry. Brief Funct GenomicProteomic 2008; 7: 355–370
53 van Kampen JJA, Burgers PC, de Groot R, Luider TM. Qualitative andquantitative analysis of pharmaceutical compounds by MALDI‑TOFmass spectrometry. Anal Chem 2006; 78: 5403–5411
54 Dingle CT, Butler-Wu SM. MALDI‑TOF mass spectrometry for micro-organism identification. Clin Lab Med 2013; 33: 589–609
55 Lai YH, So PK, Lo SCL, Ng EWY, PoonTCW, Yao ZP. Rapid differentiation ofPanax ginseng and Panax quinquefolius by matrix-assisted laser de-sorption/ionization mass spectrometry. Anal Chim Acta 2012; 753:73–81
56 Wu W, Liang Z, Zhao Z, Cai Z. Direct analysis of alkaloid profiling inplant tissue by using matrix-assisted laser desorption/ionization massspectrometry. J Mass Spectrom 2007; 42: 58–69
57 Wang J, van der Heijden R, Spijksma G, Reijmers T, WangM, Xu G, Hanke-meier T, van der Greef J. Alkaloid profiling of the Chinese herbal medi-cine Fuzi by combination of matrix-assisted laser desorption ionizationmass spectrometry with liquid chromatography-mass spectrometry.J Chromatogr A 2009; 1216: 2169–2178
58 Wu W, Qiao C, Liang Z, Xu H, Zhao Z, Cai Z. Alkaloid profiling in crudeand processed Strychnos nux-vomica seeds bymatrix-assisted laser de-sorption/ionization-time of flight mass spectrometry. J Pharm BiomedAnal 2007; 45: 430–436
59 Zhu F, Cai YZ, Xing J, Ke J, Zhan Z, Corke H. Rapid identification of gallo-tannins from Chinese galls by matrix-assisted laser desorption/ioniza-tion time-of-flight quadrupole ion trap mass spectrometry. RapidCommun Mass Spectrom 2009; 23: 1678–1682
60 Ng KM, Liang Z, Lu W, Tang HW, Zhao Z, Che CM, Cheng YC. In vivo anal-ysis and spatial profiling of phytochemicals in herbal tissue by matrix-assisted laser desorption/ionization mass spectrometry. Anal Chem2007; 79: 2745–2755
61 Greene LA, Isaac I, Gray DE, Schwartz SA. Streamlining plant samplepreparation: the use of high-throughput robotics to process Echinaceasamples for biomarker profiling by MALDI‑TOF mass spectrometry.J Biomol Tech 2007; 18: 238–244
62 Musharraf SG, Ali A, Choudhary MI, Atta-ur-Rahman. Probing of metab-olites in finely powdered plant material by direct laser desorption ion-ization mass spectrometry. J Am Soc Mass Spectrom 2014; 25: 530–537
63 Catharino RR, Marques LA, Santos LS, Baptista AS, Glória EM, Calori-Domingues MA, Facco EMP, Eberlin MN. Aflatoxin screening by MALDI-TOF mass spectrometry. Anal Chem 2005; 77: 8155–8157
64 Fraser PD, Enfissi EM, Goodfellow M, Eguchi T, Bramley PM. Metaboliteprofiling of plant carotenoids using the matrix-assisted laser desorp-tion ionization time-of-flight mass spectrometry. Plant J 2007; 49:552–564
65 Jerez M, Sineiro J, Guitián E, Núnez MJ. Identification of polymeric pro-cyanidins from pine bark by mass spectrometry. Rapid Commun MassSpectrom 2009; 23: 4013–4018
66 Behrens A, Maie N, Knicker H, Kögel-Knabner I. MALDI‑TOF mass spec-trometry and PSD fragmentation as means for the analysis of con-densed tannins in plant leaves and needles. Phytochemistry 2003; 62:1159–1170
67 Jones JJ, Stump MJ, Fleming RC, Lay jr. JO, Wilkins CL. Strategies and dataanalysis techniques for lipid and phospholipid chemistry elucidationby intact cell MALDI-FTMS. J Am Soc Mass Spectrom 2004; 15: 1665–1674
68 Wang J, Sporns P. MALDI‑TOF MS analysis of food flavonol glycosides.J Agric Food Chem 2000; 48: 1657–1662
Silva R et al. Application of MALDI… Planta Med 2016; 82: 671–689
686 Reviews
Thi
s do
cum
ent w
as d
ownl
oade
d fo
r pe
rson
al u
se o
nly.
Una
utho
rized
dis
trib
utio
n is
str
ictly
pro
hibi
ted.
69 Svatoš A. Single-cell metabolomics comes of age: new developments inmass spectrometry profiling and imaging. Anal Chem 2011; 83: 5037–5044
70 Kueger S, Steinhauser D,Willmitzer L, Giavalisco P.High-resolution plantmetabolomics: from mass spectral features to metabolites and fromwhole-cell analysis to subcellular metabolite distributions. Plant J2012; 70: 39–50
71 Hegeman AD. Plant metabolomics-meeting the analytical challenges ofcomprehensive metabolite analysis. Brief Funct Genomics 2010; 9:139–148
72 Shroff R, Rulíšek L, Doubský J, Svatoš A. Acid-base-driven matrix-assis-ted mass spectrometry for targeted metabolomics. Proc Natl Acad SciU S A 2009; 106: 10092–10096
73 Kaspar S, Peukert M, Svatos A, Matros A, Mock HP.MALDI-imaging massspectrometry – An emerging technique in plant biology. Proteomics2011; 11: 1840–1850
74 Silva DB, Turatti ICC, Gouveia DR, Ernst M, Teixeira SP, Lopes NP. Massspectrometry of flavonoid vicenin-2, based sunlight barriers in Lychno-phora species. Sci Rep 2014; 4: 4309
75 Lee YJ, Perdian DC, Song Z, Yeung ES, Nikolau BJ. Use of mass spectrom-etry for imaging metabolites in plants. Plant J 2012; 70: 81–95
76 Fuchs B, Süß R, Nimptsch A, Schiller J.MALDI‑TOF‑MS directly combinedwith TLC: a review of the current state. Chromatographia 2009; 69:S95–S105
77 Fuchs B, Schiller J, Süss R, Schürenberg M, Suckau D. A direct and simplemethod of coupling matrix-assisted laser desorption and ionizationtime-of-flight mass spectrometry (MALDI‑TOF MS) to thin-layer chro-matography (TLC) for the analysis of phospholipids from egg yolk. AnalBioanal Chem 2007; 389: 827–834
78 Bonfill M, Mangas S, Cusidó RS, Osuna L, Piño MT, Palazón J. Identifica-tion of triterpenoid compounds of Centella asiatica by thin-layer chro-matography and mass spectrometry. Biomed Chromatogr 2006; 20:151–153
79 Hayen H, Volmer DA. Rapid identification of siderophores by combinedthin-layer chromatography/matrix-assisted laser desorption/ioniza-tion mass spectrometry. Rapid Commun Mass Spectrom 2005; 19:711–720
80 Shariatgorji M, Spacil Z, Maddalo G, Cardenas LB, Ilag LL. Matrix-freethin-layer chromatography/laser desorption ionization mass spec-trometry for facile separation and identification of medicinal alkaloids.Rapid Commun Mass Spectrom 2009; 23: 3655–3660
81 Yamagaki T, Watanabe T. Hydrogen radical removal causes complexoverlapping isotope patterns of aromatic carboxylic acids in negative-ion matrix-assisted laser desorption/ionization mass spectrometry.Mass Spectrom (Tokyo) 2012; 1: A0005
82 Wang X, Han J, Chou A, Yang J, Pan J, Borchers CH. Hydroxyflavones as anew family of matrices for MALDI tissue imaging. Anal Chem 2013; 85:7566–7573
83 Hvattum E, Ekeberg D. Study of the collision-induced radical cleavage offlavonoid glycosides using negative electrospray ionization tandemquadrupole mass spectrometry. J Mass Spectrom 2003; 38: 43–49
84 Houston CT, Taylor WP, Widlanski TS, Reilly JP. Investigation of enzymekinetics using quench-flow techniques with MALDI‑TOF mass spec-trometry. Anal Chem 2000; 72: 3311–3319
85 Xu Z, Yao S, Wei Y, Zhou J, Zhang L, Wang C, Guo Y. Monitoring enzymereaction and screening of inhibitors of acetylcholinesterase by quanti-tative matrix-assisted laser desorption/ionization fourier transformmass spectrometry. J Am Soc Mass Spectrom 2008; 19: 1849–1855
86 Su X, Kong L, Lei X, Hu L, Ye M, Zou H. Biological fingerprinting analysisof traditional Chinese medicines with targeting ADME/Tox propertyfor screening of bioactive compounds by chromatographic and MSmethods. Mini Rev Med Chem 2007; 7: 87–98
87 Pan C, Xu S, Hu L, Su X, Ou J, Zou H, Guo Z, Zhang Y, Guo B. Using oxidizedcarbon nanotubes as matrix for analysis of small molecules by MALDI-TOF MS. J Am Soc Mass Spectrom 2005; 16: 883–892
88 Xu SY, Li YF, Zou HF, Qiu JS, Guo Z, Guo BC. Carbon nanotubes as assistedmatrix for laser desorption/ionization time-of-flight mass spectrome-try. Anal Chem 2003; 75: 6191–6195
89 Ugarov MV, Egan T, Khabashesku DV, Schultz JA, Peng HQ, KhabasheskuVN, Furutani H, Prather KS, Wang HWJ, Jackson SN, Woods AS. MALDImatrices for biomolecular analysis based on functionalized carbonnanomaterials. Anal Chem 2004; 76: 6734–6742
90 Fisher AA, Labenski MT, Monks TJ, Lau SS. Utilization of MALDI‑TOF todetermine chemical-protein adduct formation in vitro. Methods MolBiol 2011; 691: 303–316
Silva R et al. Application of MALDI… Planta Med 2016; 82: 671–689
91 Mané C, Sommerer N, Yalcin T, Cheynier V, Cole RB, Fulcrand H. Assess-ment of themolecular weight distribution of tannin fractions throughMALDI‑TOF MS analysis of protein-tannin complexes. Anal Chem2007; 79: 2239–2248
92 Chen Y, Hagerman AE. Characterization of soluble non-covalentcomplexes between bovine serum albumin and β-1, 2, 3, 4, 6-penta-O-galloyl-D-glucopyranose by MALDI‑TOF MS. J Agric Food Chem2004; 52: 4008–4011
93 Xu S, Pan C, Hu L, Zhang Y, Guo Z, Li X, Zou H. Enzymatic reaction of theimmobilized enzyme on porous silicon studied by matrix-assistedlaser desorption/ionization-time of flight-mass spectrometry. Elec-trophoresis 2004; 25: 3669–3676
94 Caprioli RM, Farme TB, Gile J.Molecular imaging of biological sample-s: localization of peptides and proteins using MALDI‑TOF MS. AnalChem 1997; 69: 4751–4760
95 Schwamborn K, Caprioli RM.Molecular imaging bymass spectrometry– looking beyond classical histology. Nat Rev Cancer 2010; 10: 639–646
96 Balluff B, Schöne C, Höfler H, Walch A.MALDI imaging mass spectrom-etry for direct tissue analysis: technological advancements and recentapplications. Histochem Cell Biol 2011; 136: 227–244
97 Watrous JD, Alexandrov T, Dorrestein PC. The evolving field of imagingmass spectrometry and its impact on future biological research.J Mass Spectrom 2011; 46: 209–222
98 Nunes TM, Mateus S, Favaris AP, Amaral MF, Zuben LG, Clososki GC,Bento JMS, Oldroyd BP, Silva R, Zucchi R, Silva DB, Lopes NP. Queen sig-nals in a stingless bee: suppression of worker ovary activation andspatial distribution of active compounds. Sci Rep 2014; 4: 7449
99 Andersson M, Andren P, Caprioli RM. MALDI imaging and profilingmass spectrometry in neuroproteomics. In: Aalzate O, editor. Neuro-proteomics. Boca Raton, FL: CRC Press/Taylor & Francis; 2010:115–134
100 Dong Y, Li B, Malitsky S, Rogachev I, Aharoni A, Kaftan F, Svatoš A,Franceschi P. Sample preparation for mass spectrometry imaging ofplant tissues: a review. Front Plant Sci 2016; 7: 60
101 Burrell M, Earnshaw C, Clench M. Imaging matrix assisted laserdesorption ionization mass spectrometry: a technique to map plantmetabolites within tissues at high spatial resolution. J Exp Bot 2007;58: 757–763
102 Esquenazi E, Yang YL, Watrous J, Gerwick WH, Dorrestein PC. Imagingmass spectrometry of natural products. Nat Prod Rep 2009; 26:1521–1534
103 Watrous JD, Dorrestein PC. Imaging mass spectrometry in microbiol-ogy. Nat Rev Microbiol 2011; 9: 683–694
104 Moree WJ, Phelan VV, Wu CH, Bandeira N, Cornett DS, Duggan BM,Dorrestein PC. Interkingdom metabolic transformations captured bymicrobial imaging mass spectrometry. Proc Natl Acad Sci U S A 2012;109: 13811–13816
105 Handberg E, Chingin K, Wang N, Dai X, Chen H. Mass spectrometryimaging for visualizing organic analytes in food. Mass Spectrom Rev2015; 34: 641–658
106 Shroff R, Vergara F, Muck A, Svatoš A, Gershenzon J. Nonuniform distri-bution of glucosinolates in Arabidopsis thaliana leaves has importantconsequences for plant defense. Proc Natl Acad Sci U S A 2008; 105:6196–6201
107 Hölscher D, Shroff R, Knop K, Gottschaldt M, Crecelius A, Schneider B,Heckel DG, Schubert US, Svatos A. Matrix-free UV-laser desorption/ionization (LDI) mass spectrometric imaging at the single-cell level:distribution of secondary metabolites of Arabidopsis thaliana andHypericum species. Plant J 2009; 60: 907–918
108 Franceschi P, Dong Y, Strupat K, Vrhovsek U, Mattivi F. Combining in-tensity correlation analysis and MALDI imaging to study the distribu-tion of flavonols and dihydrochalcones in Golden Delicious apples.J Exp Bot 2012; 63: 1123–1133
109 Goto-Inoue N, SetouM, Zaima N. Visualization of spatial distribution ofgamma-aminobutyric acid in eggplant (Solanum Melongena) by ma-trix-assisted laser desorption/ionization imaging mass spectrometry.Anal Sci 2010; 26: 821–825
110 Goodwin RJ. Sample preparation for mass spectrometry imaging:small mistakes can lead to big consequences. J Proteomics 2012; 75:4893–4911
111 Peukert M, Matros A, Lattanzio G, Kaspar S, Abadía J, Mock HP. Spatiallyresolved analysis of small molecules by matrix-assisted laser desorp-tion/ionization mass spectrometric imaging (MALDI‑MSI). New Phy-tol 2012; 193: 806–815
687Reviews
Thi
s do
cum
ent w
as d
ownl
oade
d fo
r pe
rson
al u
se o
nly.
Una
utho
rized
dis
trib
utio
n is
str
ictly
pro
hibi
ted.
112 Prentice BM, Chumbley CW, Caprioli RM. High-speed MALDI MS/MSimaging mass spectrometry using continuous raster sampling. J MassSpectrom 2015; 50: 703–710
113 McDonnell LA, Römpp A, Balluff B, Heeren RMA, Albar JP, Andrén PE,Corthals GL, Walch A, Stoeckli M. Discussion point: reporting guide-lines for mass spectrometry imaging. Anal Bioanal Chem 2015; 407:2035–2045
114 Thiele H, Heldmann S, Trede D, Strehlow J, Wirtz S, Dreher W, Berger J,Oetjen J, Kobarg JH, Fischer B, Maass P. 2D and 3D MALDI-imaging:conceptual strategies for visualization and data mining. Biochim Bio-phys Acta 2014; 1844: 117–137
115 Heeren RMA. Getting the picture: The coming of age of imaging MS.Int J Mass Spectrom 2015; 377: 672–680
116 Heyman HM, Dubery IA. The potential of mass spectrometry imagingin plant metabolomics: a review. Phytochem Rev 2016; 15: 297–316
117 Horn PJ, Chapman KD. Lipidomics in situ: insights into plant lipid me-tabolism from high resolution spatial maps of metabolites. Prog LipidRes 2014; 54: 32–52
118 Dalisay DS, Kim KW, Lee C, Yang H, Rübel O, Bowen BP, Davin LB, LewisNJ. Dirigent protein-mediated lignan and cyanogenic glucoside for-mation in flax seed: integrated omics and MALDI mass spectrometryimaging. J Nat Prod 2015; 78: 1231–1242
119 Cotter RJ. Time-of-flight mass spectrometer. In: Cole RB, editor. Elec-trospray and MALDI mass spectrometry: fundamentals, instrumenta-tion, practicalities, and biological applications. Hoboken: John Wiley& Sons; 2010: 345–364
120 Wolff JJ, Amster IJ. Fourier transform ion cyclotron resonance andmagnetic sector analyzers for ESI and MALDI. In: Cole RB, editor. Elec-trospray and MALDI mass spectrometry: fundamentals, instrumenta-tion, practicalities, and biological applications. Hoboken: John Wiley& Sons; 2010: 365–406
121 Hakansson K, Klassen JS. Ion activation methods for tandem massspectrometry. In: Cole RB, editor. Electrospray and MALDI mass spec-trometry: fundamentals, instrumentation, practicalities, and biologi-cal applications. Hoboken: John Wiley & Sons; 2010: 571–630
122 March RE, Li H, Belgacem O, Papanastasiou D. High-energy and low-energy collision-induced dissociation of protonated flavonoids gener-ated by MALDI and by electrospray ionization. Int J Mass Spectrom2007; 262: 51–66
123 Zhou X,Wei Y, He Q, Boey F, Zhang Q, Zhang H. Reduced graphene oxidefilms used asmatrix of MALDI‑TOF‑MS for detection of octachlorodi-benzo-p-dioxin. Chem Commun (Camb) 2010; 46: 6974–6976
124 Madeira PJA, Florêncio MH. Flavonoid-matrix cluster ions in MALDImass spectrometry. J Mass Spectrom 2009; 44: 1105–1113
125 Yamagaki T, Watanabe T, TanakaM, Sugahara K. Laser-Induced hydro-gen radical removal in UV MALDI MS allows for the differentiation offlavonoid monoglycoside isomers. J Am Soc Mass Spectrom 2014; 25:88–94
126 Pavarini DP, Silva DB, Carollo CA, Portella APF, Latansio-Aidar SR,Cavalin PO, Oliveira VC, Rosado BHP, Aidar MPM, Bolzani VS, Lopes NP,Joly CA. Application of MALDI‑MS analysis of rainforest chemodiver-sity: a keystone for biodiversity conservation and sustainable use.J Mass Spectrom 2012; 47: 1482–1485
127 March RE, Lewars EG, Stadey CJ, Miao XS, Zhao X, Metcalfe CD. A com-parison of flavonoid glycosides by electrospray tandem mass spec-trometry. Int J Mass Spectrom 2006; 248: 61–85
128 Radebe N, Rode K, Pizzi A, Pasch H. Microstructure elucidation ofpolyflavonoid tannins by MALDI‑TOF‑CID. J Appl Polym Sci 2012;127: 1937–1950
129 Moneti G, Francese S, Mastrobuoni G, Pieraccini G, Seraglia R, ValituttiG, Traldi P. Do collisions inside the collision cell play a relevant role inCID-LIFT experiments? J Mass Spectrom 2007; 42: 117–126
130 Neubert H, Halket JM, Ocana MF, Patel RKP. MALDI post-source decayand LIFT‑TOF/TOF investigation of α-cyano-4-hydroxycinnamic acidcluster interferences. J Am Soc Mass Spectrom 2004; 15: 336–343
131 Jespersen S, Chaurand P, van Strien FJ, Spengler B, van der Greef J. Directsequencing of neuropeptides in biological tissue by MALDI‑PSD massspectrometry. Anal Chem 1999; 71: 660–666
132 Spengler B. Post-source decay analysis in matrix-assisted laser de-sorption/ionization mass spectrometry of biomolecules. J Mass Spec-trom 1997; 32: 1019–1036
133 Talbo G, Mann M. Aspects of the sequencing of carbohydrates andoligonucleotides by matrix-assisted laser desorption/ionization post-source decay. Rapid Commun Mass Spectrom 1996; 10: 100–103
134 Zehl M, Pittenauer E, Jirovetz L, Bandhari P, Singh B, Kaul VK, Rizzi AR,Allmaier G.Multistage and tandemmass spectrometry of glycosylatedtriterpenoid saponins isolated from Bacopa monnieri: comparison ofthe information content provided by different techniques. Anal Chem2007; 79: 8214–8221
135 Wang J, Sporns P. MALDI‑TOF MS analysis of isoflavones in soy prod-ucts. J Agric Food Chem 2000; 48: 5887–5892
136 Wingerath T, StahlW, KirschD, Kaufmann R, Sies H. Fruit juice carotenolfatty acid esters and carotenoids as identified bymatrix-assisted laserdesorption ionization (MALDI) mass spectrometry. J Agric Food Chem1996; 44: 2006–2013
137 Radebe N, Rode K, Pizzi A, Giovando S, Pasch H.MALDI‑TOF‑CID for themicrostructure elucidation of polymeric hydrolysable tannins. J ApplPolym Sci 2013; 128: 97–107
138 Fuchs B, Schober C, Richter G, Süss R, Schiller J.MALDI‑TOF MS of phos-phatidylethanolamines: different adducts cause different post sourcedecay (PSD) fragment ion spectra. J Biochem Biophys Methods 2007;70: 689–692
139 Picariello G, Sacchi R, Addeo F. One-step characterization of triacylgly-cerols from animal fat byMALDI‑TOFMS. Eur J Lipid Sci Technol 2007;109: 511–524
140 Fuchs B, Süss R, Schiller J. An update of MALDI‑TOF mass spectrometryin lipid research. Prog Lipid Res 2010; 49: 450–475
141 Guaratini T, Vessecchi R, Pinto E, Colepicolo P, Lopes NP. Balance of xan-thophylls molecular and protonated molecular ions in electrosprayionization. J Mass Spectrom 2005; 40: 963–968
142 Vessecchi E, Crotti AE, Guaratini T, Colepicolo P, Galembeck SE, Lopes NP.Radical ion generation processes of organic compounds in electro-spray ionization mass spectrometry. Mini Rev Org Chem 2007; 4:75–87
143 van Breemen RB, Schmitz HH, Schwartz SJ. Fast atom bombardmenttandem mass spectrometry of carotenoids. J Agric Food Chem 1995;43: 384–389
144 Kéki S, Deák G, Lévai A, Zsuga M. Post-source decay matrix-assisted la-ser desorption/ionization mass spectrometric study of peracetylatedisoflavone glycosides cationized by protonation and with variousmetal ions. J Mass Spectrom 2003; 38: 1207–1209
145 Kéki S, Nagy L, Deák G, Zsuga M, Somogyi L, Lévai A. Cationization ofsimple organic molecules by singly-charged Ag3+ cluster ions in ma-trix-assisted laser desorption/ionization mass spectrometry: metalcluster-molecule interactions. J Am Soc Mass Spectrom 2004; 15:879–883
146 Guo S, Falk E, Kenne L, Rönnberg B, Sundquist BG. Triterpenoid sa-ponins containing an acetylated branched D-fucosyl residue fromQuillaja saponaria Molina. Phytochemistry 2000; 53: 861–868
147 Dyck SV, Gerbaux P, Flammang P. Elucidation of molecular diversityand body distribution of saponins in the sea cucumber Holothuriaforskali (Echinodermata) by mass spectrometry. Comp BiochemPhysiol B BiochemMol Biol 2009; 152: 124–134
148 Cheng C, Gross ML. Applications and mechanisms of charge-remotefragmentation. Mass Spectrom Rev 2000; 19: 398–420
149 GriffithsW. Tandemmass spectrometry in the study of fatty acids, bileacids, and steroids. Mass Spectrom Rev 2003; 22: 81–152
150 Bahrami Y, Zhang W, Chataway T, Franco C. Structural elucidation ofnovel saponins in the sea cucumber Holothuria lessoni. Mar Drugs2014; 12: 4439–4473
151 Bahrami Y, Zhang W, Franco C. Discovery of novel saponins from theviscera of the sea cucumber Holothuria lessoni. Mar Drugs 2014; 12:2633–2667
152 Pasch H, Pizzi A, Rode K. MALDI‑TOF mass spectrometry of poly-flavonoid tannins. Polymer (Guildf) 2001; 42: 7531–7539
153 Guaratini T, Armelini AI, Ferrari CR, Schefer RR, Neto AP, Navas R,Reigada JB, Silva DB. Application of matrix-assisted laser-desorption/ionization time-of-flight LIFT for identification of cocoa condensedtannins. J Mass Spectrom 2014; 49: 251–255
154 Mateos-Martín ML, Fuguet E, Quero C, Pérez-Jiménez J, Torres JL. Newidentification of proanthocyanidins in cinnamon (Cinnamomumzeylanicum L.) using MALDI‑TOF/TOF MS. Anal Bioanal Chem 2012;402: 1327–1336
155 Prado LC, Silva DB, de Oliveira-Silva GL, Hiraki KR, Canabrava HA,Bispo-da-Silva LB. The gastroprotective effects of Eugenia dysenterica(Myrtaceae) leaf extract: the possible role of condensed tannins. BiolPharm Bull 2014; 37: 722–730
156 Trentin DS, Silva DB, Amaral MW, Zimmer KR, Silva MV, Lopes NP,Giordani RB, Macedo AJ. Tannins possessing bacteriostatic effect im-
Silva R et al. Application of MALDI… Planta Med 2016; 82: 671–689
688 Reviews
Thi
s do
cum
ent w
as d
ownl
oade
d fo
r pe
rson
al u
se o
nly.
Una
utho
rized
dis
trib
utio
n is
str
ictly
pro
hibi
ted.
pair Pseudomonas aeruginosa adhesion and biofilm formation. PLoSOne 2013; 11: e66257
157 Trentin DS, Silva DB, Frasson AP, Rzhepishevska O, da Silva MV, PulciniEL, James G, Soares GV, Tasca T, Ramstedt M, Giordani RB, Lopes NP,Macedo AJ. Natural Green coating inhibits adhesion of clinically im-portant bacteria. Sci Rep 2015; 5: 8287
158 Pérez-Jiménez J, Torres JL. Analysis of proanthocyanidins in almondblanch water by HPLC–ESI–QqQ–MS/MS and MALDI–TOF/TOF MS.Food Res Int 2012; 49: 798–806
159 Cai YZ, Xing J, Sun M, Zhan ZK, Corke H. Phenolic antioxidants (hydro-lyzable tannins, flavonols, and anthocyanins) identified by LC‑ESI‑MSand MALDI‑QIT‑TOF MS from Rosa chinensis flowers. J Agric FoodChem 2005; 53: 9940–9948
160 Sáyago-Ayerdi SG, Moreno-Hernández CL, Montalvo-González E, Gar-cía-MagañaML, OcaMMM, Torres JL, Pérez-Jiménez J.Mexican ‘Ataulfo’mango (Mangifera indica L) as a source of hydrolyzable tannins. Anal-ysis by MALDI‑TOF/TOF MS. Food Res Int 2013; 51: 188–194
161 Xiang P, Lin Y, Lin P, Xiang C, Yang Z, Lu Z. Effect of cationizationreagents on the matrix-assisted laser desorption/ionization time-of-flight mass spectrum of Chinese gallotannins. J Appl Polym Sci 2007;105: 859–864
162 Silva VC, Napolitano A, Eletto D, Rodrigues CM, Pizza C, VilegasW. Char-acterization of gallotannins from Astronium species by flow injectionanalysis- electrospray ionization-ion trap-tandem mass spectrome-try and matrix-assisted laser desorption/ionization time-of- flightmass spectrometry. Eur J Mass Spectrom 2011; 17: 365–375
163 Reed JD, Krueger CG, Vestling MM. MALDI‑TOF mass spectrometry ofoligomeric food polyphenols. Phytochemistry 2005; 66: 2248–2263
164 Meyers KJ, Swiecki TJ, Mitchell AE. Understanding the native Califor-nian diet: identification of condensed and hydrolyzable tannins intanoak acorns (Lithocarpus densiflorus). J Agric Food Chem 2006; 54:7686–7691
165 Berardini N, Carle R, Schieber A. Characterization of gallotannins andbenzophenone derivatives frommango (Mangifera indica L. cv.‘Tommy Atkinsʼ) peels, pulp and kernels by high-performance liquidchromatography/electrospray ionization mass spectrometry. RapidCommun Mass Spectrom 2004; 18: 2208–2216
166 Spina E, Sturiale L, Romeo D, Impallomeni G, Garozzo D, Waidelich D,Glueckmann M. New fragmentation mechanisms in matrix-assistedlaser desorption/ionization time-of-flight/time-of-flight tandemmass spectrometry of carbohydrates. Rapid Commun Mass Spectrom2004; 18: 392–398
167 Harvey DJ. Matrix-assisted laser desorption/ionization mass spec-trometry of carbohydrates. Mass Spectrom Rev 1999; 18: 349–451
168 Yoshimura Y, Zaima N, Moriyama T, Kawamura Y. Different localiza-tion patterns of anthocyanin species in the pericarp of black rice re-vealed by imaging mass spectrometry. PLoS One 2012; 7: e31285
169 MenetMC, Sang S, Yang CS, Ho CT, Rosen RT. Analysis of theaflavins andthearubigins from black tea extract by MALDI‑TOF mass spectrome-try. J Agric Food Chem 2004; 52: 2455–2461
170 Yassin GH, Koek JH, Kuhnert N. Identification of trimeric and tetramericflavan-3-ol derivatives in the SII black tea thearubigin fraction ofblack tea using ESI-tandem and MALDI‑TOF mass spectrometry. FoodRes Int 2014; 63: 317–327
171 Ho YC, TsengMC, Lu YW, Lin CC, Chen YJ, FuhMR.Nanoparticle-assistedMALDI‑TOF MS combined with seed layer surface preparation forquantification of small molecules. Anal Chim Acta 2011; 697: 1–7
172 Pham TV, Jimenez CR. OplAnalyzer: a toolbox for MALDI‑TOF massspectrometry data analysis. In: Perner P, Salvetti O, editors. Advancesin mass data analysis of images and signals in medicine, biotechnol-ogy, chemistry and food industry, 3rd edition. Leipzig, Germany:Springer; 2008: 73–81
173 Kumar C, Mann M. Bioinformatics analysis of mass spectrometry-based proteomics data sets. FEBS Lett 2009; 583: 1703–1712
174 Alexandrov T. MALDI imaging mass spectrometry: statistical dataanalysis and current computational challenges. BMC Bioinformatics2012; 13: S11
175 Morris JS, Baggerly KA, Gutstein HB, Coombes KR. Statistical contribu-tions to proteomic research. Methods Mol Biol 2010; 641: 143–166
176 Ge G, Wong GW. Classification of premalignant pancreatic cancermass-spectrometry data using decision tree ensembles. BMC Bio-informatics 2008; 9: 275
177 Tong DL, Boocock DJ, Coveney C, Saif J, Gomez SG, Querol S, Rees R, BallGR. A simpler method of preprocessingMALDI‑TOFMS data for differ-
Silva R et al. Application of MALDI… Planta Med 2016; 82: 671–689
ential biomarker analysis: stem cell and melanoma cancer studies.Clin Proteomics 2011; 8: 14
178 Ressom HW, Varghese RS, Goldman L, Loffredo CA, Abdel-Hamid M,Kyselova Z, Mechref Y, Novotny M, Goldman R. Analysis of MALDI‑TOFmass spectrometry data for detection of glycan biomarkers. Pac SympBiocomput 2008; 216–227
179 Oberg AL, Vitek O. Statistical design of quantitative mass spectrome-try-based proteomic experiments. J Proteome Res 2009; 8: 2144–2156
180 Hu J, Coombes KR, Morris JS, Baggerly KA. The importance of experi-mental design in proteomic mass spectrometry experiments: somecautionary tales. Brief Funct Genomic Proteomic 2005; 3: 322–331
181 Cairns DA. Statistical issues in quality control of proteomic analyses:good experimental design and planning. Proteomics 2011; 11:1037–1048
182 Zhang L, Borror CM, Sandrin TR. A designed experiments approach tooptimization of automated data acquisition during characterization ofbacteria with MALDI‑TOF mass spectrometry. PLoS One 2014; 9:e92720
183 Xiang B, Prado M. An accurate and clean calibration method forMALDI‑MS. J Biomol Tech 2010; 21: 116–119
184 Saideman SR, Ma M, Kutz-Naber KK, Cook A, Torfs P, Schoofs L, Li L,Nusbaum MP. Modulation of rhythmic motor activity by pyrokininpeptides. J Neurophysiol 2007; 97: 579–595
185 He Z, Qi RZ, Yu W. Bioinformatic analysis of data generated fromMALDI mass spectrometry for biomarker discovery. Top Curr Chem2013; 331: 193–209
186 Hilario M, Kalousis A. Approaches to dimensionality reduction in pro-teomic biomarker studies. Brief Bioinform 2008; 9: 102–118
187 Hilario M, Kalousis A, Pellegrini C, Müller M. Processing and classifica-tion of protein mass spectra. Mass Spectrom Rev 2006; 25: 409–449
188 Gibb S, Strimmer K.MALDIquant: a versatile R package for the analysisof mass spectrometry data. Bioinformatics 2012; 28: 2270–2271
189 Ryan CG, Clayton E, Griffin WL, Sie SH, Cousens DR. SNIP, a statistics-sensitive background treatment for the quantitative analysis of PIXEspectra in geoscience applications. Nucl Instrum Methods Phys Res B1988; 34: 396–402
190 Veltri P. Algorithms and tools for analysis and management of massspectrometry data. Brief Bioinform 2008; 9: 144–155
191 He QP, Wang J, Mobley JA, Richman J, Grizzle WE. Self-calibrated warp-ing for mass spectra alignment. Cancer Inform 2011; 10: 65–82
192 Bloemberg TG, Gerretzen J, Lunshof A, Wehrens R, Buydens LMC.Warp-ing methods for spectroscopic and chromatographic signal align-ment: a tutorial. Anal Chim Acta 2013; 781: 14–32
193 R Development Core Team. R: A language and environment for statisti-cal computing. Vienna, Austria: R Foundation for Statistical Comput-ing; 2010
194 Yang C, He Z, Yu W. Comparison of public peak detection algorithmsfor MALDI mass spectrometry data analysis. BMC Bioinformatics2009; 10: 4
195 Smith CA, Want EJ, OʼMaille G, Abagyan R, Siuzdak G. XCMS: processingmass spectrometry data for metabolite profiling using nonlinear peakalignment, matching, and identification. Anal Chem 2006; 78: 779–787
196 Wang W, Zhou H, Lin H, Roy S, Shaler TA, Hill LR, Norton S, Kumar P,Anderle M, Becker CH. Quantification of proteins and metabolites bymass spectrometry without isotopic labeling or spiked standards.Anal Chem 2003; 75: 4818–4826
197 Ejigu BA, Valkenborg D, Baggerman G, Vanaerschot M, Witters E, Dujar-din JC, Burzykowski T, Berg M. Evaluation of normalization methods topave the way towards large-scale LC‑MS-based metabolomics profil-ing experiments. OMICS 2013; 17: 473–485
198 Deininger SO, Cornett DS, Paape R, Becker M, Pineau C, Rauser S, WalchA, Wolski E. Normalization in MALDI‑TOF imaging datasets of pro-teins: practical considerations. Anal Bioanal Chem 2011; 401: 167–181
199 Webb A. Statistical pattern recognition. New York: Oxford UniversityPress; 1999
200 Suzuki R, Shimodaira H. Pvclust: an R package for assessing the uncer-tainty in hierarchical clustering. Bioinformatics 2006; 22: 1540–1542
201 Wehrens R. Chemometrics with R: multivariate data analysis in thenatural sciences and life sciences (Use R!). New York: Springer; 2011
202 Alexandrov T, Kobarg JH. Efficient spatial segmentation of large imag-ing mass spectrometry datasets with spatially aware clustering.Bioinformatics 2011; 27: i230-i238
689Reviews
Thi
s do
cum
ent w
as d
ownl
oade
d fo
r pe
rson
al u
se o
nly.
Una
utho
rized
dis
trib
utio
n is
str
ictly
pro
hibi
ted.
203 Giacomoni F, Le Corguillé G, Monsoor M, Landi M, Pericard P, Pétéra M,Duperier C, Tremblay-Franco M, Martin JF, Jacob D, Goulitquer S,Thévenot EA, Caron C. Workflow4Metabolomics: a collaborative re-search infrastructure for computational metabolomics. Bioinfor-matics 2015; 31: 1493–1495
204 Steinbeck C, Conesa P, Haug K, Mahendraker T, Williams M, Maguire E,Rocca-Serra P, Sansone SA, Salek RM, Griffin JL.MetaboLights: towardsa new COSMOS of metabolomics data management. Metabolomics2012; 8: 757–760
205 Ara T, Enomoto M, Arita M, Ikeda C, Kera K, Yamada M, Nishioka T,Ikeda T, Nihei Y, Shibata D, Kanaya S, Sakurai N. Metabolonote: awiki-based database for managing hierarchical metadata of metabo-lome analyses. Front Bioeng Biotechnol 2015; 3: 38
206 Aamodt A, Plaza E. Case-based reasoning: foundational issues, meth-odological variations, and system approaches. AI communications1994; 7: 39–59
207 Forim MR, Cornélio VE, da Silva MF, Rodrigues-Filho E, Fernandes JB,Vieira PC, Matinez SS, Napolitano MP, Yost RA. Chemical characteriza-tion of Azadirachta indica grafted on Melia azedarach and analyses ofazadirachtin by HPLC‑MS‑MS (SRM) and meliatoxins by MALDI‑MS.Phytochem Anal 2010; 21: 363–373
208 Pogam PL, Schinkovitz A, Legouin B, Lamer ACL, Boustie L, Richomme P.Matrix-free UV-laser desorption ionization mass spectrometry as aversatile approach for accelerating dereplication studies on lichens.Anal Chem 2015; 87: 10421–10428
209 Wang H, Dai B, Liu B, Lu H. Coumarins as new matrices for matrix-as-sisted laser-desorption/ionization Fourier transform ion cyclotronresonance mass spectrometric analysis of hydrophobic compounds.Anal Chim Acta 2015; 882: 49–57
210 Annangudi SP, Myung K, Adame CA, Gilbert JR. MALDI‑MS imaginganalysis of fungicide residue distributions on wheat leaf surfaces.Environ Sci Technol 2015; 49: 5579–5583
211 Berisha A, Dold S, Guenther S, Desbenoit N, Takats Z, Spengler B, RömppA. A comprehensive high-resolution mass spectrometry approach forcharacterization of metabolites by combination of ambient ionization,chromatography and imaging methods. Rapid Commun Mass Spec-trom 2014; 28: 1779–1791
212 Sekuła J, Nizioł J, Misiorek M, Dec P, Wrona A, Arendowski A, Ruman T.Gold nanoparticle-enhanced target for MS analysis and imaging ofharmful compounds in plant, animal tissue and on fingerprint. AnalChim Acta 2015; 895: 45–53
213 Shroff R, Schramm K, Jeschke V, Nemes P, Vertes A, Gershenzon J, SvatošA. Quantification of plant surface metabolites by MALDI mass spec-trometry imaging: glucosinolates on Arabidopsis thaliana leaves.Plant J 2015; 81: 961–972
214 Takahashi K, Kozuka T, Anegawa A, Nagatani A, Mimura T. Develop-ment and application of a high-resolution imaging mass spectrome-ter for the study of plant tissues. Plant Cell Physiol 2015; 56: 1329–1338
215 Oliveira DN, Ferreira MS, Catharino RR. Rapid and simultaneous in situassessment of aflatoxins and stilbenes using silica plate imprintingmass spectrometry imaging. PLoS One 2014; 9: e90901
216 Gamboa-Becerra R, Ramírez-Chávez E, Molina-Torres J, Winkler R. MSI.R scripts reveal volatile and semi-volatile features in low-temperatureplasma mass spectrometry imaging (LTP‑MSI) of chilli (Capsicumannuum). Anal Bioanal Chem 2015; 407: 5673–5684
217 Soares MS, da Silva DF, Forim MR, da Silva MF, Fernandes JB, Vieira PC,Silva DB, Lopes NP, de Carvalho SA, de Souza AA, Machado MA. Quanti-fication and localization of hesperidin and rutin in Citrus sinensisgrafted on C. limonia after Xylella fastidiosa infection by HPLC‑UV
and MALDI imaging mass spectrometry. Phytochemistry 2015; 115:161–170
218 Araujo P, Ferreira MS, de Oliveira DN, Pereira L, Sawaya AC, CatharinoRR, Mazzafera P. Mass spectrometry imaging: an expeditious andpowerful technique for fast in situ lignin assessment in Eucalyptus.Anal Chem 2014; 86: 3415–3419
219 Li B, Bhandari DR, Janfelt C, Römpp A, Spengler B. Natural products inGlycyrrhiza glabra (licorice) rhizome imaged at the cellular level byatmospheric pressure matrix-assisted laser desorption/ionizationtandem mass spectrometry imaging. Plant J 2014; 80: 161–171
220 Horn PJ, Chapman KD.Metabolite Imager: customized spatial analysisof metabolite distributions in mass spectrometry imaging. Metabo-lomics 2014; 10: 337–348
221 Liaimer A, Helfrich EJN, Hinrichs K, Guljamow A, Ishida K, Hertweck C,Dittmann E. Nostopeptolide plays a governing role during cellular dif-ferentiation of the symbiotic cyanobacterium Nostoc punctiforme.Proc Natl Acad Sci U S A 2015; 112: 1862–1867
222 Peukert M, Thiel J, Peshev D, Weschke W, Van den Ende W, Mock HP,Matros A. Spatio-temporal dynamics of fructan metabolism in devel-oping barley grains. Plant Cell 2014; 26: 3728–3744
223 Kusari S, Sezgin S, Nigutova K, Cellarova E, Spiteller M. Spatial chemo-profiling of hypericin and related phytochemicals in Hypericum spe-cies using MALDI-HRMS imaging. Anal Bioanal Chem 2015; 407:4779–4791
224 Rudolph-Mohr N, Gottfried S, Lamshöft M, Zühlke S, Oswald SE, SpitellerM. Non-invasive imaging techniques to study O2 micro-patternsaround pesticide treated lupine roots. Geoderma 2015; 239–240:257–264
225 Gemperline E, Jayaraman D, Maeda J, Ané JM, Li L. Multifaceted inves-tigation of metabolites during nitrogen fixation in medicago via highresolution MALDI‑MS imaging and ESI‑MS. J Am Soc Mass Spectrom2015; 26: 149–158
226 Holscher D, Fuchser J, Knop K, Menezes RC, Buerkert A, Svatoš A, Schu-bert US, Schneider B. High resolution mass spectrometry imaging re-veals the occurrence of phenylphenalenone-type compounds in redparacytic stomata and red epidermis tissue of Musa acuminata ssp.zebrina cv. ‘Rowe Redʼ. Phytochemistry 2015; 116: 239–245
227 Seneviratne HK, Dalisay DS, Kim KW, Moinuddin SGA, Yang H, Harts-horn CM, Davin LB, Lewis NG. Non-host disease resistance responsein pea (Pisum sativum) pods: Biochemical function of DRR206 andphytoalexin pathway localization. Phytochemistry 2015; 113: 140–148
228 Seaman C, Flinders B, Eijkel G, Heeren RMA, Bricklebank N, Clenc MR.“Afterlife Experiment”: use of MALDI‑MS and SIMS imaging for thestudy of the nitrogen cycle within plants. Anal Chem 2014; 86:10071–10077
229 Li C, Wang Z, Jones AD. Chemical imaging of trichome specialized me-tabolites using contact printing and laser desorption/ionization massspectrometry. Anal Bioanal Chem 2014; 406: 171–182
230 Friesen WL, Schultz BJ, Destino JF, Alivio TEG, Steet JR, Banerjee S, WoodTD. Two-dimensional graphene as a matrix for MALDI imaging massspectrometry. J Am Soc Mass Spectrom 2015; 26: 1963–1966
231 Velickovic D, Herdier H, Philippe G, Marion D, Rogniaux H, Bakan B.Ma-trix-assisted laser desorption/ionization mass spectrometry imaging:a powerful tool for probing the molecular topology of plant cutinpolymer. Plant J 2014; 80: 926–935
232 Korte AR, Yandeau-Nelson MD, Nikolau BJ, Lee YJ. Subcellular-level res-olutionMALDI‑MS imaging ofmaize leaf metabolites byMALDI-linearion trap-Orbitrap mass spectrometer. Anal Bioanal Chem 2015; 407:2301–2309
Silva R et al. Application of MALDI… Planta Med 2016; 82: 671–689