Embed Size (px)
Citation preview

Application of LiDAR Analytics for Damage Prevention
1

2
1. Remote sensing + analytics can enhance damage prevention
2. LiDAR can help reveal & quantify previously invisible risks
3. Intuitive visualization of complex data is critical for effective response
Key Takeaways

3
LiDAR
Technology Overview

4
WHAT IS LIDAR?LiDAR stands for Light Detection And Ranging
It is essentially a glorified laser range scanner like the system below
Laser
Receiver
Distance
Clock

A LiDAR has a laser range finder that sweeps back and forth rapidly
It can generate a sub-centimeter accurate 3D model of the world
5
HOW DOES IT WORK?
Laser
GPSIMU
DigitalSignal
Processor
Scan Mirror
3D Point Cloud( x, y, z, I )

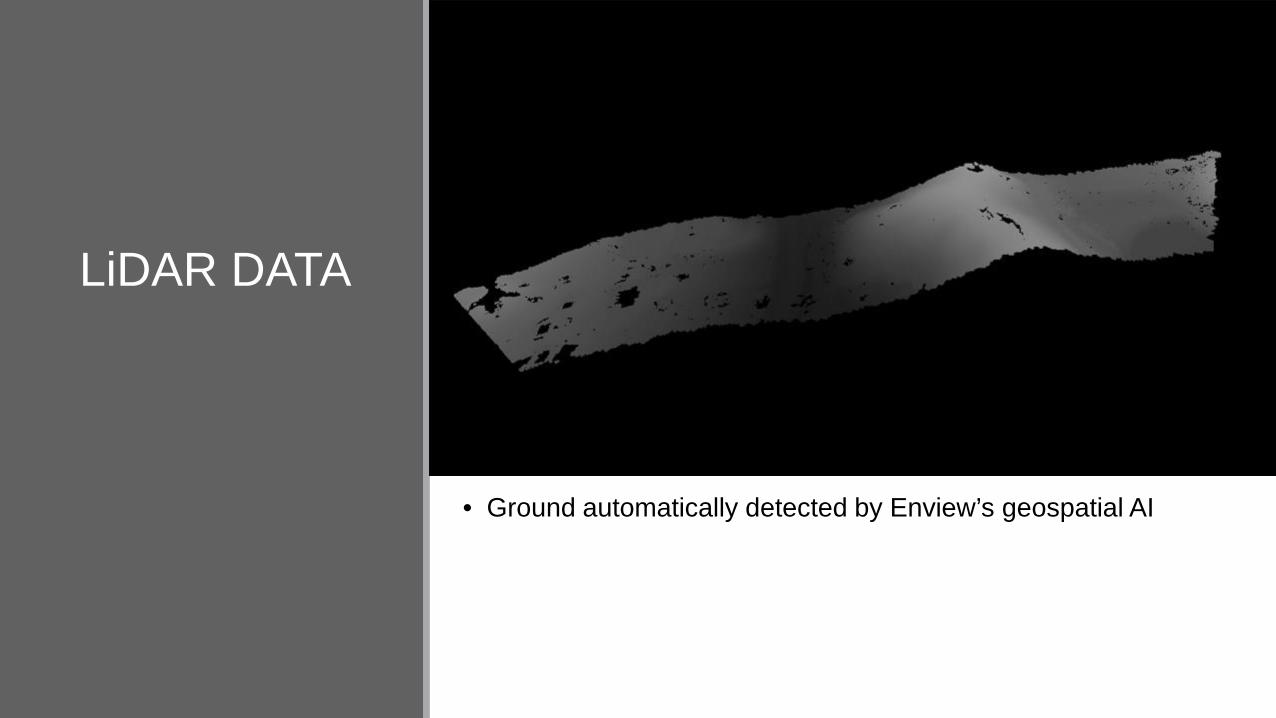
LiDAR DATA
• 1 mile of pipeline data
• 35 million points
• 3 GB of data

LiDAR DATA
• LiDAR data fused with aerial imagery

LiDAR DATA
• Vegetation automatically detected by Enview’s geospatial AI
LiDAR DATA
• Ground automatically detected by Enview’s geospatial AI

LiDAR DATA
• Structures automatically detected by Enview’s geospatial AI

LiDAR DATA
• Vehicles automatically detected by Enview’s geospatial AI

LiDAR DATA
• Power lines automatically detected by Enview’s geospatial AI

LiDAR DATA
• This 3D model of the world is now analyzed to find factors that might impact pipeline integrity

14
LiDAR Analytics
Applications
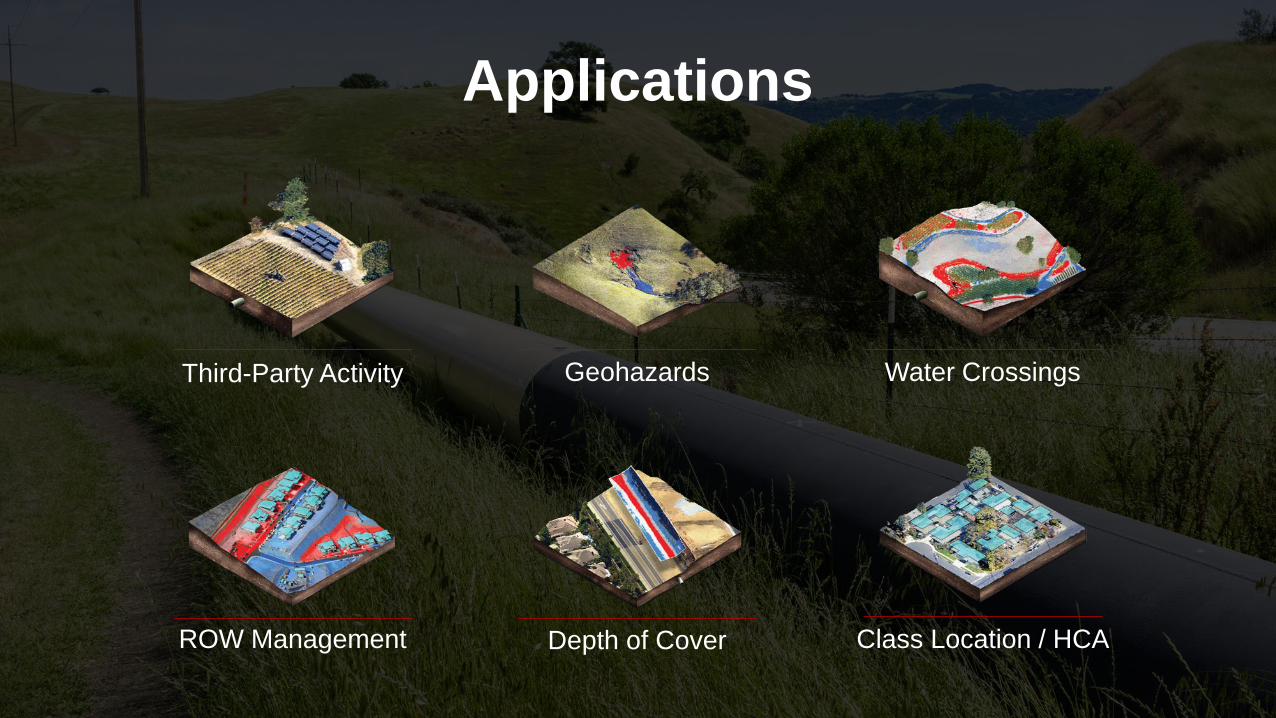
Applications
Geohazards
Class Location / HCA
Water CrossingsThird-Party Activity
ROW Management Depth of Cover

Construction
• “Before” aerial image of a pipeline ROW

Construction
• “After” image of a pipeline ROW
• Patrollers can easily see the new construction and ensure it’s captured for class location
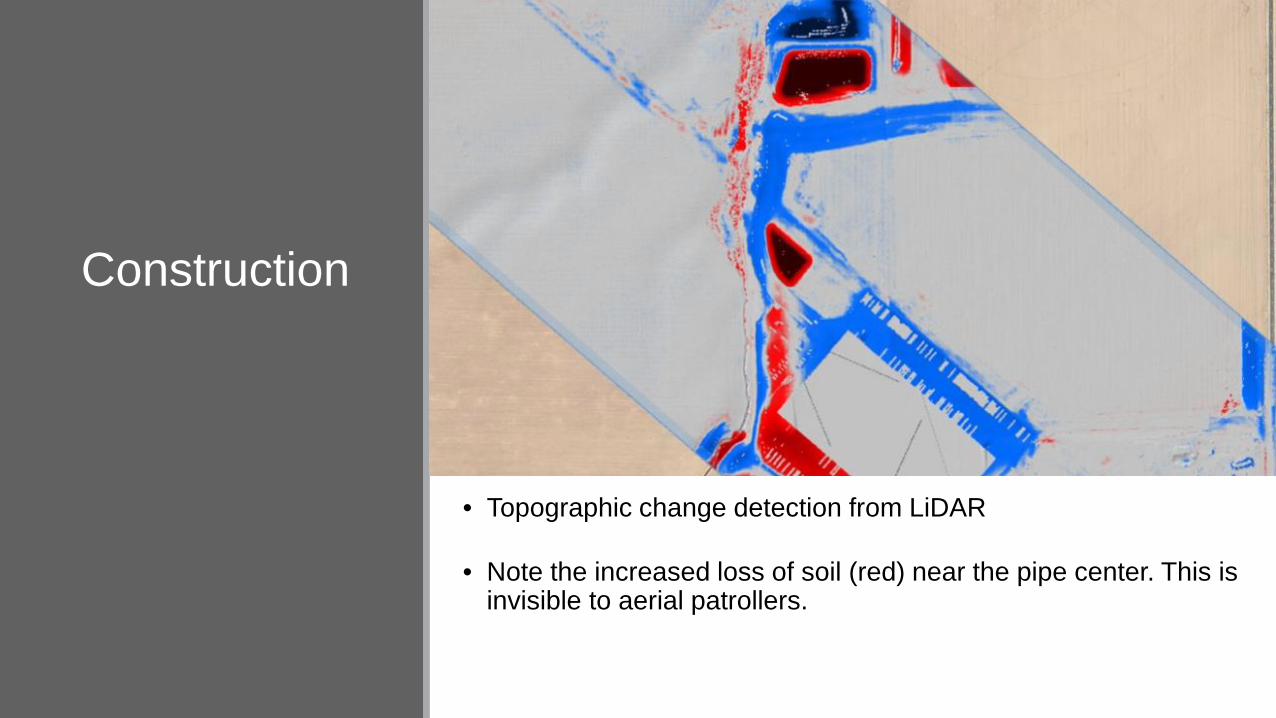
Construction
• Topographic change detection from LiDAR
• Note the increased loss of soil (red) near the pipe center. This is invisible to aerial patrollers.

Landslide
• “Before” aerial image of a pipeline ROW

Landslide
• “After” aerial image of a pipeline ROW
• The only visible change is the different shadowing we can see

Landslide
• LiDAR data reveals a landslide near the centerline (red is the slide, and blue is the toe).

Subsidence
• Left: large-scale topographic slumping detected by LiDAR
• Middle: NASA measurements of subsidence in the same region
• Right: the two datasets overlaid showing the same trend
Famiglietti, J. S., et al. "Satellites measure recent rates of groundwater depletion in California's Central Valley." Geophysical Research Letters 38.3 (2011).

Water Crossings
• “Before” image of a pipeline water crossing

Water Crossings
• “After” image of the same water crossing
• It’s hard to see meaningful change from the visible imagery

Water Crossings
• LiDAR change detection shows the increased bank erosion on the small feeder tributary
• LiDAR can identify topography change under vegetation
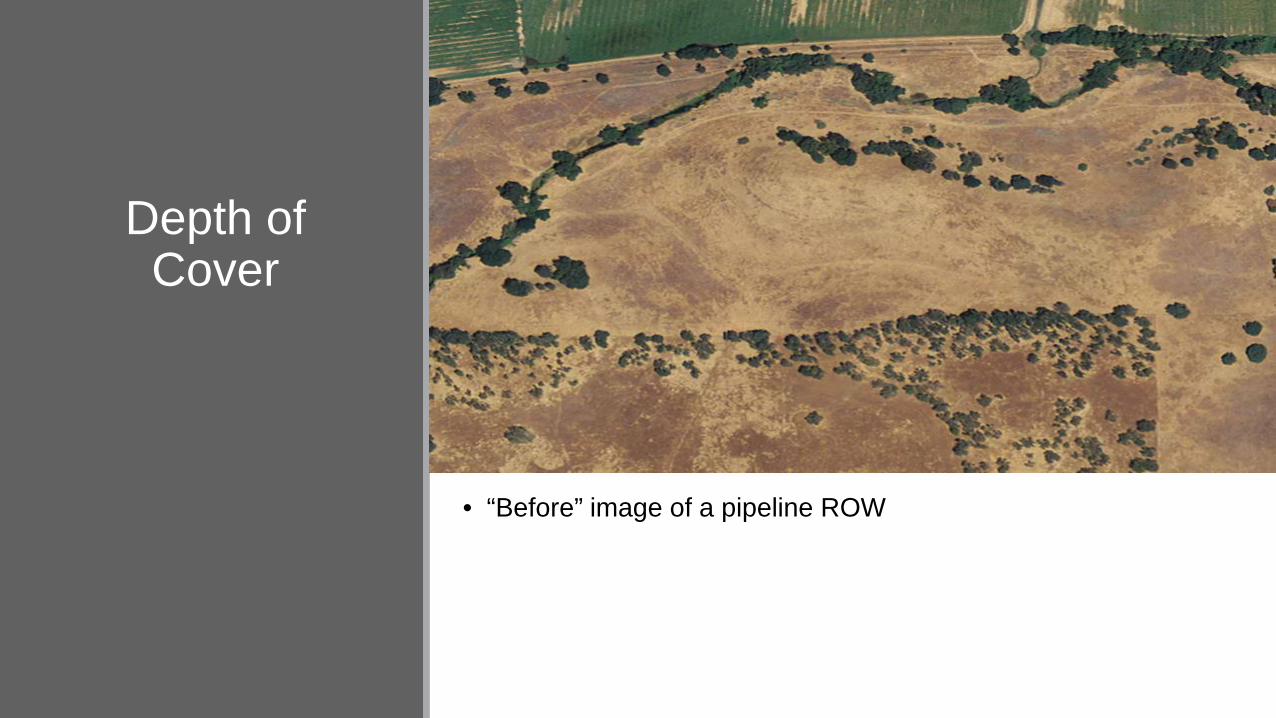
Depth of Cover
• “Before” image of a pipeline ROW

Depth of Cover
• “After” image of a pipeline ROW
• It is easy to see that the land owner has terraced the land

Depth of Cover
• LiDAR allows us to measure exactly how much depth and volume was removed near the pipe
• Depth of cover has been reduced close to the pipe (red)
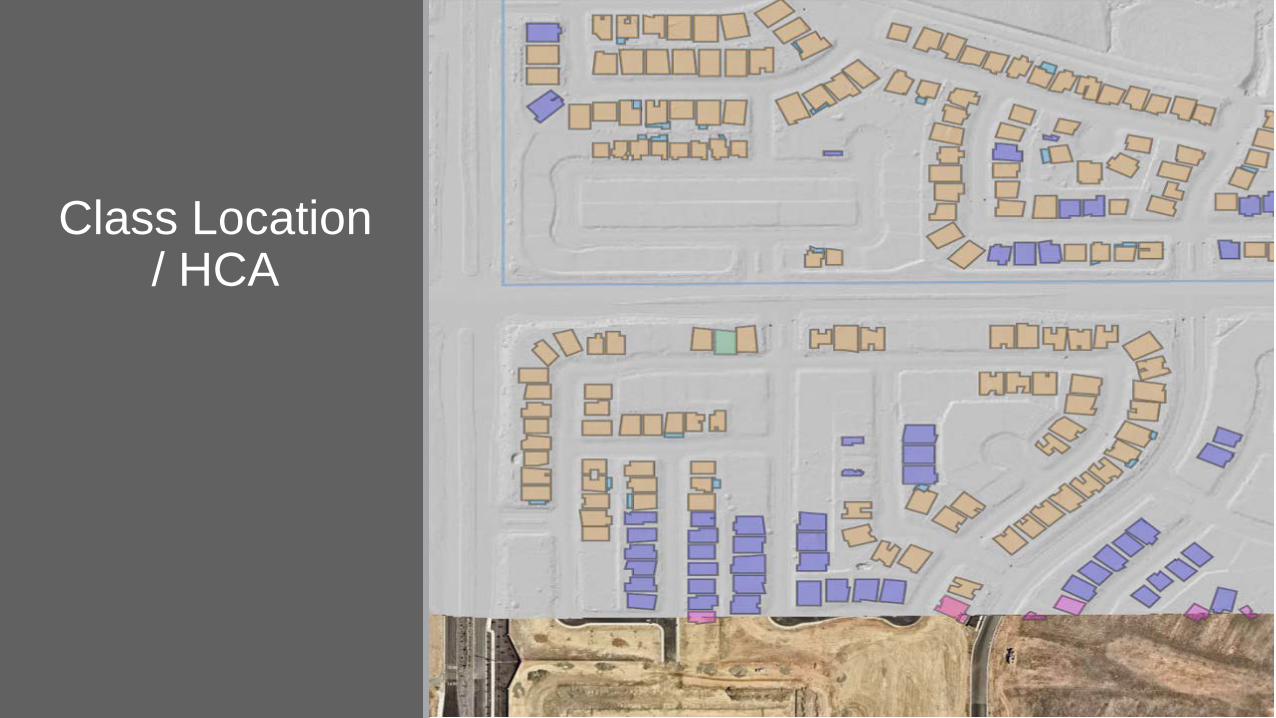
Class Location / HCA
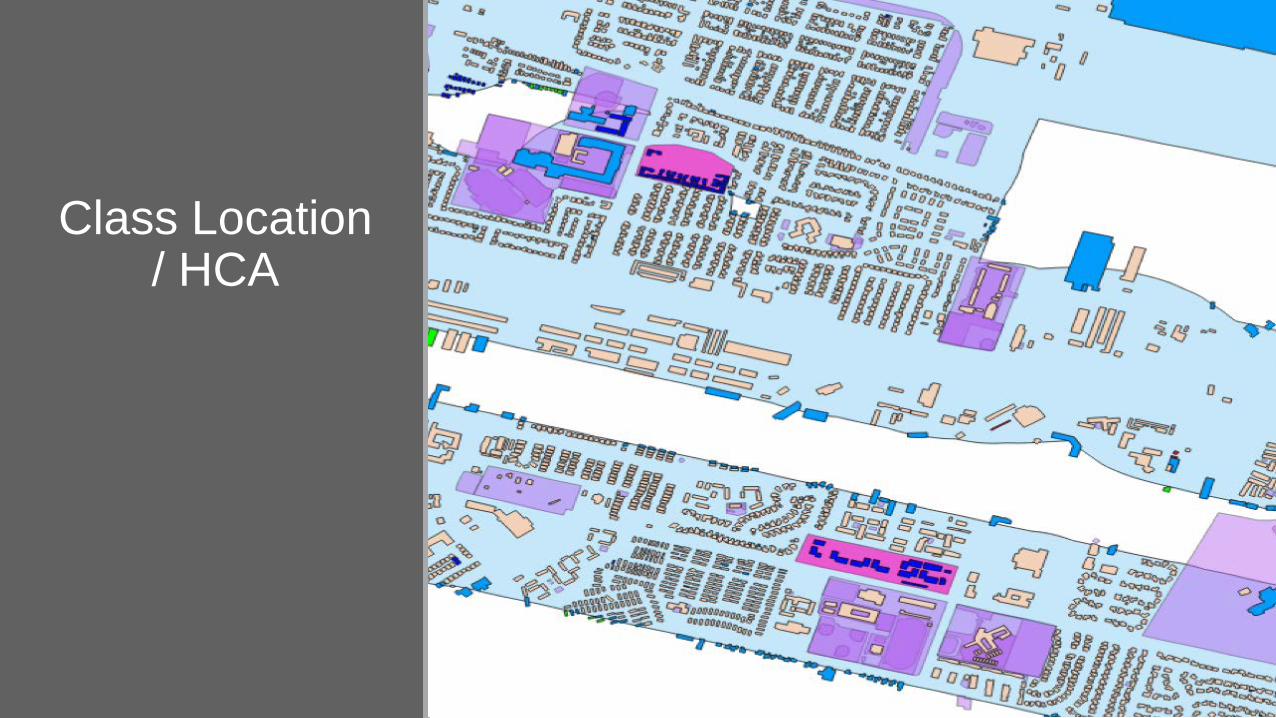
Class Location / HCA
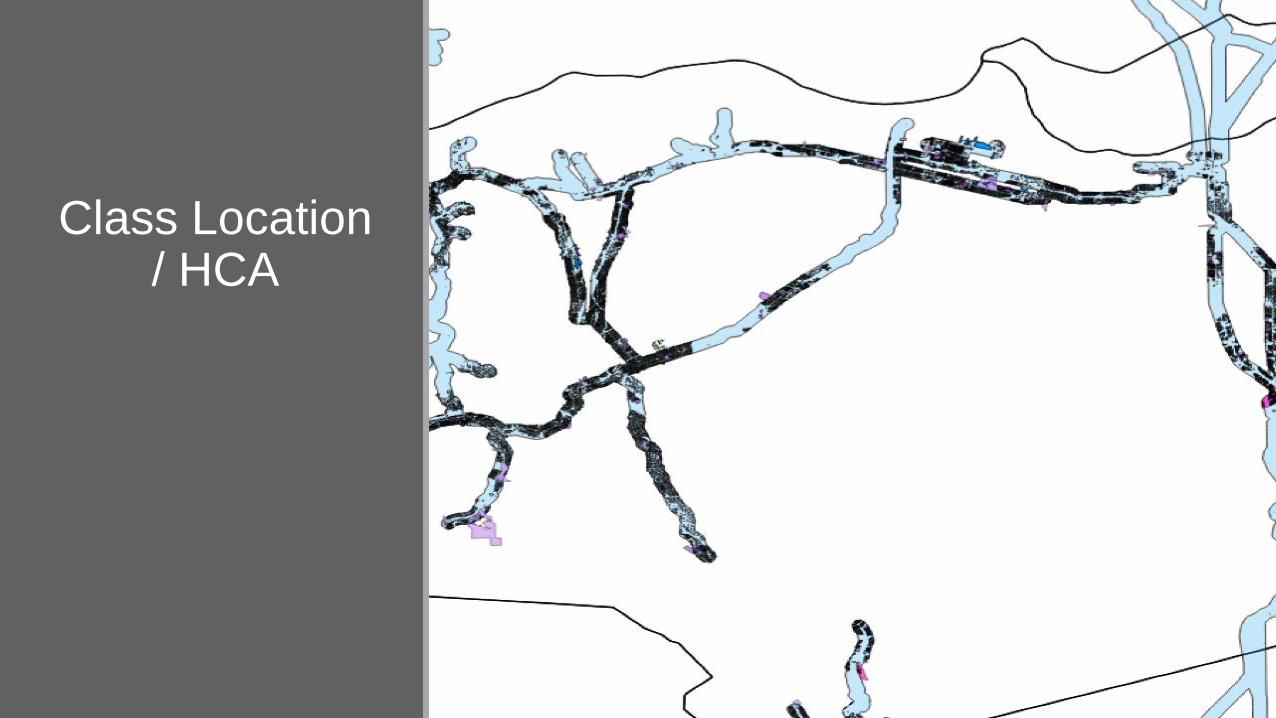
Class Location / HCA
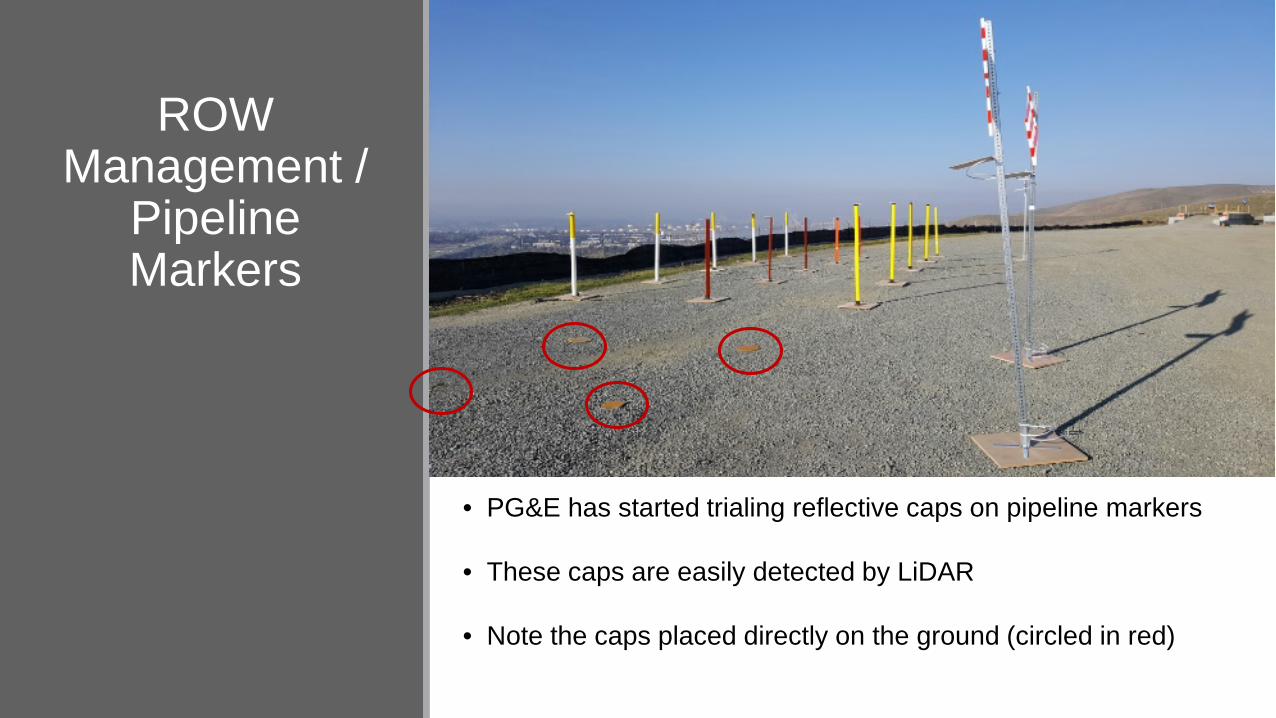
ROW Management /
Pipeline Markers
• PG&E has started trialing reflective caps on pipeline markers
• These caps are easily detected by LiDAR
• Note the caps placed directly on the ground (circled in red)

ROW Management /
Pipeline Markers
• LiDAR results of pipeline marker detection (shown by intensity)
• The white pixels are the reflective caps attached to each marker.
THANK YOU!
Questions?

THANK YOU!Krassimir Piperkov “KP”, COO
Visit: https://enview.com/