Embed Size (px)
Citation preview
UNIVERSITÀ CATTOLICA DEL SACRO CUORE Sede di Piacenza
Scuola di Dottorato per il Sistema Agro-alimentare
Doctoral School on the Agro-Food System
cycle XXV
S.S.D: AGR/13, CHIM/10, CHIM/01
APPLICATION OF DIFFERENT TECHNIQUES FOR
ARSENIC DETERMINATION IN HUMAN FOOD CHAIN: FROM GROUNDWATER TO DINING TABLE.
Coordinator: Ch.mo Prof. Romeo Astorri
_______________________________________
Candidate: Fontanella Maria Chiara
Matriculation n. : 3810668 Tutor: Dott. Gian Maria Beone Prof. Ettore Capri
Academic Year 2011/2012

ABSTRACT
The aim of this thesis was to explore new analytical techniques as well as to carry out further
characterisations of human health risks, which derive from water pollution, in particular
groundwater, and food, in particular rice. The prevention of water pollution is an environmental
aspect, that includes monitoring of both natural enrichment and outside pollution with routine
analysis but also with new techniques, e.g. the application of passive sampling techniques and
advanced technologies.
The diffusive gradients in thin films (DGT) technique with ferrihydrite adsorbent, has been
investigated for the accumulation of different species of Arsenic (As), like Inorganic Species
(arsenite and arsenate) and Organic Arsenic (dimethylarsinic and monomethylarsenate) in aqueous
matrix.
To evaluate the performance of DGT method for accumulation of arsenic species, after deployment
in synthetic solutions, DGT devices were carried out on groundwaters collected in six different
towns in the North of Italy, where the As concentration is very high. Recently, health effects at
arsenic exposures have been observed in areas where levels of inorganic As in drinking water are
not excessive. Antimony (Sb) is associated to As in several studies because the physical and
chemical properties of these two elements are similar, and it has been recently recognized as water
contaminant. In this thesis I reported for the first time detailed performance characteristics of the
Fe-oxide gel associated to DGT devices deployed in known aqueous solutions of trivalent and
pentavalent Sb. Speciation analysis of Sb(III) and Sb(V) in aqueous samples was performed through
extraction and on-line determination of isotope dilution concentration after a chromatographic
separation.
Generally rice, unlike food products of terrestrial origin, contains significant amounts of inorganic
arsenic. Recently some Government Organizations (e.g. EFSA) debated the possibility to set an
upper limit for total and inorganic arsenic in rice. Arsenic speciation was realized in 70 Italian rice
samples from different representative cultivation conditions. The most abundant forms in rice were
As(III) and DMA(V). After that, it was fundamental to investigate the localization of As in rice
grains in different processes (raw, brown and milled rice with or without parboiling technique),
because both speciation and distribution throughout the grain are key factors controlling
bioavailability of the contaminant. The As distribution in rice grains of two varieties (Gladio and
Ronaldo) from different processes, was determined by LA-ICP-MS. The distribution of As varied
between the various parts of the grains (exterior, medium and interior part). During parboiling, the
partial boiling of food as the first step in the cooking process, arsenic might have released from the

grain to the boiling water. Thus, parboiling of rice grain may reduce the magnitude of arsenic intake
in human body. Actually the As content was higher in non-parboiled rice grain than in parboiled
rice. The relationship between As intensities and the different parts of rice grain revealed that As
levels decreased from the external part towards the middle position, and then the intensity values
seem to be similar between medium and internal part in non parboiled products.
1
TABLE OF CONTENTS
CHAPTER I. CURRENT STATUS OF SPECIATION ANALYSIS OF ARSENIC AND ANTIMONY
............................................................................................................................................................................ 3
1.1. WHY IT IS IMPORTANT TO EXAMINE THE STATUS OF GROUNDWATER. ............................................... 3
1.2. ARSENIC AND ANTIMONY. .................................................................................................................. 5
1.3. SPECIATION ANALYSIS OF ELEMENTS BY HPLC-ICP-MS. ................................................................ 10
1.4. ADVANTAGES OF DGT TECHNIQUE FOR SPECIATION ANALYSIS. ..................................................... 12
1.5. PRINCIPLE OF ISOTOPIC DILUITION-ICP-MS. .................................................................................... 16
1.6. EMPLOYMENT OF LASER ABLATION. ................................................................................................ 22
1.7. REFERENCES ...................................................................................................................................... 26
PHD THESIS PROJECT .............................................................................................................................. 37
DEVELOPMENT OF THE RESEARCH PROJECT ................................................................................ 39
CHAPTER II – WATER: ONE, NONE, ONE HUNDRED THOUSAND USES…AND THEN? ......... 41
CHAPTER III. DETERMINATION OF ARSENIC SPECIES IN DIFFUSIVE GRADIENTS IN THIN
FILMS (DGT) DEVICE. ............................................................................................................................... 53
INTRODUCTION ....................................................................................................................................... 53
MATERIALS AND METHODS ................................................................................................................. 55
RESULTS AND DISCUSSION .................................................................................................................. 62
CONCLUSIONS ......................................................................................................................................... 75
REFERENCES ............................................................................................................................................ 77
CHAPTER IV. SPECIATION ANALYSIS OF ANTIMONY BY DIFFUSIVE GRADIENTS IN THIN
FILMS (DGT) ID ICP MS. ........................................................................................................................... 81
INTRODUCTION ....................................................................................................................................... 81
MATERIALS AND METHODS ................................................................................................................. 83
RESULTS AND DISCUSSION .................................................................................................................. 89
CONCLUSIONS ......................................................................................................................................... 97
REFERENCES ............................................................................................................................................ 98
CHAPTER V. SURVEY OF TOTAL ARSENIC AND ARSENIC SPECIES IN ITALIAN RICE .... 101
INTRODUCTION ..................................................................................................................................... 101
MATERIALS AND METHODS ............................................................................................................... 102
RESULTS AND DISCUSSION ................................................................................................................ 104
CONCLUSION .......................................................................................................................................... 117
REFERENCES .......................................................................................................................................... 118
2
CHAPTER VI. INVESTIGATION OF ARSENIC DISTRIBUTION INSIDE RICE GRAIN USING
LASER ABLATION INDUCTIVELY COUPLED PLASMA MASS SPECTROMETRY. ................ 121
INTRODUCTION ..................................................................................................................................... 121
MATERIAL AND METHOD ................................................................................................................... 124
RESULTS AND DISCUSSION ................................................................................................................ 125
CONCLUSIONS ....................................................................................................................................... 131
REFERENCES .......................................................................................................................................... 132
CONCLUSION ............................................................................................................................................. 135
CHAPTER VII. CONCLUSION AND FUTURE PRESPECTIVES. ..................................................... 137
REFERENCES .......................................................................................................................................... 140
ACKNOWLEDGEMENTS ......................................................................................................................... 141

1
INTRODUCTION

2
3
Chapter I. Current status of speciation analysis of
Arsenic and Antimony.
1.1. Why it is important to examine the status of groundwater.
The Earth is known as the Blue Planet for the predominance of volumes of water in comparison
with land, but it has less than 3% of the available fresh water. More than 2.5% of this small
percentage is ice in the Arctic and Antarctic zone. Humanity must rely on 0.5% of fresh water for
all human and ecosystem needs (World Business Council for Sustainable Development, 2005).
Some 0,5 percentage of fresh water is stored in the following sectors: 10 * 106 km3 in deep aquifers,
119 * 103 km3 in the rain, 91 * 103 km3 in the lakes, 5 * 103 km3 in artificial basins and 2.120 km3
in the rivers, constantly supplied by rain, snow and melted ice (Vörösmarty, 1997, Foster and
Chilton, 2003).
The fresh water is used for different reasons: urban use (nutrition, hygiene), agriculture, breeding,
industry, tourism, energy source and commerce.
The most important uses, in terms of total extraction, can be identified as a public water supply, for
agriculture, industry and energy production.
Between 1998 and 2007 in Europe 21% of water was used for public water supply, 22% on average
for agriculture, 12% for industry and 45% for the production of energy (EEA – ETC/WTR, 2010).
Two different trends are observed in Europe during the last 10 to 15 years in the public supply of
water: the countries of Eastern and Western Europe had a decrease in consumption, while in the
Southern European countries, the domestic use increased by 12 %.
The decrease in consumption is higher in England and Germany, as well as in Eastern Europe
(Poland, Bulgaria and Romania) and everything can be attributed to the promotion of water-saving
practices (Dworak et al., 2007).
In the South, the observed increase in public supply of water could be attributed to climate change
and tourism. The increase in temperature (observed in the Mediterranean area) showed a rise in
demand for water for domestic use, for personal hygiene and for outdoor use (gardening, swimming
pools) (Cohen, 1987, Downing et al. 2003, Herrington, 1996, Kenneth, 1997). In France, Greece,
Italy, Portugal and Spain, the tourism is increased by 90% in the last two decades (Attané and
Courbage, 2001, De Stefano, 2004).
In Italy, supplies from groundwater are higher than those from surface waters, with differences at
the provincial and sector level.
4
For example, in the province of Piacenza (288.003 inhabitants) (ISTAT), 20% of surface water and
80% of groundwater supplies the civil sector in the city of Piacenza (102.687 inhabitants) (ISTAT)
all withdrawals for civil purposes derived from groundwater (Regione Emilia, 2005).
Any assessment of the availability and sustainability of water use must take into account the amount
and use of available fresh water but also its quality. In fact, a poor quality will lower the apparent
availability of water.
Groundwater is endangered and polluted in various ways and some of these chemicals may affect
human health.
Water is the food that every living being consumes continuously and it is more fundamental than
any other food in the human diet. Water also performs the function of cleaning and sanitizing, thus
helping to prevent diseases and ensure a better quality of life.
In every case, the water must be healthy because it could be a formidable factor of disease
spreading. The increasing production of industrial and urban waste forced to make use of surface
and groundwater as receptors of discharges, often contaminated by toxic or carcinogenic substances
(such as metals, solvents, pesticides, oils).
At Community level, a series of guidelines were developed to protect the whole water compartment.
Directive 2000/60/EC supports the requirement of extended protection by the Community
authorities, through national and local authorities on all the different types of water (surface and
underground), recognizing the citizens, ideal subjects to be involved to obtain objectives by
identifying needs, requests and suggestions of users as priority.
Directive 2006/118/EC recognizes groundwater as fundamental element for the ecosystems and
water supply for human consumption.
In Italy the key laws are: national decree DL 31/2001 of Directive 98/38/EC, concerning the quality
of water for human consumption, D. Lgs 152/2006 establishing environmental standards for…water
quality…and D. Lgs 30/2009, of Directive 2006/118/EC, on the groundwater protection against
pollution and deterioration.
At the local level, the “Piano di Gestione del Distretto Idrografico del fiume Po” is very important
because objectives and priorities of hydrographic basin are defined. The “Piano di Tutela delle
Acque” is a planning document established at regional level and adopted at the provincial level, and
it must comply with the instructions of the “Piano di Gestione”.
Effective controls on the quantity and quality of the water withdrawn are carried out by different
authorities.
5
The “SIAN – AUSL” (Servizio Igiene Alimenti e Nutrizione) provides a judgment of suitability of
water for human consumption, maintaining open channels of communication with municipalities,
agencies and distribution services with the “Autorità D’Ambito”.
The “Gestore del Servizio Idrico” feed in the water system with the quality characteristics
constantly monitored for human consumption, after the collection and treatment of drinking water.
ARPA (Agenzia Regionale Prevenzione e Ambiente) has a monitoring network with the following
objectives: (a) to classify surface and groundwater, (b) to check the status of the resources, (c) to
verify the water pollution, (d) to define the potential of the aquifers, (e) to identify the main
environmental emergencies (nitrates and pesticides), (f) to assess the effectiveness of rehabilitation
systems and (g) to support complex plant and animal ecosystems.
Prevention of surface and groundwater pollution is very important from an economic and
environmental respect point of view. Natural features of groundwater aquifer or soil might cause the
presence of high concentrations of different chemical elements, without outside pollution.
The characterization and the study of the qualitative characteristics of water are part of the concept
of sustainable management, thanks to the involvement of the three aspects, environmental, social
and economical, that contribute to specific sustainability concept.
Prevention of water pollution is an environmental aspect, that include the monitoring of natural
enrichment or outside pollution with routine analysis but also with new technique, for example the
application of passive sampling techniques and advanced technologies. This type of monitoring is
useful because it is possible to employ accurate and aimed purification technologies without public
resources waste.
1.2. Arsenic and Antimony.
Arsenic (As) is a metalloid that occurs in different inorganic and organic forms. The inorganic
forms of arsenic are more toxic but, in official food control, only total arsenic content is usually
reported, without differentiating the arsenic species. The investigation of total arsenic would lead an
overestimation of health risk related to dietary arsenic exposure (EFSA, 2009).
D. Lgs 31/2001 indicates a parameter value of 10 µg L-1 for arsenic in groundwater, the same value
reported in D. Lgs 30/2009.
The toxicity of As depends not only on total concentrations, but also on its chemical forms. The
inorganic As species have been classified in group 1 as carcinogenic to humans (IARC 1987).
Arsenite (As(III)) has higher toxic effects than arsenate (As(V)). Organic form of As, like
monomethylarsonic acid (MMA(V)) and dimethylarsinic acid (DMA(V)) also exist. Until recently,
6
methylation of arsenic was considered to be a detoxification process because the toxicity of
MMA(V) and DMA(V) was much lower than that of inorganic arsenicals (Del Razo et al. 2001,
Eguchi et al. 1997). In contrast to the low toxicity of MMA(V) and DMA(V), several authors
(Petrick et al. 2001, Sakurai et al. 2002) reported that MMA(III) and DMA(III) are more toxic than
inorganic arsenics.
MMA(III) and DMA(III) have been reported to break down DNA at lower concentrations than
inorganic arsenicals or pentavalent methylated arsenicals (Mass et al, 2001, Nesnow et al. 2002).
Therefore, due to large differences of toxicity among As(III), As(V) and organic As, an accurate As
speciation is essential.
Natural concentrations of arsenic in soil are typically less than 10 mg kg-1, but anthropogenic and
natural inputs may raise concentrations substantially. In Bangladesh, for example, there is great
concern about the contamination of soil and drinking water that originates from a diffusive source,
resulting in toxicity problems on a regional scale, and in serious threats to 85 million people
(Hossain, 2006). In the same area with arsenic endemic areas, recent reports showed an increase of
As(III) amount in drinking water and the existence of low concentrations of organic arsenicals in
drinking water (Harvey et al 2002, Shraim et al. 2002).
The speciation of As is strongly influenced by pH and redox potential (Eh) (Cullen and Reimer,
1989). If the groundwater is under reducing conditions (low Eh) prevails As(III), with high
concentrations of iron, manganese, ammonia and phosphate (Katsoyiannis et al 2007).
Because the dominant species of pentavalent arsenic in aqueous solution, H2AsO4- , is isoelectronic
and similar in volume to phosphate, H2PO4- , phosphate transporters can potentially allow the
passage of arsenate. This situation is probably true in most organisms including humans (Huang and
Lee, 1996). Upon its entry into the cell, also in mammal cells, arsenate is reduced to the trivalent
arsenite (Radabaugh and Aposhian, 2000).
Arsenic might cause cancer to the brain, liver, kidney and stomach, it has a great affinity with
hydrogen sulphide groups of biomolecules such as glutathione (GSH), fatty acids and cysteine of
many enzymes (Aposhian and Aposhian, 2006).
The formation of bonds between sulphuric groups and As(III) causes dangerous effects such as
inhibition of various enzymes such as glutathione reductase, glutadione peroxidase, thioredoxin
reductase and thioredoxin peroxidase (Schuliga et al., 2002; Wang et al., 1997; Lin et al., 2001;
Chang et al., 2003).
As(III) also interact poorly with the surface of many solids, and then As(III) is difficult to remove
with conventional methods of treatment (eg. adsorption and precipitation).
7
Several studies have been published on the oxidation of As(III) via traditional chemical oxidants as
chlorine, chlorine dioxide, chlorine amines, ozone, hydrogen peroxide, permanganate ion and ferric
ion (Frank and Clifford, 1986; Kim et al., 2000; Pettine et al., 1999; Emett and Khoe, 2001;
Johnston and Heijnen, 2001; Bissen and Frimmel, 2003; Lee et al., 2003; Ghurye and Clifford,
2004; Vasudevan et al., 2006; Dodd et al., 2006; Sharma et al., 2007).
The chlorination is effective for the oxidation of As(III), but this technique creates and releases
products of synthesis in the tap water. Trihalomethanes are products by this synthesis, which are
carcinogenic for rodents (Boorman et al., 1999); NH2Cl also produces N-nitrosodimetilammine
(NDMA), substance suspected to be carcinogenic for humans (Mitch and Sedlak, 2002).
Ozone is able to reduce the levels of trihalomethanes, however, it causes the formation of bromate
ion, highly carcinogenic. The ferric ion does not produce bromate ions and products of synthesis are
non-toxic (Sharma, 2007 , Sharma, 2002, 2004; Sharma et al., 2005; Yngard et al., 2008).
The knowledge of elements present in the future drinking water is essential to ensure an appropriate
choice of the disinfection system.
Ingestion of polluted groundwater is not the only source of arsenic. In the human dietary there are
staple foods, like rice, that may represent a hazard for human health. Rice is one of the most
important exposure route for arsenic. In comparison with other cereal grains, baseline
concentrations of As in rice are approx. 10-fold larger (Williams et al., 2007). Moreover,
discovering the location and speciation of arsenic within the edible rice grain is essential to
understanding the human health risk (Meharg et al. 2008) and establishing effective strategies to
reduce concentrations of this metalloid.
Williams et al. (2006) reported that the dominant species in rice were inorganic (arsenate and
arsenite), with dimethylarsenic acid [DMA(V)] being only a minor component. This distribution
was almost similar to that found in Italian rice in the present study (70 rice samples came from
different areas in the North of Italy), in particularly the most abundant species in Italian rice were
As(III) and DMA(V) (Chapter V). Different authors (Meharg et al. 2009, Williams et al. 2005,
Norton 2009, Norton 2009, Williams et al. 2006, Zavala et al. 2008, Zhu et al. 2008, Adomako et al.
2009) established that the proportion of inorganic-to-organic arsenic varies geographically and
genotypically; rice in the USA contains proportionately more DMA and rice in Asia contains
proportionally more inorganic arsenic. Methylated species are taken up rather inefficiently
compared with inorganic species but seem to be translocated more efficiently (Raab et al., 2007).
Because of the complexity of these processes, the mechanisms responsible for As loading into the
rice grains and its speciation and distribution within the grain are not fully understood.
Several studies have analysed arsenic distribution in rice grain by quantifying arsenic in separated
8
fractions (Sun et al., 2008, Ren et al. 2006, Rahman et al. 2007); all reported that arsenic was most
concentrated in the bran, with levels following the pattern bran > wholegrain rice > polished rice.
Meharg et al. (2008) showed that whole grain (brown) rice had a higher inorganic arsenic and total
arsenic content than polished (white) rice.
Accumulation of As in rice plant tissues and grains was reported resulting from the soils or
irrigation waters containing an elevated level of As. Abedin et al. (2002) discovered that As
concentrations in rice grains, husks, stalks, and roots were positively correlated with arsenate
contents in the irrigation water. The large majority of the information available on As distribution
and speciation in rice is related to the analyses of powdered rice grains. In Chapter VI, we reported
laser ablation ICP-MS (LA-ICP-MS) results which show a potential analytical technique for As
intensity estimation in rice samples and a methodfor rapid, direct analysis of solid samples without
dissolution and with minimal sample preparation.
Antimony (Sb) behaves like a metal in most reaction. However, in some reactions, it demonstrates
nonmetal characteristics. Antimony may occur at four oxidation states, that is, −3, +3, +4, and +5. It
occurs mainly in Sb3+ and Sb5+ forms in the biological and geochemical environment. It is present
in all units of the environment and its natural background in various environmental matrices is
highly diversified (Smichowski, 2008). In aqueous solution, antimony exists either in the
pentavalent or trivalent oxidation state.
In general, inorganic antimony compounds are more toxic than the organic ones. Sb(III) compounds
are ten times more toxic than Sb(V) ones. On the other hand, the toxicity of antimony compounds is
approximately ten times lesser than arsenic ones but it depends on their oxidation states and
structure. Antimony in the elemental form is more toxic than its salts (Nordberg et al., 2007).
D. Lgs 31/2001 indicates a trigger value of 5 µg L-1 for antimony, the same value reported in D. Lgs
30/2009 for groundwater.
Recent studies show that the concentration of Sb in uncontaminated groundwater is very low, below
1 µg L-1. Antimony concentrations are much higher in natural geothermal systems where they can
range from 500 mg L-1 up to 10 wt%. (Ritchie, 1961; Weissberg et al., 1979; Kolpakova, 1982;
Stauffer and Thompson, 1984). Probably due to its lower abundance and the relative insolubility of
most of its compounds, antimony is usually overlooked as an element of environmental concern and
its study has been largely neglected.
In terms of hard-soft behaviour (Ahrland, 1968, 1973; Pearson, 1963), Sb(III) is commonly
classified as a borderline metal, which makes its interactions with a soft ligand, like SH, and a hard
ligand such as –COOH, both possible.
9
The physical and chemical properties of Sb and As are similar. In the past, these two elements and
their compounds were often determined together (Gebel, 1997). As first pointed out by Pauling
(1933), the coordination with Sb(V) with oxygen is quite different from that of As(V). Based on its
larger ionic radius and lower charge density, this author suggested that antimony should be
octahedrally coordinated with oxygen and its compounds, rather than tetrahedrally like As(V) is.
In contrast to arsenate, the entrance route of pentavalent antimony, or antimonate, into the cells has
not yet been identified. The uptake mechanism may be different from that of arsenate because the
stable form of antimonate in aqueous solutions, Sb(OH)6-, is not isoelectronic with
arsenate/phosphate. Nevertheless, once antimonate is inside the cell, it is also reduced to the
trivalent state, antimonite. The process of reducing antimonate to antimonite is very important
because, as is the case for arsenic, the trivalent form of antimony is the active and the more toxic
state (Zangi and Filella, 2012).
A certain number of studies have been devoted to the chemical solution of Sb(III)-
polyaminocarboxylic acids (CDTA, DTPA, EDTA) (Bhat and Iyer, 1965; Bhat et al., 1966;
Anderegg and Malik, 1967, 1970a,b; Özer and Bogucki, 1971; Er-kang, 1982). Although significant
complexation has been observed at acidic pH values, experimental results show that Sb(III) prefers
sulphur as a ligand at low temperatures but that, at higher temperature, it forms mixed ligand
complexes containing both sulphur and oxygen group (Krupp, 1988; Sherman et al., 2000).
Sb(III) shows a high affinity for red blood cells and hydrogen sulphide groups of biomolecules of
the cells, while the same red blood cells are impermeable to the Sb(V). The primary effects of
chronic exposure to antimony in humans are respiratory problems, lung damage, cardiovascular
effects, gastrointestinal disorders, and adverse reproductive outcomes (Bhattacharjee et al. 2009).
IARC (International Agency for Research on Cancer) has added Sb in the group of suspected
substances to be carcinogenic for human beings (IARC 1989, Gebel, 1997). However, the U.S.
Environmental Protection Agency (USEPA, 1999) and German Research Community (DFG, 1994)
categorize antimony as a main pollutant but do not indicate it as a carcinogen.
The comprehension of antimony behaviour in aqueous matrix is very important because many
studies have been published in which drinking water contamination from bottle materials was
investigated. According to estimations, approximately 38% of the total Sb intake of an adult (about
7.4 µg Sb/day) would come from drinking water (Greathouse and Craun, 1978)
The only element which is highly concentrated in PET bottled water was antimony with a 21-fold
concentration over glass (Reimann et al. 2010). The higher concentration of antimony in PET bottle
water is expected, because antimony trioxide (Sb2O3) or its reaction product with ethylene glycol is
widely used as a polycondensation catalyst in the manufacturing of PET. The antimony catalyst
10
offers a high catalytic activity and has a low tendency to catalyse side reactions. In addition,
antimony does not engender undesirable colours and the polymerisation catalyst remains in the PET
polymer. The Sb concentration of the commercialised PET resin is between 190 and 300 µg g-1.
Recently, an Sb(V) complex, Sb(V)-citrate, was identified for the first time in no spiked orange
juice contained in poly(ethyleneterephthalate) (PET) bottles (Duh, 2002).
On the contrary, Sb was not detectable in water samples originating directly from the wells or
stored in glass bottles. In the freshly bottled samples, the Sb concentration ranged between very low
values and it depends on the PET surface/water volume ratio, therefore the storage in smaller bottles
results in higher Sb concentration. Moreover, illumination and increased storage temperature
augmented the Sb concentration (Keresztes et al. 2009).
All this evidences emphasizes the importance of identifying and quantifying the chemical forms of
antimony to provide comprehensive information about its toxicity and human health relevance.
In conclusion, antimony must be considered as the most important inorganic species that may
migrate from the PET bottle wall into the beverages.
1.3. Speciation analysis of elements by HPLC-ICP-MS.
Arsenic is a metalloid with organic and inorganic forms. The inorganic forms of As are more toxic,
but only the total content of arsenic is reported in official controls on food, without difference
between the arsenic species. The analysis of total As concentration in the diet could lead to an
overestimation of the risk for human health (EFSA, 2009).
An accurate arsenic speciation is essential to determine its impact on humans through the diet,
because of the large toxicity differences between As(III), As(V) and organic species.
Numerous instrumental methods for the speciation of these arsenic species are reported in literature.
Most of them are based on chromatographic separation techniques such as High Performance
Liquid Chromatography (HPLC) (Gailer and Irgolic, 1996; Teräsahde et al., 1996; Le and Ma,
1997; Dagnac et al., 1999; Kohlmeyer et al., 2002).
The HPLC-ICP-MS technique is the most powerful method for arsenic speciation. The advantages
associated with the HPLC-ICP-MS technique include high elemental specificity, the possibility to
record real time chromatograms, the ability to separate the signals of interfering species from the
peaks of interest, a high linear range, a multi-element capability and the possibility to obtain
isotopic information.
11
However, the use of ICP-MS as a detector for HPLC gives rise to some constraints on the choice of
chromatographic conditions concerning the nature and concentration of the buffer salts of the
mobile phase and the presence of organic solvents.
Moreover, because of its high sensibility, ICP-MS may suffer from many isobaric interferences
caused mainly by phenomena occurring either in the plasma or in the ion extraction device. For
example, presence of chlorine in the sample may give rise to the formation of 40Ar35Cl+ that
interferes strongly with the mono-isotopic 75As+ (Gray, 1986; Hywel Evans and Giglio, 1993).
All the arsenic species of this study have a range of dissociation constants making them suitable for
anion exchange column, as they exist in anionic form in alkaline mobile phase (Teräsahde et al.,
1996).
Na2HPO4 and NaH2PO4 are often used as mobile phase for the As species separation, but deposition
of salt on the sampling interface causes a rapid degradation and instability of the signal. For this
reason, the selected mobile phase used in this study was ammonium dihydrogen phosphate
(NH4H2PO4), for which less deposit was observed together with a good stability of the signal
(Ronkart et al. 2007).
Alternatively, total As concentration could be measured by inductively coupled plasma mass
spectrometer (Agilent 7700x, Agilent Technologies, USA) with octapole reaction system (ORS
system). ICP–MS has revolutionised quantitative analysis of arsenic in rice graina number of
studies have combined the good separation capabilities of HPLC with highly sensitive ICP-MS
detection, to identify and quantify arsenic species in mature rice grain, by detecting arsenite,
arsenate, and dimethylated arsenic (DMA) with, occasionally, trace amounts of monomethylated
arsenic (MMA) (Schoof et al. 1999, Heitkemper et al. 2001, Williams et al. 2005, Sun et al. 2008,
Norton 2009, Norton 2009).
A certified Reference Material was used to ensure the accuracy and precision of the analytical
procedure (CRM BCR 610, groundwater). The same procedure was applied to check whether the
analytical results of As in rice agreed (NIST 1568a, IMEP 107, rice samples).
The first works relating to antimony speciation were published in the early 1980s (Andreae et al.,
1983). The speciation of antimony consists in the determination of Sb(III) and Sb(V) and organic
antimony compounds.
Antimony and its compounds are often determined in various types of water, such as drinking,
mineral, and surface water. However, the information on the content of different forms of antimony
is not ample.
Most of the studies reporting HPLC (high-performance liquid chromatography) separations of Sb
species are based on anion-exchange chromatographic methods, due to the predominance of Sb
12
anionic species in aqueous environmental samples (Smichowski et al., 1995; De Gregori et al. 2005;
Potin-Gautier et al. 2005; De Gregori et al. 2007; Zheng et al. 2000; Zheng et al. 2001; Hansen and
Pergantis, 2006; Ulrich 1998; Sayago et al. 2002; Nash et al. 2006).
The determination of Sb(III) and Sb(V) in aqueous solution is most commonly performed by
separation by anion-exchange chromatography (AEC), followed by element specific detection
(Hansen and Pergantis, 2007; Miravet et al. 2010).
The main differences in method-development strategies described in the literature are mostly based
on the mobile phases employed. In general, the elution of Sb(V) is readily achieved with a variety
of mobile phases, while, for Sb(III), a broad tailing chromatographic peak is usually observed.
Complexing mobile phases of pH 4.0–5.5 containing tartrate buffers (Zhang X et al. 1998), sodium
citrate (Satiroglu, 2000) or EDTA with or without potassium-hydrogen phthalate (KHP) have been
also proposed (Krachler and Emons, 2000, 2001; Dodd et al., 1992; Sayago et al., 2000) to solve
this problem. These methods usually show a good performance for standard solutions, and, in most
cases, they have been applied to Sb speciation in spiked water samples. The importance of
complexing ligands in the mobile phase for AEC was established by Lintschinger et al. (1997), who
also showed that addition of a strong competing anion, e.g. phthalate, to the EDTA mobile phase
improved the chromatographic system by shifting the Sb(III) peak to a shorter retention time and
improving its symmetry.
A complexing mobile phase serves to preserve the trivalent oxidation state of Sb during the
chromatographic separation, as Sb(III) easily oxidizes to Sb(V) in aqueous solutions (Krachler et al.
2001). Moreover, in most cases, Sb(III) is irreversibly retained on the AEC columns when chelators
are not present in the mobile phase (Lintschinger et al. 1997; Hansen and Pergantis, 2007)
As the AEC method using a combination of EDTA and phthalic acid in the mobile phase appears to
be the most successful approach for determination of Sb oxidation state so far, it has been
extensively applied (Miravet et al. 2010, Chapter IV).
1.4. Advantages of DGT technique for speciation analysis.
In recent experiments (Chapter III and IV), two approaches have been used together to study
elements speciation in raw groundwater: HPLC-ICP-MS and Ferrihydrite (FH) Diffusive Gradients
in Thin Films (DGT) (DGT Research Ltd, Lancaster, UK). Usually, DGT has been used in parallel
with several other speciation and fractionation techniques for a comparison, and to investigate the
fractions and species measured.
13
In Chapter III and IV the commercially available FH-DGT, already characterised for measurements
of phosphate and total inorganic arsenic, was evaluated for determination of labile anionic forms
like arsenite, As(III), arsenate, As(V), antimonite, Sb(III), antimonate, Sb(V), with some
observations about organic arsenic species behaviour.
Organic arsenic species are commonly found in natural waters (Hasegawa et al. 2010) and
sediments (Orero Iserte et al. 2004). The two most prevalent, dimethylarsonate (DMA(V)) and
monomethylarsinate (MMA(V)) can potentially adsorb to the ferrihydrite binding agent (Lafferty
and Loeppert, 2005) used for DGT measurements of inorganic arsenic, and might thus contribute to
total arsenic measurements. If total arsenic is determined in DGT-eluates but only the concentration
of inorganic arsenic is of interest, there is the profound risk for making overestimations and
consequently speciation analysis on the sampled water is needed to confirm that neither DMA(V) or
MMA(V) are present at significant levels.
The first scientific work concerning the DGT technique was presented in a letter to Nature in 1994
by Prof. William Davison and Dr. Hao Zhang of Lancaster University, United Kingdom. In this
chapter and in the following, DGT technique (Davison & Zhang, 1994; Zhang & Davison, 1995)
has been proposed as a tool to assess the real risk of polluted soils and the potential availability of
pollutants and a mean by which to measure concentrations of trace metals in natural waters and to
estimate their concentrations in soil pore water (Zhang 2002). When exposed to a soil solution, a
DGT device provides an indirect measure of the maximum potentially available concentration of
pollutants in soil water, and consequently an estimation of potential uptake by plants. This
technique can be used to study As speciation in irrigation water and soil solution in experiments of
rice growing.
Sampling with DGT offers a wide range of applications. It has been used for many bioavailability
and toxicity studies (Røyset et al., 2005; Tusseau-Vuillemin et al., 2004; Ferreira et al., 2008; Diviš
et al., 2007), detailed studies to quantify labile organic and inorganic trace metal species (Warnken
et al., 2008) and for the evaluation of trace pollution sources in sewer systems (Thomas, 2009). The
diversity in applications implies that DGT is a useful tool for researchers from varying disciplines.
DGT has the benefit of eliminating the risk of speciation changes due to transportation and storage
of samples prior to preparation and analysis (Lead et al. 1997) and it is designed to accumulate
labile species in environmental systems (Zhang and Davison 1995, Zhang and Davison 2000,
Davison et al. 2000) as a result of the in situ sampling capabilities.
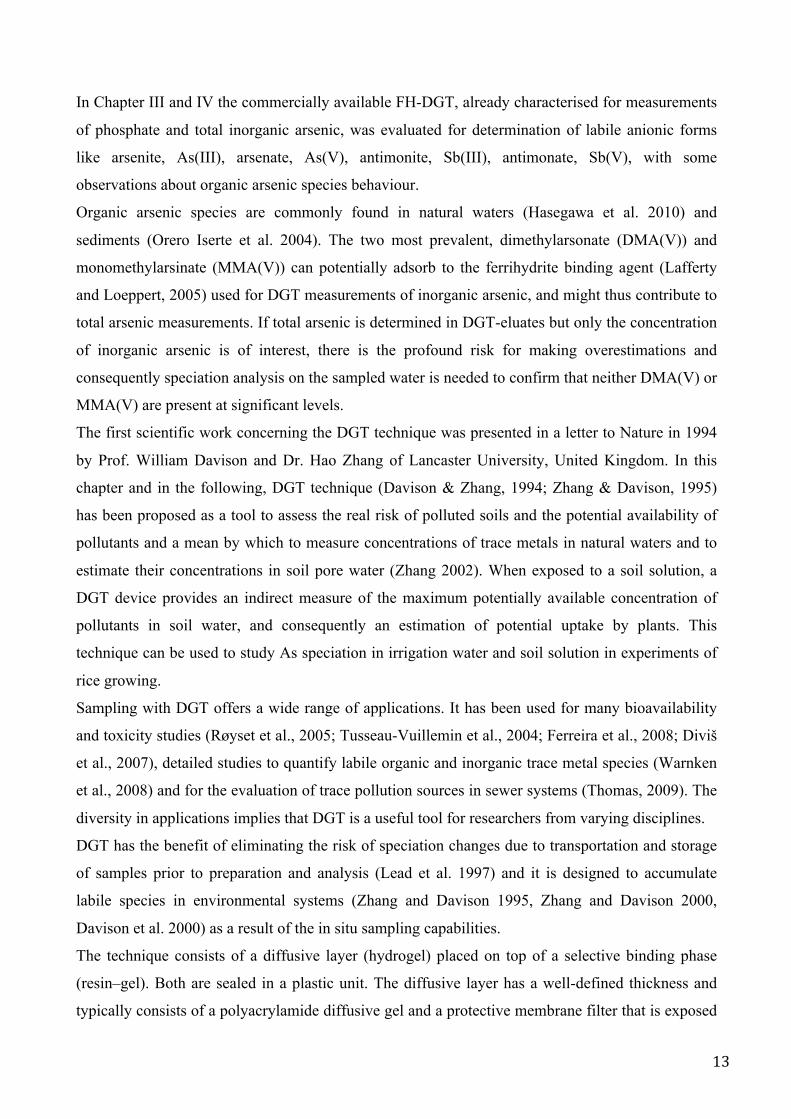
The technique consists of a diffusive layer (hydrogel) placed on top of a selective binding phase
(resin–gel). Both are sealed in a plastic unit. The diffusive layer has a well-defined thickness and
typically consists of a polyacrylamide diffusive gel and a protective membrane filter that is exposed
14
to the bulk solution through an opening/”window” in the sampling device (Figure 1).
Fig. 1. Schematic representation of a DGT device.
The hydrogel and membrane filter allow free diffusion of analyte species, smaller than the hydrogel
pore size, from the bulk solution to the binding layer, where adsorption and accumulation occurs.
DGT incorporates ferrihydrite (an iron oxyhydroxide) anion exchanger for determination of labile
anionic phosphate (Zhang H et al. 1998) and inorganic As (Panther et al. 2008). Though the
differences between the DGTs were often rather small, there were significant differences between
the binding layers for mass accumulation, and it was observed that the estimated concentrations of
DGT labile metals are dependent on the binding phase used.
The ferrihydrite backed DGT (FH-DGT) device has also been applied to Se investigation in soil
(Sogn et al. 2008), to study of P, As, V, W, Mo, Sb, and U microniches in sediments (Stockdale et
al. 2008, 2010). Recently, full characterisation was reported for the measurement of As(V), V(V),
Se(VI) and Sb(V) (Luo et al. 2010).
Analytes in the sampling medium diffuse through the membrane filter and hydrogel to finally
accumulate in the binding layer. Accumulation continues as long as the sampling device is exposed,
and after retrieval the analytes are eluted and determined at the laboratory. The knowledge of the
accumulated mass and diffusion coefficient of the analyte, as well as the deployment time and
temperature, enables calculation of the average concentration during the time of exposure.
It is important to note that the DGT concentrations may not be directly related to the total or
dissolved analyte concentrations, since species accumulated by the DGT are dependent on size and
lability.
DGT is to a certain extent special because it is designed to:
(a) bind the substances of interest and
(b) accurately control the transport of the substances to the device.
Concentration in solution is calculated using the Fick's first law of diffusion and the measured mass
of solutes accumulated on the binding agent after a known deployment time. The Fick’s first law of
24
PRACTICAL GUIDE TO USING DGTFORMEASURING PHOSPHATE IN WATERS
GEL STORAGE:1) Fe-oxide gels (for phosphate) should be stored in MQ or deionised water at room temperature.2) Diffusive gels should be stored in 0.01-0.1MNaNO3 (or NaCl) at room temperature.They can be stored under these conditions for about 12 months
TO CUT THE GEL:Place the gel on a clean perspex plate. Press the gel cutter directly onto the gel.
Useful tricks:1) Gels can be easily handled on a polyethylene sheet with a drop of water. Avoid lifting them,
rather tease them out on the surface.2) When the gel disc cutter is used for cutting the Fe-oxide gel, you need to press and twist the
cutter at the same time to ensure a clean cut.
TO ASSEMBLE DGTUNITS FOR SOLUTION DEPLOYMENT:1) Cut the gel to the correct size (d=2.5cm) using a disc gel cutter and wet the filter membrane disc(d=2.5cm) with MQ water (or deionised water).Note: The filter can be a cellulose nitrate or polysulfone membrane. For field deployments > 24hours the polysulfone membrane is preferable. The pore size of the filter membrane is 0.45 m.
2) Arrange gels and filter membrane on the moulding base as shown in Figure 1. Place the Fe-oxidegel on the base first. Then place the diffusive gel on top of the Fe-oxide gel followed by the filtermembrane. Make sure there are no air bubbles trapped between layers.
3) Carefully put the cap on ensuring it is horizontal. Then apply even force and press it down to thebottom of the base.
Figure 1. Schematic representations of a sectionthrough the DGT assembly.
TESTING DGTPERFORMANCE IN YOUR LABORATORY
Experimental Procedures1) Into a 3 L plastic container, mix 2 L of MQ water (or deionised water) and 4 ml of 100 ppm P
(KH2PO4) solution to make up a 200 ppb immersion solution. Stir for at least one hour beforeDGT deployment.
2) Place the DGT units under test in the immersion solution. Ensure the plane of the filter is vertical,parallel to the container walls and facing towards the centre of the container (you need to designa device to fix DGT units in the container). Note down the time and solution temperature. Makesure the solution is well stirred, but not cavitating.
3) At the beginning of the experiment measure the temperature and take an aliquot of the immersionsolution for subsequent analysis.
4) After about 4 hours, sample the immersion solution again, for subsequent analysis. Take the DGTunits out of the solution and rinse the surface with MQ water.
5) Note down the time of retrieval and measure the solution temperature at the end of theexperiment.
membrane filterdiffusivegel
resinlayer
outersleevewithwindow
piston
3
Products
1. Solution deployment mouldingsA plastic base (2.5 cm diameter) can be loaded with resin gel, diffusive gel and filterand then the plastic top securely push fits over it to leave a 2.0 cm diameter window.The mouldings have been designed to accommodate a 0.4 mm resin gel layer, 0.8mm diffusive gel layer and 0.135 mm filter. A 0.4 mm thick diffusive layer can beused if a 0.4 mm thick spacer is placed at the back of the resin layer..
Window
Cap
Piston
2. Gel discsPre-cast and hydrated diffusive gels and resin gels are available in disc form (2.5 cmdiameter) for solution or soil deployment mouldings. The shelf life is 12 months.
There are six types:
diffusive gel (open pore);restricted gel (restricted pore for measuring labile inorganic only);Chelex gel (for metals);Fe-oxide gel (for phosphorus);AMP gel (for Cs);AgI gel (for sulphide).
3. Gel stripsPre-cast and hydrated diffusive gel strips (about 7 cm x 22 cm, sufficient for 20 geldiscs) and resin gel strips are available for DET and DGT sediment probes. Eachstrip is sufficient for making two sediment probes. The shelf life is 12 months.
There are five types:
diffusive gel;Chelex gel (for metals);Fe-oxide gel (for phosphorus);AMP gel (for Cs);AgI gel (for sulphide).
15
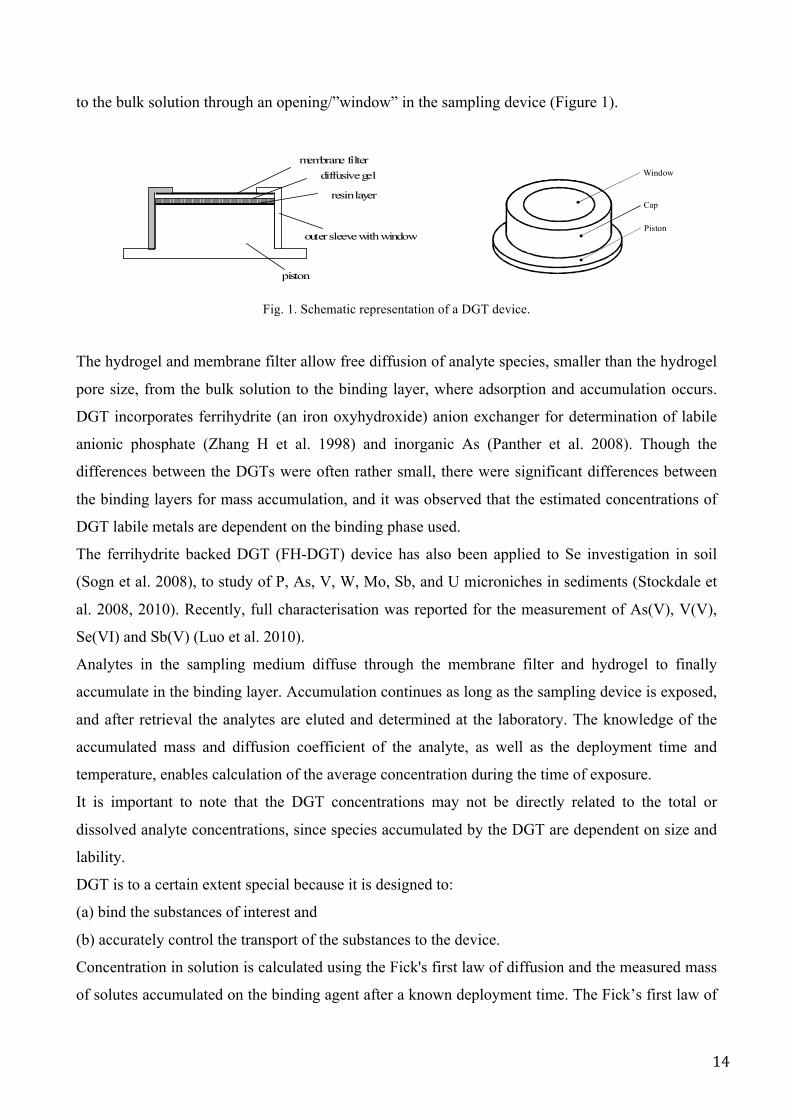
diffusion (Equation 1) is based on diffusion coefficient (D; cm2 s-1) and the concentration gradient
(ΔC/dx; mol cm-4).
! =D × ∆Cdx !". 1
If diffusion coefficients of ions in the diffusive gel are the same as in water, the flux is given by
Equation 2, where C (mol cm-3) is the bulk concentration of an ion and C’ is the concentration at the
boundary between the binding-gel and the diffusive gel.
! =D × (C− C!)∆g+ δ !". 2
If the free metal ions reach rapidly the equilibrium with the binding agent and with a large binding
constant, C’ is effectively zero, providing that the binding agent is not saturated. In well stirred
solutions, the boundary layer thickness, δ (cm), is negligibly small compared to the thickness of the
diffusive layer, Δg (cm ) of ~0.1 cm. Equation (2) then simplifies to Equation (3).
! =D × C∆g !". 3
Therefore, Eq. (3) can be rearranged to Equation (4).
! =F × ∆gD !". 4
According to the definition of flux F=M/At, where M is the mass of element species diffused
through a known area (A) after a given time (t), the concentration in the solution can be calculated
using Eq. (5).
! =M × ∆gD × A × t !". 5
M can be obtained from the direct measurement of element concentration, Ce, in the oxide-gel layer
of total volume of Vgel (Eq. (6) using a chromatographic separation techniques such as High
Performance Liquid Chromatography (HPLC).
16
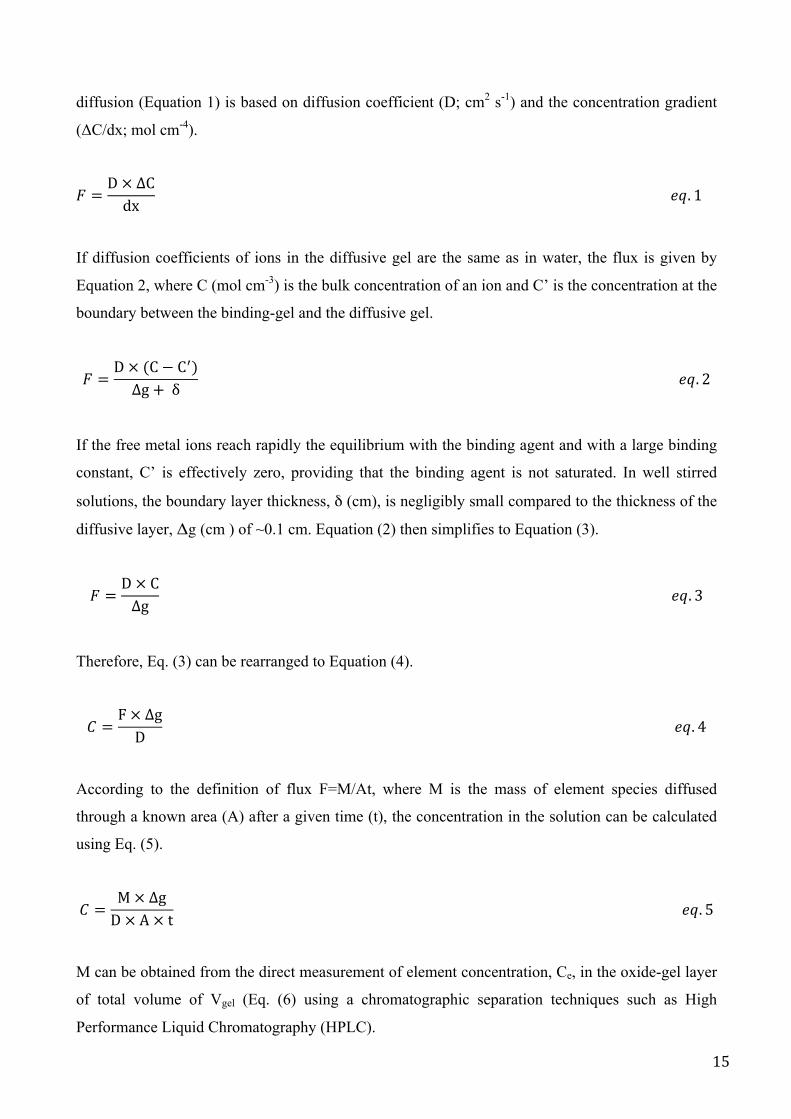
! = !!× (!!"# + !!"#$) !". 1
The opportunities associated with the DGT technique make further development desirable in order
to increase the number of elements suitable for DGT measurements. In principle the DGT technique
is quite simple, but detailed interpretation of the results of DGT-based measurements is associated
with a range of uncertainties and questions that need further investigation. Complexed metal ions
have slower diffusion rate than the corresponding free metal ion (Scally et al., 2003). Cattani et al.
(2009), used the DGT technique for the first time to assess the complexed fraction of an element,
like mercury, by humic acids. When DGT is immersed in a solution, it measures: (i) free metal ions,
which are usually both the minor and the soluble fraction of trace metals in natural waters due to the
complexation to natural inorganic and organic ligands; (ii) metal-ligand complexes which can
dissociate within the diffusion time-scale in the diffusive layer; (iii) metal from the exchange
reaction of metal-ligand and functional groups of chelating resin at the interface between the
binding phase and the diffusive layer (if the stability constant for the metal of the metal-resin is
much greater than that of metal-ligand). DGT does not measure inert diffusible complexes which
will not contribute to the mass accumulation in the binding phase, or large complexes of metal, such
as metal adsorbed to particles and large colloids, which are excluded from the diffusive layer (Li et
al., 2005).
Diffusion coefficients are normally determined at room temperature and thereafter adjusted to
deployment temperature. This corresponds to a change of 3% per °C. However, Larner et al. (2006)
showed that diffusion coefficients of Cd, Pb, Al, Mn, Co, Cu and Zn measured at –1 °C on average
differed 12% from the recalculated values determined at 20 °C. Therefore, for accurate
measurements in low temperature waters it may be necessary to repeat diffusion coefficient
measurements. When high accuracy is necessary, temperature loggers might be needed. The
temperature logger is attached in situ close to the DGT devices and is programmed to register the
temperature at specified time intervals.
1.5. Principle of isotopic diluition-ICP-MS.
Isotope dilution analysis (IDA) is a well-known analytical technique based on the measurement of
isotope ratios in samples where its isotopic composition has been altered by the addition of a known
amount of an isotopically enriched element.
17
The use of IDA for total elemental determinations is well documented in the literature and several
reviews and books have been written on this subject (Heumann, 1992 & 1998; Fasset and Paulsen,
1989; De Bievre, 1994). In the last years, we have seen the application of isotope dilution
methodologies in some new analytical fields. One of those new fields is elemental speciation, where
the aim is the determination of the individual chemical species in which an element is distributed in
a given sample.
Isotope dilution analysis relies on the intentional alteration of the isotope abundances of an
endogenous element in a given sample by the addition of a known amount of an enriched isotope of
the same element (spike). The element to be analysed must have, therefore, at least two stable or
long-lived radioactive isotopes able to be measured in a mass spectrometer free of spectral
interferences.
For best comprehension, the isotope a is the most abundant in the sample whereas the spike is
isotopically enriched in the isotope b. It is clear that the abundance of the two isotopes and, hence,
the isotope ratio in the mixture, will be intermediate between those in the sample and the spike and
it will depend both on the amount of spike added and on the initial amount of the element in the
sample. Those relationships can be expressed mathematically using a simple isotope dilution
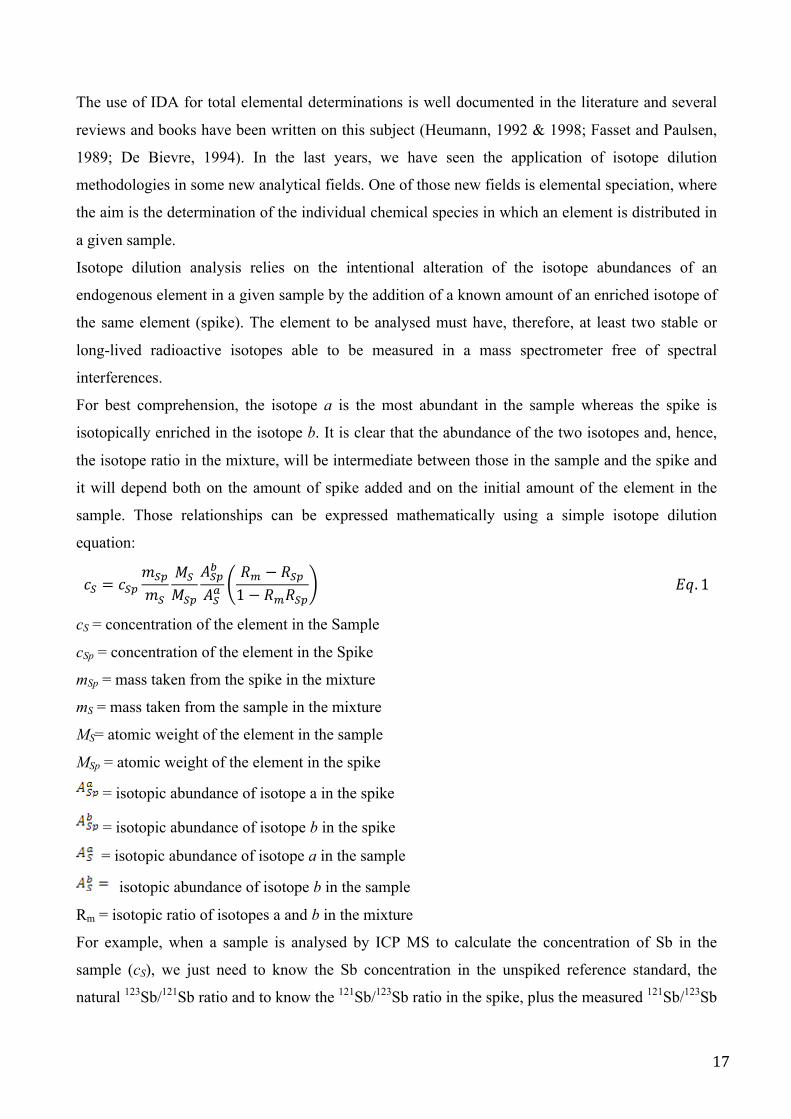
equation:
!! = !!"!!"
!!
!!
!!"
!!"!
!!!!! − !!"1− !!!!"
!". 1
cS = concentration of the element in the Sample
cSp = concentration of the element in the Spike
mSp = mass taken from the spike in the mixture
mS = mass taken from the sample in the mixture
MS= atomic weight of the element in the sample
MSp = atomic weight of the element in the spike
= isotopic abundance of isotope a in the spike
= isotopic abundance of isotope b in the spike
= isotopic abundance of isotope a in the sample
isotopic abundance of isotope b in the sample
Rm = isotopic ratio of isotopes a and b in the mixture
For example, when a sample is analysed by ICP MS to calculate the concentration of Sb in the
sample (cS), we just need to know the Sb concentration in the unspiked reference standard, the
natural 123Sb/121Sb ratio and to know the 121Sb/123Sb ratio in the spike, plus the measured 121Sb/123Sb
18
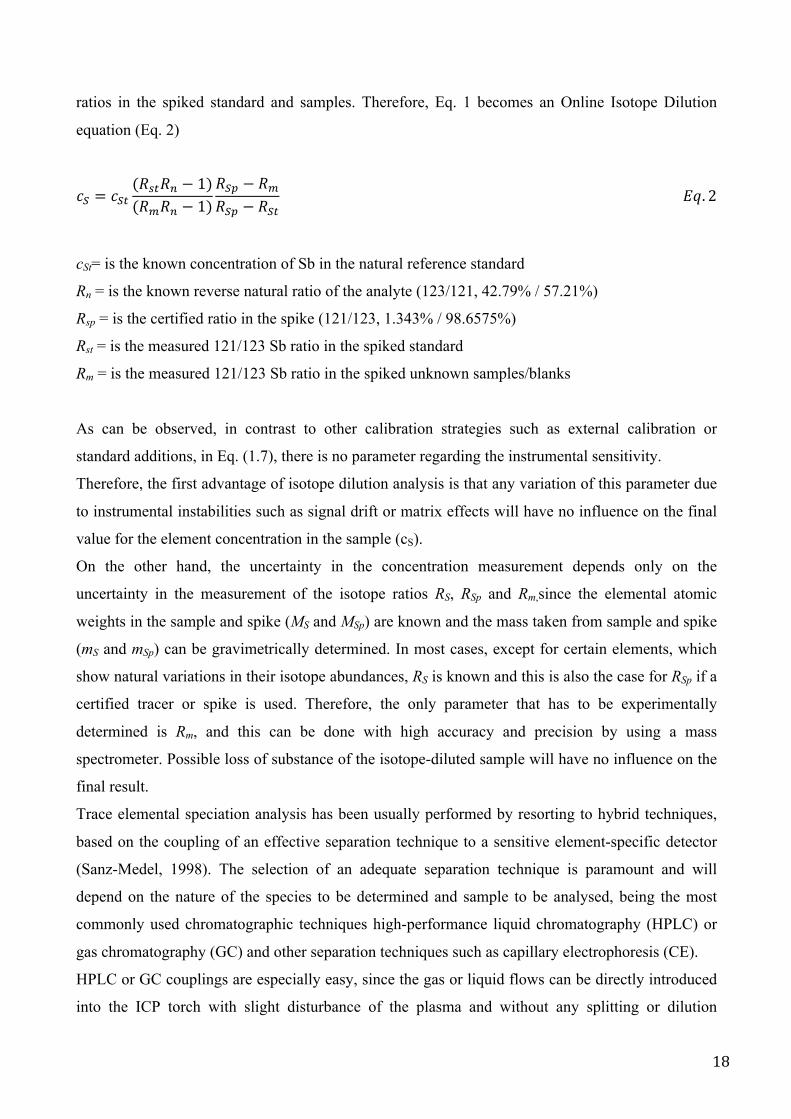
ratios in the spiked standard and samples. Therefore, Eq. 1 becomes an Online Isotope Dilution
equation (Eq. 2)
!! = !!"(!!"!! − 1)(!!!! − 1)
!!" − !!!!" − !!"
!". 2
cSt= is the known concentration of Sb in the natural reference standard
Rn = is the known reverse natural ratio of the analyte (123/121, 42.79% / 57.21%)
Rsp = is the certified ratio in the spike (121/123, 1.343% / 98.6575%)
Rst = is the measured 121/123 Sb ratio in the spiked standard
Rm = is the measured 121/123 Sb ratio in the spiked unknown samples/blanks
As can be observed, in contrast to other calibration strategies such as external calibration or
standard additions, in Eq. (1.7), there is no parameter regarding the instrumental sensitivity.
Therefore, the first advantage of isotope dilution analysis is that any variation of this parameter due
to instrumental instabilities such as signal drift or matrix effects will have no influence on the final
value for the element concentration in the sample (cS).
On the other hand, the uncertainty in the concentration measurement depends only on the
uncertainty in the measurement of the isotope ratios RS, RSp and Rm,since the elemental atomic
weights in the sample and spike (MS and MSp) are known and the mass taken from sample and spike
(mS and mSp) can be gravimetrically determined. In most cases, except for certain elements, which
show natural variations in their isotope abundances, RS is known and this is also the case for RSp if a
certified tracer or spike is used. Therefore, the only parameter that has to be experimentally
determined is Rm, and this can be done with high accuracy and precision by using a mass
spectrometer. Possible loss of substance of the isotope-diluted sample will have no influence on the
final result.
Trace elemental speciation analysis has been usually performed by resorting to hybrid techniques,
based on the coupling of an effective separation technique to a sensitive element-specific detector
(Sanz-Medel, 1998). The selection of an adequate separation technique is paramount and will
depend on the nature of the species to be determined and sample to be analysed, being the most
commonly used chromatographic techniques high-performance liquid chromatography (HPLC) or
gas chromatography (GC) and other separation techniques such as capillary electrophoresis (CE).
HPLC or GC couplings are especially easy, since the gas or liquid flows can be directly introduced
into the ICP torch with slight disturbance of the plasma and without any splitting or dilution
19
process. Due to the multi-element capability and the high sensitivity of the inductively coupled
plasma–mass spectrometer (ICP-MS), as well as the possibility of measuring different isotopes of a
given element, the coupling of these separation techniques to an ICP-MS has been in the past years
one of the most powerful tools for elemental speciation.
The application of isotope dilution analysis for elemental speciation can be performed under two
different modes: species-specific and species-unspecific spiking, depending on when and in which
chemical form the isotope tracer (spike) is added to the sample.
The species-specific spiking mode requires the use of a spike solution containing the species to be
analysed in an isotopically labelled form.
Conversely, in the species-unspecific spiking mode, the addition of the isotope tracer or spike is
carried out after the complete separation of the naturally occurring species in the sample has taken
place (post-column spiking). This mode is especially useful either when the structure and
composition of the sought species is not exactly known or when the corresponding isotopically
labelled compounds are not commercially available or cannot be synthesized.
Also, this mode of spiking can only be applied when the ionisation efficiency of the element is
independent from the chemical form in which the element is presented to the ion source. Hence,
only ICP-MS has been used till now for post-column isotope dilution as the ionisation efficiencies
in this ion source can be considered independent from the chemical form of the element (Schwarz
and Heumann, 2002). The isotope ratio changes along the peak as the enriched spike is pumped
continuously post-column. Only point-by-point isotope ratio measurement is adequate, because the
integration of the isotope ratio chromatogram will provide the concentration of the sought species.
Rottmann and Heumann described the first application of species-unspecific isotope dilution
analysis in 1994. In this pioneer chapter, an approach based on an on-line isotope dilution technique
coupled with HPLC-ICP-MS was developed and applied for the determination of metal complexed
with humic substances in river water.
In order to obtain the concentration of the different species in the sample, the continuous addition of
the spike solution containing the enriched isotopes is performed by a peristaltic pump in such a way
that it is completely and continuously mixed -through a T piece- with the effluent from the column
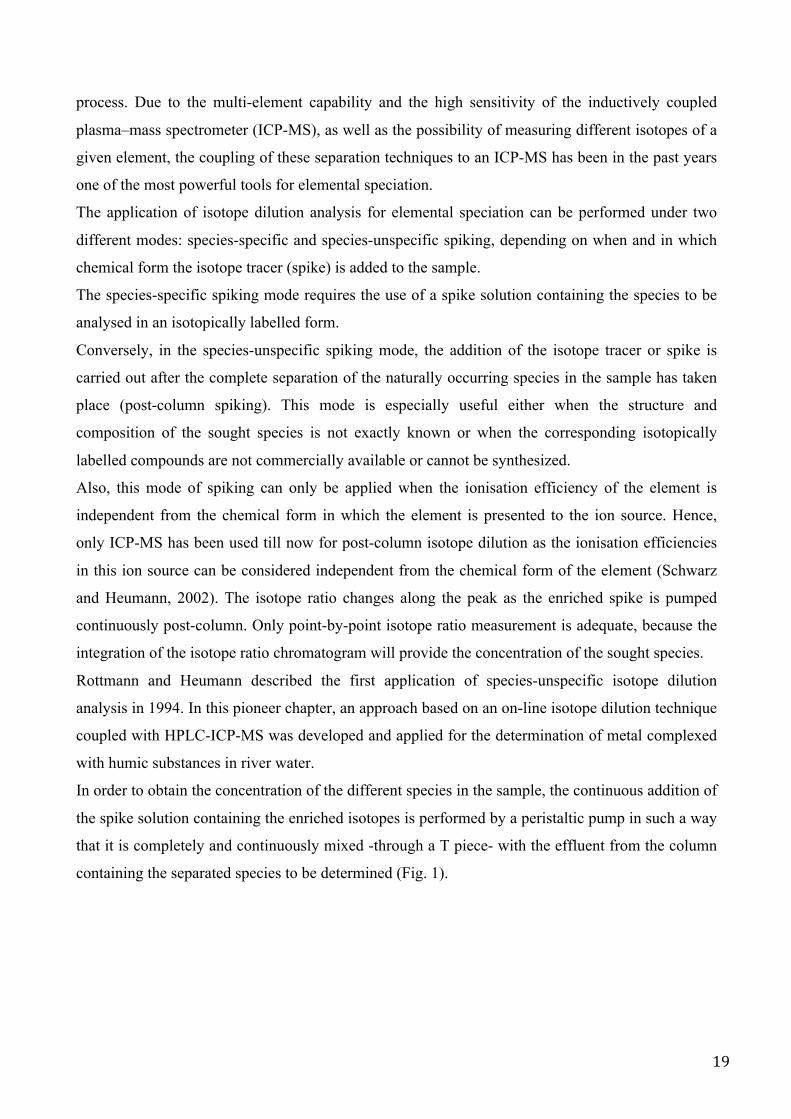
containing the separated species to be determined (Fig. 1).
20
Fig. 1 Representation of mix of spike solution and effluent from the column.
In brief, the basis of this on-line isotope dilution technique relies on the plotting of the mass flow
vs. retention time. The various peaks detected have to be integrated and normalised to the injection
volume. The mass flow is calculated by measuring the corresponding isotope ratio throughout the
whole chromatographic run. If no discrimination of the species during the ionisation processes is
assumed, a mass flow profile can therefore be obtained. The equations used for post-column isotope
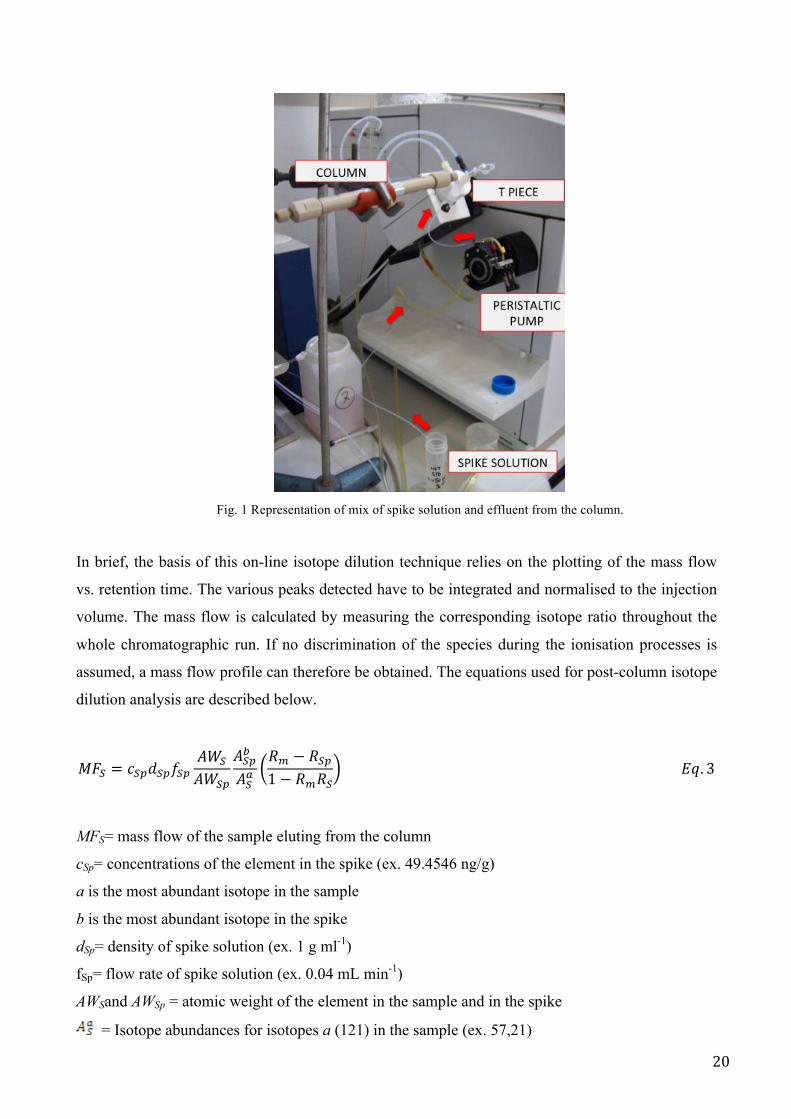
dilution analysis are described below.
!"! = !!"!!"!!"!"!
!"!"
!!"!
!!!!! − !!"1− !!!!
!". 3
MFS= mass flow of the sample eluting from the column
cSp= concentrations of the element in the spike (ex. 49.4546 ng/g)
a is the most abundant isotope in the sample
b is the most abundant isotope in the spike
dSp= density of spike solution (ex. 1 g ml-1)
fSp= flow rate of spike solution (ex. 0.04 mL min-1)
AWSand AWSp = atomic weight of the element in the sample and in the spike
= Isotope abundances for isotopes a (121) in the sample (ex. 57,21)
21
= Isotope abundances for isotopes b (123) in the spike (ex. 98.66)
Rm= the isotope ratio (a/b) (121/123) in the mixture
RSp = is the isotope ratio (a/b) (121/123, 1.343% /98.6575%) in the spike
RS = the isotope ratio (b/a) (123/121, 42.79% / 57.21%) in the sample
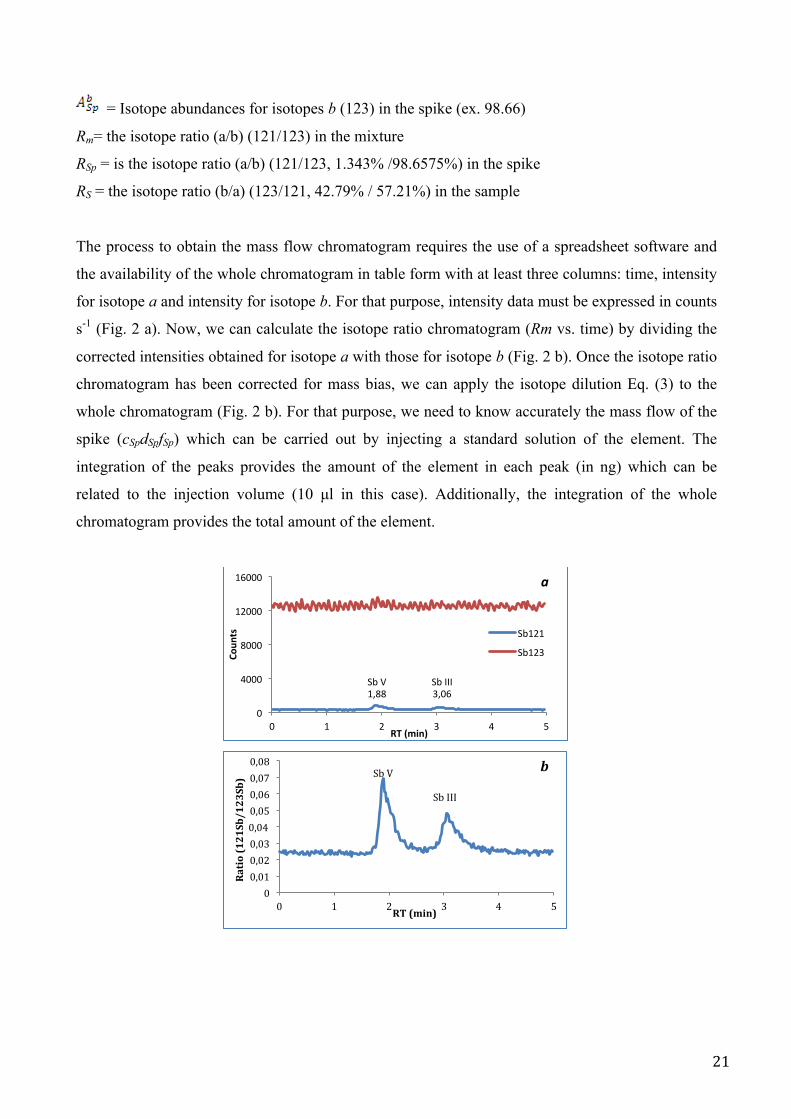
The process to obtain the mass flow chromatogram requires the use of a spreadsheet software and
the availability of the whole chromatogram in table form with at least three columns: time, intensity
for isotope a and intensity for isotope b. For that purpose, intensity data must be expressed in counts
s-1 (Fig. 2 a). Now, we can calculate the isotope ratio chromatogram (Rm vs. time) by dividing the
corrected intensities obtained for isotope a with those for isotope b (Fig. 2 b). Once the isotope ratio
chromatogram has been corrected for mass bias, we can apply the isotope dilution Eq. (3) to the
whole chromatogram (Fig. 2 b). For that purpose, we need to know accurately the mass flow of the
spike (cSpdSpfSp) which can be carried out by injecting a standard solution of the element. The
integration of the peaks provides the amount of the element in each peak (in ng) which can be
related to the injection volume (10 µl in this case). Additionally, the integration of the whole
chromatogram provides the total amount of the element.
0
4000
8000
12000
16000
0 1 2 3 4 5
Coun
ts
RT (min)
Sb121
Sb123
Sb V 1,88
Sb III 3,06
a
0 0,01 0,02 0,03 0,04 0,05 0,06 0,07 0,08
0 1 2 3 4 5
Ratio (121Sb/123Sb)
RT (min)
Sb V
Sb III
b
22
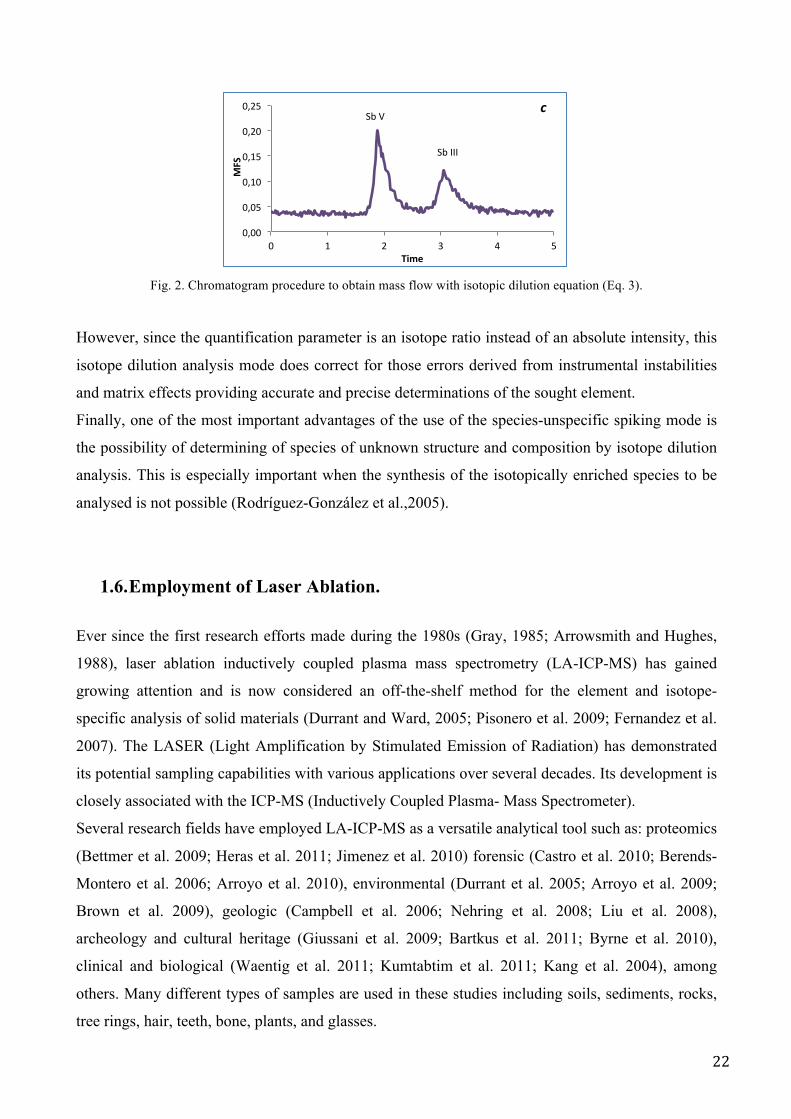
Fig. 2. Chromatogram procedure to obtain mass flow with isotopic dilution equation (Eq. 3).
However, since the quantification parameter is an isotope ratio instead of an absolute intensity, this
isotope dilution analysis mode does correct for those errors derived from instrumental instabilities
and matrix effects providing accurate and precise determinations of the sought element.
Finally, one of the most important advantages of the use of the species-unspecific spiking mode is
the possibility of determining of species of unknown structure and composition by isotope dilution
analysis. This is especially important when the synthesis of the isotopically enriched species to be
analysed is not possible (Rodríguez-González et al.,2005).
1.6. Employment of Laser Ablation. Ever since the first research efforts made during the 1980s (Gray, 1985; Arrowsmith and Hughes,
1988), laser ablation inductively coupled plasma mass spectrometry (LA-ICP-MS) has gained
growing attention and is now considered an off-the-shelf method for the element and isotope-
specific analysis of solid materials (Durrant and Ward, 2005; Pisonero et al. 2009; Fernandez et al.
2007). The LASER (Light Amplification by Stimulated Emission of Radiation) has demonstrated
its potential sampling capabilities with various applications over several decades. Its development is
closely associated with the ICP-MS (Inductively Coupled Plasma- Mass Spectrometer).
Several research fields have employed LA-ICP-MS as a versatile analytical tool such as: proteomics
(Bettmer et al. 2009; Heras et al. 2011; Jimenez et al. 2010) forensic (Castro et al. 2010; Berends-
Montero et al. 2006; Arroyo et al. 2010), environmental (Durrant et al. 2005; Arroyo et al. 2009;
Brown et al. 2009), geologic (Campbell et al. 2006; Nehring et al. 2008; Liu et al. 2008),
archeology and cultural heritage (Giussani et al. 2009; Bartkus et al. 2011; Byrne et al. 2010),
clinical and biological (Waentig et al. 2011; Kumtabtim et al. 2011; Kang et al. 2004), among
others. Many different types of samples are used in these studies including soils, sediments, rocks,
tree rings, hair, teeth, bone, plants, and glasses.
0,00
0,05
0,10
0,15
0,20
0,25
0 1 2 3 4 5 MFS
Time
Sb V
Sb III
c
23
The most striking features of LA-ICP-MS are ease of use, high sensitivity, and a dynamic range
covering up to twelve orders of magnitude, allowing for the simultaneous acquisition of major,
minor, and trace constituents. Furthermore, little or even no sample preparation is required, making
LA-ICP-MS particularly attractive for the analysis of chemically resistant materials such as fluorites
or zircons (Jeffries et al. 1998; Kosler et al. 2005). Another important feature is its high spatial
resolution (<1 µm) and therefore small material uptake (<0.1 µg s-1), which accounts for the non-
destructive sample appearance on the macroscopic scale (>1 mm).
Depending on the LA protocol and sample material chosen, heterogeneous aerosols composed of
nanoparticles and larger aggregates are released upon laser exposure, which can limit the accuracy
of analyses as a result of varying evaporation and ionization patterns inside the ICP if non-matrix-
matched calibration standards are used.
To suppress the occurrence of molecular interferences formed by polyatomic ions and to achieve
the optimum ion yield needed for trace element determinations, the inert gases argon and helium are
supplied as aerosol carriers.
Considering the above-mentioned heterogeneity and size structure of aerosols emerging from the
LA process, indispensable pre-conditions for accurate analyses are (1) a representative aerosol
composition, (2) high transport efficiencies, and (3) a complete decomposition of particles that
reach the ICP (Garcia et al. 2009). For the purpose of representative sampling, Nd:YAG laser
sources emitting nano-second (ns) pulses (5 to 10 ns) in the mid- and far-ultraviolet (UV) spectral
range down to 213 nm have been most commonly used.
However, the formation of particles in the micrometer-size range produced in this way has been
reported to strongly affect precision and accuracy of Nd:YAG laser-based LA-ICP-MS analyses,
since they were found to insufficiently evaporate in the ICP, resulting in spikes and drifting signals
(Guillong and Gunther, 2002; Hola et al. 2008).
Because the detection of analyte ions formed inside the ICP can only be accomplished under
vacuum conditions, a differentially pumped sampler-skimmer system is arranged in front of the
mass analyser, that separates ions according to their mass-to-charge (m/z) ratio. Depending on mass
resolution, sensitivity, and precision required, ICP-MS analyses of laser-produced aerosols are
carried out by either quadrupole (Q). Today, virtually all ICP-MS instruments can be equipped with
detectors covering a linear dynamic range of a maximum of twelve orders of magnitude, permitting
the simultaneous acquisition of major and trace elements.
The quantification capabilities of LA-ICP-MS critically depend on the availability of adequate
reference standards for calibration that, at best, exactly match the sample composition.

24
Conceptually, the laser ablation system, CETAC LSX-213 G2 in our study, provides a mean of
rapid and direct analysis of solid samples without dissolution and with minimal sample preparation.
The laser ablation system features a high-energy laser and computer-controlled sampling methods
using the DigiLazTM G2 Software. The laser ablation system generates particulate aerosols from soil
material by an extreme rapid interaction between a high energy UV larger pulse and the sample
surface. This process is referred to as ablation. Adjusting laser energy, spot size and pulse frequency
using the DigiLaz G2 Software optimizes signal intensity and stability. Ablated material is swept
into the ICP-MS by carrier gas (Fig. 1). Typically, a solid sample is placed inside an enclosed
chamber (the sample cell) and a laser beam is focused on the surface of the sample. The sample cell
is mounted on a computer controlled X-Y-Z translation stage, with a step size of 0.25 µm.
When the laser is fired, a cloud of particles is produced. These particles are removed from the
sample cell by a carrier gas, and are swept into the inductively coupled plasma for atomization and
ionization and subsequent analysis. Compared with conventional dissolution techniques, laser
ablation has many advantages. Most analytical techniques involve removing a portion of the solid
sample, which is then dissolved in acid solutions. With this procedure, there is a greater chance of
exposure to hazardous materials and there is a risk of introducing contaminants or losing volatile
components during sample preparation. For laser ablation, any type of solid sample can be ablated
for analysis; there are no sample-size requirements and no sample preparation procedures. In
addition, a focused laser beam permits spatial characterization of heterogeneity in solid samples,
with typically micron resolution both in terms of lateral and depth conditions.
The LSX-213 G2 employs a specially designed Nd:YAG laser; frequency quintuplicated to the
ultraviolet wavelength of 213 nm (Fig. 2). This laser provides a uniforms energy profile (“flat-top
profile”) across all spot sizes and yields a flat-bottomed crater on the sample. The laser can be
operated at a high repetition rate of up to 20 Hz for increased sampling efficiency and better ICP-
MS sensitivity.
25
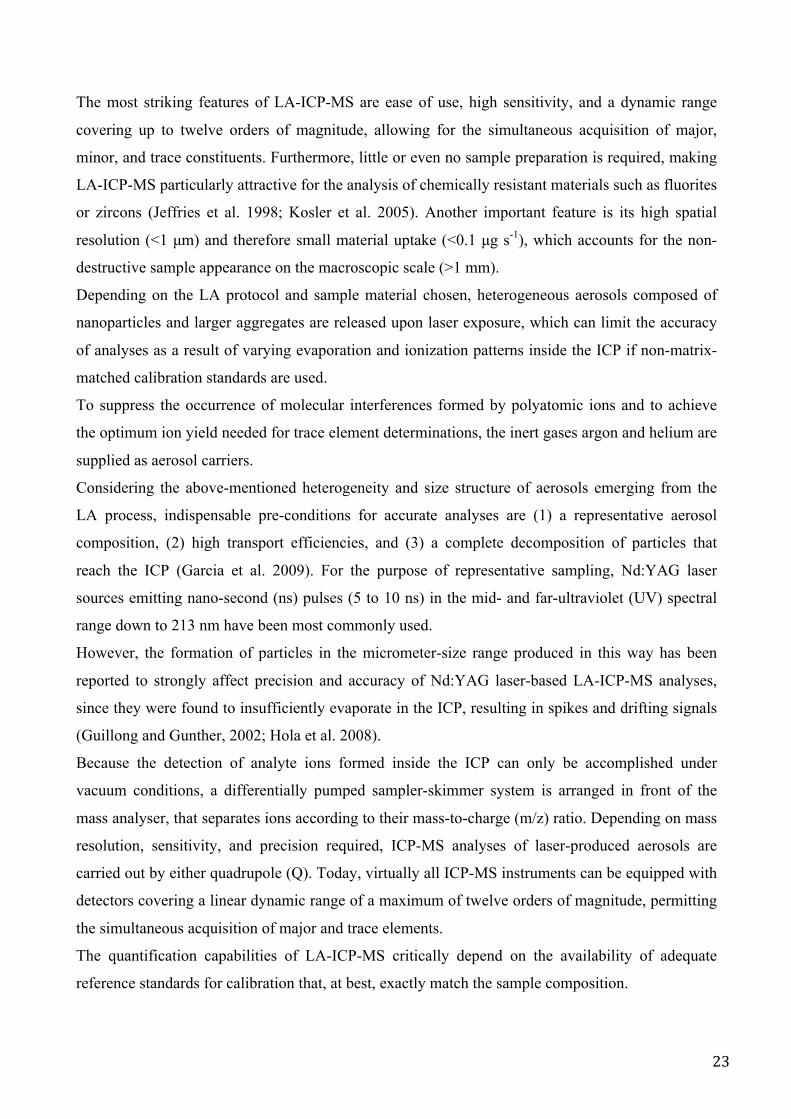
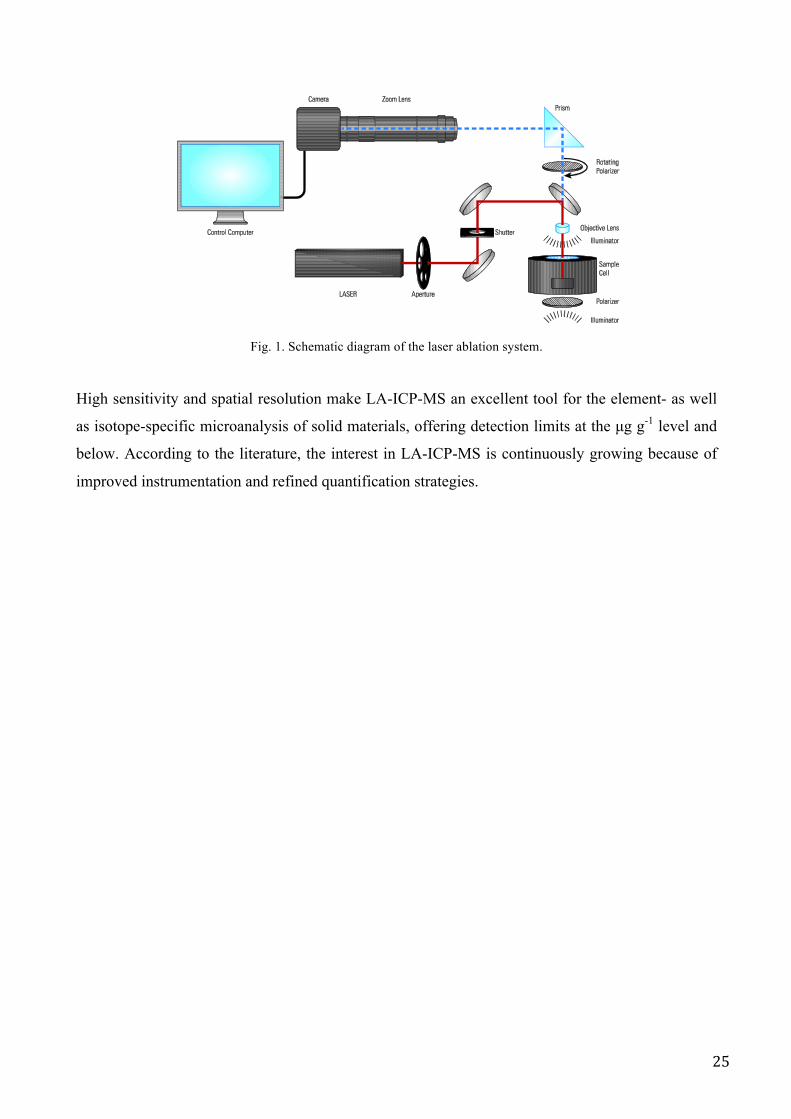
Fig. 1. Schematic diagram of the laser ablation system.
High sensitivity and spatial resolution make LA-ICP-MS an excellent tool for the element- as well
as isotope-specific microanalysis of solid materials, offering detection limits at the µg g-1 level and
below. According to the literature, the interest in LA-ICP-MS is continuously growing because of
improved instrumentation and refined quantification strategies.
!"#$!%&'()*+,%-./0123045%617819%%
!:1.2/0%+;%<7203=8>2?37%
!"#
!"#$%!&'(%)*+%",-!(%./(0,(*12%,!&*3%$4(%5&3&6)'%78%!#.$9)/(%#"$&:&'(!%!&3*)-%&*$(*!&$2%)*+%!$);&-&$2<%
=;-)$(+%:)$(/&)-%&!%!9("$%&*$#%$4(%>?@ABC%#/%>?@ADEC%;2%$4(%1)//&(/%3)!<%B)*2%$2"(!%#.%!):"-(!%1)*%;(%)*)-2'(+%,!&*3%-)!(/%);-)$&#*%!):"-(%&*$/#+,1$&#*%&*1-,+&*3%3-)!!(!F%1#)$&*3!F%/(./)1$#/2%:)$(/&)-!F%"#9+(/!F%1(/):&1!F%3(#-#3&1)-%!):"-(!F%"/#1(!!%:)$(/&)-!%)*+%"#-2:(/!<%%=;-)$&#*%:)2%;(%"(/.#/:(+%#*%!):"-(!%#.%(-(1$/&1)--2%1#*+,1$&G(%#/%*#*A1#*+,1$&G(%:)$(/&)-!<%
!"#$%&'()"*+,-&.%,/$##&
H2"&1)--2F%)%!#-&+%!):"-(%&!%"-)1(+%&*!&+(%)*%(*1-#!(+%14):;(/%I$4(%!):"-(%1(--J%)*+%)%-)!(/%;():%&!%.#1,!(+%#*%$4(%!,/.)1(%#.%$4(%!):"-(<%K4(*%$4(%-)!(/%&!%.&/(+F%)%1-#,+%#.%")/$&1-(!%&!%"/#+,1(+<%H4(!(%")/$&1-(!%)/(%/(:#G(+%./#:%$4(%!):"-(%1(--%;2%)%1)//&(/%3)!F%)*+%)/(%!9("$%&*$#%$4(%>?@%"-)!:)%.#/%)$#:&')$&#*%)*+%&#*&')$&#*%)*+%!,;!(0,(*$%)*)-2!&!<%%
%
0+12%$&345%%%%C14(:)$&1%5&)3/):%#.%$4(%6)!(/%=;-)$&#*%C2!$(:%
&
!"#$%&'()"*+,-&67#*$8&9,8:,-$-*#&H4(%-)!(/%);-)$&#*%!2!$(:%&!%1#:"#!(+%#.%$4(%.#--#9&*3%1#:"#*(*$!<%%
!"#$%&9"(+-$*;%H4(%-)!(/%1);&*($%1#*$)&*!%$4(%-)!(/%&$!(-.F%)--%#"$&1!F%)"(/$,/(!F%-&34$&*3%($1<%H4(%!):"-(%1(--%#*%$4(%$/)*!-)$&#*%!$)3(%&!%()!&-2%",--(+%.#/9)/+%.#/%)11(!!%$#%$4(%!):"-(%1(--<%H4(%(-(1$/#*&1!%&*%$4(%1);&*($%)/(%"#9(/(+%;2%)%!:)--%+(!L$#"%M;/&1LM%$/)*!.#/:(/<%
9,,)$%<.,=$%&62::)7;&H4(%1##-(/N"#9(/%!,""-2%"/#G&+(!%"#9(/%.#/%$4(%-)!(/%)*+%1&/1,-)$(!%1##-(+%9)$(/%$4/#,34%$4(%-)!(/%4()+<%
>,#*&9,8:2*$%;%H4(%!2!$(:%&!%1#*$/#--(+%;2%)%"(/!#*)-%1#:",$(/<%>*%:#!$%1)!(!F%$4(%!,""-&(+%@?%!4#,-+%;(%,!(+F%)-$4#,34%)*#$4(/%1#:",$(/%1)*%;(%,!(+%&.%/(0,&/(+<%H4(%4#!$%1#:",$(/%/,*!%$4(%5&3&6)'O%78%!#.$9)/(F%94&14%1#*$/#-!%!):"-(%"#!&$&#*&*3F%-)!(/%.&/&*3F%1):(/)%#"(/)$&#*F%!):"-(%1(--%&--,:&*)$&#*F%)*+%3)!%.-#9<%%
26
1.7. References
Abedin MJ, Cotter-Howells JC, Meharg AA. 2002. Arsenic uptake and accumulation in rice (Oryza sativa L.) irrigated
with contaminated water. Plant and Soil, Vol 240, N 2, 311-319.
Adomako EE, Solaiman ARM, Williams PN, Deacon C, Rahman GKMM, Meharg AA. 2009. Enhanced transfer of
arsenic to grain for Bangladesh grown rice compared to US and EU. Environ Int 35:476–479
Ahrland S. 1968. Thermodynamics of complex formation between hard and soft acceptors and donors. Struct. Bond. 5,
118–149.
Ahrland, S. 1973. Thermodynamics of stepwise formation of metal – ion complexes in aqueous solutions. Struct. Bond.
15, 167 – 188.
Anderegg G and Malik S. 1970. Die Komplexbildungstendenz des dreiwertigen Antimons in wässeriger Lösung. Helv.
Chim. Acta. 53, 577–600.
Anderegg G and Malik S. 1970. Komplexone XLIII. Die Komplexe des dreiwertigen Antimons mit
Polyaminocarboxylates. Helv. Chim. Acta. 53, 564–569.
Anderegg G and Malik S. 1967. Wasserlösliche Komplexe des dreiwertigen Antimons. Chimia. 21, 541–544.
Andreae MO, Byrd TJ, Froelich ON. 1983. Arsenic, antimony, germanium and tin in the Tejo estuary, Portugal:
modelling of a polluted estuary. Environ. Sci. Technol. 17, 731–737.
Aposhian HV, Aposhian MM. 2006. Arsenic toxicology: five questions. Chem Res Toxicol. 19: 1–15.
Arrowsmith P and S. K. Hughes. 1988. Entrainment and Transport of Laser Ablated Plumes for Subsequent Elemental
Analysis. Appl. Spectrosc. 42, 1231.
Arroyo L, Trejos T, Gardinali PR and Almirall JR. 2009. Optimization and validation of a Laser Ablation Inductively
Coupled Plasma Mass Spectrometry method for the routine analysis of soils and sediments. Spectrochim. Acta.
Part B, 64, 16.
Arroyo L, Trejos T, Hosick T, Machemer S, Almirall JR and Gardinali PR. 2010. Analysis of Soils and Sediments by
Laser Ablation Inductively Coupled Plasma Mass Spectrometry (LA-ICP-MS): An Innovative Tool for
Environmental Forensics. Environ. Forensics. 11(4), 315.
Attané I, Courbage J, 2001. La démographie en Méditerranée. Situation et projections. Les Fascicules du Plan Bleu, 11.
Paris, Economica, pp. 249.
Bartkus L, Amarasiriwardena D, Arriaza B, Bellis D and Yanez J. 2011.Exploring lead exposure in ancient Chilean
mummies using a single strand of hair by laser ablation-inductively coupled plasma-mass spectrometry (LA-
ICP-MS). Microchem. J. 98, 267.
Berends-Montero S, Wiarda W, de Joode P and G. van der Peijl. 2006. Forensic analysis of float glass using laser
ablation inductively coupled plasma mass spectrometry (LA-ICP-MS): validation of a method. J. Anal. At.
Spectrom. 21, 1185.
Bettmer J, Bayon MM, Encinar JR, Sanchez MLF, M. R. F. de la Campa and Medel AS. 2009.The emerging role of
ICP-MS in proteomic analysis. J. Proteomics. 72, 989.
Bhat TR, Iyer RK, Shankar J. 1966. Antimony and bismuth chelates of N-hydroxyethyl ethylene diamine triacetic acid.
Z. Anorg. Chem. 343, 329–336.
Bhat TR, Iyer RK. 1965. Studies on EDTA complexes. V. Antimony(III) and bismuth(III) EDTA systems. Z. Anorg.
Allg. Chem. 335, 331–336.
27
Bhattacharjee H, Rosen BP and R Mukhopadhyay. 2009. Aquaglyceroporins and metalloid transport: implications in
human diseases. Handb. Exp. Pharmacol. 190, 309–325.
Bissen M, Frimmel FH. 2003. Arsenic—a review. Part II: oxidation of arsenic and its removal in water treatment. Acta
Hydrochim Hydrobiol. 31:97–107.
Boorman GA, Dellarco V, Dunnick JK, Chapin RE, Hunter S, Hauchman F, et al. 1999. Drinking water disinfection
byproducts: review and approach to toxicity evaluation. Environ Health Perspect. 107(Suppl 1): 207–17.
Brown JC, Jarvis KE, Disch BA, Goddard SL and AS Brown. 2009. Spatial inhomogeneity of metals in particulate
matter on ambient air filters determined by LA-ICP-MS and comparison with acid digestion ICP-MS. J.
Environ. Monit. 11, 2022.
Byrne S, Amarasiriwardena D, Bandak B, Bartkus L, Kane J, Jones J, Yanez J, Arriaza B and L Cornejo. 2010. Were
Chinchorros exposed to arsenic? Arsenic determination in Chinchorro mummies' hair by laser ablation
inductively coupled plasma-mass spectrometry (LA-ICP-MS). Microchem. J. 94, 28.
Campbell IH, Ballard JR, Palin JM, Allen C and A Faunes. 2006. U-Pb Zircon Geochronology of Granitic Rocks from
the Chuquicamata-El Abra Porphyry Copper Belt of Northern Chile: Excimer Laser Ablation ICP-MS.
Analysis. Econ. Geol. 101(7), 1327.
Castro W, Hoogewerff J, Latkoczy C and JR Almirall. 2010. Application of laser ablation (LA-ICP-SF-MS) for the
elemental analysis of bone and teeth samples for discrimination purposes. Forensic Sci. Int. 195, 17.
Cattani I, Zhang H, Beone GM, Del Re AA, Boccelli R, Trevisan M. 2009. The role of natural purified humic acids in
modifying mercury accessibility in water and soil. J Environ Qual. 6:493-501.
Chang KN, Lee TC, Tam MF, Chen YC, Lee LW, Lee SY, et al. 2003. Identification of galectin I and thioredoxin
peroxidase II as two arsenic-binding proteins in Chinese hamster ovary cells. Biochem J. 371:495–503.
Cohen S. 1987. Projected increases in municipal water use in the Great Lakes due to C02- induced climatic change.
Water Resources Bulletin. 23(1), 91-101.
Cullen WR, Reimer KJ. 1989. Arsenic speciation in the environment. Chem Rev. 89: 713–64.
D. Lgs 152/2006, Norme in materia ambientale, Parte Terza, 2006, p. 30-83.
D. Lgs 30/2009, Attuazione della dir 2006/118/CE , relativa alla protezione delle acque sotterranee dall’inquinamento e
dal deterioramento.
D. Lgs 31/2001 Attuazione della direttiva 98/38/CE relativa alla qualità delle acque destinate al consumo umano.
Dagnac T, Padro ́A, Rubio R, Rauret G. 1999. Speciation of arsenic in mussels by the coupled system liquid
chromatography UV irradiation hydride generation inductively coupled plasma mass spectrometry. Talanta.
48, 763–772.
Davison W, Fones G, Harper M, Teasdale P, Zhang H In J. Buffle, G. Horvai (Eds.). 2000. In Situ Monitoring of
Systems: Chemical Analysis and Speciation. John Wiley &Sons Inc., New York, p. 495.
Davison W, Zhang H. 1994. In situ speciation measurements of trace components in natural waters using thin-film gels.
Nature. 367, 546-548.
De Bievre P. 1994. Isotope-dilution mass spectrometry. Tech. Instrum. Anal. Chem. 15, 169 – 183.
De Gregori I, Quiroz W, Pinochet H, Pannier F, Potin-Gautier M. 2005. Simultaneous speciation analysis of Sb(III),
Sb(V) and (CH3)3SbCl2 by high performance liquid chromatography-hydride generation-atomic fluorescence
spectrometry detection (HPLC-HG-AFS): application to antimony speciation in sea water. J. Chromatogr. A
1091, 94.
28
De Gregori I, Quiroz W, Pinochet H, Pannier F, Potin-Gautier M. 2007. Speciation analysis of antimony in marine biota
by HPLC-(UV)-HG-AFS: Extraction procedures and stability of antimony species. Talanta. 73, 458.
De Stefano L. 2004. Freshwater and Tourism in the Mediterranean. WWF Mediterranean Programme
Del Razo LM, Quintanilla Vega B, Brambila Colombres E, Calderon Aranda ES, Manno M, Albores A. 2001. Stress
proteins induced by arsenic. Toxicol. Appl. Pharmacol. 177, 132–148.
Deutsche Forschungsgemeinschaft (DFG), Analysis of Hazardous Substances in Biological Materials, Wiley-VCH,
Weinheim, Germany, 1994.
Diviš P, Doc ̌ekalová H, Brulík L, Pavliš M, Hekera P. 2007. Use of the diffusive gradients in thin films technique to
evaluate (bio) available trace metal concentrations in river water. Anal. Bioanal. Chem. 387, 2239-2244.
Dodd M, Grundy SL, Reimer KJ, Cullen WR. 1992. Methylated antimony(V) compounds: Synthesis, hydride
generation properties and implications for aquatic speciation. Appl. Organomet. Chem. 6, 207.
Dodd MC, Vu ND, Ammann A, Le VC, Kissner R, Pham HV, et al. 2006. Kinetics and mechanistic aspects of As(III)
oxidation by aqueous chlorine, chloroamines, and ozone: relevance to drinking water treatment. Environ Sci
Technol. 40: 3285–92.
Downing TE, Butterfield RE, Edmonds B et al. 2003. Climate Change and the Demand for Water, Research Report,
Stockholm Environment Institute Oxford Office, Oxford.
Duh B. 2002. Effect of antimony catalyst on solid-state polycondensation of poly(ethyleneterephthalate). Polymer. 43:
3147–54.
Durrant SF and NI Ward. 2005. Recent biological and environmental applications of laser ablation inductively coupled
plasma mass spectrometry (LA-ICP-MS). J. Anal. At. Spectrom. 20, 821.
Dworak T, Berglund M, Laaser C. et al. 2007. EU Water Saving Potential. Retrieved January 2009, from
http://ec.europa.eu/environment/water/quantity/pdf/water_saving_1.pdf
EEA – ETC/WTR based on data from Eurostat data table: Annual water abstraction by source and by sector. 2010
EFSA Panel on Contaminants in the Food Chain (CONTAM). Scientific Opinion on Arsenic in Food. EFSA Journal
2009. 7(10):1351..
Eguchi N, Kuroda K and G Endo. 1997. Metabolites of arsenic induced tetraploids and mitotic arrest in cultured cells.
Arch. Environ. Contam. Toxicol. 32. 141–145.
Emett MT, Khoe GH. 2001. Photochemical oxidation of arsenic by oxygen and iron in acidic solutions. Water Res. 35:
649–56.
Er-kang W. 1982. Polarographic electrode process of antimony(III) complexes with complexones. Coll. Czech. Chem.
Commun. 47, 3243–3251.
EU. Directive 2000/60/EC of the European parliament and of the council of 23 October 2000 establishing a framework
for Community action in the field of water policy. Off. J. Eur. Comm. L327, 1–73. 2000.
EU. Directive 2006/118 of the European Parliament and of the Council of 12 December 2006 on the protection of
groundwater against pollution and deterioration. Off. J. Eur. Comm. L372, 1–19. 2006
Fasset JD and Paulsen PJ. 1989. Isotope dilution mass spectrometry for accurate elemental analysis. Anal. Chem. 61,
623A – 644A.
Fernandez B, Claverie F, Pecheyran C, and OFX Donard. 2007. Direct analysis of solid samples by fs-LA-ICP-MS.
Trends Anal. Chem. 26, 951.
Ferreira D, Tousset N, Ridame C, Tusseau-Vuillemin MH. 2008. More than inorganic copper is bioavailable to aquatic
mosses at environmentally relevant concentrations. Environ. Toxicol. Chem. 27, 2108-2116.
29
Foster SSD & Chilton PJ. 2003. Groundwater: the processes and global significance of aquifer degradation. Phil. Trans.
R. Soc. Lond. B 358, 1957–1972.
Frank P and D Clifford. 1986. Arsenic(III) oxidation and removal from drinking water. U.S. Environmental Protection
Agency. EPA-600-52-86/021, pp. 2–86.
Gailer J and Irgolic KJ. 1996. Retention behavior of arsenobetaine, arsenocholine, trimethylarsine oxide and
tetramethylarsonium iodide on a styrene divinylbenzene column with benzenesulfonates as ion pairing
reagents. J. Chromatogr. A. 730, 219–229.
Garcia CC, Lindner H, and Niemax K. 2009. Laser ablation inductively coupled plasma mass spectrometry—current
shortcomings, practical suggestions for improving performance, and experiments to guide future development.
J. Anal. At. Spectrom. 24, 14.
Gebel T. 1997. Aresnic and antimony: comparative approach on mechanistic toxicology. Chemico-Biological
Interactions. vol. 107, no. 3, pp. 131–144.
Ghurye G, Clifford D and Tripp A. 2004. Iron coagulation and direct microfiltration to remove arsenic from
groundwater. J Am Water Works Assoc. 96: 84–9.
Giussani B, Monticelli D and Rampazzi L. 2009. Role of laser ablation–inductively coupled plasma–mass spectrometry
in cultural heritage research: A review. Anal. Chim. Acta. 635, 6.
Gray AL. 1985. Solid sample introduction by laser ablation for inductively coupled plasma source mass spectrometry.
Analyst (Cambridge, U.K.) 110, 551.
Greathouse DG and Craun GF. 1978. Cardiovascular disease study — occurrence of inorganics in household tap water
and relationships to cardiovascular mortality rates. In: Hemphill DD, editor. Trace substances in environmental
health XII — 12th annual conference on trace substances in environmental health. p. 31–9. Columbia,
Missouri, 6–8 June.
Guillong M and Gunther D. 2002. Effect of particle size distribution on ICP-induced elemental fractionation in laser
ablation-inductively coupled plasma-mass spectrometry. J. Anal. At. Spectrom. 17, 831.
Hansen HR and Pergantis SA. 2007. Identification of Sb(V) Complexes in Biological and Food Matrixes and Their
Stibine Formation Efficiency during Hydride Generation with ICPMS Detection. Anal. Chem. 79, 5304–5311.
Hansen R and Pergantis SA. 2006. Detection of antimony species in citrus juices and drinking water stored in PET
containers. J. Anal. At. Spectrom. 21, 731.
Harvey CF, Swartz CH, Badruzzaman ABM, Keon-Blute N, Yu W, Ali MA, Jay J, Beckie R, Niedan V, Brabander D,
Oates PM, Ashfaque KN, Islam S, Hemond HF and MF Ahmed. 2002. Arsenic mobility and groundwater
extraction in Bangladesh. Science. 298, 1602 – 1606.
Hasegawa H, Rahman MA, Kitahara K, Itaya Y, Maki T, Ueda K. 2010. Seasonal changes of arsenic speciation in lake
waters in relation to eutrophication. Sci. Tot. Environ. 408, 1684-1690.
Heitkemper DT, Vela NP, Stewart KR, Westphal CS. 2001. Determination of total and speciated arsenicin rice by ion
chromatography and inductively coupled plasma mass spectrometry. J Anal At Spectrom. 16: 299–306 17.
Heras IL, Palomo M and Madrid Y. 2011. Selenoproteins: the key factor in selenium essentiality. State of the art
analytical techniques for selenoproteins studies. Anal. Bioanal. Chem. 400, 1717.
Herrington P. 1996. Climate change and the demand for water. HMSO, London.
Heumann KG. 1992. Isotope Dilution mass spectrometry (IDMS) of the elements. Mass Spectrom. Rev. 11, 41 – 67.
Heumann KG. 1998. Isotope dilution mass spectrometry, in: F. Adams, R. Gijbels, R. Van Grieken (Eds.), Inorganic
Mass Spectrometry, Wiley, New York, pp.301 – 376.
30
Hola M, Konecna V, Mikuska P, Kaiser J, Palenikova K, Prusa S, Hanzlikova R, and V Kanicky. 2008. Study of
aerosols generated by 213 nm laser ablation of cobalt-cemented hard metals. J. Anal. At. Spectrom. 23, 1341.
Hossain MF. 2006. Arsenic contamination in Bangladesh - an overview. Agriculture, Ecosystems & Environmen. 113,
1-16.
Huang RN and TC Lee. 1996. Cellular uptake of trivalent arsenite and pentavalent arsenate in KB cells cultured in
phosphate-free medium. Toxicol. Appl. Pharmacol. 136, 243–249.
Hywel Evans E and Giglio JJ. 1993. Interferences in inductively coupled plasma mass spectrometry a review. J. Anal.
Atom. Spectrom. 8, 1–18.
International Agency for Research on Cancer (IARC). 1989. IARC Monograph: Some Organic Solvents, Resin
Monomers and Related Compounds, Pigments and Occupational Exposures in Paint Manufacture and Painting.
IARC, Lyon, Vol. 47, p. 291.
ISTAT, http://demo.istat.it/pop2010/index.html
Jeffries TE, Jackson SE, and HP Longerich. 1998. Application of a frequency quintupled Nd:YAG source (λ=213 nm)
for laser ablation inductively coupled plasma mass spectrometric analysis of minerals. J. Anal. At. Spectrom.
13, 935.
Jimenez MS, Rodriguez L, Gomez MT and JR Castillo. 2010. Metal–protein binding losses in proteomic studies by
PAGE–LA-ICP-MS. Talanta. 81, 241.
Johnston R and Heijnen H. 2001. Safe water technology for arsenic removal. In: Ahmed MF, Ali MA, Adeel Z, editors.
Technologies for arsenic removal from drinking water. p. 1–22.
Kang D, Amarasiriwardena D and AH Goodman. 2004. Application of laser ablation-inductively coupled plasma-mass
spectrometry (LA-ICP-MS) to investigate trace metal spatial distributions in human tooth enamel and dentine
growth layers and pulp. Anal. Bioanal. Chem. 378, 1608.
Katsoyiannis IA, Hug SJ, Ammann A et al. 2007. Arsenic speciation and uranium concentrations in drinking water
supply wells in Northern Greece: Correlations with redox indicative parameters and implications for
groundwater treatment. Science of the Total Environment. 383: 128–140.
Kenneth DF. 1997. Water Resources and Climate Change. Resources for the future Climate. Issues Brief No. 3.
Keresztes S, Tatar E, Mihucz VG, Virag I, Majdik C, Zaray G. 2009. Leaching of antimony from polyethylene
terephthalate (PET) bottles into mineral water. Sci. Total Environ. 407, 4731-4735.
Kim M, Nriagu J and Haack S. 2000. Carbonate ions and As dissolution by groundwater. Environ. Sci. Technol. 34,
3094– 3100.
Kohlmeyer U, Kuballa J, Jantzen E. 2002. Silmultaneous separation of 17 inorganic and organic arsenic compounds in
marine biota by means of high performance liquid chromatography inductively cou- pled plasma mass
spectrometry. Rapid Comm. Mass Spectrom. 16, 965–974.
Kolpakova NN. 1982. Laboratory and field studies of ionic equilibria in the Sb2S3–H2O–H2S system. Geochem. Int. 19,
46–54.
Kosler J, Wiedenbeck M, Wirth R, Hovorka J, Sylvester P, and J Mikova. 2005. Chemical and phase composition of
particles produced by laser ablation of silicate glass and zircon—implications for elemental fractionation
during ICP-MS analysis. J. Anal. At. Spectrom. 20, 402.
Krachler M and H Emons. 2000. Potential of high performance liquid chromatography coupled to flow injection
hydride generation atomic absorption spectrometry for the speciation of inorganic and organic antimony
compounds. J. Anal. At. Spectrom. 15, 281.
31
Krachler M and H Emons. 2001. Speciation analysis of antimony by high-performance liquid chromatography
inductively coupled plasma mass spectrometry using ultrasonic nebulization. Anal. Chim. Acta. 429, 125.
Krachler M, Emons H and J Zheng. 2001. Speciation of antimony for the 21st century: promises and pitfalls. TrAC,
Trends Anal. Chem. 20, 79–90.
Krupp RE. 1988. Solubility of stibnite in hydrogen sulfide solu- tions, speciation, and equilibrium constants, from 25 to
350°C. Geochim. Cosmochim. Acta. 52, 3005–3015.
Kumtabtim U, Siripinyanond A, Auray-Blais C, Ntwari A and JS Becker. 2011. Analysis of trace metals in single
droplet of urine by laser ablation inductively coupled plasma mass spectrometry. Int. J. Mass Spectrom.
Lafferty BJ and RH Loeppert. 2005. Methyl arsenic adsorption and desorption behavior on iron oxides. Environ. Sci.
Technol. 39, 2120-2127.
Larner BL, Seen AJ, Snape I. 2006. Evaluation of diffusive gradients in thin film (DGT) samplers for measuring
contaminants in the Antarctic marine environment. Chemosphere. 65, 811-820.
Le XC and M Ma. 1997. Speciation of arsenic compounds by using ion pair chromatography with atomic spectrometry
and mass spectrometry detection. J. Chromatogr. A. 764, 55–64.
Lead JR, Davison W, Hamilton-Taylor J. 1997. Characterizing Colloidal Material in Natural Waters. Aquat. Geochem.
3, 213–232.
Lee Y, Um IK, Yoon J. 2003. Arsenic(III) oxidation by iron(VI) (ferrate) and subsequent removal of arsenic(V) by
iron(III) coagulation. Environ Sci Technol. 37:5750–6.
Li W, Zhao H, Teasdale PR, John R and Wang F. 2005. Metal speciation measurement by diffusive gradients in thin
films technique with different binding phases. Anal. Chim. Acta. 533: 193–202.
Lin TF, Wu JK. 2001. Adsorption of arsenite and arsenate within activated alumina grains: equilibrium and kinetics.
Water Res. 35(8): 2049–57.
Lintschinger J, Koch I, Serves S, Feldmann J and WR Cullen. 1997. Determination of antimony species with high-
performance liquid chromatography using element specific detection. J. Anal. Chem. 359, 484–491.
Liu Y, Hu Z, Gao S, Gunther D, Xu J, Gao C and H Chen. 2008. In situ analysis of major and trace elements of
anhydrous minerals by LA-ICP-MS without applying an internal standard. Chem. Geol. 257, 34.
Luo J, Zhang H, Santner J, Davison W. 2010. Performance characteristics of diffusive gradients in thin films equipped
with a binding gel layer containing precipitated ferrihydrite for measuring arsenic(V), selenium(VI),
vanadium(V), and antimony(V). Anal. Chem. 82, 8903-8909.
Mass MJ, Tennant A, Roop BC, Cullen WR, Styblo M, Thomas DJ, Kligerman, A.D., 2001. Methylated trivalent
arsenic species are genotoxic. Chem. Res. Toxicol. 14, 355–361.
Meharg AA, Sun G, Williams PN, Adomako E, Deacon C, Zhu YG, Feldmann J, Raab A. 2008. Inorganic arsenic
levels in baby rice are of concern. Environ Pollut. 152: 746–749.
Meharg AA, Williams PN, Adomako E, Lawgali YY, Deacon C, Villada A, Cambell RCJ, Sun G, Zhu YG, Feldmann
J, Raab A, Zhao F, Islam R, Hossain S, Yanai J. 2009. Geographical Variation in Total and Inorganic Arsenic
Content of Polished (White) Rice. Environ Sci Technol. 43:1612–1617.
Miravet R, Hernandez-Nataren E, Sahuquillo A, Rubioand R and JF Lopez-Sanchez. 2010. Speciation of antimony in
environmental matrices by coupled techniques. TrAC, Trends Anal. Chem. 29, 28–39.
Mitch WA, Sedlak DL. 2002. Formation of N-nitrosodimethylamine (NDMA) from dimethylamine during chlorination.
Environ Sci Technol. 36:588–95.
32
Nash MJ, Maskall JE and SJ Hill. 2006. Developments with anion exchange stationary phases for HPLC-ICP-MS
analysis of antimony species. Analyst (Cambridge, UK). 131, 724.
Nehring F, Jacob DE, Barth MG and SF Foley. 2008. Laser-ablation ICP-MS analysis of siliceous rock glasses fused on
an iridium strip heater using MgO dilution. Microchim. Acta. 160, 153.
Nesnow S, Roop BC, Lambert G, Kadiiska M, Mason RP, Cullen WR and MJ Mass. 2002. DNA damage induced by
methylated trivalent arsenicals is mediated by reactive oxygen species. Chem. Res. Toxicol. 15, 1627–1634.
Nordberg GF, Flower BA, Nordberg M, and Friberg L. 2007. Handbook of the Toxicology of Metals, Academic Press,
London, UK, 3rd edition.
Norton GJ, Duan G, Dasgupta T, Islam MR, Lei M, Zhu Y, Deacon CM, Moran AC, Islam S, Zhao F, Stroud JL,
Mcgrath SP, Feldmann J, Price AH, Meharg AA. 2009. Environmental and Genetic Control of Arsenic
Accumulation and Speciation in Rice Grain: Comparing a Range of Common Cultivars Grown in
Contaminated Sites Across Bangladesh, China, and India. Environ Sci Technol. 43:8381–8386.
Norton GJ, Islam MR, Deacon CM, Zhao F, Stroud JL, Mcgrath SP, Islam S, Jahiruddin M, Feldmann J, Price AH,
Meharg AA. 2009. Identification of Low Inorganic and Total Grain Arsenic Rice Cultivars from Bangladesh.
Environ Sci Technol. 43:6070–6075.
Orero Iserte L, Roig-Navarro AF, Hernández F. 2004. Simultaneous determination of arsenic and selenium species in
phosphoric acid extracts of sediment samples by HPLC-ICP-MS. Anal. Chim. Acta. 527, 97-104.
Özer UY, Bogucki RF. 1971. Equilibrium studies of antimony(III) chelates in aqueous solution. J. Inorg. Nucl. Chem.
33, 4143 – 4153.
Panther JG, Stillwell KP, Powell KJ, Downard AJ. 2008. Development and application of the diffusive gradients in thin
films technique for the measurement of total dissolved inorganic arsenic in waters. Anal. Chim. Acta. 622, 133-
142.
Pauling L. 1933. The formulas of antimonic acid and the antimonates. J. Am. Chem. Soc. 55, 1895–1900.
Pearson RG. 1963. Hard and soft acids and bases. J. Am. Chem. Soc. 85, 3533–3539.
Petrick JS, Jagadish B, Mash EA and HV Aposhian. 2001. Monomethylarsonous acid (MMA(III)) and arsenite: LD(50)
in hamsters and in vitro inhibition of pyruvate dehydrogenase. Chem. Res. Toxicol. 14, 651 – 656.
Pettine M, Campanella L, Millero FJ. 1999. Arsenite oxidation by H2O2 in aqueous solutions. Geochim Cosmochim
Acta. 63:2727–35.
Pisonero J, Fernandez B, and D Gunther. 2009. Critical revision of GD-MS, LA-ICP-MS and SIMS as inorganic mass
spectrometric techniques for direct solid analysis. J. Anal. At. Spectrom. 24, 1145.
Potin-Gautier M, Pannier F, Quiroz W, Pinochet H and I De Gregori. 2005. Antimony speciation analysis in sediment
reference materials using high-performance liquid chromatography coupled to hydride generation atomic
fluorescence spectrometry. Anal. Chim. Acta. 553, 214.
Provincia di Parma (Servizio Amb., Difesa del Suolo e Tutela del territorio), Piano Territoriale di Coordinamento
Provinciale - PTCP, A. Quadro conoscitivo, A.1 Approfondimento in materia di tutela delle acque, Elaborato
1, Analisi e dettagli tecnici, 2008.
Provincia di Piacenza, Piano regionale di Tutela delle Acque nella Provincia di Piacenza, 2007.
Raab A, Williams PN, Meharg A, Feldmann J. 2007. Uptake and translocation of inorganic and methylated arsenic
species by plants. Environmental Chemistry. 4: 197–203.
Radabaugh TR and HV Aposhian. 2000. Enzymatic reduction of arsenic compounds in mammalian systems: reduction
of arsenate to arsenite by human liver arsenate reductase, Chem. Res. Toxicol. 13, 26–30.
33
Rahman MA, Hasegawa H, Rahman MM, Rahman MA, Miah MAM. 2007. Arsenic accumulation in duckweed
(Spirodela polyrhiza L.): A good option for phytoremediation. Chemosphere. 69:942–948.
Regione Emilia Romagna, Piano di Tutela delle acque della Regione Emilia Romagna, 2005.
Regione Emilia Romagna. 2005. Piano di Tutela delle Acque. pp 371
Reimann C, Birke M, Filzmoser P. 2010. Bottled drinking water: water contamination from bottle materials (glass, hard
PET, soft PET), the influence of colour and acidification. Appl Geochem. 25(7): 1030–1046.
Ren XL, Liu QL, Wu DX, Shu Q. 2006.Variations in Concentration and Distribution of Health-Related Elements
Affected by Environmental and Genotypic Differences in Rice Grains. Rice Sci. 13:170–178
Ritchie JA. 1961. Arsenic and antimony in some New Zealand thermal waters. N. Z. J. Sci. 4, 218–229.
Rodríguez-González P, Marchante Gayón JM, García Alonso JI and A Sanz-Medel. 2005. Isotope dilution analysis for
elemental speciation: A tutorial review. Spectrochim. Acta. B 60, 151.
Ronkart SN, Laurent V, Carbonnelle P, Mabon N, Copin A. 2007. Speciation of five arsenic species (arsenite, arsenate,
MMAA(V), DMAA(V) and AsBet) in different kind of water by HPLC-ICP-MS. J. P. Chemosphere. 66 (4),
738-745.
Rottmann L and KG Heumann. 1994. Development of an on-line isotope dilution technique with HPLC/ICP-MS for the
accurate determina- tion of elemental species. J. Anal. Chem. 350, 221 – 227.
Røyset O, Rosseland BO, Kristensen T, Kroglund F, Garmo ØA, Steinnes E. 2005. Diffusive gradients in thin films
sampler predicts stress in brown trout (Salmo trutta L.) exposed to aluminum in acid fresh waters. Environ. Sci.
Technol. 2005, 39, 1167- 1174.
Sakurai T, Qu W, Sakurai MH and MP Waalkes. 2002. A major human arsenic metabolite, dimethylarsinic acid,
requires reduced glutathione to induce apoptosis. Chem. Res. Toxicol. 15, 629–637.
Sanz-Medel A. 1998. Trace element analytical speciation in biological systems: importance, challenges and trends.
Spectrochim. Acta. Part B 53, 197 – 211.
Satiroglu N, Bektas S, Genc O, Hazer H. 2000. HPLC/Hydride Generation AAS Coupling for the Speciation of Sb(III)
and Sb(V) in Wastewaters. Turk. J. Chem. 24, 371.
Sayago A, Beltrán R, Gómez-Ariza JL. 2000. Hydride generation atomic fluorescence spectrometry (HG-AFS) as a
sensitive detector for Sb(III) and Sb(V) speciation in water. J. Anal. At. Spectrom. 15, 423.
Sayago A, Beltrán R, Recamales MAF, Gómez-Ariza JL. 2002. Optimization of an HPLC-HG-AFS method for
screening Sb(V), Sb(III), and Me3SbBr2 in water samples. J. Anal. At. Spectrom. 17, 1400.
Scally S, Davison W, Zhang H. 2003. In situ measurements of dissociation kinetics and labilities of metal complexes in
solution using DGT. Environ. Sci. Technol. 37, 1379-1384.
Schoof RA, Yost LJ, Eickhoff J, Crecelius EA, Cragin DW, Meacher DM, Menzel DB. 1999.A Market Basket Survey
of Inorganic Arsenic in Food. Food Chem Toxicol. 37:839–846.
Schuliga M, Chouchane S, Snow ET. 2002. Upregulation of glutathione-related genes and enzyme activities in cultured
human cells by sublethal concentration of inorganic arsenic. Toxicol Sci. 70: 183–92.
Schwarz A and Heumann KG. 2002. Two-dimensional on-line detection of brominated and iodinated volatile organic
compounds by ECD and ICP-MS after GC separation. Anal. Bioanal. Chem. 374, 212 – 219.
Sharma VK, Burnett CR, Yngard R, Cabelli DE. 2005. Iron(VI) and iron(V) oxidation of copper (I)cyanide. Environ Sci
Technol. 39: 3849–55.
Sharma VK, Dutta PK, Ray AK. 2007. Review of kinetics of chemical and photocatalytical oxidation of arsenic(III) as
influenced by pH. J Environ Sci Health. Part A. 42: 997–1004.
34
Sharma VK, Kazama F, Jiangyong H, Ray AK. 2005. Ferrates as environmentally-friendly oxidants and disinfectants. J
Water Health. 3: 42–58.
Sharma VK. 2002. Potassium ferrate(VI): an environmentally friendly oxidant. Adv Environ Res. 6:143–56.
Sharma VK. 2004. Use of iron(VI) and iron(V) in water and wastewater treatment. Water Sci Technol. 49:69–74.
Sherman DM, Ragnarsdottir KV, Oelkers EH. 2000. Antimony transport in hydrothermal solutions: and EXAFS study
of antimony(V) complexation in alkaline sulfide and sulfide– chloride brines at temperatures from 25 °C to
300 °C at Psat. Chem. Geol. 167, 161–167.
Shraim A, Sekaran NC, Anuradha CD and S Hirano. 2002. Speciation of arsenic in tube-well water samples collected
from West Bengal, India, by high-performance liquid chromatography-inductively coupled plasma mass
spectrometry. Appl. Organomet. Chem. 16, 202–209.
Smichowski P, Madrid Y, Calle-Guntiñas MB, Cámara C. 1995 Separation and determination of antimony(III) and
antimony(V) species by high-performance liquid chromatography with hydride generation atomic absorption
spectrometric and inductively coupled plasma mass spectrometric detection. J. Anal. At. Spectrom. 10, 815.
Smichowski P. 2008. Antimony in the environment as a global pollutant: a review on analytical methodologies for its
determination in atmospheric aerosols. Talanta. vol. 75, no. 1, pp. 2–14.
Sogn TA, Eich-Greatorex S, Røyset O, Øgaard AF, Almås ÅR. 2008. Use of diffusive gradients in thin films to predict
potentially bioavailable selenium in soil. Comm. Soil Sci. Plant Anal.39, 587-602.
Stauffer RE, Thompson JM. 1984. Arsenic and antimony in geothermal waters of Yellowstone National Park,
Wyoming, USA. Geochim. Cosmochim. Acta. 48, 2547–2561.
Stockdale A, Davison W, Zhang H. 2008. High-resolution two-dimensional quantitative analysis of phosphorus,
vanadium and arsenic, and qualitative analysis of sulfide, in a freshwater sediment. Environ. Chem. 5, 143-149.
Stockdale A, Davison W, Zhang H. 2010. 2D simultaneous measurement of the oxyanions of P, V, As, Mo, Sb, W and
U. J. Environ. Monit. 12, 981.
Sun GX, Williams PN, Carey AM, Zhu YG, Deacon C, Raab A, Feldmann J, Islam RM, Meharg AA. 2008. Inorganic
Arsenic in Rice Bran and Its Products Are an Order of Magnitude Higher than in Bulk Grain. Environ Sci
Technol. 42:7542–7546.
Teräsahde P, Pantsar-Kallio M, Manninen PKG. 1996. Silmutaneous determination of arsenic species by ion
chromatography inductively coupled plasma mass spectrometry. J. Chromatogr. A. 750, 83–88.
Thomas P. 2009. Metals pollution tracing in the sewerage network using the diffusive gradients in thin films technique.
Water Sci. Technol. 60, 65-70.
Tusseau-Vuillemin M-H, Gilbin R, Bakkaus E, Garric J. 2004. Performance of diffusion gradient in thin films to
evaluate the toxic fraction of copper to Daphnia magna. Environ. Toxicol. Chem. 23, 2154-2161.
Ulrich N. 1998. Anal. Chim. Acta. 359, 245.
US Environmental Protection Agency, Integrated Pisk Information System (IRS) on Antymony, National Centem for
Environmental Assessement, Office of Research and Developments, Washington, DC, 1999.
Vasudevan S, Mohan S, Sozhan G, Raghavendran NS, Murugan CV. 2006. Studies of oxidation of As(III) to As(V) by
in-situ-generated hypochlorite. Ind Eng Chem Res. 45: 7729–32.
Vörösmarty CJ et al. 1997. The Storage and Aging of Continental Runoff in Large Reservoir Systems of the World.
Ambio. Vol.26 n°4, pp. 210 – 219.
Waentig LN, Jakubowski and PH Roos. 2011. Multi-parametric analysis of cytochrome P450 expression in rat liver
microsomes by LA-ICP-MS. J. Anal. At. Spectrom. 26, 310.
35
Wang TS, Shu YF, Liu YC, Jan KY, Huang H. 1997. Glutathione peroxidase and catalase modulate the genotoxicity of
arsenic. Toxicology. 121:229–37.
Warnken KW, Davison W, Zhang H. 2008. Interpretation of in situ speciation measurements of inorganic and
organically complexed trace metals in freshwater by DGT. Environ. Sci. Technol. 42, 6903-6909.
Weissberg BG, Browne PRL, Seward TM. 1979. Ore metals in active geothermal systems. In: Barnes, H.L. (Ed.),
Geochemistry of Hydrothermal Ore Deposits. Wiley, New York, pp. 738 – 780.
Williams PN, Islam MR, Adomako EE, Raab A, Hossain SA, Zhu YG, Feldmann J, Meharg AA. 2006. Increase in Rice
Grain Arsenic for Regions of Bangladesh Irrigating Paddies with Elevated Arsenic in Groundwaters. Environ
Sci Technol. 40:4903–4908.
Williams PN, Price AH, Raab A, Hossain SA, Feldmann J, Meharg AA. 2005. Variation in Arsenic Speciation and
Concentration in Paddy Rice Related to Dietary Exposure. Environ Sci Technol. 39:5531–5540.
Williams PN, Raab A, Feldmann J, Meharg AA. 2007. Market basket survey shows elevated levels of As in South
Central US processed rice compared to California: consequences for human dietary exposure. Environmental
Science Technology. 41: 2178–2183.
World Business Council for Sustainable Development. 2005. Facts and Trends. Water. Version 2.
World Health Organization, Antimony in Drinking-Water, WHO/ SDE/WSH/03.04/74, Geneva, 2003.
Yngard RA, Sharma VK, Philips J, Zboril R. 2008. Ferrate(VI) oxidation of weak acid dissociable cyanides. Environ
Sci Technol. 42:3005–10.
Zangi R and M Filella. 2012. Transport routes of metalloids into and out of the cell: A review of the current knowledge.
Chemico-Biological Interactions. 197, 47–57
Zavala YJ, Gerads R, Gürleyük H, Duxbury JM. 2008. Arsenic in Rice: II. Arsenic Speciation in USA Grain and
Implications for Human Health. Environ Sci Technol. 42:3861–3866
Zhang H and W. Davison. 1995. Performance Characteristics of Diffusion Gradients in Thin Films for the in Situ
Measurement of Trace Metals in Aqueous Solution. Anal. Chem. 67, 3391.
Zhang H and W. Davison. 2000. Direct In Situ Measurements of Labile Inorganic and Organically Bound Metal
Species in Synthetic Solutions and Natural Waters Using Diffusive Gradients in Thin Films. Anal. Chem. 72,
pp 4447–445.
Zhang H, Davison W, Gadi R, Kobayashi T. 1998. In situ measurement of dissolved phosphorus in natural waters using
DGT. Anal. Chim. Acta 370, 29-38.
Zhang H, Davison W, Mortimer RJG, Krom MD, Hayes PJ, Davies IM. 2002. Localised remobilization of metals in a
marine sediment. Sci. Total Environ. 296: 175–187.
Zhang X, Cornelis R and L Mees. 1998. Speciation of antimony(III) and antimony(V) species by using high-
performance liquid chromatography coupled to hydride generation atomic absorption spectrometry. J. Anal. At.
Spectrom. 13, 205.
Zheng J, Iijima A and N. Furuta. 2001. Complexation effect of antimony compounds with citric acid and its application
to the speciation of antimony(III) and antimony(V) using HPLC-ICP-MS. J. Anal. At. Spectrom. 16, 812.
Zheng J, Ohata M and N. Furuta. 2000. Antimony Speciation in Environmental Samples by Using High-Performance
Liquid Chromatography Coupled to Inductively Coupled Plasma Mass Spectrometry. Anal. Sci. 16, 75.
Zhu YG, Sun GX, Lei M, Teng M, Liu YX, Chen NC, Wang LH, Carey AM, Deacon C, Raab A, Meharg AA,
Williams PN. 2008. High Percentage Inorganic Arsenic Content of Mining Impacted and Nonimpacted
Chinese Rice. Environ Sci Technol. 42:5008–5013.

36
37
PhD thesis project

38
39
Development of the research project
The aim of this thesis was in general to explore health risks in human food chain, from water to
foodstuff. In particulary, we had investigated the distribution of Arsenic and its chemical forms in
groundwater and rice. Millions of people are threatened by exposure to inorganic As from drinking
water and another importa pathway of human As uptake is rice consumption. Moreover, the
information on the content of different speciation forms of elements is not ample. Actually
International and national laws classify the harmful elements based on the total content.
It is important to focus the attention on the importance of groundwater because it reprents the main
sorce of drinking water and the knowledge of chemical composition is necessary for risk assessment
and for appropriate choice of removal technology.
Chronic exposure to Arsenic can lead to cancerous health hazards and other public health problems.
We had taken adventages of binding capacity of fehhydrite and chromatographic separation of
HPLC to obtain a characterisation of inorganic and organic Arsenic species in groundwater. Our
results has confirmed that DGT is able to maintain the Arsenic species without risk of changes for
speciation and its application avoids an overestimation of risk for human health.
The physical and chemical qualities of Antimony (Sb) and Arsenic are similar. In the past, these
two elements and their compounds were often determined together. It should be noted that this
similarity in chemical properties has been assumed for many years without a rigorous study.
The biochemical significance and toxicological behavior of Sb coordination complexes is however
unknown, as their detection in real samples has been prevented partly due to naturally low Sb levels
and partly due to limitations of the analytical techniques applied in antimony speciation analysis. Sb
speciation in water samples is of general interest for human health assessment. The comprehension
of Sb behaviour in aqueous matrix is very important, as several studies demonstrated that bottle
materials may contaminate drinking water. Thus, it is imperative that new advanced analytical tech-
niques are developed to overcome the existing severe limitations.
In this paper, we report the first investigation of inorganic antimony behaviour, especially Sb(III),
in water samples. Speciation analysis of Sb(III) and Sb(V) in aqueous samples was performed
through DGT resin extraction and on-line isotope dilution concentration determination after a
chromatographic separation by HPLC-ICP-MS.
The risk for human health doesn’t come only from total concentration and species of elements
present not only in the water, but also from in foodstuffs, such as rice. Generally rice contains
significant amounts of inorganic As but little information about speciation of As(III) and As(V) in
rice is currently available in the literature. In our study, we investigated different types of rice grains
40
from different areas of Northern Italy. Our data showed the influences of As(III) and DMA(V) on
the As concentration in rice grain and the relevance of As(III) and As(V) speciation for assessing
As toxicity to human health.
After having determined the concentration of the As species in rice, it is fundamental to investigate
the element distribution in the different parts of rice grain obtained from different processes.
LASER (Light Amplification by Stimulated Emission of Radiation)-ICP-MS emerges as a potential
analytical tool for the estimation of As localisation in rice samples. The purpose of this study was to
evaluate As distribution within the rice grains (exterior, medium, interior part) of different varieties
(Gladio and Ronaldo) obtained from different processes (raw, brown and milled rice with or
without parboiling technique) with direct determination of LA-ICP-MS. The distribution of As
varied in the different parts of the grains. The relationship between As intensities and several parts
of grain in rice revealed that As levels decreased from the external part towards the middle position,
and then the intensity values appeared to be similar between medium and internal part in non
parboiled products. Arsenic content was higher in non-parboiled rice grain than in parboiled rice.
41
Chapter II – Water: one, none, one hundred thousand uses…
and then?
1
Acqua: uno, nessuno, centomila usi…e poi?
Centro di Ricerca Opera;Università Cattolica del Sacro Cuore,Piacenza
Indirizzo per la corrispondenza:Maria Chiara Fontanella, PhD StudentIstituto di Chimica Agraria e AmbientaleUniversità Cattolica del Sacro Cuorevia Emilia Parmense, 8429122 Piacenza - ItalyE-mail: [email protected]
LAVORO ORIGINALE
E. CAPRI, M.C. FONTANELLA
PROGRESS IN NUTRITION
VOL. 12, N. 4, 000-000, 2010 SummaryWater is not a commercial product like any other but, rather, a heritagewhich must be protected, defended and treated as such (Dir 2000/60/EC). Characteristics and uses of water depend on different activities,agricultural, industrial and civil, and country income. Water is an ele-ment always present in citizens life but water is also used to make everyproduct on Earth, and so all business, and all sector, depend on it in so-me way, so daily custom of citizens can influence the consumption ofwater, precious water for physiological intake and domestic use but alsofor aquatic and terrestrial ecosystems. Sustainable measures must be de-veloped and existing initiative must be improved. It is useful develop aplanning of prevention and safeguard measures between citizens, watermanagement service, administration and health authorities because thetime of natural recharge of water is so long.
RiassuntoL’acqua non è un prodotto commerciale al pari di altri, bensì un patri-monio che va protetto, difeso e trattato come tale (DIR 2000/60/EC).Lo sfruttamento e le caratteristiche della risorsa acqua sono differenti aseconda del settore di utilizzo, agricolo, industriale e domestico, e dellosviluppo economico del paese. L’acqua è un elemento presente tal qualenella vita quotidiana dei cittadini, ma è anche un elemento essenziale perla realizzazione di tutti i prodotti, che quotidianamente vengono man-giati, indossati e utilizzati; in questo modo le abitudini quotidiane deicittadini possono influenzare fortemente il consumo di risorse idrichepreziose non solo per gli esseri umani e per le loro attività domestiche edeconomiche ma per mantenere in funzione gli ecosistemi acquatici e ter-restri ad esse associati. È quindi necessario elaborare misure di sostenibi-lità e migliorare quelle esistenti per tutelare l’acqua nella sua totalità tra-mite una programmazione condivisa e partecipata delle misure di pre-venzione e salvaguardia tra i cittadini, i gestori del servizio idrico, le au-torità amministrative, le autorità sanitarie, visti i tempi necessari per laformazione e il ricambio naturale delle acque.
TITLE
Water: one, none, onehundred thousand uses…and then?
KEY WORDS
Groundwater, surface water,quantity and chemical status,virtual water, sustainability
PAROLE CHIAVE
Quantità e qualità dell’acqua,acqua di superficie, acqua di falda,acqua virtuale, sostenibilità
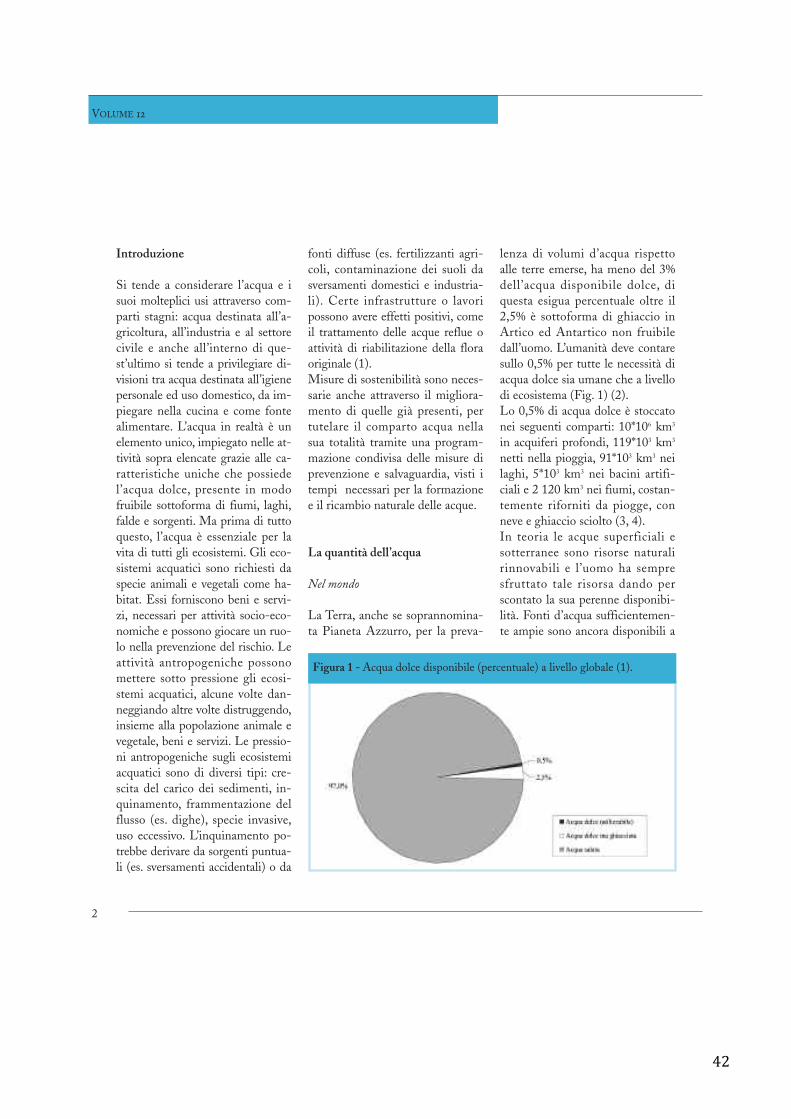
42
2
VOLUME 12
Introduzione
Si tende a considerare l’acqua e isuoi molteplici usi attraverso com-parti stagni: acqua destinata all’a-gricoltura, all’industria e al settorecivile e anche all’interno di que-st’ultimo si tende a privilegiare di-visioni tra acqua destinata all’igienepersonale ed uso domestico, da im-piegare nella cucina e come fontealimentare. L’acqua in realtà è unelemento unico, impiegato nelle at-tività sopra elencate grazie alle ca-ratteristiche uniche che possiedel’acqua dolce, presente in modofruibile sottoforma di fiumi, laghi,falde e sorgenti. Ma prima di tuttoquesto, l’acqua è essenziale per lavita di tutti gli ecosistemi. Gli eco-sistemi acquatici sono richiesti daspecie animali e vegetali come ha-bitat. Essi forniscono beni e servi-zi, necessari per attività socio-eco-nomiche e possono giocare un ruo-lo nella prevenzione del rischio. Leattività antropogeniche possonomettere sotto pressione gli ecosi-stemi acquatici, alcune volte dan-neggiando altre volte distruggendo,insieme alla popolazione animale evegetale, beni e servizi. Le pressio-ni antropogeniche sugli ecosistemiacquatici sono di diversi tipi: cre-scita del carico dei sedimenti, in-quinamento, frammentazione delflusso (es. dighe), specie invasive,uso eccessivo. L’inquinamento po-trebbe derivare da sorgenti puntua-li (es. sversamenti accidentali) o da
fonti diffuse (es. fertilizzanti agri-coli, contaminazione dei suoli dasversamenti domestici e industria-li). Certe infrastrutture o lavoripossono avere effetti positivi, comeil trattamento delle acque reflue oattività di riabilitazione della floraoriginale (1).Misure di sostenibilità sono neces-sarie anche attraverso il migliora-mento di quelle già presenti, pertutelare il comparto acqua nellasua totalità tramite una program-mazione condivisa delle misure diprevenzione e salvaguardia, visti itempi necessari per la formazionee il ricambio naturale delle acque.
La quantità dell’acqua
Nel mondo
La Terra, anche se soprannomina-ta Pianeta Azzurro, per la preva-
lenza di volumi d’acqua rispettoalle terre emerse, ha meno del 3%dell’acqua disponibile dolce, diquesta esigua percentuale oltre il2,5% è sottoforma di ghiaccio inArtico ed Antartico non fruibiledall’uomo. L’umanità deve contaresullo 0,5% per tutte le necessità diacqua dolce sia umane che a livellodi ecosistema (Fig. 1) (2).Lo 0,5% di acqua dolce è stoccatonei seguenti comparti: 10*106 km3
in acquiferi profondi, 119*103 km3
netti nella pioggia, 91*103 km3 neilaghi, 5*103 km3 nei bacini artifi-ciali e 2 120 km3 nei fiumi, costan-temente riforniti da piogge, conneve e ghiaccio sciolto (3, 4).In teoria le acque superficiali esotterranee sono risorse naturalirinnovabili e l’uomo ha sempresfruttato tale risorsa dando perscontato la sua perenne disponibi-lità. Fonti d’acqua sufficientemen-te ampie sono ancora disponibili a
Figura 1 - Acqua dolce disponibile (percentuale) a livello globale (1).
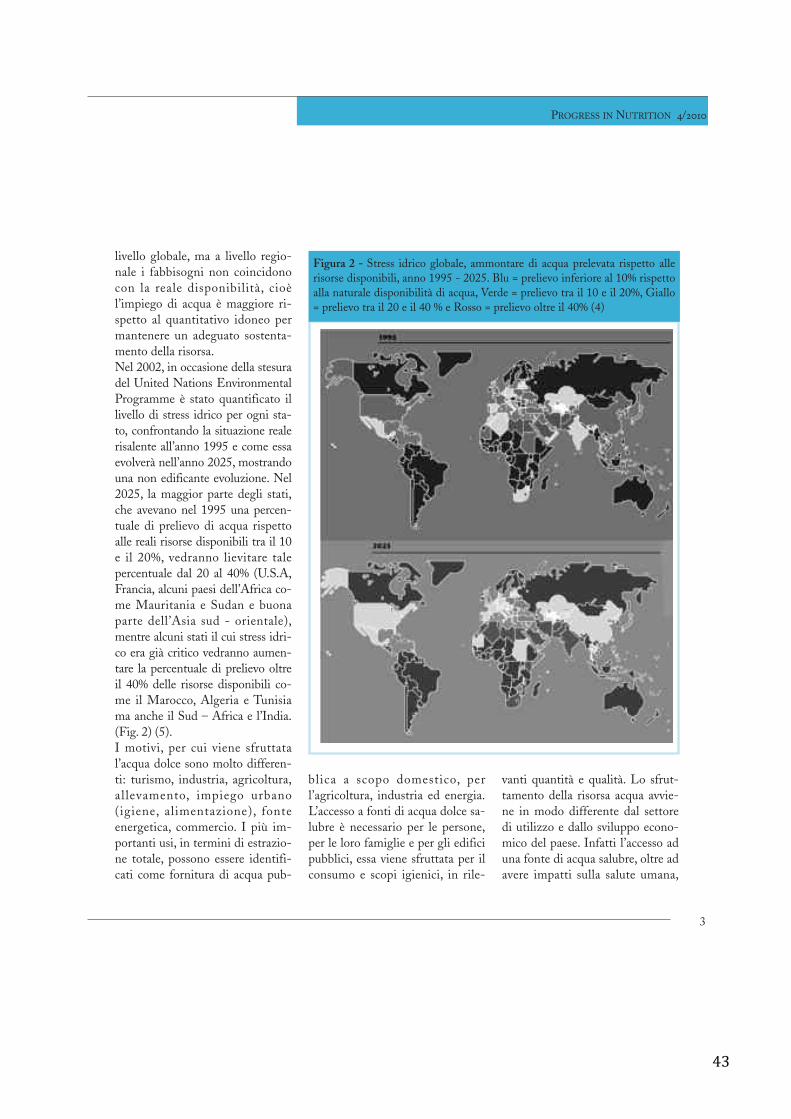
43
livello globale, ma a livello regio-nale i fabbisogni non coincidonocon la reale disponibilità, cioèl’impiego di acqua è maggiore ri-spetto al quantitativo idoneo permantenere un adeguato sostenta-mento della risorsa.Nel 2002, in occasione della stesuradel United Nations EnvironmentalProgramme è stato quantificato illivello di stress idrico per ogni sta-to, confrontando la situazione realerisalente all’anno 1995 e come essaevolverà nell’anno 2025, mostrandouna non edificante evoluzione. Nel2025, la maggior parte degli stati,che avevano nel 1995 una percen-tuale di prelievo di acqua rispettoalle reali risorse disponibili tra il 10e il 20%, vedranno lievitare talepercentuale dal 20 al 40% (U.S.A,Francia, alcuni paesi dell’Africa co-me Mauritania e Sudan e buonaparte dell’Asia sud - orientale),mentre alcuni stati il cui stress idri-co era già critico vedranno aumen-tare la percentuale di prelievo oltreil 40% delle risorse disponibili co-me il Marocco, Algeria e Tunisiama anche il Sud – Africa e l’India.(Fig. 2) (5).I motivi, per cui viene sfruttatal’acqua dolce sono molto differen-ti: turismo, industria, agricoltura,allevamento, impiego urbano(igiene, alimentazione), fonteenergetica, commercio. I più im-portanti usi, in termini di estrazio-ne totale, possono essere identifi-cati come fornitura di acqua pub-
blica a scopo domestico, perl’agricoltura, industria ed energia.L’accesso a fonti di acqua dolce sa-lubre è necessario per le persone,per le loro famiglie e per gli edificipubblici, essa viene sfruttata per ilconsumo e scopi igienici, in rile-
vanti quantità e qualità. Lo sfrut-tamento della risorsa acqua avvie-ne in modo differente dal settoredi utilizzo e dallo sviluppo econo-mico del paese. Infatti l’accesso aduna fonte di acqua salubre, oltre adavere impatti sulla salute umana,
PROGRESS IN NUTRITION 4/2010
3
Figura 2 - Stress idrico globale, ammontare di acqua prelevata rispetto allerisorse disponibili, anno 1995 - 2025. Blu = prelievo inferiore al 10% rispettoalla naturale disponibilità di acqua, Verde = prelievo tra il 10 e il 20%, Giallo= prelievo tra il 20 e il 40 % e Rosso = prelievo oltre il 40% (4)
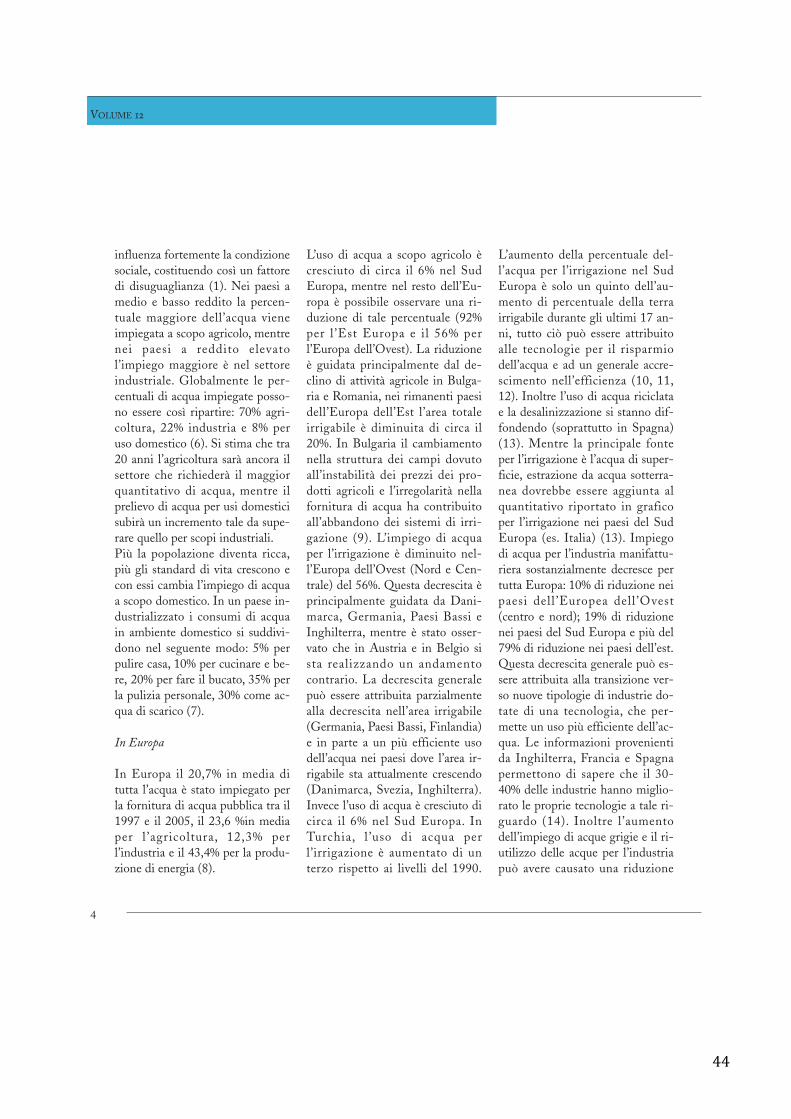
44
influenza fortemente la condizionesociale, costituendo così un fattoredi disuguaglianza (1). Nei paesi amedio e basso reddito la percen-tuale maggiore dell’acqua vieneimpiegata a scopo agricolo, mentrenei paesi a reddito elevatol’impiego maggiore è nel settoreindustriale. Globalmente le per-centuali di acqua impiegate posso-no essere così ripartire: 70% agri-coltura, 22% industria e 8% peruso domestico (6). Si stima che tra20 anni l’agricoltura sarà ancora ilsettore che richiederà il maggiorquantitativo di acqua, mentre ilprelievo di acqua per usi domesticisubirà un incremento tale da supe-rare quello per scopi industriali.Più la popolazione diventa ricca,più gli standard di vita crescono econ essi cambia l’impiego di acquaa scopo domestico. In un paese in-dustrializzato i consumi di acquain ambiente domestico si suddivi-dono nel seguente modo: 5% perpulire casa, 10% per cucinare e be-re, 20% per fare il bucato, 35% perla pulizia personale, 30% come ac-qua di scarico (7).
In Europa
In Europa il 20,7% in media ditutta l’acqua è stato impiegato perla fornitura di acqua pubblica tra il1997 e il 2005, il 23,6 %in mediaper l ’agricoltura, 12,3% perl’industria e il 43,4% per la produ-zione di energia (8).
L’uso di acqua a scopo agricolo ècresciuto di circa il 6% nel SudEuropa, mentre nel resto dell’Eu-ropa è possibile osservare una ri-duzione di tale percentuale (92%per l ’Est Europa e il 56% perl’Europa dell’Ovest). La riduzioneè guidata principalmente dal de-clino di attività agricole in Bulga-ria e Romania, nei rimanenti paesidell’Europa dell’Est l’area totaleirrigabile è diminuita di circa il20%. In Bulgaria il cambiamentonella struttura dei campi dovutoall’instabilità dei prezzi dei pro-dotti agricoli e l’irregolarità nellafornitura di acqua ha contribuitoall’abbandono dei sistemi di irri-gazione (9). L’impiego di acquaper l’irrigazione è diminuito nel-l’Europa dell’Ovest (Nord e Cen-trale) del 56%. Questa decrescita èprincipalmente guidata da Dani-marca, Germania, Paesi Bassi eInghilterra, mentre è stato osser-vato che in Austria e in Belgio sista realizzando un andamentocontrario. La decrescita generalepuò essere attribuita parzialmentealla decrescita nell’area irrigabile(Germania, Paesi Bassi, Finlandia)e in parte a un più efficiente usodell’acqua nei paesi dove l’area ir-rigabile sta attualmente crescendo(Danimarca, Svezia, Inghilterra).Invece l’uso di acqua è cresciuto dicirca il 6% nel Sud Europa. InTurchia, l ’uso di acqua perl’irrigazione è aumentato di unterzo rispetto ai livelli del 1990.
L’aumento della percentuale del-l’acqua per l’irrigazione nel SudEuropa è solo un quinto dell’au-mento di percentuale della terrairrigabile durante gli ultimi 17 an-ni, tutto ciò può essere attribuitoalle tecnologie per il risparmiodell’acqua e ad un generale accre-scimento nell’efficienza (10, 11,12). Inoltre l’uso di acqua riciclatae la desalinizzazione si stanno dif-fondendo (soprattutto in Spagna)(13). Mentre la principale fonteper l’irrigazione è l’acqua di super-ficie, estrazione da acqua sotterra-nea dovrebbe essere aggiunta alquantitativo riportato in graficoper l’irrigazione nei paesi del SudEuropa (es. Italia) (13). Impiegodi acqua per l’industria manifattu-riera sostanzialmente decresce pertutta Europa: 10% di riduzione neipaesi dell ’Europea dell ’Ovest(centro e nord); 19% di riduzionenei paesi del Sud Europa e più del79% di riduzione nei paesi dell’est.Questa decrescita generale può es-sere attribuita alla transizione ver-so nuove tipologie di industrie do-tate di una tecnologia, che per-mette un uso più efficiente dell’ac-qua. Le informazioni provenientida Inghilterra, Francia e Spagnapermettono di sapere che il 30-40% delle industrie hanno miglio-rato le proprie tecnologie a tale ri-guardo (14). Inoltre l ’aumentodell’impiego di acque grigie e il ri-utilizzo delle acque per l’industriapuò avere causato una riduzione
4
VOLUME 12
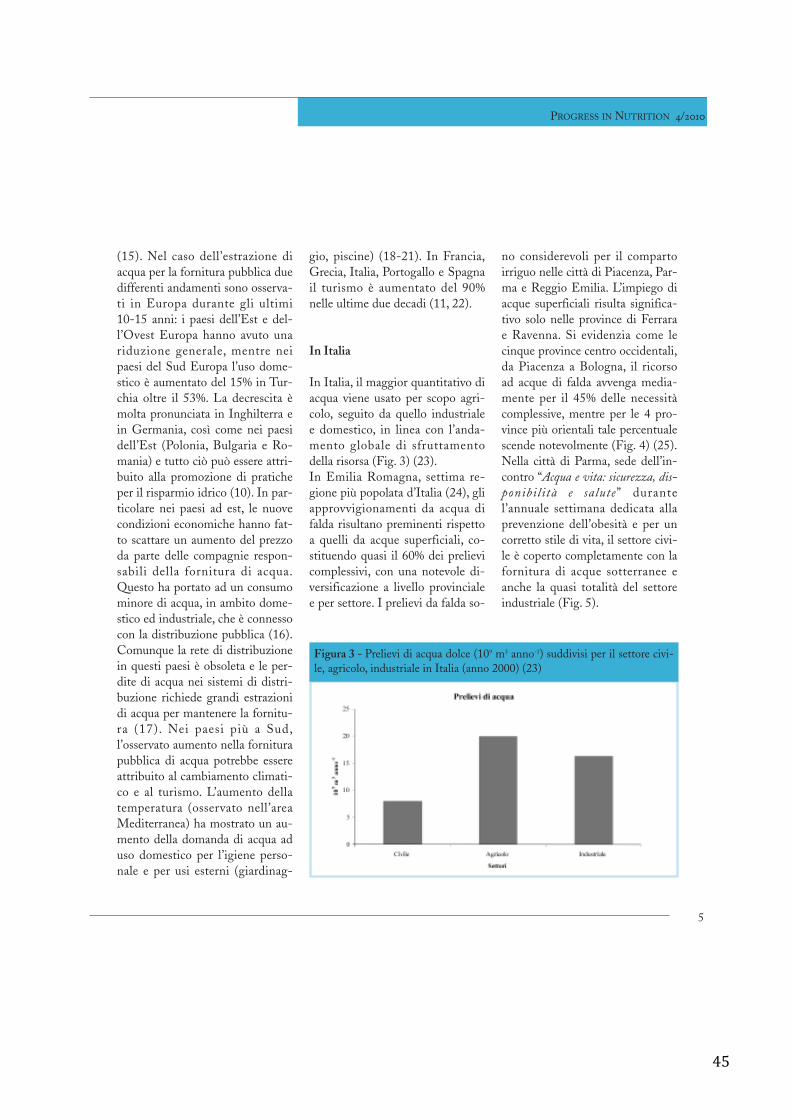
45
(15). Nel caso dell’estrazione diacqua per la fornitura pubblica duedifferenti andamenti sono osserva-ti in Europa durante gli ultimi10-15 anni: i paesi dell’Est e del-l’Ovest Europa hanno avuto unariduzione generale, mentre neipaesi del Sud Europa l’uso dome-stico è aumentato del 15% in Tur-chia oltre il 53%. La decrescita èmolta pronunciata in Inghilterra ein Germania, così come nei paesidell’Est (Polonia, Bulgaria e Ro-mania) e tutto ciò può essere attri-buito alla promozione di praticheper il risparmio idrico (10). In par-ticolare nei paesi ad est, le nuovecondizioni economiche hanno fat-to scattare un aumento del prezzoda parte delle compagnie respon-sabili della fornitura di acqua.Questo ha portato ad un consumominore di acqua, in ambito dome-stico ed industriale, che è connessocon la distribuzione pubblica (16).Comunque la rete di distribuzionein questi paesi è obsoleta e le per-dite di acqua nei sistemi di distri-buzione richiede grandi estrazionidi acqua per mantenere la fornitu-ra (17). Nei paesi più a Sud,l’osservato aumento nella forniturapubblica di acqua potrebbe essereattribuito al cambiamento climati-co e al turismo. L’aumento dellatemperatura (osservato nell’areaMediterranea) ha mostrato un au-mento della domanda di acqua aduso domestico per l’igiene perso-nale e per usi esterni (giardinag-
gio, piscine) (18-21). In Francia,Grecia, Italia, Portogallo e Spagnail turismo è aumentato del 90%nelle ultime due decadi (11, 22).
In Italia
In Italia, il maggior quantitativo diacqua viene usato per scopo agri-colo, seguito da quello industrialee domestico, in linea con l’anda-mento globale di sfruttamentodella risorsa (Fig. 3) (23).In Emilia Romagna, settima re-gione più popolata d’Italia (24), gliapprovvigionamenti da acqua difalda risultano preminenti rispettoa quelli da acque superficiali, co-stituendo quasi il 60% dei prelievicomplessivi, con una notevole di-versificazione a livello provincialee per settore. I prelievi da falda so-
no considerevoli per il compartoirriguo nelle città di Piacenza, Par-ma e Reggio Emilia. L’impiego diacque superficiali risulta significa-tivo solo nelle province di Ferrarae Ravenna. Si evidenzia come lecinque province centro occidentali,da Piacenza a Bologna, il ricorsoad acque di falda avvenga media-mente per il 45% delle necessitàcomplessive, mentre per le 4 pro-vince più orientali tale percentualescende notevolmente (Fig. 4) (25).Nella città di Parma, sede dell’in-contro “Acqua e vita: sicurezza, dis-ponibilità e salute” durantel’annuale settimana dedicata allaprevenzione dell’obesità e per uncorretto stile di vita, il settore civi-le è coperto completamente con lafornitura di acque sotterranee eanche la quasi totalità del settoreindustriale (Fig. 5).
PROGRESS IN NUTRITION 4/2010
5
Figura 3 - Prelievi di acqua dolce (109 m3 anno-1) suddivisi per il settore civi-le, agricolo, industriale in Italia (anno 2000) (23)
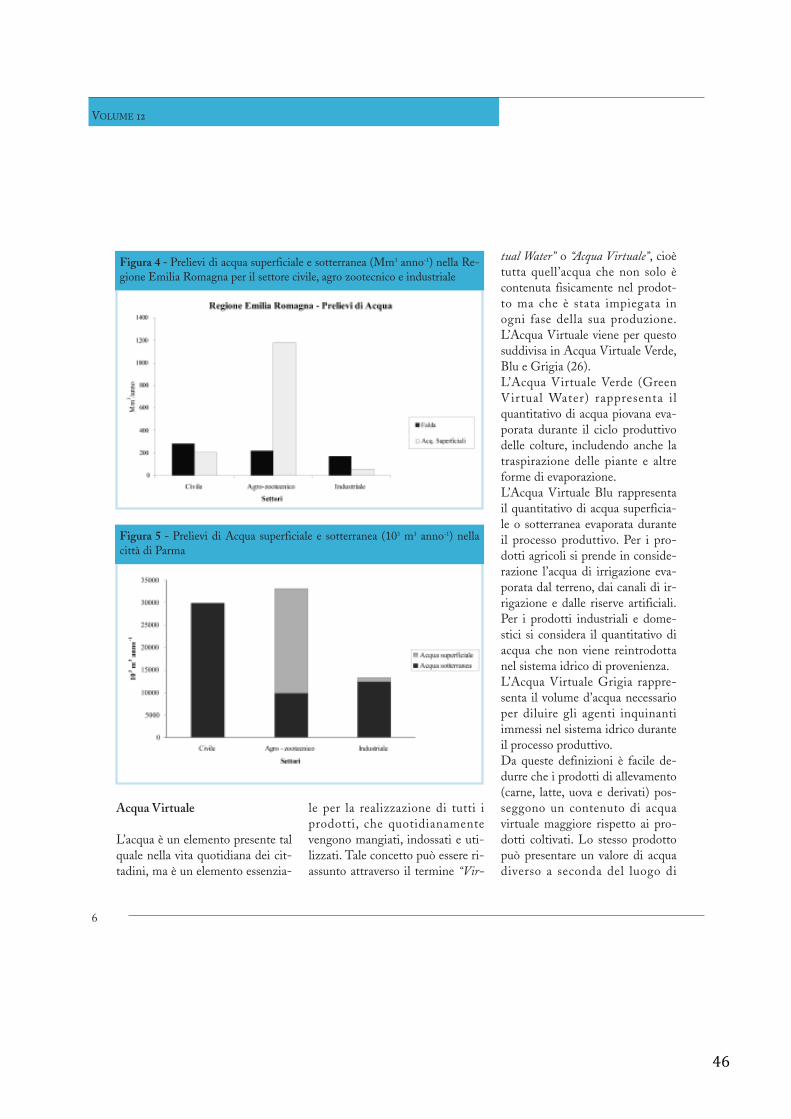
46
Acqua Virtuale
L’acqua è un elemento presente talquale nella vita quotidiana dei cit-tadini, ma è un elemento essenzia-
le per la realizzazione di tutti iprodotti, che quotidianamentevengono mangiati, indossati e uti-lizzati. Tale concetto può essere ri-assunto attraverso il termine “Vir-
tual Water” o “Acqua Virtuale”, cioètutta quell’acqua che non solo ècontenuta fisicamente nel prodot-to ma che è stata impiegata inogni fase della sua produzione.L’Acqua Virtuale viene per questosuddivisa in Acqua Virtuale Verde,Blu e Grigia (26).L’Acqua Virtuale Verde (GreenVirtual Water) rappresenta ilquantitativo di acqua piovana eva-porata durante il ciclo produttivodelle colture, includendo anche latraspirazione delle piante e altreforme di evaporazione.L’Acqua Virtuale Blu rappresentail quantitativo di acqua superficia-le o sotterranea evaporata duranteil processo produttivo. Per i pro-dotti agricoli si prende in conside-razione l’acqua di irrigazione eva-porata dal terreno, dai canali di ir-rigazione e dalle riserve artificiali.Per i prodotti industriali e dome-stici si considera il quantitativo diacqua che non viene reintrodottanel sistema idrico di provenienza.L’Acqua Virtuale Grigia rappre-senta il volume d’acqua necessarioper diluire gli agenti inquinantiimmessi nel sistema idrico duranteil processo produttivo.Da queste definizioni è facile de-durre che i prodotti di allevamento(carne, latte, uova e derivati) pos-seggono un contenuto di acquavirtuale maggiore rispetto ai pro-dotti coltivati. Lo stesso prodottopuò presentare un valore di acquadiverso a seconda del luogo di
6
VOLUME 12
Figura 4 - Prelievi di acqua superficiale e sotterranea (Mm3 anno-1) nella Re-gione Emilia Romagna per il settore civile, agro zootecnico e industriale
Figura 5 - Prelievi di Acqua superficiale e sotterranea (103 m3 anno-1) nellacittà di Parma
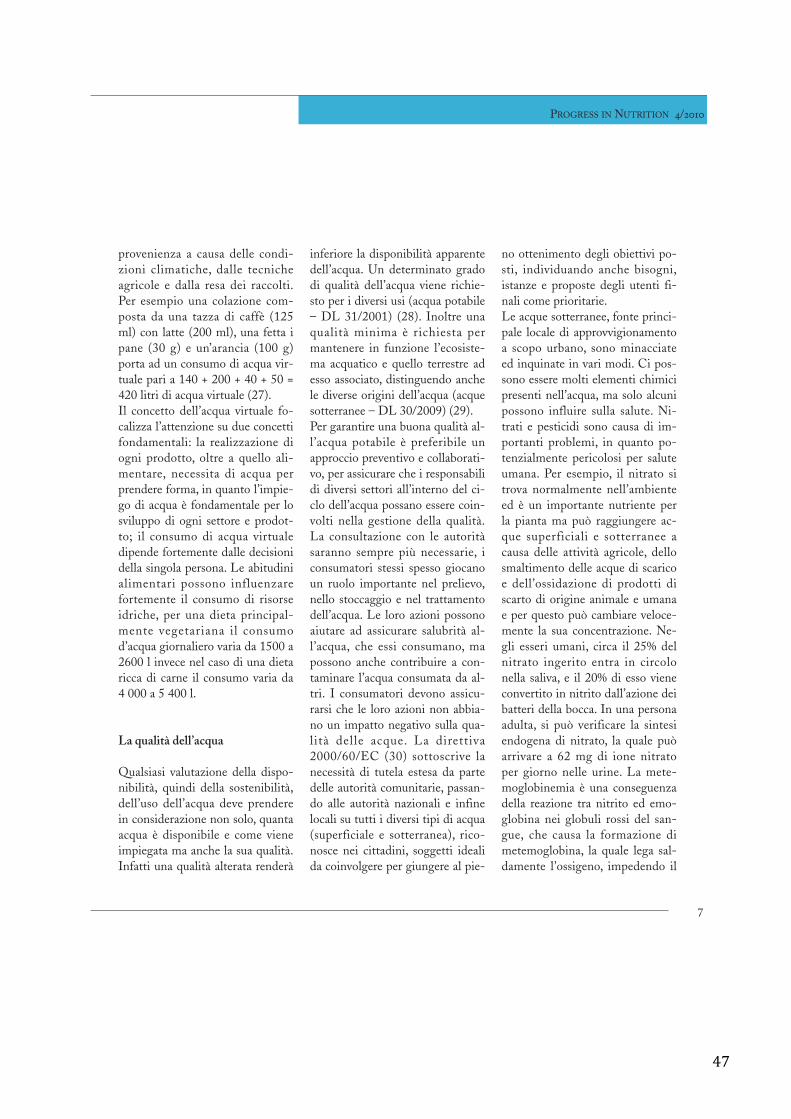
47
provenienza a causa delle condi-zioni climatiche, dalle tecnicheagricole e dalla resa dei raccolti.Per esempio una colazione com-posta da una tazza di caffè (125ml) con latte (200 ml), una fetta ipane (30 g) e un’arancia (100 g)porta ad un consumo di acqua vir-tuale pari a 140 + 200 + 40 + 50 =420 litri di acqua virtuale (27).Il concetto dell’acqua virtuale fo-calizza l’attenzione su due concettifondamentali: la realizzazione diogni prodotto, oltre a quello ali-mentare, necessita di acqua perprendere forma, in quanto l’impie-go di acqua è fondamentale per losviluppo di ogni settore e prodot-to; il consumo di acqua virtualedipende fortemente dalle decisionidella singola persona. Le abitudinialimentari possono influenzarefortemente il consumo di risorseidriche, per una dieta principal-mente vegetariana il consumod’acqua giornaliero varia da 1500 a2600 l invece nel caso di una dietaricca di carne il consumo varia da4 000 a 5 400 l.
La qualità dell’acqua
Qualsiasi valutazione della dispo-nibilità, quindi della sostenibilità,dell’uso dell’acqua deve prenderein considerazione non solo, quantaacqua è disponibile e come vieneimpiegata ma anche la sua qualità.Infatti una qualità alterata renderà
inferiore la disponibilità apparentedell’acqua. Un determinato gradodi qualità dell’acqua viene richie-sto per i diversi usi (acqua potabile– DL 31/2001) (28). Inoltre unaqualità minima è richiesta permantenere in funzione l’ecosiste-ma acquatico e quello terrestre adesso associato, distinguendo anchele diverse origini dell’acqua (acquesotterranee – DL 30/2009) (29).Per garantire una buona qualità al-l’acqua potabile è preferibile unapproccio preventivo e collaborati-vo, per assicurare che i responsabilidi diversi settori all’interno del ci-clo dell’acqua possano essere coin-volti nella gestione della qualità.La consultazione con le autoritàsaranno sempre più necessarie, iconsumatori stessi spesso giocanoun ruolo importante nel prelievo,nello stoccaggio e nel trattamentodell’acqua. Le loro azioni possonoaiutare ad assicurare salubrità al-l’acqua, che essi consumano, mapossono anche contribuire a con-taminare l’acqua consumata da al-tri. I consumatori devono assicu-rarsi che le loro azioni non abbia-no un impatto negativo sulla qua-lità delle acque. La direttiva2000/60/EC (30) sottoscrive lanecessità di tutela estesa da partedelle autorità comunitarie, passan-do alle autorità nazionali e infinelocali su tutti i diversi tipi di acqua(superficiale e sotterranea), rico-nosce nei cittadini, soggetti idealida coinvolgere per giungere al pie-
no ottenimento degli obiettivi po-sti, individuando anche bisogni,istanze e proposte degli utenti fi-nali come prioritarie.Le acque sotterranee, fonte princi-pale locale di approvvigionamentoa scopo urbano, sono minacciateed inquinate in vari modi. Ci pos-sono essere molti elementi chimicipresenti nell’acqua, ma solo alcunipossono influire sulla salute. Ni-trati e pesticidi sono causa di im-portanti problemi, in quanto po-tenzialmente pericolosi per saluteumana. Per esempio, il nitrato sitrova normalmente nell’ambienteed è un importante nutriente perla pianta ma può raggiungere ac-que superficiali e sotterranee acausa delle attività agricole, dellosmaltimento delle acque di scaricoe dell’ossidazione di prodotti discarto di origine animale e umanae per questo può cambiare veloce-mente la sua concentrazione. Ne-gli esseri umani, circa il 25% delnitrato ingerito entra in circolonella saliva, e il 20% di esso vieneconvertito in nitrito dall’azione deibatteri della bocca. In una personaadulta, si può verificare la sintesiendogena di nitrato, la quale puòarrivare a 62 mg di ione nitratoper giorno nelle urine. La mete-moglobinemia è una conseguenzadella reazione tra nitrito ed emo-globina nei globuli rossi del san-gue, che causa la formazione dimetemoglobina, la quale lega sal-damente l’ossigeno, impedendo il
PROGRESS IN NUTRITION 4/2010
7
48
rilascio e causando un blocco neltrasporto dell’ossigeno. Alti livellidi metemoglobinemia (> del 10%)possono causare la cianosi riporta-ta anche come sindrome del bam-bino blu. In studi epidemiologicisulla metemoglobinemia, il 97%dei casi si verificano a concentra-zioni maggiori di 44,3 mg/L consintomi clinici associati ad alteconcentrazioni (gli individui affet-ti avevano meno di 3 mesi di età).Il rischio della metemoglobinemiaaumenta in presenza di simultaneeinfezioni intestinali (31).Non ci sono evidenze significativetra l’assunzione di nitrato attraver-so l’acqua potabile e il rischio diformazione delle cancro nel trattogastrico. I mezzi più appropriatiper controllare la concentrazionedi nitrati, soprattutto nelle acquesotterranee, derivano dal controllodelle contaminazioni (32).Il cromo è un elemento ampia-mente distribuito nella crosta ter-restre. Il cibo sembra essere la suamaggior fonte di introduzionenell’organismo. Ma solo il cromoVI è stato classificato come ele-mento carcinogenico (31).Il fluoro è anch’esso un elementonormalmente presente nella crostaterrestre. È riconosciuto l’effettobenefico del fluoro contro le cariedentali, ma un elevata introduzionedi fluoruro può provocare effettisui tessuti scheletrici (ossa e denti).La fluorosi dello scheletro (cam-biamento e frattura delle ossa) può
essere osservata quando l’acquapotabile contiene 3-6 mg per litro,con alte ingestioni di acqua (31).Il cadmio viene rilasciato nell’am-biente tramite acque di scarico eda fonti diffuse ed è dovuto all’usodei fertilizzanti e all’inquinamentodell’aria, anche se la principalefonte di esposizione rimanel’alimentazione. Il cadmio vieneaccumulato principalmente nei re-ni e ha un periodo lungo di persi-stenza ma non dimostra segni dicarcinogenicità (31).L’arsenico è normalmente presentenell’acqua a concentrazioni inferio-ri a 1-2 µgr L-1, la concentrazionepuò aumentare nelle acque sotter-ranee, dove sono presenti depositisedimentari di origine vulcanica.L’As non è stato dimostrato essereun elemento essenziale negli esseriumani. Segni di arsenicalismo cro-nico, includendo lesioni dermali,neuropatie, cancro alla pelle, allavescica e ai polmoni sono state os-servate in popolazioni soggette al-l’ingestione quotidiana di acquapotabile contaminata (31, 33).La disinfezione è di importanzainquestionabile nella fornitura diacqua potabile sicura. La distruzio-ne dei patogeni di tipo microbiolo-gico è essenziale ed è molto comu-ne impiegare l’uso di agenti chimi-ci come il cloro. La disinfezione èeffettivamente una barriera versomolti patogeni (soprattutto batteri)nel trattamento dell’acqua potabilee deve essere usata per l’acqua di
superficie e per quella sotterranea,soggetta a contaminazione fecale.L’uso di disinfettanti chimici neltrattamento dell’acqua causa la for-mazione di prodotti secondari.Comunque, il rischio derivante daquesti prodotti secondari è netta-mente più basso in confronto con irischi associati ad un disinfezioneinadeguata. I trialometani (bromo-formio, bromodiclorometano, di-bromoclorometano, cloroformio) siformano come risultano della clo-razione della sostanza organicapresente naturalmente nelle acquedi origine. L’andamento e il gradodi formazione dei trialometani cre-scono in funzione del cloro, dellaconcentrazione di acidi umici,temperatura, pH e della concentra-zione dello ione bromuro. Il cloro-formio è il più comune trialometa-no nelle acque potabili clorate. Lamaggior parte dei trialometanivengono trasferiti all’aria come ri-sultato della loro volatilità.Il cloroformio e il bromodicloro-metano vengono classificati comepossibili carcinogenici per gli esse-ri umani, mentre il bromoformio eil dibromoclorometano sono clas-sificati come non carcinogenici perl’uomo.La quantità quanto la qualità van-no di pari passo per assicurare ca-ratteristiche ottimali dell’acqua,poiché il rischio di trasferimentodiretto di malattie da persona apersona o da alimenti contaminatiè più elevato quando dalla penuria
8
VOLUME 12
49
di acqua deriva da prassi igienicheinsufficienti.
Sostenibilità
Sostenibilità è diventato chiara-mente un termine popolare in poli-tica ambientale e nel mondo dellaricerca come si può intuire dalla fa-miliarità delle espressioni “Svilupposostenibile”, “Sostenibilità Ecologi-ca”. In anni recenti, l’attenzionedella comunità politica e scientificaè stata focalizzata sul concetto disostenibilità globale (34). WorldResources Institute (35) consideralo sviluppo sostenibile come “unastrategia di sviluppo nella qualevengono gestiti tutti i beni – risorsenaturali ed umane, così come i benifisici e finanziari”. Sostenibilità èun concetto nascente che ha stimo-lato un importante gruppo di lavo-ro e di riflessione su varie temati-che come lo sviluppo economico,produzione agricola, equità socialee la biodiversità. Sostenibilità è iltermine che lega sviluppo e am-biente, originariamente esso si ap-plicava in contesti forestali, di pre-lievo di acqua sotterranea o di pe-sca, includendo solo il concetto diquantità. Anche nel rispetto di unconcetto quantitativo di prelievo osfruttamento, non è detto che unsistema possa essere definito soste-nibile. Lo sviluppo sostenibile ri-chiede sostenibilità sociale così co-me sostenibilità economica ed am-
bientale. I fattori chiave che gover-nano una tale prospettiva di svilup-po sono la povertà, l’inquinamento,la partecipazione, la politica, ilmercato (good governance) insiemealla prevenzione e alla gestione deidisastri. Uno degli aspetti fonda-mentali elencati precedentemente,che influenza la sostenibilità, è lapartecipazione. La partecipazione èun processo attraverso il quale glistakeholders possono influenzare esuddividere le responsabilità tra losviluppo di iniziative e le risorseusate attraverso un impegno attivodurante la presa di decisioni. Tra glistakeholders vengono inclusi anchei cittadini che beneficiano dello svi-luppo, compreso l’apparto governa-tivo, il settore privato e la societàcivile (incluse le università e gli isti-tuti di ricerca, unione dei lavorato-ri, organizzazioni religiose, partipolitiche, i media, le fondazioni,servizi sociali e le organizzazioninon governative) a livello locale, di-strettuale e nazionale.Gleick et al. (36) approfondisce ladefinizione dell ’uso sostenibiledell’acqua: l’uso dell’acqua, che so-stiene l’abilità della società umananel tollerare e nel fiorire nell’inde-finito futuro, non deve pregiudica-re l’integrità del ciclo idrogeologi-co o dei sistemi ecologici che di-pendono da esso. Un uso sosteni-bile delle risorse idriche significasoddisfare il fabbisogno attuale,senza compromettere la capacitàper le future generazioni di soddi-
sfare il proprio. Gleick et al. (36)fornisce criteri espliciti e obiettiviper la sostenibilità delle risorse diacqua dolce (Tab. 1) (36).Questi criteri sono alla base di una“visione” alternativa per la gestio-ne dell’acqua futura e sono in gra-do di offrire diversi consigli perazioni legislative e non governativenel futuro (36).Attualmente sono stati compiutidiversi passi per perseguire l’obiet-tivo di uso sostenibile delle risorseidriche, in ambito europeo, nazio-nale, distrettuale, regionale e locale.La sostenibilità oggi può essereidentificata nelle seguenti azioni:• il riconoscimento a livello euro-
peo dell’acqua come patrimonio;• obiettivo di qualità dei corpi idri-
ci (Buono stato nel 2015 stabilitodalla direttiva 2000/60/EC) (30);
• distinzione delle caratteristichequalitative delle acque a secondadella loro destinazione (acquepotabili, acque reflue) ma anchecome valore intrinseco del corpoidrico in tutela dell’ecosistemaglobale;
• controlli efficaci sulla qualità equantità dell’acqua prelevata dal-le diverse autorità (ARPA, Ge-store del Servizio Idrico, AUSL);
• comunicazione del rischio tra leautorità responsabili della salutedel cittadino;
• iniziale applicazione di tecnolo-gie efficaci per il risparmio idricoin ambito domestico, agricolo,industriale;
PROGRESS IN NUTRITION 4/2010
9
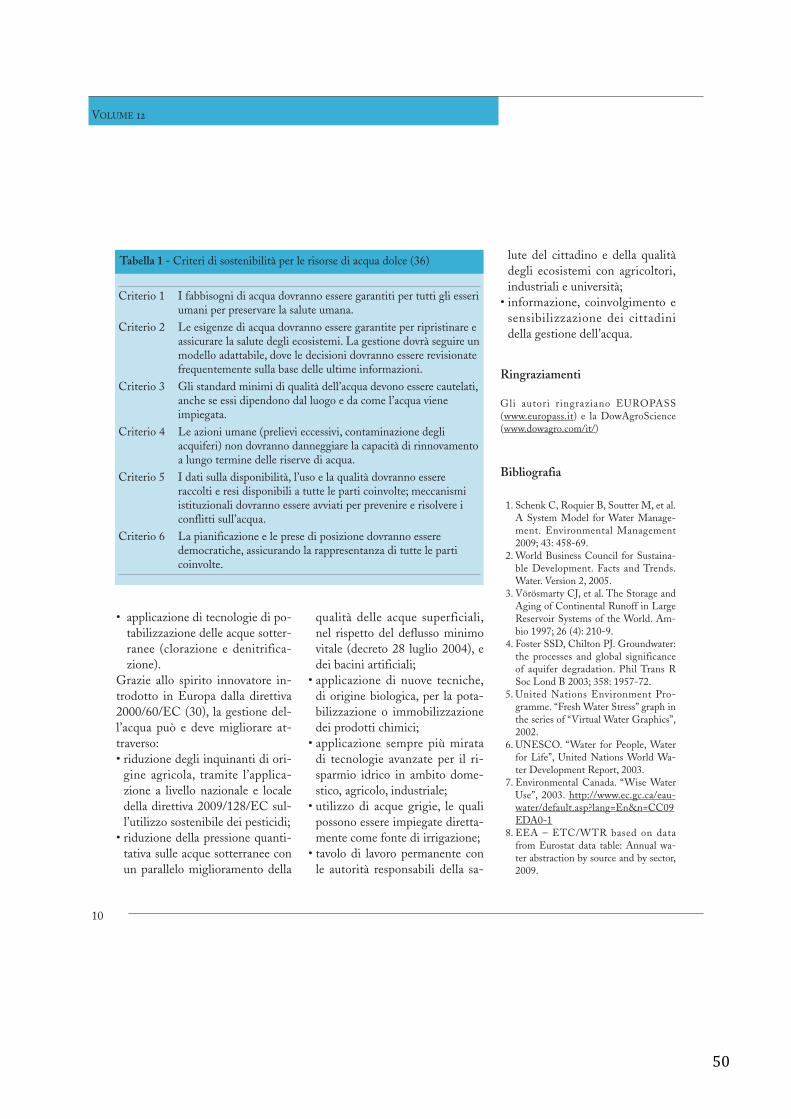
50
• applicazione di tecnologie di po-tabilizzazione delle acque sotter-ranee (clorazione e denitrifica-zione).
Grazie allo spirito innovatore in-trodotto in Europa dalla direttiva2000/60/EC (30), la gestione del-l’acqua può e deve migliorare at-traverso:• riduzione degli inquinanti di ori-
gine agricola, tramite l’applica-zione a livello nazionale e localedella direttiva 2009/128/EC sul-l’utilizzo sostenibile dei pesticidi;
• riduzione della pressione quanti-tativa sulle acque sotterranee conun parallelo miglioramento della
qualità delle acque superficiali,nel rispetto del deflusso minimovitale (decreto 28 luglio 2004), edei bacini artificiali;
• applicazione di nuove tecniche,di origine biologica, per la pota-bilizzazione o immobilizzazionedei prodotti chimici;
• applicazione sempre più miratadi tecnologie avanzate per il ri-sparmio idrico in ambito dome-stico, agricolo, industriale;
• utilizzo di acque grigie, le qualipossono essere impiegate diretta-mente come fonte di irrigazione;
• tavolo di lavoro permanente conle autorità responsabili della sa-
lute del cittadino e della qualitàdegli ecosistemi con agricoltori,industriali e università;
• informazione, coinvolgimento esensibilizzazione dei cittadinidella gestione dell’acqua.
Ringraziamenti
Gli autori ringraziano EUROPASS(www.europass.it) e la DowAgroScience(www.dowagro.com/it/)
Bibliografia
1. Schenk C, Roquier B, Soutter M, et al.A System Model for Water Manage-ment. Environmental Management2009; 43: 458-69.
2. World Business Council for Sustaina-ble Development. Facts and Trends.Water. Version 2, 2005.
3. Vörösmarty CJ, et al. The Storage andAging of Continental Runoff in LargeReservoir Systems of the World. Am-bio 1997; 26 (4): 210-9.
4. Foster SSD, Chilton PJ. Groundwater:the processes and global significanceof aquifer degradation. Phil Trans RSoc Lond B 2003; 358: 1957-72.
5. United Nations Environment Pro-gramme. “Fresh Water Stress” graph inthe series of “Virtual Water Graphics”,2002.
6. UNESCO. “Water for People, Waterfor Life”, United Nations World Wa-ter Development Report, 2003.
7. Environmental Canada. “Wise WaterUse”, 2003. http://www.ec.gc.ca/eau-water/default.asp?lang=En&n=CC09EDA0-1
8. EEA – ETC/WTR based on datafrom Eurostat data table: Annual wa-ter abstraction by source and by sector,2009.
10
VOLUME 12
Criterio 1 I fabbisogni di acqua dovranno essere garantiti per tutti gli esseriumani per preservare la salute umana.
Criterio 2 Le esigenze di acqua dovranno essere garantite per ripristinare eassicurare la salute degli ecosistemi. La gestione dovrà seguire unmodello adattabile, dove le decisioni dovranno essere revisionatefrequentemente sulla base delle ultime informazioni.
Criterio 3 Gli standard minimi di qualità dell’acqua devono essere cautelati,anche se essi dipendono dal luogo e da come l’acqua vieneimpiegata.
Criterio 4 Le azioni umane (prelievi eccessivi, contaminazione degliacquiferi) non dovranno danneggiare la capacità di rinnovamentoa lungo termine delle riserve di acqua.
Criterio 5 I dati sulla disponibilità, l’uso e la qualità dovranno essereraccolti e resi disponibili a tutte le parti coinvolte; meccanismiistituzionali dovranno essere avviati per prevenire e risolvere iconflitti sull’acqua.
Criterio 6 La pianificazione e le prese di posizione dovranno esseredemocratiche, assicurando la rappresentanza di tutte le particoinvolte.
Tabella 1 - Criteri di sostenibilità per le risorse di acqua dolce (36)
51
9. Penov I. The use of irrigation waterduring transition in Bulgaria’s Plovdivregion. CEESA Discussion Paper No7/2002 UNEP: United Nations Envi-ronment Programme, 2002.
10. Dworak T, Berglund M, Laaser C, etal. EU Water Saving Potential, 2007.http://ec.europa.eu/environment/water/quantity/pdf/water_saving_1.pdf
11. Attané I, Courbage J. La démographieen Méditerranée. Situation et projec-tions. Les Fascicules du Plan Bleu, 11.Paris, Economica, 2001: 249.
12. Massarutto A. Water pricing, theCommon Agricultural policy and irri-gation water use, draft report, Udine,Italy, 2001.
13. OECD. Environmental Performanceof Agriculture in OECD countriessince 1990, Paris, France, 2008.
14. Institut Català d’Energia-ICAEN.Gestió de l’aigua a la Indústria. Estalvii Depuració, 1999.
15. UNEP16. Dalmas L, Reynaud A. Residential Wa-
ter Demand in the Slovak Republic,LERNA CEA-INRA-UT1, 2003.
17. EEA. Environmental issue report No19, Sustainable water use in EuropePart 2: Demand management, EEA,Copenhagen, 2001.
18. Cohen S. Projected increases in muni-cipal water use in the Great Lakes dueto C02- induced climatic change. Wa-ter Resources Bulletin 1987; 23 (1):91-101.
19. Downing TE, Butterfield RE, Ed-monds B, et al. Climate Change andthe Demand for Water, Research Re-port, Stockholm Environment Institu-te Oxford Office, Oxford, 2003.
20. Herrington P. Climate change and thedemand for water. HMSO, London,1996.
21. Kenneth DF. Water Resources andClimate Change. Resources for the fu-ture Climate Issues Brief No. 3, 1997.
22. De Stefano L. Freshwater and Tou-rism in the Mediterranean. WWFMediterranean Programme, 2004.
23. FAO. Aquastat. 2003. http://www.fao.org/nr/water/aquastat/main/index.stm
24. ISTAT, http://demo.istat.it/pop2010/index.html
25. Regione Emilia Romagna. Piano diTutela delle Acque, 2005: 371
26. Allan JA. Virtual water: A strategic re-source global solutions to regional defi-cits. Ground Water 1998; 36 (4): 545-6.
27. Hoekstra AY, A K. Globalisation ofWater: sharing the planet’s freshwaterresources. Wiley - Blackwell, 2008:232.
28. Decreto Legislativo 2 febbraio 2001,n.31. Attuazione della direttiva 98/83/CE relative alla qualità delle acquedestinate al consumo umano.
29. Decreto Legislativo 16 marzo 2009, n.30. Attuazione della direttiva 2006/118/CE, relativa alla protezione delleacque sotterranee dall’inquinamento edal deterioramento.
30. Direttiva 2000/60/CE del 23 ottobre2000. Direttiva del Parlamento euro-peo e del Consiglio che istituisce unquadro per l’azione comunitaria in ma-teria di acque.
31. WHO. Guidelines for Drinking – wa-ter Quality. Third Edition, 2008.
32. Schmoll O, Howard G, Chilton J, etal. Protecting Groundwater forHealth. Managing the Quality ofDrinking Water Sources. WorldHealth Organization, IWA Publis-hing, London, UK, 2006: 199-270.
33. IPCS. Arsenic and arsenic com-pounds. Geneva, World Health Orga-nization, International Programme onChemical Safety (EnvironmentalHealth Criteria 224), 2001.
34. Clark W. Unpublished notes and do-cuments on the Sustainable Develop-ment of the biosphere Project. Inter-national Institute for Applied SystemsAnalysis, Laxenburg, Austria, 1986.
35. Repetto R (ed). The global possible.Yale University Press, New Haven,Connecticut, 1985.
36. Gleick P, Loh P, Gomez S, et al. Cali-fornia water 2020: a sustainable vision.Pacific Institute Report, Pacific Insti-tute for Studies in Development, En-vironment, and Security. Oakland, Ca-lifornia, USA, 1995.
PROGRESS IN NUTRITION 4/2010
11

52
53
Chapter III. Determination of Arsenic Species in
Diffusive Gradients in Thin Films (DGT) device.
ABSTRACT
The diffusive gradients in thin films (DGT) technique, utilizing a ferrihydrite adsorbent, has
been investigated for the accumulation of different species of Arsenic, like Inorganic Species
(arsenite and arsenate) and Organic Arsenic (dimethylarsinic and monomethylarsenate). The results,
obtained by application of HPLC-ICP-MS, has confirmed that DGT is a reliable method for pre-
concentration of Total Dissolved As and it is able to maintain the Arsenic species. It has been
shown that MMA(V) and, under some conditions, DMA(V) can accumulate on the ferrihydrite
adsorbent and will therefore contribute to the total As measured by DGT sampling. To evaluate the
performance of DGT method for accumulation of arsenic species, DGT devices were carried out on
groundwater collected in six different towns where the As concentration in groundwater is very
high. The total arsenic concentration was represented by inorganic forms. Further investigations are
necessary to study probable interactions of organic As species to colloids and seasonal variations of
groundwater conditions.
Key words: Ferrihydrite, Arsenate, Arsenite, Monomethylarsonic Acid, Dimethylarsinic Acid, Diffusion coefficients,
Groundwater.
INTRODUCTION Arsenic (As) is a ubiquitous element found in the atmosphere, soils and rocks, natural waters
and organisms. It is mobilised through a combination of natural processes such as weathering
reactions, biological activity and volcanic emissions as well as through a range of anthropogenic
activities. Most environmental As problems are the result of mobilisation under natural conditions.
Of the various sources of As in the environment, drinking water probably poses the greatest threat
to human health. A big percentage of tap and drinking water comes from groundwater because the
surface water is often polluted by agricultural and industrial substances. In Europe, particularly in
Italy, during the last years the presence of arsenic in groundwater was reported from many
provinces in the North of Italy.
Arsenic is human carcinogen and it exists under different chemical species in groundwater.
54
The WHO guideline value for As in drinking water was provisionally reduced in 1993 from 50 to
10 µg L-1. The new recommended value was based on the increasing awareness of the toxicity of
As, particularly its carcinogenicity, and on the ability to measure it quantitatively (WHO, 1993).
Inorganic arsenite and arsenate are predominant, but low amounts of organic species may also be
found, like monomethylarsonic acid (MMA(V)) and dimethylarsinic acid (DMA(V)). The toxicity
of As in the environment depends upon speciation. The general order of toxicity for As is given as:
organoarsenicals (e.g. methylated species) < arsenates (As(V)) < arsenites (As(III)) (Yamauchi and
Fowler 1994). Another important characteristic is that As(V) species are less mobile than As(III)
species in many environmental systems (Bhattacharya et al. 2002).
It is useful to measure different types of species because the efficiency of As removal from drinking
water depends on its speciation. The knowledge of As speciation is necessary for risk assessment
and for appropriate choice of arsenic removal technology.
As species are very unstable in natural water; their distribution depends on the redox condition, pH,
DOC and the presence of precipitating elements (Smedley and Kinniburgh 2002). As(III) (arsenite)
is thermodynamically stable in anoxic environments and As(V) (arsenate) in oxygenated
environments.
Redox potential (Eh) and pH are the most important factors controlling As speciation. Under
oxidising conditions, H2AsO4- is dominant at low pH (less than about pH 6.9), whilst at higher pH,
HAsO42- becomes dominant (H3AsO4
0 and AsO43- may be present in extremely acidic and alkaline
conditions respectively). Under reducing conditions at pH less than about pH 9.2, the uncharged
arsenite species H3AsO30 will predominate (Brookins, 1988; Yan et al., 2000).
In the present study, two approaches are combined to study As speciation in raw groundwater: (a)
Ferrihydrite (FH) Diffusive Gradients in Thin Films (DGT), (b) HPLC-ICP-MS, technique with
excellent separation and high sensitivity.
As a result of the in situ sampling capabilities, DGT has the advantage of obtaining time-weighted
average concentrations of analytes, eliminating the risk of speciation changes due to transportation
and storage of samples prior to preparation and analysis (Lead et al. 2002), its preconcentration
effect can lower effective detection limits for trace species and it is designed to accumulate labile
species in environmental systems (Zhang and Davison 1995, Zhang and Davison 2000, Davison et
al. 2000).
The use of DGT technique is a well established approach to the in-situ determination of dynamic
trace element concentrations (Warnken et al. 2007). The DGT plastic sampling unit holds a binding
layer covered by a diffusion gel and a membrane filter that is exposed to the target solution.
Analytes diffuse through the diffusive layer (i.e. the diffusive gel and membrane filter) and
55
accumulate in the binding layer to an analyte specific adsorbent. After deployment the binding layer
is extracted from the sampling unit and subjected to suitable analysis.
A DGT device with a layer of iron (Fe) oxide gel (impreganted with ferrihydrite) was developed for
dissolved reactive phosphorous measurements (Zhang et al. 1998) and it has lately also been
applied for the determination of labile oxyanions, including arsenic (Osterlund et al. 2010; Luo et
al. 2010). Both arsenite and arsenate adsorb to the ferrihydrite binding layer, and methods to
measure total inorganic arsenic (Panther et al. 2008 b) as well as the individual species have been
developed (Panther et al. 2008 b).
Methylated arsenic species are formed by microorganisms (Cullen and Reimer, 1989), and therefore
the speciation changes in response to biological activity, resulting in seasonal variation (Hasegawa
et al. 2010; Hasegawa et al. 2009; Anderson and Bruland, 1991). Although it is known that organic
arsenic species also adsorb to ferric oxides (Lafferty and Loeppert, 2005), the effects on DGT
sampling have not yet been investigated.
This work aims to investigate the simultaneously adsorption and accumulation of the two inorganic
arsenic species, As(III) and As(V), and organic species, DMA(V) and MMA(V), by ferrihydrite
DGT. Furthermore, limitations for using such DGT devices to retrieve arsenic speciation
information from natural water bodies are identified.
MATERIALS AND METHODS Following the procedure of Huang for quantitative chemical extraction for As in food, like
rice grain (Huang et al. 2010), it is possible to apply this technique for digestion FH DGT resin
layer favoured the matrix free from interferences in the ICP-MS measurement.
Solutions
Stock solutions of arsenic species (1000 mg l−1 for As) were prepared by As2O3 (ArsenicIII Oxide)
and Na2HAsO4*7H2O (sodium arsenate dibasic heptahydrate) and of DMA(V) and MMA(V) from
dimethylarsinic acid ((CH3)2As(O)OH) and disodium methylarsenate (Na2CH3AsO3).
The standard solutions of arsenic species were used by diluting the corresponding stock solutions.
Standard solutions of As were prepared by dilution of a multielement standard (100 mg L-1)
obtained from CPI International (Amsterdam, The Netherlands) for total concentration analysis.
All reagents were of analytical grade. Ultra-pure water was prepared by a Milli-Q system (18MΩ-
cm resistance, Millipore® system, Millipore, Bedford, MA).
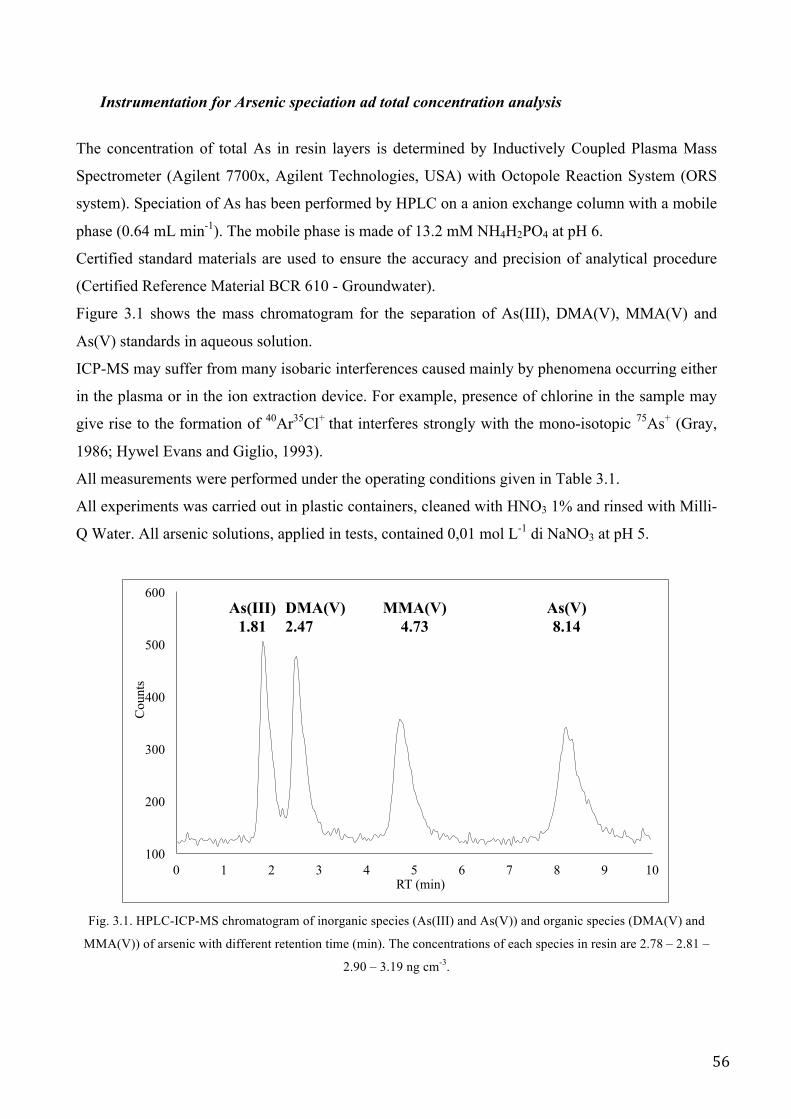
56
Instrumentation for Arsenic speciation ad total concentration analysis
The concentration of total As in resin layers is determined by Inductively Coupled Plasma Mass
Spectrometer (Agilent 7700x, Agilent Technologies, USA) with Octopole Reaction System (ORS
system). Speciation of As has been performed by HPLC on a anion exchange column with a mobile
phase (0.64 mL min-1). The mobile phase is made of 13.2 mM NH4H2PO4 at pH 6.
Certified standard materials are used to ensure the accuracy and precision of analytical procedure
(Certified Reference Material BCR 610 - Groundwater).
Figure 3.1 shows the mass chromatogram for the separation of As(III), DMA(V), MMA(V) and
As(V) standards in aqueous solution.
ICP-MS may suffer from many isobaric interferences caused mainly by phenomena occurring either
in the plasma or in the ion extraction device. For example, presence of chlorine in the sample may
give rise to the formation of 40Ar35Cl+ that interferes strongly with the mono-isotopic 75As+ (Gray,
1986; Hywel Evans and Giglio, 1993).
All measurements were performed under the operating conditions given in Table 3.1.
All experiments was carried out in plastic containers, cleaned with HNO3 1% and rinsed with Milli-
Q Water. All arsenic solutions, applied in tests, contained 0,01 mol L-1 di NaNO3 at pH 5.
Fig. 3.1. HPLC-ICP-MS chromatogram of inorganic species (As(III) and As(V)) and organic species (DMA(V) and
MMA(V)) of arsenic with different retention time (min). The concentrations of each species in resin are 2.78 – 2.81 –
2.90 – 3.19 ng cm-3.
100
200
300
400
500
600
0 1 2 3 4 5 6 7 8 9 10
Cou
nts
RT (min)
As(III) 1.81
DMA(V)
2.47 MMA(V)
4.73 As(V) 8.14
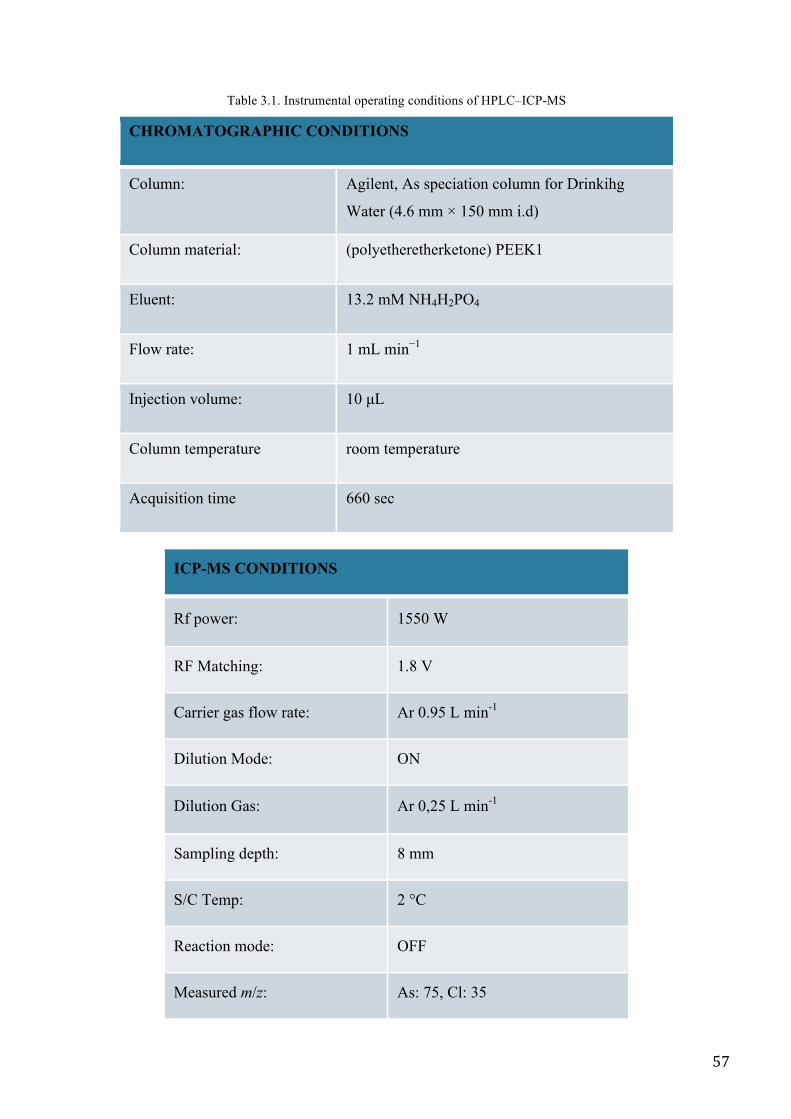
57
Table 3.1. Instrumental operating conditions of HPLC–ICP-MS
CHROMATOGRAPHIC CONDITIONS
Column: Agilent, As speciation column for Drinkihg
Water (4.6 mm × 150 mm i.d)
Column material: (polyetheretherketone) PEEK1
Eluent: 13.2 mM NH4H2PO4
Flow rate: 1 mL min−1
Injection volume: 10 µL
Column temperature room temperature
Acquisition time 660 sec
ICP-MS CONDITIONS
Rf power: 1550 W
RF Matching: 1.8 V
Carrier gas flow rate: Ar 0.95 L min-1
Dilution Mode: ON
Dilution Gas: Ar 0,25 L min-1
Sampling depth: 8 mm
S/C Temp: 2 °C
Reaction mode: OFF
Measured m/z: As: 75, Cl: 35
58
Quadrupole bias: -3 V
Diffusive Gradient in Thin Films (DGT) application
DGT units, with Fe-oxide resin gel, were exposed directly to solutions of inorganic and organic
arsenic (pH 5, 0.01 M NaNO3). After 24 h on the stirrer, DGT units were taken out of the solution
and the surface was rinsed with MilliQ water. After that, the resin gel could be retrieved and the Fe-
oxide gel placed in a clean sample tube. All experiments were carried out at 24.0 ± 0,5 °C.
After that, the Fe-oxide gels are placed in a plastic flask (digiTUBES 50 mL) with 15 mL of 0.28 M
of HNO3. They are mineralized at 95° C for 90 min in a heating block system (DIGIPREP, Scp
Science, Quebec, Canada).
The digested DGT gel solutions were filtered by using 0.45 µm filter (digiFILTER) after
appropriate dilution with Milli- Water.
Testing DGT performance in laboratory
The amount of As absorbed by the resin was analysed, and determined after deploying of two DGT
units for 24h in a solution of inorganic arsenic (As(III) and As(V)). The time-averaged
concentration of a specie in a solution, C, was then calculated using the DGT equation (1),
!!"# = ! ∗ ∆!! ∗ ! ∗ ! (1)
Δg = the thickness of the diffusive gel (cm),
t = the deployment time (s)
A = the surface area of the diffusive gel exposed to the bulk solution (cm2)
D = the diffusion coefficient of analyte in the diffusive gel (cm2 s-1),
CDGT was compared with the immersion solution concentration analysed in the samples taken
during the experiment. There was a difference between the concentrations within 10%.
A solution of organic arsenic (DMA(V) and MMA(V)) was made for testing DGT performances,
even if the diffusion coefficient of organic arsenic species was not known before the deployment of
DGT devices for measurement of DMA(V) and MMA(V) diffusion coefficients.
Measurement of As Diffusion Coefficients using DGT devices
Diffusion coefficients of As(V) and As(III) were measured using DGT devices. Ten DGT devices
were deployed in the As solution for times ranging from 3 to 24h. At each retrieval time, 2 DGT
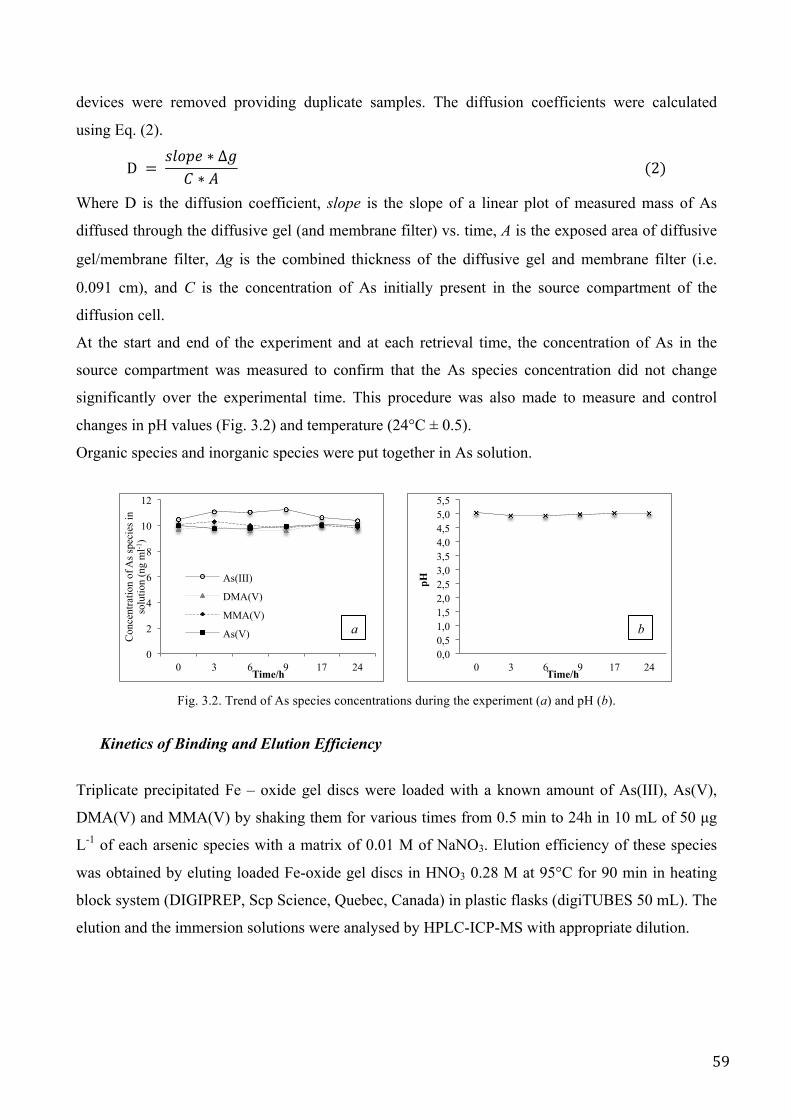
59
devices were removed providing duplicate samples. The diffusion coefficients were calculated
using Eq. (2).
D = !"#$% ∗ ∆!! ∗ ! (2)
Where D is the diffusion coefficient, slope is the slope of a linear plot of measured mass of As
diffused through the diffusive gel (and membrane filter) vs. time, A is the exposed area of diffusive
gel/membrane filter, Δg is the combined thickness of the diffusive gel and membrane filter (i.e.
0.091 cm), and C is the concentration of As initially present in the source compartment of the
diffusion cell.
At the start and end of the experiment and at each retrieval time, the concentration of As in the
source compartment was measured to confirm that the As species concentration did not change
significantly over the experimental time. This procedure was also made to measure and control
changes in pH values (Fig. 3.2) and temperature (24°C ± 0.5).
Organic species and inorganic species were put together in As solution.
Fig. 3.2. Trend of As species concentrations during the experiment (a) and pH (b).
Kinetics of Binding and Elution Efficiency
Triplicate precipitated Fe – oxide gel discs were loaded with a known amount of As(III), As(V),
DMA(V) and MMA(V) by shaking them for various times from 0.5 min to 24h in 10 mL of 50 µg
L-1 of each arsenic species with a matrix of 0.01 M of NaNO3. Elution efficiency of these species
was obtained by eluting loaded Fe-oxide gel discs in HNO3 0.28 M at 95°C for 90 min in heating
block system (DIGIPREP, Scp Science, Quebec, Canada) in plastic flasks (digiTUBES 50 mL). The
elution and the immersion solutions were analysed by HPLC-ICP-MS with appropriate dilution.
0
2
4
6
8
10
12
0 3 6 9 17 24
Con
cent
ratio
n of
As s
peci
es in
so
lutio
n (n
g m
l-1)
Time/h
As(III)
DMA(V)
MMA(V)
As(V) a
0,0 0,5 1,0 1,5 2,0 2,5 3,0 3,5 4,0 4,5 5,0 5,5
0 3 6 9 17 24
pH
Time/h
b
60
Ionic strength and pH influence
To test the effects of ionic strength and pH, triplicate FH DGTs, were deployed for 24h in various
well-stirred solutions at known constant temperatures.
To study the effect of ionic strength, a range of NaNO3 concentrations, from 0 to 100 mM, was
prepared in 2.5 L of solution (pH 5) containing each species at 50 µg L-1.
For pH influence, 2.5 L containing 0.01 M of NaNO3 were prepared at different pHs adjusted with
HNO3 and NaOH prior to spiking with As species stock solutions to 50 µg L-1.
Field measurements
Sampling was conducted in six different towns in Cremona province (Fig. 3.3), where the As
pollution of groundwater is a great problem. Groundwater samples were collected and stored in the
freezer (- 20°C) until use. Water chemistry data of six points are presented in Table 3.2.
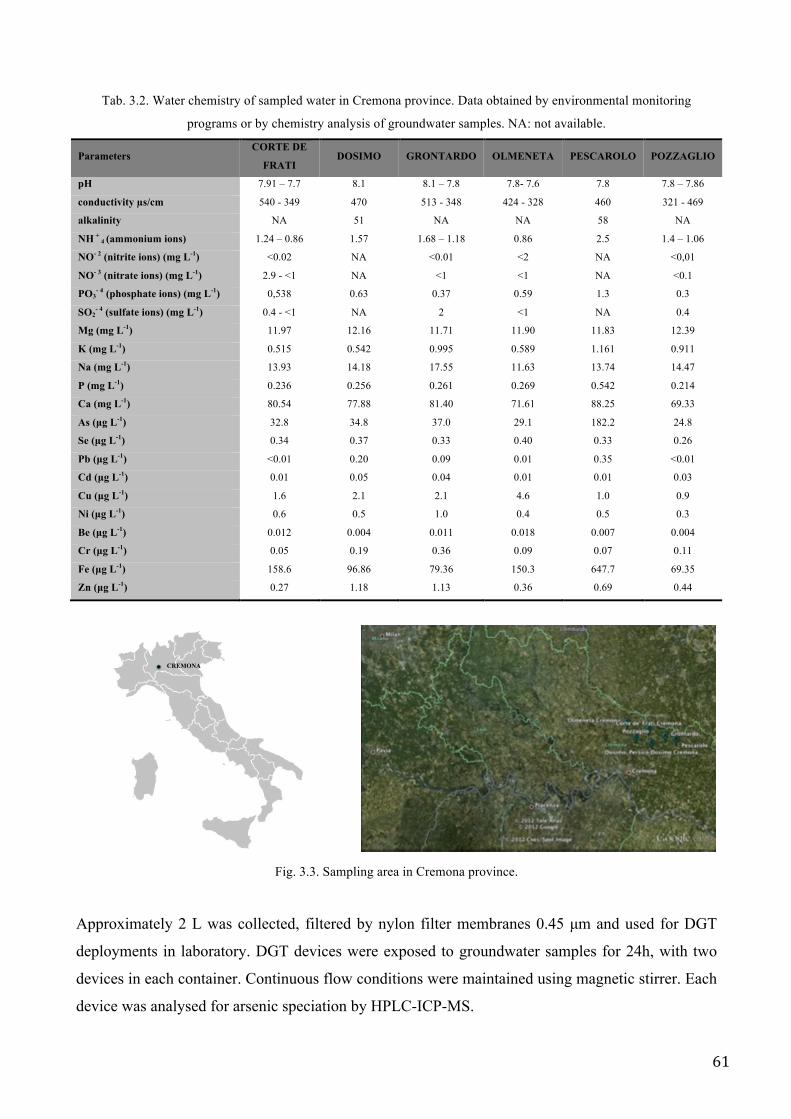
61
Tab. 3.2. Water chemistry of sampled water in Cremona province. Data obtained by environmental monitoring
programs or by chemistry analysis of groundwater samples. NA: not available.
Parameters CORTE DE
FRATI DOSIMO GRONTARDO OLMENETA PESCAROLO POZZAGLIO
pH 7.91 – 7.7 8.1 8.1 – 7.8 7.8- 7.6 7.8 7.8 – 7.86 conductivity µs/cm 540 - 349 470 513 - 348 424 - 328 460 321 - 469 alkalinity NA 51 NA NA 58 NA NH +
4 (ammonium ions) 1.24 – 0.86 1.57 1.68 – 1.18 0.86 2.5 1.4 – 1.06 NO- 2 (nitrite ions) (mg L-1) <0.02 NA <0.01 <2 NA <0,01 NO- 3 (nitrate ions) (mg L-1) 2.9 - <1 NA <1 <1 NA <0.1 PO3
- 4 (phosphate ions) (mg L-1) 0,538 0.63 0.37 0.59 1.3 0.3 SO2
- 4 (sulfate ions) (mg L-1) 0.4 - <1 NA 2 <1 NA 0.4 Mg (mg L-1) 11.97 12.16 11.71 11.90 11.83 12.39 K (mg L-1) 0.515 0.542 0.995 0.589 1.161 0.911 Na (mg L-1) 13.93 14.18 17.55 11.63 13.74 14.47 P (mg L-1) 0.236 0.256 0.261 0.269 0.542 0.214 Ca (mg L-1) 80.54 77.88 81.40 71.61 88.25 69.33 As (µg L-1) 32.8 34.8 37.0 29.1 182.2 24.8 Se (µg L-1) 0.34 0.37 0.33 0.40 0.33 0.26 Pb (µg L-1) <0.01 0.20 0.09 0.01 0.35 <0.01 Cd (µg L-1) 0.01 0.05 0.04 0.01 0.01 0.03 Cu (µg L-1) 1.6 2.1 2.1 4.6 1.0 0.9 Ni (µg L-1) 0.6 0.5 1.0 0.4 0.5 0.3 Be (µg L-1) 0.012 0.004 0.011 0.018 0.007 0.004 Cr (µg L-1) 0.05 0.19 0.36 0.09 0.07 0.11 Fe (µg L-1) 158.6 96.86 79.36 150.3 647.7 69.35 Zn (µg L-1) 0.27 1.18 1.13 0.36 0.69 0.44
Fig. 3.3. Sampling area in Cremona province.
Approximately 2 L was collected, filtered by nylon filter membranes 0.45 µm and used for DGT
deployments in laboratory. DGT devices were exposed to groundwater samples for 24h, with two
devices in each container. Continuous flow conditions were maintained using magnetic stirrer. Each
device was analysed for arsenic speciation by HPLC-ICP-MS.
CREMONA
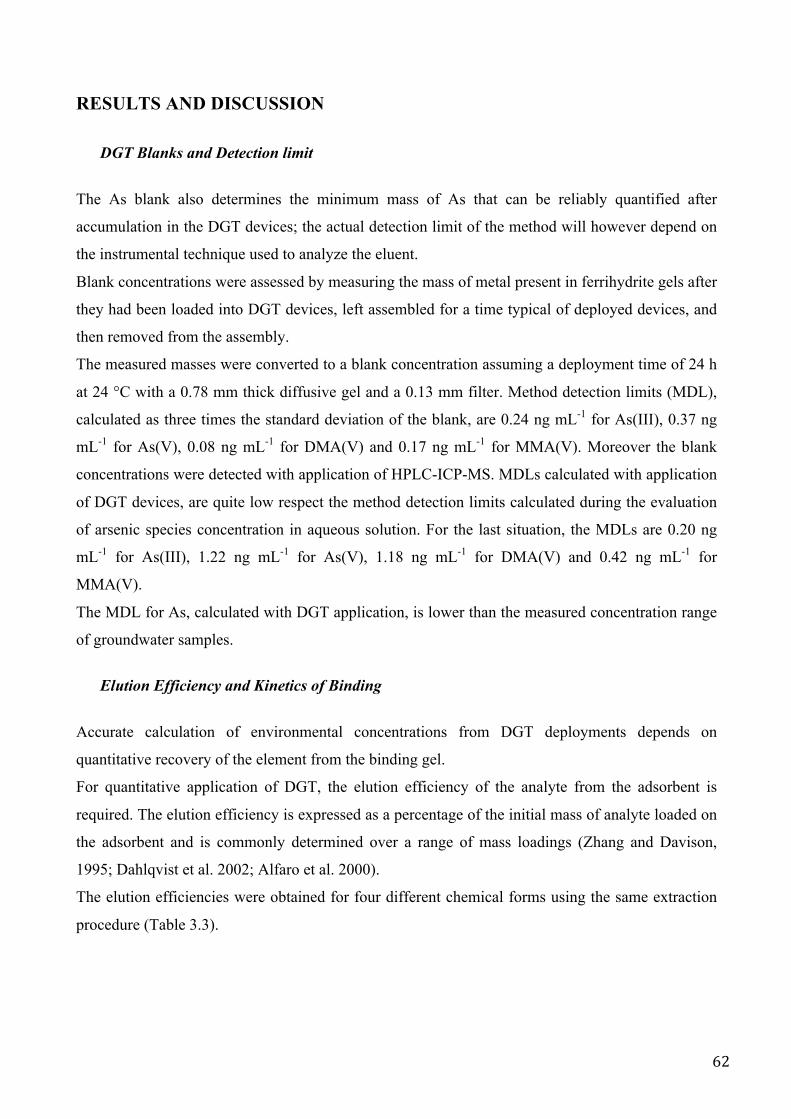
62
RESULTS AND DISCUSSION
DGT Blanks and Detection limit
The As blank also determines the minimum mass of As that can be reliably quantified after
accumulation in the DGT devices; the actual detection limit of the method will however depend on
the instrumental technique used to analyze the eluent.
Blank concentrations were assessed by measuring the mass of metal present in ferrihydrite gels after
they had been loaded into DGT devices, left assembled for a time typical of deployed devices, and
then removed from the assembly.
The measured masses were converted to a blank concentration assuming a deployment time of 24 h
at 24 °C with a 0.78 mm thick diffusive gel and a 0.13 mm filter. Method detection limits (MDL),
calculated as three times the standard deviation of the blank, are 0.24 ng mL-1 for As(III), 0.37 ng
mL-1 for As(V), 0.08 ng mL-1 for DMA(V) and 0.17 ng mL-1 for MMA(V). Moreover the blank
concentrations were detected with application of HPLC-ICP-MS. MDLs calculated with application
of DGT devices, are quite low respect the method detection limits calculated during the evaluation
of arsenic species concentration in aqueous solution. For the last situation, the MDLs are 0.20 ng
mL-1 for As(III), 1.22 ng mL-1 for As(V), 1.18 ng mL-1 for DMA(V) and 0.42 ng mL-1 for
MMA(V).
The MDL for As, calculated with DGT application, is lower than the measured concentration range
of groundwater samples.
Elution Efficiency and Kinetics of Binding
Accurate calculation of environmental concentrations from DGT deployments depends on
quantitative recovery of the element from the binding gel.
For quantitative application of DGT, the elution efficiency of the analyte from the adsorbent is
required. The elution efficiency is expressed as a percentage of the initial mass of analyte loaded on
the adsorbent and is commonly determined over a range of mass loadings (Zhang and Davison,
1995; Dahlqvist et al. 2002; Alfaro et al. 2000).
The elution efficiencies were obtained for four different chemical forms using the same extraction
procedure (Table 3.3).
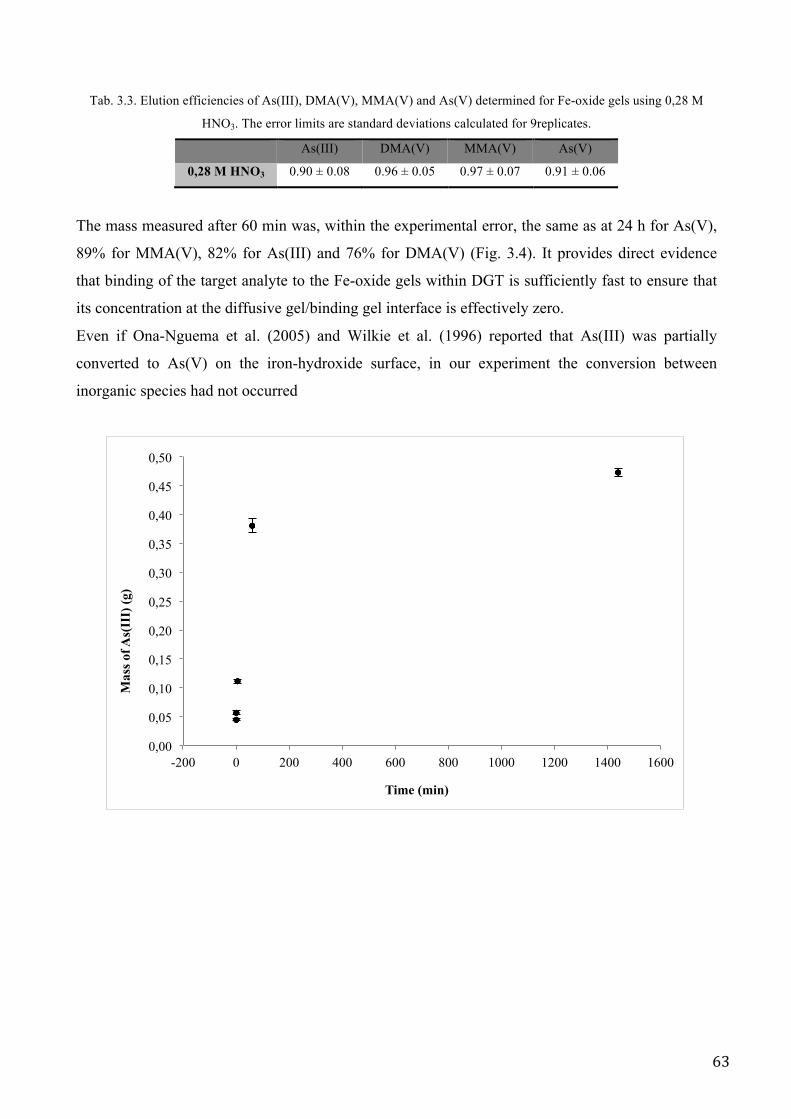
63
Tab. 3.3. Elution efficiencies of As(III), DMA(V), MMA(V) and As(V) determined for Fe-oxide gels using 0,28 M
HNO3. The error limits are standard deviations calculated for 9replicates.
As(III) DMA(V) MMA(V) As(V)
0,28 M HNO3 0.90 ± 0.08 0.96 ± 0.05 0.97 ± 0.07 0.91 ± 0.06
The mass measured after 60 min was, within the experimental error, the same as at 24 h for As(V),
89% for MMA(V), 82% for As(III) and 76% for DMA(V) (Fig. 3.4). It provides direct evidence
that binding of the target analyte to the Fe-oxide gels within DGT is sufficiently fast to ensure that
its concentration at the diffusive gel/binding gel interface is effectively zero.
Even if Ona-Nguema et al. (2005) and Wilkie et al. (1996) reported that As(III) was partially
converted to As(V) on the iron-hydroxide surface, in our experiment the conversion between
inorganic species had not occurred
0,00
0,05
0,10
0,15
0,20
0,25
0,30
0,35
0,40
0,45
0,50
-200 0 200 400 600 800 1000 1200 1400 1600
Mas
s of A
s(II
I) (g
)
Time (min)
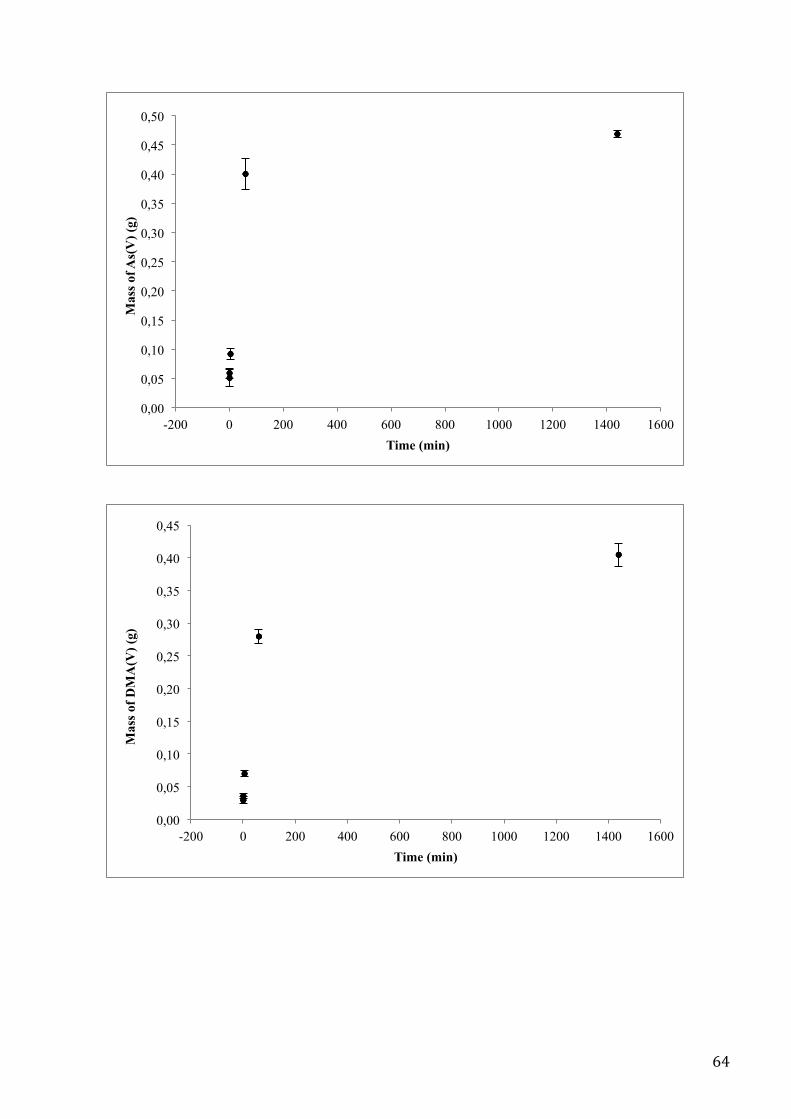
64
0,00
0,05
0,10
0,15
0,20
0,25
0,30
0,35
0,40
0,45
0,50
-200 0 200 400 600 800 1000 1200 1400 1600
Mas
s of A
s(V
) (g)
Time (min)
0,00
0,05
0,10
0,15
0,20
0,25
0,30
0,35
0,40
0,45
-200 0 200 400 600 800 1000 1200 1400 1600
Mas
s of D
MA
(V) (
g)
Time (min)
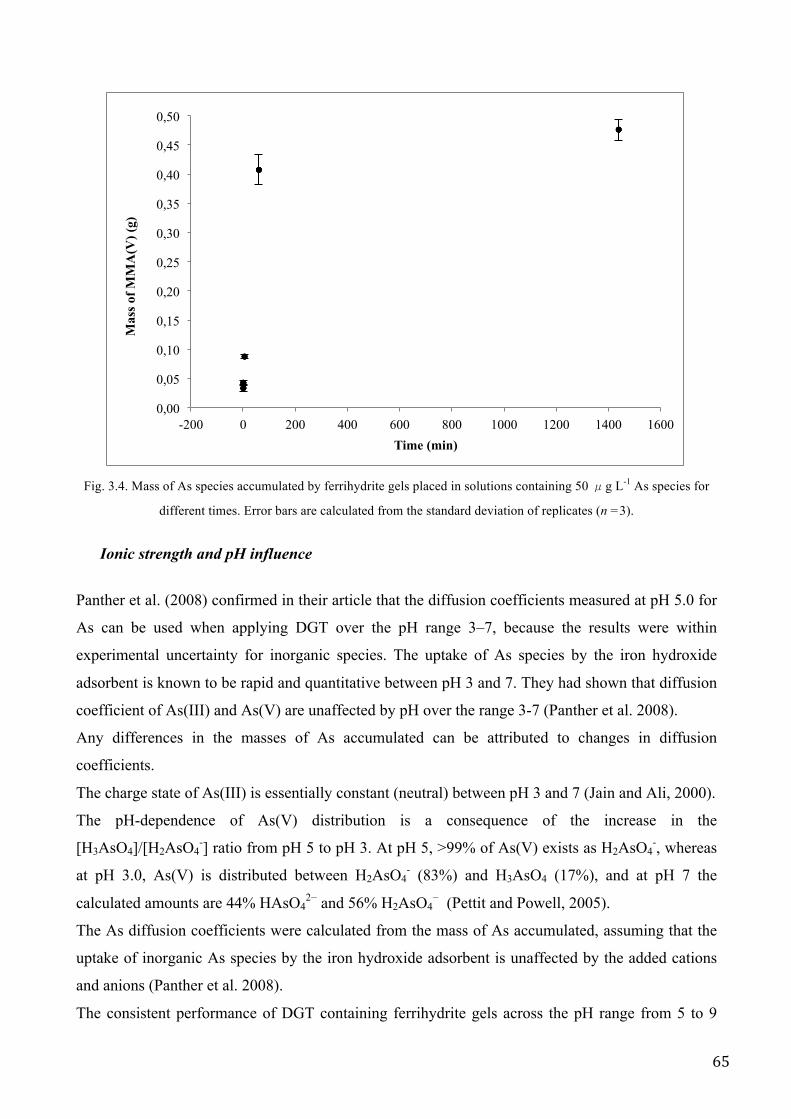
65
Fig. 3.4. Mass of As species accumulated by ferrihydrite gels placed in solutions containing 50 μg L-1 As species for
different times. Error bars are calculated from the standard deviation of replicates (n =3).
Ionic strength and pH influence
Panther et al. (2008) confirmed in their article that the diffusion coefficients measured at pH 5.0 for
As can be used when applying DGT over the pH range 3–7, because the results were within
experimental uncertainty for inorganic species. The uptake of As species by the iron hydroxide
adsorbent is known to be rapid and quantitative between pH 3 and 7. They had shown that diffusion
coefficient of As(III) and As(V) are unaffected by pH over the range 3-7 (Panther et al. 2008).
Any differences in the masses of As accumulated can be attributed to changes in diffusion
coefficients.
The charge state of As(III) is essentially constant (neutral) between pH 3 and 7 (Jain and Ali, 2000).
The pH-dependence of As(V) distribution is a consequence of the increase in the
[H3AsO4]/[H2AsO4-] ratio from pH 5 to pH 3. At pH 5, >99% of As(V) exists as H2AsO4
-, whereas
at pH 3.0, As(V) is distributed between H2AsO4- (83%) and H3AsO4 (17%), and at pH 7 the
calculated amounts are 44% HAsO42− and 56% H2AsO4
− (Pettit and Powell, 2005).
The As diffusion coefficients were calculated from the mass of As accumulated, assuming that the
uptake of inorganic As species by the iron hydroxide adsorbent is unaffected by the added cations
and anions (Panther et al. 2008).
The consistent performance of DGT containing ferrihydrite gels across the pH range from 5 to 9
0,00
0,05
0,10
0,15
0,20
0,25
0,30
0,35
0,40
0,45
0,50
-200 0 200 400 600 800 1000 1200 1400 1600
Mas
s of M
MA
(V) (
g)
Time (min)
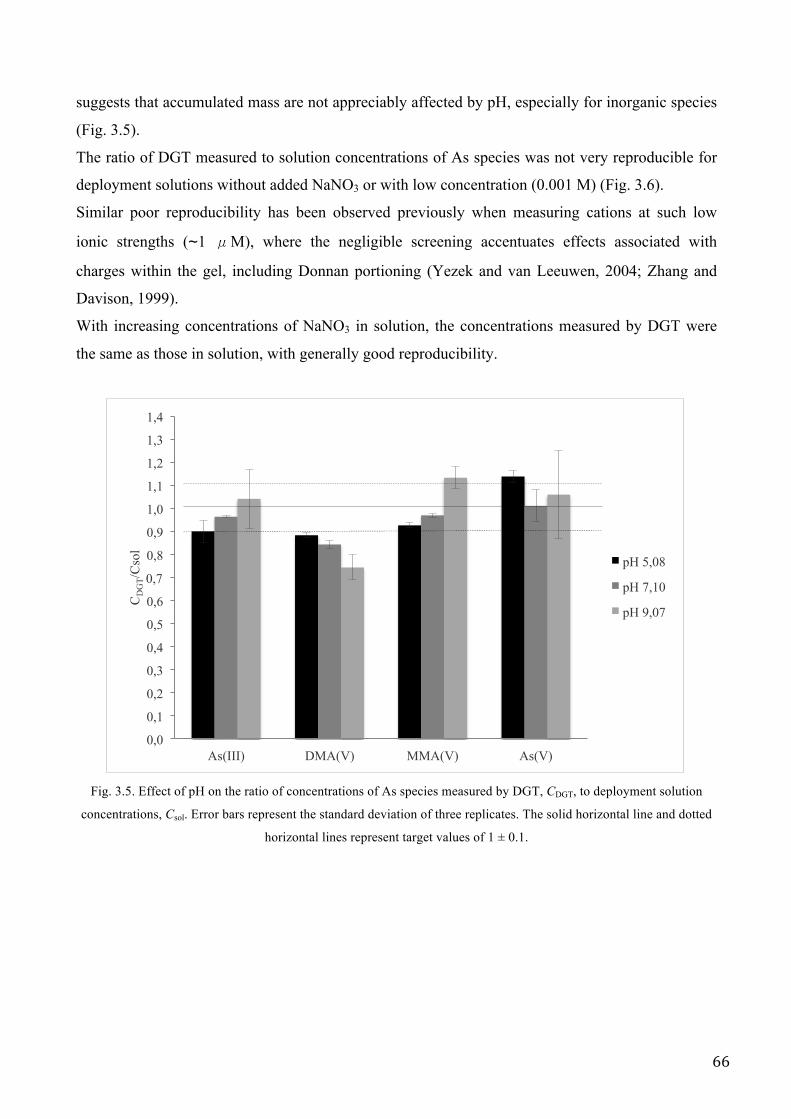
66
suggests that accumulated mass are not appreciably affected by pH, especially for inorganic species
(Fig. 3.5).
The ratio of DGT measured to solution concentrations of As species was not very reproducible for
deployment solutions without added NaNO3 or with low concentration (0.001 M) (Fig. 3.6).
Similar poor reproducibility has been observed previously when measuring cations at such low
ionic strengths (∼1 μM), where the negligible screening accentuates effects associated with
charges within the gel, including Donnan portioning (Yezek and van Leeuwen, 2004; Zhang and
Davison, 1999).
With increasing concentrations of NaNO3 in solution, the concentrations measured by DGT were
the same as those in solution, with generally good reproducibility.
Fig. 3.5. Effect of pH on the ratio of concentrations of As species measured by DGT, CDGT, to deployment solution
concentrations, Csol. Error bars represent the standard deviation of three replicates. The solid horizontal line and dotted
horizontal lines represent target values of 1 ± 0.1.
0,0
0,1
0,2
0,3
0,4
0,5
0,6
0,7
0,8
0,9
1,0
1,1
1,2
1,3
1,4
As(III) DMA(V) MMA(V) As(V)
CD
GT/
Cso
l
pH 5,08
pH 7,10
pH 9,07

67
Fig. 3.6. Effect of concentration of supporting electrolyte, NaNO3, on the ratio of concentrations measured by DGT
containing ferrihydrite gels, CDGT, to deployment solution concentrations of As species, Csol.
The inorganic arsenic species and MMA(V) were almost completely adsorbed in all solutions.
On the contrary, DMA(V) behaved erratically between matrices showing low uptake in the
synthetic solutions, expecialy without NaNO3 addition and 0.001 M NaNO3 and with different pH.
The same DMA(V) behaviour had been also observed by Osterlund et al. (2012). Moreover,
diminished uptake of DMA(V) on ferrihydrite is in agreement with results reported by Lafferty and
Loeppert (2005), which indicated weaker adsorption of DMA(V), compared with inorganic arsenic
and MMA(V). The 84 % of DMA(V) was adsorbed in a 0.01M matrix at pH 7.10, but this figure
decreased as the pH increase from 7 to 9.
The adsorption efficiency of MMA(V) is higher compared with DMA(V) under all studied
conditions. It can also be seen that pH has a larger effect on the adsorption than ionic straight.
Lafferty and Loeppert (2005) suggested that the decreased adsorption of DMA(V) to ferrihydrite
they observed between pH 7 and 8, was attributable to the point of zero charge (PZC) of the two-
line ferrihydrite at pH 8; the negatively charged surface at pH values above the PZC prevented
DMA(V) adsorption.
0,0 0,1 0,2 0,3 0,4 0,5 0,6 0,7 0,8 0,9 1,0 1,1 1,2 1,3 1,4 1,5 1,6
As(III) DMA(V) MMA(V) As(V)
CD
GT
/ Cso
l without NaNO3 add. 0.001M 0.01 M 0.1M
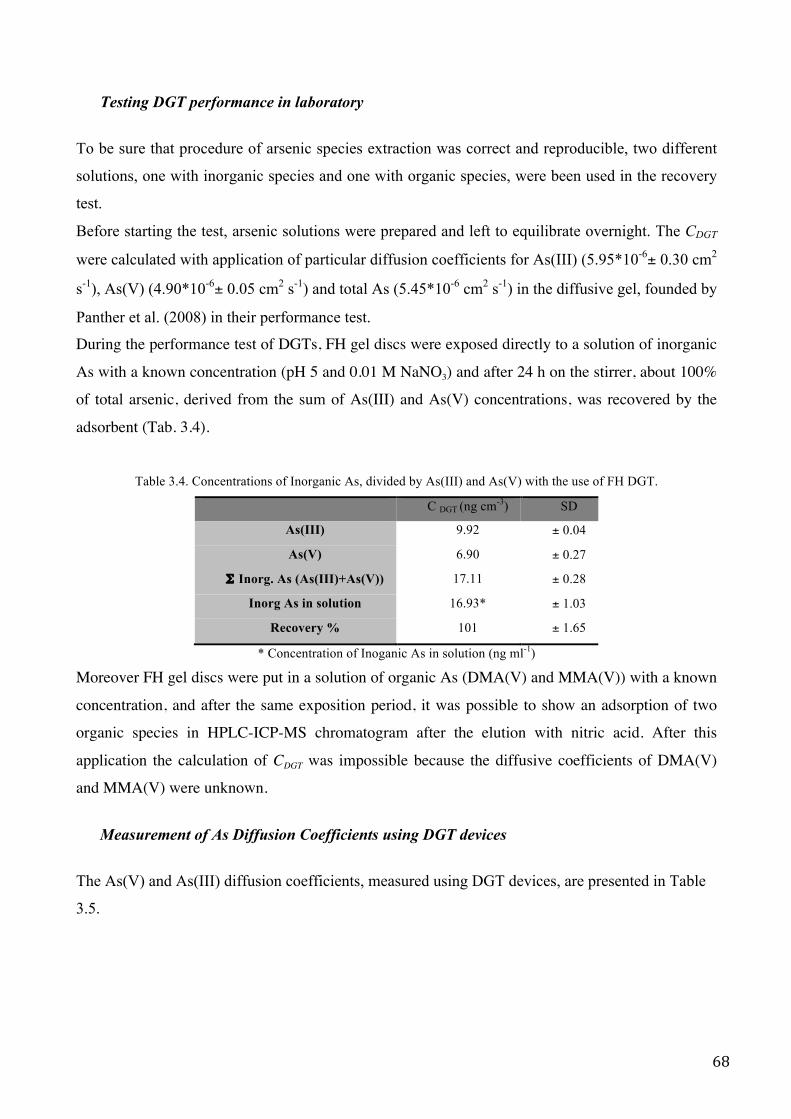
68
Testing DGT performance in laboratory
To be sure that procedure of arsenic species extraction was correct and reproducible, two different
solutions, one with inorganic species and one with organic species, were been used in the recovery
test.
Before starting the test, arsenic solutions were prepared and left to equilibrate overnight. The CDGT
were calculated with application of particular diffusion coefficients for As(III) (5.95*10-6± 0.30 cm2
s-1), As(V) (4.90*10-6± 0.05 cm2 s-1) and total As (5.45*10-6 cm2 s-1) in the diffusive gel, founded by
Panther et al. (2008) in their performance test.
During the performance test of DGTs, FH gel discs were exposed directly to a solution of inorganic
As with a known concentration (pH 5 and 0.01 M NaNO3) and after 24 h on the stirrer, about 100%
of total arsenic, derived from the sum of As(III) and As(V) concentrations, was recovered by the
adsorbent (Tab. 3.4).
Table 3.4. Concentrations of Inorganic As, divided by As(III) and As(V) with the use of FH DGT.
C DGT (ng cm-3) SD
As(III) 9.92 ± 0.04
As(V) 6.90 ± 0.27
Σ Inorg. As (As(III)+As(V)) 17.11 ± 0.28
Inorg As in solution 16.93* ± 1.03
Recovery % 101 ± 1.65
* Concentration of Inoganic As in solution (ng ml-1) Moreover FH gel discs were put in a solution of organic As (DMA(V) and MMA(V)) with a known
concentration, and after the same exposition period, it was possible to show an adsorption of two
organic species in HPLC-ICP-MS chromatogram after the elution with nitric acid. After this
application the calculation of CDGT was impossible because the diffusive coefficients of DMA(V)
and MMA(V) were unknown.
Measurement of As Diffusion Coefficients using DGT devices
The As(V) and As(III) diffusion coefficients, measured using DGT devices, are presented in Table
3.5.
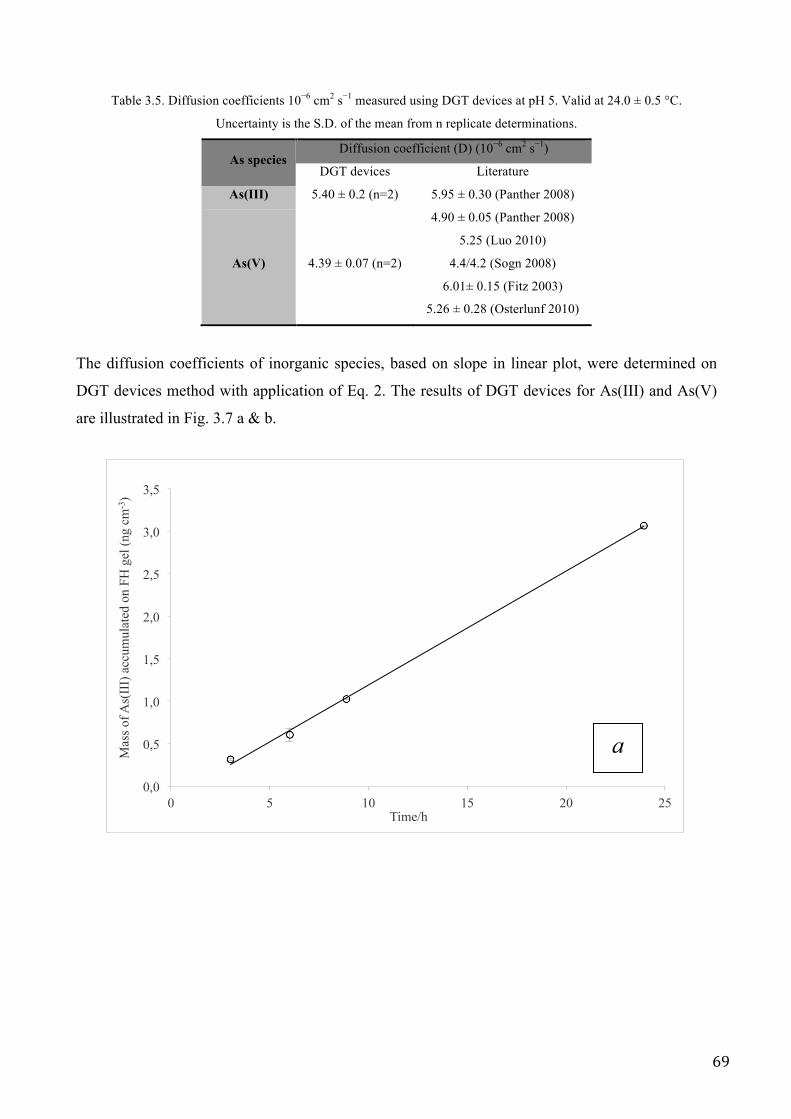
69
Table 3.5. Diffusion coefficients 10−6 cm2 s−1 measured using DGT devices at pH 5. Valid at 24.0 ± 0.5 °C.
Uncertainty is the S.D. of the mean from n replicate determinations.
As species Diffusion coefficient (D) (10−6 cm2 s−1)
DGT devices Literature
As(III) 5.40 ± 0.2 (n=2) 5.95 ± 0.30 (Panther 2008)
As(V) 4.39 ± 0.07 (n=2)
4.90 ± 0.05 (Panther 2008)
5.25 (Luo 2010)
4.4/4.2 (Sogn 2008)
6.01± 0.15 (Fitz 2003)
5.26 ± 0.28 (Osterlunf 2010)
The diffusion coefficients of inorganic species, based on slope in linear plot, were determined on
DGT devices method with application of Eq. 2. The results of DGT devices for As(III) and As(V)
are illustrated in Fig. 3.7 a & b.
0,0
0,5
1,0
1,5
2,0
2,5
3,0
3,5
0 5 10 15 20 25
Mas
s of A
s(II
I) a
ccum
ulat
ed o
n FH
gel
(ng
cm-3
)
Time/h
a
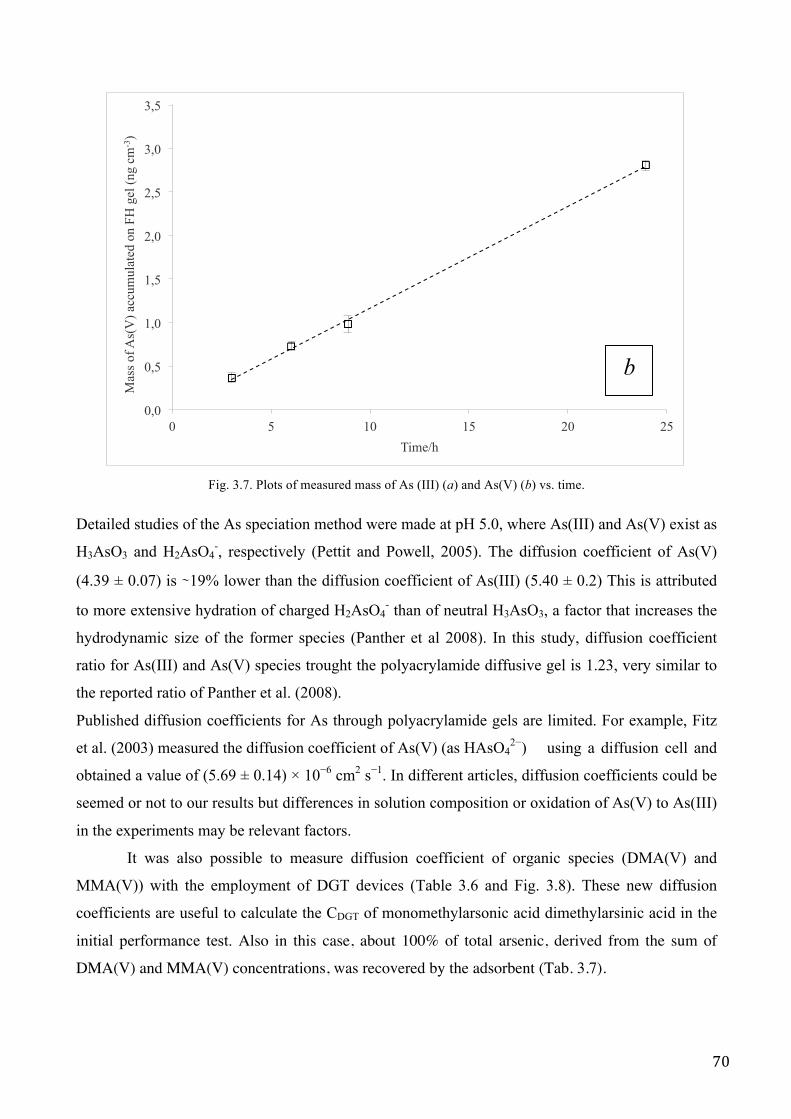
70
Fig. 3.7. Plots of measured mass of As (III) (a) and As(V) (b) vs. time.
Detailed studies of the As speciation method were made at pH 5.0, where As(III) and As(V) exist as
H3AsO3 and H2AsO4-, respectively (Pettit and Powell, 2005). The diffusion coefficient of As(V)
(4.39 ± 0.07) is ∼19% lower than the diffusion coefficient of As(III) (5.40 ± 0.2) This is attributed
to more extensive hydration of charged H2AsO4- than of neutral H3AsO3, a factor that increases the
hydrodynamic size of the former species (Panther et al 2008). In this study, diffusion coefficient
ratio for As(III) and As(V) species trought the polyacrylamide diffusive gel is 1.23, very similar to
the reported ratio of Panther et al. (2008).
Published diffusion coefficients for As through polyacrylamide gels are limited. For example, Fitz
et al. (2003) measured the diffusion coefficient of As(V) (as HAsO42−) using a diffusion cell and
obtained a value of (5.69 ± 0.14) × 10−6 cm2 s−1. In different articles, diffusion coefficients could be
seemed or not to our results but differences in solution composition or oxidation of As(V) to As(III)
in the experiments may be relevant factors.
It was also possible to measure diffusion coefficient of organic species (DMA(V) and
MMA(V)) with the employment of DGT devices (Table 3.6 and Fig. 3.8). These new diffusion
coefficients are useful to calculate the CDGT of monomethylarsonic acid dimethylarsinic acid in the
initial performance test. Also in this case, about 100% of total arsenic, derived from the sum of
DMA(V) and MMA(V) concentrations, was recovered by the adsorbent (Tab. 3.7).
0,0
0,5
1,0
1,5
2,0
2,5
3,0
3,5
0 5 10 15 20 25
Mas
s of A
s(V
) acc
umul
ated
on
FH g
el (n
g cm
-3)
Time/h
b
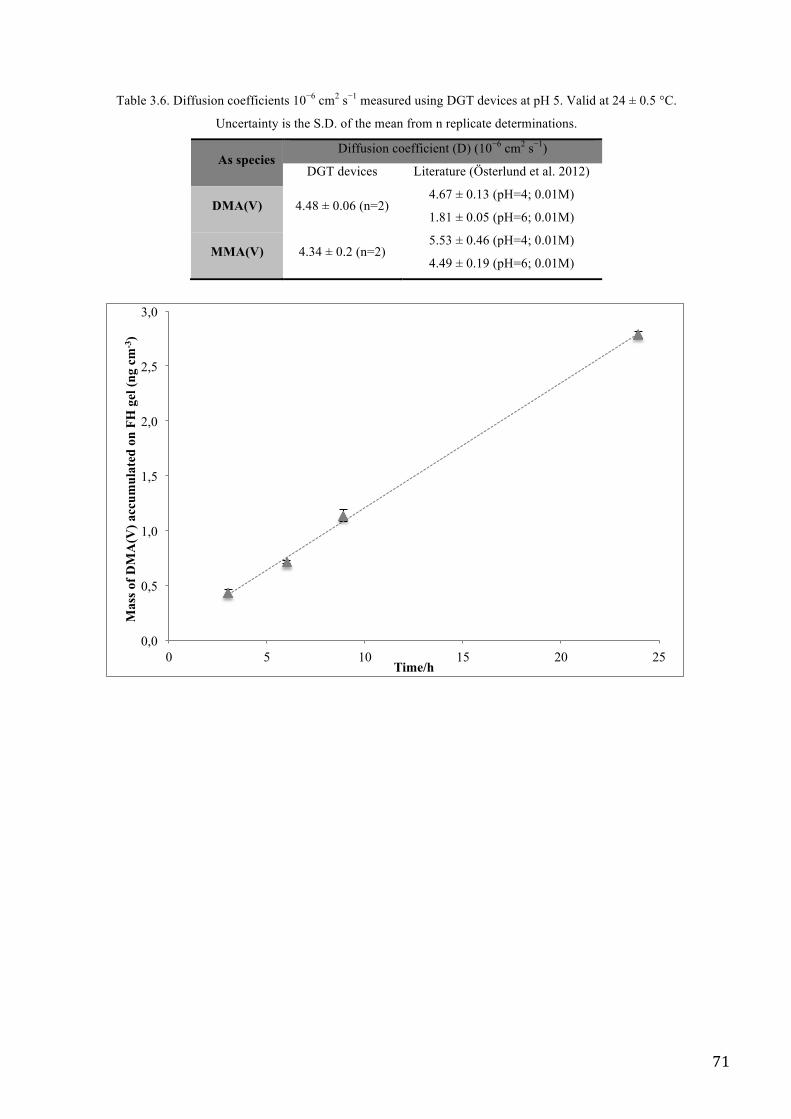
71
Table 3.6. Diffusion coefficients 10−6 cm2 s−1 measured using DGT devices at pH 5. Valid at 24 ± 0.5 °C.
Uncertainty is the S.D. of the mean from n replicate determinations.
As species Diffusion coefficient (D) (10−6 cm2 s−1)
DGT devices Literature (Österlund et al. 2012)
DMA(V) 4.48 ± 0.06 (n=2) 4.67 ± 0.13 (pH=4; 0.01M)
1.81 ± 0.05 (pH=6; 0.01M)
MMA(V) 4.34 ± 0.2 (n=2) 5.53 ± 0.46 (pH=4; 0.01M)
4.49 ± 0.19 (pH=6; 0.01M)
0,0
0,5
1,0
1,5
2,0
2,5
3,0
0 5 10 15 20 25
Mas
s of D
MA
(V) a
ccum
ulat
ed o
n FH
gel
(ng
cm-3
)
Time/h
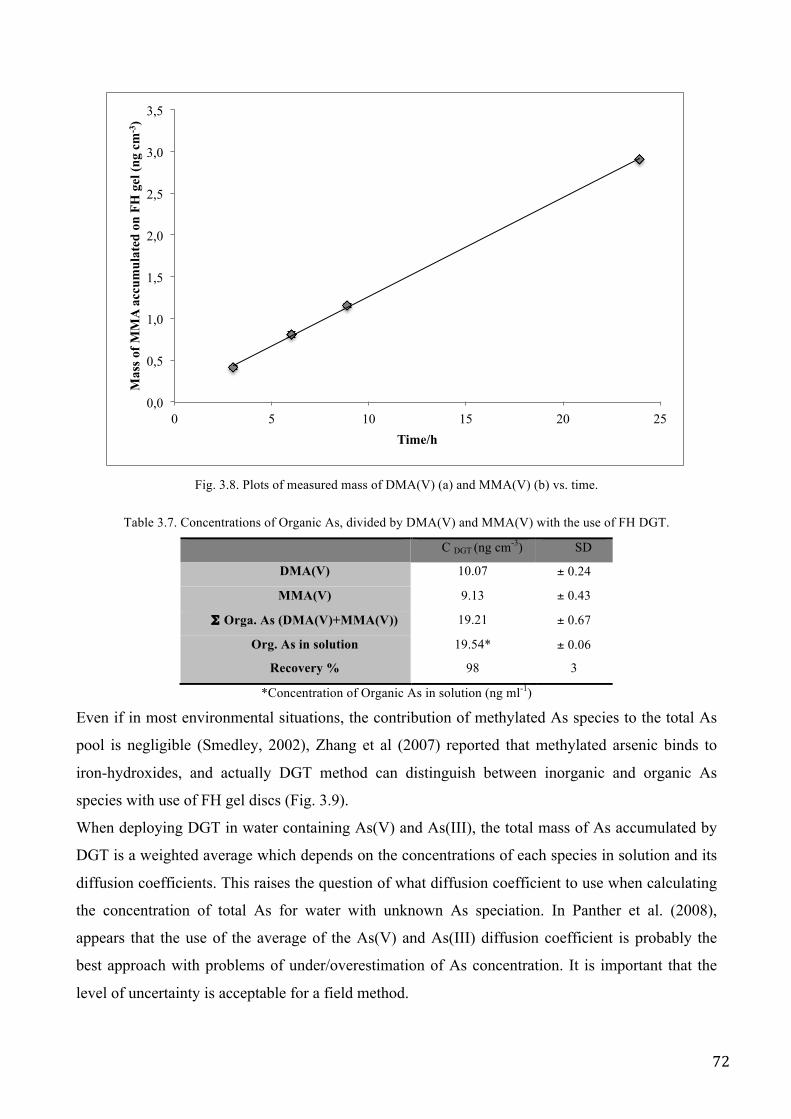
72
Fig. 3.8. Plots of measured mass of DMA(V) (a) and MMA(V) (b) vs. time.
Table 3.7. Concentrations of Organic As, divided by DMA(V) and MMA(V) with the use of FH DGT.
C DGT (ng cm-3) SD
DMA(V) 10.07 ± 0.24
MMA(V) 9.13 ± 0.43
Σ Orga. As (DMA(V)+MMA(V)) 19.21 ± 0.67
Org. As in solution 19.54* ± 0.06
Recovery % 98 3
*Concentration of Organic As in solution (ng ml-1)
Even if in most environmental situations, the contribution of methylated As species to the total As
pool is negligible (Smedley, 2002), Zhang et al (2007) reported that methylated arsenic binds to
iron-hydroxides, and actually DGT method can distinguish between inorganic and organic As
species with use of FH gel discs (Fig. 3.9).
When deploying DGT in water containing As(V) and As(III), the total mass of As accumulated by
DGT is a weighted average which depends on the concentrations of each species in solution and its
diffusion coefficients. This raises the question of what diffusion coefficient to use when calculating
the concentration of total As for water with unknown As speciation. In Panther et al. (2008),
appears that the use of the average of the As(V) and As(III) diffusion coefficient is probably the
best approach with problems of under/overestimation of As concentration. It is important that the
level of uncertainty is acceptable for a field method.
0,0
0,5
1,0
1,5
2,0
2,5
3,0
3,5
0 5 10 15 20 25
Mas
s of M
MA
acc
umul
ated
on
FH g
el (n
g cm
-3)
Time/h
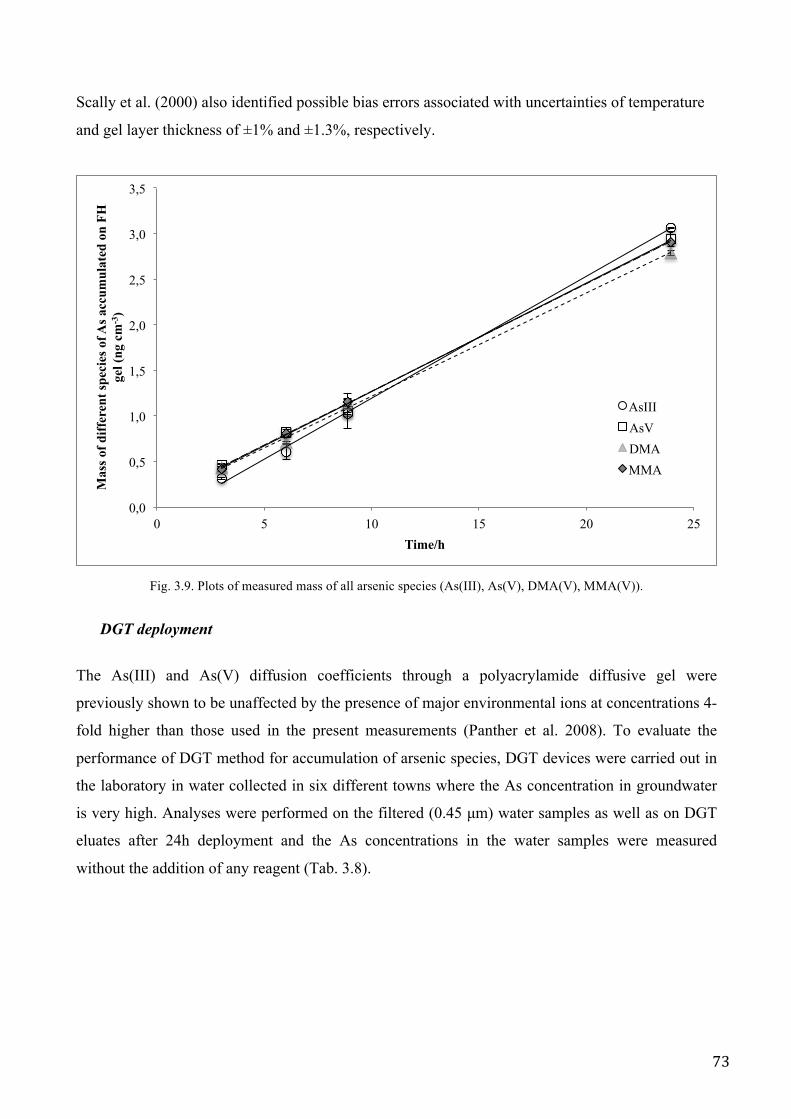
73
Scally et al. (2000) also identified possible bias errors associated with uncertainties of temperature
and gel layer thickness of ±1% and ±1.3%, respectively.
Fig. 3.9. Plots of measured mass of all arsenic species (As(III), As(V), DMA(V), MMA(V)).
DGT deployment
The As(III) and As(V) diffusion coefficients through a polyacrylamide diffusive gel were
previously shown to be unaffected by the presence of major environmental ions at concentrations 4-
fold higher than those used in the present measurements (Panther et al. 2008). To evaluate the
performance of DGT method for accumulation of arsenic species, DGT devices were carried out in
the laboratory in water collected in six different towns where the As concentration in groundwater
is very high. Analyses were performed on the filtered (0.45 µm) water samples as well as on DGT
eluates after 24h deployment and the As concentrations in the water samples were measured
without the addition of any reagent (Tab. 3.8).
0,0
0,5
1,0
1,5
2,0
2,5
3,0
3,5
0 5 10 15 20 25
Mas
s of d
iffer
ent s
peci
es o
f As a
ccum
ulat
ed o
n FH
ge
l (ng
cm
-3)
Time/h
AsIII AsV DMA MMA
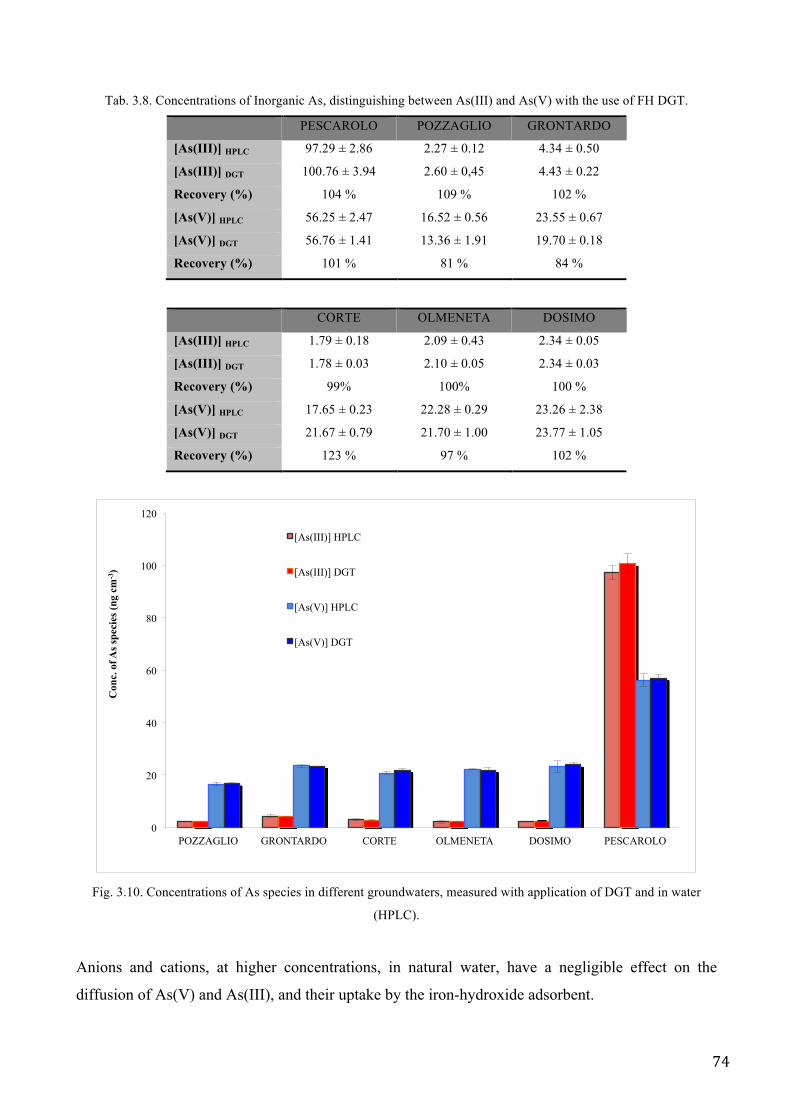
74
Tab. 3.8. Concentrations of Inorganic As, distinguishing between As(III) and As(V) with the use of FH DGT.
PESCAROLO POZZAGLIO GRONTARDO
[As(III)] HPLC 97.29 ± 2.86 2.27 ± 0.12 4.34 ± 0.50
[As(III)] DGT 100.76 ± 3.94 2.60 ± 0,45 4.43 ± 0.22
Recovery (%) 104 % 109 % 102 %
[As(V)] HPLC 56.25 ± 2.47 16.52 ± 0.56 23.55 ± 0.67
[As(V)] DGT 56.76 ± 1.41 13.36 ± 1.91 19.70 ± 0.18
Recovery (%) 101 % 81 % 84 %
CORTE OLMENETA DOSIMO
[As(III)] HPLC 1.79 ± 0.18 2.09 ± 0.43 2.34 ± 0.05
[As(III)] DGT 1.78 ± 0.03 2.10 ± 0.05 2.34 ± 0.03
Recovery (%) 99% 100% 100 %
[As(V)] HPLC 17.65 ± 0.23 22.28 ± 0.29 23.26 ± 2.38
[As(V)] DGT 21.67 ± 0.79 21.70 ± 1.00 23.77 ± 1.05
Recovery (%) 123 % 97 % 102 %
Fig. 3.10. Concentrations of As species in different groundwaters, measured with application of DGT and in water
(HPLC).
Anions and cations, at higher concentrations, in natural water, have a negligible effect on the
diffusion of As(V) and As(III), and their uptake by the iron-hydroxide adsorbent.
0
20
40
60
80
100
120
POZZAGLIO GRONTARDO CORTE OLMENETA DOSIMO PESCAROLO
Con
c. o
f As s
peci
es (n
g cm
-3)
[As(III)] HPLC
[As(III)] DGT
[As(V)] HPLC
[As(V)] DGT
75
The percentage of As(III) ranged from 9 to 16% of the total concentration in five points of
sampling. Only in one sampling point, the concentration of As(III) was about 65% the total
concentration.
Marks of DMA(V) concentrations were not found in groundwater samples. It is possible to assume
that the colloids (e.g. fulvic acids) were present in low concentration, because normally they
perform absorption action to As(III) and formation of soluble As - colloid complexes is expected to
decrease the amount of As accumulated by DGT, in this cases the As species concentration had a
good recovery in deployed DGT probes.
CONCLUSIONS It has been shown from laboratory experiments and field measurements that the ferrihydrite-DGT is
suitable for simultaneous determination of labile arsenic, over a wide pH range.
This work establishes that it is possible to use Diffusive Gradient in Thin Films in the identification
of As species. The presence of inorganic species has been well identified in DGT resin gel with the
use of HPLC-ICP-MS. The DGT method can be used in the quantitative identification of organic
species like DMA(V) and MMA(V).
Compared with other sampling methods, the major advantages of DGT include its ability to
preconcentrate the analyte (leading to lower detection limits, after extended deployment times, than
for direct measurements).
Panther et al. (2008) noted that longer deployment times, higher concentrations of competing ions,
or a change in pH could affect the reliability of the DGT measurement. Therefore diffusion
coefficients in the protective membrane filter and diffusive gel were estimated at several pH values
using a direct uptake to DGT devices. When diffusive gels were equilibrated in solutions of As
species at different ionic strengths and pH, the concentrations measured in the gels and in solution
were not significantly different (Williams, personal communication), indicating no measurable
charge effect, Donnan partitioning, or specific binding.
In groundwater samples, the presence of anions and cations, at concentrations up to 4 fold higher
than those expected in unpolluted natural water, has no significant effect on the accumulation of As
by DGT.
The results of Luo et al. (2010) suggest that for conditions likely to be encountered in natural water,
possible competition effects between the oxyanions are likely to be negligible. Ferrihydrite exhibits
a higher affinity for MMA(V) than for DMA(V) and Osterlund et al. (2012) noted that DMA(V)
was shown to be the arsenic species most affected by competition from other anions, such as sulfate
and phosphate.
76
We have shown that MMA(V) and, under some conditions, DMA(V) can accumulate on the
ferrihydrite adsorbent and can therefore contribute to the total As measured by DGT sampling.
Probably, DMA(V) could increase the total concentration of arsenic, but it is necessary to perform
further investigations about seasonal variations of arsenic speciation in groundwater.
DGT results were generally lower than the corresponding filtered (<0.45 µm) concentrations, which
is normal when complexation with colloids could be expected. The application of the appropriate
pore size DGT may allow this detection in water with humic acids. Actually As is reported to form
soluble complexes with natural organic matter such as fulvic acid (Redman et al. 2002; Lin et al.
2004; Ritter et al. 2006). Fulvic acids also adsorb to a variety of iron-hydroxides and can inhibit the
adsorption of As(V) and As(III) at the iron-hydroxide surface (Simeoni et al. 2003; Grafe et al.
2001; Redman et al. 2002).
The ability of DGT to accumulate inorganic As species in a predictable manner, opens a range of
possibilities for its use in environmental analyses. The potential applications include utilizing the
pre-concentration ability of DGT to obtain measurements of lower concentrations of As than in the
absence of a pre-concentration step, using DGT as a means of avoiding the difficulties of
preservation of sample characteristics during storage, and exploitation of the time-averaging aspect
of DGT deployments.
To facilitate accurate interpretation of DGT results under these conditions it is recommended to also
carry out arsenic speciation analysis on the water in question.
77
REFERENCES Alfaro-De la Torre MC, Beaulieu PY and A Tessier. 2000. In situ measurement of trace metals in lakewater using the
dialysis and DGT techniques. Anal. Chim. Acta. 418, 53.
Anderson LCD and KW Bruland. 1991. Biogeochemistry of arsenic in natural waters: the importance of methylated
species. Environ. Sci. Technol. 25, 420.
Bhattacharya P, Frisbie SH, Smith E, et al. 2002. Arsenic in the environment: a global perspective. In: Sarkar, B. (Ed.),
Handbook of Heavy Metals in the Environment. Marcell Dekker Inc., New York, pp. 147–215.
Brookins DG. 1988. Eh-pH Diagrams for Geochemistry. Springer-Verlag, Berlin.
Cullen WR and KJ Reimer. 1989. Arsenic speciation in the environment. Chem. Rev. 89, 713.
Dahlqvist R, Zhang H, Ingri J and W Davison. 2002. Performance of the diffusive gradients in thin films technique for
measuring Ca and Mg in freshwater. Anal. Chim. Acta. 460, 247.
Davison W, Fones G, Harper M, Teasdale P, Zhang H In J. Buffle, G. Horvai (Eds.). 2000. In Situ Monitoring of
Systems: Chemical Analysis and Speciation. John Wiley &Sons Inc., New York, p. 495.
Fitz Wj, Wenzel Ww, Zhang H, Nurmi J, Stipek K, Fischerova Z, Schweiger P, Kollensperger G, Ma Lq and G
Stingeder. 2003. Rhizosphere Characteristics of the Arsenic Hyperaccumulator Pteris vittata L. and Monitoring
of Phytoremoval Efficiency. Environ. Sci. Technol. 37, 5008-5014.
Grafe M, Eick MJ and PR Grossl. 2001. Adsorption of Arsenate (V) and Arsenite (III) on Goethite in the Presence and
Absence of Dissolved Organic Carbon. Soil Sci. Soc. Am. J. 65, 1680.
Hasegawa H, Rahman MA, Kitahara K, Itaya Y, Maki T and K Ueda. 2010. Seasonal changes of arsenic speciation in
lake waters in relation to eutrophication. Sci. Total Environ. 408, 1684.
Hasegawa H, Rahman MA, Matsuda T, Kitahara T, Maki T and K Ueda. 2009. Effect of eutrophication on the
distribution of arsenic species in eutrophic and mesotrophic lakes. Sci. Total Environ. 407, 1418.
Huang JH, G Ilgenb and P Fecher. 2010. Quantitative chemical extraction for arsenic speciation in rice grains. J. Anal.
At. Spectrom. 25, 800–802.
Jain CK and I Ali. 2000. Arsenic: occurrence, toxicity and speciation techniques. Water Res. 34, 4304–4312.
Lafferty BJ and RH Loeppert. 2005. Methyl arsenic adsorption and desorption behavior on iron oxides. Environ. Sci.
Technol. 39, 2120.
Lead JR, Davison W, Hamilton-Taylor J and J Buffle. 1997. Characterizing Colloidal Material in Natural Waters.
Aquat. Geochem. 3, 213–232.
Lin HT, Wang MC and GC Li. 2004. Complexation of arsenate with humic substance in water extract of compost.
Chemosphere. 56, 1105.
Luo J, Zhang H, Santner J, and W Davison. 2010. Performance Characteristics of Diffusive Gradients in
ThinFilmsEquipped with a Binding Gel Layer Containing Precipitated Ferrihydrite for Measuring Arsenic(V),
Selenium(VI), Vanadium(V), and Antimony(V). Anal. Chem. 82 (21), pp 8903–8909.
Ona-Nguema G, Morin G, Juillot F, Calas G and GE Brown. 2005. EXAFS Analysis of Arsenite Adsorption onto Two-
Line Ferrihydrite, Hematite, Goethite, and Lepidocrocite. Environ. Sci. Technol. 39, 9147.
Österlund H, Chlotb S, Faarinena M, Widerlundb A, Rodushkina I, Ingri J and DC Baxtera. 2010. Simultaneous
measurements of As, Mo, Sb, V and W using a ferrihydrite diffusive gradients in thinfilms (DGT) device.
Analytica Chimica Acta. 682, 59–65.
78
Österlund H, Faarinen M, Ingri J and DC Baxter. 2012. Contribution of organic arsenic species to total arsenic
measurements using ferrihydrite-backed diffusive gradients in thin films (DGT). Environmental Chemistry.
9(1) 55-62.
Panther JG, Stillwell KP, Powell KJ and AJ Downard. 2008. Development and application of the diffusive gradients in
thin films technique for the measurement of total dissolved inorganic arsenic in waters. Analytica Chimica
Acta. 622, 133–142.
Panther JG, Teasdale PR, Bennett WW, Welsh DT and H Zhao. 2011. Comparing dissolved reactive phosphorus
measured by DGT with ferrihydrite and titanium dioxide adsorbents: anionic interferences, adsorbent capacity
and deployment time. Anal. Chim. Acta. 698, 20.
Pettit L and HKJ Powell. IUPAC Stabilty Constants Database; Academic Software: Oxford. U.K. 2005.
Redman AD, Macalady DL and D Ahmann. 2002. Natural Organic Matter Affects Arsenic Speciation and Sorption
onto Hematite. Environ. Sci. Technol. 36, 2889.
Ritter K, Aiken GR, Ranville JF, Bauer M and DL Macalady. 2006. Evidence for the Aquatic Binding of Arsenate by
Natural Organic Matter−Suspended Fe(III). Environ. Sci. Technol. 40, 5380.
Simeoni MA, Batts BD and C McRae. 2003. Effect of groundwater fulvic acid on the adsorption of arsenate by
ferrihydrite and gibbsite. Appl. Geochem. 18, 1507.
Smedley PL and DG Kinniburgh. 2002. A review of the source, behaviour and distribution of arsenic in natural waters.
Appl. Geochem. 17, 517.
Sogn TA, Eich-Greatorex S, Øgaard Røyset O, Almås AF and AR Comm. 2008. Use of Diffusive Gradients in Thin
Films to Predict Potentially Bioavailable Selenium in Soil. Soil Sci. Plant Anal. 39, 587–602.
Warnken KW, Zhang H and W Davison. 2007. In situ monitoring and dynamic speciation measurements in solution
using DGT, in Passive Sampling Techniques in Environmental Monitoring (Eds R. Green- wood, Q. Mills, B.
Vrana).
WHO, 1993. Guidelines for drinking-water quality. Volume 1: Recommendations, 2nd ed. WHO, Geneva.
Wilkie JA and JG Hering. 1996. Adsorption of arsenic onto hydrous ferric oxide: effects of adsorbate/adsorbent ratios
and co-occurring solutes. Colloids Surf. A 107, 97.
Yamauchi H and BA Fowler. 1994. Toxicity and metabolism of inorganic and methylated arsenicals.In: Nriagu, J.O.
(Ed.), Arsenic in the Environment. Part II;Human Health and Ecosystem Effects. Wiley, New York.
Yan XP, Kerrich R and MJ Hendry. 2000. Distribution of arsenic(III), arsenic(V) and total inorganic arsenic in pore-
waters from a thick till and clay-rich aquitard sequence, Saskatchewan, Canada. Geochim. Cosmochim. Acta.
64, 2637–2648.
Yezek LP and HP van Leeuwen. 2004. An electrokinetic characterization of low charge density cross-linked
polyacrylamide gels. J. Colloid Interface Sci. 278, 243– 250.
Zhang H, Davison W, Gadi R and T Kobayashi. 1998. In situ measurement of dissolved phosphorus in natural waters
using DGT. Anal. Chim. Acta. 370, 29.
Zhang H and W Davison. 2000. Direct In Situ Measurements of Labile Inorganic and Organically Bound Metal Species
in Synthetic Solutions and Natural Waters Using Diffusive Gradients in Thin Films. Anal. Chem. 72, 4447–
445.
Zhang H and W Davison. 1995. Performance Characteristics of Diffusion Gradients in Thin Films for the in Situ
Measurement of Trace Metals in Aqueous Solution. Anal. Chem. 67, 3391.

79
Zhang JS, Stanforth RS and SO Pehkonen. 2007. Effect of replacing a hydroxyl group with a methyl group on arsenic
(V) species adsorption on goethite (α-FeOOH). Colloid Interface Sci. 306, 16.
Zhang H and W Davison. 1999. Diffusional characteristics of hydrogels used in DGT and DET techniques. Anal. Chim.
Acta. 398, 329–340.

80
81
Chapter IV. Speciation analysis of Antimony by
Diffusive Gradients in Thin Films (DGT) ID ICP MS.
ABSTRACT
Measurements of inorganic species of antimony (Sb) require a binding agent, like Fe-oxide
gel in DGT, EDTA, for preservation of different species, HPLC ICP MS, like analytical technique
with anionic exchange column. Here, we report for the first time detailed performance
characteristics of the Fe-oxide gel and associated DGT devices obtained by deployment in known
solutions of trivalent and pentavalent Sb. The diffusion coefficients for each chemical forms were
determined using an independent diffusion cell. Theoretical responses were obtained with studies in
different ionic strength (from deionized water to 0.1 M NaNO3) and pH (5-9). The potential
capability for simultaneously measuring labile forms of antimony in acidic to neutral, fresh to
brackish waters was demonstrated. Speciation analysis of Sb(III) and Sb(V) in aqueous samples was
performed through extraction from DGT resin after deployment and on-line isotope dilution
concentration determination after a chromatographic separation. The separation of Sb(III) and
Sb(V) was achieved using an anion exchange column and 10 mmol L−1 EDTA and 1 mmol L−1
phthalic acid at pH 4.5 as a mobile phase.
The eluent from the HPLC was mixed with an enriched 123Sb spike solution that was pumped by a
peristaltic pump with a constant flow rate (0.04 mL min−1) in a three-way valve.
Keywords: trivalent and pentavalent antimony, Diffusive Gradient in Thin Film, HPLC-ICP-MS,
water, isotopic dilution.
INTRODUCTION Antimony (Sb) is considered to be a nonessential element in plants, animals or humans (Iffland,
1988; Filella et al. 2002). Sb and its compounds have been listed as priority pollutants by the US
Environmental Protection Agency of the United States and the European Union (USEPA, 1979; Dir
98/83/EC).
Antimony belongs to the subgroup 15 of the table of the elements. Its concentrations are much
higher in natural geothermal systems, where they can range from 500 mg L-1 up to 10 wt %.
(Ritchie, 1961; Weissberg et al., 1979; Kolpakova, 1982; Stauffer and Thompson, 1984). Probably
due to its lower abundance and the relative insolubility of most of its compounds, this is usually
overlooked as an element of environmental concern and its study has been largely neglected.
82
Most of the analytical methods for antimony assessment are based on the determination of total
antimony concentrations. However, it is widely accepted that the impact of a toxic element on the
environment cannot be assessed by measuring only its total concentration, and environmental risks
linked to the presence of antimony depend to a great extent on the chemical form present.
The majority of speciation analysis techniques consist of three steps: sample preparation, separation
of different species, and determination of the separated species. Sample preparation is one of the
most critical steps of the analytical speciation procedure,
The development of highly sensitive coupled techniques to identify and/or to quantify one or more
Sb species has opened up an increasingly attractive research area for elucidating the fate of Sb
among the different environmental compartments. Most commonly employed analytical techniques
for the separation and detection of antimony species are the on-line coupling of high-performance
liquid chromatography to powerful element specific detectors like ICP-MS (Lintschinger et al.
1997; Lintschinger et al. 1998; Lindemann et al. 2000; Zheng et al. 2000; Zheng et al. 2001;
Krachler and Emons, 2001). Much attention has been focused on chromatographic methods,
especially HPLC, with different separation mechanisms and different detection methods. The
coupling of chromatographic techniques with element-specific detection allows simultaneous
separation and determination of Sb(III) and Sb(V) in one step.
In antimony compounds, the most common oxidation states are 5, 3, and -3. It exists mainly as
Sb(III) and Sb(V) in environmental, biological, and geochemical samples.
However, as with other elements, the toxicological and physiological behaviour of antimony
depends on its oxidation state, the presence of binding partners and potential ligands, and on the
solubility of the Sb compound. Elemental Sb is more toxic than its salts and generally trivalent Sb
compounds exert a 10 times higher acute toxicity than pentavalent Sb species.
The physical and chemical qualities of Sb and As are similar. In the past, these two elements and
their compounds were often determined together. As first pointed out by Pauling (1933), the
coordination of Sb(V) with oxygen is quite different from that of As(V). Based on its larger ionic
radius and lower charge density, this author suggested that antimony should be octahedrally
coordinated with oxygen and its compounds rather than tetrahedrally like As(V) is. Moreover, there
is evidence that antimony (in contrast to arsenic) is not detoxified via methylation in mammals, but
it still remains unclear which mechanism is responsible for antimony's genotoxicity. Coupled
techniques based on the combination of a separation method with a suitable element adsorption
system have become reliable in speciation analysis to discriminate specific forms of an element.
83
We report the first investigation of use of Fe-oxide gels in Diffusive Gradient in Thin Films (DGT)
for incorporation of inorganic chemical forms of antimony, especially Sb(III), coupled with HPLC-
ICP-MS.
An important feature of an HPLC-ICP-MS system is the capability of the system to perform isotope
ratio measurements and consequently isotope dilution mass spectrometry due to the mass-specific
detection system (Hill et al.1993). The quantification is based on the determination of the isotope
ratio of at least two isotopes of an element in the sample after spiking with an enriched analyte
isotope. Since only isotope ratios instead of absolute intensities are used for the concentration
calculation, variations in the intensities due to matrix effects have less influence on the accuracy of
analytical results compared with conventional calibration strategies.
In this work we developed an analytical chemical procedure based on the above capability of using
HPLC-ID-ICP-MS to separate and determine Sb(III) and Sb(V) in aqueous samples and Fe-oxide
resins from DGT devices application.
The DGT technique is based on a simple device, which accumulates solutes on a binding agent after
passage through a hydrogel, which acts as a well-defined diffusion layer. It relies on the
establishment of a steady-state concentration gradient from solution to the binding agent (Davison
and Zhang, 1994). Concentration in solution is calculated using Fick's first law of diffusion and the
measured mass of solutes accumulated on the binding agent after a known deployment time. These
applications are a promising preservation procedure and they have the benefit of eliminating the risk
of speciation changes due to transportation and storage of water samples prior to preparation and
analysis. Actually the other difficulty encountered with Sb speciation analysis is the oxidation of
Sb(III) to Sb(V).
Use of DGTs is useful because species stability in the samples is an important issue, since natural
environmental samples are not usually analysed immediately after sampling and long-term storage
can produce a significant alteration of the chemical species.
New data on the diffusion coefficients of Sb(V) and the first data on diffusion coefficient for Sb(III)
in the diffusive gels are provided to allow accurate calculation of DGT measured concentrations.
MATERIALS AND METHODS
Solutions
Stock solutions of antimony species (1000 mg L−1 for Sb) were prepared by antimony (III)
potassium tartrate hemihydrate (C4H4KO7Sb · ½H2O), potassium hexahydroxoantimonate
(KSb(OH)6) from Carlo Erba Reagents. The standard solutions of antimony species were used by
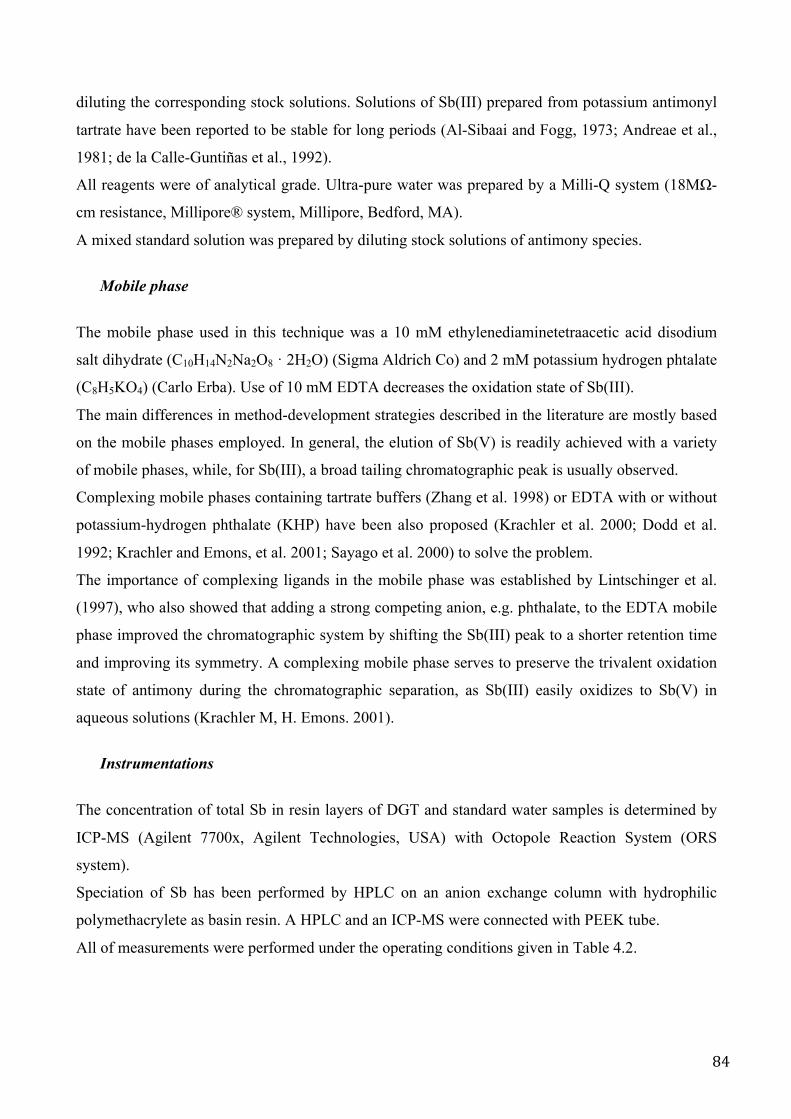
84
diluting the corresponding stock solutions. Solutions of Sb(III) prepared from potassium antimonyl
tartrate have been reported to be stable for long periods (Al-Sibaai and Fogg, 1973; Andreae et al.,
1981; de la Calle-Guntiñas et al., 1992).
All reagents were of analytical grade. Ultra-pure water was prepared by a Milli-Q system (18MΩ-
cm resistance, Millipore® system, Millipore, Bedford, MA).
A mixed standard solution was prepared by diluting stock solutions of antimony species.
Mobile phase
The mobile phase used in this technique was a 10 mM ethylenediaminetetraacetic acid disodium
salt dihydrate (C10H14N2Na2O8 · 2H2O) (Sigma Aldrich Co) and 2 mM potassium hydrogen phtalate
(C8H5KO4) (Carlo Erba). Use of 10 mM EDTA decreases the oxidation state of Sb(III).
The main differences in method-development strategies described in the literature are mostly based
on the mobile phases employed. In general, the elution of Sb(V) is readily achieved with a variety
of mobile phases, while, for Sb(III), a broad tailing chromatographic peak is usually observed.
Complexing mobile phases containing tartrate buffers (Zhang et al. 1998) or EDTA with or without
potassium-hydrogen phthalate (KHP) have been also proposed (Krachler et al. 2000; Dodd et al.
1992; Krachler and Emons, et al. 2001; Sayago et al. 2000) to solve the problem.
The importance of complexing ligands in the mobile phase was established by Lintschinger et al.
(1997), who also showed that adding a strong competing anion, e.g. phthalate, to the EDTA mobile
phase improved the chromatographic system by shifting the Sb(III) peak to a shorter retention time
and improving its symmetry. A complexing mobile phase serves to preserve the trivalent oxidation
state of antimony during the chromatographic separation, as Sb(III) easily oxidizes to Sb(V) in
aqueous solutions (Krachler M, H. Emons. 2001).
Instrumentations
The concentration of total Sb in resin layers of DGT and standard water samples is determined by
ICP-MS (Agilent 7700x, Agilent Technologies, USA) with Octopole Reaction System (ORS
system).
Speciation of Sb has been performed by HPLC on an anion exchange column with hydrophilic
polymethacrylete as basin resin. A HPLC and an ICP-MS were connected with PEEK tube.
All of measurements were performed under the operating conditions given in Table 4.2.
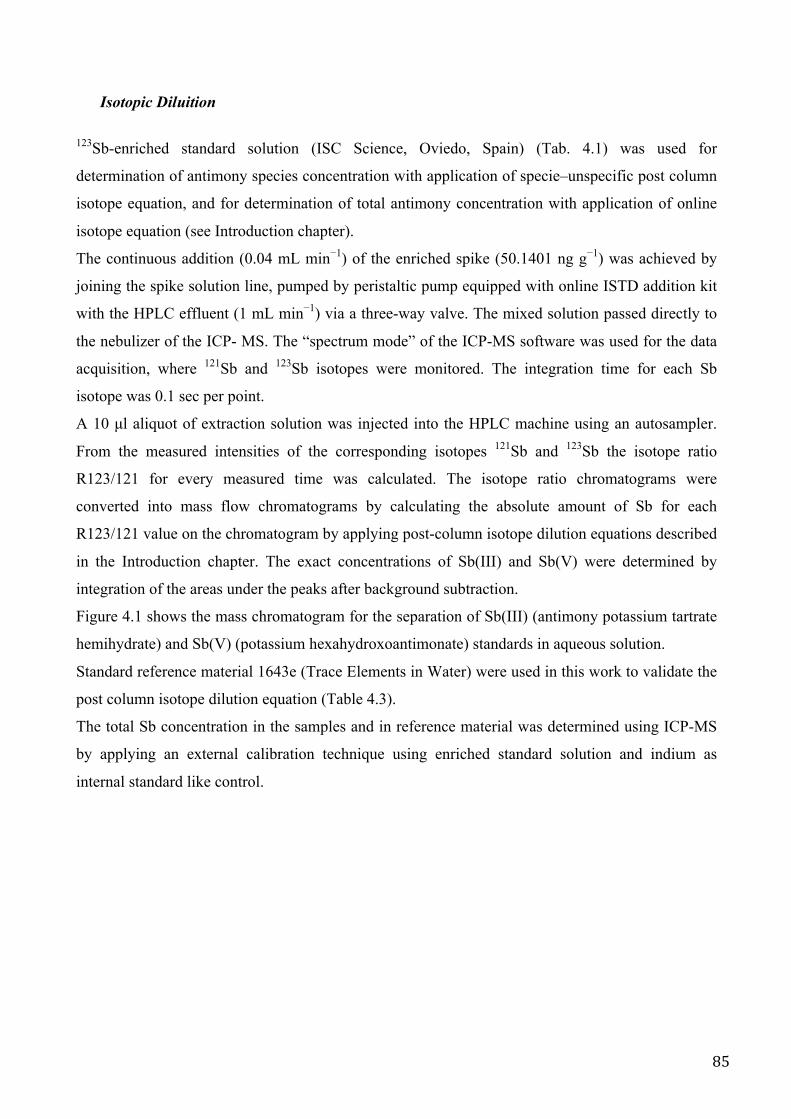
85
Isotopic Diluition
123Sb-enriched standard solution (ISC Science, Oviedo, Spain) (Tab. 4.1) was used for
determination of antimony species concentration with application of specie–unspecific post column
isotope equation, and for determination of total antimony concentration with application of online
isotope equation (see Introduction chapter).
The continuous addition (0.04 mL min−1) of the enriched spike (50.1401 ng g−1) was achieved by
joining the spike solution line, pumped by peristaltic pump equipped with online ISTD addition kit
with the HPLC effluent (1 mL min−1) via a three-way valve. The mixed solution passed directly to
the nebulizer of the ICP- MS. The “spectrum mode” of the ICP-MS software was used for the data
acquisition, where 121Sb and 123Sb isotopes were monitored. The integration time for each Sb
isotope was 0.1 sec per point.
A 10 µl aliquot of extraction solution was injected into the HPLC machine using an autosampler.
From the measured intensities of the corresponding isotopes 121Sb and 123Sb the isotope ratio
R123/121 for every measured time was calculated. The isotope ratio chromatograms were
converted into mass flow chromatograms by calculating the absolute amount of Sb for each
R123/121 value on the chromatogram by applying post-column isotope dilution equations described
in the Introduction chapter. The exact concentrations of Sb(III) and Sb(V) were determined by
integration of the areas under the peaks after background subtraction.
Figure 4.1 shows the mass chromatogram for the separation of Sb(III) (antimony potassium tartrate
hemihydrate) and Sb(V) (potassium hexahydroxoantimonate) standards in aqueous solution.
Standard reference material 1643e (Trace Elements in Water) were used in this work to validate the
post column isotope dilution equation (Table 4.3).
The total Sb concentration in the samples and in reference material was determined using ICP-MS
by applying an external calibration technique using enriched standard solution and indium as
internal standard like control.
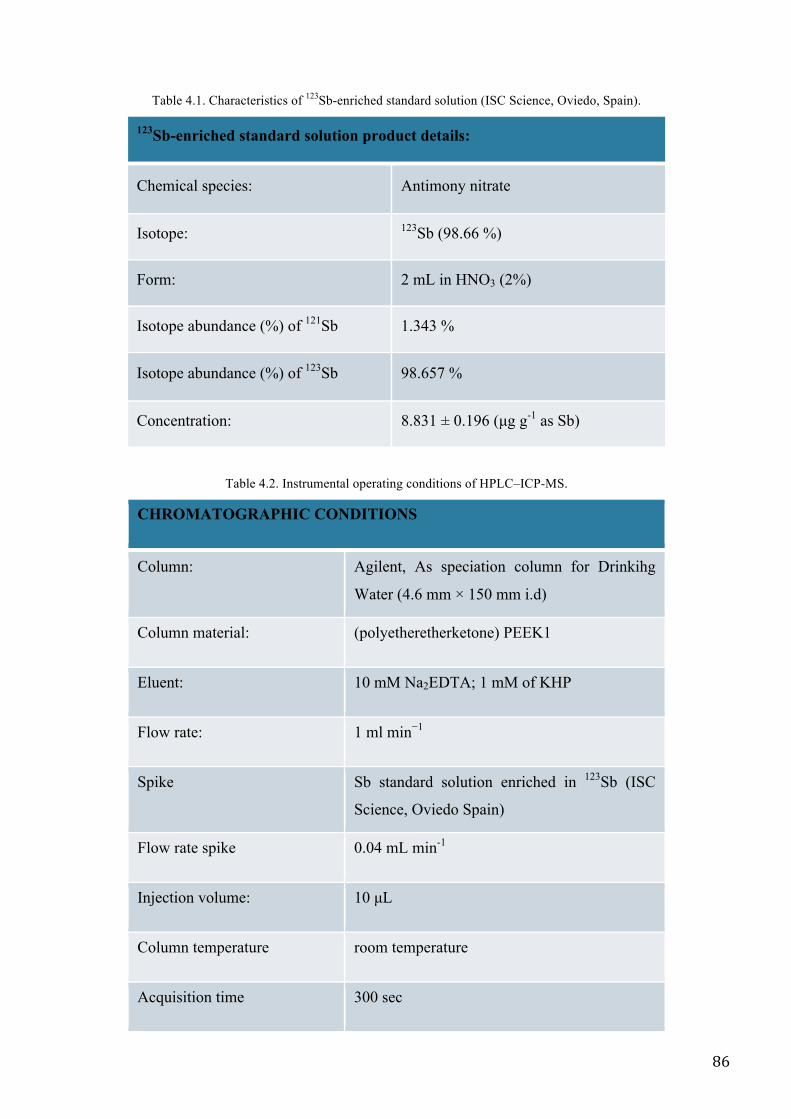
86
Table 4.1. Characteristics of 123Sb-enriched standard solution (ISC Science, Oviedo, Spain).
123Sb-enriched standard solution product details:
Chemical species: Antimony nitrate
Isotope: 123Sb (98.66 %)
Form: 2 mL in HNO3 (2%)
Isotope abundance (%) of 121Sb 1.343 %
Isotope abundance (%) of 123Sb 98.657 %
Concentration: 8.831 ± 0.196 (µg g-1 as Sb)
Table 4.2. Instrumental operating conditions of HPLC–ICP-MS.
CHROMATOGRAPHIC CONDITIONS
Column: Agilent, As speciation column for Drinkihg
Water (4.6 mm × 150 mm i.d)
Column material: (polyetheretherketone) PEEK1
Eluent: 10 mM Na2EDTA; 1 mM of KHP
Flow rate: 1 ml min−1
Spike Sb standard solution enriched in 123Sb (ISC
Science, Oviedo Spain)
Flow rate spike 0.04 mL min-1
Injection volume: 10 µL
Column temperature room temperature
Acquisition time 300 sec
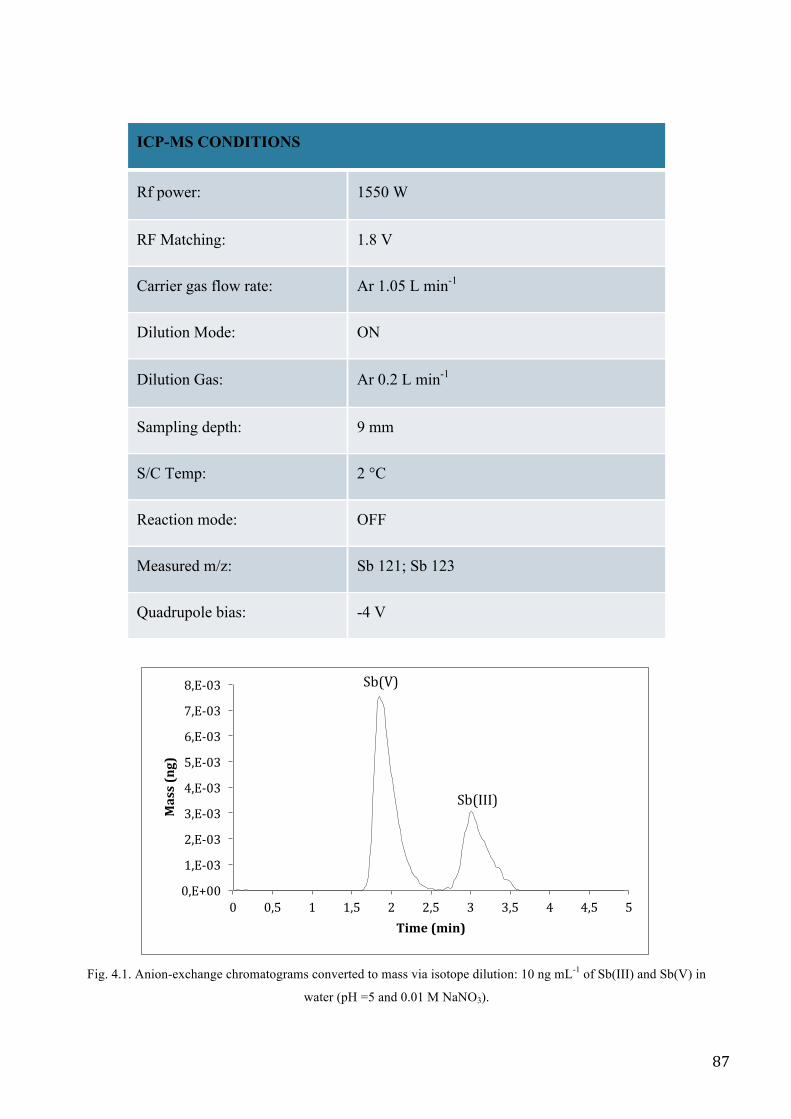
87
ICP-MS CONDITIONS
Rf power: 1550 W
RF Matching: 1.8 V
Carrier gas flow rate: Ar 1.05 L min-1
Dilution Mode: ON
Dilution Gas: Ar 0.2 L min-1
Sampling depth: 9 mm
S/C Temp: 2 °C
Reaction mode: OFF
Measured m/z: Sb 121; Sb 123
Quadrupole bias: -4 V
Fig. 4.1. Anion-exchange chromatograms converted to mass via isotope dilution: 10 ng mL-1 of Sb(III) and Sb(V) in
water (pH =5 and 0.01 M NaNO3).
0,E+00
1,E-‐03
2,E-‐03
3,E-‐03
4,E-‐03
5,E-‐03
6,E-‐03
7,E-‐03
8,E-‐03
0 0,5 1 1,5 2 2,5 3 3,5 4 4,5 5
Mass (ng)
Time (min)
Sb(V)
Sb(III)
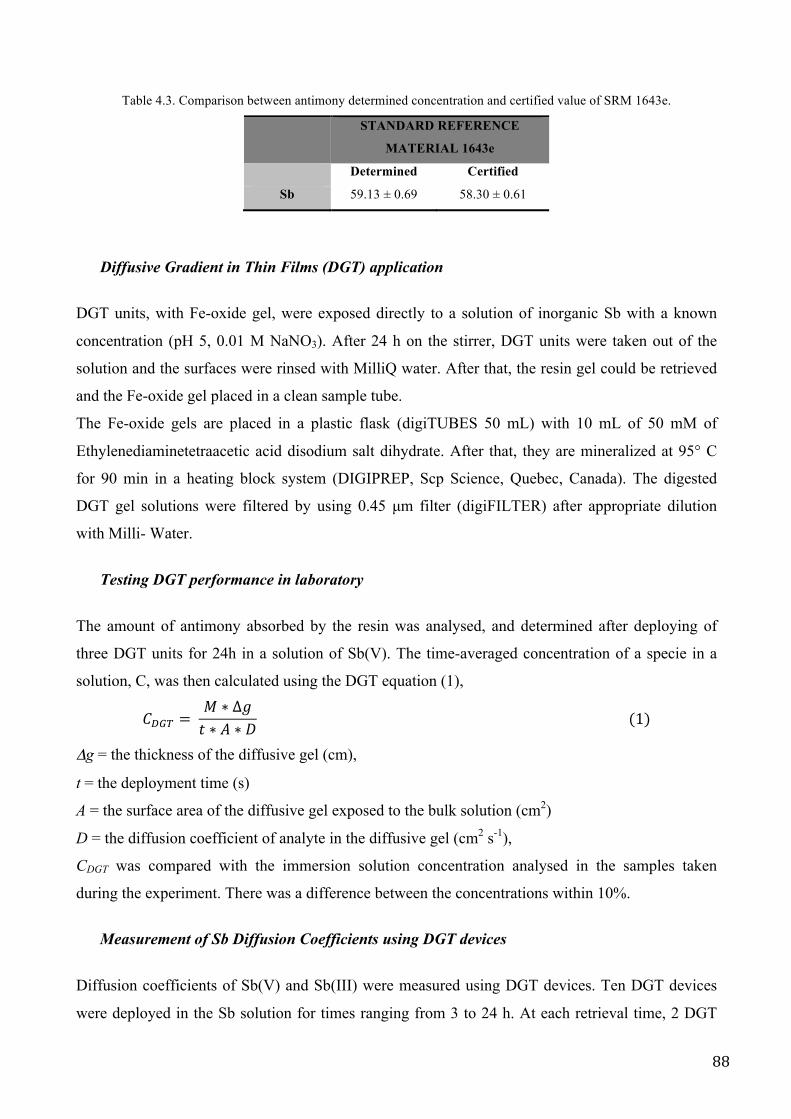
88
Table 4.3. Comparison between antimony determined concentration and certified value of SRM 1643e.
STANDARD REFERENCE
MATERIAL 1643e
Determined Certified
Sb 59.13 ± 0.69 58.30 ± 0.61
Diffusive Gradient in Thin Films (DGT) application
DGT units, with Fe-oxide gel, were exposed directly to a solution of inorganic Sb with a known
concentration (pH 5, 0.01 M NaNO3). After 24 h on the stirrer, DGT units were taken out of the
solution and the surfaces were rinsed with MilliQ water. After that, the resin gel could be retrieved
and the Fe-oxide gel placed in a clean sample tube.
The Fe-oxide gels are placed in a plastic flask (digiTUBES 50 mL) with 10 mL of 50 mM of
Ethylenediaminetetraacetic acid disodium salt dihydrate. After that, they are mineralized at 95° C
for 90 min in a heating block system (DIGIPREP, Scp Science, Quebec, Canada). The digested
DGT gel solutions were filtered by using 0.45 µm filter (digiFILTER) after appropriate dilution
with Milli- Water.
Testing DGT performance in laboratory
The amount of antimony absorbed by the resin was analysed, and determined after deploying of
three DGT units for 24h in a solution of Sb(V). The time-averaged concentration of a specie in a
solution, C, was then calculated using the DGT equation (1),
!!"# = ! ∗ ∆!! ∗ ! ∗ ! (1)
Δg = the thickness of the diffusive gel (cm),
t = the deployment time (s)
A = the surface area of the diffusive gel exposed to the bulk solution (cm2)
D = the diffusion coefficient of analyte in the diffusive gel (cm2 s-1),
CDGT was compared with the immersion solution concentration analysed in the samples taken
during the experiment. There was a difference between the concentrations within 10%.
Measurement of Sb Diffusion Coefficients using DGT devices
Diffusion coefficients of Sb(V) and Sb(III) were measured using DGT devices. Ten DGT devices
were deployed in the Sb solution for times ranging from 3 to 24 h. At each retrieval time, 2 DGT
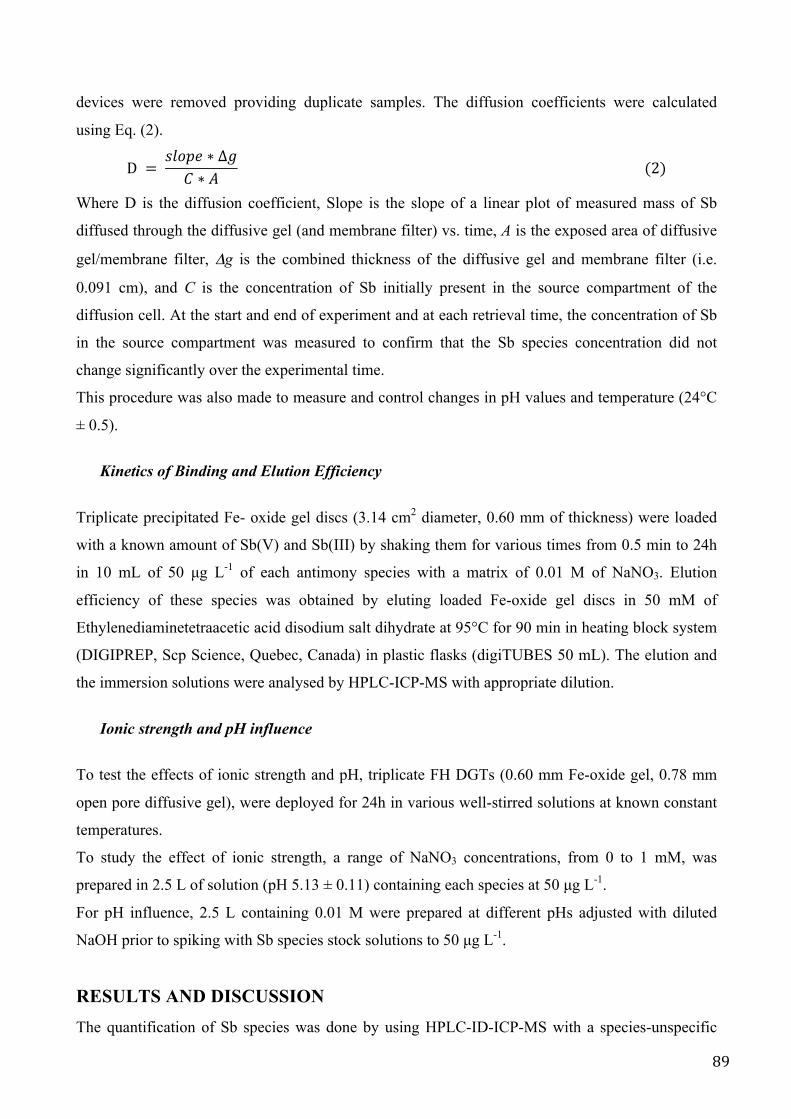
89
devices were removed providing duplicate samples. The diffusion coefficients were calculated
using Eq. (2).
D = !"#$% ∗ ∆!! ∗ ! (2)
Where D is the diffusion coefficient, Slope is the slope of a linear plot of measured mass of Sb
diffused through the diffusive gel (and membrane filter) vs. time, A is the exposed area of diffusive
gel/membrane filter, Δg is the combined thickness of the diffusive gel and membrane filter (i.e.
0.091 cm), and C is the concentration of Sb initially present in the source compartment of the
diffusion cell. At the start and end of experiment and at each retrieval time, the concentration of Sb
in the source compartment was measured to confirm that the Sb species concentration did not
change significantly over the experimental time.
This procedure was also made to measure and control changes in pH values and temperature (24°C
± 0.5).
Kinetics of Binding and Elution Efficiency
Triplicate precipitated Fe- oxide gel discs (3.14 cm2 diameter, 0.60 mm of thickness) were loaded
with a known amount of Sb(V) and Sb(III) by shaking them for various times from 0.5 min to 24h
in 10 mL of 50 µg L-1 of each antimony species with a matrix of 0.01 M of NaNO3. Elution
efficiency of these species was obtained by eluting loaded Fe-oxide gel discs in 50 mM of
Ethylenediaminetetraacetic acid disodium salt dihydrate at 95°C for 90 min in heating block system
(DIGIPREP, Scp Science, Quebec, Canada) in plastic flasks (digiTUBES 50 mL). The elution and
the immersion solutions were analysed by HPLC-ICP-MS with appropriate dilution.
Ionic strength and pH influence
To test the effects of ionic strength and pH, triplicate FH DGTs (0.60 mm Fe-oxide gel, 0.78 mm
open pore diffusive gel), were deployed for 24h in various well-stirred solutions at known constant
temperatures.
To study the effect of ionic strength, a range of NaNO3 concentrations, from 0 to 1 mM, was
prepared in 2.5 L of solution (pH 5.13 ± 0.11) containing each species at 50 µg L-1.
For pH influence, 2.5 L containing 0.01 M were prepared at different pHs adjusted with diluted
NaOH prior to spiking with Sb species stock solutions to 50 µg L-1.
RESULTS AND DISCUSSION The quantification of Sb species was done by using HPLC-ID-ICP-MS with a species-unspecific
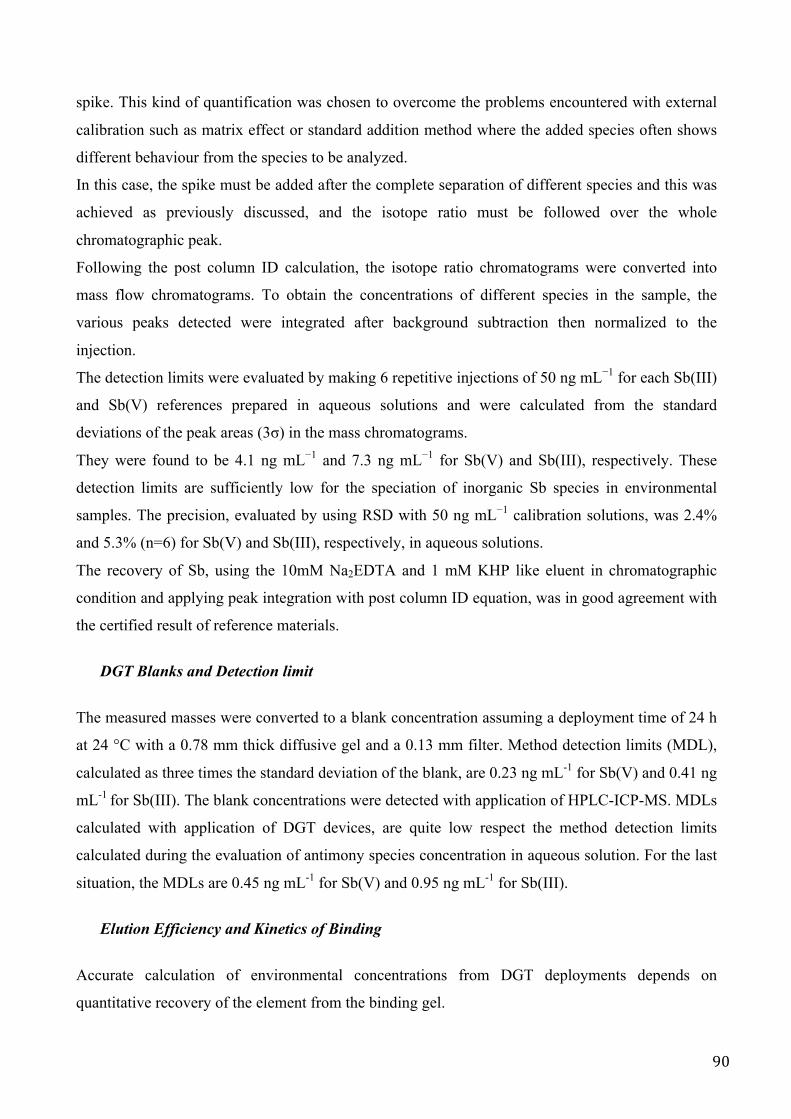
90
spike. This kind of quantification was chosen to overcome the problems encountered with external
calibration such as matrix effect or standard addition method where the added species often shows
different behaviour from the species to be analyzed.
In this case, the spike must be added after the complete separation of different species and this was
achieved as previously discussed, and the isotope ratio must be followed over the whole
chromatographic peak.
Following the post column ID calculation, the isotope ratio chromatograms were converted into
mass flow chromatograms. To obtain the concentrations of different species in the sample, the
various peaks detected were integrated after background subtraction then normalized to the
injection.
The detection limits were evaluated by making 6 repetitive injections of 50 ng mL−1 for each Sb(III)
and Sb(V) references prepared in aqueous solutions and were calculated from the standard
deviations of the peak areas (3σ) in the mass chromatograms.
They were found to be 4.1 ng mL−1 and 7.3 ng mL−1 for Sb(V) and Sb(III), respectively. These
detection limits are sufficiently low for the speciation of inorganic Sb species in environmental
samples. The precision, evaluated by using RSD with 50 ng mL−1 calibration solutions, was 2.4%
and 5.3% (n=6) for Sb(V) and Sb(III), respectively, in aqueous solutions.
The recovery of Sb, using the 10mM Na2EDTA and 1 mM KHP like eluent in chromatographic
condition and applying peak integration with post column ID equation, was in good agreement with
the certified result of reference materials.
DGT Blanks and Detection limit
The measured masses were converted to a blank concentration assuming a deployment time of 24 h
at 24 °C with a 0.78 mm thick diffusive gel and a 0.13 mm filter. Method detection limits (MDL),
calculated as three times the standard deviation of the blank, are 0.23 ng mL-1 for Sb(V) and 0.41 ng
mL-1 for Sb(III). The blank concentrations were detected with application of HPLC-ICP-MS. MDLs
calculated with application of DGT devices, are quite low respect the method detection limits
calculated during the evaluation of antimony species concentration in aqueous solution. For the last
situation, the MDLs are 0.45 ng mL-1 for Sb(V) and 0.95 ng mL-1 for Sb(III).
Elution Efficiency and Kinetics of Binding
Accurate calculation of environmental concentrations from DGT deployments depends on
quantitative recovery of the element from the binding gel.
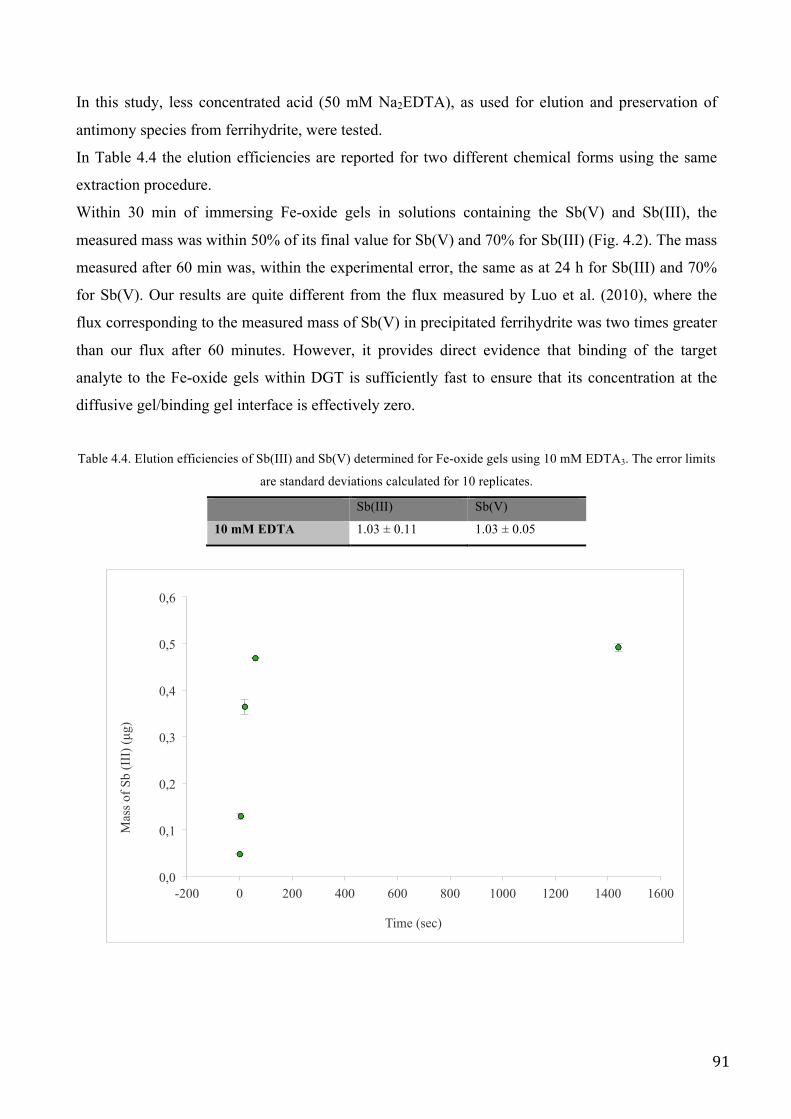
91
In this study, less concentrated acid (50 mM Na2EDTA), as used for elution and preservation of
antimony species from ferrihydrite, were tested.
In Table 4.4 the elution efficiencies are reported for two different chemical forms using the same
extraction procedure.
Within 30 min of immersing Fe-oxide gels in solutions containing the Sb(V) and Sb(III), the
measured mass was within 50% of its final value for Sb(V) and 70% for Sb(III) (Fig. 4.2). The mass
measured after 60 min was, within the experimental error, the same as at 24 h for Sb(III) and 70%
for Sb(V). Our results are quite different from the flux measured by Luo et al. (2010), where the
flux corresponding to the measured mass of Sb(V) in precipitated ferrihydrite was two times greater
than our flux after 60 minutes. However, it provides direct evidence that binding of the target
analyte to the Fe-oxide gels within DGT is sufficiently fast to ensure that its concentration at the
diffusive gel/binding gel interface is effectively zero.
Table 4.4. Elution efficiencies of Sb(III) and Sb(V) determined for Fe-oxide gels using 10 mM EDTA3. The error limits
are standard deviations calculated for 10 replicates.
Sb(III) Sb(V)
10 mM EDTA 1.03 ± 0.11 1.03 ± 0.05
0,0
0,1
0,2
0,3
0,4
0,5
0,6
-200 0 200 400 600 800 1000 1200 1400 1600
Mas
s of S
b (I
II) (
µg)
Time (sec)
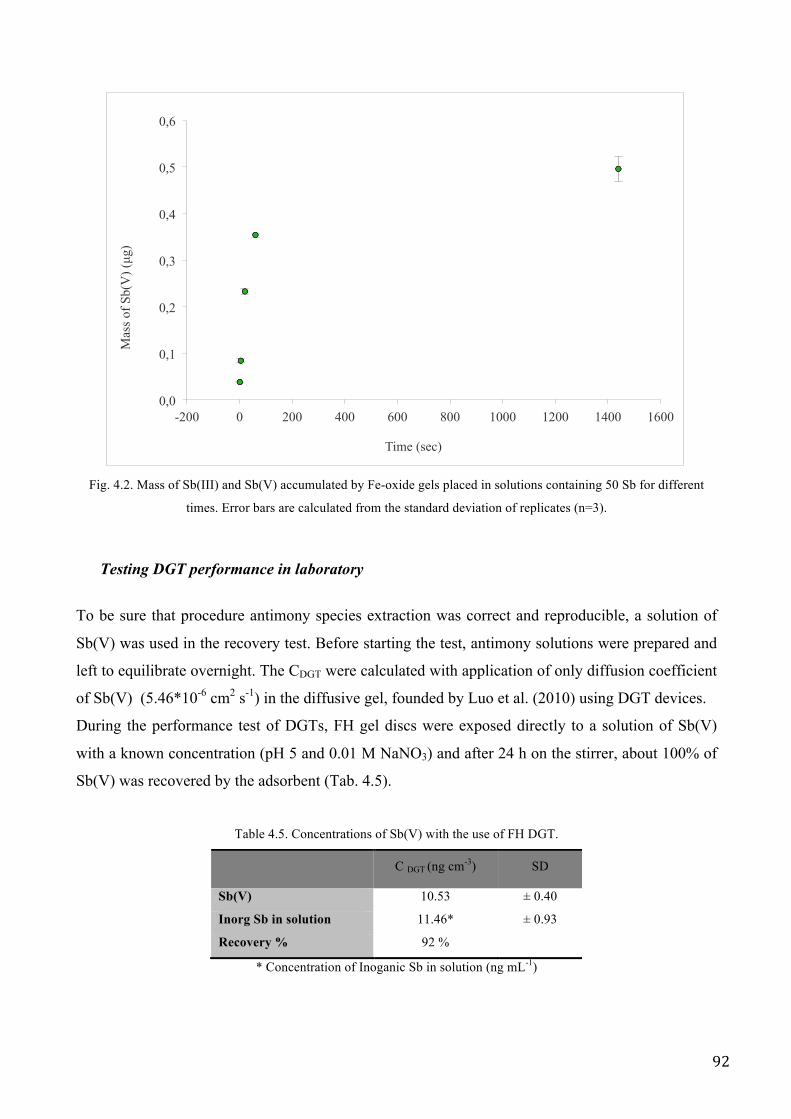
92
Fig. 4.2. Mass of Sb(III) and Sb(V) accumulated by Fe-oxide gels placed in solutions containing 50 Sb for different
times. Error bars are calculated from the standard deviation of replicates (n=3).
Testing DGT performance in laboratory
To be sure that procedure antimony species extraction was correct and reproducible, a solution of
Sb(V) was used in the recovery test. Before starting the test, antimony solutions were prepared and
left to equilibrate overnight. The CDGT were calculated with application of only diffusion coefficient
of Sb(V) (5.46*10-6 cm2 s-1) in the diffusive gel, founded by Luo et al. (2010) using DGT devices.
During the performance test of DGTs, FH gel discs were exposed directly to a solution of Sb(V)
with a known concentration (pH 5 and 0.01 M NaNO3) and after 24 h on the stirrer, about 100% of
Sb(V) was recovered by the adsorbent (Tab. 4.5).
Table 4.5. Concentrations of Sb(V) with the use of FH DGT.
C DGT (ng cm-3) SD
Sb(V) 10.53 ± 0.40
Inorg Sb in solution 11.46* ± 0.93
Recovery % 92 %
* Concentration of Inoganic Sb in solution (ng mL-1)
0,0
0,1
0,2
0,3
0,4
0,5
0,6
-200 0 200 400 600 800 1000 1200 1400 1600
Mas
s of S
b(V
) (µg
)
Time (sec)
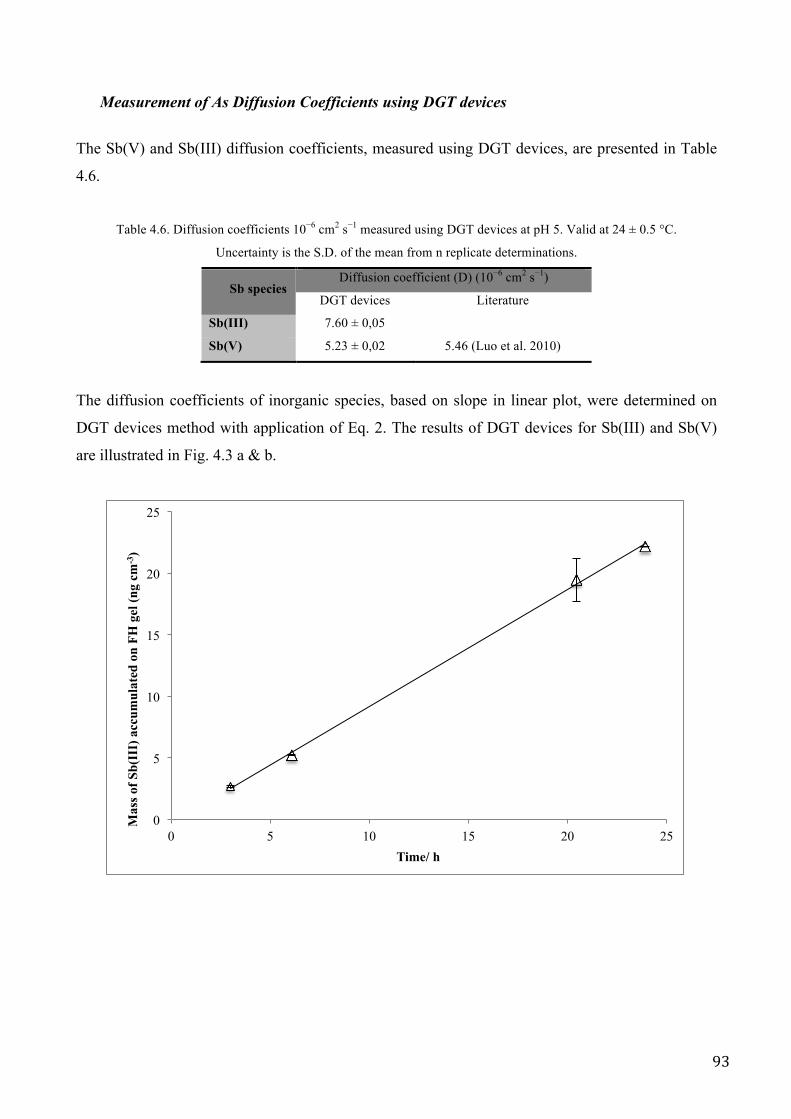
93
Measurement of As Diffusion Coefficients using DGT devices
The Sb(V) and Sb(III) diffusion coefficients, measured using DGT devices, are presented in Table
4.6.
Table 4.6. Diffusion coefficients 10−6 cm2 s−1 measured using DGT devices at pH 5. Valid at 24 ± 0.5 °C.
Uncertainty is the S.D. of the mean from n replicate determinations.
Sb species Diffusion coefficient (D) (10−6 cm2 s−1)
DGT devices Literature
Sb(III) 7.60 ± 0,05
Sb(V) 5.23 ± 0,02 5.46 (Luo et al. 2010)
The diffusion coefficients of inorganic species, based on slope in linear plot, were determined on
DGT devices method with application of Eq. 2. The results of DGT devices for Sb(III) and Sb(V)
are illustrated in Fig. 4.3 a & b.
0
5
10
15
20
25
0 5 10 15 20 25
Mas
s of S
b(II
I) a
ccum
ulat
ed o
n FH
gel
(ng
cm-3
)
Time/ h
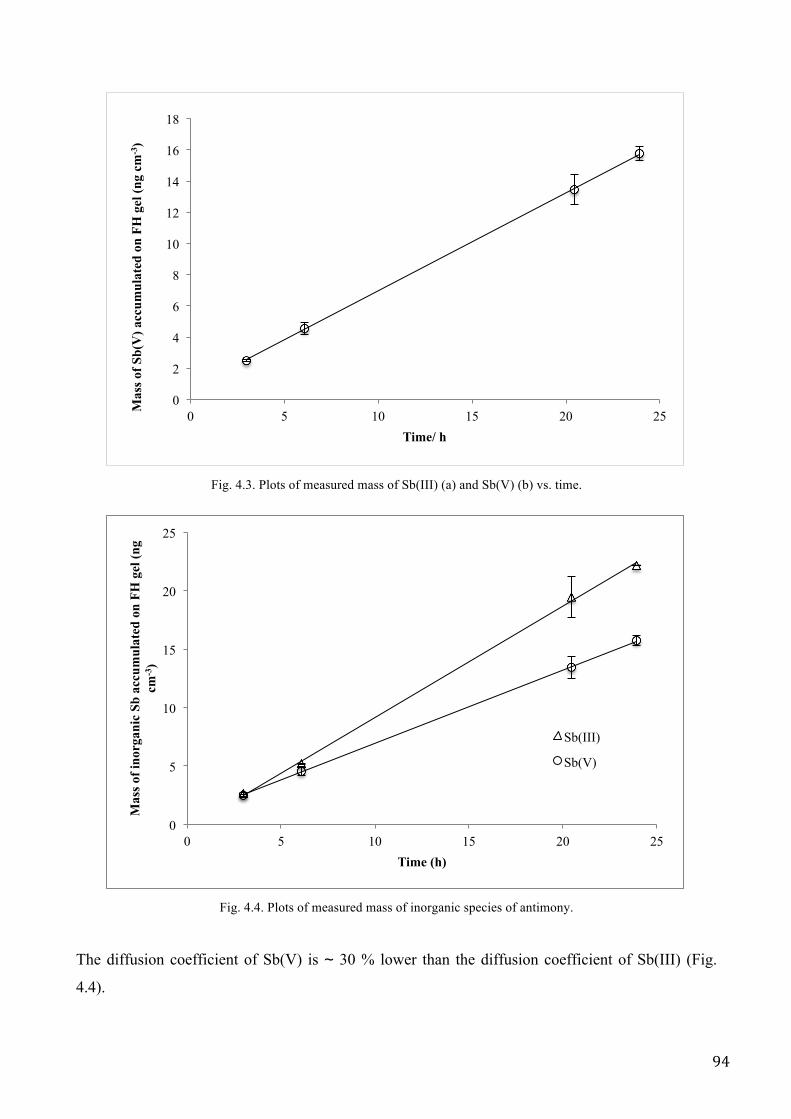
94
Fig. 4.3. Plots of measured mass of Sb(III) (a) and Sb(V) (b) vs. time.
Fig. 4.4. Plots of measured mass of inorganic species of antimony.
The diffusion coefficient of Sb(V) is ∼ 30 % lower than the diffusion coefficient of Sb(III) (Fig.
4.4).
0
2
4
6
8
10
12
14
16
18
0 5 10 15 20 25
Mas
s of S
b(V
) acc
umul
ated
on
FH g
el (n
g cm
-3)
Time/ h
0
5
10
15
20
25
0 5 10 15 20 25
Mas
s of i
norg
anic
Sb
accu
mul
ated
on
FH g
el (n
g cm
-3)
Time (h)
Sb(III)
Sb(V)
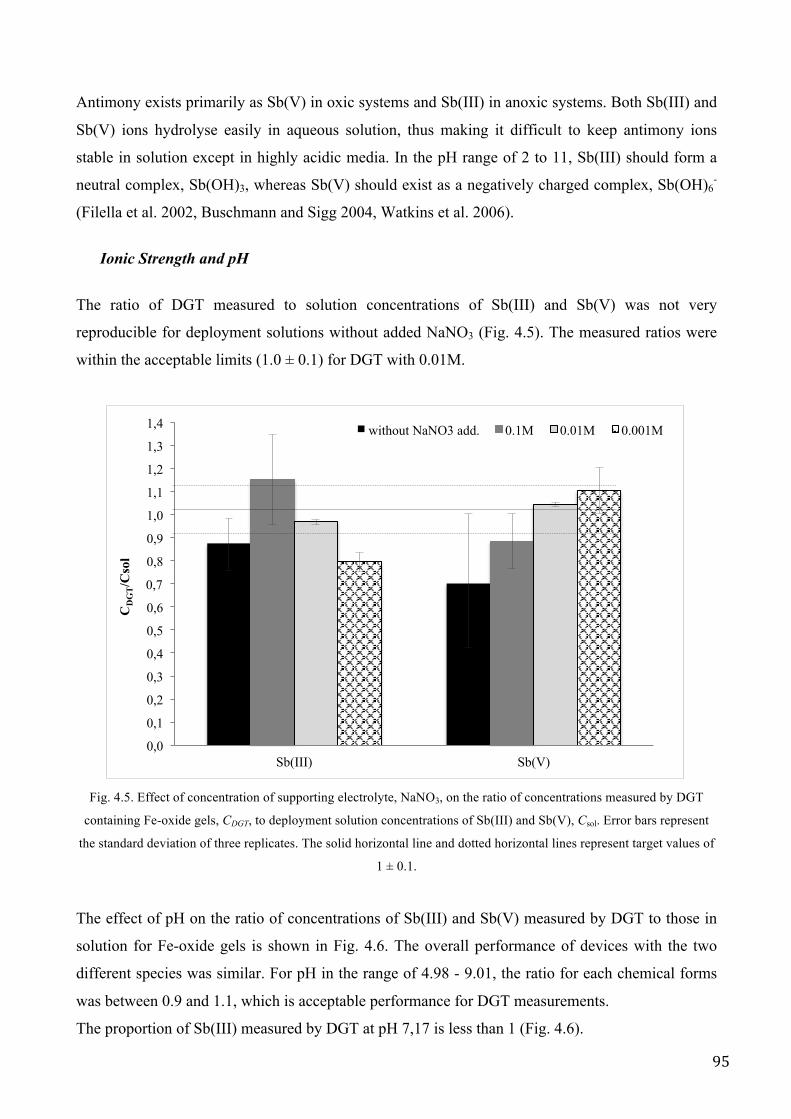
95
Antimony exists primarily as Sb(V) in oxic systems and Sb(III) in anoxic systems. Both Sb(III) and
Sb(V) ions hydrolyse easily in aqueous solution, thus making it difficult to keep antimony ions
stable in solution except in highly acidic media. In the pH range of 2 to 11, Sb(III) should form a
neutral complex, Sb(OH)3, whereas Sb(V) should exist as a negatively charged complex, Sb(OH)6-
(Filella et al. 2002, Buschmann and Sigg 2004, Watkins et al. 2006).
Ionic Strength and pH
The ratio of DGT measured to solution concentrations of Sb(III) and Sb(V) was not very
reproducible for deployment solutions without added NaNO3 (Fig. 4.5). The measured ratios were
within the acceptable limits (1.0 ± 0.1) for DGT with 0.01M.
Fig. 4.5. Effect of concentration of supporting electrolyte, NaNO3, on the ratio of concentrations measured by DGT
containing Fe-oxide gels, CDGT, to deployment solution concentrations of Sb(III) and Sb(V), Csol. Error bars represent
the standard deviation of three replicates. The solid horizontal line and dotted horizontal lines represent target values of
1 ± 0.1.
The effect of pH on the ratio of concentrations of Sb(III) and Sb(V) measured by DGT to those in
solution for Fe-oxide gels is shown in Fig. 4.6. The overall performance of devices with the two
different species was similar. For pH in the range of 4.98 - 9.01, the ratio for each chemical forms
was between 0.9 and 1.1, which is acceptable performance for DGT measurements.
The proportion of Sb(III) measured by DGT at pH 7,17 is less than 1 (Fig. 4.6).
0,0
0,1
0,2
0,3
0,4
0,5
0,6
0,7
0,8
0,9
1,0
1,1
1,2
1,3
1,4
Sb(III) Sb(V)
CD
GT/C
sol
without NaNO3 add. 0.1M 0.01M 0.001M
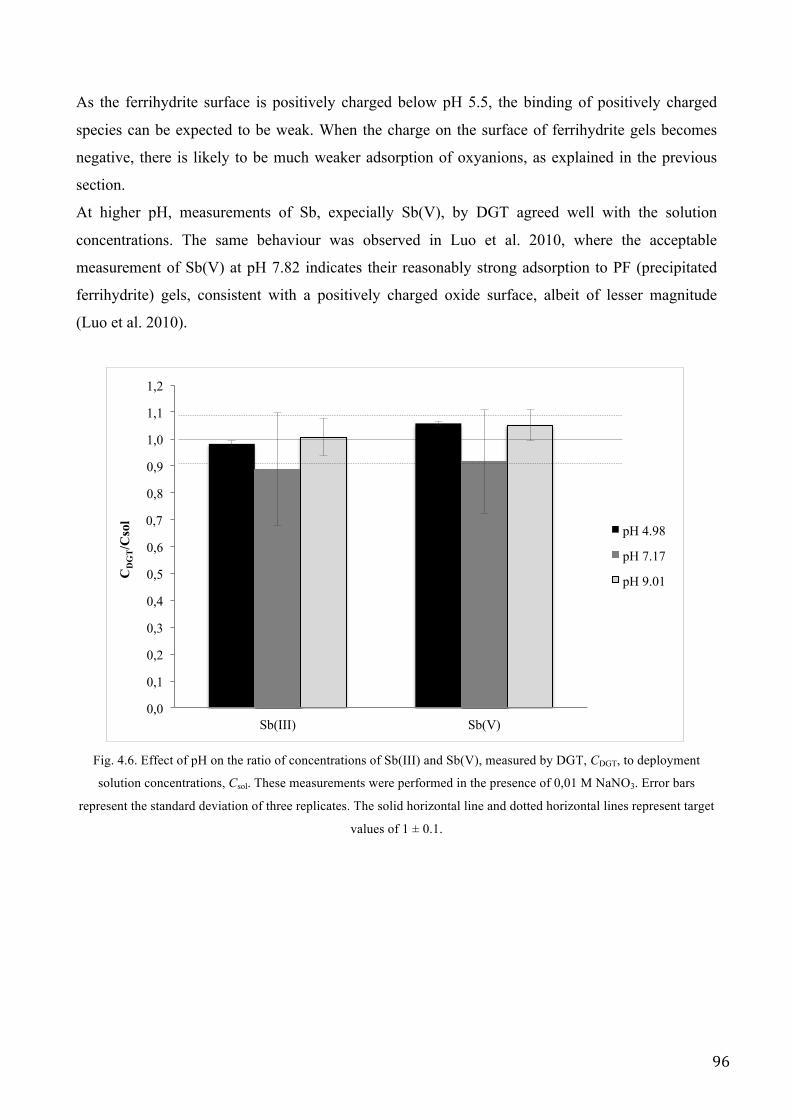
96
As the ferrihydrite surface is positively charged below pH 5.5, the binding of positively charged
species can be expected to be weak. When the charge on the surface of ferrihydrite gels becomes
negative, there is likely to be much weaker adsorption of oxyanions, as explained in the previous
section.
At higher pH, measurements of Sb, expecially Sb(V), by DGT agreed well with the solution
concentrations. The same behaviour was observed in Luo et al. 2010, where the acceptable
measurement of Sb(V) at pH 7.82 indicates their reasonably strong adsorption to PF (precipitated
ferrihydrite) gels, consistent with a positively charged oxide surface, albeit of lesser magnitude
(Luo et al. 2010).
Fig. 4.6. Effect of pH on the ratio of concentrations of Sb(III) and Sb(V), measured by DGT, CDGT, to deployment
solution concentrations, Csol. These measurements were performed in the presence of 0,01 M NaNO3. Error bars
represent the standard deviation of three replicates. The solid horizontal line and dotted horizontal lines represent target
values of 1 ± 0.1.
0,0
0,1
0,2
0,3
0,4
0,5
0,6
0,7
0,8
0,9
1,0
1,1
1,2
Sb(III) Sb(V)
CD
GT/C
sol
pH 4.98
pH 7.17
pH 9.01
97
CONCLUSIONS This chapter reports the application of HPLC species-unspecific spike isotope dilution ICP-MS to
separate and quantify inorganic Sb species in aqueous solution with use of Diffusive Gradient in
Thin Films. The Fe-oxide gel has already been used in DGT to provide, with analysis by HPLC-
ICP-MS, the possibility to accumulate and determine the inorganic specie, Sb(V), but also Sb(III).
The measured value for the diffusion coefficient of Sb(V) in the hydrogel at pH 5 of 5.23 ± 0.02 ×
10-6 cm2 s-1 shows sufficient agreement with other measurement in previous work.
However, measured value of 7.60 ± 0.05 × 10⁻⁶ for Sb(III), is, as yet, uncorroborated by other
workers. The antimony species could be measured quantitatively throughout the pH range tested of
4.98-9.01 without diminution of performance.
The combination of HPLC-ICP-MS, as analytical technique, Fe-oxide DGT, as adsorption system
in aqueous solution, and EDTA, for preservation of different species represent an excellent point of
departure for antimony investigation in environmental.
Future applications could include the study and the identification of methylated antimony species in
some environmental compartments because little information is known about these chemistry
solutions. Moreover information on antimony interactions with natural organic matter is very scarse
and does not allow any rigorous conclusion to be drawn regarding its role in antimony fate in
natural aquatic systems.
98
REFERENCES Al-Sibaai AA,and AG Fogg. 1973. Stability of dilute standard solutions of antimony, arsenic, iron and rhenium used in
colorimetry. Analyst. 98, 732–738.
Andreae MO, Asmode ́ JF, Foster P and L Van’t dack. 1981. Determination of antimony(III), antimony(V), and
methylanti- mony species in natural waters by atomic absorption spectrometry with hydride generation. Anal.
Chem. 53, 1766–1771.
Council of European Union, Council Directive 98/83/EC of 3 November 1998, Quality of Water Intended for Human
Consumption. Off. J. L 330, 32–54.
de la Calle Guntiñas MB, Madrid Y and C Cámara. 1992. Stability study of total antimony, Sb(III) and Sb(V) at the
trace level. Fresenius J. Anal. Chem. 344, 27–29.
Dodd M, Grundy SL, Reimer KJ and WR Cullen. 1992. Methylated antimony(V) compounds: Synthesis, hydride
generation properties and implications for aquatic speciation. Appl. Organomet. Chem. 6, 207.
Filella M, Belzile N and Y Chen. 2002. Antimony in the environment: a review focused on natural waters. I.
Occurrence. Earth- Sci. Rev. 57, 125–176. Iffland R. 1988. Antimony, in: Handbooks on Toxicity of Inorganic
Com- pounds, Marcel Dekker, New York, (Chapter 7), p. 67.
Gomez Ariza JL, Morales E, Sanchez-Rodas D and I Giraldes. 2000. Stability of chemical species in environmental
matrices. Trends Anal. Chem. 19, 200.
Hill S, Bloxham M and P Worsfold. 1993. Chromatography coupled with inductively coupled plasma atomic emission
spectrometry and inductively coupled plasma mass spectrometry. A review. J Anal Atomic Spectrom. 8:499–515.
Kolpakova NN. 1982. Laboratory and field studies of ionic equilibria in the Sb2S3–H2O–H2S system. Geochem. Int.
19, 46–54.
Krachler M and H Emons. 2000. Urinary antimony speciation by HPLC-ICP-MS. J. Anal. At. Spectrom. 15, 281.
Krachler M, H. Emons. 2001. Speciation analysis of antimony by high-performance liquid chromatography inductively
coupled plasma mass spectrometry using ultrasonic nebulization. Anal. Chim. Acta. 429, 125.
Krachler M and H Emons. 2001. Speciation of antimony for the 21st century: promises and pitfalls. Anal. Chim. Acta
429, 125.
Lindemann T, Prange A, Dannecker W and B Neidhart. 2000. Stability studies of arsenic, selenium, antimony and
tellurium species in water, urine, fish and soil extracts using HPLC/ICP-MS. J. Anal. Chem. 368, 214.
Lintschinger J, Koch I, Serves S, Feldmann J and WR Cullen. 1997. Determination of antimony species with high-
performance liquid chromatography using element specific detection. J. Anal. Chem. 359, 484.
Lintschinger J, Schramel O and A Kettrup. 1998. The analysis of antimony species by using ESI-MS and HPLC-ICP-
MSJ. Anal. Chem. 361, 96.
Miravet R, Lopez-Sanchez JF and R Rubio. 2004. New considerations about the separation and quantification of
antimony species by ion chromatography. J. Anal. Chromatogr. 1052, 121.
Pauling L. 1933. The formulas of antimonic acid and the antimonates. J. Am. Chem. Soc. 55, 1895–1900.
Ritchie JA. 1961. Arsenic and antimony in some New Zealand thermal waters. N. Z. J. Sci. 4, 218–229.
Sayago A, Beltran R and JL Gomez-Ariza. 2000. Hydride generation atomic fluorescence spectrometry (HG-AFS) as a
sensitive detector for Sb(III) and Sb(V) speciation in water. J. Anal. At. Spectrom. 15, 423.
Stauffer RE and JM Thompson. 1984. Arsenic and antimony in geothermal waters of Yellowstone National Park,
Wyoming, USA. Geochim. Cosmochim. Acta. 48, 2547–2561.
United States Environmental Protection Agency USEPA, Water Related fate of the 129 Priority Pollutants, vol. 1,
99
Washington, DC, 1979.
Weissberg BG, Browne PRL and TM Seward. 1979. Ore metals in active geothermal systems. In: Barnes, H.L. (Ed.),
Geochem- istry of Hydrothermal Ore Deposits. Wiley, New York, pp. 738 – 780.
Zhang X, Cornelis R and L Mees. 1998. Speciation of antimony(III) and antimony(V) species by using high-
performance liquid chromatography coupled to hydride generation atomic absorption spectrometry. J. Anal. At.
Spectrom. 13, 205.
Zheng J, Lijima A and N Furuta. 2001. Complexation effect of antimony compounds with citric acid and its application
to the speciation of antimony(III) and antimony(V) using HPLC-ICP-MS. J. Anal. At. Spectrom. 16, 812.
Zheng J, Ohata M and N Furuta. 2000. Antimony Speciation in Environmental Samples by Using High-Performance
Liquid Chromatography Coupled to Inductively Coupled Plasma Mass Spectrometry. Anal. Sci. 16, 75.
Zheng J, Ohata M and N Furuta. 2000. Studies on the speciation of inorganic and organic antimony compounds in
airborne particulate matter by HPLC-ICP-MS. Analyst. 125, 1025.

100
101
Chapter V. Survey of Total Arsenic and Arsenic Species
in Italian Rice
ABSTRACT
Arsenic toxicity depends on the chemical form. Inorganic arsenic is more toxic than organic arsenic
and trivalentarsenite is more toxic than pentavalent and zero-valent arsenic. Generally rice, unlike
food products of terrestrial origin, contains significant amounts of inorganic arsenic. Recently some
Government Organizations (e.g. EFSA) debated the possibility to set an upper limit for total and
inorganic arsenic in rice.
Arsenic speciation was realized in 70 Italian rice samples from different representative cultivation
conditions. The adopted method was effective in preserving the arsenic species and suitable for
routine analysis of large numbers of samples. The HPLC-ICP-MS technique was used to measure
the different arsenic species [arsenite (As(III)), arsenate (As(V)), monomethylarsonic acid
(MMA(V)) and dimethylarsinic acid (DMA(V))], which were separated using an anion-exchange
column. The sum of As(III) and As(V) is known as inorganic arsenic. Total As concentration in
samples was determined directly by ICP–MS. Certified reference material, NIST 1568a rice flour
and IMEP 107, for total and inorganic As in rice, were included for quality assurance.
The most abundant species in rice were As(III) and DMA(V). Total arsenic levels in the 70 Italian
rice samples averaged 0.16 µg g-1 (range 0.06-0.60 µg g-1); inorganic arsenic averaged 0.10 µg g-1
(range 0.04-0.16 µg g-1). The percentage of inorganic arsenic tended to decrease with increasing the
total arsenic.
Keywords: Arsenic speciation, rice, nitric acid extraction, inorganic arsenic, organic arsenic.
INTRODUCTION For many years contaminated drinking water has been assigned as the main source for human
exposure to inorganic arsenic, a causal agent for various cancers (Chen et al. 1992) and
cardiovascular disease (Chen et al., 2011). More recently, however, rice and rice-based products
have been identified as significant dietary sources of inorganic arsenic (Meharg et al., 2008; Signes-
Pastor et al., 2009). For populations not exposed to arsenic-contaminated drinking water, food is
now considered the major contributor to the intake of inorganic arsenic (EFSA, 2009). Rice,
compared to other staple cereal crops, is an important foodstuff for 3 billion people and it is the
102
most important exposure route for arsenic (As), a non-threshold class 1 carcinogen. Foods, as
opposed to drinking water, may contain several As species with different levels of toxicity. The
toxicity of As depends not only on total concentrations, but also on its chemical forms. In general,
the toxicity of As increases with decreasing oxidation states. In general, inorganic As species are
more toxic than organic ones. Arsenite (As(III)) has higher toxic effects than arsenate (As(V)).
Speciation of As in rice grain were usually categorised as inorganic and organic As (Heitkemper et
al. 2001; Williams et al., 2005).
Little information about speciation of As(III) and As(V) in rice is currently available in the
literature. Therefore, due to large differences of toxicity among As(III), As(V) and organic As,
accurate As speciation is indispensable to assess the impact of As toxicity in rice on human health.
However, since the toxicity of As(III) is higher than As(V) to human, comprehensive understands
of the potential As toxicity in rice grain require analytical methods capable of distinguishing As(III)
from As(V).
A successful extraction is necessary to break As(III)-thiolate complexes and avoid any As redox
transformation caused by an extraction matrix, e.g. extractants and thiolate compounds released
from rice grains. A substantial time length seems to be necessary to break As(III)-thiolate
complexes with dilute HNO3 (Heitkemper, 2001). Nitric acid was the most suitable extractant for
identification of different species in Arsenic in rice. The extraction with H2O2 usually led to
complete oxidation of As (III) (Huang et al. 2012). Monomethylarsonic acid and dimethylarsinic
acid were affected very little during most extraction procedures.
The aim of the present work was to apply recent extraction method for As speciation in rice grain
(Huang et al. 2010). The increasing concern about dietary intake of inorganic As, combined with
probable future legislative regulations, highlights the need for a selective, sensitive and robust
method for determining the inorganic As content of foods. In our study, we investigated different
types of rice grains from different areas of Northern Italy. Our data showed the influences of As(III)
and DMA(V) on the As concentration in rice grain and the relevance of As(III) and As(V)
speciation for assessing As toxicity to human health.
MATERIALS AND METHODS
Reagents and materials
Stock solutions of arsenic species (1000 mg L−1 of As) were prepared by As2O3 (ArsenicIII Oxide)
and Na2HAsO4*7H2O (sodium arsenate dibasic heptahydrate) and of DMA(V) and MMA(V) from
dimethylarsinic acid ((CH3)2As(O)OH) and disodium methylarsenate (Na2CH3AsO3).
103
The standard solutions of arsenic species were obtained by diluting the corresponding stock
solutions.
Standard solutions of total arsenic were prepared by dilution of a multielement standard (100 mg
L1) obtained from CPI International (Amsterdam, The Netherlands).
Ultra-pure water was prepared by a Milli-Q system (18MΩ cm resistance, Millipore® system,
Millipore, Bedford, MA). Nitric acid in analytical grade was obtained from Carlo Erba Reagents.
Sample preparation
The white rice grain samples were milled with a blender, which was cleaned after milling of each
sample to avoid cross-contamination. The resulting milling temperature was never high, thus the
influence of milling on As speciation was estimated negligible due to the low milling temperature
and high stability of As species in rice grain (Huang et al. 2010).
For digestion, approx. 1.5 g of pulverized rice grains were mineralized using HNO3 0.28 M at 95°C
for 90 min in a heating block system (DIGIPREP) in 50 ml polypropylene tubes (digiTUBES, SCP
Science). The digested grain solutions were filtered by using 0.45 µm filter (digiFILTER, SCP
Science) after appropriate dilution with Milli- Q Water.
The extraction method allows as recovery for quantitative analyses and preserves As(III) and As(V)
during extraction (Huang et al. 2010).
Certificated standard materials were used to ensure the precision of analytical procedure (NIST
1568a rice flour and IMEP 107, for total and inorganic As in rice) and they were obtained as fine
powders and used as experimental standards without further treatments.
Instrumentation
The concentration of Total Arsenic in rice grain were determined by Inductively Coupled Plasma
Mass Spectrometer (Agilent 7700x, Agilent Technologies, USA) with Octopole Reaction System
(ORS system).
Speciation of arsenic species was performed by HPLC on an anion exchange column with a mobile
phase (1 mL min-1). The mobile phase was made of 13.2 mM NH4H2PO4 at pH 6. The ion intensity
at m/z 75 (75As+) was monitored without reaction mode with carrier gas (Argon) flow rate of 0.95 L
min-1. Clorine (35Cl+) was also monitored because chlorine matrices lead to 40Ar35Cl+ interferences.
Arsenic speciation in extracts was conducted immediately after extraction. Identification of As
species was confirmed by spiking real extracts with a mixture of standard solutions.
Figure 5.1 shows the mass chromatogram for the separation of As(III), DMA(V), MMA(V) and
As(V) standards in aqueous solution.
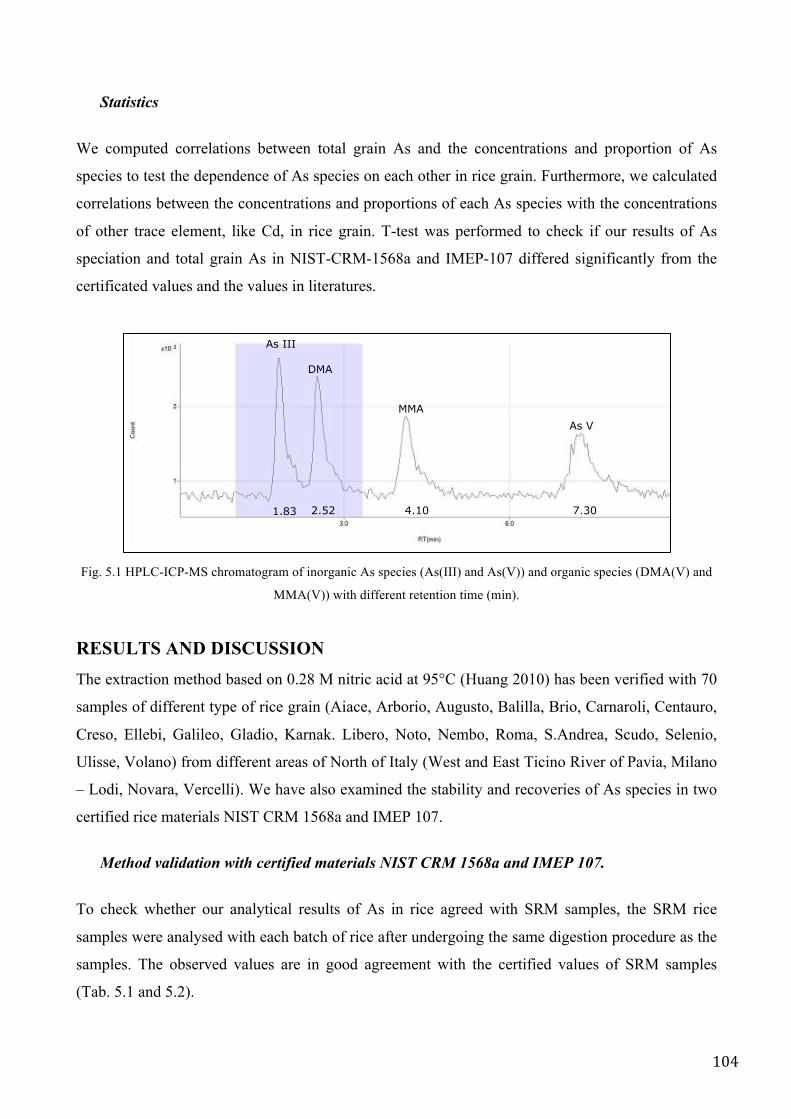
104
Statistics
We computed correlations between total grain As and the concentrations and proportion of As
species to test the dependence of As species on each other in rice grain. Furthermore, we calculated
correlations between the concentrations and proportions of each As species with the concentrations
of other trace element, like Cd, in rice grain. T-test was performed to check if our results of As
speciation and total grain As in NIST-CRM-1568a and IMEP-107 differed significantly from the
certificated values and the values in literatures.
Fig. 5.1 HPLC-ICP-MS chromatogram of inorganic As species (As(III) and As(V)) and organic species (DMA(V) and
MMA(V)) with different retention time (min).
RESULTS AND DISCUSSION The extraction method based on 0.28 M nitric acid at 95°C (Huang 2010) has been verified with 70
samples of different type of rice grain (Aiace, Arborio, Augusto, Balilla, Brio, Carnaroli, Centauro,
Creso, Ellebi, Galileo, Gladio, Karnak. Libero, Noto, Nembo, Roma, S.Andrea, Scudo, Selenio,
Ulisse, Volano) from different areas of North of Italy (West and East Ticino River of Pavia, Milano
– Lodi, Novara, Vercelli). We have also examined the stability and recoveries of As species in two
certified rice materials NIST CRM 1568a and IMEP 107.
Method validation with certified materials NIST CRM 1568a and IMEP 107.
To check whether our analytical results of As in rice agreed with SRM samples, the SRM rice
samples were analysed with each batch of rice after undergoing the same digestion procedure as the
samples. The observed values are in good agreement with the certified values of SRM samples
(Tab. 5.1 and 5.2).
As III
DMA
MMA As V
1.83 2.52 4.10 7.30
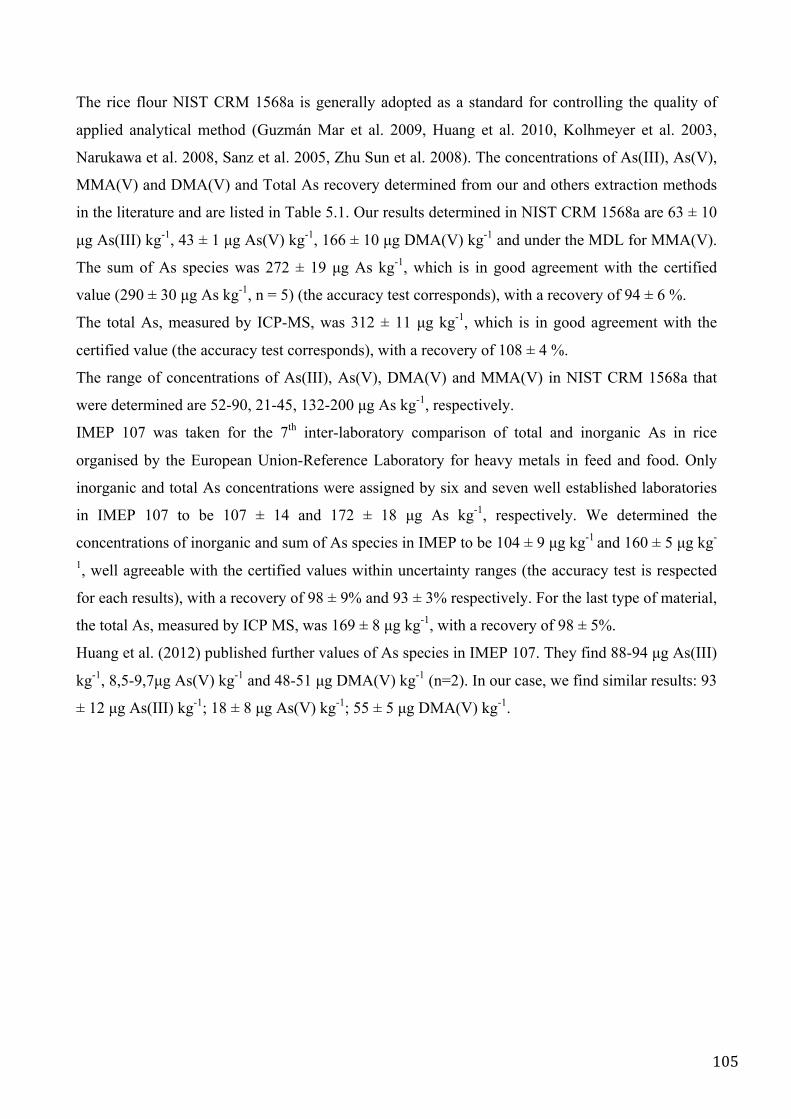
105
The rice flour NIST CRM 1568a is generally adopted as a standard for controlling the quality of
applied analytical method (Guzmán Mar et al. 2009, Huang et al. 2010, Kolhmeyer et al. 2003,
Narukawa et al. 2008, Sanz et al. 2005, Zhu Sun et al. 2008). The concentrations of As(III), As(V),
MMA(V) and DMA(V) and Total As recovery determined from our and others extraction methods
in the literature and are listed in Table 5.1. Our results determined in NIST CRM 1568a are 63 ± 10
µg As(III) kg-1, 43 ± 1 µg As(V) kg-1, 166 ± 10 µg DMA(V) kg-1 and under the MDL for MMA(V).
The sum of As species was 272 ± 19 µg As kg-1, which is in good agreement with the certified
value (290 ± 30 µg As kg-1, n = 5) (the accuracy test corresponds), with a recovery of 94 ± 6 %.
The total As, measured by ICP-MS, was 312 ± 11 µg kg-1, which is in good agreement with the
certified value (the accuracy test corresponds), with a recovery of 108 ± 4 %.
The range of concentrations of As(III), As(V), DMA(V) and MMA(V) in NIST CRM 1568a that
were determined are 52-90, 21-45, 132-200 µg As kg-1, respectively.
IMEP 107 was taken for the 7th inter-laboratory comparison of total and inorganic As in rice
organised by the European Union-Reference Laboratory for heavy metals in feed and food. Only
inorganic and total As concentrations were assigned by six and seven well established laboratories
in IMEP 107 to be 107 ± 14 and 172 ± 18 µg As kg-1, respectively. We determined the
concentrations of inorganic and sum of As species in IMEP to be 104 ± 9 µg kg-1 and 160 ± 5 µg kg-
1, well agreeable with the certified values within uncertainty ranges (the accuracy test is respected
for each results), with a recovery of 98 ± 9% and 93 ± 3% respectively. For the last type of material,
the total As, measured by ICP MS, was 169 ± 8 µg kg-1, with a recovery of 98 ± 5%.
Huang et al. (2012) published further values of As species in IMEP 107. They find 88-94 µg As(III)
kg-1, 8,5-9,7µg As(V) kg-1 and 48-51 µg DMA(V) kg-1 (n=2). In our case, we find similar results: 93
± 12 µg As(III) kg-1; 18 ± 8 µg As(V) kg-1; 55 ± 5 µg DMA(V) kg-1.
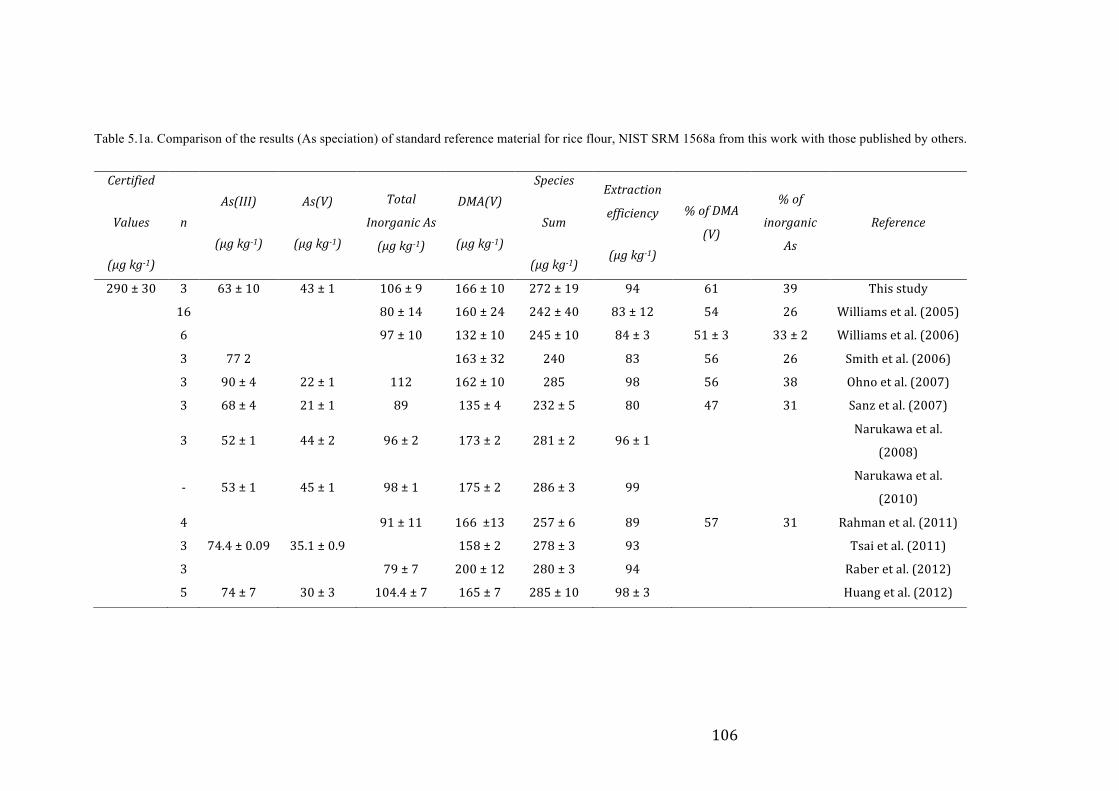
106
Table 5.1a. Comparison of the results (As speciation) of standard reference material for rice flour, NIST SRM 1568a from this work with those published by others.
Certified
Values
(μg kg-‐1)
n As(III)
(μg kg-‐1)
As(V)
(μg kg-‐1)
Total
Inorganic As
(μg kg-‐1)
DMA(V)
(μg kg-‐1)
Species
Sum
(μg kg-‐1)
Extraction
efficiency
(μg kg-‐1)
% of DMA
(V)
% of
inorganic
As
Reference
290 ± 30 3 63 ± 10 43 ± 1 106 ± 9 166 ± 10 272 ± 19 94 61 39 This study
16 80 ± 14 160 ± 24 242 ± 40 83 ± 12 54 26 Williams et al. (2005)
6 97 ± 10 132 ± 10 245 ± 10 84 ± 3 51 ± 3 33 ± 2 Williams et al. (2006)
3 77 2 163 ± 32 240 83 56 26 Smith et al. (2006)
3 90 ± 4 22 ± 1 112 162 ± 10 285 98 56 38 Ohno et al. (2007)
3 68 ± 4 21 ± 1 89 135 ± 4 232 ± 5 80 47 31 Sanz et al. (2007)
3 52 ± 1 44 ± 2 96 ± 2 173 ± 2 281 ± 2 96 ± 1 Narukawa et al.
(2008)
-‐ 53 ± 1 45 ± 1 98 ± 1 175 ± 2 286 ± 3 99 Narukawa et al.
(2010)
4 91 ± 11 166 ±13 257 ± 6 89 57 31 Rahman et al. (2011)
3 74.4 ± 0.09 35.1 ± 0.9 158 ± 2 278 ± 3 93 Tsai et al. (2011)
3 79 ± 7 200 ± 12 280 ± 3 94 Raber et al. (2012)
5 74 ± 7 30 ± 3 104.4 ± 7 165 ± 7 285 ± 10 98 ± 3 Huang et al. (2012)
107
Table 5.1b. Comparison of the results (As speciation) of standard reference material for rice grain, IMEP 107 (JRC Scientific and Technical Reports), from this work with those
published by others.
Certified
Values
(μg kg-‐1) n As(III)
(μg kg-‐1)
As(V)
(μg kg-‐1)
Total
Inorganic
As (μg kg-‐1)
DM (V)
(μg kg-‐1)
Species
Sum
(μg kg-‐1)
Extraction
efficiency
(μg kg-‐1)
%
of
DMA (V)
%
of
inorganic
As
Reference
Tot As Inorganic
As
172 ± 18 107 ± 14 3 93 ± 12 18 104 ± 9 55 ± 5 160 ± 5 93 35 65 This study
2 91 9 100 50 151 88 Huang et al. (2012)
108
Speciation of arsenite and arsenate in rice grain
The total Arsenic content ranged in our rice grain from 56 to 586 µg kg-1. The mean As
concentration in the 70 Italian rice samples was 164 µg kg-1; inorganic arsenic averaged 0.10 µg g-1
(range 39 - 158 µg kg-1).
The most abundant species in rice were As(III) and DMA(V). The portion of As(III) and DMA(V)
has a mean value of 64 % and 31 %, respectively.
Conversely, As(V) is usually the minor component with an average of 9 % of total grain As.
Arsenite is the predominate inorganic As in all rice samples and accounts for an average of 92 % of
inorganic As.
The predominance of As(III) in rice in past studies is generally in agreement with our finding.
In the earlier studies, ranges of the proportion of As(III) in inorganic As were found 74-93% (n=3)
(Guzmán Mar et al. 2009), 90-100% (n=3) (Sanz et al. 2005) and 61-80% (n=6) (Narukawa and
Chiba, 2010). The recovery of total grain As in Guzmán Mar et al. (2009) and Sanz et al. (2005)
were all ≥ 90%. In comparison, total arsenic recoveries in Zhu et al. (2008) were low in average,
probably leading to lower As(III) to inorganic As ratios than what found in other studies.
The predominance of As(III) in rice grain can be supported by plenty of information from the
literature.
In the porewater of paddy soil, As(III) is usually the dominat arsenic species expecially during the
flooded irrigation period (Takahashi et al. 2004). Translocation of As(III) from porewater to rice
plant via nodulin 26-like intrinsic proteins aquaporin in one of the most important pathways for As
to enter rice plants (Ma et al. 2008).
Dimethylarsinic acid is often the second important component (Fig. 5.3). The relevance of DMA(V)
is manifested by its presence in around 30% of total grain As on average. In some cases, DMA(V)
became the dominant As species.
The relationship between total rice arsenic and inorganic arsenic levels in rice revealed that
inorganic arsenic levels increased linearly between 200 and 300 µg kg-1 of total arsenic, and then
plateauded at an inorganic arsenic concentration of around 140 µg kg-1. Although the plot of total
arsenic against percentage inorganic arsenic showed more scatter there was a trend that in rice
samples with high total arsenic concentrations the percentage inorganic arsenic content decreases
(Fig. 5.2). This is in agreement with findings for baby rice samples in Meharg et al. (2008).
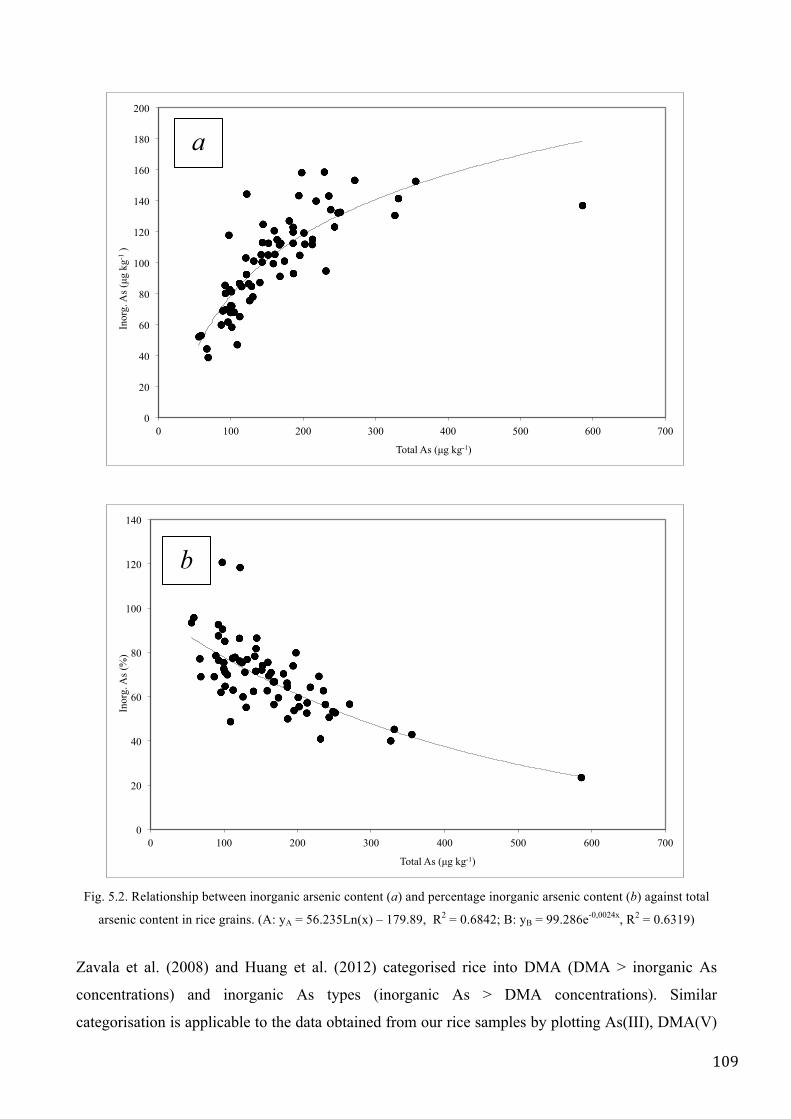
109
Fig. 5.2. Relationship between inorganic arsenic content (a) and percentage inorganic arsenic content (b) against total
arsenic content in rice grains. (A: yA = 56.235Ln(x) – 179.89, R2 = 0.6842; B: yB = 99.286e-0,0024x, R2 = 0.6319)
Zavala et al. (2008) and Huang et al. (2012) categorised rice into DMA (DMA > inorganic As
concentrations) and inorganic As types (inorganic As > DMA concentrations). Similar
categorisation is applicable to the data obtained from our rice samples by plotting As(III), DMA(V)
0
20
40
60
80
100
120
140
160
180
200
0 100 200 300 400 500 600 700
Inor
g. A
s (µg
kg-1
)
Total As (µg kg-1)
a
0
20
40
60
80
100
120
140
0 100 200 300 400 500 600 700
Inor
g. A
s (%
)
Total As (µg kg-1)
b
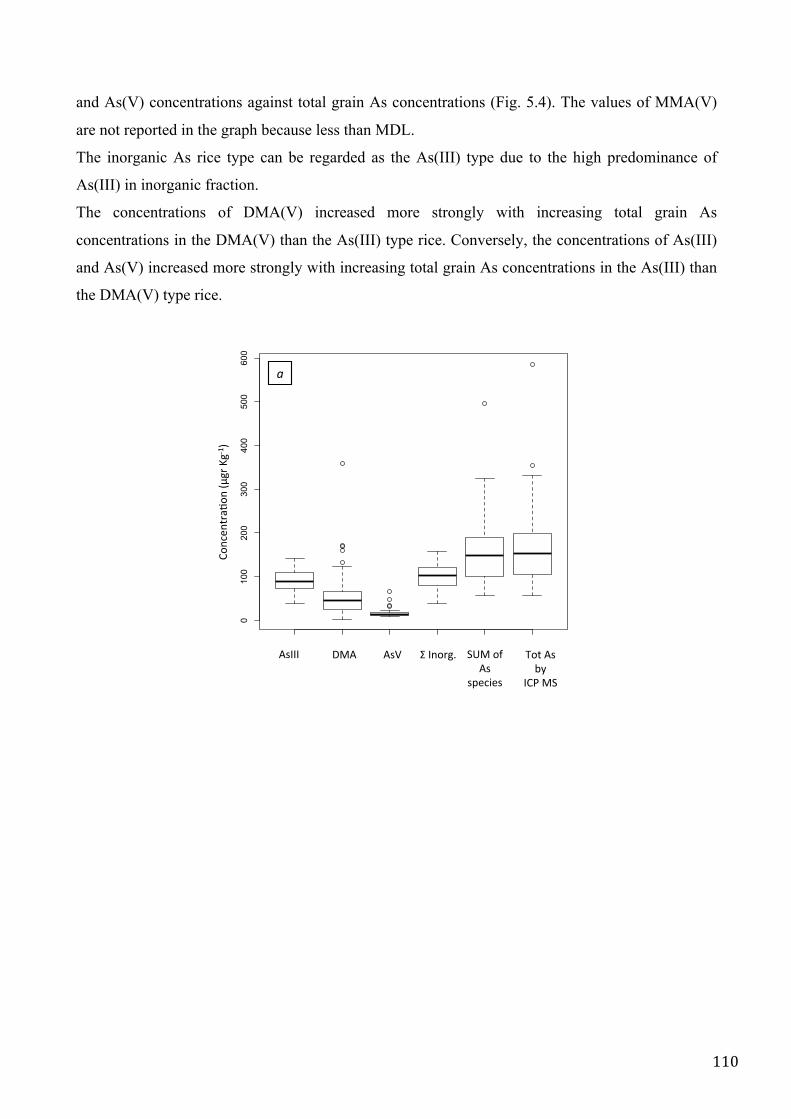
110
and As(V) concentrations against total grain As concentrations (Fig. 5.4). The values of MMA(V)
are not reported in the graph because less than MDL.
The inorganic As rice type can be regarded as the As(III) type due to the high predominance of
As(III) in inorganic fraction.
The concentrations of DMA(V) increased more strongly with increasing total grain As
concentrations in the DMA(V) than the As(III) type rice. Conversely, the concentrations of As(III)
and As(V) increased more strongly with increasing total grain As concentrations in the As(III) than
the DMA(V) type rice.
0100
200
300
400
500
600
Con
cent
ratio
n (n
g/g)
!"#$%#
&'()
"#*+,
-'*.-/0 1*
23444* 562* 237* 8*4#"'-9* :;6*"<*23*
3=%$>%3*
?"&*23*@A**
4!B*6:*
!"
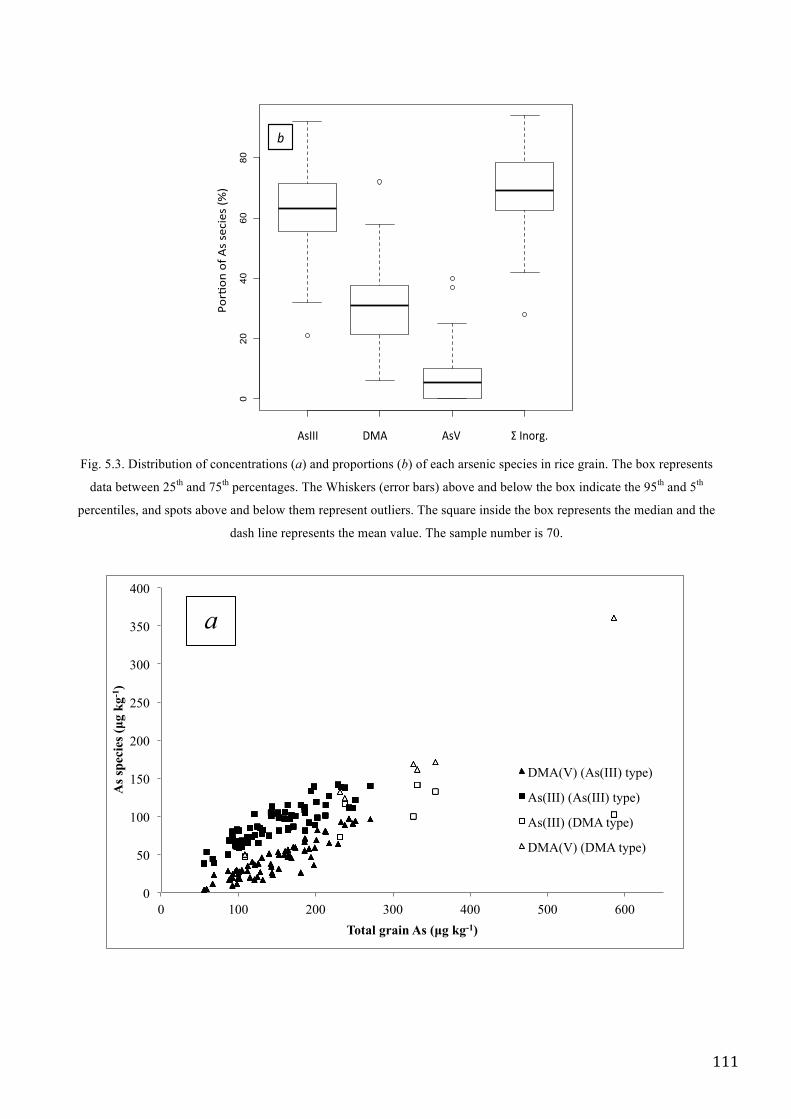
111
Fig. 5.3. Distribution of concentrations (a) and proportions (b) of each arsenic species in rice grain. The box represents
data between 25th and 75th percentages. The Whiskers (error bars) above and below the box indicate the 95th and 5th
percentiles, and spots above and below them represent outliers. The square inside the box represents the median and the
dash line represents the mean value. The sample number is 70.
1 2 3 4
020
4060
80
!"###$ %&!$ !"'$ ($#)*+,-$
.*+/*)
$*0$!
"$"1231"$45
6$
!"
0
50
100
150
200
250
300
350
400
0 100 200 300 400 500 600
As s
peci
es (µ
g kg
-1)
Total grain As (µg kg-1)
DMA(V) (As(III) type)
As(III) (As(III) type)
As(III) (DMA type)
DMA(V) (DMA type)
a
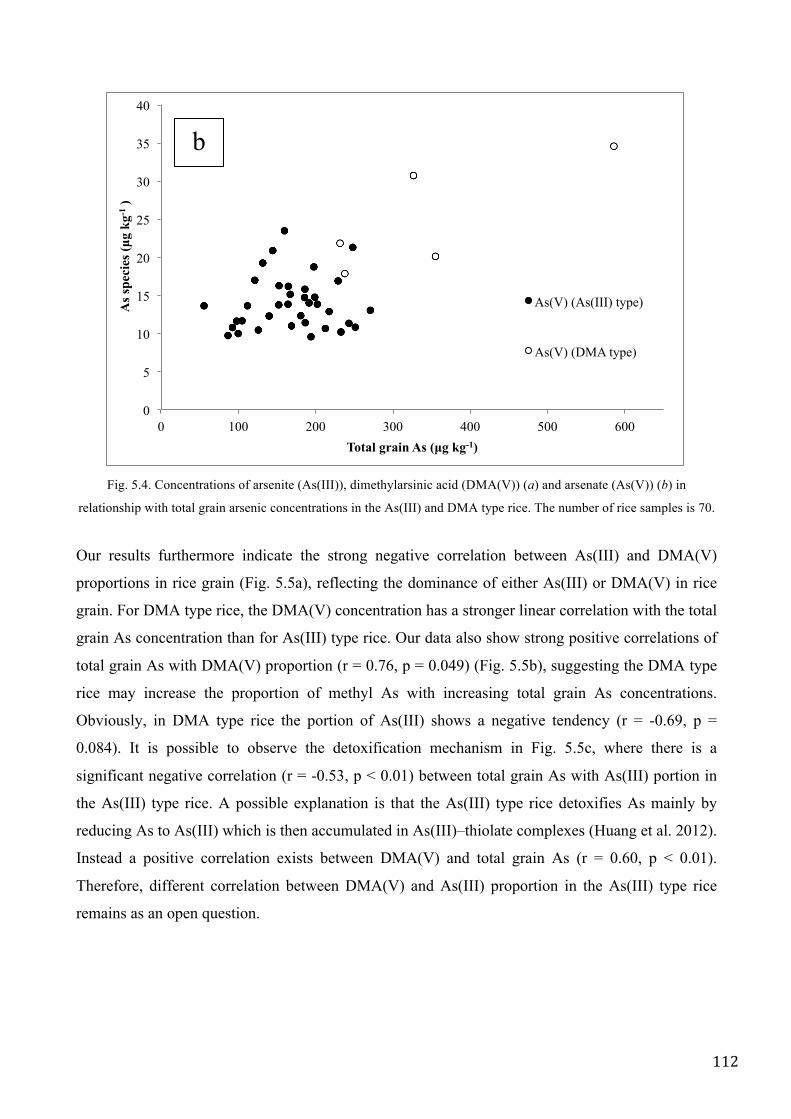
112
Fig. 5.4. Concentrations of arsenite (As(III)), dimethylarsinic acid (DMA(V)) (a) and arsenate (As(V)) (b) in
relationship with total grain arsenic concentrations in the As(III) and DMA type rice. The number of rice samples is 70.
Our results furthermore indicate the strong negative correlation between As(III) and DMA(V)
proportions in rice grain (Fig. 5.5a), reflecting the dominance of either As(III) or DMA(V) in rice
grain. For DMA type rice, the DMA(V) concentration has a stronger linear correlation with the total
grain As concentration than for As(III) type rice. Our data also show strong positive correlations of
total grain As with DMA(V) proportion (r = 0.76, p = 0.049) (Fig. 5.5b), suggesting the DMA type
rice may increase the proportion of methyl As with increasing total grain As concentrations.
Obviously, in DMA type rice the portion of As(III) shows a negative tendency (r = -0.69, p =
0.084). It is possible to observe the detoxification mechanism in Fig. 5.5c, where there is a
significant negative correlation (r = -0.53, p < 0.01) between total grain As with As(III) portion in
the As(III) type rice. A possible explanation is that the As(III) type rice detoxifies As mainly by
reducing As to As(III) which is then accumulated in As(III)–thiolate complexes (Huang et al. 2012).
Instead a positive correlation exists between DMA(V) and total grain As (r = 0.60, p < 0.01).
Therefore, different correlation between DMA(V) and As(III) proportion in the As(III) type rice
remains as an open question.
0
5
10
15
20
25
30
35
40
0 100 200 300 400 500 600
As s
peci
es (µ
g kg
-1 )
Total grain As (µg kg-1)
As(V) (As(III) type)
As(V) (DMA type)
b
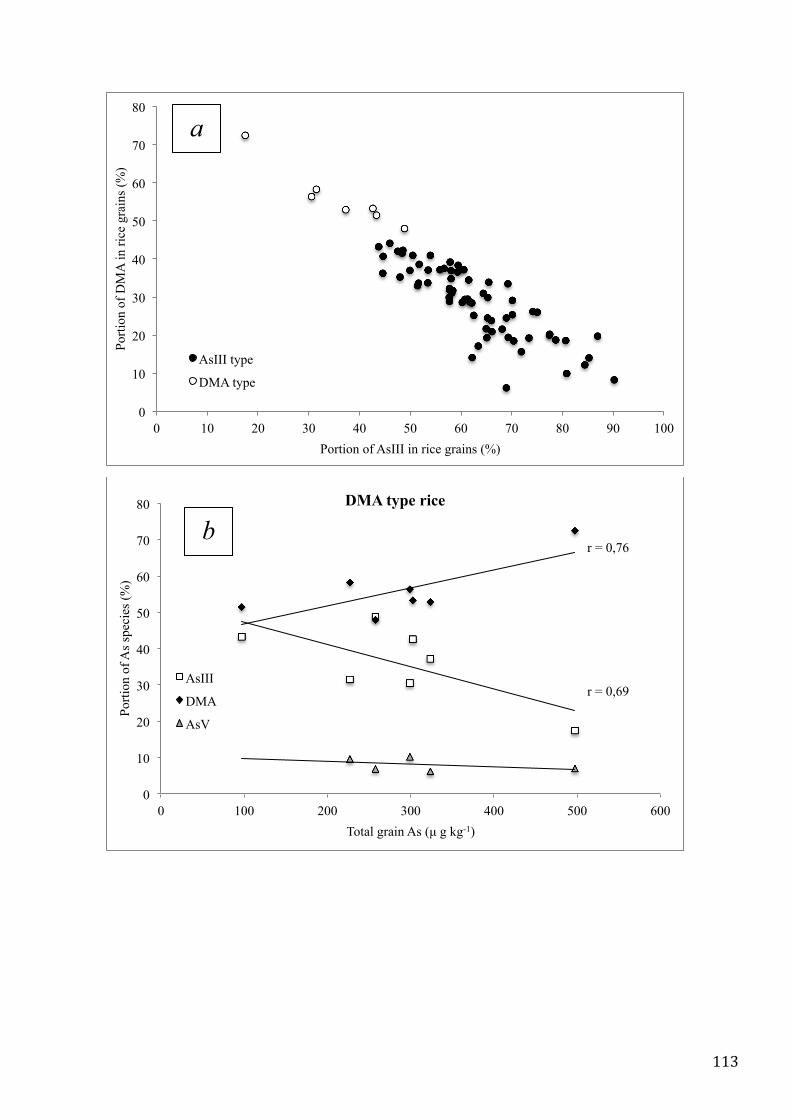
113
0
10
20
30
40
50
60
70
80
0 10 20 30 40 50 60 70 80 90 100
Porti
on o
f DM
A in
rice
gra
ins (
%)
Portion of AsIII in rice grains (%)
AsIII type
DMA type
a
r = 0,69
r = 0,76
0
10
20
30
40
50
60
70
80
0 100 200 300 400 500 600
Porti
on o
f As s
peci
es (%
)
Total grain As (µ g kg-1)
DMA type rice
AsIII
DMA
AsV
b
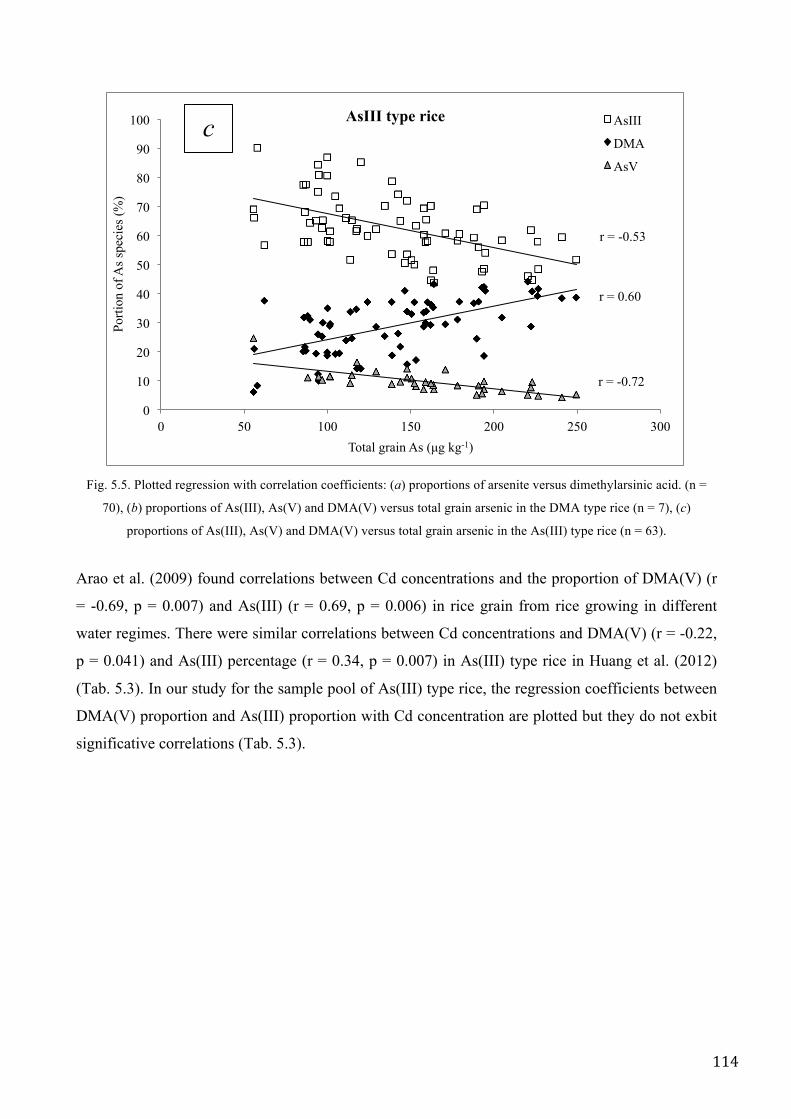
114
Fig. 5.5. Plotted regression with correlation coefficients: (a) proportions of arsenite versus dimethylarsinic acid. (n =
70), (b) proportions of As(III), As(V) and DMA(V) versus total grain arsenic in the DMA type rice (n = 7), (c)
proportions of As(III), As(V) and DMA(V) versus total grain arsenic in the As(III) type rice (n = 63).
Arao et al. (2009) found correlations between Cd concentrations and the proportion of DMA(V) (r
= -0.69, p = 0.007) and As(III) (r = 0.69, p = 0.006) in rice grain from rice growing in different
water regimes. There were similar correlations between Cd concentrations and DMA(V) (r = -0.22,
p = 0.041) and As(III) percentage (r = 0.34, p = 0.007) in As(III) type rice in Huang et al. (2012)
(Tab. 5.3). In our study for the sample pool of As(III) type rice, the regression coefficients between
DMA(V) proportion and As(III) proportion with Cd concentration are plotted but they do not exbit
significative correlations (Tab. 5.3).
r = -0.53
r = 0.60
r = -0.72
0
10
20
30
40
50
60
70
80
90
100
0 50 100 150 200 250 300
Porti
on o
f As s
peci
es (%
)
Total grain As (µg kg-1)
AsIII type rice AsIII
DMA
AsV
c
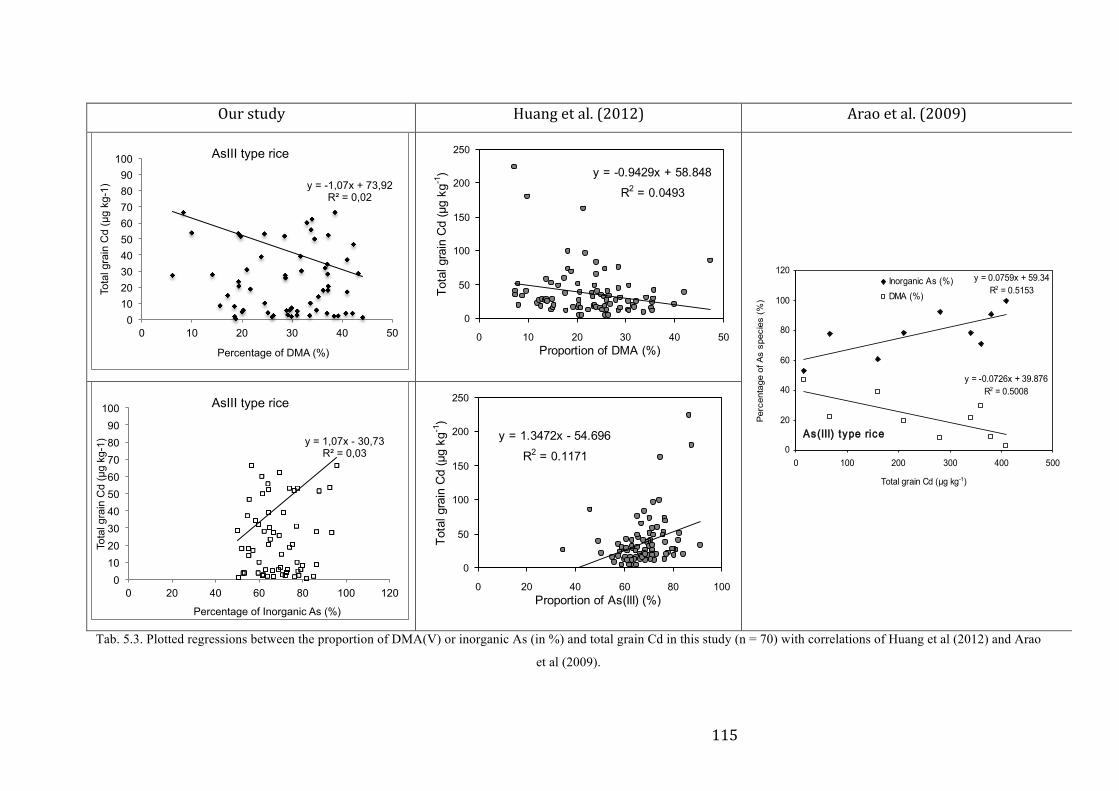
115
Our study Huang et al. (2012) Arao et al. (2009)
Tab. 5.3. Plotted regressions between the proportion of DMA(V) or inorganic As (in %) and total grain Cd in this study (n = 70) with correlations of Huang et al (2012) and Arao
et al (2009).
y = -1,07x + 73,92 R² = 0,02
0 10 20 30 40 50 60 70 80 90
100
0 10 20 30 40 50
Tota
l gra
in C
d (µ
g kg
-1)
Percentage of DMA (%)
AsIII type rice y = -0.9429x + 58.848
R2 = 0.0493
0
50
100
150
200
250
0 10 20 30 40 50Proportion of DMA (%)
Total grain Cd (µg kg-1)
y = -0.0726x + 39.876R2 = 0.5008
y = 0.0759x + 59.34R2 = 0.5153
0
20
40
60
80
100
120
0 100 200 300 400 500
Total grain Cd (µg kg-1)
Per
cent
age
of A
s sp
ecie
s (%
)
Inorganic As (%)DMA (%)
As(III) type ricey = 1,07x - 30,73
R² = 0,03
0 10 20 30 40 50 60 70 80 90
100
0 20 40 60 80 100 120
Tota
l gra
in C
d (µ
g kg
-1)
Percentage of Inorganic As (%)
AsIII type rice
y = 1.3472x - 54.696R2 = 0.1171
0
50
100
150
200
250
0 20 40 60 80 100Proportion of As(III) (%)
Total grain Cd (µg kg-1)
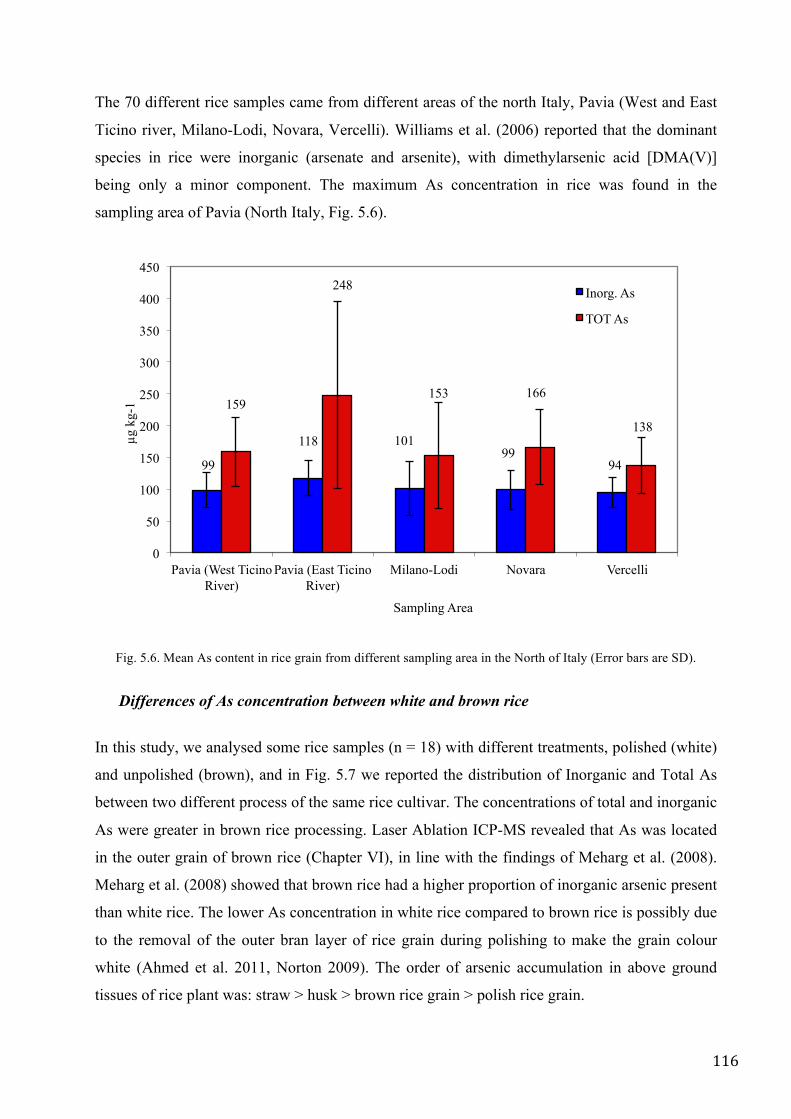
116
The 70 different rice samples came from different areas of the north Italy, Pavia (West and East
Ticino river, Milano-Lodi, Novara, Vercelli). Williams et al. (2006) reported that the dominant
species in rice were inorganic (arsenate and arsenite), with dimethylarsenic acid [DMA(V)]
being only a minor component. The maximum As concentration in rice was found in the
sampling area of Pavia (North Italy, Fig. 5.6).
Fig. 5.6. Mean As content in rice grain from different sampling area in the North of Italy (Error bars are SD).
Differences of As concentration between white and brown rice
In this study, we analysed some rice samples (n = 18) with different treatments, polished (white)
and unpolished (brown), and in Fig. 5.7 we reported the distribution of Inorganic and Total As
between two different process of the same rice cultivar. The concentrations of total and inorganic
As were greater in brown rice processing. Laser Ablation ICP-MS revealed that As was located
in the outer grain of brown rice (Chapter VI), in line with the findings of Meharg et al. (2008).
Meharg et al. (2008) showed that brown rice had a higher proportion of inorganic arsenic present
than white rice. The lower As concentration in white rice compared to brown rice is possibly due
to the removal of the outer bran layer of rice grain during polishing to make the grain colour
white (Ahmed et al. 2011, Norton 2009). The order of arsenic accumulation in above ground
tissues of rice plant was: straw > husk > brown rice grain > polish rice grain.
99
118 101 99
94
159
248
153 166
138
0
50
100
150
200
250
300
350
400
450
Pavia (West Ticino River)
Pavia (East Ticino River)
Milano-Lodi Novara Vercelli
µg k
g-1
Sampling Area
Inorg. As
TOT As
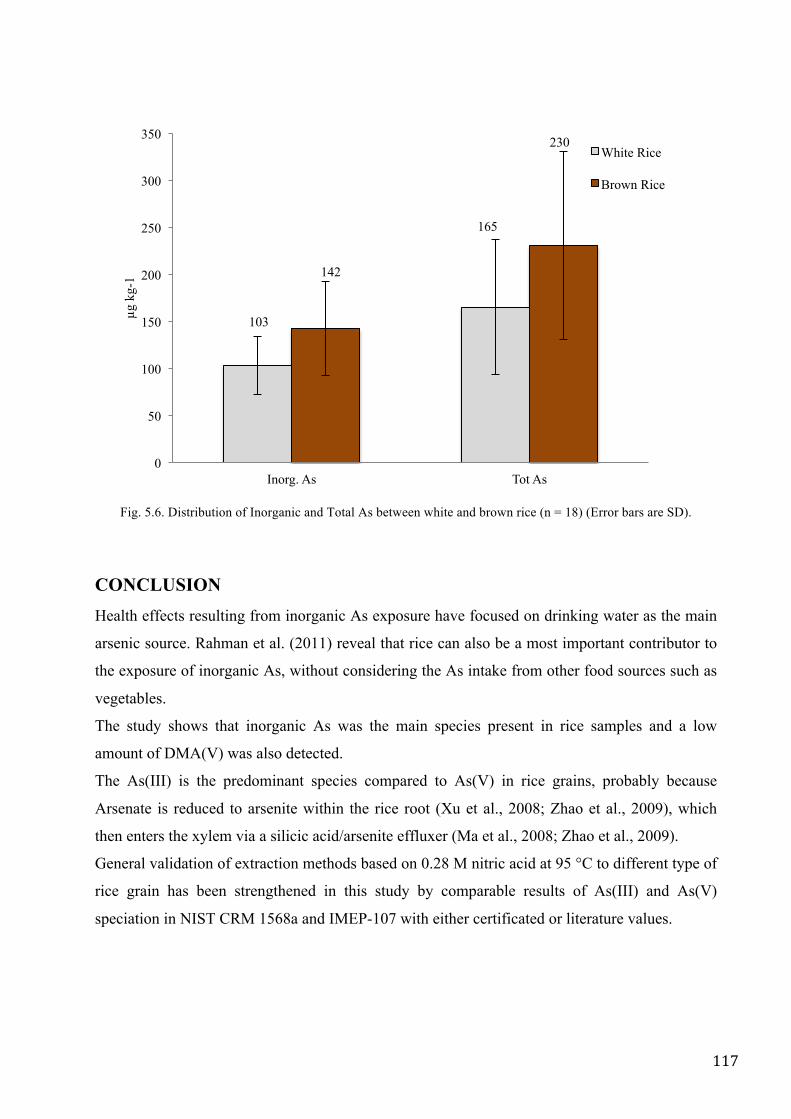
117
Fig. 5.6. Distribution of Inorganic and Total As between white and brown rice (n = 18) (Error bars are SD).
CONCLUSION Health effects resulting from inorganic As exposure have focused on drinking water as the main
arsenic source. Rahman et al. (2011) reveal that rice can also be a most important contributor to
the exposure of inorganic As, without considering the As intake from other food sources such as
vegetables.
The study shows that inorganic As was the main species present in rice samples and a low
amount of DMA(V) was also detected.
The As(III) is the predominant species compared to As(V) in rice grains, probably because
Arsenate is reduced to arsenite within the rice root (Xu et al., 2008; Zhao et al., 2009), which
then enters the xylem via a silicic acid/arsenite effluxer (Ma et al., 2008; Zhao et al., 2009).
General validation of extraction methods based on 0.28 M nitric acid at 95 °C to different type of
rice grain has been strengthened in this study by comparable results of As(III) and As(V)
speciation in NIST CRM 1568a and IMEP-107 with either certificated or literature values.
103
165
142
230
0
50
100
150
200
250
300
350
Inorg. As Tot As
µg k
g-1
White Rice
Brown Rice
118
REFERENCES Ahmed ZU, Panaullah GM, Gauch HJr, McCouch SR, Tyagi W, Kabir MS and JM Duxbury. 2011. Genotype and
environment effects on rice (Oryza sativa L.) grain arsenic concentration in Bangladesh. Plant Soil, 338,
367−382.
Arao T, Kawasaki A, Baba K, Mori S and S Matsumoto. 2009. Effects of water management on cadmium and
arsenic accumulation and dimethylarsinic acid concentrations in Japanese rice. Environmental Science &
Technology, 43, 9361–9367.
Chen CJ, Chen CW, Wu MM and TL Kuo. 1992. Cancer Potential in liver, lung, bladder and kidney due to ingested
inorganic arsenic in drinking-water. British Journal of Cancer, 66(5), 888–892.
Chen Y, Graziano JH, Parvez F, Liu M, Slavkovich V, Kalra T, et al. 2011. Arsenic exposure from drinking water
and mortality from cardiovascular disease in Bangladesh: Prospective cohort study. British Medical Journal,
342, d2431.
EFSA Panel on Contaminants in the Food Chain (CONTAM). 2009. Scientific Opinion on Arsenic in Food, 199.
Guzmán Mar JL, Reyes LH, Mizanur Rahman GM and HM Skip Kingston. 2009. Simultaneous extraction of
arsenic and selenium species from rice products by microwave-assisted enzymatic extraction and analysis by
ion chromatography-inductively coupled plasma-mass spectrometry. Journal of Agricultural and Food
Chemistry, 57, 3005–3013.
Heitkemper DT, Vela NP, Stewart KR and CS Westphal. 2001. Determination of total and speciated arsenic in rice
by ion chromatography and inductively coupled plasma mass spectrometry. Journal of Analytical Atomic
Spectrometry 16: 299–306.
Huang JH, Fecher P, Ilgen G, Hu KN and J Yang. 2012. Speciation of arsenite and arsenate in rice grain –
Verification of nitric acid based extraction method and mass sample survey. Food Chemistry. Volume 130,
Issue 2, Pages 453–459.
Huang JH, Ilgen G and P Fecher. 2010. Quantitative chemical extraction for arsenic speciation in rice grains.
Journal of Analytical Atomic Spectrometry (6) 25: 749 – 904.
Kohlmeyer U, Jantzen E and J Kuballa. 2003. Benefits of high resolution IC-ICP-MS for the routine analysis of
inorganic and organic arsenic species in food products of marine and terrestrial origin. Analytical
Bioanalytical Chemistry, 377, 6–13.
Ma JF, Yamaji N, Mitani N, Xu XY, Su YH, McGrath SP and FJ Zhao. 2008. Transporters of arsenite in rice and
their role in As accumulation in rice grain. Proc Natl Acad Sci USA 105: 9931–9935.
Ma JF, Yamaji N, Mitani N, Xu XY, Su YH, McGrath SP, et al. 2008. Transporters of arsenite in rice and their role
in arsenic accumulation in rice grain. Proceedings of the National Academy of Sciences of the United States
of America, 105, 9931–9935.
Meharg AA, Deacon C, Campbell RCJ, Carey A, Williams PN, Feldmann J, et al. 2008. Inorganic arsenic levels in
rice milk exceed EU and US drinking water standards. Journal of Environmental Monitoring, 10(4), 428–
431.
Meharg AA, Sun GX, Williams PN, Adamako E, Deacon C, Zhu YG, Feldmann J,and A Raab. 2008. Inorganic
arsenic levels in baby rice are of concern. Environmental Pollution.
Narukawa T and K Chiba. 2010. Heat assisted aqueous extraction of rice flour for arsenic speciation analysis.
Journal of Agricultural and Food Chemistry, 58, 8183–8188.
119
Narukawa T, Inagaki K, Kuroiwa T and K Chiba. 2008. The extraction and speciation of arsenic in rice flour by
HPLC-ICP-MS. Talanta, 77, 427–432.
Ohno K, Yanase T, Matsuo Y, Kimura T, Rahman MH, Magara Y and Y Matsiu. 2007. Arsenic intake via water and
food by a population living in an arsenic-affected area of Bangladesh. Sci. Total Environ. 381:68–76.
Raber G, Stock N, Hanel P, Murko M, Navratilova J and KA Francesconi. 2012. An improved HPLC–ICPMS
method for determining inorganic arsenic in food: Application to rice, wheat and tuna fish. Food Chemistry.
Vol. 134, Issue 1, Pages 524–532.
Rahman MM, Asaduzzaman M and R Naidu. 2011. Arsenic exposure from rice and water sources in the Noakhali
district of Bangladesh. Water Qual Expo Health 3:1–10.
Sanz E, Muñoz R and C Cámara. 2005. A rapid and novel alternative to conventional sample treatment for arsenic
speciation in rice using enzymatic ultrasonic probe. Analytica Chimica Acta, 535, 227–235.
Sanz E, Munoz-Olivas R, Camara C, Sengupta MK and S Ahamed. 2007. Journal of Environmental Science and
Health - Part A Toxic/Hazardous Substances and Environmental Engineering, 42, 1695-1705.
Signes-Pastor AJ, Deacon C, Jenkins RO, Haris PI, Carbonell-Barrachina AA and AA Meharg. 2009. Arsenic
speciation in Japanese rice drinks and condiments. Journal of Environmental Monitoring, 11(11), 1930–1934.
Smith NM, Lee R, Heitkemper DT, De Nicola Caggerky K, Hauqe A and AK Henderson. 2006. Inorganic arsenic in
cooked rice and vegetables from Bangladeshi households. Sci. Total Environ. 270, 294– 301.
Tsai CY and Jiang. 2011. Microwave-assisted extraction and ion chromatography dynamic reaction cell inductively
coupled plasma mass spectrometry for the speci- ation analysis of arsenic and selenium in cereals. Anal. Sci.
27, 271–276.
Williams PN, Islam MR, Adomako EE, Raab A, Hossain SA, Zhu YG, Feldmann J and AA Meharg. 2006. Increase
in rice grain arsenic for regions of Bangladesh irrigating paddies with elevated arsenic in groundwaters.
Environ. Sci. Technol. 40, 4903–4908.
Williams PN, Price AH, Raab A., et al. 2005. Variation in arsenic speciation and concentration in paddy rice related
to dietary exposure. Environmental Science and Technology, 39, 5531–5540.
Xu XY, Mcgrath SP, Meharg AA and FJ Zhao. 2008. Growingrice aerobically markedly decreases arsenic
accumulation. Environ. Sci. Technol. 2008, 42, 5574–5579.
Zavala YJ, Gerads R, Gürleyüket H,and JM Duxbury. 2008. Arsenic in rice. II. Arsenic speciation in USA grain and
implication for human health. Environmental Science & Technology, 42, 3861–3866.
Zhao FJ, Ma JF, Meharg AA and SP McGrath. 2009. Arsenic uptake and metabolism in plants. New Phytol 181:
777–794.
Zhu YG, Sun GX, Lei M, Teng M, Liu YX, Chen NC, et al. 2008. High percentage inorganic arsenic content of
mining impacted and nonimpacted Chinese rice. Environmental Science & Technology, 42, 5008–5013.

120
121
Chapter VI. Investigation of Arsenic distribution
inside rice grain using laser ablation inductively
coupled plasma mass spectrometry.
ABSTRACT
Arsenic (As) contamination of rice grains has been recognized as a major concern for human
health. Here, we investigated the localization of As in rice grains because these are key factors
controlling bioavailability of contaminants. Arsenic distribution in rice grains of two varieties,
Gladio and Ronaldo, were determined. The distribution of As varied between the various parts of
the grains (exterior, medium and interior part).
A method for direct determination of As by LA-ICP-MS in rice samples collected in several post
harvest treatments was developed. Once the As concentrations were measured with adequate
accuracy and precision, a method for its direct determination by LA-ICP-MS was developed.
The final optimized conditions of laser ablation parameters were: laser energy (100%), spot size
(100 µm) and repetition rate (10 Hz) and13C intensity was used as internal standard. As
distribution profiles in rice grain cross-sections were also obtained. By these results, LA-ICP-MS
emerges as a potential analytical tool for As localisation in rice samples. Minimum amount of
sample required, bioimaging capability, high analytical throughput, and minimization of waste
generation are the major analytical features of this approach. Arsenic content was higher in non-
parboiled rice grain than that of parboiled rice. The relationship between arsenic intensities,
corrected with 13C intensities, and several parts of grain in rice revealed that arsenic levels
decreased from the external part towards the middle position, and then the intensity values seem
to be similar between medium and internal part in non parboiled products.
Keywords: Arsenic, rice, parboiled and non-parboiled, Laser Ablation, ICP-MS.
INTRODUCTION Limited literatures are found on arsenic accumulation in different fractions of rice grain.
Majority of the people of Bangladesh and West Bengal, India, parboil raw rice before cooking
though, the people of some other countries like Thailand, Japan and China cook rice without
parboiling. Moreover, rice is milled to remove the husk (hull) before cooking. Some times, the
bran polish (the outer thin layer of milled rice) becomes detached from the rice grain during
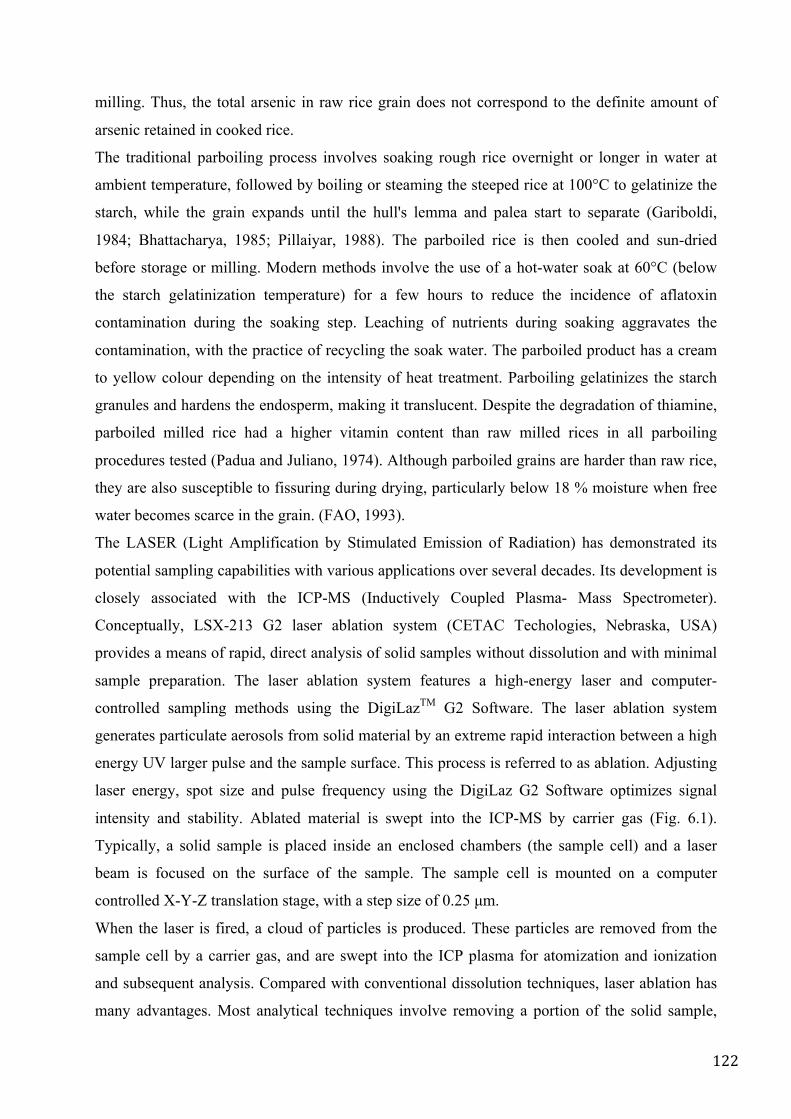
122
milling. Thus, the total arsenic in raw rice grain does not correspond to the definite amount of
arsenic retained in cooked rice.
The traditional parboiling process involves soaking rough rice overnight or longer in water at
ambient temperature, followed by boiling or steaming the steeped rice at 100°C to gelatinize the
starch, while the grain expands until the hull's lemma and palea start to separate (Gariboldi,
1984; Bhattacharya, 1985; Pillaiyar, 1988). The parboiled rice is then cooled and sun-dried
before storage or milling. Modern methods involve the use of a hot-water soak at 60°C (below
the starch gelatinization temperature) for a few hours to reduce the incidence of aflatoxin
contamination during the soaking step. Leaching of nutrients during soaking aggravates the
contamination, with the practice of recycling the soak water. The parboiled product has a cream
to yellow colour depending on the intensity of heat treatment. Parboiling gelatinizes the starch
granules and hardens the endosperm, making it translucent. Despite the degradation of thiamine,
parboiled milled rice had a higher vitamin content than raw milled rices in all parboiling
procedures tested (Padua and Juliano, 1974). Although parboiled grains are harder than raw rice,
they are also susceptible to fissuring during drying, particularly below 18 % moisture when free
water becomes scarce in the grain. (FAO, 1993).
The LASER (Light Amplification by Stimulated Emission of Radiation) has demonstrated its
potential sampling capabilities with various applications over several decades. Its development is
closely associated with the ICP-MS (Inductively Coupled Plasma- Mass Spectrometer).
Conceptually, LSX-213 G2 laser ablation system (CETAC Techologies, Nebraska, USA)
provides a means of rapid, direct analysis of solid samples without dissolution and with minimal
sample preparation. The laser ablation system features a high-energy laser and computer-
controlled sampling methods using the DigiLazTM G2 Software. The laser ablation system
generates particulate aerosols from solid material by an extreme rapid interaction between a high
energy UV larger pulse and the sample surface. This process is referred to as ablation. Adjusting
laser energy, spot size and pulse frequency using the DigiLaz G2 Software optimizes signal
intensity and stability. Ablated material is swept into the ICP-MS by carrier gas (Fig. 6.1).
Typically, a solid sample is placed inside an enclosed chambers (the sample cell) and a laser
beam is focused on the surface of the sample. The sample cell is mounted on a computer
controlled X-Y-Z translation stage, with a step size of 0.25 µm.
When the laser is fired, a cloud of particles is produced. These particles are removed from the
sample cell by a carrier gas, and are swept into the ICP plasma for atomization and ionization
and subsequent analysis. Compared with conventional dissolution techniques, laser ablation has
many advantages. Most analytical techniques involve removing a portion of the solid sample,
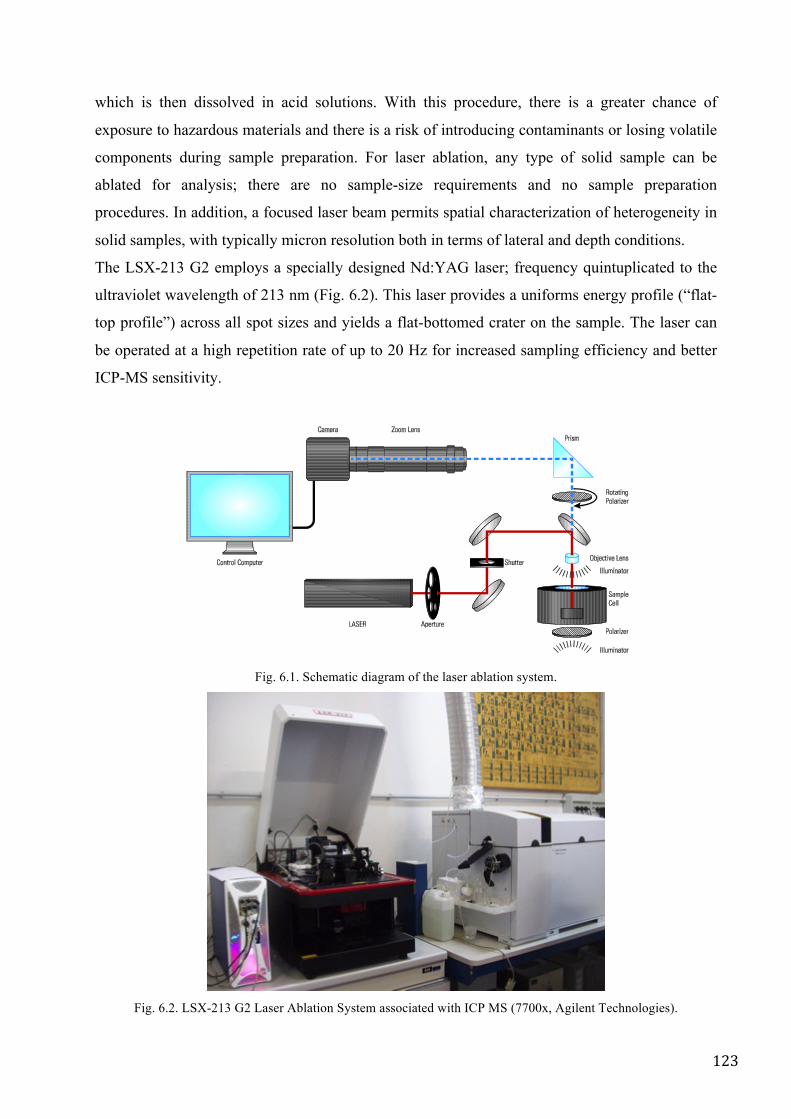
123
which is then dissolved in acid solutions. With this procedure, there is a greater chance of
exposure to hazardous materials and there is a risk of introducing contaminants or losing volatile
components during sample preparation. For laser ablation, any type of solid sample can be
ablated for analysis; there are no sample-size requirements and no sample preparation
procedures. In addition, a focused laser beam permits spatial characterization of heterogeneity in
solid samples, with typically micron resolution both in terms of lateral and depth conditions.
The LSX-213 G2 employs a specially designed Nd:YAG laser; frequency quintuplicated to the
ultraviolet wavelength of 213 nm (Fig. 6.2). This laser provides a uniforms energy profile (“flat-
top profile”) across all spot sizes and yields a flat-bottomed crater on the sample. The laser can
be operated at a high repetition rate of up to 20 Hz for increased sampling efficiency and better
ICP-MS sensitivity.
Fig. 6.1. Schematic diagram of the laser ablation system.
Fig. 6.2. LSX-213 G2 Laser Ablation System associated with ICP MS (7700x, Agilent Technologies).
!"#$!%&'()*+,%-./0123045%617819%%
!:1.2/0%+;%<7203=8>2?37%
!"#
!"#$%!&'(%)*+%",-!(%./(0,(*12%,!&*3%$4(%5&3&6)'%78%!#.$9)/(%#"$&:&'(!%!&3*)-%&*$(*!&$2%)*+%!$);&-&$2<%
=;-)$(+%:)$(/&)-%&!%!9("$%&*$#%$4(%>?@ABC%#/%>?@ADEC%;2%$4(%1)//&(/%3)!<%B)*2%$2"(!%#.%!):"-(!%1)*%;(%)*)-2'(+%,!&*3%-)!(/%);-)$&#*%!):"-(%&*$/#+,1$&#*%&*1-,+&*3%3-)!!(!F%1#)$&*3!F%/(./)1$#/2%:)$(/&)-!F%"#9+(/!F%1(/):&1!F%3(#-#3&1)-%!):"-(!F%"/#1(!!%:)$(/&)-!%)*+%"#-2:(/!<%%=;-)$&#*%:)2%;(%"(/.#/:(+%#*%!):"-(!%#.%(-(1$/&1)--2%1#*+,1$&G(%#/%*#*A1#*+,1$&G(%:)$(/&)-!<%
!"#$%&'()"*+,-&.%,/$##&
H2"&1)--2F%)%!#-&+%!):"-(%&!%"-)1(+%&*!&+(%)*%(*1-#!(+%14):;(/%I$4(%!):"-(%1(--J%)*+%)%-)!(/%;():%&!%.#1,!(+%#*%$4(%!,/.)1(%#.%$4(%!):"-(<%K4(*%$4(%-)!(/%&!%.&/(+F%)%1-#,+%#.%")/$&1-(!%&!%"/#+,1(+<%H4(!(%")/$&1-(!%)/(%/(:#G(+%./#:%$4(%!):"-(%1(--%;2%)%1)//&(/%3)!F%)*+%)/(%!9("$%&*$#%$4(%>?@%"-)!:)%.#/%)$#:&')$&#*%)*+%&#*&')$&#*%)*+%!,;!(0,(*$%)*)-2!&!<%%
%
0+12%$&345%%%%C14(:)$&1%5&)3/):%#.%$4(%6)!(/%=;-)$&#*%C2!$(:%
&
!"#$%&'()"*+,-&67#*$8&9,8:,-$-*#&H4(%-)!(/%);-)$&#*%!2!$(:%&!%1#:"#!(+%#.%$4(%.#--#9&*3%1#:"#*(*$!<%%
!"#$%&9"(+-$*;%H4(%-)!(/%1);&*($%1#*$)&*!%$4(%-)!(/%&$!(-.F%)--%#"$&1!F%)"(/$,/(!F%-&34$&*3%($1<%H4(%!):"-(%1(--%#*%$4(%$/)*!-)$&#*%!$)3(%&!%()!&-2%",--(+%.#/9)/+%.#/%)11(!!%$#%$4(%!):"-(%1(--<%H4(%(-(1$/#*&1!%&*%$4(%1);&*($%)/(%"#9(/(+%;2%)%!:)--%+(!L$#"%M;/&1LM%$/)*!.#/:(/<%
9,,)$%<.,=$%&62::)7;&H4(%1##-(/N"#9(/%!,""-2%"/#G&+(!%"#9(/%.#/%$4(%-)!(/%)*+%1&/1,-)$(!%1##-(+%9)$(/%$4/#,34%$4(%-)!(/%4()+<%
>,#*&9,8:2*$%;%H4(%!2!$(:%&!%1#*$/#--(+%;2%)%"(/!#*)-%1#:",$(/<%>*%:#!$%1)!(!F%$4(%!,""-&(+%@?%!4#,-+%;(%,!(+F%)-$4#,34%)*#$4(/%1#:",$(/%1)*%;(%,!(+%&.%/(0,&/(+<%H4(%4#!$%1#:",$(/%/,*!%$4(%5&3&6)'O%78%!#.$9)/(F%94&14%1#*$/#-!%!):"-(%"#!&$&#*&*3F%-)!(/%.&/&*3F%1):(/)%#"(/)$&#*F%!):"-(%1(--%&--,:&*)$&#*F%)*+%3)!%.-#9<%%
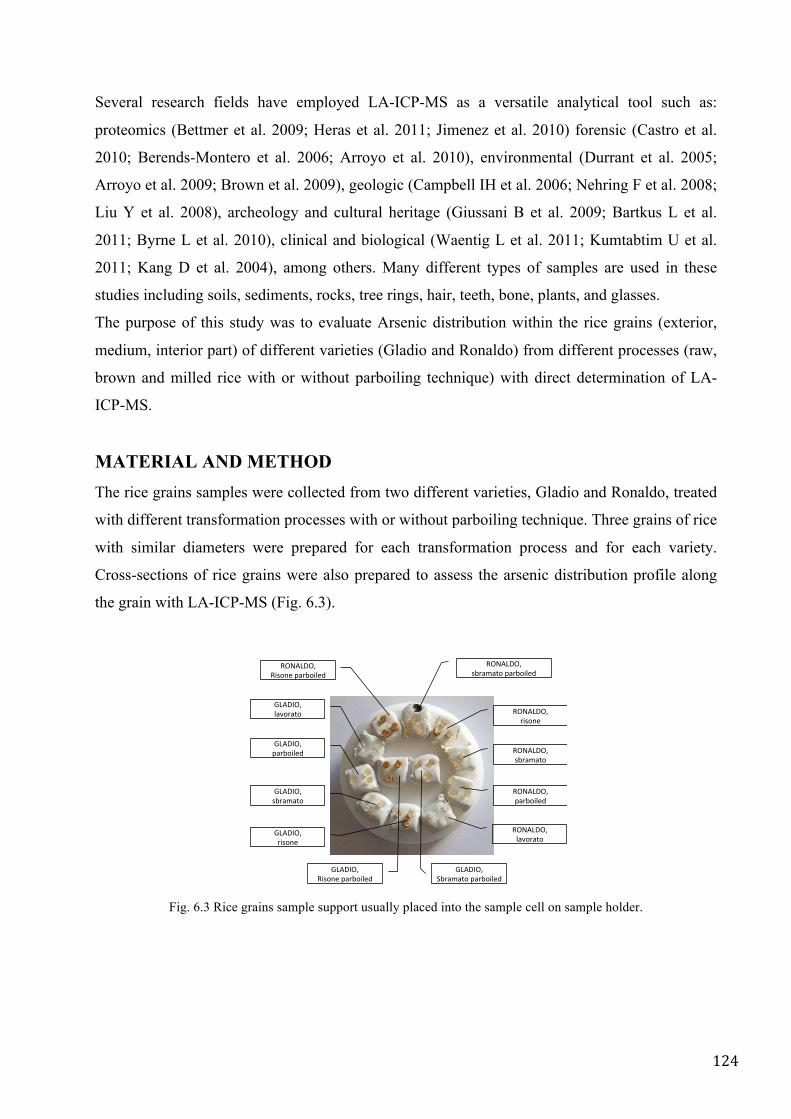
124
Several research fields have employed LA-ICP-MS as a versatile analytical tool such as:
proteomics (Bettmer et al. 2009; Heras et al. 2011; Jimenez et al. 2010) forensic (Castro et al.
2010; Berends-Montero et al. 2006; Arroyo et al. 2010), environmental (Durrant et al. 2005;
Arroyo et al. 2009; Brown et al. 2009), geologic (Campbell IH et al. 2006; Nehring F et al. 2008;
Liu Y et al. 2008), archeology and cultural heritage (Giussani B et al. 2009; Bartkus L et al.
2011; Byrne L et al. 2010), clinical and biological (Waentig L et al. 2011; Kumtabtim U et al.
2011; Kang D et al. 2004), among others. Many different types of samples are used in these
studies including soils, sediments, rocks, tree rings, hair, teeth, bone, plants, and glasses.
The purpose of this study was to evaluate Arsenic distribution within the rice grains (exterior,
medium, interior part) of different varieties (Gladio and Ronaldo) from different processes (raw,
brown and milled rice with or without parboiling technique) with direct determination of LA-
ICP-MS.
MATERIAL AND METHOD The rice grains samples were collected from two different varieties, Gladio and Ronaldo, treated
with different transformation processes with or without parboiling technique. Three grains of rice
with similar diameters were prepared for each transformation process and for each variety.
Cross-sections of rice grains were also prepared to assess the arsenic distribution profile along
the grain with LA-ICP-MS (Fig. 6.3).
Fig. 6.3 Rice grains sample support usually placed into the sample cell on sample holder.
!"#$%&"'(()*+,-,./(0,+*/1234(
!"#$%&"'((+1)/53(
!"#$%&"'(()*+,-,./(
!"#$%&"'(0,+*/1234((
!"#$%&"'(2,6/+,./(
7%$&8"'(+1)/53(
7%$&8"'()*+,-,./(
7%$&8"'(0,+*/1234(
7%$&8"'(2,6/+,./(
!"#$%&"'(!1)/53(0,+*/1234(
7%$&8"'(!1)/53(0,+*/1234(
7%$&8"'(9*+,-,./(0,+*/1234(

125
Instrumentation
The LA-ICP-MS experiments were performed using a Nd:YAG deep UV (213 nm) laser ablation
system (CETAC technologies, Nebraska, USA) coupled to an ICP-MS (Agilent 7700x, Agilent
Technologies, USA). The detailed experimental conditions are described in the Table 6.1. The
inert gas used to transport the sample aerosol from the ablation chamber to the ICP-MS was a
mixture containing argon and helium.
Table 6.1. Operational parameters for ICP-MS and LA-ICP-MS determinations
LA-ICP-MS instrumental parameters (LSX-213 G2) Parameters Laser warm-up time (s) 40 Laser output (%) 60 Repetition rate (Hz) 10 Spot size (µm) 100
Energy delivered (%) 100 Fluence (J cm-2) 7.2
ICP-MS instrumental parameters (Agilent 7700x) Parameters RF power (kW) 1.45 Lens voltage (V) 5.5 Argon nebulizer flow rate (L min-1) 0.5 Argon auxiliary flow rate (L min-1) 1.2 Argon coolant flow rate (L min-1) 15 Dwell time (ms) 100 Isotopes monitored (m/z) 75As 13C
RESULTS AND DISCUSSION The application of Laser Ablation is based on single point selection. Actually, it is possible to set
the location of the spot on the sample image (Fig. 6.5). These laser ablation conditions were
employed to achieve a good spatial resolution and satisfactory analytical signals in order to build
the elemental bio-image of Arsenic distribution. In Fig. 6.4 there are typical analytical signals
obtained for one ablation spot on a rice grain surface (from Parboiled Gladio) under optimized
conditions (Energy: 100%).
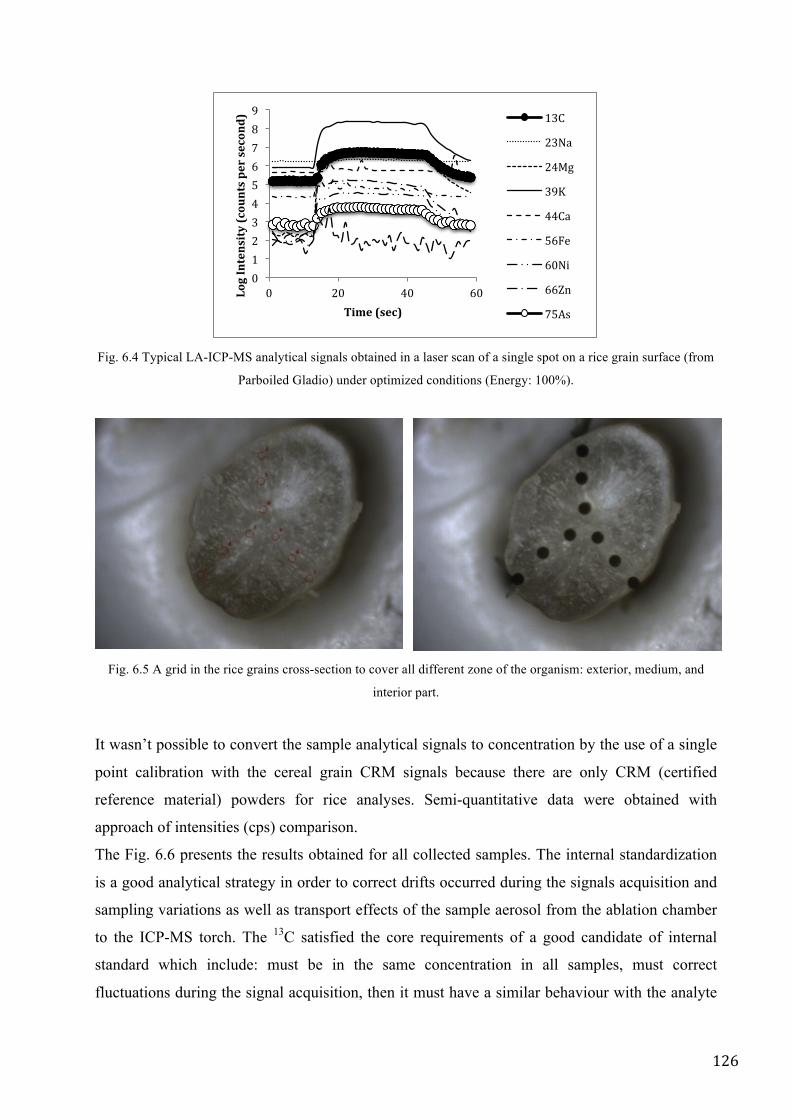
126
Fig. 6.4 Typical LA-ICP-MS analytical signals obtained in a laser scan of a single spot on a rice grain surface (from
Parboiled Gladio) under optimized conditions (Energy: 100%).
Fig. 6.5 A grid in the rice grains cross-section to cover all different zone of the organism: exterior, medium, and
interior part.
It wasn’t possible to convert the sample analytical signals to concentration by the use of a single
point calibration with the cereal grain CRM signals because there are only CRM (certified
reference material) powders for rice analyses. Semi-quantitative data were obtained with
approach of intensities (cps) comparison.
The Fig. 6.6 presents the results obtained for all collected samples. The internal standardization
is a good analytical strategy in order to correct drifts occurred during the signals acquisition and
sampling variations as well as transport effects of the sample aerosol from the ablation chamber
to the ICP-MS torch. The 13C satisfied the core requirements of a good candidate of internal
standard which include: must be in the same concentration in all samples, must correct
fluctuations during the signal acquisition, then it must have a similar behaviour with the analyte
0 1 2 3 4 5 6 7 8 9
0 20 40 60 Log Intensity (counts per second)
Time (sec)
13C
23Na
24Mg
39K
44Ca
56Fe
60Ni
66Zn
75As
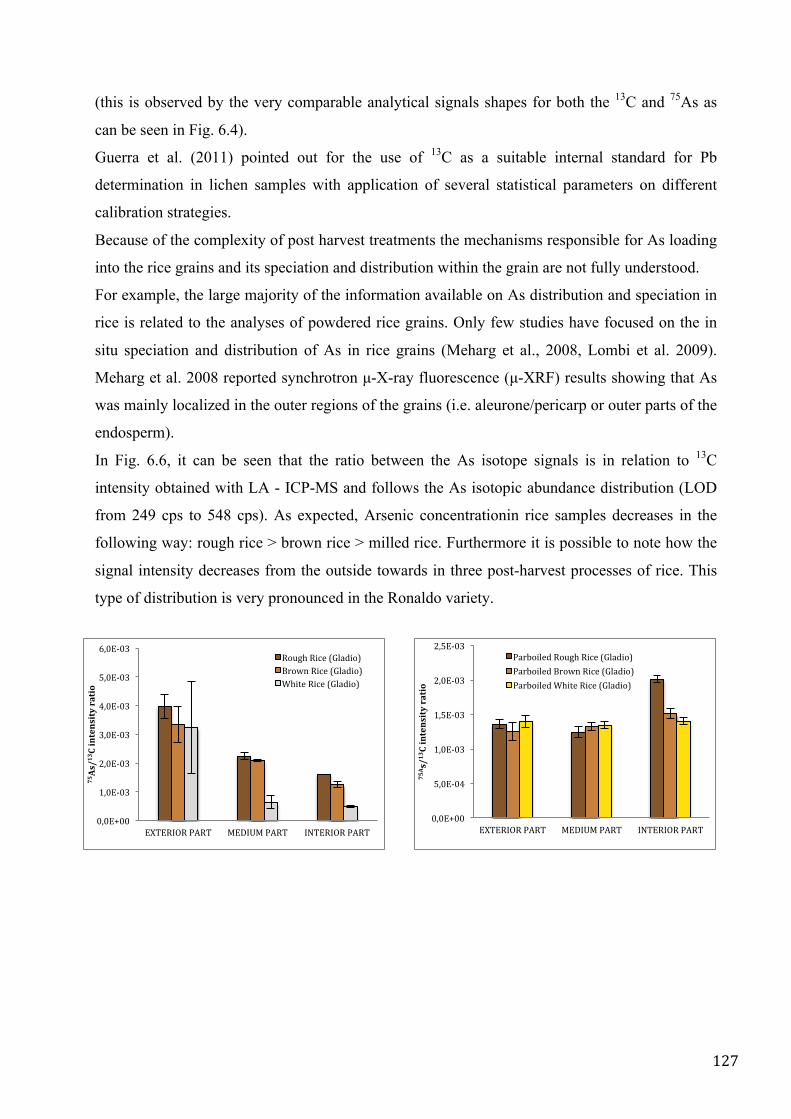
127
(this is observed by the very comparable analytical signals shapes for both the 13C and 75As as
can be seen in Fig. 6.4).
Guerra et al. (2011) pointed out for the use of 13C as a suitable internal standard for Pb
determination in lichen samples with application of several statistical parameters on different
calibration strategies.
Because of the complexity of post harvest treatments the mechanisms responsible for As loading
into the rice grains and its speciation and distribution within the grain are not fully understood.
For example, the large majority of the information available on As distribution and speciation in
rice is related to the analyses of powdered rice grains. Only few studies have focused on the in
situ speciation and distribution of As in rice grains (Meharg et al., 2008, Lombi et al. 2009).
Meharg et al. 2008 reported synchrotron µ-X-ray fluorescence (µ-XRF) results showing that As
was mainly localized in the outer regions of the grains (i.e. aleurone/pericarp or outer parts of the
endosperm).
In Fig. 6.6, it can be seen that the ratio between the As isotope signals is in relation to 13C
intensity obtained with LA - ICP-MS and follows the As isotopic abundance distribution (LOD
from 249 cps to 548 cps). As expected, Arsenic concentrationin rice samples decreases in the
following way: rough rice > brown rice > milled rice. Furthermore it is possible to note how the
signal intensity decreases from the outside towards in three post-harvest processes of rice. This
type of distribution is very pronounced in the Ronaldo variety.
0,0E+00
1,0E-‐03
2,0E-‐03
3,0E-‐03
4,0E-‐03
5,0E-‐03
6,0E-‐03
EXTERIOR PART MEDIUM PART INTERIOR PART
75As/1
3 C intensity ratio
Rough Rice (Gladio) Brown Rice (Gladio) White Rice (Gladio)
0,0E+00
5,0E-‐04
1,0E-‐03
1,5E-‐03
2,0E-‐03
2,5E-‐03
EXTERIOR PART MEDIUM PART INTERIOR PART
75A s/1
3 C intensity ratio
Parboiled Rough Rice (Gladio) Parboiled Brown Rice (Gladio) Parboiled White Rice (Gladio)
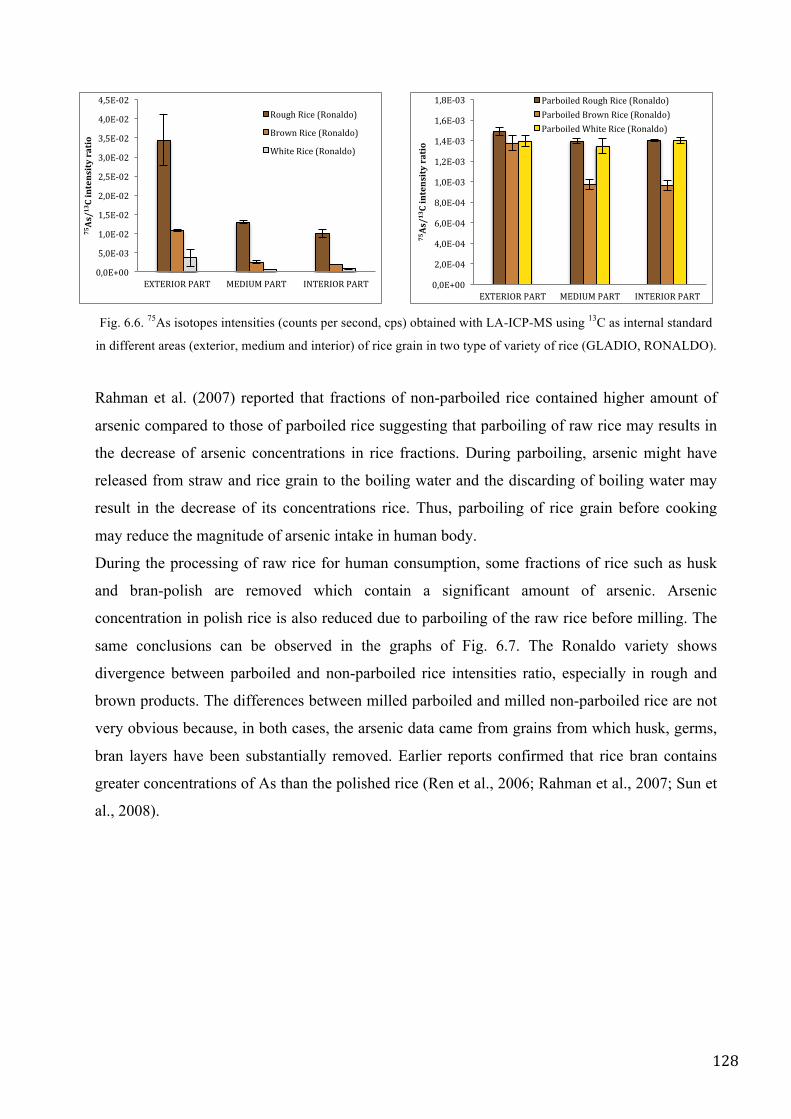
128
Fig. 6.6. 75As isotopes intensities (counts per second, cps) obtained with LA-ICP-MS using 13C as internal standard
in different areas (exterior, medium and interior) of rice grain in two type of variety of rice (GLADIO, RONALDO).
Rahman et al. (2007) reported that fractions of non-parboiled rice contained higher amount of
arsenic compared to those of parboiled rice suggesting that parboiling of raw rice may results in
the decrease of arsenic concentrations in rice fractions. During parboiling, arsenic might have
released from straw and rice grain to the boiling water and the discarding of boiling water may
result in the decrease of its concentrations rice. Thus, parboiling of rice grain before cooking
may reduce the magnitude of arsenic intake in human body.
During the processing of raw rice for human consumption, some fractions of rice such as husk
and bran-polish are removed which contain a significant amount of arsenic. Arsenic
concentration in polish rice is also reduced due to parboiling of the raw rice before milling. The
same conclusions can be observed in the graphs of Fig. 6.7. The Ronaldo variety shows
divergence between parboiled and non-parboiled rice intensities ratio, especially in rough and
brown products. The differences between milled parboiled and milled non-parboiled rice are not
very obvious because, in both cases, the arsenic data came from grains from which husk, germs,
bran layers have been substantially removed. Earlier reports confirmed that rice bran contains
greater concentrations of As than the polished rice (Ren et al., 2006; Rahman et al., 2007; Sun et
al., 2008).
0,0E+00
5,0E-‐03
1,0E-‐02
1,5E-‐02
2,0E-‐02
2,5E-‐02
3,0E-‐02
3,5E-‐02
4,0E-‐02
4,5E-‐02
EXTERIOR PART MEDIUM PART INTERIOR PART
75As/1
3 C intensity ratio
Rough Rice (Ronaldo)
Brown Rice (Ronaldo)
White Rice (Ronaldo)
0,0E+00
2,0E-‐04
4,0E-‐04
6,0E-‐04
8,0E-‐04
1,0E-‐03
1,2E-‐03
1,4E-‐03
1,6E-‐03
1,8E-‐03
EXTERIOR PART MEDIUM PART INTERIOR PART
75As/1
3 C intensity ratio
Parboiled Rough Rice (Ronaldo) Parboiled Brown Rice (Ronaldo) Parboiled White Rice (Ronaldo)
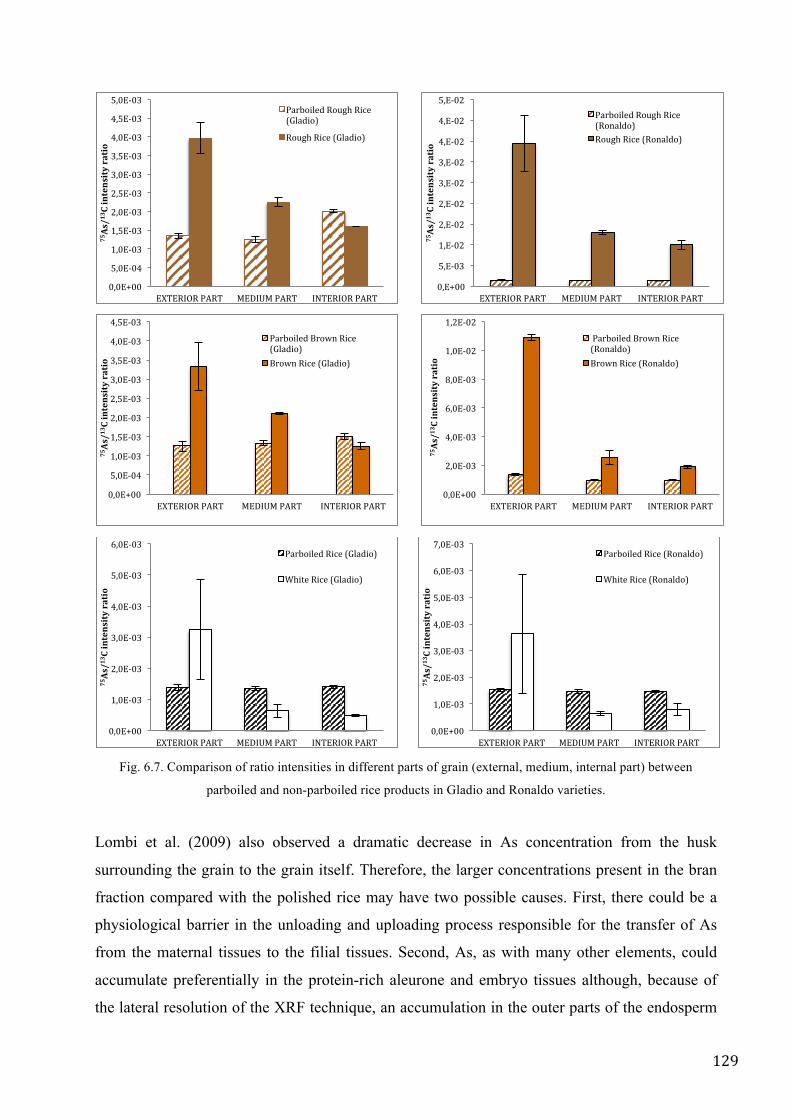
129
Fig. 6.7. Comparison of ratio intensities in different parts of grain (external, medium, internal part) between
parboiled and non-parboiled rice products in Gladio and Ronaldo varieties.
Lombi et al. (2009) also observed a dramatic decrease in As concentration from the husk
surrounding the grain to the grain itself. Therefore, the larger concentrations present in the bran
fraction compared with the polished rice may have two possible causes. First, there could be a
physiological barrier in the unloading and uploading process responsible for the transfer of As
from the maternal tissues to the filial tissues. Second, As, as with many other elements, could
accumulate preferentially in the protein-rich aleurone and embryo tissues although, because of
the lateral resolution of the XRF technique, an accumulation in the outer parts of the endosperm
0,0E+00
5,0E-‐04
1,0E-‐03
1,5E-‐03
2,0E-‐03
2,5E-‐03
3,0E-‐03
3,5E-‐03
4,0E-‐03
4,5E-‐03
5,0E-‐03
EXTERIOR PART MEDIUM PART INTERIOR PART
75As/1
3 C intensity ratio
Parboiled Rough Rice (Gladio)
Rough Rice (Gladio)
0,E+00
5,E-‐03
1,E-‐02
2,E-‐02
2,E-‐02
3,E-‐02
3,E-‐02
4,E-‐02
4,E-‐02
5,E-‐02
EXTERIOR PART MEDIUM PART INTERIOR PART
75As/1
3 C intensity ratio
Parboiled Rough Rice (Ronaldo) Rough Rice (Ronaldo)
0,0E+00
5,0E-‐04
1,0E-‐03
1,5E-‐03
2,0E-‐03
2,5E-‐03
3,0E-‐03
3,5E-‐03
4,0E-‐03
4,5E-‐03
EXTERIOR PART MEDIUM PART INTERIOR PART
75As/1
3 C intensity ratio
Parboiled Brown Rice (Gladio) Brown Rice (Gladio)
0,0E+00
2,0E-‐03
4,0E-‐03
6,0E-‐03
8,0E-‐03
1,0E-‐02
1,2E-‐02
EXTERIOR PART MEDIUM PART INTERIOR PART
75As/1
3 C intensity ratio
Parboiled Brown Rice (Ronaldo) Brown Rice (Ronaldo)
0,0E+00
1,0E-‐03
2,0E-‐03
3,0E-‐03
4,0E-‐03
5,0E-‐03
6,0E-‐03
EXTERIOR PART MEDIUM PART INTERIOR PART
75As/1
3 C intensity ratio
Parboiled Rice (Gladio)
White Rice (Gladio)
0,0E+00
1,0E-‐03
2,0E-‐03
3,0E-‐03
4,0E-‐03
5,0E-‐03
6,0E-‐03
7,0E-‐03
EXTERIOR PART MEDIUM PART INTERIOR PART
75As/1
3 C intensity ratio
Parboiled Rice (Ronaldo)
White Rice (Ronaldo)
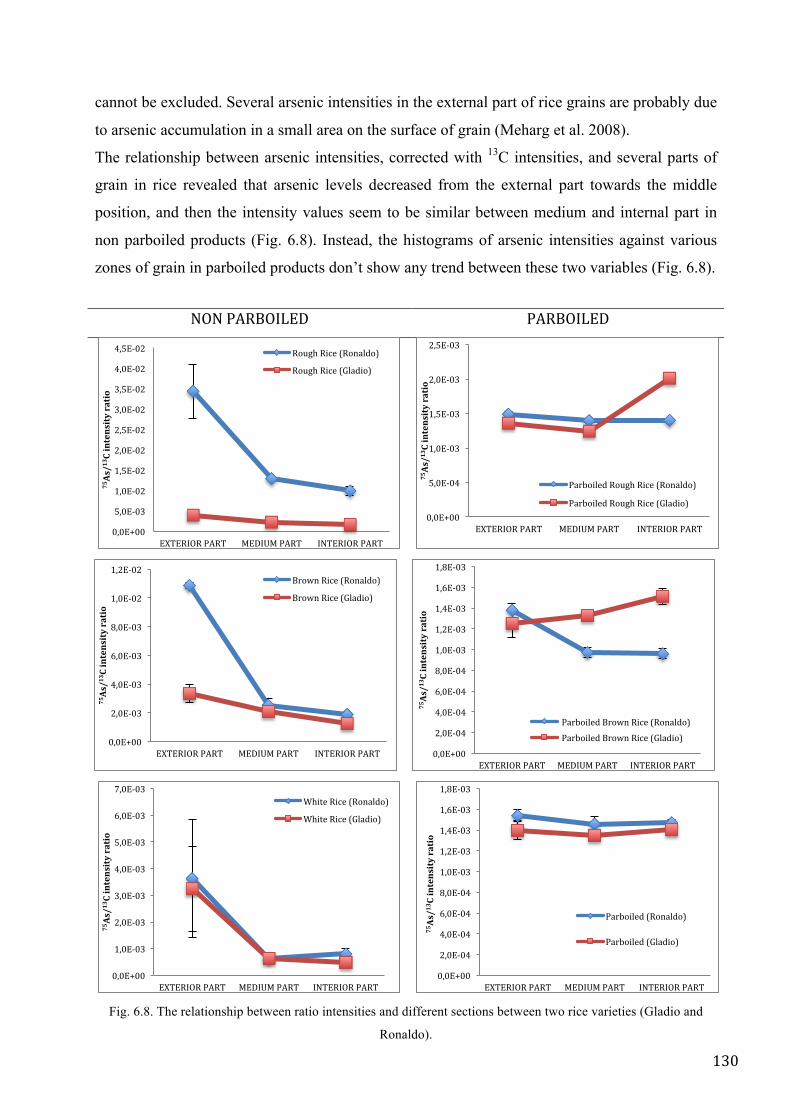
130
cannot be excluded. Several arsenic intensities in the external part of rice grains are probably due
to arsenic accumulation in a small area on the surface of grain (Meharg et al. 2008).
The relationship between arsenic intensities, corrected with 13C intensities, and several parts of
grain in rice revealed that arsenic levels decreased from the external part towards the middle
position, and then the intensity values seem to be similar between medium and internal part in
non parboiled products (Fig. 6.8). Instead, the histograms of arsenic intensities against various
zones of grain in parboiled products don’t show any trend between these two variables (Fig. 6.8).
NON PARBOILED PARBOILED
Fig. 6.8. The relationship between ratio intensities and different sections between two rice varieties (Gladio and
Ronaldo).
0,0E+00
5,0E-‐03
1,0E-‐02
1,5E-‐02
2,0E-‐02
2,5E-‐02
3,0E-‐02
3,5E-‐02
4,0E-‐02
4,5E-‐02
EXTERIOR PART MEDIUM PART INTERIOR PART
75As/1
3 C intensity ratio
Rough Rice (Ronaldo)
Rough Rice (Gladio)
0,0E+00
5,0E-‐04
1,0E-‐03
1,5E-‐03
2,0E-‐03
2,5E-‐03
EXTERIOR PART MEDIUM PART INTERIOR PART
75As/1
3 C intensity ratio
Parboiled Rough Rice (Ronaldo)
Parboiled Rough Rice (Gladio)
0,0E+00
2,0E-‐03
4,0E-‐03
6,0E-‐03
8,0E-‐03
1,0E-‐02
1,2E-‐02
EXTERIOR PART MEDIUM PART INTERIOR PART
75As/1
3 C intensity ratio
Brown Rice (Ronaldo)
Brown Rice (Gladio)
0,0E+00
2,0E-‐04
4,0E-‐04
6,0E-‐04
8,0E-‐04
1,0E-‐03
1,2E-‐03
1,4E-‐03
1,6E-‐03
1,8E-‐03
EXTERIOR PART MEDIUM PART INTERIOR PART
75As/1
3 C intensity ratio
Parboiled Brown Rice (Ronaldo)
Parboiled Brown Rice (Gladio)
0,0E+00
1,0E-‐03
2,0E-‐03
3,0E-‐03
4,0E-‐03
5,0E-‐03
6,0E-‐03
7,0E-‐03
EXTERIOR PART MEDIUM PART INTERIOR PART
75As/1
3 C intensity ratio
White Rice (Ronaldo)
White Rice (Gladio)
0,0E+00
2,0E-‐04
4,0E-‐04
6,0E-‐04
8,0E-‐04
1,0E-‐03
1,2E-‐03
1,4E-‐03
1,6E-‐03
1,8E-‐03
EXTERIOR PART MEDIUM PART INTERIOR PART
75As/1
3 C intensity ratio
Parboiled (Ronaldo)
Parboiled (Gladio)
131
CONCLUSIONS LA-ICP-MS emerges as a potential analytical technique for As intensity estimation in rice
samples. The minimum amount of sample required (few mg in a laser shot) and minimization of
waste generation are significant analytical advantages of this approach.
The effectiveness of arsenic reduction in a parboiling process suggests that consuming parboiled
rice may be a rapid and cost-effective means to improve the amount of safety rice intake. Further
research is required to optimise the arsenic localisation inside the grain under different post
harvest treatments with different varieties. Actually, Rahman et al. (2007) revealed that As
uptake into plant might differ with the varieties of same species.
132
REFERENCES Arroyo L, Trejos T, Gardinali PR and JR Almirall. 2009. Optimization and validation of a Laser Ablation
Inductively Coupled Plasma Mass Spectrometry method for the routine analysis of soils and sediments.
Spectrochim. Acta. Part B, 64, 16.
Arroyo L, Trejos T, Hosick T, Machemer S, Almirall JR and PR Gardinali. 2010. Analysis of Soils and Sediments
by Laser Ablation Inductively Coupled Plasma Mass Spectrometry (LA-ICP-MS): An Innovative Tool for
Environmental Forensics Environ. Forensics. 11(4), 315.
Bartkus L, Amarasiriwardena D, Arriaza B, Bellis D and J Yanez. 2011.Exploring lead exposure in ancient Chilean
mummies using a single strand of hair by laser ablation-inductively coupled plasma-mass spectrometry (LA-
ICP-MS). Microchem. J. 98, 267.
Berends-Montero S, Wiarda W, de Joode P and G van der Peijl. 2006. Forensic analysis of float glass using laser
ablation inductively coupled plasma mass spectrometry (LA-ICP-MS): validation of a method. J. Anal. At.
Spectrom. 21, 1185.
Bettmer J, Bayon MM, Encinar JR, Sanchez MLF, de la Campa MRF and AS Medel. 2009.The emerging role of
ICP-MS in proteomic analysis. J. Proteomics. 72, 989. 39.
Bhattacharya KR. 1985. Parboiling of rice. In B.O. Juliano, ed. Rice chemistry and technology, 2nd ed, p. 289-348.
St Paul, MN, USA, Am. Assoc. Cereal Chem.
Brown JC, Jarvis KE, Disch BA, Goddard SL and AS Brown. 2009. Spatial inhomogeneity of metals in particulate
matter on ambient air filters determined by LA-ICP-MS and comparison with acid digestion ICP-MS. J.
Environ. Monit. 11, 2022.
Byrne S, Amarasiriwardena D, Bandak B, Bartkus L, Kane J, Jones J, Yanez J, Arriaza B and L Cornejo. 2010.
Were Chinchorros exposed to arsenic? Arsenic determination in Chinchorro mummies' hair by laser ablation
inductively coupled plasma-mass spectrometry (LA-ICP-MS). Microchem. J. 94, 28.
Campbell IH, Ballard JR, Palin JM, Allen C and A Faunes. 2006. U-Pb Zircon Geochronology of Granitic Rocks
from the Chuquicamata-El Abra Porphyry Copper Belt of Northern Chile: Excimer Laser Ablation ICP-MS
Analysis.. Econ. Geol. 101(7), 1327.
Castro W, Hoogewerff J, Latkoczy C and J R Almirall. 2010. Application of laser ablation (LA-ICP-SF-MS) for the
elemental analysis of bone and teeth samples for discrimination purposes. Forensic Sci. Int. 195, 17.
Durrant SF and NI Ward. 2005. Recent biological and environmental applications of laser ablation inductively
coupled plasma mass spectrometry (LA-ICP-MS). J. Anal. At. Spectrom. 20, 821.
FAO. 1993. Rice in human nutrition, published with the collaboration of the international rice research institute food
and agriculture organization of the united nations. Rome.
Gariboldi, F. 1984. Rice parboiling. FAO Agric. Serv. Bull. 56. Rome, FAO. 73 PP.
Giussani B, Monticelli D and L Rampazzi. 2009. Role of laser ablation–inductively coupled plasma–mass
spectrometry in cultural heritage research: A review. Anal. Chim. Acta. 635, 6.
Guerra MBB, Amarasiriwardena D, Schaefer CEGR, Pereira CD, Spielmann AA, Nóbrega JA and ER Pereira-Filho.
2011. Biomonitoring of lead in Antarctic lichens using laser ablation inductively coupled plasma mass
spectrometry. J. Anal. At. Spectrom. 26,2238.
Hattendorf B, Latkoczy C and D Gunther. 2003. Peer Reviewed: Laser Ablation-ICPMS. It’s the aerosol size that
really matters in this high-throughput technique for ultratrace analysis of solids. Anal. Chem. 15 (1), 341A.
Heras IL, Palomo M and Y Madrid. 2011. Selenoproteins: the key factor in selenium essentiality. State of the art
133
analytical techniques for selenoprotein studies. Anal. Bioanal. Chem. 400, 1717.
Jimenez MS, Rodriguez L, Gomez MT and JR Castillo. 2010. Metal–protein binding losses in proteomic studies by
PAGE–LA-ICP-MS. Talanta. 81, 241.
Kang D, Amarasiriwardena D and AH Goodman. 2004. Application of laser ablation-inductively coupled plasma-
mass spectrometry (LA-ICP-MS) to investigate trace metal spatial distributions in human tooth enamel and
dentine growth layers and pulp. Anal. Bioanal. Chem. 378, 1608.
Kumtabtim U, Siripinyanond A, Auray-Blais C, Ntwari A and JS Becker. 2011. Analysis of trace metals in single
droplet of urine by laser ablation inductively coupled plasma mass spectrometry. Int. J. Mass Spectrom.
2011.
Liu Y, Hu Z, Gao S, Gunther D, Xu J, Gao C and H Chen. 2008. In situ analysis of major and trace elements of
anhydrous minerals by LA-ICP-MS without applying an internal standard. Chem. Geol. 257, 34.
Lombi E, Scheckel KG, Pallon J, Carey AM, Zhu YG and AA Meharg. 2009. Speciation and distribution of arsenic
and localization of nutrients in rice grains. 2009. New Phytologist. 184: 193–201.
Nehring F, Jacob DE, Barth MG and SF Foley. 2008. Laser-ablation ICP-MS analysis of siliceous rock glasses
fused on an iridium strip heater using MgO dilution. Microchim. Acta. 160, 153.
Padua AB and BO Juliano. 1974. Effect of parboiling on thiarnin, protein and fat of rice. J. Sci. Food Agric. 25:
697-701.
Pillaiyar P. 1988. Rice postproduction manual. New Delhi, Wiley Eastern Ltd. pp 437.
Rahman MA, Hasegawa H, Rahman MM, Rahman MA and MA Miah. 2007. Accumulation of arsenic in tissues of
rice plant (Oryza sativa L.) and its distribution in fractions of rice grain. Chemosphere. 69: 942–948.
Rahman MA, Hasegawa H, Rahman MM, Rahman MA and MAM Miah. 2007. Accumulation of arsenic in tissues
of rice plant (Oryza sativa L.) and its distribution in fractions of rice grain. Chemosphere. 69 (6), 942–948.
Ren XL, Liu QL, Wu DX and QY Shu. 2006. Variations in concentration and distribution of health-related elements
affected by environmental and genotypic differences in rice grains. Rice Science. 13: 170–178.
Sun GX, Williams PN, Carey AM, Zhu YG, Deacon C, Raab A, Feldmann J, Islam RM and AA Meharg. 2008.
Inorganic arsenic in rice bran and its products are an order of magnitude higher than in bulk grain.
Environmental Science Technology. 42: 7542–7546.
Waentig L, Jakubowski N and PH Roos. 2011. Multi-parametric analysis of cytochrome P450 expression in rat liver
microsomes by LA-ICP-MS. J. Anal. At. Spectrom. 26, 310.

134

135
CONCLUSION

136
137
Chapter VII. Conclusion and Future Prespectives.
Arsenic is one of the most studied elements for human health implications. The total
concentration of this element is usually reported without differentiating the arsenic species, but
its toxicity depends on the chemical forms.
DGT technique, a tool to assess the potential availability of pollutants, is suitable for
simultaneous determination of labile Arsenic in groundwater, over a wide pH range. Moreover
organic arsenic species, like DMA(V) and MMA(V), are identified in DGT resin and they could
contribute to total As concentration.
In groundwater samples, the presence of anions and cations, at concentrations up to 4 fold higher
than those expected in unpolluted natural water, has no significant effect on the accumulation of
As by DGT. It is essential to monitor the drinking water resources, like groundwater, and it is
necessary to perform further investigations about seasonal variations of arsenic speciation in
groundwater for future applications. The use of these devices could be very useful to obtain
measurements of lower concentrations, taking advantage of the pre-concentration ability of
DGT. Moreover, the detection of different arsenic species may be possible with the application
of the appropriate pore size DGT in a water sample containing humic acids. It is necessary to
investigate the behaviour of different chemical forms of arsenic with natural organic matter such
as fulvic acid, because different authors (Simeoni et al. 2003; Grafe et al. 2001; Redman et al.
2002) have reported that fulvic acids can inhibit the adsorption of As(V) and As(III) at the iron-
hydroxide surface. This type of deepening may help to improve the application of the DGT
devices in different matrices such as soil.
For many years contaminated water has been assigned as the main source for human exposure to
inorganic arsenic. However, a recent epidemiological research indicated that inorganic As has
detrimental human health effects at exposures much lower than previously thought, and in areas
where levels of inorganic As in drinking water are not excessive (Navas-acien et al. 2008). More
recently, however, rice and rice-based products have been identified as significant dietary
sources of inorganic arsenic (Meharg et al., 2008; Signes-Pastor et al., 2009). Our study, based
on different types of rice grains from different areas of Northern Italy, shows that inorganic As is
the main species present in rice samples and a low amount of DMA(V) is also detected. A
general validation of extraction methods based on 0.28 M nitric acid at 95 °C for different type
of rice has been strengthened in this study by results for As(III) and As(V) speciation
comparable to NIST CRM 1568a and IMEP-107 (certificated or literature values).
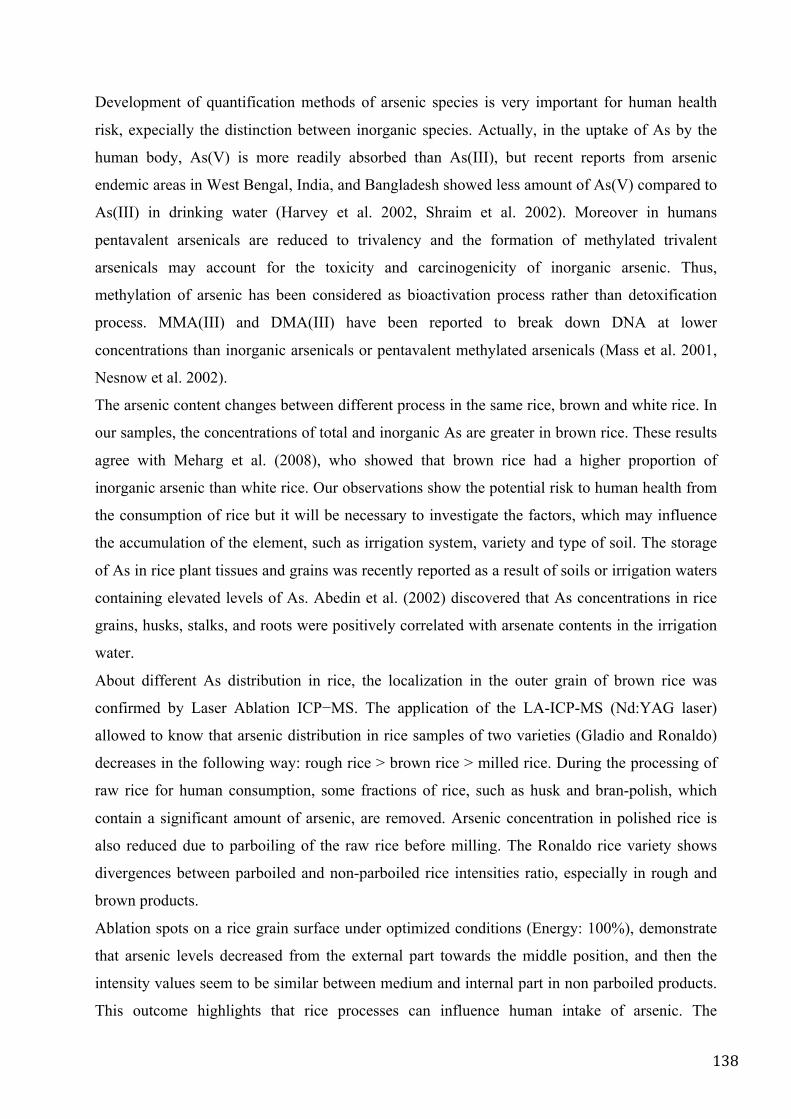
138
Development of quantification methods of arsenic species is very important for human health
risk, expecially the distinction between inorganic species. Actually, in the uptake of As by the
human body, As(V) is more readily absorbed than As(III), but recent reports from arsenic
endemic areas in West Bengal, India, and Bangladesh showed less amount of As(V) compared to
As(III) in drinking water (Harvey et al. 2002, Shraim et al. 2002). Moreover in humans
pentavalent arsenicals are reduced to trivalency and the formation of methylated trivalent
arsenicals may account for the toxicity and carcinogenicity of inorganic arsenic. Thus,
methylation of arsenic has been considered as bioactivation process rather than detoxification
process. MMA(III) and DMA(III) have been reported to break down DNA at lower
concentrations than inorganic arsenicals or pentavalent methylated arsenicals (Mass et al. 2001,
Nesnow et al. 2002).
The arsenic content changes between different process in the same rice, brown and white rice. In
our samples, the concentrations of total and inorganic As are greater in brown rice. These results
agree with Meharg et al. (2008), who showed that brown rice had a higher proportion of
inorganic arsenic than white rice. Our observations show the potential risk to human health from
the consumption of rice but it will be necessary to investigate the factors, which may influence
the accumulation of the element, such as irrigation system, variety and type of soil. The storage
of As in rice plant tissues and grains was recently reported as a result of soils or irrigation waters
containing elevated levels of As. Abedin et al. (2002) discovered that As concentrations in rice
grains, husks, stalks, and roots were positively correlated with arsenate contents in the irrigation
water.
About different As distribution in rice, the localization in the outer grain of brown rice was
confirmed by Laser Ablation ICP−MS. The application of the LA-ICP-MS (Nd:YAG laser)
allowed to know that arsenic distribution in rice samples of two varieties (Gladio and Ronaldo)
decreases in the following way: rough rice > brown rice > milled rice. During the processing of
raw rice for human consumption, some fractions of rice, such as husk and bran-polish, which
contain a significant amount of arsenic, are removed. Arsenic concentration in polished rice is
also reduced due to parboiling of the raw rice before milling. The Ronaldo rice variety shows
divergences between parboiled and non-parboiled rice intensities ratio, especially in rough and
brown products.
Ablation spots on a rice grain surface under optimized conditions (Energy: 100%), demonstrate
that arsenic levels decreased from the external part towards the middle position, and then the
intensity values seem to be similar between medium and internal part in non parboiled products.
This outcome highlights that rice processes can influence human intake of arsenic. The
139
effectiveness of arsenic reduction in a parboiling process suggests that consuming parboiled rice
may be a rapid and cost-effective means to improve the safety of rice intake. Further research is
required to optimise the arsenic localisation inside the grain under different post harvest
treatments and in different varieties.
LA-ICP-MS, in association with traditional detection technique, could be a potential analytical
technique for estimation of As intensity in rice samples, because this instrument allows the
ablation of any type of solid sample for analysis; there is no need of sample-size requirements
and no sample preparation procedures. In addition, a focused laser beam permits spatial
characterization of heterogeneity in solid samples, with typically micron resolution both in terms
of lateral and depth conditions without changes of matrices.
Investigation of antimony is enclosed in this research in association with study of arsenic
distribution, because the physical and chemical qualities of Sb and As are similar, and it has been
recently recognized as water contaminant. The comprehension of antimony behaviour in aqueous
matrix is very important because many studies were published in which drinking water
contamination from bottle materials was investigated. The first important objectives were
identifying and quantifying the chemical forms of antimony, to provide comprehensive
information about its toxicity and human health relevance. We report the application of HPLC
species- unspecific spike isotope dilution ICP-MS to separate and quantify inorganic Sb species
(Sb(V) and Sb(III)) in aqueous solution using the diffusive gradient in thin films technique. The
toxicity of antimony compounds is approximately ten times lesser than for arsenic, even if it
depends on the oxidation states and structure. This analytical technique combined with Fe-oxide
DGT, as adsorption system in aqueous solution, and EDTA, for preservation of different species,
represent an excellent point of departure for antimony investigation in the environment. Analysis
of Sb species was suitable for the application of Isotope Dilution Analysis (IDA), a well-known
analytical technique based on the measurement of isotope ratios in samples, without uncertainties
about instrumental instabilities such as signal drift or matrix effects. Future applications could
include the study and the identification of methylated antimony species in some environmental
compartments, as little information is known about the behaviour of these species in solution.
Moreover, information on antimony interactions with natural organic matter is very scarce and
does not allow any rigorous conclusion to be drawn regarding its role in the fate of this element
in natural aquatic systems.

140
REFERENCES Abedin MJ, Cotter-Howells JC, Meharg AA. 2002. Arsenic uptake and accumulation in rice (Oryza sativa L.)
irrigated with contaminated water. Plant and Soil, Vol 240, N 2, 311-319.
Grafe M, Eick MJ and PR Grossl. 2001. Adsorption of Arsenate (V) and Arsenite (III) on Goethite in the Presence
and Absence of Dissolved Organic Carbon. Soil Sci. Soc. Am. J. 65, 1680.
Harvey CF, Swartz CH, Badruzzaman ABM, Keon-Blute N, Yu W, Ali MA, Jay J, Beckie R, Niedan V, Brabander
D, Oates PM, Ashfaque KN, Islam S, Hemond HF and MF Ahmed. 2002. Arsenic mobility and
groundwater extraction in Bangladesh. Science. 298, 1602 – 1606.
Mass MJ, Tennant A, Roop BC, Cullen WR, Styblo M, Thomas DJ and AD Kligerman. 2001. Methylated trivalent
arsenic species are genotoxic. Chem. Res. Toxicol. 14, 355–361.
Meharg AA, Sun G, Williams PN, Adomako E, Deacon C, Zhu YG, Feldmann J, Raab A. 2008. Inorganic arsenic
levels in baby rice are of concern. Environ Pollut. 152: 746–749.
Navas-Acien A, Silbergeld EK, Pastor-Barriuso R and E Guallar. 2008. Arsenic exposure and prevalence of type 2
diabetes in US adults. Jama-Journal of the American Medical Association, 300(7), 814–822.
Nesnow S, Roop BC, Lambert G, Kadiiska M, Mason RP, Cullen WR and MJ Mass. 2002. DNA damage induced
by methylated trivalent arsenicals is mediated by reactive oxygen species. Chem. Res. Toxicol. 15, 1627–
1634.
Redman AD, Macalady DL and D Ahmann. 2002. Natural Organic Matter Affects Arsenic Speciation and Sorption
onto Hematite. Environ. Sci. Technol. 36, 2889.
Shraim A, Sekaran NC, Anuradha CD and S Hirano. 2002. Speciation of arsenic in tube-well water samples
collected from West Bengal, India, by high-performance liquid chromatography-inductively coupled plas-
ma mass spectrometry. Appl. Organomet. Chem. 16, 202–209.
Signes-Pastor AJ, Deacon C, Jenkins RO, Haris PI, Carbonell-Barrachina AA and AA Meharg. 2009. Arsenic
speciation in Japanese rice drinks and condiments. Journal of Environmental Monitoring, 11(11), 1930–1934.
Simeoni MA, Batts BD and C McRae. 2003. Effect of groundwater fulvic acid on the adsorption of arsenate by
ferrihydrite and gibbsite. Appl. Geochem. 18, 1507.
141
Acknowledgements
Desidero esprimere la mia gratitudine e apprezzamento alle seguenti persone e istituzioni.
Il Dott. Gian Maria Beone per i preziosissimi insegnamenti durante questi anni di dottorato, per
tutto il tempo dedicato, per il sostegno, per la comprensione e per la contagiosa curiosità.
Il Prof. Ettore Capri, che mi ha permesso di intraprendere questa stupenda e appagante
esperienza all’interno dell’Università.
Istituto di Chimica Agraria e Ambientale per avermi dato l’opportunità di crescere
professionalmente. Un grazie particolare alla Prof.sa Franca Carini per le esperienze che mi ha
permesso di affrontare in completa fiducia e a Laura per aver condiviso “gioie e dolori”.
La Dott.sa Ilenia Cattani per la sua energia e professionalità.
Lancaster Environmental Centre per l’ospitalità, in particolar modo Dr. Hao Zhang e il Dr
Hamid Pouran per i prezioni consigli e per non avermi fatto sentire sola.
Il Prof. Fricano per l’inesuaribile interesse verso la sua professione.
Paolo per essere semplicemente…Paolo! Grazie!
Il ringraziamento più grande va alla Mamma, a Stefano, alla mia stellina Beatrice per
sopportarmi così come sono, senza dimenticare il mio papà e la mia nonna, la quale descriveva
così il mio impegno in Univesità “ma non hai ancora finito di studiare?”.