Embed Size (px)
Citation preview
COMPARATIVE STUDY OF DIFFERENT ENVIRONMENTAL TECHNIQUES IN THE
SECTOR PRODUCING MAGNESIUM OXIDE FROM MAGNESIUM VIA DRY PROCESS
__________________________________________________
February, 2009
Page 2 of 24
INDEX
1. STUDY BACKGROUND, PURPOSE AND SCOPE 3
2. METHODOLOGY FOLLOWED AND RESULTS 5
3. FINAL CONCLUSIONS 10
4. ANNEX: CALCULATIONS AND INITIAL INFORMATION 11
4.1 Direct atmospheric emissions 12
4.1.1 SO2 and particles 12
4.1.2 CO2 14
4.2 Spills into water 18
4.3 Electricity consumption and indirect atmospheric emissions 20
4.4 Water consumption 21
4.5 Summary table 24
Page 3 of 24
1. STUDY BACKGROUND, PURPOSE AND SCOPE
Within the revision framework of the European Commission BREF
documents1, a specific section for magnesium oxide production known
as magnesia from magnesium carbonate (magnesite) via the dry
process is being included in the old BREF cement and lime sector.
Although this activity is not specifically included in the IPPC Directive, its
inclusion has been justified by the competent bodies due to the similarity
in the industrial processes followed in these three sectors, likewise its
consideration as a chemical industry under Directive IPPC Annex I
epigraph 4.2e) .
With references to the techniques described as Best Available
Techniques (BAT) for the sector object of the study, a comparative study
has been carried out to clarify to what extent and for which specific
purpose a certain technique may be considered a BAT, since the
drafting of the last BREF draft2 is considered too confusing and general.
Therefore, there would be regions where some environmental aspects
would be priority against others, yet not necessarily relevant in other
regions (e.g. in areas of southern Europe water availability and quality
are critical aspects, while this may not be so in northern Europe,
furthermore air quality is influenced by air currents carrying particles from
the Sahara desert, which does not occur in other regions). Thus, the
appropriateness of the BAT should be specified and provide sufficient
information for their application in different local ambits.
1 Further information see http://eippcb.jrc.es/
2 Draft Reference Document on Best Available Techniques in the Cement, Lime and
Magnesium Oxide Manufacturing Industries. February 2009.
Page 4 of 24
The study has been limited to the following combined techniques
because they are the ones which caused most doubts in the BREF draft:
� Electrostatic Precipitator (ESP) to reduce particle emissions
and Wet Scrubber (WS) to reduce SO2 emissions. Hereinafter,
ESP+WS.
� Fabric Filters (FF) to reduce particle emissions and Wet
Scrubber (WS) to reduce SO2 emissions after reheating the
waste gas current to increase its performance. Hereinafter,
FF+WSa.
� Fabric Filters (FF) to reduce particle emissions and Wet
Scrubber (WS) to reduce SO2 emissions, without reheating
gases. Hereinafter, FF+WSb.
� Fabric Filters (FF) to reduce particle emissions and dry Sorbent
Injection (dSI) to reduce SO2 emissions. Hereinafter, FF+dSI.
Study results are given for each of these techniques as a range covering
the spectrum of the different fuels used by the sector.
Information sources used for this study are cited throughout the report.
Page 5 of 24
2. METHODOLOGY FOLLOWED AND RESULTS
For each of the above techniques, emissions into air and water, plus the
following consumptions were obtained from the initial information3 to
provide information enabling clarification of the advantages and
inconveniences of the different techniques to determine the most
appropriate and in which situations:
� Emissions into air:
o SO2 emissions after gas purification in concentration
and mass units.
o Particle emissions ones after gas purification in
concentration and mass units.
o Direct CO2 emissions due to gas purification systems
in mass units. These emissions come from additional
fuel consumption (and also new SOs, NOx and CO
emissions would be produced) and chemical
reactions produced in the purification system in such
case.
o Indirect SOs and CO2 emissions due to gas electricity
consumption of gas purification systems in mass
units.
3 Information sources for the execution of this study are included in the annex. Generally, BREF
amendment drafts object of the study were used as sources, information from the industry
itself, IPCC Guidelines for National Greenhouse Gas Inventories and BREF “Economics and
Cross-Media Effects”. Furthermore, information from these sources was contrasted with
that included in the BREF “General Principles of Monitoring” and “Common Waste Water
and Waste Gas Treatment/Management Systems in the Chemical Sector”, with
importance given to any information supplied by the BREF object of study
Page 6 of 24
� Emissions into water due to gas purification in concentration
and mass units.
� Electricity and water consumptions due to gas purification
systems in corresponding consumption units.
Other emissions or impacts were not considered since they caused no
doubts after drafting in the last BREF draft.
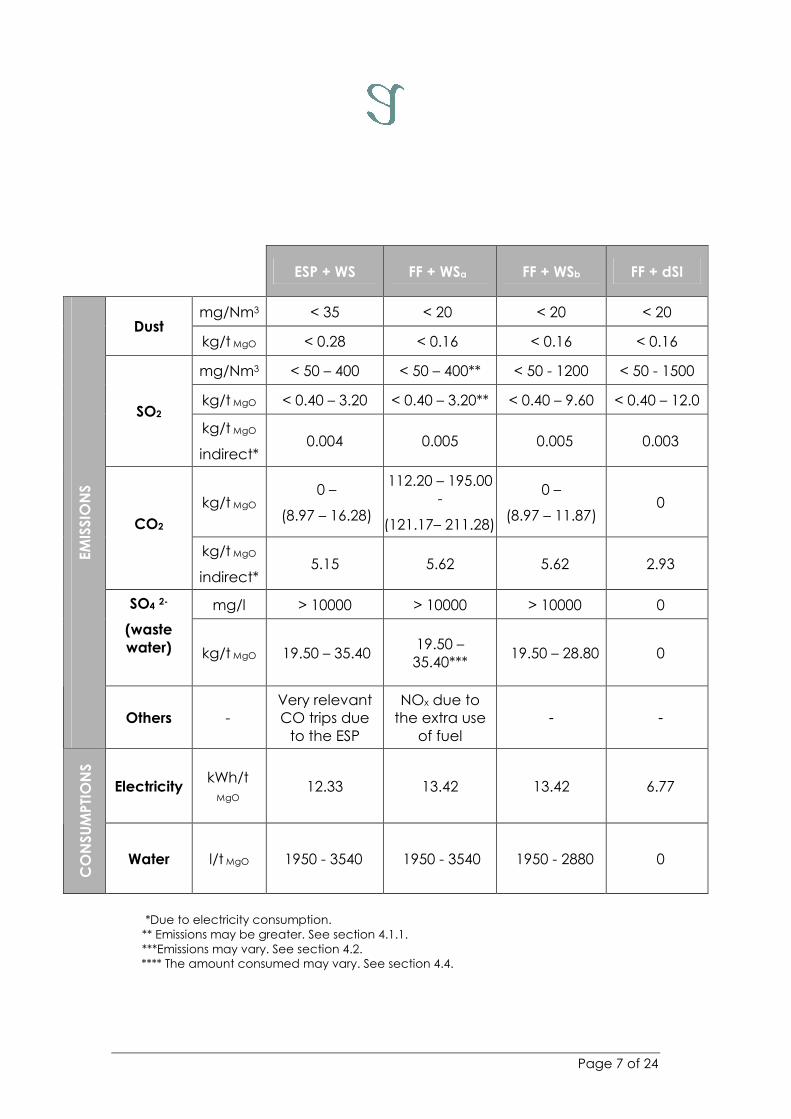
Thus, the following results were obtained as per the calculations and
initial information included in the annex:
Page 7 of 24
*Due to electricity consumption.
** Emissions may be greater. See section 4.1.1.
***Emissions may vary. See section 4.2. **** The amount consumed may vary. See section 4.4.
ESP + WS FF + WSa FF + WSb FF + dSI
mg/Nm3 < 35 < 20 < 20 < 20 Dust
kg/t MgO < 0.28 < 0.16 < 0.16 < 0.16
mg/Nm3 < 50 – 400 < 50 – 400** < 50 - 1200 < 50 - 1500
kg/t MgO < 0.40 – 3.20 < 0.40 – 3.20** < 0.40 – 9.60 < 0.40 – 12.0 SO2
kg/t MgO
indirect* 0.004 0.005 0.005 0.003
kg/t MgO 0 –
(8.97 – 16.28)
112.20 – 195.00
-
(121.17– 211.28)
0 –
(8.97 – 11.87) 0
CO2
kg/t MgO
indirect* 5.15 5.62 5.62 2.93
mg/l > 10000 > 10000 > 10000 0 SO4 2-
(waste
water)
kg/t MgO 19.50 – 35.40 19.50 –
35.40*** 19.50 – 28.80 0
EM
ISS
ION
S
Others -
Very relevant
CO trips due
to the ESP
NOx due to
the extra use
of fuel
- -
Electricity kWh/t
MgO 12.33 13.42 13.42 6.77
CO
NS
UM
PTI
ON
S
Water l/t MgO 1950 - 3540 1950 - 3540 1950 - 2880 0
Page 8 of 24
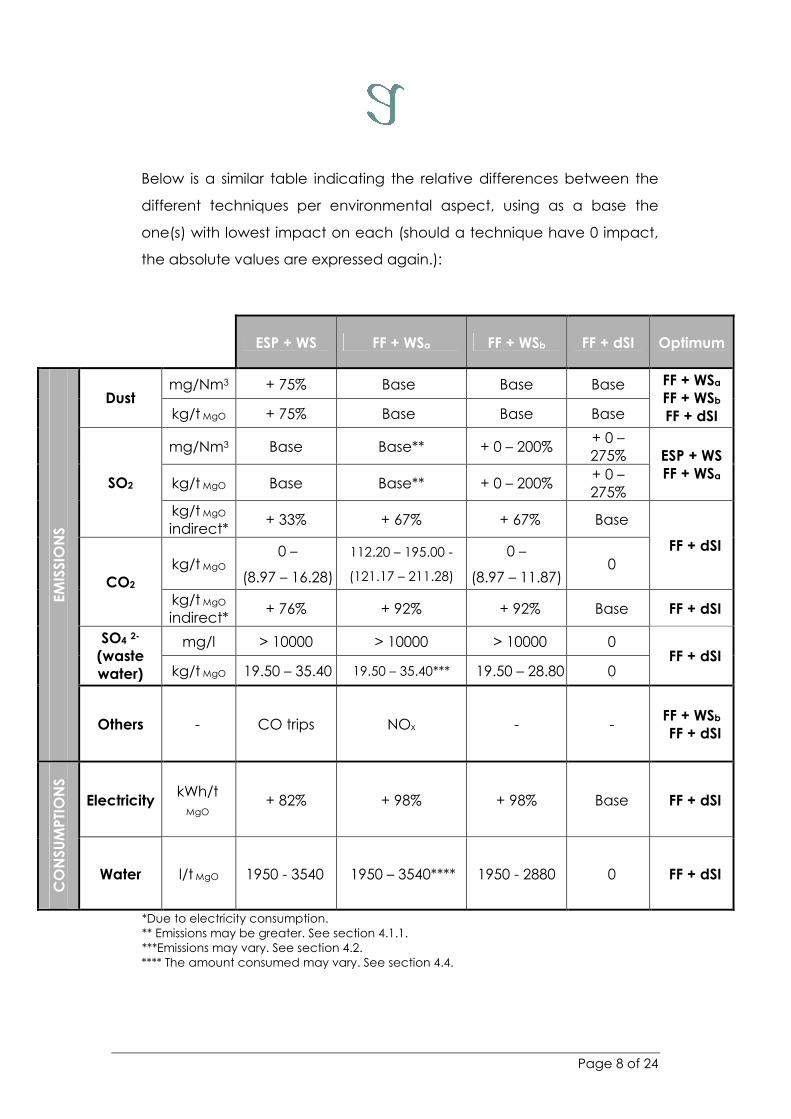
Below is a similar table indicating the relative differences between the
different techniques per environmental aspect, using as a base the
one(s) with lowest impact on each (should a technique have 0 impact,
the absolute values are expressed again.):
*Due to electricity consumption.
** Emissions may be greater. See section 4.1.1.
***Emissions may vary. See section 4.2. **** The amount consumed may vary. See section 4.4.
ESP + WS FF + WSa FF + WSb FF + dSI Optimum
mg/Nm3 + 75% Base Base Base Dust
kg/t MgO + 75% Base Base Base
FF + WSa
FF + WSb
FF + dSI
mg/Nm3 Base Base** + 0 – 200% + 0 –
275%
kg/t MgO Base Base** + 0 – 200% + 0 –
275%
ESP + WS
FF + WSa SO2
kg/t MgO
indirect* + 33% + 67% + 67% Base
kg/t MgO 0 –
(8.97 – 16.28)
112.20 – 195.00 -
(121.17 – 211.28)
0 –
(8.97 – 11.87) 0
FF + dSI
CO2 kg/t MgO
indirect* + 76% + 92% + 92% Base FF + dSI
mg/l > 10000 > 10000 > 10000 0 SO4 2-
(waste
water) kg/t MgO 19.50 – 35.40 19.50 – 35.40*** 19.50 – 28.80 0 FF + dSI
EM
ISS
ION
S
Others - CO trips NOx - - FF + WSb
FF + dSI
Electricity kWh/t
MgO + 82% + 98% + 98% Base FF + dSI
CO
NS
UM
PTI
ON
S
Water l/t MgO 1950 - 3540 1950 – 3540**** 1950 - 2880 0 FF + dSI
Page 9 of 24
Thus, we see the best techniques for SO2 emissions are combinations of
ESP and WS, and FF and WS with gas reheating.
Likewise the best techniques for particle emissions are all linked to FF.
Regarding CO2 emissions associated with the previous techniques, the
least contaminating (in relation to climate change) is the combination FF
+ dSI. Particularly contaminating would be the combination FF+WS with
gas reheating.
In relation to spills, as with the previous case, the technique with least
impact is the combination FF + dSI, with a great difference because it is
a dry process.
Finally, regarding electricity and water consumptions, the optimum
combination is FF + dSI as it consumes no water and consumes less
electricity.
Generally, one can see the combination FF+dSI has a lower impact on a
large number of environmental aspects, in some cases, very
significatively.
Moreover, application of these technologies makes emission control
monitory of the said pollutants necessary. In this sense, as included in the
last BREF draft, on-going monitoring is considered a BAT, as the practice
is virtually infallible, once contrasted and relatively economic4.
4 In the last BREF draft, Draft Reference Document on Best Available Techniques in the
Cement, Lime and Magnesium Oxide Manufacturing Industries. February 2009, on-going or
periodical monitoring is considered a BAT. In any event, advantages are clear at a very
low cost, on-going versus periodical monitory: real time information, workload modification
to influence emissions impossible, absolute representativeness, etc. Nevertheless,
periodical monitoring via sampling, on performing the corresponding laboratory analysis, is
more precise; and considered a necessary complement to on-going monitoring,
corroborated in the BREF “General Principles of Monitoring” July 2003, section 5.1.
Page 10 of 24
3. FINAL CONCLUSIONS
The result of the analysis seems clear there is no technique which is more
appropriate and at the same valid for all the environmental aspects
studied. Therefore, it seems reasonable to assume a separate BAT should
be considered per environmental aspect, unmistakeably indicating its
advantages and disadvantages, i.e. greater efficacy in one or several
environmental aspects, and less efficacy in other or several other
environmental aspects-.
Thus local authorities involved in granting IPPC authorisations or licences,
which in practice are the main destination of BAT documents, or those
involved in any other process referring to BAT application will have
sufficient information to assess the various techniques as per local
conditioning factors (e.g. greater or lesser water availability, deep local
air quality, fuels available, etc.), and is clearly the natural purpose of the
BREF documents.
Page 11 of 24
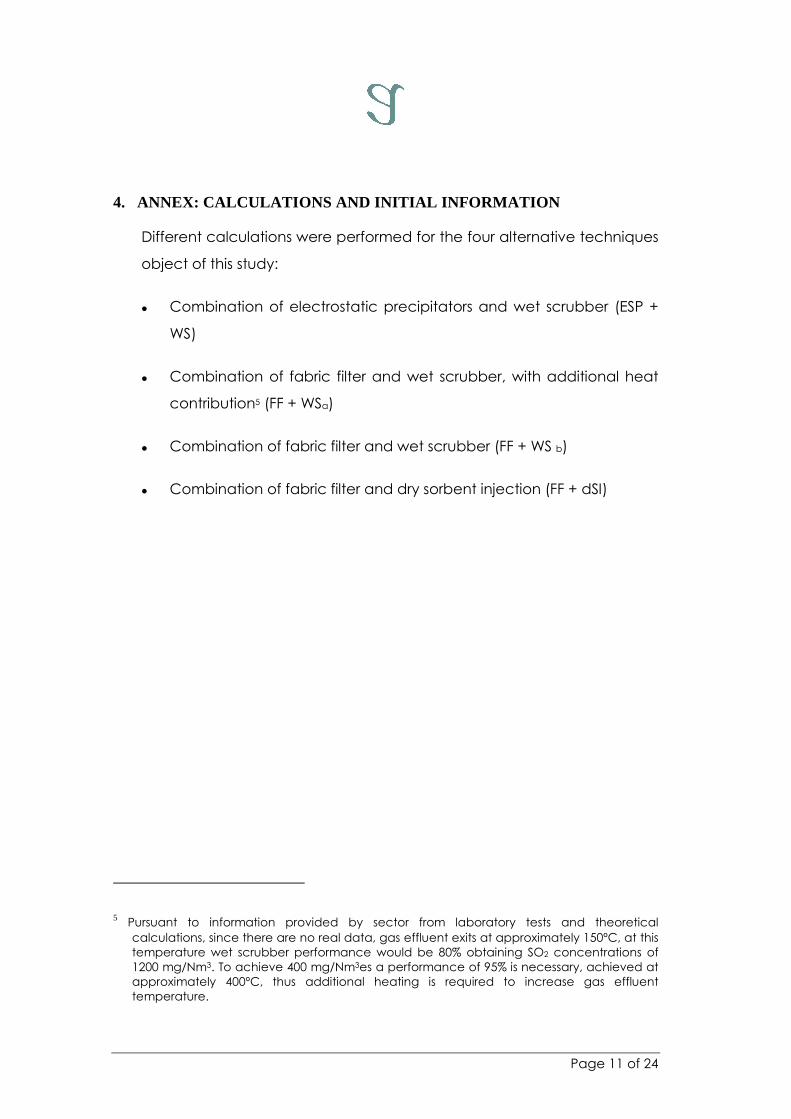
4. ANNEX: CALCULATIONS AND INITIAL INFORMATION
Different calculations were performed for the four alternative techniques
object of this study:
� Combination of electrostatic precipitators and wet scrubber (ESP +
WS)
� Combination of fabric filter and wet scrubber, with additional heat
contribution5 (FF + WSa)
� Combination of fabric filter and wet scrubber (FF + WS b)
� Combination of fabric filter and dry sorbent injection (FF + dSI)
5 Pursuant to information provided by sector from laboratory tests and theoretical
calculations, since there are no real data, gas effluent exits at approximately 150ºC, at this
temperature wet scrubber performance would be 80% obtaining SO2 concentrations of
1200 mg/Nm3. To achieve 400 mg/Nm3es a performance of 95% is necessary, achieved at
approximately 400ºC, thus additional heating is required to increase gas effluent
temperature.
Page 12 of 24
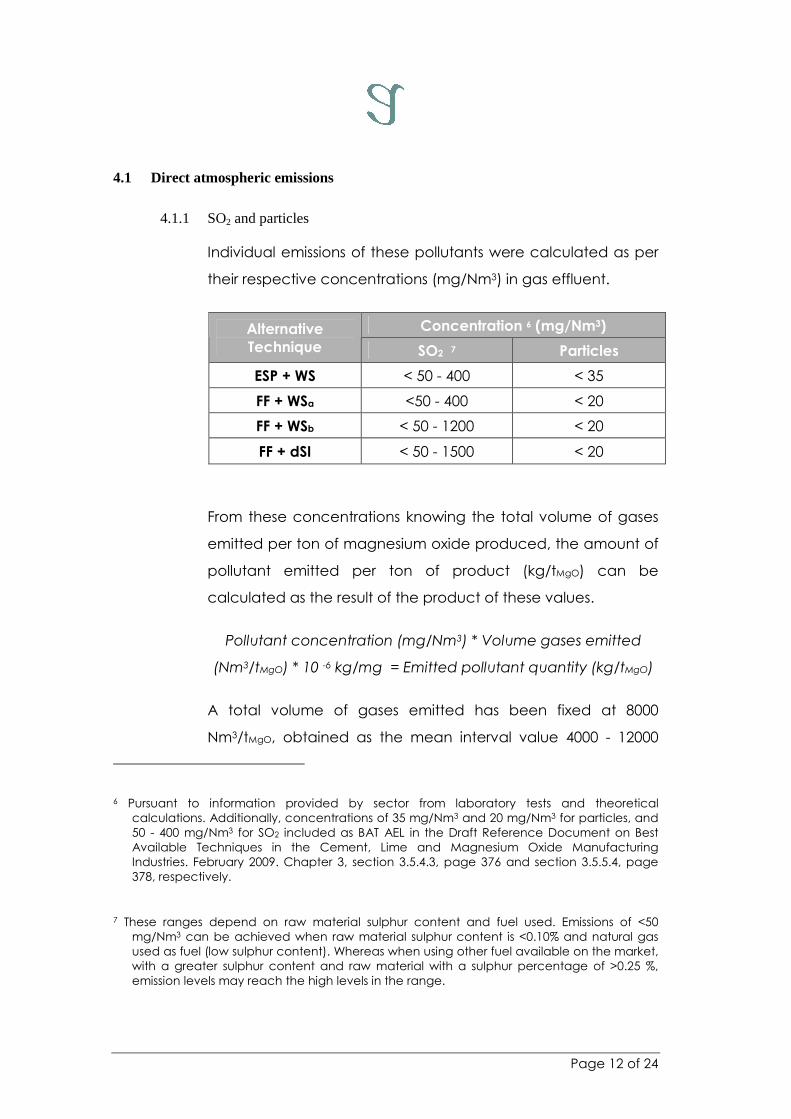
4.1 Direct atmospheric emissions
4.1.1 SO2 and particles
Individual emissions of these pollutants were calculated as per
their respective concentrations (mg/Nm3) in gas effluent.
Concentration 6 (mg/Nm3) Alternative
Technique SO2 7 Particles
ESP + WS < 50 - 400 < 35
FF + WSa <50 - 400 < 20
FF + WSb < 50 - 1200 < 20
FF + dSI < 50 - 1500 < 20
From these concentrations knowing the total volume of gases
emitted per ton of magnesium oxide produced, the amount of
pollutant emitted per ton of product (kg/tMgO) can be
calculated as the result of the product of these values.
Pollutant concentration (mg/Nm3) * Volume gases emitted
(Nm3/tMgO) * 10 -6 kg/mg = Emitted pollutant quantity (kg/tMgO)
A total volume of gases emitted has been fixed at 8000
Nm3/tMgO, obtained as the mean interval value 4000 - 12000
6 Pursuant to information provided by sector from laboratory tests and theoretical
calculations. Additionally, concentrations of 35 mg/Nm3 and 20 mg/Nm3 for particles, and
50 - 400 mg/Nm3 for SO2 included as BAT AEL in the Draft Reference Document on Best
Available Techniques in the Cement, Lime and Magnesium Oxide Manufacturing
Industries. February 2009. Chapter 3, section 3.5.4.3, page 376 and section 3.5.5.4, page
378, respectively.
7 These ranges depend on raw material sulphur content and fuel used. Emissions of <50
mg/Nm3 can be achieved when raw material sulphur content is <0.10% and natural gas
used as fuel (low sulphur content). Whereas when using other fuel available on the market,
with a greater sulphur content and raw material with a sulphur percentage of >0.25 %,
emission levels may reach the high levels in the range.
Page 13 of 24
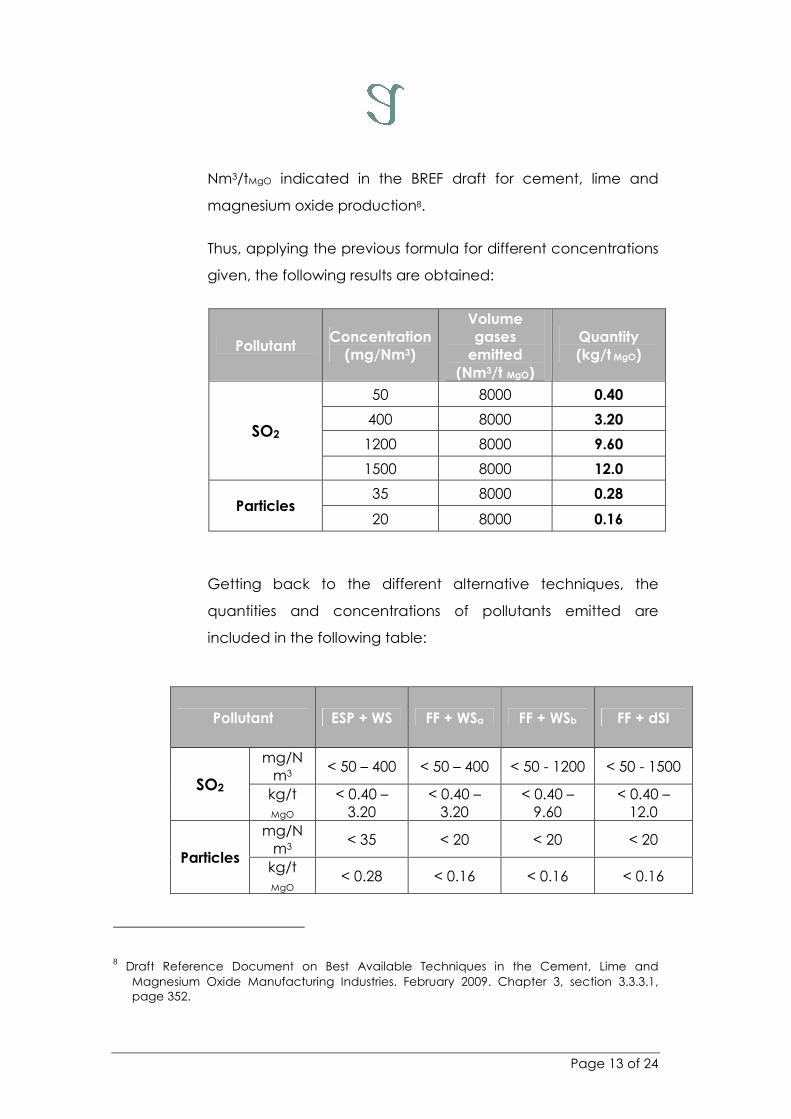
Nm3/tMgO indicated in the BREF draft for cement, lime and
magnesium oxide production8.
Thus, applying the previous formula for different concentrations
given, the following results are obtained:
Pollutant Concentration
(mg/Nm3)
Volume
gases
emitted
(Nm3/t MgO)
Quantity
(kg/t MgO)
50 8000 0.40
400 8000 3.20
1200 8000 9.60 SO2
1500 8000 12.0
35 8000 0.28 Particles
20 8000 0.16
Getting back to the different alternative techniques, the
quantities and concentrations of pollutants emitted are
included in the following table:
8 Draft Reference Document on Best Available Techniques in the Cement, Lime and
Magnesium Oxide Manufacturing Industries. February 2009. Chapter 3, section 3.3.3.1,
page 352.
Pollutant ESP + WS FF + WSa FF + WSb FF + dSI
mg/N
m3 < 50 – 400 < 50 – 400 < 50 - 1200 < 50 - 1500
SO2 kg/t
MgO
< 0.40 –
3.20
< 0.40 –
3.20
< 0.40 –
9.60
< 0.40 –
12.0
mg/N
m3 < 35 < 20 < 20 < 20
Particles kg/t
MgO < 0.28 < 0.16 < 0.16 < 0.16
Page 14 of 24
In the case of the FF + WSa combination, the use of fuel to re-
heat the flue gases between the FF and the WS involves a new
SO2 source that should be treated in the WS to get the SO2
emission levels stated in the table, it is possible to get different
performances in the WS due to the S content in the fuel, so the
SO2 emissions could vary.
4.1.2 CO2
Some environmental techniques object of study produce direct
CO2 emissions. Thus in the wet scrubber case direct CO2
emissions are produced due to the chemical reaction
occurring in the wet scrubber to eliminate SO2:
SO2 + ½ O2 + 2H2O + MgCO3 � MgSO4�2H2O + CO2
Thus we can calculate the stoichiometric CO2 generated from
the amount of SO2 consumed in the wet scrubber:
Moles SO2 /t MgO = Moles CO2 /t MgO
Substituting the respective masses and molecular weights, the
following expression is obtained:
kg CO2/t MgO = kg SO2 /t MgO * PM CO2/ PM SO2
Where,
PM SO2 = 64 g/mol
PM CO2 = 44 g/mol
PM CO2 / PM SO2 = 44 / 64 = 0.69
Page 15 of 24
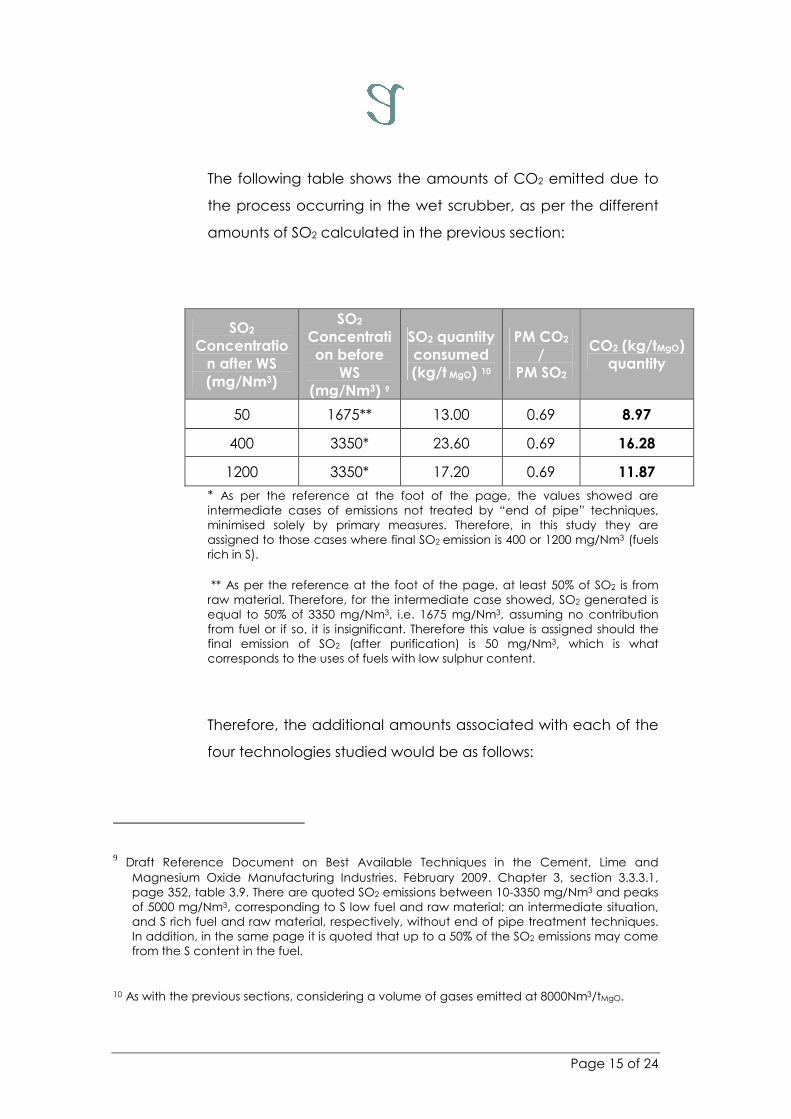
The following table shows the amounts of CO2 emitted due to
the process occurring in the wet scrubber, as per the different
amounts of SO2 calculated in the previous section:
SO2
Concentratio
n after WS
(mg/Nm3)
SO2
Concentrati
on before
WS
(mg/Nm3) 9
SO2 quantity
consumed
(kg/t MgO) 10
PM CO2
/
PM SO2
CO2 (kg/tMgO)
quantity
50 1675** 13.00 0.69 8.97
400 3350* 23.60 0.69 16.28
1200 3350* 17.20 0.69 11.87
* As per the reference at the foot of the page, the values showed are
intermediate cases of emissions not treated by “end of pipe” techniques,
minimised solely by primary measures. Therefore, in this study they are
assigned to those cases where final SO2 emission is 400 or 1200 mg/Nm3 (fuels
rich in S).
** As per the reference at the foot of the page, at least 50% of SO2 is from
raw material. Therefore, for the intermediate case showed, SO2 generated is
equal to 50% of 3350 mg/Nm3, i.e. 1675 mg/Nm3, assuming no contribution
from fuel or if so, it is insignificant. Therefore this value is assigned should the
final emission of SO2 (after purification) is 50 mg/Nm3, which is what
corresponds to the uses of fuels with low sulphur content.
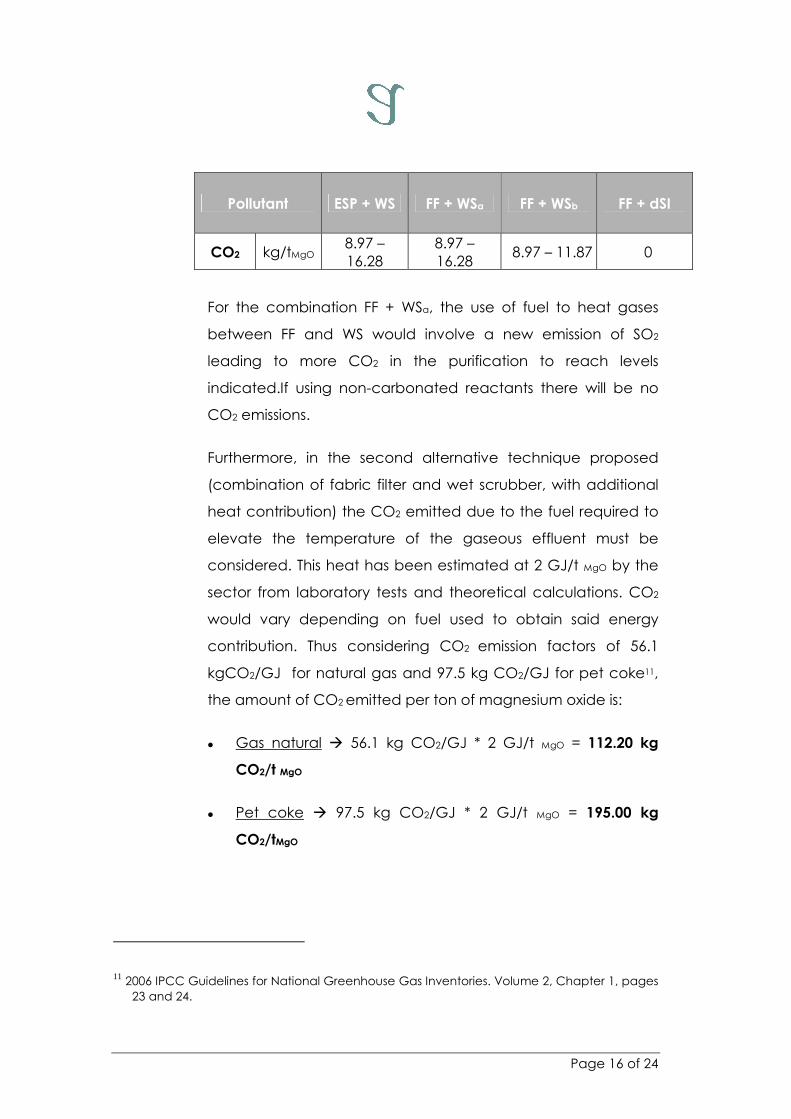
Therefore, the additional amounts associated with each of the
four technologies studied would be as follows:
9 Draft Reference Document on Best Available Techniques in the Cement, Lime and
Magnesium Oxide Manufacturing Industries. February 2009. Chapter 3, section 3.3.3.1,
page 352, table 3.9. There are quoted SO2 emissions between 10-3350 mg/Nm3 and peaks
of 5000 mg/Nm3, corresponding to S low fuel and raw material; an intermediate situation,
and S rich fuel and raw material, respectively, without end of pipe treatment techniques.
In addition, in the same page it is quoted that up to a 50% of the SO2 emissions may come
from the S content in the fuel.
10 As with the previous sections, considering a volume of gases emitted at 8000Nm3/tMgO.
Page 16 of 24
For the combination FF + WSa, the use of fuel to heat gases
between FF and WS would involve a new emission of SO2
leading to more CO2 in the purification to reach levels
indicated.If using non-carbonated reactants there will be no
CO2 emissions.
Furthermore, in the second alternative technique proposed
(combination of fabric filter and wet scrubber, with additional
heat contribution) the CO2 emitted due to the fuel required to
elevate the temperature of the gaseous effluent must be
considered. This heat has been estimated at 2 GJ/t MgO by the
sector from laboratory tests and theoretical calculations. CO2
would vary depending on fuel used to obtain said energy
contribution. Thus considering CO2 emission factors of 56.1
kgCO2/GJ for natural gas and 97.5 kg CO2/GJ for pet coke11,
the amount of CO2 emitted per ton of magnesium oxide is:
� Gas natural � 56.1 kg CO2/GJ * 2 GJ/t MgO = 112.20 kg
CO2/t MgO
� Pet coke � 97.5 kg CO2/GJ * 2 GJ/t MgO = 195.00 kg
CO2/tMgO
11 2006 IPCC Guidelines for National Greenhouse Gas Inventories. Volume 2, Chapter 1, pages
23 and 24.
Pollutant ESP + WS FF + WSa FF + WSb FF + dSI
CO2 kg/tMgO 8.97 –
16.28
8.97 –
16.28 8.97 – 11.87 0
Page 17 of 24
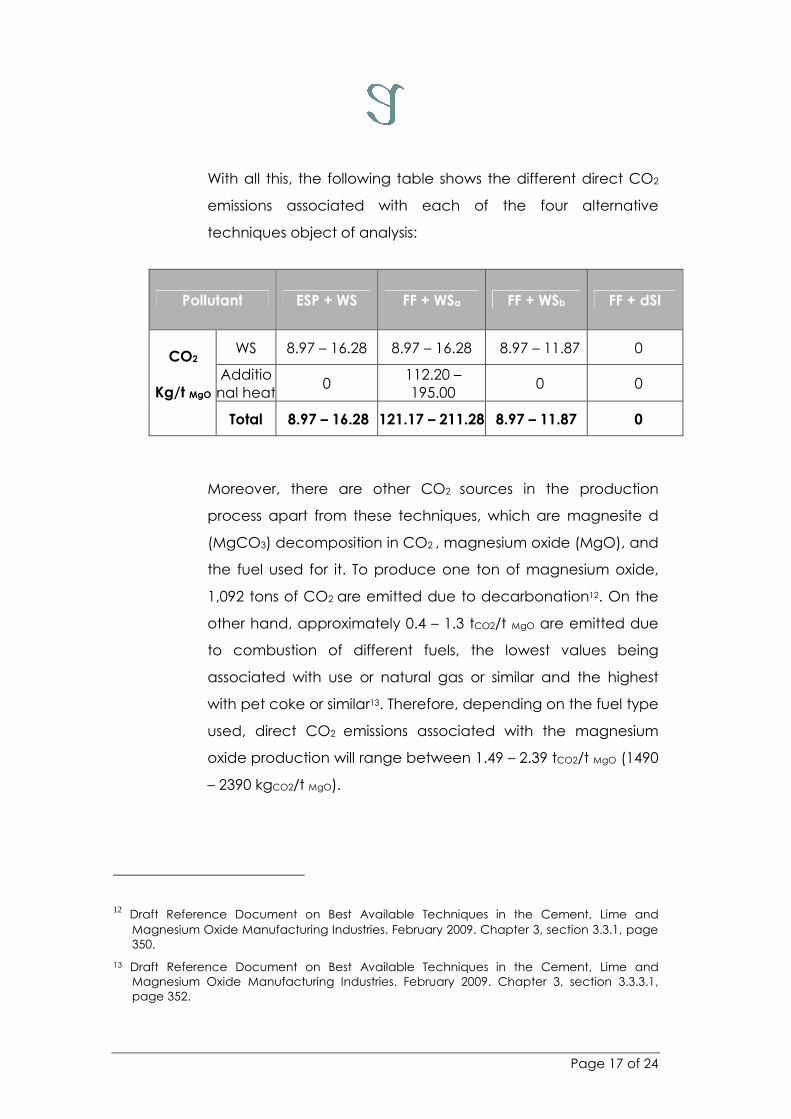
With all this, the following table shows the different direct CO2
emissions associated with each of the four alternative
techniques object of analysis:
Moreover, there are other CO2 sources in the production
process apart from these techniques, which are magnesite d
(MgCO3) decomposition in CO2 , magnesium oxide (MgO), and
the fuel used for it. To produce one ton of magnesium oxide,
1,092 tons of CO2 are emitted due to decarbonation12. On the
other hand, approximately 0.4 – 1.3 tCO2/t MgO are emitted due
to combustion of different fuels, the lowest values being
associated with use or natural gas or similar and the highest
with pet coke or similar13. Therefore, depending on the fuel type
used, direct CO2 emissions associated with the magnesium
oxide production will range between 1.49 – 2.39 tCO2/t MgO (1490
– 2390 kgCO2/t MgO).
12 Draft Reference Document on Best Available Techniques in the Cement, Lime and
Magnesium Oxide Manufacturing Industries. February 2009. Chapter 3, section 3.3.1, page
350.
13 Draft Reference Document on Best Available Techniques in the Cement, Lime and
Magnesium Oxide Manufacturing Industries. February 2009. Chapter 3, section 3.3.3.1,
page 352.
Pollutant ESP + WS FF + WSa FF + WSb FF + dSI
WS 8.97 – 16.28 8.97 – 16.28 8.97 – 11.87 0
Additio
nal heat0
112.20 –
195.00 0 0
CO2
Kg/t MgO
Total 8.97 – 16.28 121.17 – 211.28 8.97 – 11.87 0
Page 18 of 24
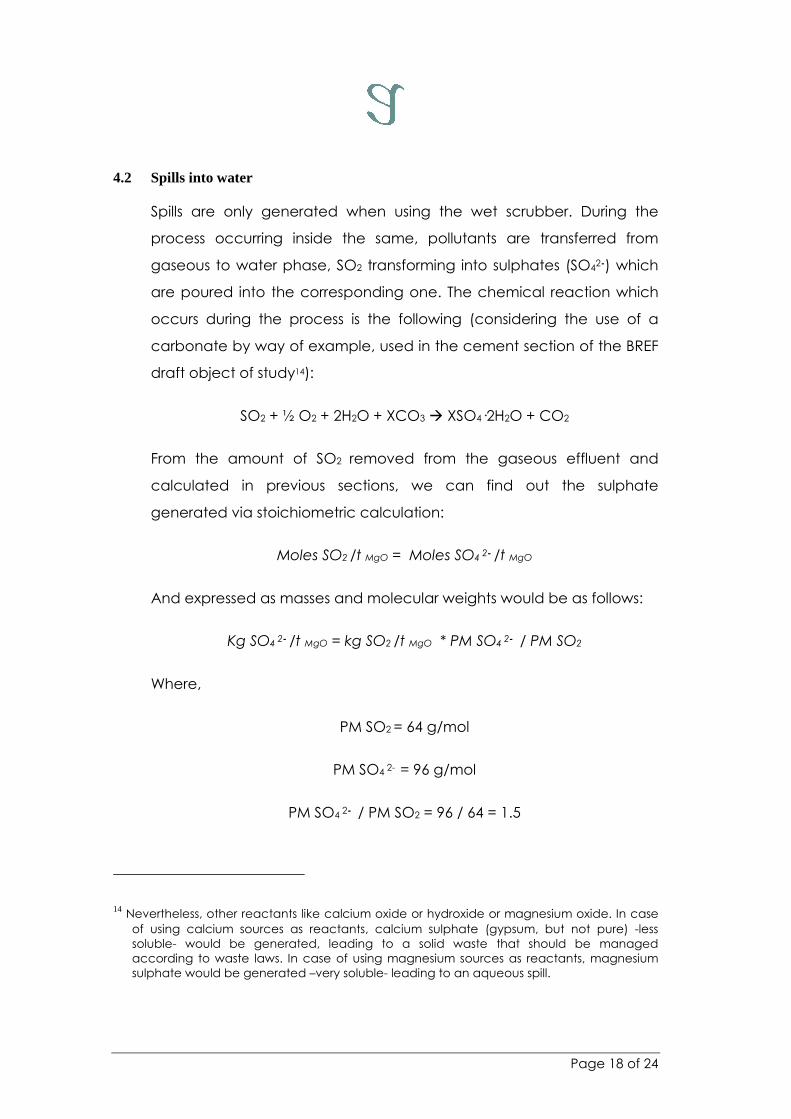
4.2 Spills into water
Spills are only generated when using the wet scrubber. During the
process occurring inside the same, pollutants are transferred from
gaseous to water phase, SO2 transforming into sulphates (SO42-) which
are poured into the corresponding one. The chemical reaction which
occurs during the process is the following (considering the use of a
carbonate by way of example, used in the cement section of the BREF
draft object of study14):
SO2 + ½ O2 + 2H2O + XCO3 � XSO4�2H2O + CO2
From the amount of SO2 removed from the gaseous effluent and
calculated in previous sections, we can find out the sulphate
generated via stoichiometric calculation:
Moles SO2 /t MgO = Moles SO4 2- /t MgO
And expressed as masses and molecular weights would be as follows:
Kg SO4 2- /t MgO = kg SO2 /t MgO * PM SO4 2- / PM SO2
Where,
PM SO2 = 64 g/mol
PM SO4 2- = 96 g/mol
PM SO4 2- / PM SO2 = 96 / 64 = 1.5
14 Nevertheless, other reactants like calcium oxide or hydroxide or magnesium oxide. In case
of using calcium sources as reactants, calcium sulphate (gypsum, but not pure) -less
soluble- would be generated, leading to a solid waste that should be managed
according to waste laws. In case of using magnesium sources as reactants, magnesium
sulphate would be generated –very soluble- leading to an aqueous spill.
Page 19 of 24
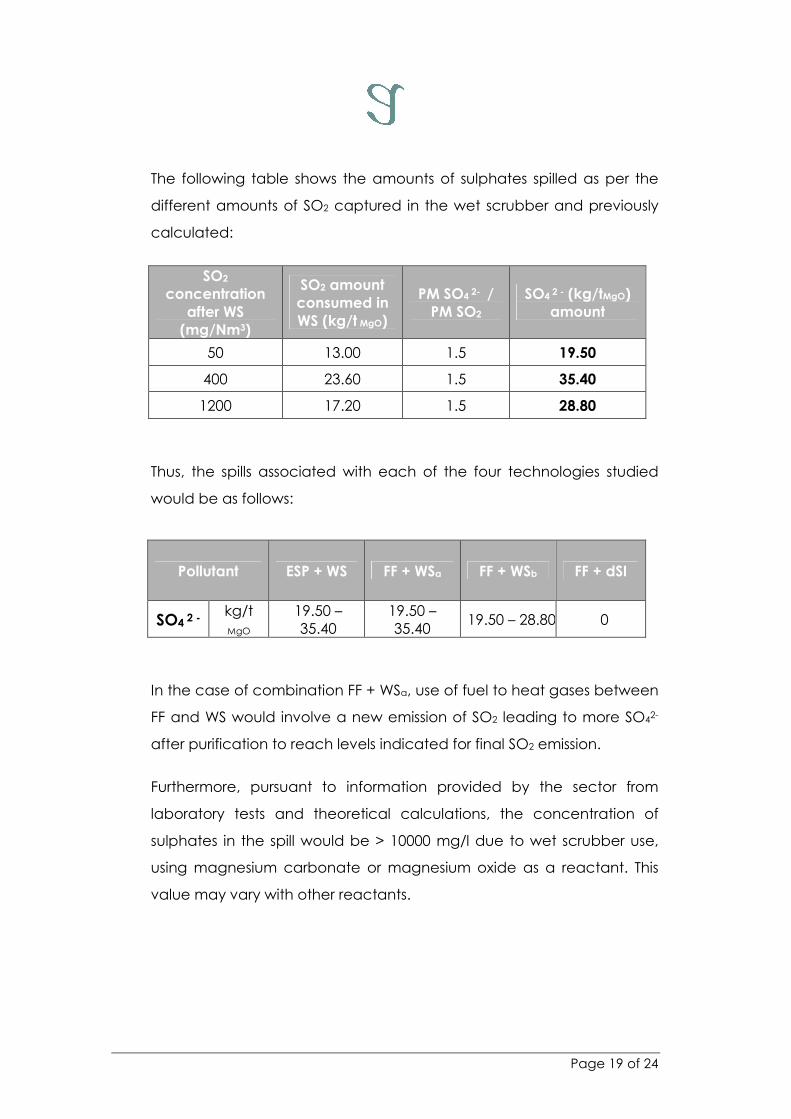
The following table shows the amounts of sulphates spilled as per the
different amounts of SO2 captured in the wet scrubber and previously
calculated:
SO2
concentration
after WS
(mg/Nm3)
SO2 amount
consumed in
WS (kg/t MgO)
PM SO4 2- /
PM SO2
SO4 2 - (kg/tMgO)
amount
50 13.00 1.5 19.50
400 23.60 1.5 35.40
1200 17.20 1.5 28.80
Thus, the spills associated with each of the four technologies studied
would be as follows:
In the case of combination FF + WSa, use of fuel to heat gases between
FF and WS would involve a new emission of SO2 leading to more SO42-
after purification to reach levels indicated for final SO2 emission.
Furthermore, pursuant to information provided by the sector from
laboratory tests and theoretical calculations, the concentration of
sulphates in the spill would be > 10000 mg/l due to wet scrubber use,
using magnesium carbonate or magnesium oxide as a reactant. This
value may vary with other reactants.
Pollutant ESP + WS FF + WSa FF + WSb FF + dSI
SO4 2 -
kg/t
MgO
19.50 –
35.40
19.50 –
35.40 19.50 – 28.80 0
Page 20 of 24
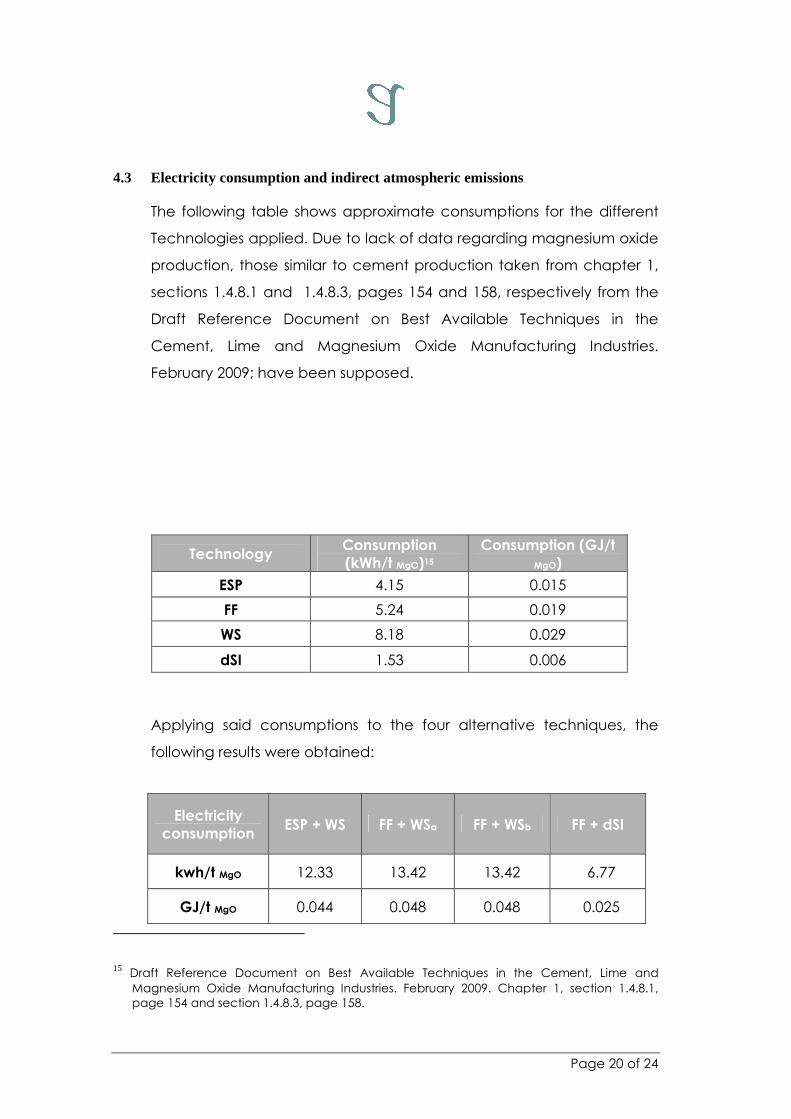
4.3 Electricity consumption and indirect atmospheric emissions
The following table shows approximate consumptions for the different
Technologies applied. Due to lack of data regarding magnesium oxide
production, those similar to cement production taken from chapter 1,
sections 1.4.8.1 and 1.4.8.3, pages 154 and 158, respectively from the
Draft Reference Document on Best Available Techniques in the
Cement, Lime and Magnesium Oxide Manufacturing Industries.
February 2009; have been supposed.
Technology Consumption
(kWh/t MgO)15
Consumption (GJ/t
MgO)
ESP 4.15 0.015
FF 5.24 0.019
WS 8.18 0.029
dSI 1.53 0.006
Applying said consumptions to the four alternative techniques, the
following results were obtained:
15 Draft Reference Document on Best Available Techniques in the Cement, Lime and
Magnesium Oxide Manufacturing Industries. February 2009. Chapter 1, section 1.4.8.1,
page 154 and section 1.4.8.3, page 158.
Electricity
consumption ESP + WS FF + WSa FF + WSb FF + dSI
kwh/t MgO 12.33 13.42 13.42 6.77
GJ/t MgO 0.044 0.048 0.048 0.025
Page 21 of 24
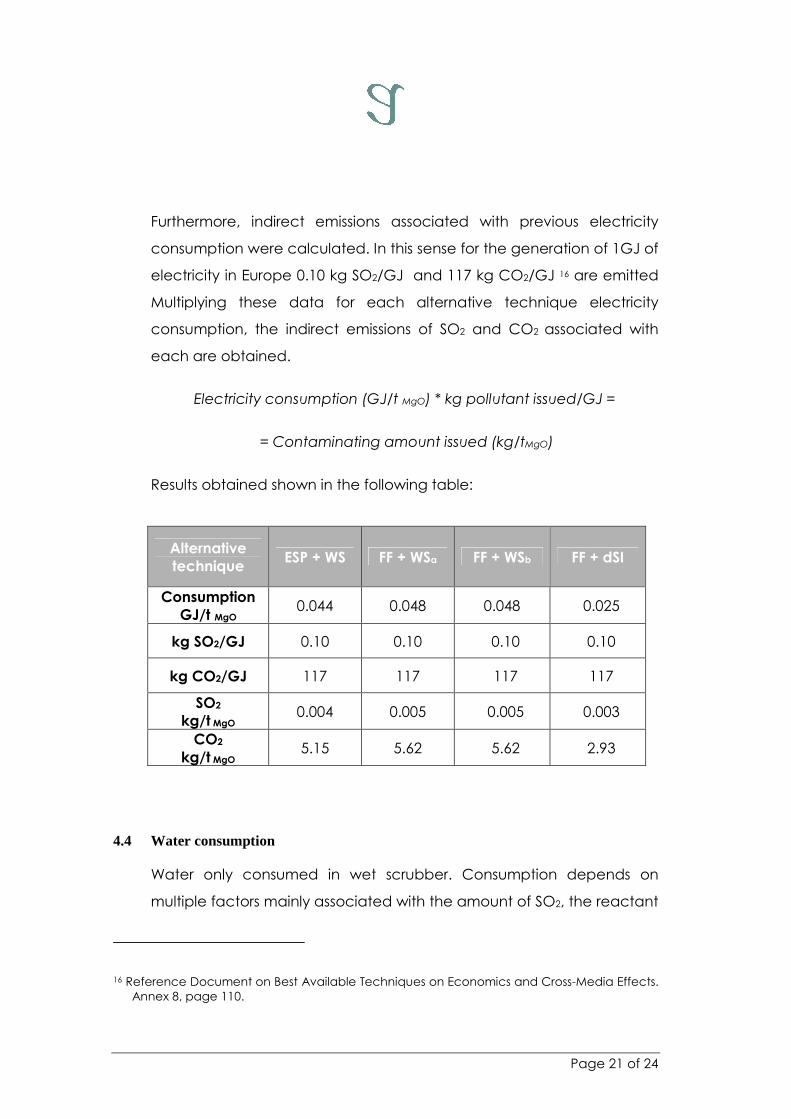
Furthermore, indirect emissions associated with previous electricity
consumption were calculated. In this sense for the generation of 1GJ of
electricity in Europe 0.10 kg SO2/GJ and 117 kg CO2/GJ 16 are emitted
Multiplying these data for each alternative technique electricity
consumption, the indirect emissions of SO2 and CO2 associated with
each are obtained.
Electricity consumption (GJ/t MgO) * kg pollutant issued/GJ =
= Contaminating amount issued (kg/tMgO)
Results obtained shown in the following table:
4.4 Water consumption
Water only consumed in wet scrubber. Consumption depends on
multiple factors mainly associated with the amount of SO2, the reactant
16 Reference Document on Best Available Techniques on Economics and Cross-Media Effects.
Annex 8, page 110.
Alternative
technique ESP + WS FF + WSa FF + WSb FF + dSI
Consumption
GJ/t MgO 0.044 0.048 0.048 0.025
kg SO2/GJ 0.10 0.10 0.10 0.10
kg CO2/GJ 117 117 117 117
SO2 kg/t MgO
0.004 0.005 0.005 0.003
CO2
kg/t MgO 5.15 5.62 5.62 2.93
Page 22 of 24
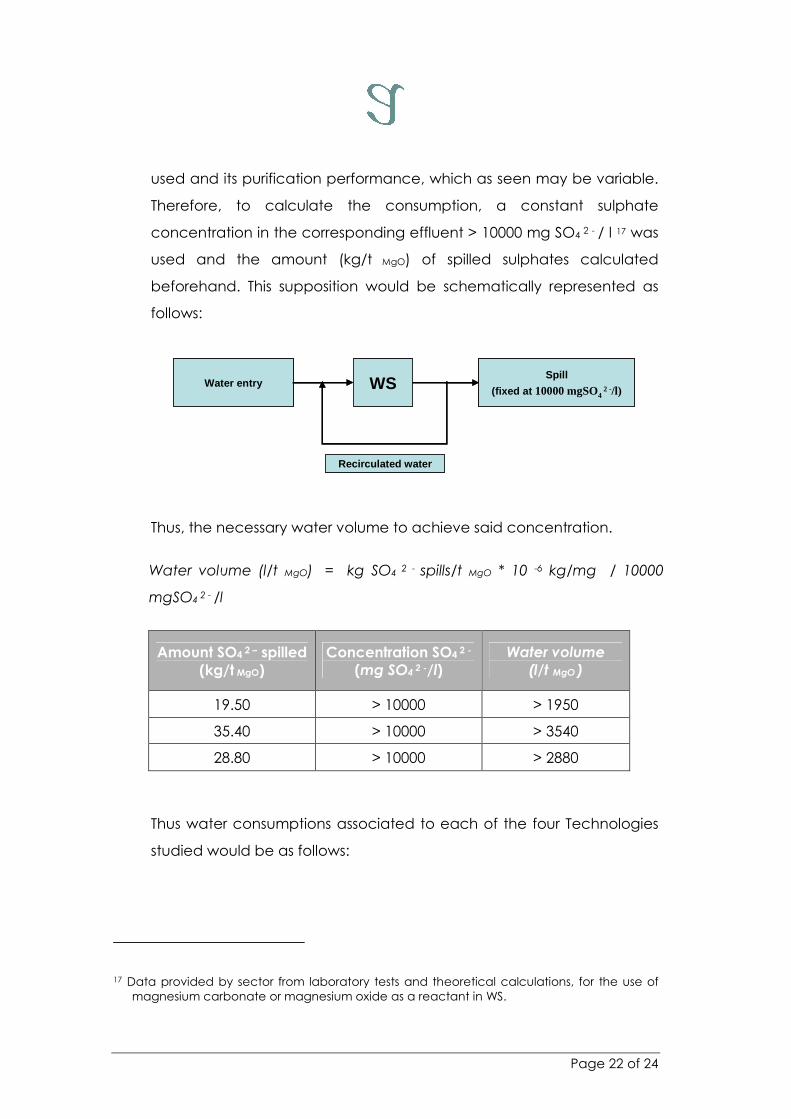
used and its purification performance, which as seen may be variable.
Therefore, to calculate the consumption, a constant sulphate
concentration in the corresponding effluent > 10000 mg SO4 2 - / l 17 was
used and the amount (kg/t MgO) of spilled sulphates calculated
beforehand. This supposition would be schematically represented as
follows:
Thus, the necessary water volume to achieve said concentration.
Water volume (l/t MgO) = kg SO4 2 - spills/t MgO * 10 -6 kg/mg / 10000
mgSO4 2 - /l
Amount SO4 2 – spilled
(kg/t MgO)
Concentration SO4 2 -
(mg SO4 2 -/l)
Water volume
(l/t MgO )
19.50 > 10000 > 1950
35.40 > 10000 > 3540
28.80 > 10000 > 2880
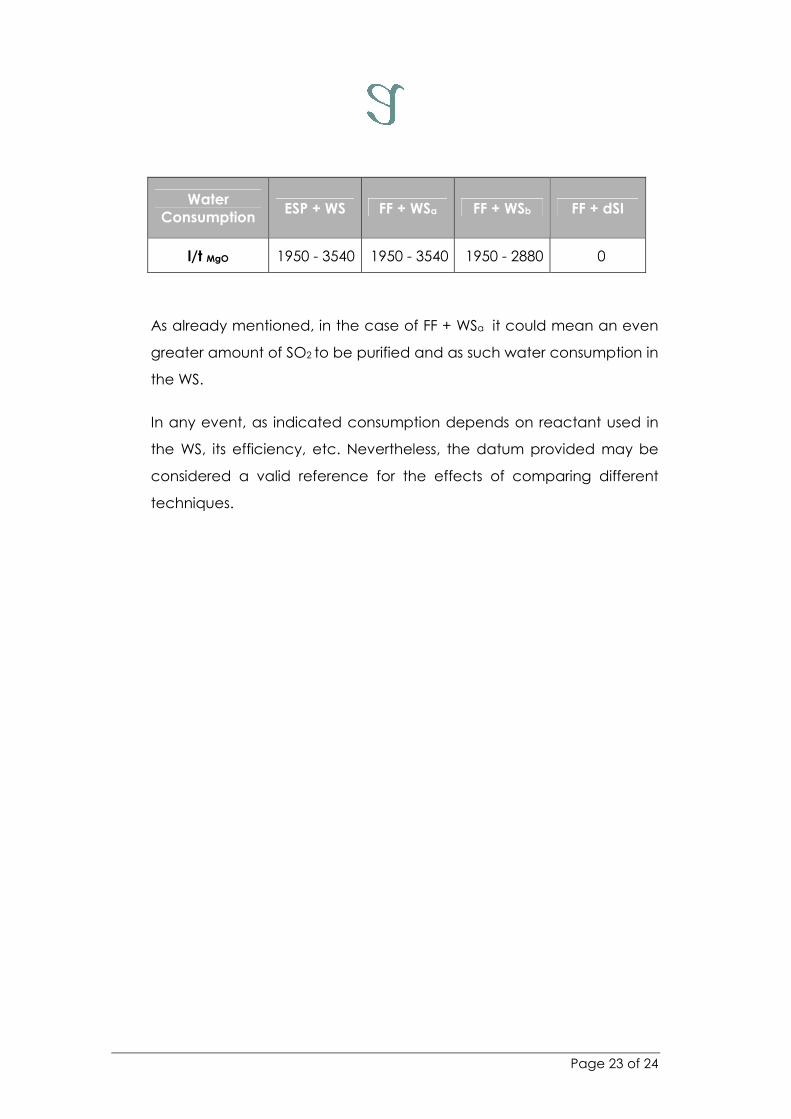
Thus water consumptions associated to each of the four Technologies
studied would be as follows:
17 Data provided by sector from laboratory tests and theoretical calculations, for the use of
magnesium carbonate or magnesium oxide as a reactant in WS.
Water entry
Recirculated water
WSSpill
(fixed at 10000 mgSO4 2 -/l)
Water entry
Recirculated water
WSSpill
(fixed at 10000 mgSO4 2 -/l)
Page 23 of 24
As already mentioned, in the case of FF + WSa it could mean an even
greater amount of SO2 to be purified and as such water consumption in
the WS.
In any event, as indicated consumption depends on reactant used in
the WS, its efficiency, etc. Nevertheless, the datum provided may be
considered a valid reference for the effects of comparing different
techniques.
Water
Consumption ESP + WS FF + WSa FF + WSb FF + dSI
l/t MgO 1950 - 3540 1950 - 3540 1950 - 2880 0
Page 24 of 24
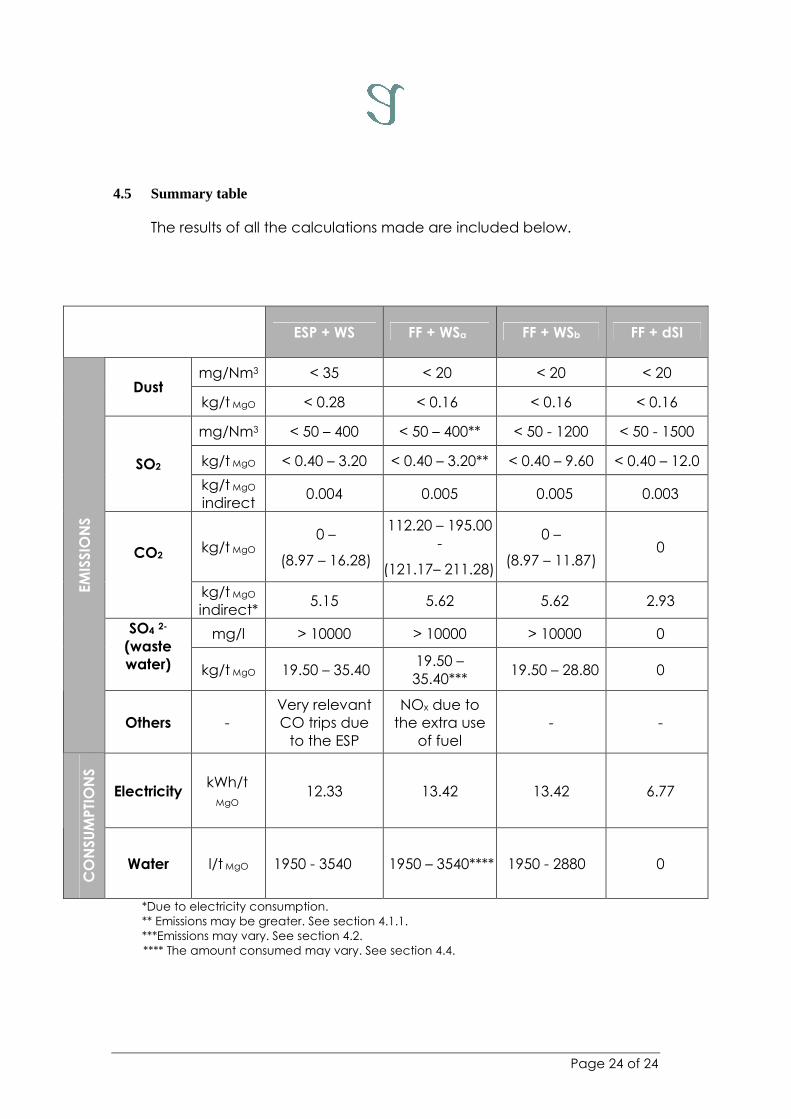
4.5 Summary table
The results of all the calculations made are included below.
*Due to electricity consumption.
** Emissions may be greater. See section 4.1.1.
***Emissions may vary. See section 4.2. **** The amount consumed may vary. See section 4.4.
ESP + WS FF + WSa FF + WSb FF + dSI
mg/Nm3 < 35 < 20 < 20 < 20 Dust
kg/t MgO < 0.28 < 0.16 < 0.16 < 0.16
mg/Nm3 < 50 – 400 < 50 – 400** < 50 - 1200 < 50 - 1500
kg/t MgO < 0.40 – 3.20 < 0.40 – 3.20** < 0.40 – 9.60 < 0.40 – 12.0 SO2
kg/t MgO
indirect 0.004 0.005 0.005 0.003
kg/t MgO 0 –
(8.97 – 16.28)
112.20 – 195.00
-
(121.17– 211.28)
0 –
(8.97 – 11.87) 0 CO2
kg/t MgO
indirect* 5.15 5.62 5.62 2.93
mg/l > 10000 > 10000 > 10000 0 SO4 2-
(waste
water)
kg/t MgO 19.50 – 35.40
19.50 –
35.40*** 19.50 – 28.80 0
EM
ISS
ION
S
Others -
Very relevant
CO trips due
to the ESP
NOx due to
the extra use
of fuel
- -
Electricity kWh/t
MgO 12.33 13.42 13.42 6.77
CO
NS
UM
PTI
ON
S
Water l/t MgO 1950 - 3540 1950 – 3540**** 1950 - 2880 0