Embed Size (px)
Citation preview
The Premier Electrical Maintenance and Safety Event
Page 1 / Rockwell, Horowitz, Smith
Application and Commissioning of
Online Partial Discharge Technology
for Medium Voltage Switchgear
Bruce Rockwell, P.E.
Bruce Horowitz, P.E.
Christopher Smith, NETA IV
American Electrical Testing Company, Inc.
The Premier Electrical Maintenance and Safety Event
Page 2 / Rockwell, Horowitz, Smith
Application and Commissioning of Online Partial Discharge
Technology for Medium Voltage Switchgear
TABLE OF CONTENTS
I. Introduction
II. Application
III. Design
IV. Installation
V. Commissioning
VI. Lessons Learned

The Premier Electrical Maintenance and Safety Event
Page 3 / Rockwell, Horowitz, Smith
Introduction
Partial Discharge (PD) is a localized electrical discharge or spark resulting when ionization
partially bridges the insulation between two conducting electrodes. PD may occur at any point in
the insulation system, if the electric field strength exceeds the breakdown strength of the insulating
material. Electrical equipment operating at or above 2,400 volts ac is susceptible to partial
discharge/corona activity.
Left unchecked, this unwanted electrical activity can lead to total breakdown of the
insulation system and catastrophic failure. PD activity can be short lived or occur over an extended
period of time before it results in a phase to ground or phase to phase fault.
PD appears in one of two forms in the insulation system:
Internal PD - Occurring in defects: voids or cavities within solid insulation
Surface PD - Occurring across the surface of the insulation
PD activity emits energy as follows:
Electromagnetic Emissions
- Radio Waves (3 Hz - 300 GHz)
- Heat (300 GHz - 430 THz)
- Light (430 THz - 770 THz)
Acoustic Emissions
- Audible (20 - 20 KHz)
- Ultrasonic (20 KHz - MHz / GHz)
Gases
- Ozone
- Oxides of Nitrogen (when combined with water produces Nitric Acid)
PD occurs in voids, cracks, or inclusions within solid dielectrics, at conductor-dielectric
interfaces within solid or liquid dielectrics, or in bubbles within liquid dielectrics. PD is limited to a
portion of the insulation so discharges only partially bridge between electrodes.
The Premier Electrical Maintenance and Safety Event
Page 4 / Rockwell, Horowitz, Smith
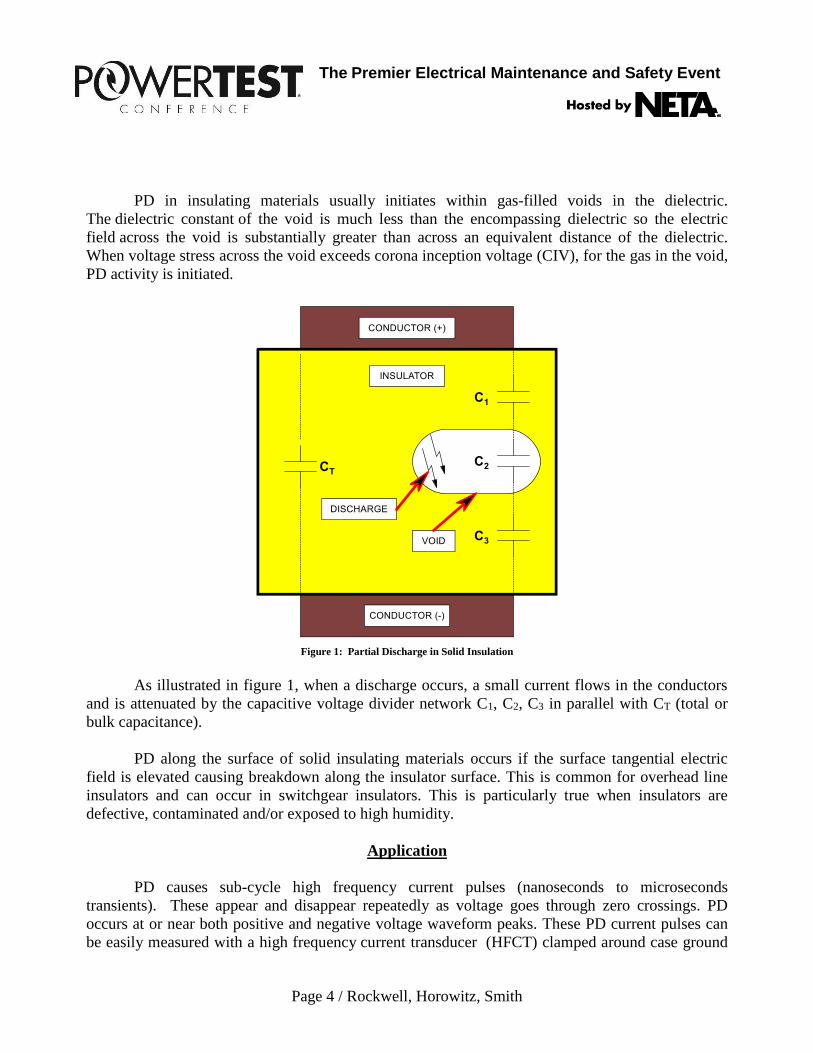
PD in insulating materials usually initiates within gas-filled voids in the dielectric.
The dielectric constant of the void is much less than the encompassing dielectric so the electric
field across the void is substantially greater than across an equivalent distance of the dielectric.
When voltage stress across the void exceeds corona inception voltage (CIV), for the gas in the void,
PD activity is initiated.
Figure 1: Partial Discharge in Solid Insulation
As illustrated in figure 1, when a discharge occurs, a small current flows in the conductors
and is attenuated by the capacitive voltage divider network C1, C2, C3 in parallel with CT (total or
bulk capacitance).
PD along the surface of solid insulating materials occurs if the surface tangential electric
field is elevated causing breakdown along the insulator surface. This is common for overhead line
insulators and can occur in switchgear insulators. This is particularly true when insulators are
defective, contaminated and/or exposed to high humidity.
Application
PD causes sub-cycle high frequency current pulses (nanoseconds to microseconds
transients). These appear and disappear repeatedly as voltage goes through zero crossings. PD
occurs at or near both positive and negative voltage waveform peaks. These PD current pulses can
be easily measured with a high frequency current transducer (HFCT) clamped around case ground
The Premier Electrical Maintenance and Safety Event
Page 5 / Rockwell, Horowitz, Smith
of the tested component. PD severity is attained by measuring the burst interval; the interval
between the end of a burst and beginning of the next burst. As insulation breakdown accelerates,
burst interval decreases because breakdown occurs at lower voltage. Burst interval is critical at two
(2) milliseconds since discharge is near the zero (0) crossing and facilitates propagation to
continuous discharge causing major component failure.
The arcing and sparking that occur during PD activity creates high frequency
electromagnetic waves that propagate away from the fault point in all directions. Measuring these
high-frequency pulses identifies the presence of PD. The next step is to locate the actual point of
fault. Applying acoustic emission detection, ultrasonic sensors, is effective to detect and locate PD.
Bandpass filters are typically required in order to remove interference from background / system
noise.
When PD activity occurs in switchgear insulation, it generates electromagnetic waves in the
radio frequency range. The signal can travel through insulating materials or components. The radio
frequency signal is attenuated as it passes through each surface or medium. Most of the
electromagnetic pulses are conducted by surrounding metalwork but a small proportion encroaches
onto the inner surface of the casing. These PD charges are small with voltage magnitudes of 0.1
millivolt to one (1) volt. This phenomenon was discovered by Dr. John Reeves in 1974 and he
labelled them Transient Earth Voltages (TEVs). TEVs occur because the partial discharge creates
current spikes in the conductor and these can appear in the grounded metal surrounding the
conductor. This current flow escapes through metalwork joints (or gaskets in gas insulated
equipment) and impinges an elevated voltage on the surface of the apparatus referenced to ground.
Dr. Reeves established TEV signals are directly proportional to the condition of the insulation for
switchgear of the same type when measured at the same point.
TEVs are measured in units of dB-mV. These voltages are high frequency pulse type
signals flowing in the switchgear metalwork. The metalwork represents a high impedance to
ground for these signals. The current flow into high impedance facilitates generation of detectable
voltage spikes. This voltage is impressed on the interior of the metalwork (to a depth of
approximately 0.5 µm in mild steel at 100 MHz) and loops around to the outer surface where there
is are electrical discontinuities.
Electromagnetic waves generated by the partial discharge frequency create TEVs on
adjacent enclosures. The surrounding enclosures act like an antenna.
TEVs are a very convenient phenomenon for online measuring and detecting of partial
discharges since they are easily detected without removing panel covers and do not require
connection to the energized conductor. TEV detection methodology is useful to detect PD in
switchgear and surface tracking on internal components; however its sensitivity is insufficient to
detect issues within solid dielectric cable systems.

The Premier Electrical Maintenance and Safety Event
Page 6 / Rockwell, Horowitz, Smith
Test and maintenance programs use offline and online test methods to detect PD. Offline
testing is typically a periodic test for factory and/or acceptance purposes. Online testing can be
periodic or continuous and is typically used for maintenance testing.
Offline testing requires the equipment under test to be removed from service so high voltage
ac can be applied directly to the equipment to collect test data. PD can persist for years before
manifesting into failure. Such failures can be catastrophic. It is important to verify if PD is present
in newly manufactured equipment and prior to being placed into service. Verifying presence /
absence of PD aides in confirming warranty conditions. Specifying offline PD testing should result
in equipment that has a much higher reliability assuming tests are properly conducted. Industry
standards, subject matter experts and the manufacturer should be consulted to properly define such
testing specifications. A two (2) sensor remote TEV monitor can be extremely useful in locating the
source of PD. The sensors can be installed on two (2) pieces of equipment or two (2) adjacent
cubicles. The HMI will display the TEV severity detected at each location and more importantly it
will display which location sensed the TEV first. The sensors can be moved quickly to another
location until the source of the PD is located. In most situations this style of diagnostic testing
located the source of PD within a few minutes.
Online PD testing technology has rapidly evolved in recent years and can be performed
periodically or continuously. Periodic monitoring consists of using hand held devices that are
capable of detecting acoustic and electromagnetic signals. The use of TEV probes is a more recent
technology tool. Handheld equipment provides instantaneous feedback allowing detection of the
presence of PD. These tools allow the technician to detect and narrow the focus to better pinpoint
the location of PD when it is internal to an apparatus. Continuous online monitoring incorporates
sensors, data collectors, system monitors and data analyzers; to collect analyze and report on a
voluminous steady stream of data reporting on the health of an insulation system.
This type of PD monitoring system is not fool proof. Outside influences (florescent lights,
local equipment operation or construction activity) can emit noise that is recorded by the system
some that can emulate PD. Expert analysis and interpretation of the data is required.
Design
This paper highlights design of online PD monitoring systems for two (2) 38 kV / 200 kV
BIL metal clad switchgears operating at 33 kV nominal:
Existing outdoor walk-in aisle switchgear: (2) Bus Sections - (14) Total Cubicles
New indoor switchgear: (3) Bus Sections - (30) Total Cubicles
The Premier Electrical Maintenance and Safety Event
Page 7 / Rockwell, Horowitz, Smith
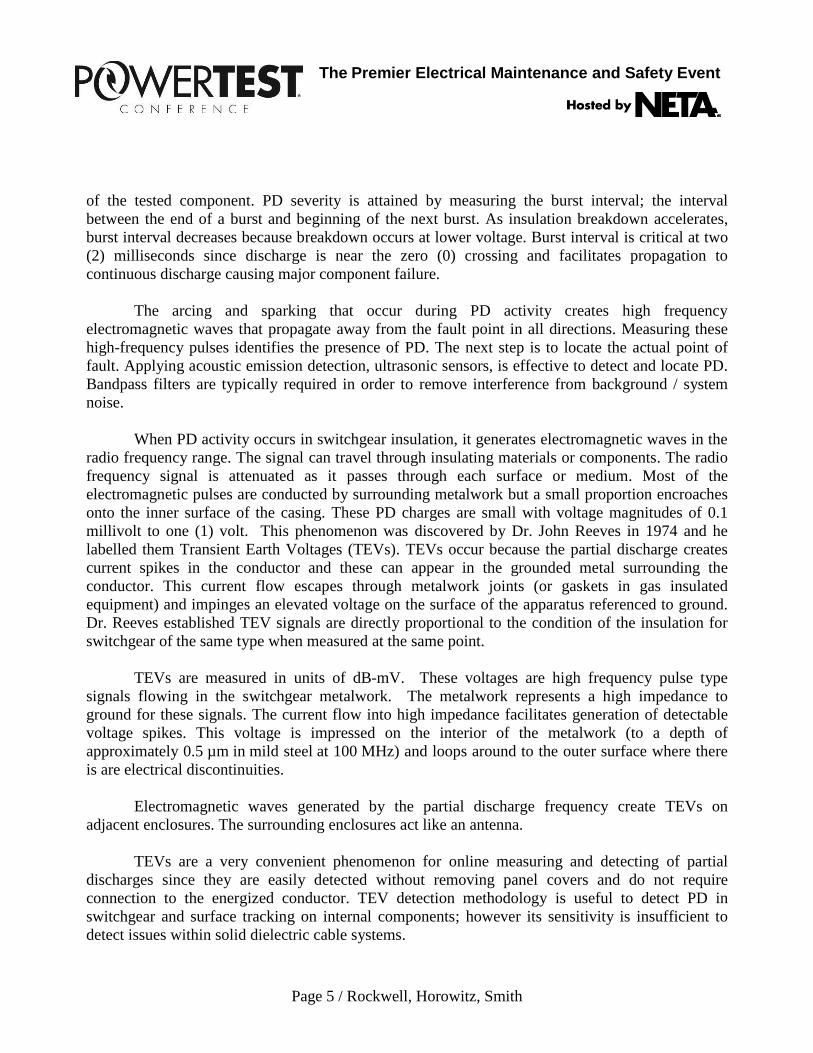
The PD systems consist of the following components:
HUB - Host computer with system program and visual presentation of data
NODES - Sensor data collector
SENSORS
- TEVs
- Microphone (Ultrasonic Detector)
- Environmental Monitor (Temperature and Humidity)
- RFCTs (Monitors Cables)
- External Antenna - (Noise Cancellation / Outside Influences)
Miscellaneous Equipment
- Ultrabus Cables (Nodes to Hub Data Link)
- Coax Cables (RCFTs, External Antennas and TEV to Nodes Data Link)
- LEMO Cables (Microphones to Nodes Data Link)
- SCADA Interface (Transmits Alarms from HUB to Local Alarm System)
Figure 2: System Layout (Concept)
The Premier Electrical Maintenance and Safety Event
Page 8 / Rockwell, Horowitz, Smith
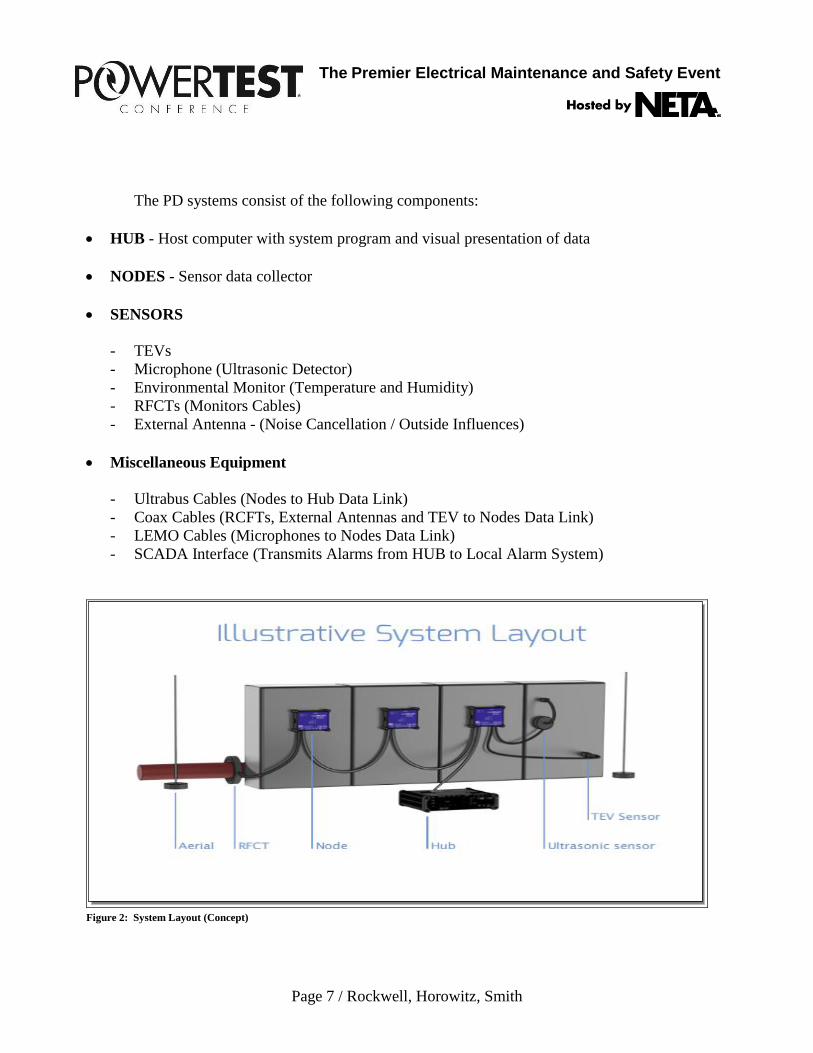
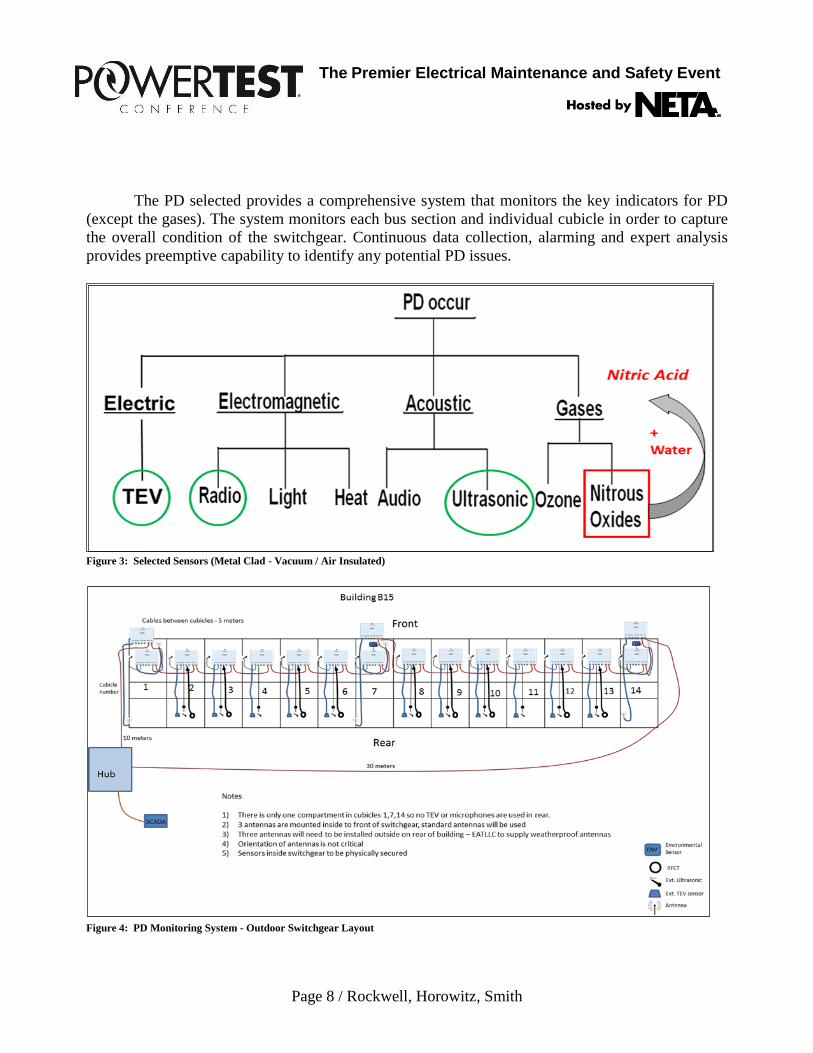
The PD selected provides a comprehensive system that monitors the key indicators for PD
(except the gases). The system monitors each bus section and individual cubicle in order to capture
the overall condition of the switchgear. Continuous data collection, alarming and expert analysis
provides preemptive capability to identify any potential PD issues.
Figure 3: Selected Sensors (Metal Clad - Vacuum / Air Insulated)
Figure 4: PD Monitoring System - Outdoor Switchgear Layout

The Premier Electrical Maintenance and Safety Event
Page 9 / Rockwell, Horowitz, Smith
Figure 4 shows the layout for one of the installations. The system includes output contacts
for alarming and is configured for remote monitoring. Each feeder compartment (incoming and
outgoing feeders) contains an overall feeder RFCT, a TEV sensor and a Microphone. The breaker
compartments contain a TEV sensor and a microphone sensor. An environmental monitor
(temperature and humidity) sensor is located in an area that reports on the switchgear environment.
External antennas are mounted several feet away from the switchgear.
The following design constraints were identified by the user and the manufacturer:
Interconnecting cable from NODE to HUB & NODE to NODE can’t be longer than 30 meters
Nodes mounted on switchgear and interconnecting cables can’t interfere with normal day to day
operation or maintenance of the equipment
Existing switchgear - only individual feeder outages allowed for PD system installation
Existing switchgear - no overall equipment outage allowed
Location of sensors / equipment can’t jeopardize switchgear reliability (short / long term)
Installation of PD system can’t void manufacturer’s warranty
Installation needed to comply with NEC (Requires NRTL field listing)
Installation can’t reduce switchgear design ratings / capabilities (i.e. BIL)
Figure 5: PD Monitoring System - Indoor Switchgear Layout

The Premier Electrical Maintenance and Safety Event
Page 10 / Rockwell, Horowitz, Smith
Figure 6: Node Figure 7: Hub
Installation
The PD system uses various types of sensors that are connected to nodes via coax or LEMO
cables. The nodes connected in a daisy chain and ultimately connect to the HUB using Ultrabus
cables (Cat 7 cables). All of the devices are equipped with a strong magnetic base, making
installation very simple. Each node accommodates two (2) ultrasonic microphones, one (1) RFCT,
one (1) environmental monitor and either an external TEV or external antenna. Each node also
contains a built in TEV and temperature sensor).
For the larger indoor switchgear installation the nodes were mounted on the front of the
circuit breaker cubicles. Cables for sensors located in rear cable compartments needed to be
brought to the front of the switchgear for connection to the node. The manufacturer supplied all the
hardware, including interconnecting hardware (cables). Because there were so many cubicles to
monitor and cable design is constrained to thirty (30) meters the system required two (2) hubs. The
cable limitation is due to attenuation of the small signals to avoid data or system errors. Each hub is
also limited to a polling capability of (22) nodes.
Since the manufacturer provides all interconnecting cables preliminary system design layout
is critical. The system has to be designed and laid out so cable lengths can be identified before
ordering equipment. This requires locations for the sensors, nodes and hubs to be identified early.
The hub needed to be located within a (30) meter cable run. The hub also requires a reliable 115
VAC external power source. In order to ensure continuously reliable power a small stand-alone
UPS was installed.
The Premier Electrical Maintenance and Safety Event
Page 11 / Rockwell, Horowitz, Smith
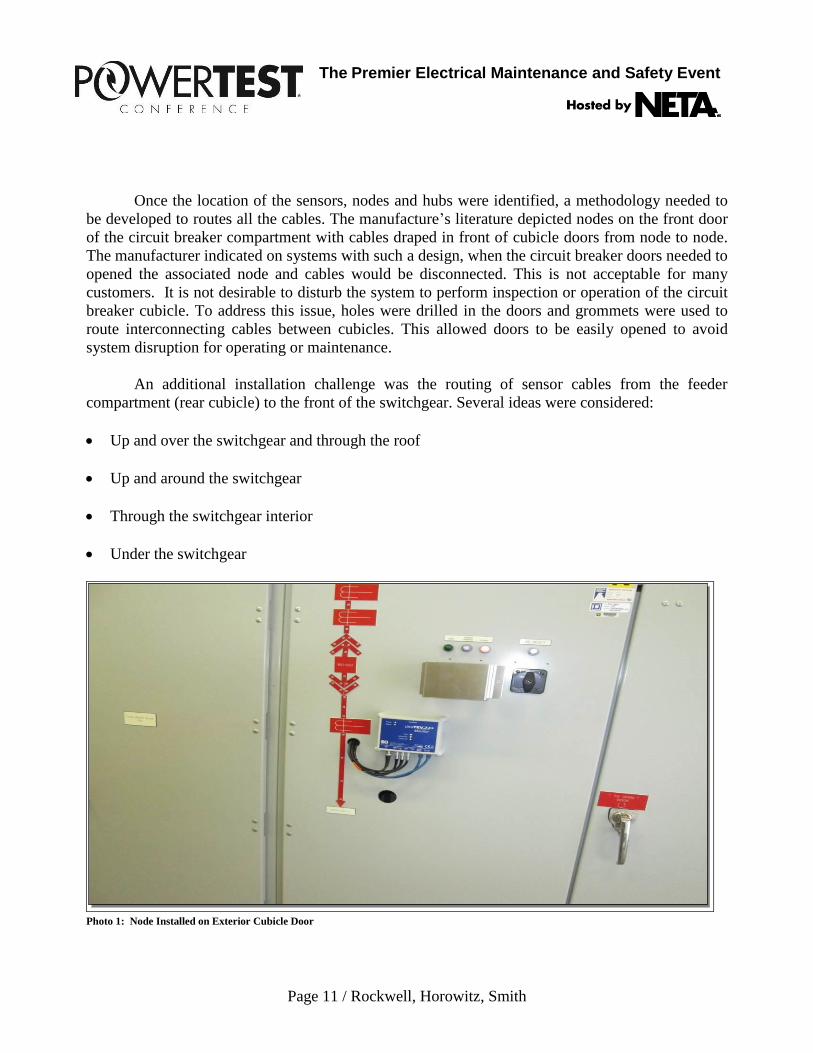
Once the location of the sensors, nodes and hubs were identified, a methodology needed to
be developed to routes all the cables. The manufacture’s literature depicted nodes on the front door
of the circuit breaker compartment with cables draped in front of cubicle doors from node to node.
The manufacturer indicated on systems with such a design, when the circuit breaker doors needed to
opened the associated node and cables would be disconnected. This is not acceptable for many
customers. It is not desirable to disturb the system to perform inspection or operation of the circuit
breaker cubicle. To address this issue, holes were drilled in the doors and grommets were used to
route interconnecting cables between cubicles. This allowed doors to be easily opened to avoid
system disruption for operating or maintenance.
An additional installation challenge was the routing of sensor cables from the feeder
compartment (rear cubicle) to the front of the switchgear. Several ideas were considered:
Up and over the switchgear and through the roof
Up and around the switchgear
Through the switchgear interior
Under the switchgear
Photo 1: Node Installed on Exterior Cubicle Door
The Premier Electrical Maintenance and Safety Event
Page 12 / Rockwell, Horowitz, Smith
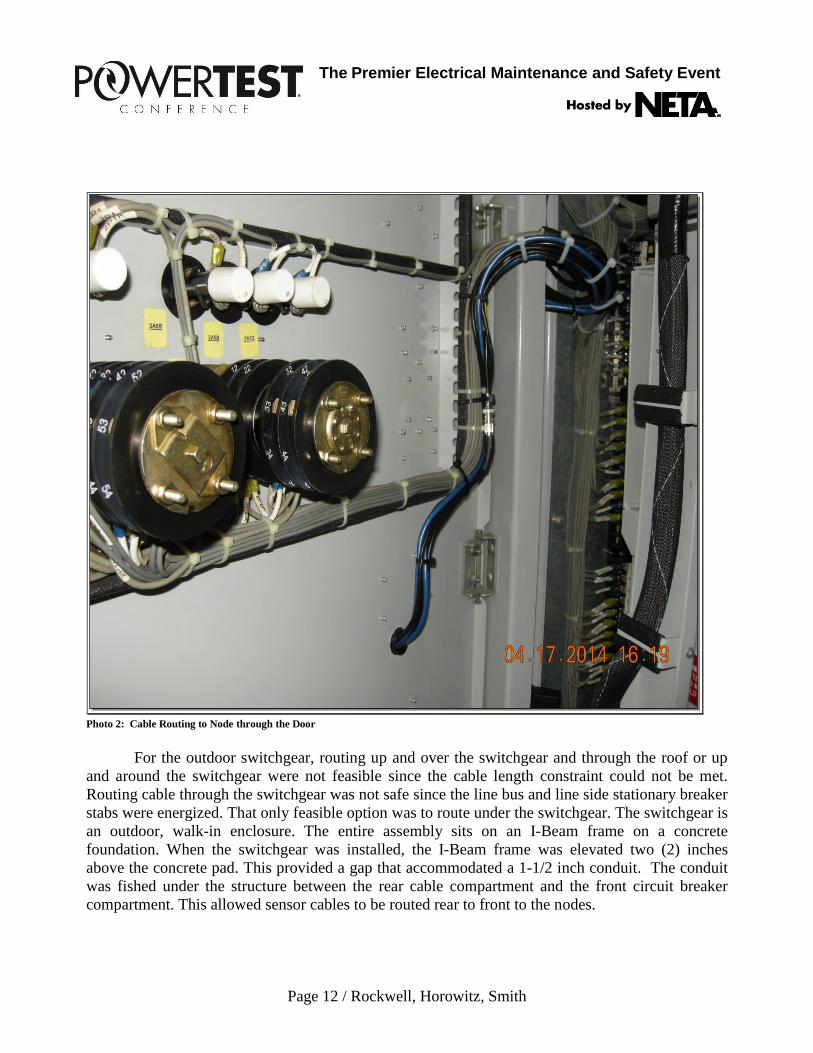
Photo 2: Cable Routing to Node through the Door
For the outdoor switchgear, routing up and over the switchgear and through the roof or up
and around the switchgear were not feasible since the cable length constraint could not be met.
Routing cable through the switchgear was not safe since the line bus and line side stationary breaker
stabs were energized. That only feasible option was to route under the switchgear. The switchgear is
an outdoor, walk-in enclosure. The entire assembly sits on an I-Beam frame on a concrete
foundation. When the switchgear was installed, the I-Beam frame was elevated two (2) inches
above the concrete pad. This provided a gap that accommodated a 1-1/2 inch conduit. The conduit
was fished under the structure between the rear cable compartment and the front circuit breaker
compartment. This allowed sensor cables to be routed rear to front to the nodes.
The Premier Electrical Maintenance and Safety Event
Page 13 / Rockwell, Horowitz, Smith
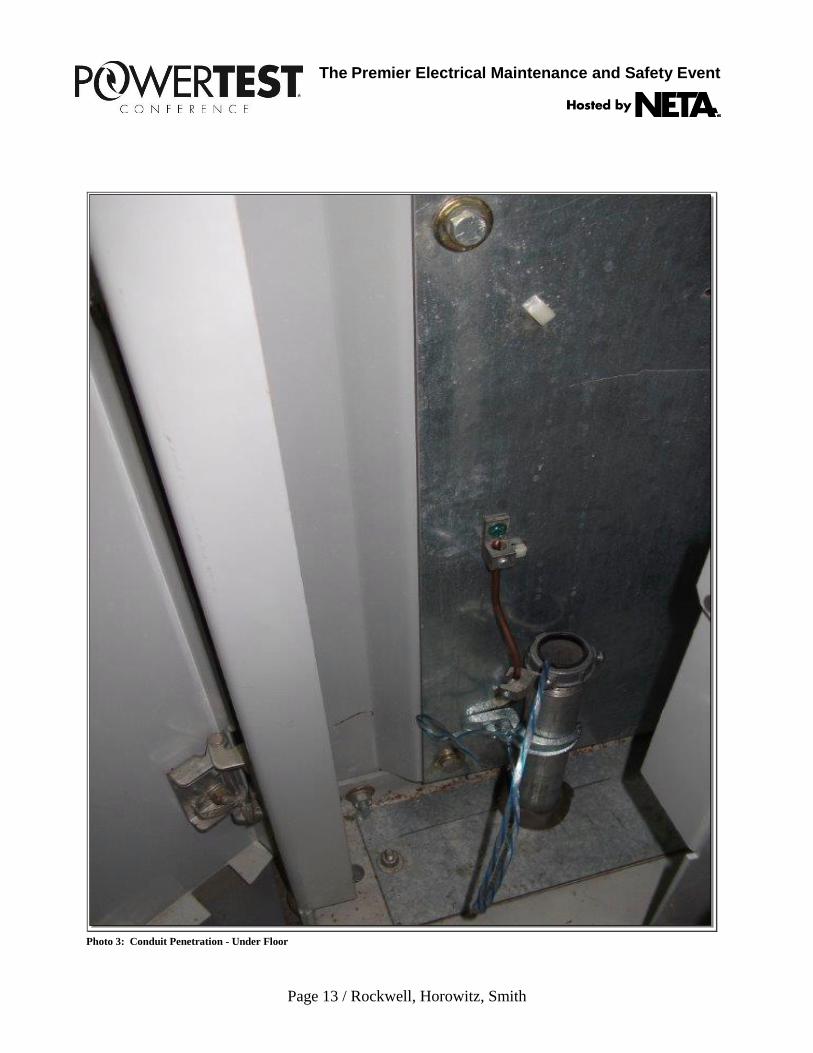
Photo 3: Conduit Penetration - Under Floor
The Premier Electrical Maintenance and Safety Event
Page 14 / Rockwell, Horowitz, Smith
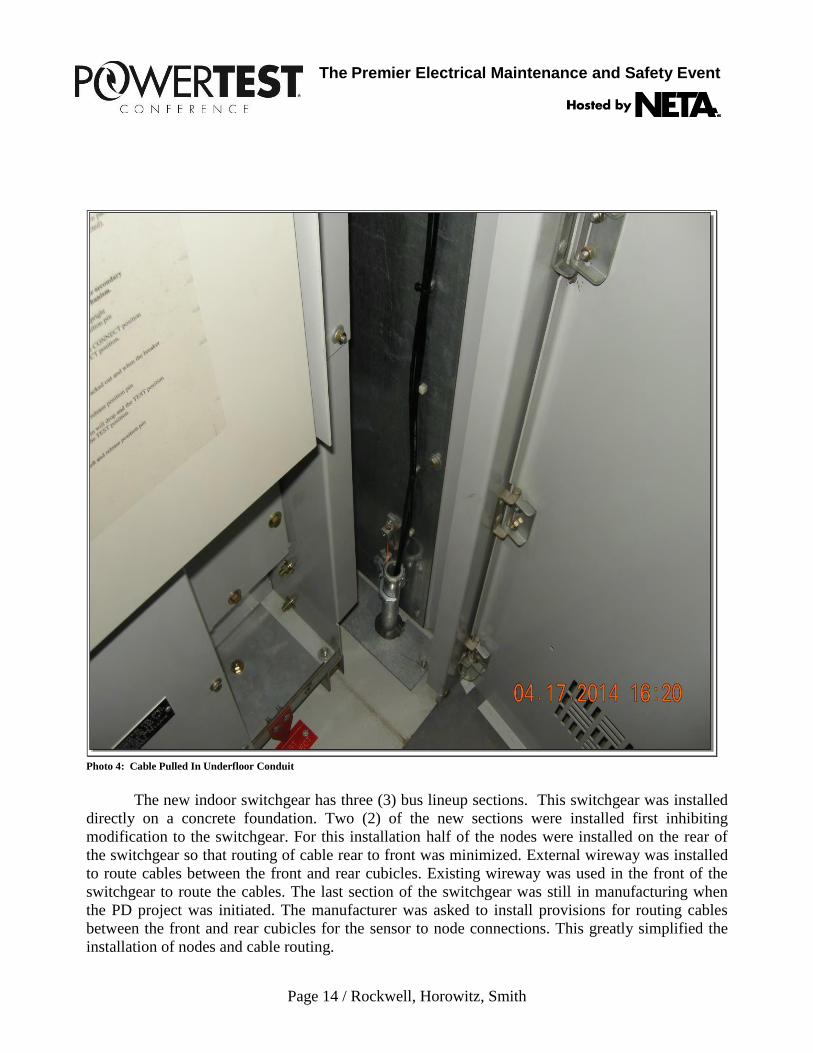
Photo 4: Cable Pulled In Underfloor Conduit
The new indoor switchgear has three (3) bus lineup sections. This switchgear was installed
directly on a concrete foundation. Two (2) of the new sections were installed first inhibiting
modification to the switchgear. For this installation half of the nodes were installed on the rear of
the switchgear so that routing of cable rear to front was minimized. External wireway was installed
to route cables between the front and rear cubicles. Existing wireway was used in the front of the
switchgear to route the cables. The last section of the switchgear was still in manufacturing when
the PD project was initiated. The manufacturer was asked to install provisions for routing cables
between the front and rear cubicles for the sensor to node connections. This greatly simplified the
installation of nodes and cable routing.
The Premier Electrical Maintenance and Safety Event
Page 15 / Rockwell, Horowitz, Smith
Commissioning
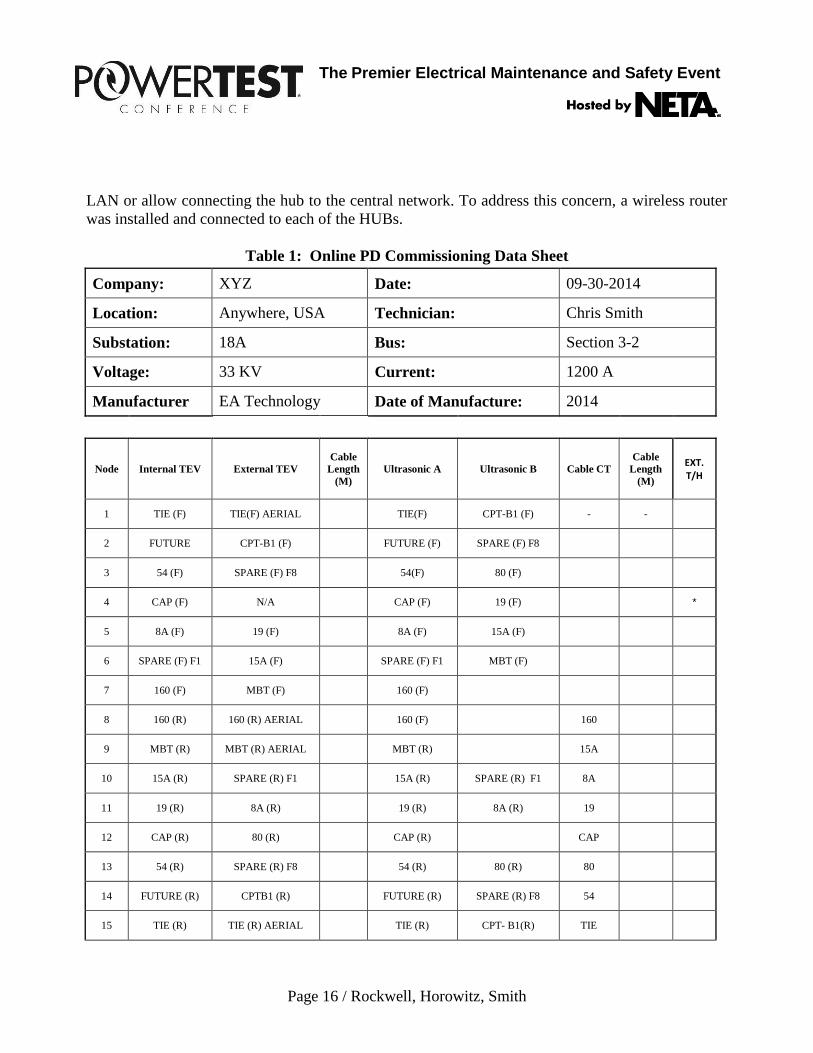
Commissioning of this system was relatively simple. Table 1 is a representative
commissioning data sheet used for programming the system configuration. When starting up the
system, a “System Discovery” is initiated that polls all connected devices. This polling identifies the
number of nodes connected to the hub and the type and quantity of connected sensors. During
discovery all of the nodes will display red and Green LEDs to assist in troubleshooting nodes that
are not communicating with the hub.
If this information is confirmed as correct, an ID tag for each node and each sensor is
entered into the system. The length of cable for any External TEV, External Antenna and RFCT
must also be entered into the system configuration. The cable length is used to provide timing the
sensors to time stamp the acquired signals. Once all the data is entered, the configuration is saved
and the system is put into the monitoring mode the system is operational.
Alarms are used to provide early warning / detection of PD. There are several alarms that
can be set:
TEV dB Mean Level
TEV Mean PPC (pulse per cycle)
Ultrasonic Mean Level
CPD (cable partial discharge) PC Meal Level
Table 2 shows the set points used for each alarm. Alarm level and alarm span were
developed in conjunction with the manufacturer’s recommendation. The alarm span indicates how
long the level needs to be at or above the alarm point in order for the system to consider it a valid
alarm. Outside influences, localized noise and transient over voltage can cause the measured
parameter to temporarily exceed the alarm level. Alarm span prevents/minimizes false alarms by
ensuring the parameter has exceeded the value and is a valid alarm.
The original system design incorporated a general alarm (dry contacts) when any monitored
point alarmed. This alarm signal was sent to the site’s central alarm command center, which is
monitored 24/7. When alarms are received by the command center, they reach out to the appropriate
department / personnel to respond. Since the owner had no prior experience with this type of system
and the PD alarm data requires expert analysis relying on the command center and responding
personnel was deemed insufficient. The hub is a computer running windows that has the capability
to be networked. For security reasons, the owner’s IT Department would not approve access to the
The Premier Electrical Maintenance and Safety Event
Page 16 / Rockwell, Horowitz, Smith
LAN or allow connecting the hub to the central network. To address this concern, a wireless router
was installed and connected to each of the HUBs.
Table 1: Online PD Commissioning Data Sheet
Company: XYZ Date: 09-30-2014
Location: Anywhere, USA Technician: Chris Smith
Substation: 18A Bus: Section 3-2
Voltage: 33 KV Current: 1200 A
Manufacturer EA Technology Date of Manufacture: 2014
Node Internal TEV External TEV
Cable
Length
(M)
Ultrasonic A Ultrasonic B Cable CT
Cable
Length
(M)
EXT. T/H
1 TIE (F) TIE(F) AERIAL
TIE(F) CPT-B1 (F) - -
2 FUTURE CPT-B1 (F)
FUTURE (F) SPARE (F) F8
3 54 (F) SPARE (F) F8
54(F) 80 (F)
4 CAP (F) N/A
CAP (F) 19 (F)
*
5 8A (F) 19 (F)
8A (F) 15A (F)
6 SPARE (F) F1 15A (F)
SPARE (F) F1 MBT (F)
7 160 (F) MBT (F)
160 (F)
8 160 (R) 160 (R) AERIAL
160 (F)
160
9 MBT (R) MBT (R) AERIAL
MBT (R)
15A
10 15A (R) SPARE (R) F1
15A (R) SPARE (R) F1 8A
11 19 (R) 8A (R)
19 (R) 8A (R) 19
12 CAP (R) 80 (R)
CAP (R)
CAP
13 54 (R) SPARE (R) F8
54 (R) 80 (R) 80
14 FUTURE (R) CPTB1 (R)
FUTURE (R) SPARE (R) F8 54
15 TIE (R) TIE (R) AERIAL
TIE (R) CPT- B1(R) TIE

The Premier Electrical Maintenance and Safety Event
Page 17 / Rockwell, Horowitz, Smith
Table 2: Alarm Settings
Alarm Point Alarm Level Alarm Span
TEV dB Mean Level 25 dB N/A
TEV Mean PPC Level 2.5 PPC N/A
Ultrasonic Mean Level 18 dB 30 minutes
CPD pC Meal Level 7000 pC 30 minutes
TeamViewer (remote access program) was installed on the hub and remote computers. This
system provides remote communication with the hub. The hub was programmed to send a daily
email indicating that the system was functioning correctly. Also, an email would be transmitted if
any monitored point alarmed or cleared. The email delineates what sensor alarmed and provides the
actual level of activity. When an alarm is received, the system can be remotely accessed and viewed
in one of two ways. The data can be viewed on the computer screen in real time as it could be on the
local hub’s monitor or the data can be downloaded. Once downloaded, the data can easily be
analyzed using the manufacturer’s data analysis software tool. This tool allows specific sensors to
be highlighted and compared. This speeds up the data review and analysis process. This
configuration also provides the OEM with direct access to the operating system which facilitates
analysis of alarms, system updates and system adjustment. Teamviewer can also be downloaded as
an application for both Android and Apple devices, allowing full access to the system from mobile
devices.
Lessons Learned
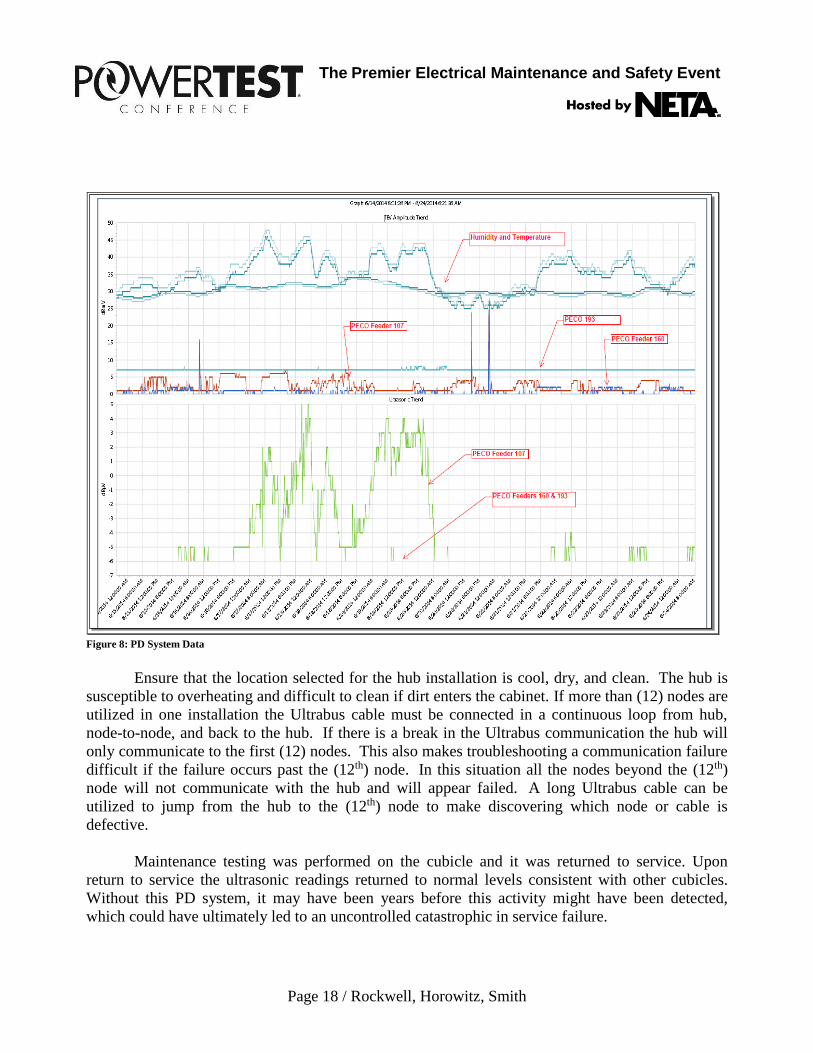
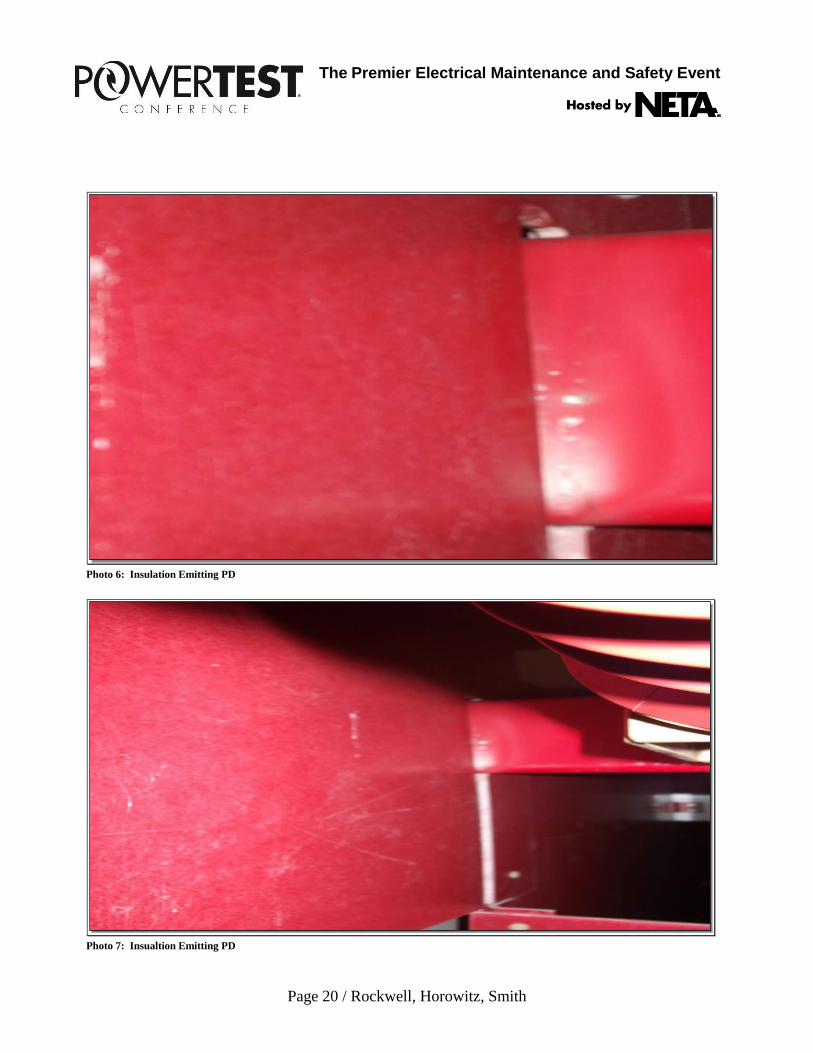
During a periodic review of stored data, after one of the systems had been installed for
several months, one (1) ultrasonic detector reading had increased above the other sensors.
However, this sensor was below the alarm point (Figure 8). Looking at the data it appeared to be
impacted by humidity. The user was notified of the potential situation. However, because the
system was relatively new, the user was reluctant to remove the equipment from service just on this
increased sensor reading. Separate ultrasonic readings were performed using a hand held
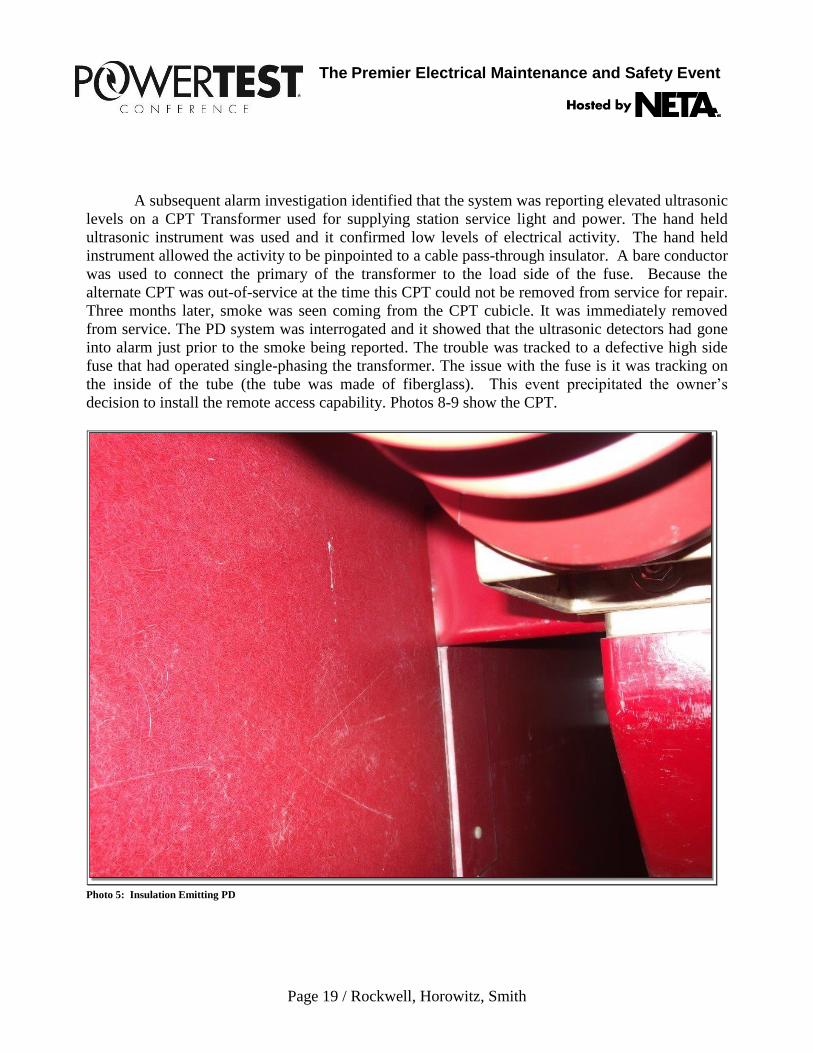
instrument, which confirmed electrical activity. The feeder was removed from service and an
inspection performed. An insulating barrier board was found rubbing against a 33 kV insulated
conductor, causing corona to be emitted. Photos 5-7 show the inspection findings. The barrier board
was removed, modified, cleaned and re-installed.
The Premier Electrical Maintenance and Safety Event
Page 18 / Rockwell, Horowitz, Smith
Figure 8: PD System Data
Ensure that the location selected for the hub installation is cool, dry, and clean. The hub is
susceptible to overheating and difficult to clean if dirt enters the cabinet. If more than (12) nodes are
utilized in one installation the Ultrabus cable must be connected in a continuous loop from hub,
node-to-node, and back to the hub. If there is a break in the Ultrabus communication the hub will
only communicate to the first (12) nodes. This also makes troubleshooting a communication failure
difficult if the failure occurs past the (12th) node. In this situation all the nodes beyond the (12th)
node will not communicate with the hub and will appear failed. A long Ultrabus cable can be
utilized to jump from the hub to the (12th) node to make discovering which node or cable is
defective.
Maintenance testing was performed on the cubicle and it was returned to service. Upon
return to service the ultrasonic readings returned to normal levels consistent with other cubicles.
Without this PD system, it may have been years before this activity might have been detected,
which could have ultimately led to an uncontrolled catastrophic in service failure.
The Premier Electrical Maintenance and Safety Event
Page 19 / Rockwell, Horowitz, Smith
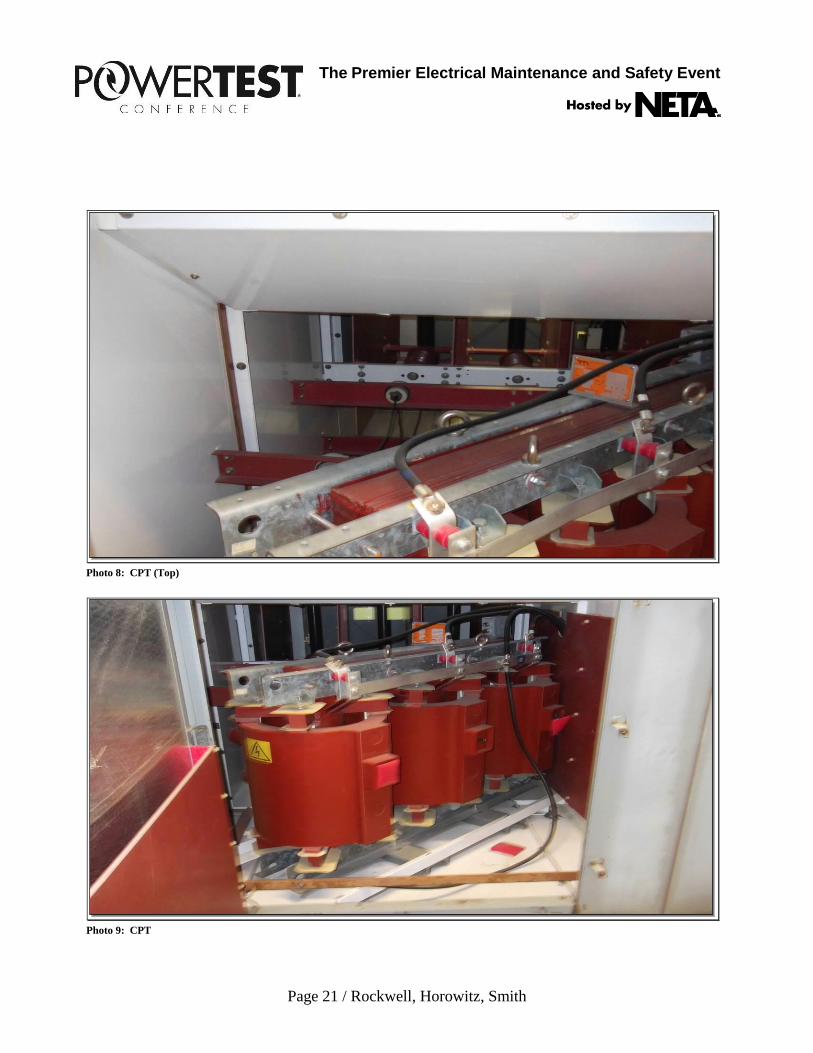
A subsequent alarm investigation identified that the system was reporting elevated ultrasonic
levels on a CPT Transformer used for supplying station service light and power. The hand held
ultrasonic instrument was used and it confirmed low levels of electrical activity. The hand held
instrument allowed the activity to be pinpointed to a cable pass-through insulator. A bare conductor
was used to connect the primary of the transformer to the load side of the fuse. Because the
alternate CPT was out-of-service at the time this CPT could not be removed from service for repair.
Three months later, smoke was seen coming from the CPT cubicle. It was immediately removed
from service. The PD system was interrogated and it showed that the ultrasonic detectors had gone
into alarm just prior to the smoke being reported. The trouble was tracked to a defective high side
fuse that had operated single-phasing the transformer. The issue with the fuse is it was tracking on
the inside of the tube (the tube was made of fiberglass). This event precipitated the owner’s
decision to install the remote access capability. Photos 8-9 show the CPT.
Photo 5: Insulation Emitting PD
The Premier Electrical Maintenance and Safety Event
Page 20 / Rockwell, Horowitz, Smith
Photo 6: Insulation Emitting PD
Photo 7: Insualtion Emitting PD
The Premier Electrical Maintenance and Safety Event
Page 21 / Rockwell, Horowitz, Smith
Photo 8: CPT (Top)
Photo 9: CPT

The Premier Electrical Maintenance and Safety Event
Page 22 / Rockwell, Horowitz, Smith
The RFCT is installed over the overall cable sheath ground. This RFCT is then connected to
a node via a coax cable that has a metallic connector. Initially, some of the RFCT’s were installed at
the floor level of the cubicle. After approximately three (3) months in operation, a feeder fault in the
substation feeding this switchgear resulted in the ground cable melting on the feeder compartment.
The root cause was the cable sheath ground cable was not sized adequately for the design fault
current levels. When the ground cable burnt open, it caused a high voltage transient which flashed
to the metal connector of the RFCT. This resulted in damage to the PD system. Repairs were made
to the system, and all metal connector associated with any of the sensors in the high voltage
compartments were insulated with Raychem 130o C tape. Adequate layers of tape were applied to
protect against full line-to-line voltage.
Advanced planning is critical for a project of this complexity to be successful. The
following key items should be followed to simplify the overall project, in particular the installation:
Pre-identify the location and proposed labeling of each sensor and the length of the cable
connecting that sensor.
Once the sensor, node and hub locations are identified, carefully determine how the system will
be interconnected. This phase is very critical if the system is being applied to in-service
switchgear. In some cases, a total outage of the switchgear will not be possible. Identifying
routing of communication cables is an important consideration - methods to consider are under
the gear (if there is access), external wireways and existing wireways.
Layout the design and sit review it with the user to fully explain the design and installation
process. Don’t assume the user is going to agree with the initial design approach. Owner input
can have significant impact on the design and installation.
After design is complete and cable routing identified, layout out the cable length requirement for
each interconnecting cable. In some cases general cable lengths work, but, do not use a 10 meter
cable when a seven (7) meter cable is suitable.
Label each cable as you install them so they can be identified during commissioning. Each
should be tested to confirm functionality prior to polling the system.
Where nodes have two (2) ultrasonic detectors connected (A & B), the system will request
where each of the detectors are located and a name for those detectors.
The Premier Electrical Maintenance and Safety Event
Page 23 / Rockwell, Horowitz, Smith
Bibliography
Brown, P. (1996). Non-Intrusive Partial Discharge Measurements On High Voltage
Switchgear. The Institution of Electrical Engineers (pp. 1-5). Leatherhead: EA
Technology.
Davies, N. (n.d.). upload/PD-Techniques-For-Measuring-Condition-Of-MV-and-HV-
Switchgear.pdf. Retrieved December 29, 2015, from http://www.cablejoints.co.uk/:
http://www.cablejoints.co.uk/upload/PD-Techniques-For-Measuring-Condition-Of-
MV-and-HV-Switchgear.pdf
Garnett, J. M., McGrail, A. J., & Doster, P. J. (2010). Substation Metal Clad Assessment
Using Handheld Ultrasonic and Transient Earth Voltage Testing Devices. TechCon
2010 (pp. 1-12). Santa Clara: Semiconductor Research Corporation (with Permission
by National Grid).
Kennedy, M. (2009). Partial Discharge - Electrical & RFI/EMI Detection Basics & Principles.
Doble Fall Committee Meetings (pp. 1-94). Calgary: Doble Engineering Company.
Lowsley, C., Davies, N., & Miller, D. (2012, July/August Volume 27, Number 4). Effective
Condition Assessment of Medium Voltage Switchgear. Maintenance & Asset
Management, pp. 46-51.
Renforth, L., Seltzer-Grant, M., Mackinlay, R., Goodfellow, S., Clark, D., & Shuttleworth, R.
(2011). Experiences from over 15 Years of On-line Partial Discharge (OLPD) Testing
of In-Service MV and HV Cables, Switchgear, Transformers and Rotating Machines.
IEEE IX Latin American Robotics Symposium and IEEE Colombian Conference on
Automatic Control (pp. 1-7). Bogota: IEEE.
Unknown. (n.d.). Upload/casestudies/cost%20benefit%20analysis.pdf. Retrieved Dec 29, 2015,
from:www.irispower.com:http://www.irispower.com/Upload/casestudies/cost%20benef
it%20analysis.pdf