Embed Size (px)
Citation preview
1
Appendix K Dispersion Modeling and Weight-of-Evidence Analysis for
Steubenville, OH-WV
2010 SO2 NAAQS Nonattainment Area Introduction The United States Environmental Protection Agency (U.S. EPA) established a new National Ambient Air Quality Standard (NAAQS) for SO2 on June 22, 2010, of 75 ppb, as the 99th percentile of maximum daily values, averaged over three years. In addition, U.S. EPA revoked the primary annual and 24-hour standards. On August 5, 2013 (75 FR 47191), effective October 4, 2013, U.S. EPA promulgated the initial SO2 nonattainment areas for the newly established SO2 standard across the country. The Clean Air Act requires states with SO2 nonattainment areas to submit a plan within eighteen months of the effective date of the designations (i.e., by April 4, 2015 based on an October 4, 2013 effective date) detailing how the SO2 standard will be attained. This document supports the SO2 State Implementation Plan (SIP) for the Steubenville, OH-WV nonattainment area in the State of Ohio. This nonattainment area encompasses emissions from the Cardinal Power Plant, Mountain State Carbon, Mingo Junction Energy Center, and the former Wheeling Pittsburgh Mingo Junction Steel Plant (herein referred to as “Mingo Junction Steel Works”). Cardinal Power Plant (Ohio EPA facility identification # 0641050002) is located at 306 County Road 7 East in Brilliant, Ohio. Mountain State Carbon (WVDEP facility identification # 009-00002) is located at WV Route 2, Follansbee, West Virginia. Mingo Junction Steel Works (Ohio EPA facility identification # 0641090010) is located at 540 Commercial Ave in Mingo Junction, Ohio, and Mingo Junction Energy Center (Ohio EPA facility identification # 0641090234) is located at 540 Commercial Ave in Mingo Junction, Ohio. The Mingo Junction Energy Center property is located within the Mingo Junction Steel Works property. There are no other significant sources of SO2 emissions in the nonattainment area that warrant inclusion in the modeling analysis. As can be seen from the inventory included in Ohio’s SO2 Nonattainment Area SIP, the emissions from the facilities comprise more than 99% of the 2011 SO2 emissions in the entire nonattainment area. Per U.S. EPA’s guidance (April 23, 2014 Guidance for 1-Hour SO2 Nonattainment Area SIP Submissions (herein referred to as “Nonattainment SIP Guidance”)), “An approvable attainment demonstration would be an air quality modeling analysis that demonstrates that the emission limits in the plan will suffice to provide for timely attainment of the affected standard”. In addition, U.S. EPA’s most recent draft of the document “Draft Modeling Guidance for Demonstrating Attainment of Air Quality Goals for Ozone, PM2.5, and Regional Haze” (December 3, 2014) continues to support the ability to use a weight-of-evidence approach as part of attainment demonstrations. Ohio
2
EPA will be using an extensive modeling analysis coupled with other evidence, such as actual monitoring data, to form our attainment strategy for this area using a weight-of-evidence approach. Multiple dispersion modeling analyses were performed for this SIP analysis. The first was an analysis of the July 1, 2013-June 30, 2014 period, using actual variable emissions from each facility included in the modeling domain that was active during that time period. This portion of Ohio EPA’s analysis demonstrates the contribution of each facility to the ambient air quality monitors in the nonattainment area, and was used to assess model performance. This specific modeling analysis is herein referred to as the “base case,” and all modeling analyses not associated with monitor-only specific impacts are herein referred to as “future case” scenarios. The second analysis demonstrates the impact of each individual facility on the nonattainment area when operating at permitted or potential SO2 emission rates. This portion of the analysis was used to establish emission rates that eliminate facility-specific hotspots exceeding the standard (herein referred to as “ceiling rates”). The third analysis demonstrates the interactive impact of facilities in the nonattainment area when operating at previously identified ceiling rates. This portion of the analysis was used to establish emission rates at all facilities required to model attainment of the standard over the nonattainment area (herein referred to as “attainment rates”). The final analysis demonstrates attainment of the standard. These analyses are discussed in greater detail below. The base case analysis evaluated a one-year time period, July 1, 2013-June 30, 2014, using actual, temporally varying emissions to determine the contribution of emissions from each active source in the modeling domain to the monitored design value concentrations and to assess model performance. This one-year time period is the result of using a full year of onsite meteorological data collected at Mountain State Carbon and at Cardinal Power Plant (Cardinal). Ohio EPA attempted to use variable emissions at the finest temporal scale available for each facility. For this analysis, Ohio EPA utilized hourly emissions from Cardinal for the July 1, 2013-June 30, 2014 period collected from U.S. EPA’s Clean Air Markets Database. Hourly variable emissions from Mountain State Carbon were provided by Mountain State Carbon to Ohio EPA and West Virginia DEP during facility outreach. Other facilities included in the attainment modeling analysis were not modeled for the base case, as they were not operating during this time period. It should also be noted, as discussed extensively in the protocol portion of Ohio’s SIP submittal, there are unique challenges in modeling this particular area and the sources within the area. For example, the area has complex meteorology and terrain that requires special consideration while also giving special consideration to the dynamic nature of Cardinal’s Unit 3 cooling tower and exhaust stream. Also unique to this area is the substantial number of ambient air quality monitors currently in operation. In addition to the four U.S. EPA Air Quality System (AQS) monitors located in the northern portion of the nonattainment area, Cardinal operates four monitors, sited specifically to monitor points of maximum impact from the Cardinal
3
plant. These monitors began operation in 2011, as part of the permit to install FGD technology on Unit 3 at the Cardinal plant. These monitors were not considered during the nonattainment designation process because the monitors had not operated for a long enough time period. These monitors undergo rigorous quality assurance/quality control (QA/QC), and now there are four full years of data collected in this network and it is being incorporated as part of this SIP submittal for modeling purposes and to inform Ohio EPA’s weight-of-evidence approach discussed later. In addition to the substantial amount of monitoring data available, Mountain State Carbon maintains and operates an onsite meteorological station, and Cardinal maintains and operates three meteorological stations. Thus, there is a significant amount of onsite meteorological data available for this area collected in locations that are more representative of the unique meteorological conditions present in the Ohio River valley. Ohio EPA utilized multiple on-site meteorological datasets as part of the modeling analyses conducted as part of this SIP submittal. The various future case analyses evaluated the impact of each impacting facility individually on the modeling domain when operated at their permitted limits, as well as any attainment strategies and/or emission reductions necessary. Dispersion modeling was used to validate that the control strategies and permit limits will provide for attainment of the standard using on-site meteorological data. Modeling Approach
Per U.S. EPA’s Nonattainment SIP Guidance,
“Appendix A of this document contains modeling guidance supplemental to that provided in the preamble to the final rulemaking promulgating the 2010 S02 NAAQS and in 40 CFR part 51, Appendix W. Appendix A of this document has also been updated to respond to issues raised during the comment period related to the September 2011 draft S02 Guidance Document. This guidance clarifies the EPA's recommendations on how to conduct refined dispersion modeling under Appendix W to support the implementation of the 2010 S02 NAAQS.”
Modeling input data, including emission rates, are addressed in Section 8.0 of Appendix W and specifically for SO2, in Appendix A of the Nonattainment SIP Guidance. The averaging period for the 2010 SO2 NAAQS is the 99th percentile of maximum monitored daily values, averaged over three years. Per the Nonattainment SIP Guidance, five years of National Weather Service data or at least one year of on-site meteorological data is sufficient to represent attainment of the standard. Thus, the modeled form of the standard is expressed as the 99th percentile of maximum daily values averaged over the number of years of meteorological data used (herein referred to as “design value”). The recommended dispersion model for SIP modeling for SO2 is the American Meteorological Society/Environmental Protection Agency Regulatory Model (AERMOD) modeling system. There are two input data processors that are regulatory components
4
of the AERMOD modeling system: AERMET, a meteorological data preprocessor that incorporates air dispersion based on planetary boundary layer turbulence structure and scaling concepts, and AERMAP, a terrain data preprocessor that incorporates complex terrain using United States Geological Survey (USGS) Digital Elevation Data. Additionally, Ohio EPA utilized the AERMINUTE module to incorporate 1-minute ASOS meteorological data into the hourly surface input file. Ohio EPA utilized the most up-to-date versions of AERMOD and the associated preprocessors available at the time of the attainment modeling analyses. These are as follows: AERMOD version 14134, AERMET version 14134, AERMINUTE version 14237, and AERMAP version 11103. Meteorological Data Multiple sources of on-site meteorological data were available for modeling analyses in the Steubenville, OH-WV nonattainment area. Three years of on-site data collected at Mountain State Carbon for the 2007-2009 period were available, as well as a one-year period from July 1, 2013-June 30, 2014 (herein referred to as the “split year”). Additionally, Cardinal maintains and operates three meteorological stations. These stations did not begin operation until 2011. Further, the meteorological station located at Mountain State Carbon was not in operation for an extended period of time between 2009 and 2013. Thus, the split year (a full 12 consecutive months) time period was utilized for a majority of the modeling analyses, as it represents a common period when both Cardinal and Mountain State Carbon were collecting meteorological data. As detailed in the protocol discussion of Ohio’s SIP submittal, Ohio EPA utilized meteorological data collected at the Cardinal plant to model the impacts of Cardinal, and meteorological data collected at Mountain State Carbon to model impacts from Mountain State Carbon, Mingo Junction Steel Works, and Mingo Junction Energy center. This use of area-specific meteorological data sets is necessary and appropriate given the unique discharge and parameterization associated with the Cardinal Unit 3 cooling tower emissions, as described in the protocol discussion of Ohio’s SIP submittal. The use of a split year (12 consecutive months) meteorological dataset, and the use of separate site-specific meteorological data, is consistent with both the Nonattainment SIP Guidance and Appendix W, as described in the protocol discussion of Ohio’s SIP submittal. Background Ohio EPA applied background concentrations of SO2 to all modeled results under all scenarios. Ohio EPA established a background concentration of 8.1 ppb determined from an analysis of monitored SO2 concentrations in the nonattainment area. A detailed description of the background determination for both the base and future case scenarios is provided in the protocol discussion of Ohio’s SIP submittal.
Base Case Analysis The base case analysis compared model predicted one-year SO2 design values to actual monitored design values during the same July 1, 2013-June 30, 2014 period. The
5
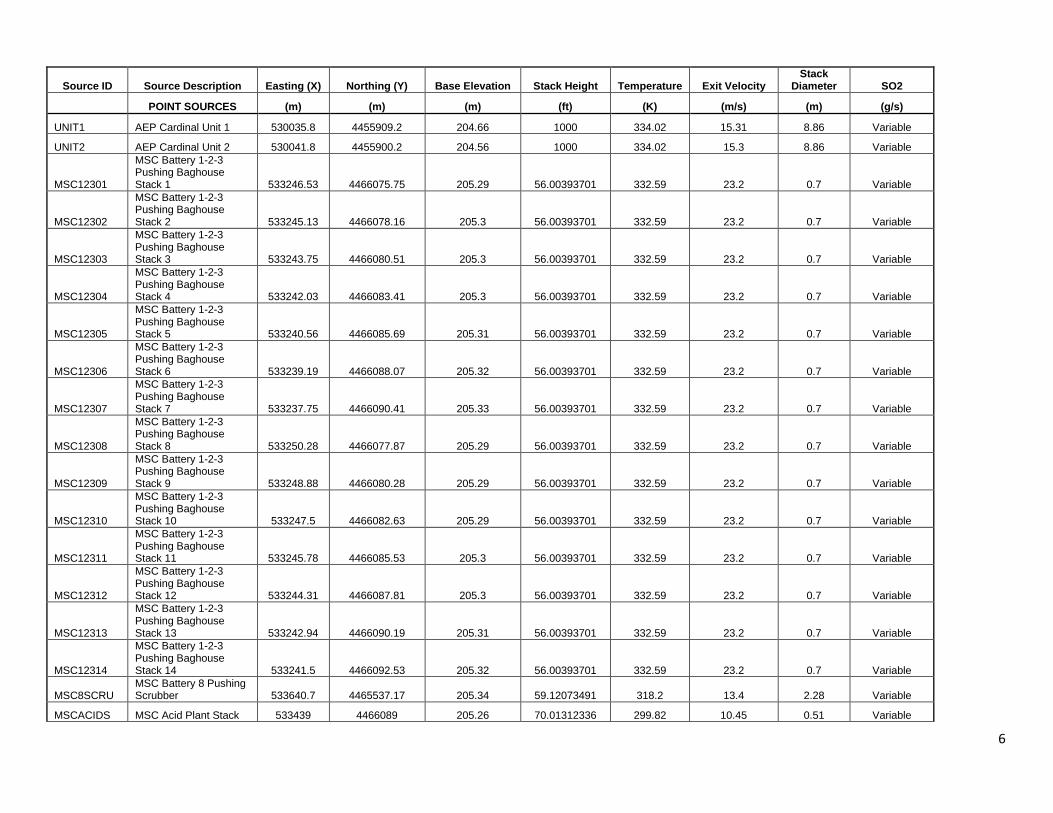
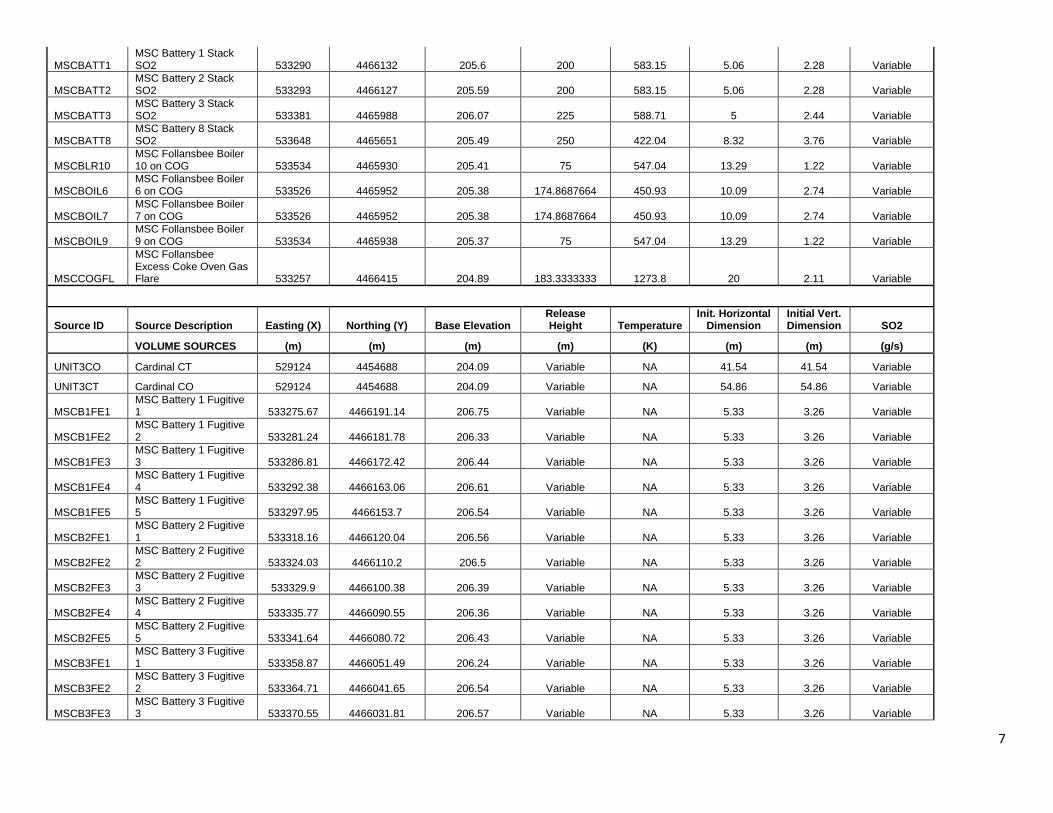
modeled base case was a reasonable attempt to replicate the actual monitored design values. The purpose of modeling actual conditions was to determine the contribution to the modeled exceedance by each source. Further, the base case provides a means to assess model performance, input data quality, and assess the accuracy of the background concentration. To assess source-specific impacts at the monitor locations, Ohio EPA, following U.S. EPA guidance for situations in which it is not possible to model all facilities simultaneously, generated hourly concentration values modeled at each monitor for both the Cardinal Plant and Mountain State Carbon via the POSTFILE output option. These POSTFILES were subsequently processed to determine the combined impact of both facilities at each monitor, for each hour of the modeled period. Emission Sources 51 emission sources from the two facilities were included in the base case modeling analysis. This includes 25 point sources and 22 segmented volume sources at Mountain State Carbon, as well as 2 point sources and 2 elevated volume sources at Cardinal Plant representing the Unit 3 discharge via the cooling tower. The treatment of the fugitive emissions from the coke oven batteries at Mountain State Carbon as buoyant volume sources, as well as the parameterization of the Unit 3 cooling tower release point are fully detailed in the protocol discussion of Ohio’s SIP submittal. Variable emissions for all 51 sources were included in the model via the HOUREMIS input pathway. As stated previously, the base case analyses were comprised of two separate modeling runs, and the resultant POSTFILES combined externally to AERMOD. Additionally, Ohio EPA accounted for the 8.1 ppb background concentration during the post-processing stage to avoid double counting of background impacts. The relevant release point parameters for the 51 emission units included in the base case analysis are presented in Table 1, below.
6
Source ID Source Description Easting (X) Northing (Y) Base Elevation Stack Height Temperature Exit Velocity Stack
Diameter SO2
POINT SOURCES (m) (m) (m) (ft) (K) (m/s) (m) (g/s)
UNIT1 AEP Cardinal Unit 1 530035.8 4455909.2 204.66 1000 334.02 15.31 8.86 Variable
UNIT2 AEP Cardinal Unit 2 530041.8 4455900.2 204.56 1000 334.02 15.3 8.86 Variable
MSC12301
MSC Battery 1-2-3 Pushing Baghouse Stack 1 533246.53 4466075.75 205.29 56.00393701 332.59 23.2 0.7 Variable
MSC12302
MSC Battery 1-2-3 Pushing Baghouse Stack 2 533245.13 4466078.16 205.3 56.00393701 332.59 23.2 0.7 Variable
MSC12303
MSC Battery 1-2-3 Pushing Baghouse Stack 3 533243.75 4466080.51 205.3 56.00393701 332.59 23.2 0.7 Variable
MSC12304
MSC Battery 1-2-3 Pushing Baghouse Stack 4 533242.03 4466083.41 205.3 56.00393701 332.59 23.2 0.7 Variable
MSC12305
MSC Battery 1-2-3 Pushing Baghouse Stack 5 533240.56 4466085.69 205.31 56.00393701 332.59 23.2 0.7 Variable
MSC12306
MSC Battery 1-2-3 Pushing Baghouse Stack 6 533239.19 4466088.07 205.32 56.00393701 332.59 23.2 0.7 Variable
MSC12307
MSC Battery 1-2-3 Pushing Baghouse Stack 7 533237.75 4466090.41 205.33 56.00393701 332.59 23.2 0.7 Variable
MSC12308
MSC Battery 1-2-3 Pushing Baghouse Stack 8 533250.28 4466077.87 205.29 56.00393701 332.59 23.2 0.7 Variable
MSC12309
MSC Battery 1-2-3 Pushing Baghouse Stack 9 533248.88 4466080.28 205.29 56.00393701 332.59 23.2 0.7 Variable
MSC12310
MSC Battery 1-2-3 Pushing Baghouse Stack 10 533247.5 4466082.63 205.29 56.00393701 332.59 23.2 0.7 Variable
MSC12311
MSC Battery 1-2-3 Pushing Baghouse Stack 11 533245.78 4466085.53 205.3 56.00393701 332.59 23.2 0.7 Variable
MSC12312
MSC Battery 1-2-3 Pushing Baghouse Stack 12 533244.31 4466087.81 205.3 56.00393701 332.59 23.2 0.7 Variable
MSC12313
MSC Battery 1-2-3 Pushing Baghouse Stack 13 533242.94 4466090.19 205.31 56.00393701 332.59 23.2 0.7 Variable
MSC12314
MSC Battery 1-2-3 Pushing Baghouse Stack 14 533241.5 4466092.53 205.32 56.00393701 332.59 23.2 0.7 Variable
MSC8SCRU MSC Battery 8 Pushing Scrubber 533640.7 4465537.17 205.34 59.12073491 318.2 13.4 2.28 Variable
MSCACIDS MSC Acid Plant Stack 533439 4466089 205.26 70.01312336 299.82 10.45 0.51 Variable
7
MSCBATT1 MSC Battery 1 Stack SO2 533290 4466132 205.6 200 583.15 5.06 2.28 Variable
MSCBATT2 MSC Battery 2 Stack SO2 533293 4466127 205.59 200 583.15 5.06 2.28 Variable
MSCBATT3 MSC Battery 3 Stack SO2 533381 4465988 206.07 225 588.71 5 2.44 Variable
MSCBATT8 MSC Battery 8 Stack SO2 533648 4465651 205.49 250 422.04 8.32 3.76 Variable
MSCBLR10 MSC Follansbee Boiler 10 on COG 533534 4465930 205.41 75 547.04 13.29 1.22 Variable
MSCBOIL6 MSC Follansbee Boiler 6 on COG 533526 4465952 205.38 174.8687664 450.93 10.09 2.74 Variable
MSCBOIL7 MSC Follansbee Boiler 7 on COG 533526 4465952 205.38 174.8687664 450.93 10.09 2.74 Variable
MSCBOIL9 MSC Follansbee Boiler 9 on COG 533534 4465938 205.37 75 547.04 13.29 1.22 Variable
MSCCOGFL
MSC Follansbee Excess Coke Oven Gas Flare 533257 4466415 204.89 183.3333333 1273.8 20 2.11 Variable
Source ID Source Description Easting (X) Northing (Y) Base Elevation Release Height Temperature
Init. Horizontal Dimension
Initial Vert. Dimension SO2
VOLUME SOURCES (m) (m) (m) (m) (K) (m) (m) (g/s)
UNIT3CO Cardinal CT 529124 4454688 204.09 Variable NA 41.54 41.54 Variable
UNIT3CT Cardinal CO 529124 4454688 204.09 Variable NA 54.86 54.86 Variable
MSCB1FE1 MSC Battery 1 Fugitive 1 533275.67 4466191.14 206.75 Variable NA 5.33 3.26 Variable
MSCB1FE2 MSC Battery 1 Fugitive 2 533281.24 4466181.78 206.33 Variable NA 5.33 3.26 Variable
MSCB1FE3 MSC Battery 1 Fugitive 3 533286.81 4466172.42 206.44 Variable NA 5.33 3.26 Variable
MSCB1FE4 MSC Battery 1 Fugitive 4 533292.38 4466163.06 206.61 Variable NA 5.33 3.26 Variable
MSCB1FE5 MSC Battery 1 Fugitive 5 533297.95 4466153.7 206.54 Variable NA 5.33 3.26 Variable
MSCB2FE1 MSC Battery 2 Fugitive 1 533318.16 4466120.04 206.56 Variable NA 5.33 3.26 Variable
MSCB2FE2 MSC Battery 2 Fugitive 2 533324.03 4466110.2 206.5 Variable NA 5.33 3.26 Variable
MSCB2FE3 MSC Battery 2 Fugitive 3 533329.9 4466100.38 206.39 Variable NA 5.33 3.26 Variable
MSCB2FE4 MSC Battery 2 Fugitive 4 533335.77 4466090.55 206.36 Variable NA 5.33 3.26 Variable
MSCB2FE5 MSC Battery 2 Fugitive 5 533341.64 4466080.72 206.43 Variable NA 5.33 3.26 Variable
MSCB3FE1 MSC Battery 3 Fugitive 1 533358.87 4466051.49 206.24 Variable NA 5.33 3.26 Variable
MSCB3FE2 MSC Battery 3 Fugitive 2 533364.71 4466041.65 206.54 Variable NA 5.33 3.26 Variable
MSCB3FE3 MSC Battery 3 Fugitive 3 533370.55 4466031.81 206.57 Variable NA 5.33 3.26 Variable
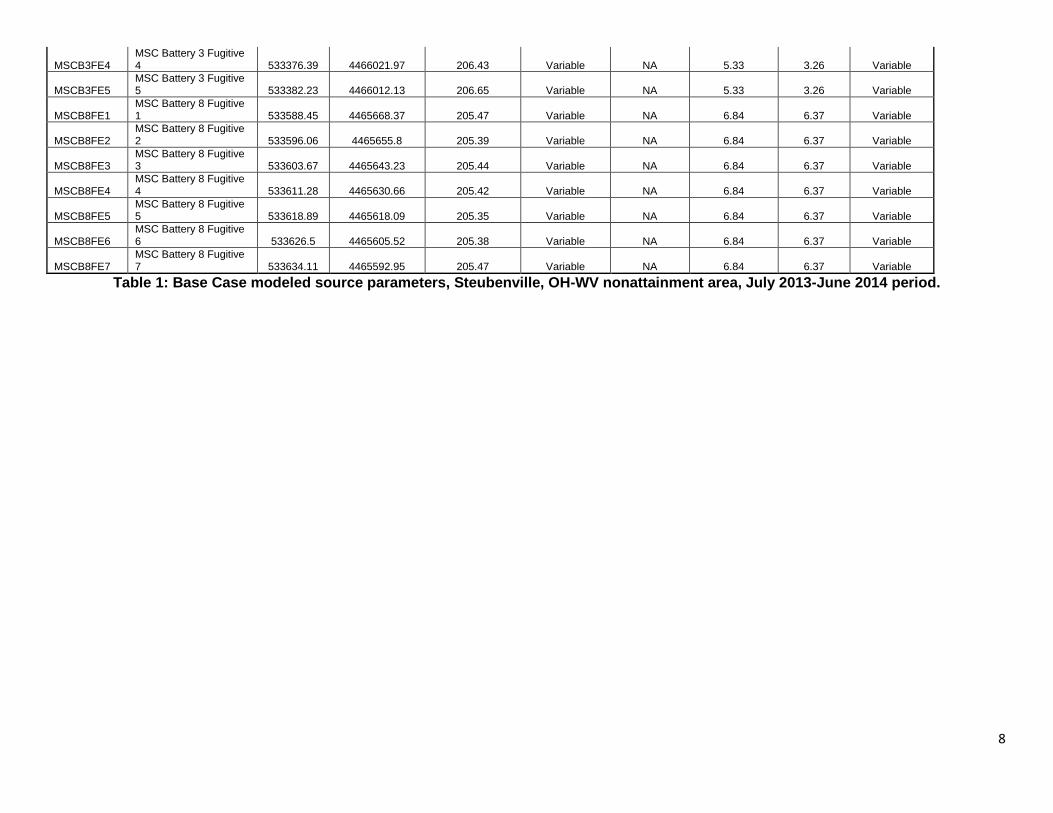
8
MSCB3FE4 MSC Battery 3 Fugitive 4 533376.39 4466021.97 206.43 Variable NA 5.33 3.26 Variable
MSCB3FE5 MSC Battery 3 Fugitive 5 533382.23 4466012.13 206.65 Variable NA 5.33 3.26 Variable
MSCB8FE1 MSC Battery 8 Fugitive 1 533588.45 4465668.37 205.47 Variable NA 6.84 6.37 Variable
MSCB8FE2 MSC Battery 8 Fugitive 2 533596.06 4465655.8 205.39 Variable NA 6.84 6.37 Variable
MSCB8FE3 MSC Battery 8 Fugitive 3 533603.67 4465643.23 205.44 Variable NA 6.84 6.37 Variable
MSCB8FE4 MSC Battery 8 Fugitive 4 533611.28 4465630.66 205.42 Variable NA 6.84 6.37 Variable
MSCB8FE5 MSC Battery 8 Fugitive 5 533618.89 4465618.09 205.35 Variable NA 6.84 6.37 Variable
MSCB8FE6 MSC Battery 8 Fugitive 6 533626.5 4465605.52 205.38 Variable NA 6.84 6.37 Variable
MSCB8FE7 MSC Battery 8 Fugitive 7 533634.11 4465592.95 205.47 Variable NA 6.84 6.37 Variable
Table 1: Base Case modeled source parameters, Steubenville, OH-WV nonattainment area, July 2013-June 2014 period.
9
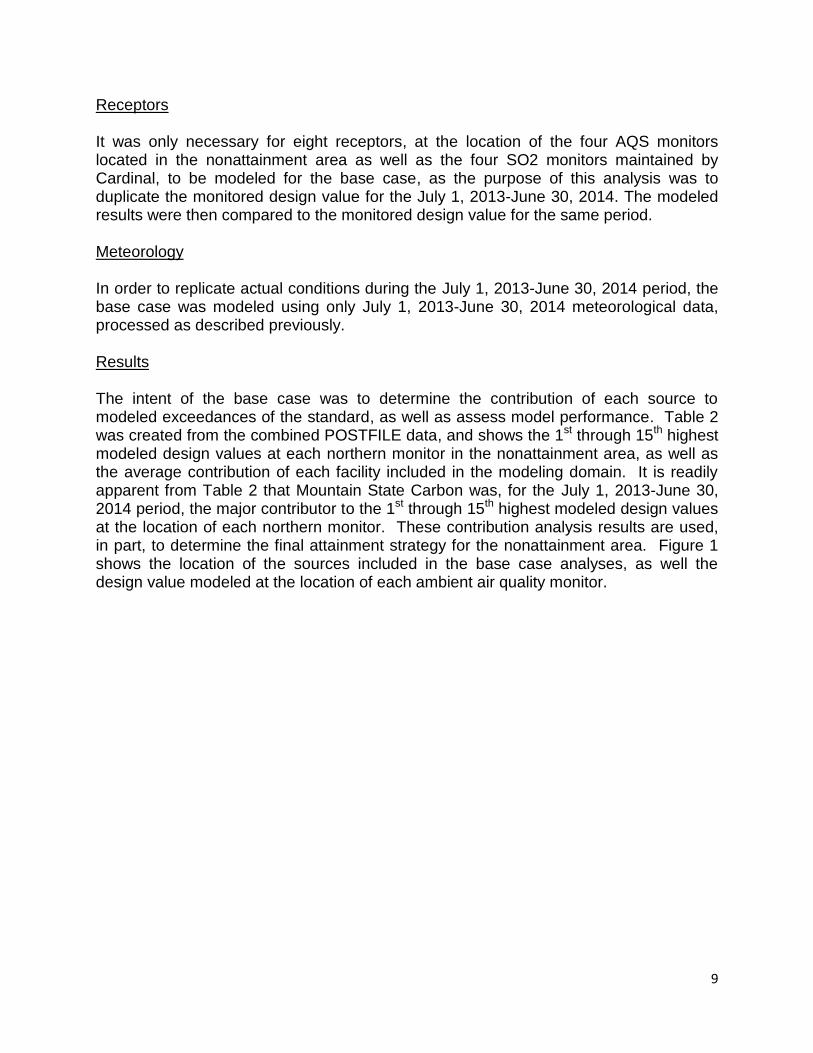
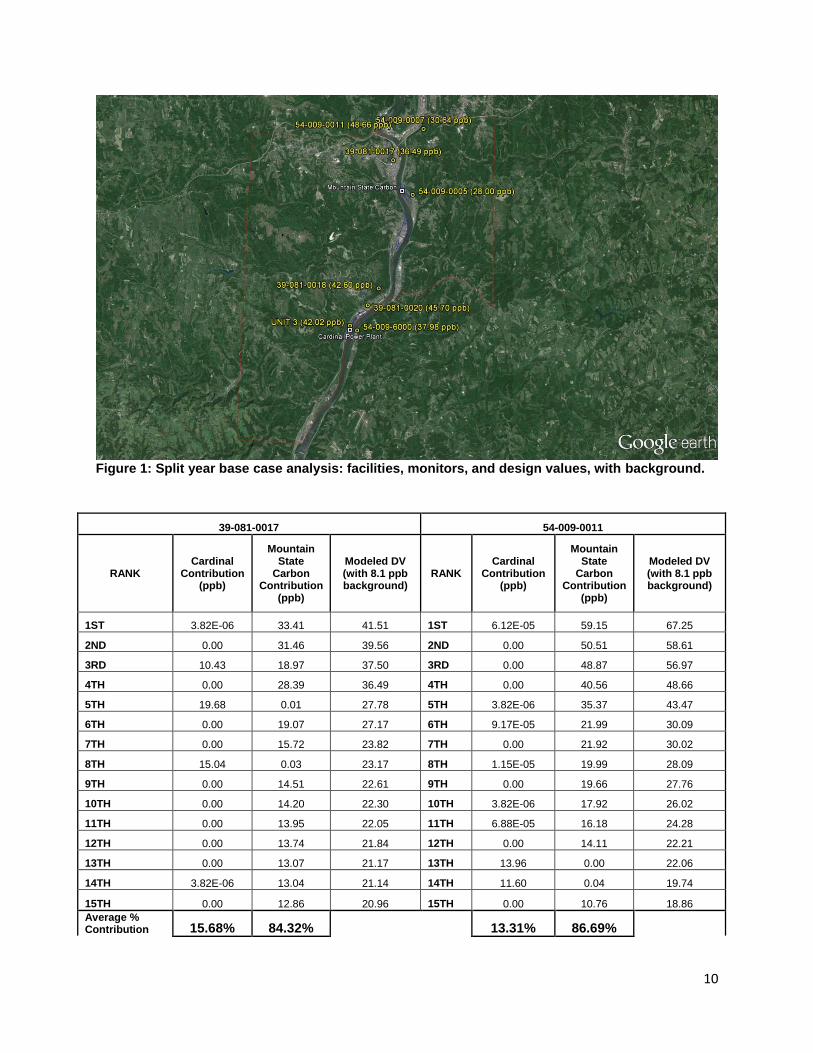
Receptors It was only necessary for eight receptors, at the location of the four AQS monitors located in the nonattainment area as well as the four SO2 monitors maintained by Cardinal, to be modeled for the base case, as the purpose of this analysis was to duplicate the monitored design value for the July 1, 2013-June 30, 2014. The modeled results were then compared to the monitored design value for the same period. Meteorology In order to replicate actual conditions during the July 1, 2013-June 30, 2014 period, the base case was modeled using only July 1, 2013-June 30, 2014 meteorological data, processed as described previously. Results The intent of the base case was to determine the contribution of each source to modeled exceedances of the standard, as well as assess model performance. Table 2 was created from the combined POSTFILE data, and shows the 1st through 15th highest modeled design values at each northern monitor in the nonattainment area, as well as the average contribution of each facility included in the modeling domain. It is readily apparent from Table 2 that Mountain State Carbon was, for the July 1, 2013-June 30, 2014 period, the major contributor to the 1st through 15th highest modeled design values at the location of each northern monitor. These contribution analysis results are used, in part, to determine the final attainment strategy for the nonattainment area. Figure 1 shows the location of the sources included in the base case analyses, as well the design value modeled at the location of each ambient air quality monitor.
10
Figure 1: Split year base case analysis: facilities, monitors, and design values, with background.
39-081-0017 54-009-0011
RANK Cardinal
Contribution (ppb)
Mountain State
Carbon Contribution
(ppb)
Modeled DV (with 8.1 ppb background)
RANK Cardinal
Contribution (ppb)
Mountain State
Carbon Contribution
(ppb)
Modeled DV (with 8.1 ppb background)
1ST 3.82E-06 33.41 41.51 1ST 6.12E-05 59.15 67.25
2ND 0.00 31.46 39.56 2ND 0.00 50.51 58.61
3RD 10.43 18.97 37.50 3RD 0.00 48.87 56.97
4TH 0.00 28.39 36.49 4TH 0.00 40.56 48.66
5TH 19.68 0.01 27.78 5TH 3.82E-06 35.37 43.47
6TH 0.00 19.07 27.17 6TH 9.17E-05 21.99 30.09
7TH 0.00 15.72 23.82 7TH 0.00 21.92 30.02
8TH 15.04 0.03 23.17 8TH 1.15E-05 19.99 28.09
9TH 0.00 14.51 22.61 9TH 0.00 19.66 27.76
10TH 0.00 14.20 22.30 10TH 3.82E-06 17.92 26.02
11TH 0.00 13.95 22.05 11TH 6.88E-05 16.18 24.28
12TH 0.00 13.74 21.84 12TH 0.00 14.11 22.21
13TH 0.00 13.07 21.17 13TH 13.96 0.00 22.06
14TH 3.82E-06 13.04 21.14 14TH 11.60 0.04 19.74
15TH 0.00 12.86 20.96 15TH 0.00 10.76 18.86
Average % Contribution 15.68% 84.32%
13.31% 86.69%
11
54-009-0007 54-009-0005
RANK Cardinal
Contribution (ppb)
Mountain State Carbon Contribution
(ppb)
Modeled DV (with 8.1 ppb background)
RANK Cardinal
Contribution (ppb)
Mountain State
Carbon Contribution
(ppb)
Modeled DV (with 8.1 ppb background)
1ST 0.00 33.42 41.52 1ST 0.00 31.23 39.33
2ND 0.00 30.83 38.93 2ND 25.32 0.44 33.86
3RD 0.00 26.87 34.97 3RD 20.48 0.12 28.70
4TH 0.00 22.54 30.64 4TH 18.37 1.53 28.00
5TH 20.33 0.01 28.43 5TH 0.02 19.35 27.47
6TH 0.05 17.90 26.06 6TH 0.03 17.04 25.18
7TH 0.00 16.11 24.21 7TH 0.01 15.25 23.35
8TH 14.04 0.06 22.20 8TH 0.00 14.99 23.09
9TH 0.00 12.46 20.56 9TH 0.00 13.03 21.13
10TH 0.00 10.95 19.05 10TH 0.01 12.66 20.77
11TH 10.66 0.00 18.76 11TH 12.21 0.04 20.35
12TH 0.00 10.58 18.68 12TH 10.08 1.14 19.32
13TH 1.74 8.15 17.99 13TH 0.00 11.22 19.32
14TH 0.00 9.84 17.94 14TH 0.04 11.04 19.18
15TH 8.21 0.00 16.31 15TH 10.76 0.31 19.17
Average % Contribution 27.82% 72.18% 38.49% 61.51%
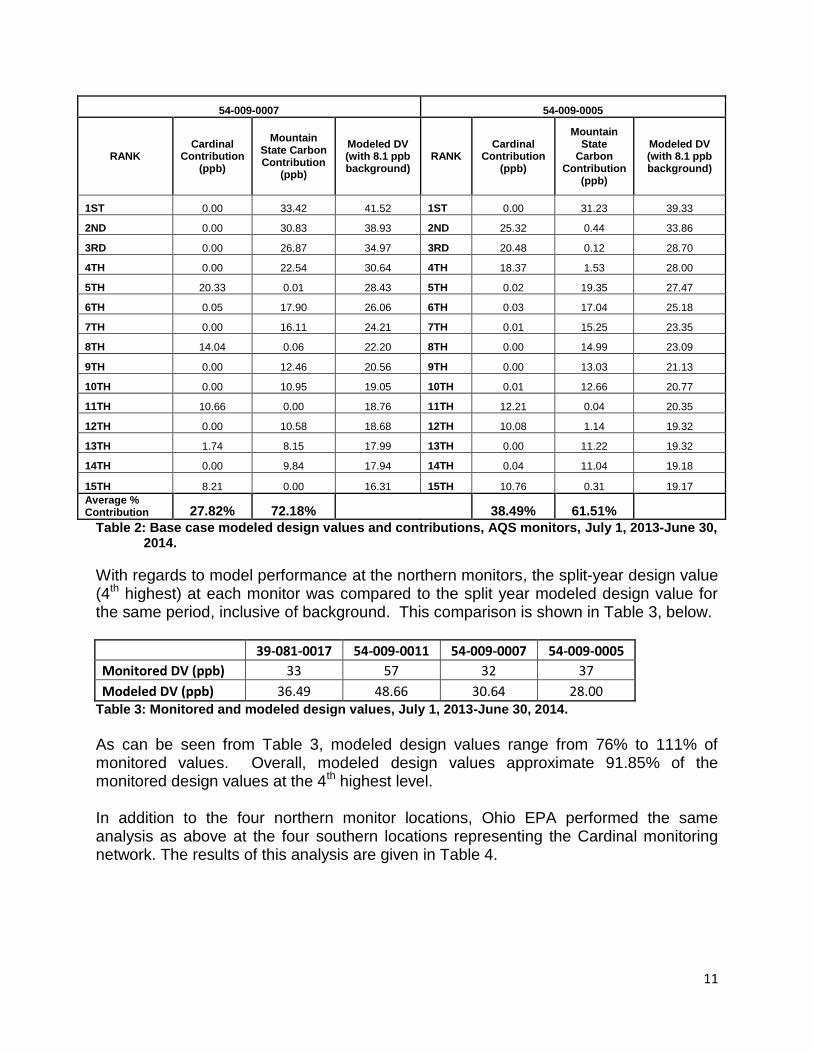
Table 2: Base case modeled design values and contributions, AQS monitors, July 1, 2013-June 30, 2014.
With regards to model performance at the northern monitors, the split-year design value (4th highest) at each monitor was compared to the split year modeled design value for the same period, inclusive of background. This comparison is shown in Table 3, below.
39-081-0017 54-009-0011 54-009-0007 54-009-0005
Monitored DV (ppb) 33 57 32 37
Modeled DV (ppb) 36.49 48.66 30.64 28.00 Table 3: Monitored and modeled design values, July 1, 2013-June 30, 2014.
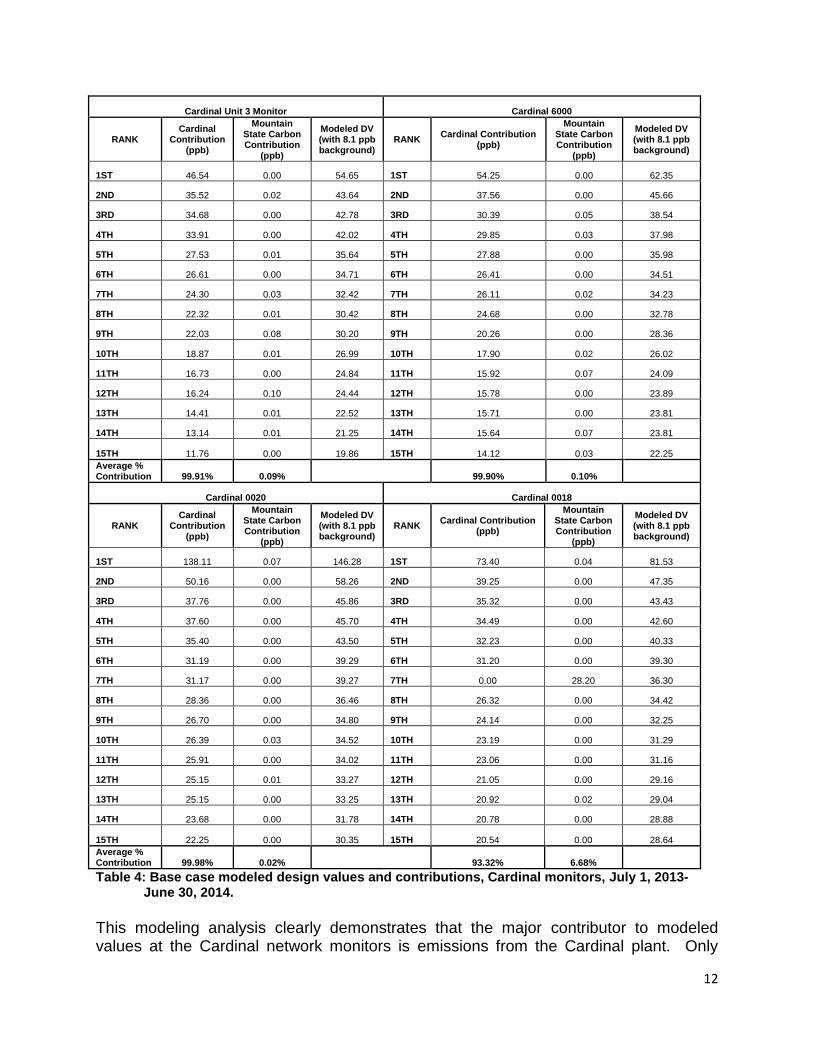
As can be seen from Table 3, modeled design values range from 76% to 111% of monitored values. Overall, modeled design values approximate 91.85% of the monitored design values at the 4th highest level. In addition to the four northern monitor locations, Ohio EPA performed the same analysis as above at the four southern locations representing the Cardinal monitoring network. The results of this analysis are given in Table 4.
12
Cardinal Unit 3 Monitor Cardinal 6000
RANK Cardinal
Contribution (ppb)
Mountain State Carbon Contribution
(ppb)
Modeled DV (with 8.1 ppb background)
RANK Cardinal Contribution
(ppb)
Mountain State Carbon Contribution
(ppb)
Modeled DV (with 8.1 ppb background)
1ST 46.54 0.00 54.65 1ST 54.25 0.00 62.35
2ND 35.52 0.02 43.64 2ND 37.56 0.00 45.66
3RD 34.68 0.00 42.78 3RD 30.39 0.05 38.54
4TH 33.91 0.00 42.02 4TH 29.85 0.03 37.98
5TH 27.53 0.01 35.64 5TH 27.88 0.00 35.98
6TH 26.61 0.00 34.71 6TH 26.41 0.00 34.51
7TH 24.30 0.03 32.42 7TH 26.11 0.02 34.23
8TH 22.32 0.01 30.42 8TH 24.68 0.00 32.78
9TH 22.03 0.08 30.20 9TH 20.26 0.00 28.36
10TH 18.87 0.01 26.99 10TH 17.90 0.02 26.02
11TH 16.73 0.00 24.84 11TH 15.92 0.07 24.09
12TH 16.24 0.10 24.44 12TH 15.78 0.00 23.89
13TH 14.41 0.01 22.52 13TH 15.71 0.00 23.81
14TH 13.14 0.01 21.25 14TH 15.64 0.07 23.81
15TH 11.76 0.00 19.86 15TH 14.12 0.03 22.25
Average % Contribution 99.91% 0.09%
99.90% 0.10%
Cardinal 0020 Cardinal 0018
RANK Cardinal
Contribution (ppb)
Mountain State Carbon Contribution
(ppb)
Modeled DV (with 8.1 ppb background)
RANK Cardinal Contribution
(ppb)
Mountain State Carbon Contribution
(ppb)
Modeled DV (with 8.1 ppb background)
1ST 138.11 0.07 146.28 1ST 73.40 0.04 81.53
2ND 50.16 0.00 58.26 2ND 39.25 0.00 47.35
3RD 37.76 0.00 45.86 3RD 35.32 0.00 43.43
4TH 37.60 0.00 45.70 4TH 34.49 0.00 42.60
5TH 35.40 0.00 43.50 5TH 32.23 0.00 40.33
6TH 31.19 0.00 39.29 6TH 31.20 0.00 39.30
7TH 31.17 0.00 39.27 7TH 0.00 28.20 36.30
8TH 28.36 0.00 36.46 8TH 26.32 0.00 34.42
9TH 26.70 0.00 34.80 9TH 24.14 0.00 32.25
10TH 26.39 0.03 34.52 10TH 23.19 0.00 31.29
11TH 25.91 0.00 34.02 11TH 23.06 0.00 31.16
12TH 25.15 0.01 33.27 12TH 21.05 0.00 29.16
13TH 25.15 0.00 33.25 13TH 20.92 0.02 29.04
14TH 23.68 0.00 31.78 14TH 20.78 0.00 28.88
15TH 22.25 0.00 30.35 15TH 20.54 0.00 28.64
Average % Contribution 99.98% 0.02% 93.32% 6.68%
Table 4: Base case modeled design values and contributions, Cardinal monitors, July 1, 2013-June 30, 2014.
This modeling analysis clearly demonstrates that the major contributor to modeled values at the Cardinal network monitors is emissions from the Cardinal plant. Only
13
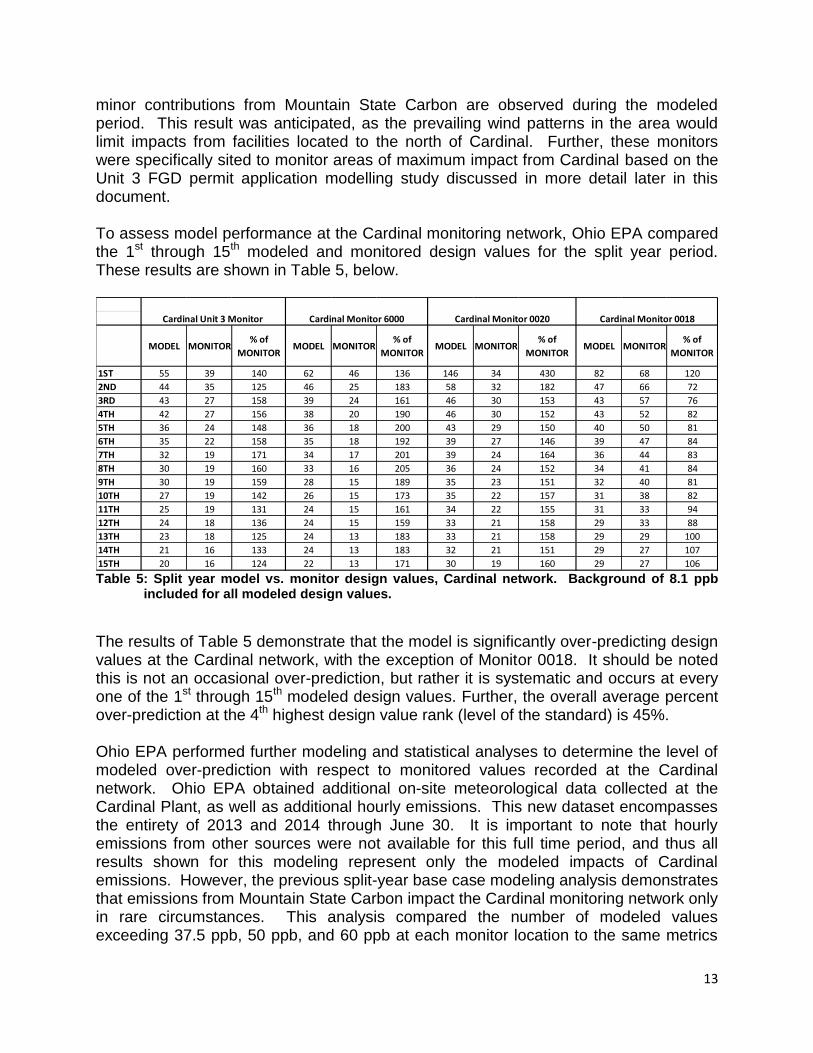
minor contributions from Mountain State Carbon are observed during the modeled period. This result was anticipated, as the prevailing wind patterns in the area would limit impacts from facilities located to the north of Cardinal. Further, these monitors were specifically sited to monitor areas of maximum impact from Cardinal based on the Unit 3 FGD permit application modelling study discussed in more detail later in this document. To assess model performance at the Cardinal monitoring network, Ohio EPA compared the 1st through 15th modeled and monitored design values for the split year period. These results are shown in Table 5, below.
Table 5: Split year model vs. monitor design values, Cardinal network. Background of 8.1 ppb
included for all modeled design values.
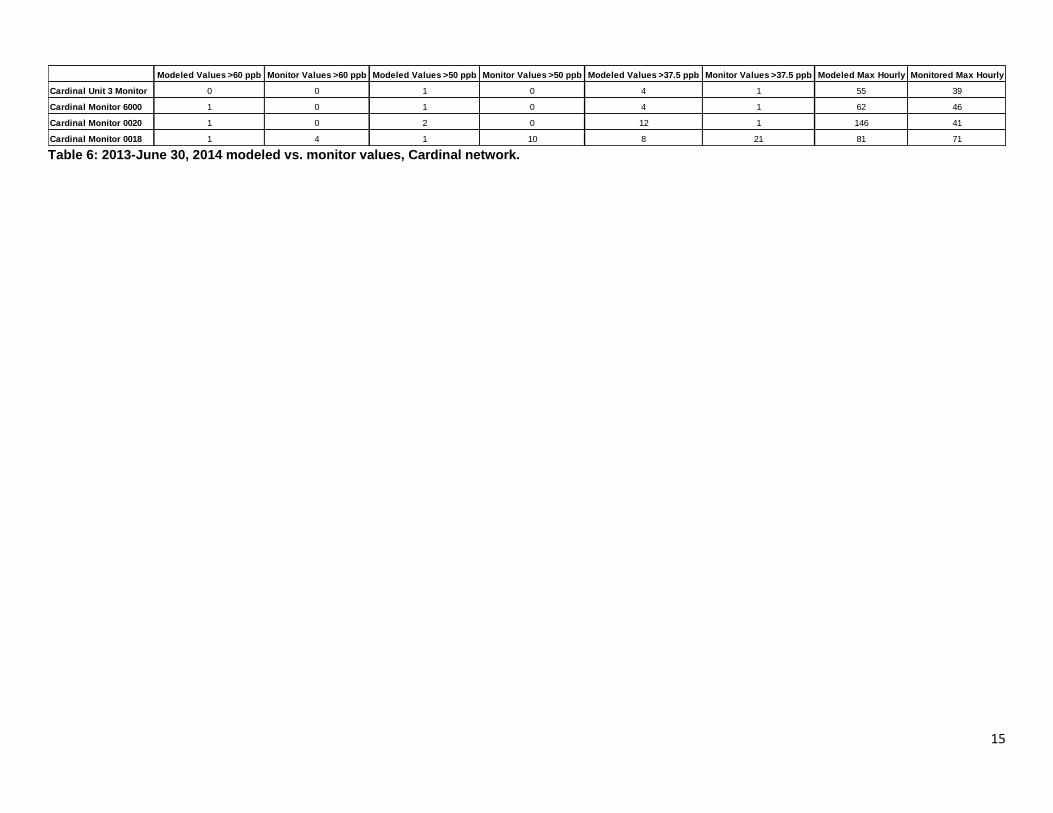
The results of Table 5 demonstrate that the model is significantly over-predicting design values at the Cardinal network, with the exception of Monitor 0018. It should be noted this is not an occasional over-prediction, but rather it is systematic and occurs at every one of the 1st through 15th modeled design values. Further, the overall average percent over-prediction at the 4th highest design value rank (level of the standard) is 45%. Ohio EPA performed further modeling and statistical analyses to determine the level of modeled over-prediction with respect to monitored values recorded at the Cardinal network. Ohio EPA obtained additional on-site meteorological data collected at the Cardinal Plant, as well as additional hourly emissions. This new dataset encompasses the entirety of 2013 and 2014 through June 30. It is important to note that hourly emissions from other sources were not available for this full time period, and thus all results shown for this modeling represent only the modeled impacts of Cardinal emissions. However, the previous split-year base case modeling analysis demonstrates that emissions from Mountain State Carbon impact the Cardinal monitoring network only in rare circumstances. This analysis compared the number of modeled values exceeding 37.5 ppb, 50 ppb, and 60 ppb at each monitor location to the same metrics
MODEL MONITOR% of
MONITORMODEL MONITOR
% of
MONITORMODEL MONITOR
% of
MONITORMODEL MONITOR
% of
MONITOR
1ST 55 39 140 62 46 136 146 34 430 82 68 120
2ND 44 35 125 46 25 183 58 32 182 47 66 72
3RD 43 27 158 39 24 161 46 30 153 43 57 76
4TH 42 27 156 38 20 190 46 30 152 43 52 82
5TH 36 24 148 36 18 200 43 29 150 40 50 81
6TH 35 22 158 35 18 192 39 27 146 39 47 84
7TH 32 19 171 34 17 201 39 24 164 36 44 83
8TH 30 19 160 33 16 205 36 24 152 34 41 84
9TH 30 19 159 28 15 189 35 23 151 32 40 81
10TH 27 19 142 26 15 173 35 22 157 31 38 82
11TH 25 19 131 24 15 161 34 22 155 31 33 94
12TH 24 18 136 24 15 159 33 21 158 29 33 88
13TH 23 18 125 24 13 183 33 21 158 29 29 100
14TH 21 16 133 24 13 183 32 21 151 29 27 107
15TH 20 16 124 22 13 171 30 19 160 29 27 106
Cardinal Unit 3 Monitor Cardinal Monitor 6000 Cardinal Monitor 0020 Cardinal Monitor 0018

14
recorded at each monitor in the Cardinal network. Additionally, Ohio EPA assessed the maximum 1-hour value modeled at each monitor location in comparison to the maximum 1-hour value recorded at each monitor in the Cardinal network. As stated previously, this comparison was done over the 2013-June 30, 2014 time period. The results of this analysis are shown in Table 6.
15
Table 6: 2013-June 30, 2014 modeled vs. monitor values, Cardinal network.
Modeled Values >60 ppb Monitor Values >60 ppb Modeled Values >50 ppb Monitor Values >50 ppb Modeled Values >37.5 ppb Monitor Values >37.5 ppb Modeled Max Hourly Monitored Max Hourly
Cardinal Unit 3 Monitor 0 0 1 0 4 1 55 39
Cardinal Monitor 6000 1 0 1 0 4 1 62 46
Cardinal Monitor 0020 1 0 2 0 12 1 146 41
Cardinal Monitor 0018 1 4 1 10 8 21 81 71
16
The results in Table 6 show that, with the exception of Cardinal Monitor 0018, the model is over-predicting in both the number of hours at the relevant concentration bins, and in terms of maximum hourly value relative to monitor data. The results of this analysis with respect to Cardinal Monitor 0018 are mixed, making it difficult to draw hard conclusions with respect to model vs. monitor values. Results of the base case clearly indicate that the model is under-predicting at this monitor with respect to design values, and in terms of number of hours at each concentration bin for the extended time period analysis shown in Table 6. However, it is concerning that the maximum hourly value is over-predicted at this monitor in the extended analysis. Ohio EPA did explore other alternative modeling protocols, and overall this protocol and the AERMOD platform provided the best balance of performance, computation time, and ease of incorporating multiple on-site meteorological datasets, given the unique meteorological circumstances of this area and the importance of obtaining good model performance in the northern portion of this area. It is the northern portion of the nonattainment area designated by U.S. EPA that contains monitors that led to the designations. It was U.S. EPA’s belief during the designation process that the lower portion of this area, the portion containing Cardinal, should be included because “The wind is more likely from the south than the north, so the much larger Cardinal Power Plant to the south of the monitors is more likely to affect air quality at the violating monitors1.” In fact, this was the only reason U.S. EPA cited for inclusion of Cardinal in this area in the nonattainment designation process. Ohio EPA notes that the wind data used by U.S. EPA in their designation analysis was obtained from the Nation Weather Service station in Pittsburgh. Ohio EPA does not believe that this dataset adequately captures the unique meteorological conditions in the Ohio River valley. As noted above, monitoring at the Cardinal location did not begin until 2011 and was not considered when making designations for this area. As discussed below, there are now four years of monitoring data available around the Cardinal facility, from locations expected to show maximum impact, that clearly show this portion of the nonattainment area is in fact attaining the standard. Further, this base case modeling analysis shows that, as suspected, emissions from Cardinal do travel north towards the violating monitors; however, and most importantly, Cardinal is not meaningfully impacting those monitors compared to Mountain State Carbon. In fact, Cardinal only contributed on average 13% of the 1st through 15th highest modeled design values at monitor 54-009-0011 which is the design value monitor that has always recorded the highest monitoring values and is the only monitor currently showing nonattainment at 76 ppb (2012 to 2014). In fact, the other monitors in the northern area have current design values ranging from 45 to 53 ppb. As discussed in the protocol discussion of Ohio’s SIP submittal, Appendix W considers the use of measured data in lieu of model estimates. It is acknowledged in Appendix W that there are some conditions where measured data may lend credence to modeling
1 See U.S. EPA’s “Technical Support Document Ohio Area Designations for the 2010 SO2 Primary
National Ambient Air Quality Standard.”
17
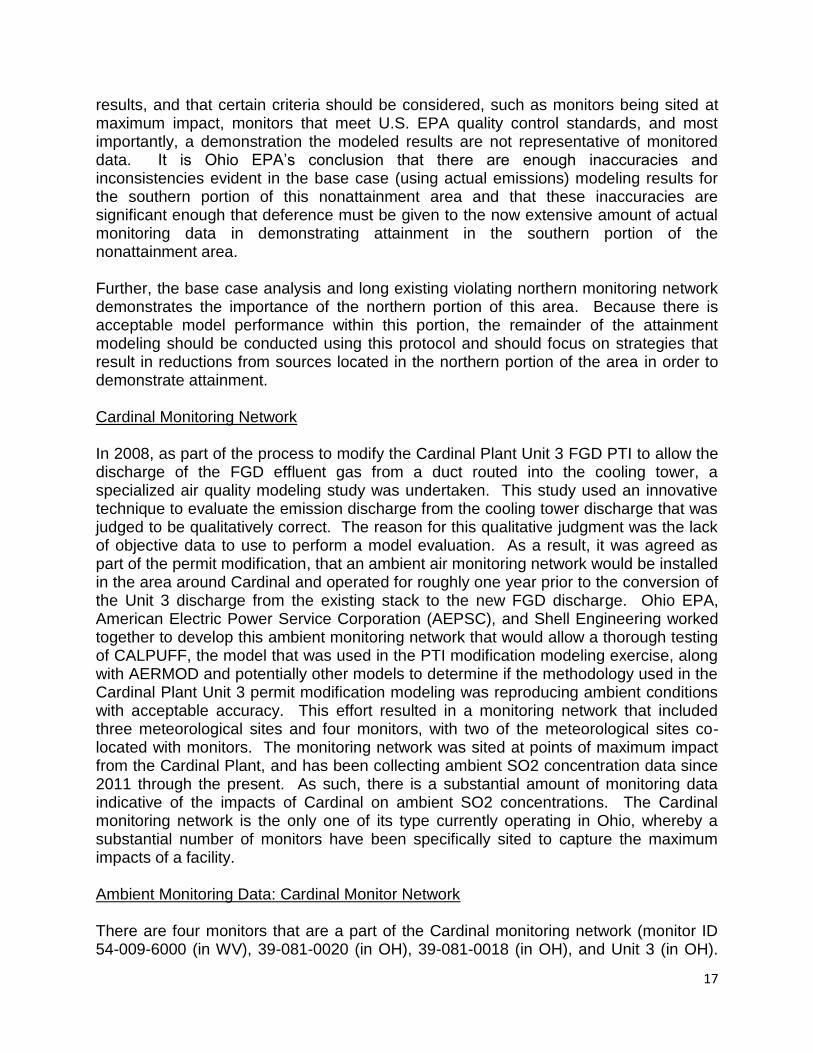
results, and that certain criteria should be considered, such as monitors being sited at maximum impact, monitors that meet U.S. EPA quality control standards, and most importantly, a demonstration the modeled results are not representative of monitored data. It is Ohio EPA’s conclusion that there are enough inaccuracies and inconsistencies evident in the base case (using actual emissions) modeling results for the southern portion of this nonattainment area and that these inaccuracies are significant enough that deference must be given to the now extensive amount of actual monitoring data in demonstrating attainment in the southern portion of the nonattainment area. Further, the base case analysis and long existing violating northern monitoring network demonstrates the importance of the northern portion of this area. Because there is acceptable model performance within this portion, the remainder of the attainment modeling should be conducted using this protocol and should focus on strategies that result in reductions from sources located in the northern portion of the area in order to demonstrate attainment. Cardinal Monitoring Network In 2008, as part of the process to modify the Cardinal Plant Unit 3 FGD PTI to allow the discharge of the FGD effluent gas from a duct routed into the cooling tower, a specialized air quality modeling study was undertaken. This study used an innovative technique to evaluate the emission discharge from the cooling tower discharge that was judged to be qualitatively correct. The reason for this qualitative judgment was the lack of objective data to use to perform a model evaluation. As a result, it was agreed as part of the permit modification, that an ambient air monitoring network would be installed in the area around Cardinal and operated for roughly one year prior to the conversion of the Unit 3 discharge from the existing stack to the new FGD discharge. Ohio EPA, American Electric Power Service Corporation (AEPSC), and Shell Engineering worked together to develop this ambient monitoring network that would allow a thorough testing of CALPUFF, the model that was used in the PTI modification modeling exercise, along with AERMOD and potentially other models to determine if the methodology used in the Cardinal Plant Unit 3 permit modification modeling was reproducing ambient conditions with acceptable accuracy. This effort resulted in a monitoring network that included three meteorological sites and four monitors, with two of the meteorological sites co-located with monitors. The monitoring network was sited at points of maximum impact from the Cardinal Plant, and has been collecting ambient SO2 concentration data since 2011 through the present. As such, there is a substantial amount of monitoring data indicative of the impacts of Cardinal on ambient SO2 concentrations. The Cardinal monitoring network is the only one of its type currently operating in Ohio, whereby a substantial number of monitors have been specifically sited to capture the maximum impacts of a facility. Ambient Monitoring Data: Cardinal Monitor Network There are four monitors that are a part of the Cardinal monitoring network (monitor ID 54-009-6000 (in WV), 39-081-0020 (in OH), 39-081-0018 (in OH), and Unit 3 (in OH).
18
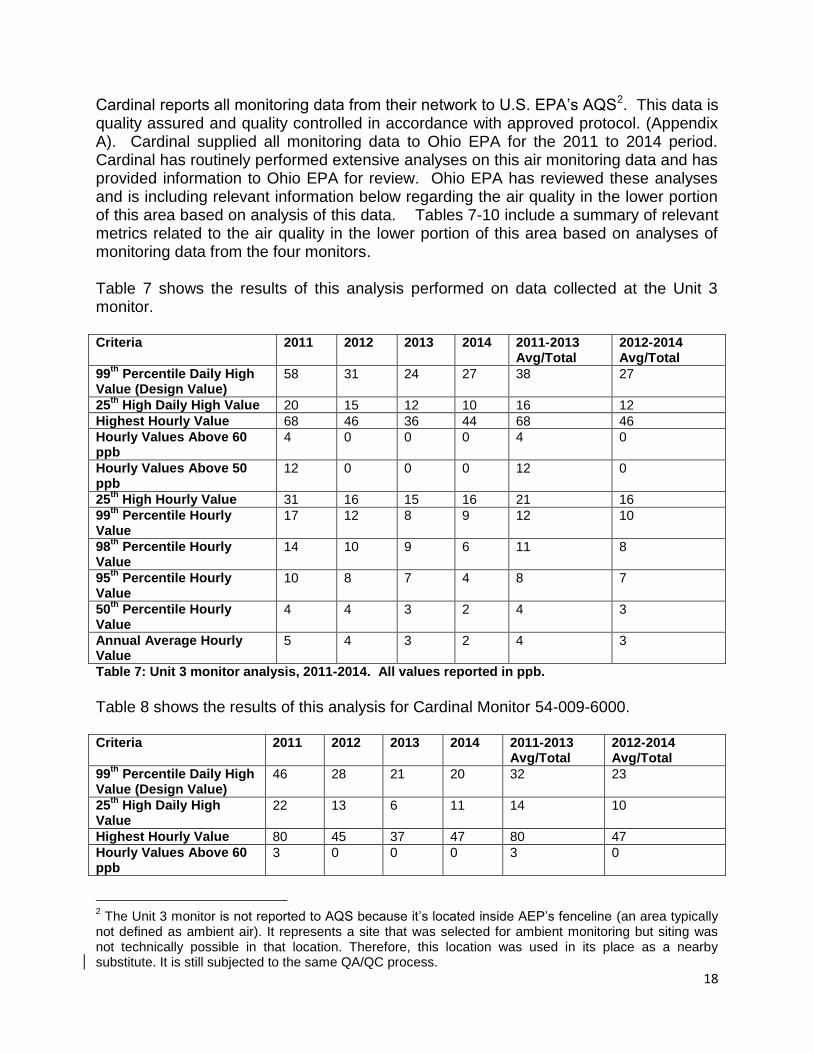
Cardinal reports all monitoring data from their network to U.S. EPA’s AQS2. This data is quality assured and quality controlled in accordance with approved protocol. (Appendix A). Cardinal supplied all monitoring data to Ohio EPA for the 2011 to 2014 period. Cardinal has routinely performed extensive analyses on this air monitoring data and has provided information to Ohio EPA for review. Ohio EPA has reviewed these analyses and is including relevant information below regarding the air quality in the lower portion of this area based on analysis of this data. Tables 7-10 include a summary of relevant metrics related to the air quality in the lower portion of this area based on analyses of monitoring data from the four monitors. Table 7 shows the results of this analysis performed on data collected at the Unit 3 monitor. Criteria 2011 2012 2013 2014 2011-2013
Avg/Total 2012-2014 Avg/Total
99th
Percentile Daily High Value (Design Value)
58 31 24 27 38 27
25th
High Daily High Value 20 15 12 10 16 12
Highest Hourly Value 68 46 36 44 68 46
Hourly Values Above 60 ppb
4 0 0 0 4 0
Hourly Values Above 50 ppb
12 0 0 0 12 0
25th
High Hourly Value 31 16 15 16 21 16
99th
Percentile Hourly Value
17 12 8 9 12 10
98th
Percentile Hourly Value
14 10 9 6 11 8
95th
Percentile Hourly Value
10 8 7 4 8 7
50th
Percentile Hourly Value
4 4 3 2 4 3
Annual Average Hourly Value
5 4 3 2 4 3
Table 7: Unit 3 monitor analysis, 2011-2014. All values reported in ppb.
Table 8 shows the results of this analysis for Cardinal Monitor 54-009-6000. Criteria 2011 2012 2013 2014 2011-2013
Avg/Total 2012-2014 Avg/Total
99th
Percentile Daily High Value (Design Value)
46 28 21 20 32 23
25th
High Daily High Value
22 13 6 11 14 10
Highest Hourly Value 80 45 37 47 80 47
Hourly Values Above 60 ppb
3 0 0 0 3 0
2 The Unit 3 monitor is not reported to AQS because it’s located inside AEP’s fenceline (an area typically
not defined as ambient air). It represents a site that was selected for ambient monitoring but siting was not technically possible in that location. Therefore, this location was used in its place as a nearby substitute. It is still subjected to the same QA/QC process.
19
Hourly Values Above 50 ppb
5 0 0 0 5 0
25th
High Hourly Value 26 15 9 13 17 13
99th
Percentile Hourly Value
16 10 5 9 10 8
98th
Percentile Hourly Value
13 7 4 8 8 6
95th
Percentile Hourly Value
9 5 3 6 6 5
50th
Percentile Hourly Value
3 2 2 1 2 2
Annual Average Hourly Value
4 2 2 2 3 2
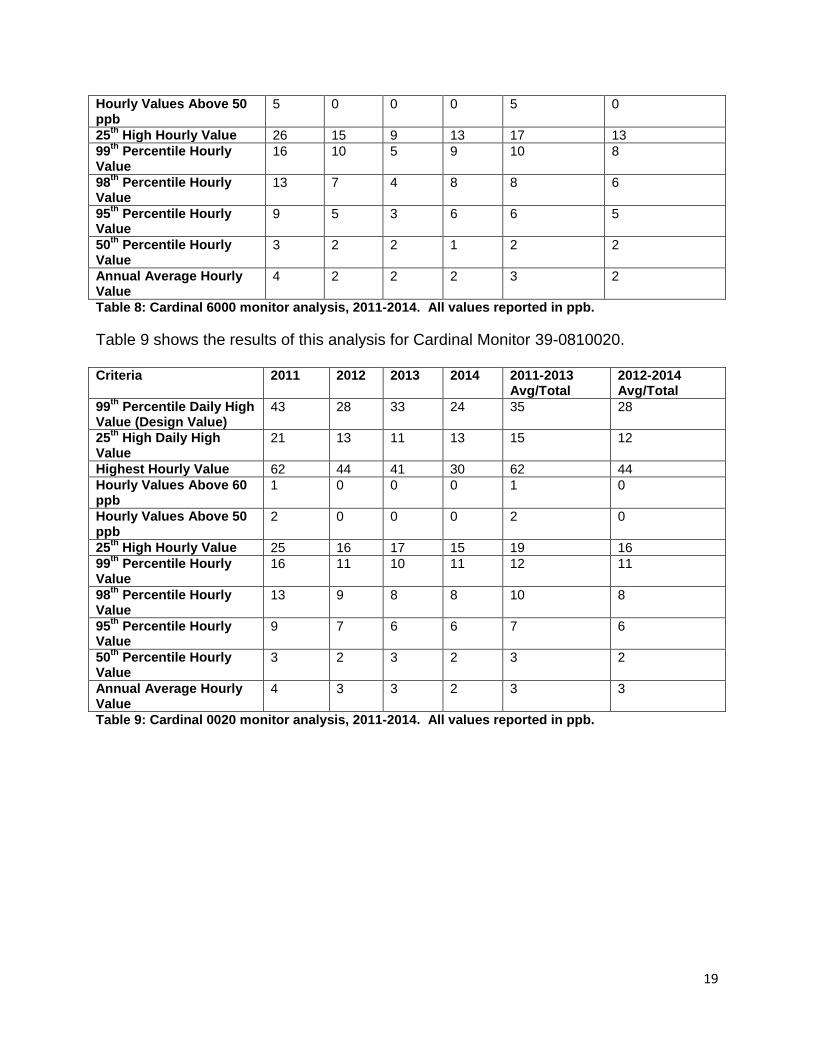
Table 8: Cardinal 6000 monitor analysis, 2011-2014. All values reported in ppb.
Table 9 shows the results of this analysis for Cardinal Monitor 39-0810020. Criteria 2011 2012 2013 2014 2011-2013
Avg/Total 2012-2014 Avg/Total
99th
Percentile Daily High Value (Design Value)
43 28 33 24 35 28
25th
High Daily High Value
21 13 11 13 15 12
Highest Hourly Value 62 44 41 30 62 44
Hourly Values Above 60 ppb
1 0 0 0 1 0
Hourly Values Above 50 ppb
2 0 0 0 2 0
25th
High Hourly Value 25 16 17 15 19 16
99th
Percentile Hourly Value
16 11 10 11 12 11
98th
Percentile Hourly Value
13 9 8 8 10 8
95th
Percentile Hourly Value
9 7 6 6 7 6
50th
Percentile Hourly Value
3 2 3 2 3 2
Annual Average Hourly Value
4 3 3 2 3 3
Table 9: Cardinal 0020 monitor analysis, 2011-2014. All values reported in ppb.
20
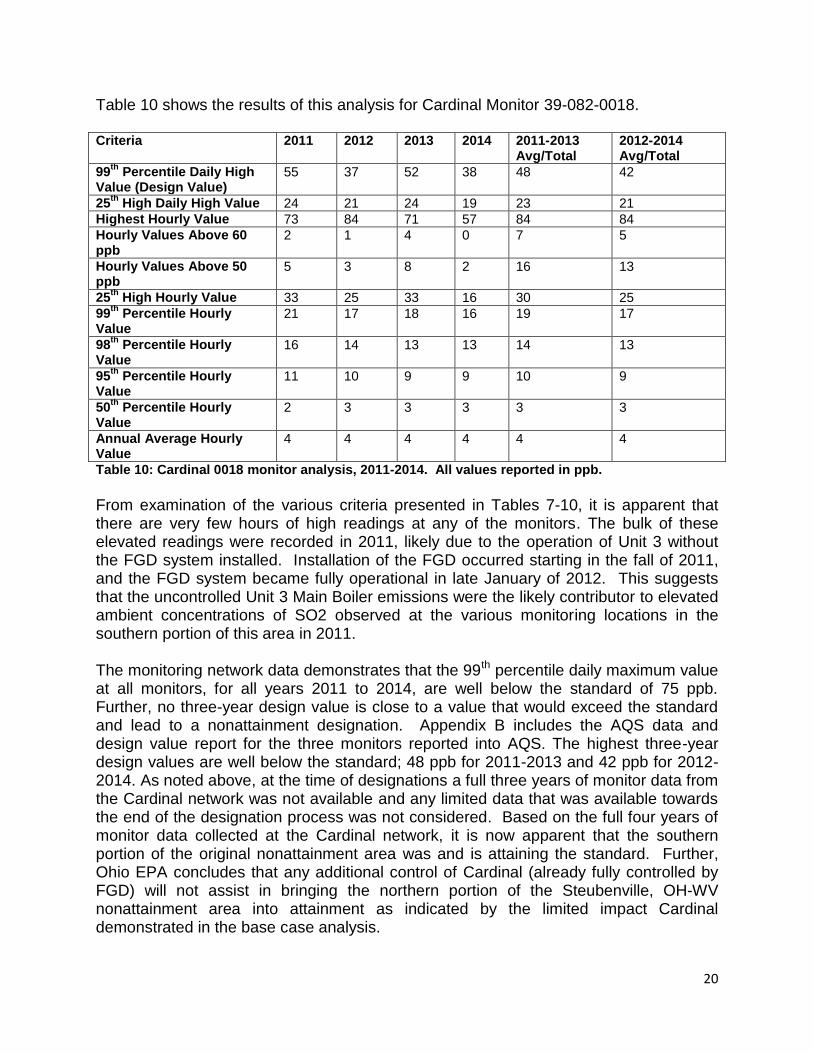
Table 10 shows the results of this analysis for Cardinal Monitor 39-082-0018. Criteria 2011 2012 2013 2014 2011-2013
Avg/Total 2012-2014 Avg/Total
99th
Percentile Daily High Value (Design Value)
55 37 52 38 48 42
25th
High Daily High Value 24 21 24 19 23 21
Highest Hourly Value 73 84 71 57 84 84
Hourly Values Above 60 ppb
2 1 4 0 7 5
Hourly Values Above 50 ppb
5 3 8 2 16 13
25th
High Hourly Value 33 25 33 16 30 25
99th
Percentile Hourly Value
21 17 18 16 19 17
98th
Percentile Hourly Value
16 14 13 13 14 13
95th
Percentile Hourly Value
11 10 9 9 10 9
50th
Percentile Hourly Value
2 3 3 3 3 3
Annual Average Hourly Value
4 4 4 4 4 4
Table 10: Cardinal 0018 monitor analysis, 2011-2014. All values reported in ppb.
From examination of the various criteria presented in Tables 7-10, it is apparent that there are very few hours of high readings at any of the monitors. The bulk of these elevated readings were recorded in 2011, likely due to the operation of Unit 3 without the FGD system installed. Installation of the FGD occurred starting in the fall of 2011, and the FGD system became fully operational in late January of 2012. This suggests that the uncontrolled Unit 3 Main Boiler emissions were the likely contributor to elevated ambient concentrations of SO2 observed at the various monitoring locations in the southern portion of this area in 2011. The monitoring network data demonstrates that the 99th percentile daily maximum value at all monitors, for all years 2011 to 2014, are well below the standard of 75 ppb. Further, no three-year design value is close to a value that would exceed the standard and lead to a nonattainment designation. Appendix B includes the AQS data and design value report for the three monitors reported into AQS. The highest three-year design values are well below the standard; 48 ppb for 2011-2013 and 42 ppb for 2012-2014. As noted above, at the time of designations a full three years of monitor data from the Cardinal network was not available and any limited data that was available towards the end of the designation process was not considered. Based on the full four years of monitor data collected at the Cardinal network, it is now apparent that the southern portion of the original nonattainment area was and is attaining the standard. Further, Ohio EPA concludes that any additional control of Cardinal (already fully controlled by FGD) will not assist in bringing the northern portion of the Steubenville, OH-WV nonattainment area into attainment as indicated by the limited impact Cardinal demonstrated in the base case analysis.
21
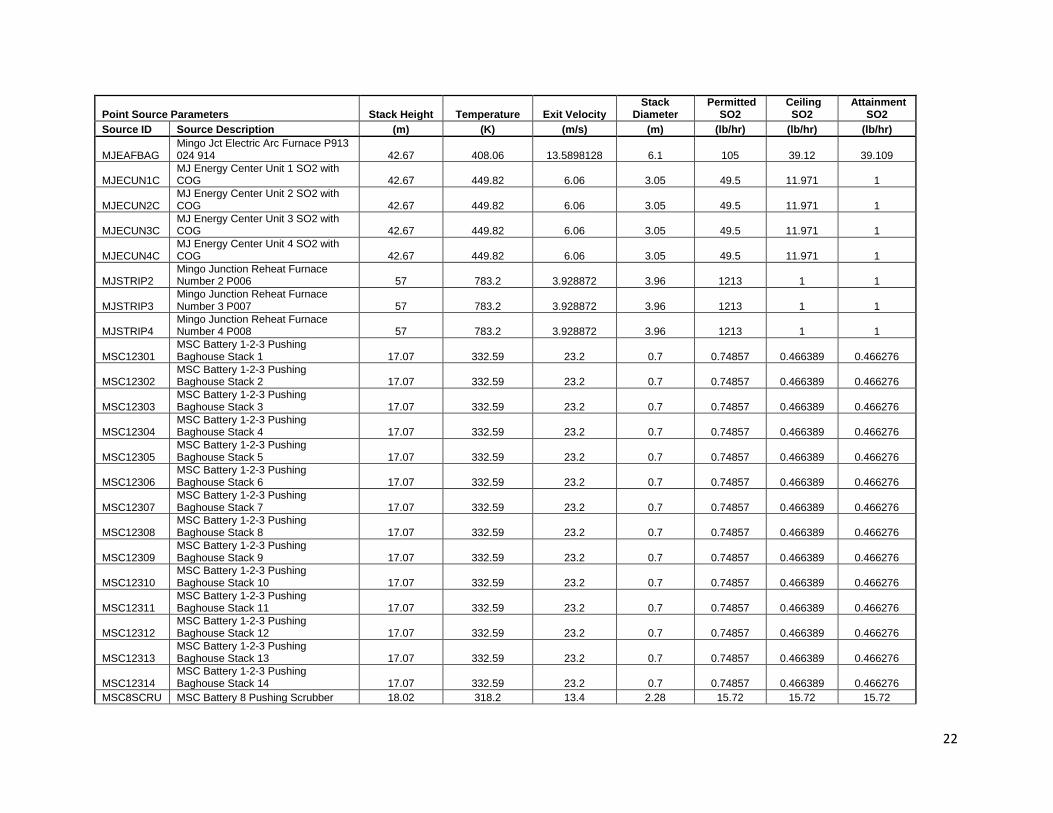
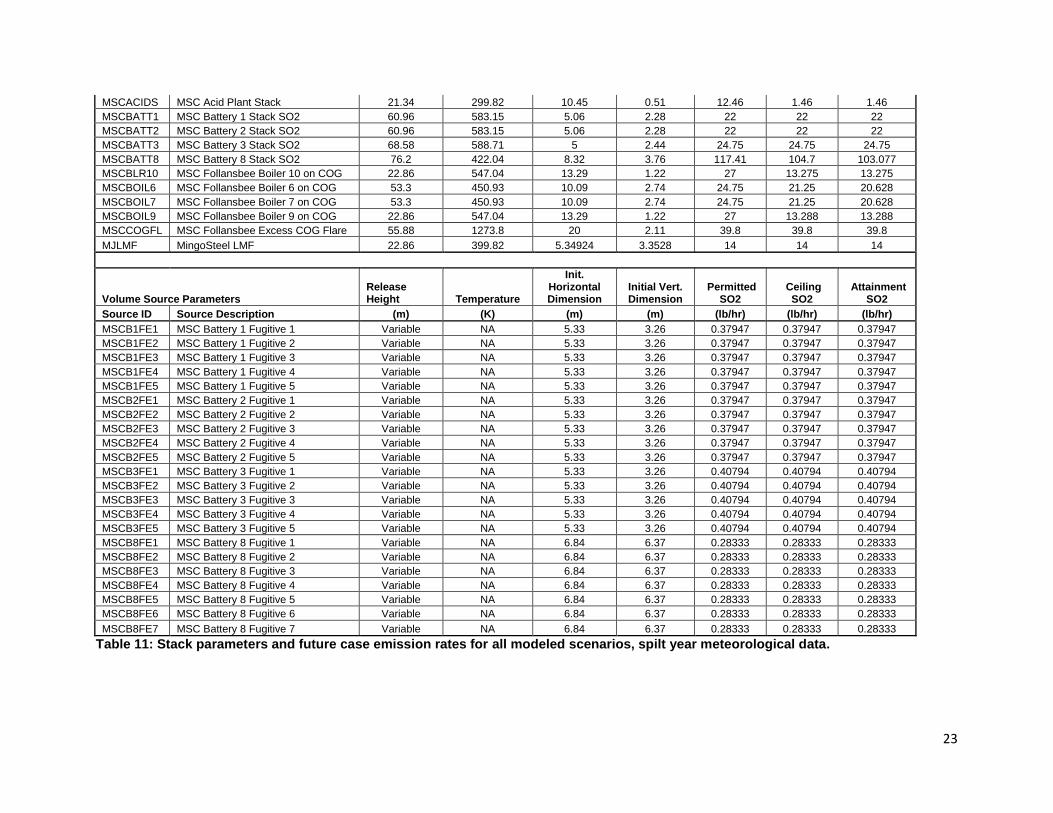
The base case modeling, however, indicates that emissions from Cardinal have a minor contribution to monitor values located in the northern portion of the nonattainment area. As such, Ohio EPA will, as part of this attainment demonstration, account for emissions from the Cardinal Plant in the final attainment demonstration. Future Case Analysis As stated previously, the future case analysis consists of multiple separate modeling scenarios. The first assessed the impact of each facility in the northern portion of the nonattainment area when modeled individually for the split-year period at permitted emission rates. The results of this analysis informed the second analysis, which established a “ceiling rate” for each northern facility that is sufficient to eliminate any facility specific exceedances in the modeling domain. The second analysis modeled each northern facility interactively to determine the combined impact of the emission units when modeled at their previously established ceiling rates. The final modeling analyses for the future case represents the final attainment strategy for all facilities, and demonstrates modeled attainment of the standard at all receptors in the northern portion of the modeling domain. In addition, Ohio EPA assessed the impact of emissions from Cardinal when operating at a theoretical, conservatively assumed and unrealistically high utilization rate, as described below and in the protocol discussion of Ohio’s SIP submittal. Emission Sources All future case modeling scenarios utilized fixed emission rates at all relevant sources included in the modeling domain. However, Ohio EPA utilized the HOUREMIS pathway to account for the buoyant volume release points representing fugitive emissions from Batteries 1, 2, 3, and 8 at Mountain State Carbon. Table 11 shows the relevant release point parameters and the emission rates modeled for each step of the attainment demonstration. The results of these steps are discussed in the “Results” section below. Ohio EPA is excluding the locations and base elevations for sources shown in Table 11, due to the large number of sources explicitly modeled in the future case scenarios. These data can be found in the protocol discussion of Ohio’s SIP submittal, as well as those relevant modeling files submitted as part of the SO2 SIP attainment demonstration. It should be noted that Batteries 1, 2, and 3 fugitive emissions were represented as five separate volume sources, and Battery 8 fugitive emissions as seven separate volume sources in the AERMOD modeling, as represented in Table 11.
22
Point Source Parameters Stack Height Temperature Exit Velocity Stack
Diameter Permitted
SO2 Ceiling
SO2 Attainment
SO2
Source ID Source Description (m) (K) (m/s) (m) (lb/hr) (lb/hr) (lb/hr)
MJEAFBAG Mingo Jct Electric Arc Furnace P913 024 914 42.67 408.06 13.5898128 6.1 105 39.12 39.109
MJECUN1C MJ Energy Center Unit 1 SO2 with COG 42.67 449.82 6.06 3.05 49.5 11.971 1
MJECUN2C MJ Energy Center Unit 2 SO2 with COG 42.67 449.82 6.06 3.05 49.5 11.971 1
MJECUN3C MJ Energy Center Unit 3 SO2 with COG 42.67 449.82 6.06 3.05 49.5 11.971 1
MJECUN4C MJ Energy Center Unit 4 SO2 with COG 42.67 449.82 6.06 3.05 49.5 11.971 1
MJSTRIP2 Mingo Junction Reheat Furnace Number 2 P006 57 783.2 3.928872 3.96 1213 1 1
MJSTRIP3 Mingo Junction Reheat Furnace Number 3 P007 57 783.2 3.928872 3.96 1213 1 1
MJSTRIP4 Mingo Junction Reheat Furnace Number 4 P008 57 783.2 3.928872 3.96 1213 1 1
MSC12301 MSC Battery 1-2-3 Pushing Baghouse Stack 1 17.07 332.59 23.2 0.7 0.74857 0.466389 0.466276
MSC12302 MSC Battery 1-2-3 Pushing Baghouse Stack 2 17.07 332.59 23.2 0.7 0.74857 0.466389 0.466276
MSC12303 MSC Battery 1-2-3 Pushing Baghouse Stack 3 17.07 332.59 23.2 0.7 0.74857 0.466389 0.466276
MSC12304 MSC Battery 1-2-3 Pushing Baghouse Stack 4 17.07 332.59 23.2 0.7 0.74857 0.466389 0.466276
MSC12305 MSC Battery 1-2-3 Pushing Baghouse Stack 5 17.07 332.59 23.2 0.7 0.74857 0.466389 0.466276
MSC12306 MSC Battery 1-2-3 Pushing Baghouse Stack 6 17.07 332.59 23.2 0.7 0.74857 0.466389 0.466276
MSC12307 MSC Battery 1-2-3 Pushing Baghouse Stack 7 17.07 332.59 23.2 0.7 0.74857 0.466389 0.466276
MSC12308 MSC Battery 1-2-3 Pushing Baghouse Stack 8 17.07 332.59 23.2 0.7 0.74857 0.466389 0.466276
MSC12309 MSC Battery 1-2-3 Pushing Baghouse Stack 9 17.07 332.59 23.2 0.7 0.74857 0.466389 0.466276
MSC12310 MSC Battery 1-2-3 Pushing Baghouse Stack 10 17.07 332.59 23.2 0.7 0.74857 0.466389 0.466276
MSC12311 MSC Battery 1-2-3 Pushing Baghouse Stack 11 17.07 332.59 23.2 0.7 0.74857 0.466389 0.466276
MSC12312 MSC Battery 1-2-3 Pushing Baghouse Stack 12 17.07 332.59 23.2 0.7 0.74857 0.466389 0.466276
MSC12313 MSC Battery 1-2-3 Pushing Baghouse Stack 13 17.07 332.59 23.2 0.7 0.74857 0.466389 0.466276
MSC12314 MSC Battery 1-2-3 Pushing Baghouse Stack 14 17.07 332.59 23.2 0.7 0.74857 0.466389 0.466276
MSC8SCRU MSC Battery 8 Pushing Scrubber 18.02 318.2 13.4 2.28 15.72 15.72 15.72
23
MSCACIDS MSC Acid Plant Stack 21.34 299.82 10.45 0.51 12.46 1.46 1.46
MSCBATT1 MSC Battery 1 Stack SO2 60.96 583.15 5.06 2.28 22 22 22
MSCBATT2 MSC Battery 2 Stack SO2 60.96 583.15 5.06 2.28 22 22 22
MSCBATT3 MSC Battery 3 Stack SO2 68.58 588.71 5 2.44 24.75 24.75 24.75
MSCBATT8 MSC Battery 8 Stack SO2 76.2 422.04 8.32 3.76 117.41 104.7 103.077
MSCBLR10 MSC Follansbee Boiler 10 on COG 22.86 547.04 13.29 1.22 27 13.275 13.275
MSCBOIL6 MSC Follansbee Boiler 6 on COG 53.3 450.93 10.09 2.74 24.75 21.25 20.628
MSCBOIL7 MSC Follansbee Boiler 7 on COG 53.3 450.93 10.09 2.74 24.75 21.25 20.628
MSCBOIL9 MSC Follansbee Boiler 9 on COG 22.86 547.04 13.29 1.22 27 13.288 13.288
MSCCOGFL MSC Follansbee Excess COG Flare 55.88 1273.8 20 2.11 39.8 39.8 39.8
MJLMF MingoSteel LMF 22.86 399.82 5.34924 3.3528 14 14 14
Volume Source Parameters Release Height Temperature
Init. Horizontal Dimension
Initial Vert. Dimension
Permitted SO2
Ceiling SO2
Attainment SO2
Source ID Source Description (m) (K) (m) (m) (lb/hr) (lb/hr) (lb/hr)
MSCB1FE1 MSC Battery 1 Fugitive 1 Variable NA 5.33 3.26 0.37947 0.37947 0.37947
MSCB1FE2 MSC Battery 1 Fugitive 2 Variable NA 5.33 3.26 0.37947 0.37947 0.37947
MSCB1FE3 MSC Battery 1 Fugitive 3 Variable NA 5.33 3.26 0.37947 0.37947 0.37947
MSCB1FE4 MSC Battery 1 Fugitive 4 Variable NA 5.33 3.26 0.37947 0.37947 0.37947
MSCB1FE5 MSC Battery 1 Fugitive 5 Variable NA 5.33 3.26 0.37947 0.37947 0.37947
MSCB2FE1 MSC Battery 2 Fugitive 1 Variable NA 5.33 3.26 0.37947 0.37947 0.37947
MSCB2FE2 MSC Battery 2 Fugitive 2 Variable NA 5.33 3.26 0.37947 0.37947 0.37947
MSCB2FE3 MSC Battery 2 Fugitive 3 Variable NA 5.33 3.26 0.37947 0.37947 0.37947
MSCB2FE4 MSC Battery 2 Fugitive 4 Variable NA 5.33 3.26 0.37947 0.37947 0.37947
MSCB2FE5 MSC Battery 2 Fugitive 5 Variable NA 5.33 3.26 0.37947 0.37947 0.37947
MSCB3FE1 MSC Battery 3 Fugitive 1 Variable NA 5.33 3.26 0.40794 0.40794 0.40794
MSCB3FE2 MSC Battery 3 Fugitive 2 Variable NA 5.33 3.26 0.40794 0.40794 0.40794
MSCB3FE3 MSC Battery 3 Fugitive 3 Variable NA 5.33 3.26 0.40794 0.40794 0.40794
MSCB3FE4 MSC Battery 3 Fugitive 4 Variable NA 5.33 3.26 0.40794 0.40794 0.40794
MSCB3FE5 MSC Battery 3 Fugitive 5 Variable NA 5.33 3.26 0.40794 0.40794 0.40794
MSCB8FE1 MSC Battery 8 Fugitive 1 Variable NA 6.84 6.37 0.28333 0.28333 0.28333
MSCB8FE2 MSC Battery 8 Fugitive 2 Variable NA 6.84 6.37 0.28333 0.28333 0.28333
MSCB8FE3 MSC Battery 8 Fugitive 3 Variable NA 6.84 6.37 0.28333 0.28333 0.28333
MSCB8FE4 MSC Battery 8 Fugitive 4 Variable NA 6.84 6.37 0.28333 0.28333 0.28333
MSCB8FE5 MSC Battery 8 Fugitive 5 Variable NA 6.84 6.37 0.28333 0.28333 0.28333
MSCB8FE6 MSC Battery 8 Fugitive 6 Variable NA 6.84 6.37 0.28333 0.28333 0.28333
MSCB8FE7 MSC Battery 8 Fugitive 7 Variable NA 6.84 6.37 0.28333 0.28333 0.28333
Table 11: Stack parameters and future case emission rates for all modeled scenarios, spilt year meteorological data.
24
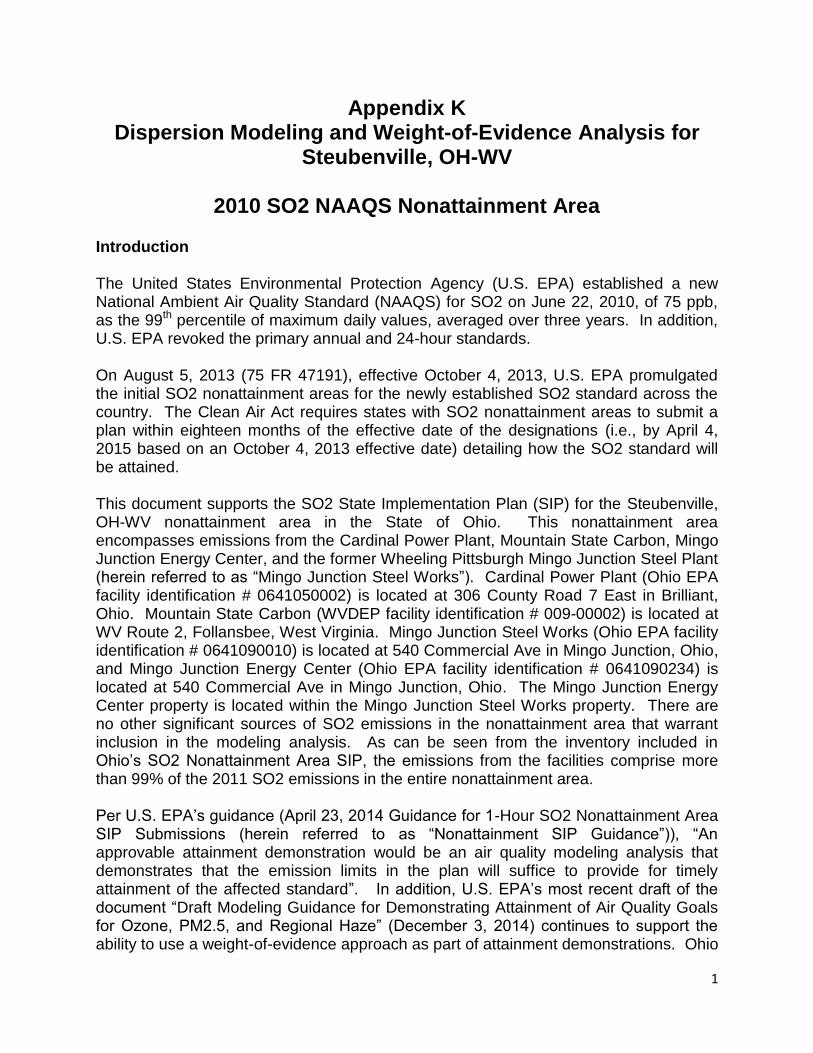
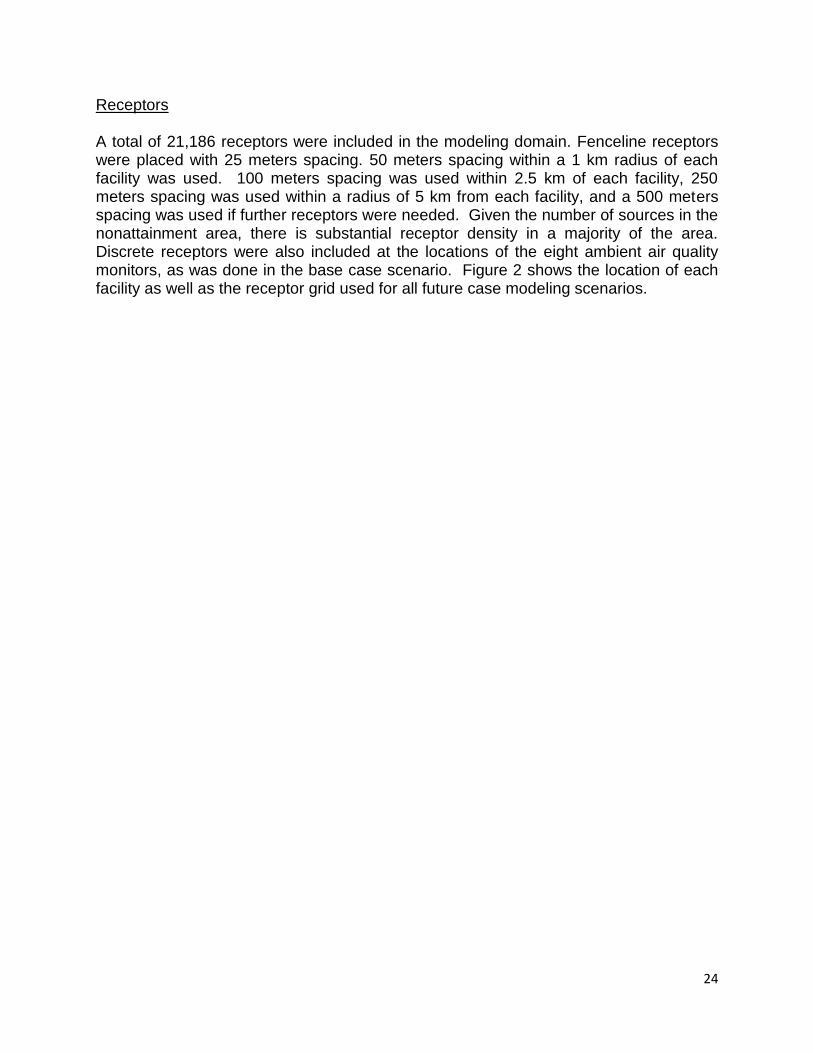
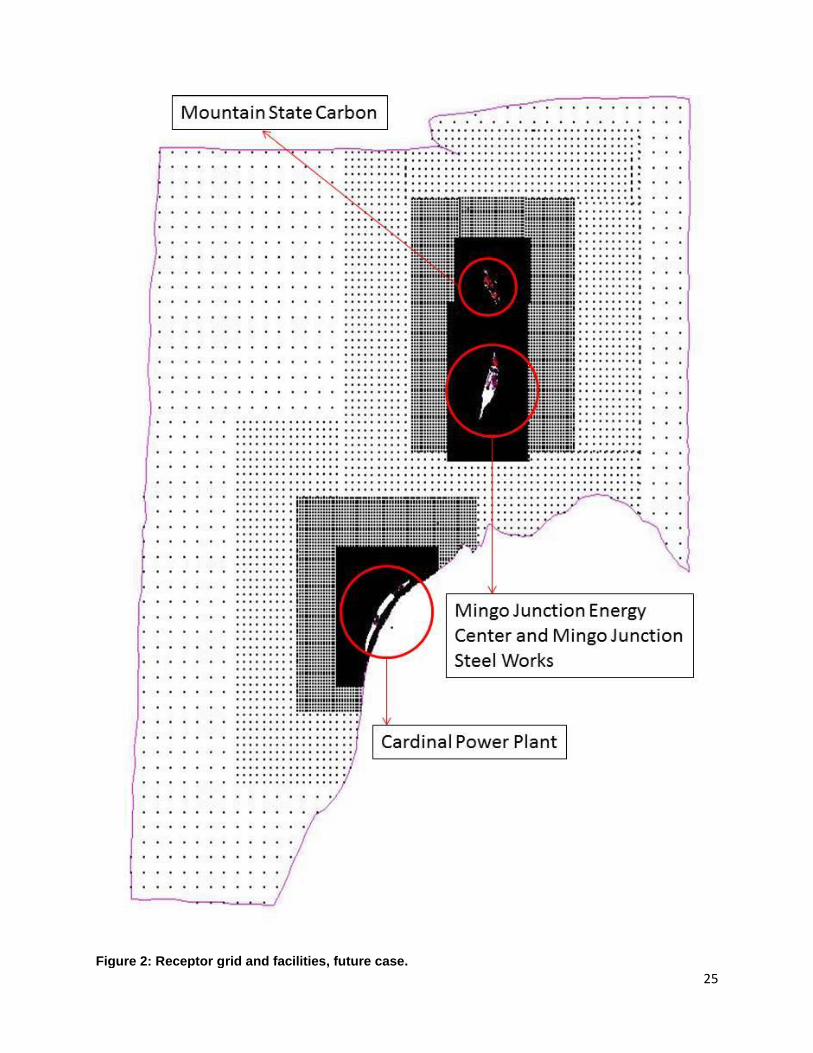
Receptors A total of 21,186 receptors were included in the modeling domain. Fenceline receptors were placed with 25 meters spacing. 50 meters spacing within a 1 km radius of each facility was used. 100 meters spacing was used within 2.5 km of each facility, 250 meters spacing was used within a radius of 5 km from each facility, and a 500 meters spacing was used if further receptors were needed. Given the number of sources in the nonattainment area, there is substantial receptor density in a majority of the area. Discrete receptors were also included at the locations of the eight ambient air quality monitors, as was done in the base case scenario. Figure 2 shows the location of each facility as well as the receptor grid used for all future case modeling scenarios.
25
Figure 2: Receptor grid and facilities, future case.
26
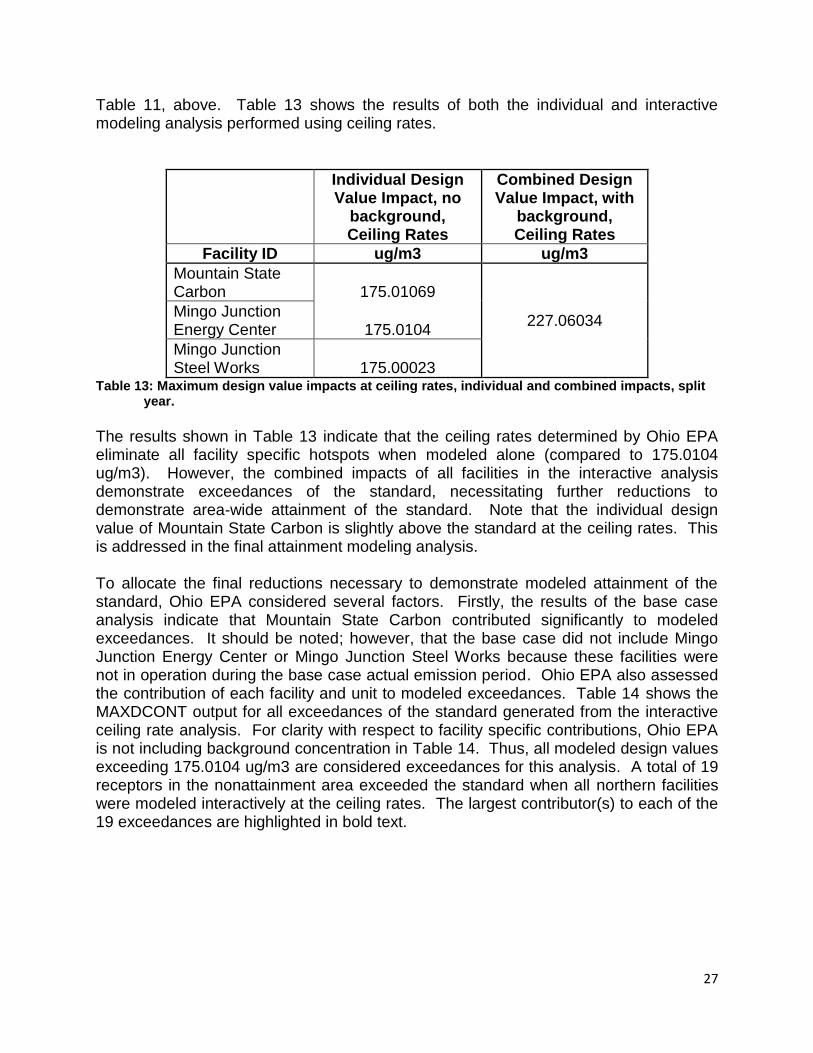
Meteorology All future case analyses were based on the split-year on-site meteorological data set collected at Mountain State Carbon (July 1, 2013-June 30, 2014 period) as described in the general meteorology section at the beginning of this document and following U.S. EPA guidance with respect to the determination of SO2 design values. Given the close proximity of the Mingo Junction Energy Center and Mingo Junction Steel Works, as well as the similar location of these facilities in the Ohio River valley, the on-site meteorological data from Mountain State Carbon is considered as on-site data for these facilities as well. Further, this meteorological station, situated in the Ohio River valley, is more representative of valley wind flows relative to other meteorological stations nearby (i.e., Pittsburgh or Wheeling). Results The first future case analysis evaluated the individual impact of each facility as a design value when modeled at their permitted SO2 emission rate. The 4th highest maximum daily impact of each facility is shown in Table 12. Any maximum impact over 175.0104 ug/m3 represents a modeled exceedance if background is not explicitly included in the model output. Modeled design values above 196.2 ug/m3 represent exceedances when the background is explicitly included in the model output.
Design Value, with
background
Facility ID ug/m3
Mountain State Carbon 358.9257
Mingo Junction Energy Center 744.8563
Mingo Junction Steel Works 15,005.2696
Table 12: Maximum design value individual facility impacts at permitted SO2 rates, split year.
The results in Table 12 clearly demonstrate that reductions in SO2 emission rates were required for all modeled facilities. Using these results and the results generated by the MAXDCONT file for the permitted rate modeling analysis, Ohio EPA determined unit-specific ceiling emission rates that would eliminate individual facility exceedances. It should be noted that Ohio EPA included, as part of the ceiling rate determination, facility supplied information with regards to some units being limited to burning natural gas. Ohio EPA then modeled each facility individually at these ceiling rates, and subsequently modeled all facilities interactively/combined, at those same ceiling rates. These ceiling rates are indicated in
27
Table 11, above. Table 13 shows the results of both the individual and interactive modeling analysis performed using ceiling rates.
Individual Design Value Impact, no
background, Ceiling Rates
Combined Design Value Impact, with
background, Ceiling Rates
Facility ID ug/m3 ug/m3
Mountain State Carbon 175.01069
227.06034 Mingo Junction Energy Center 175.0104
Mingo Junction Steel Works 175.00023
Table 13: Maximum design value impacts at ceiling rates, individual and combined impacts, split year.
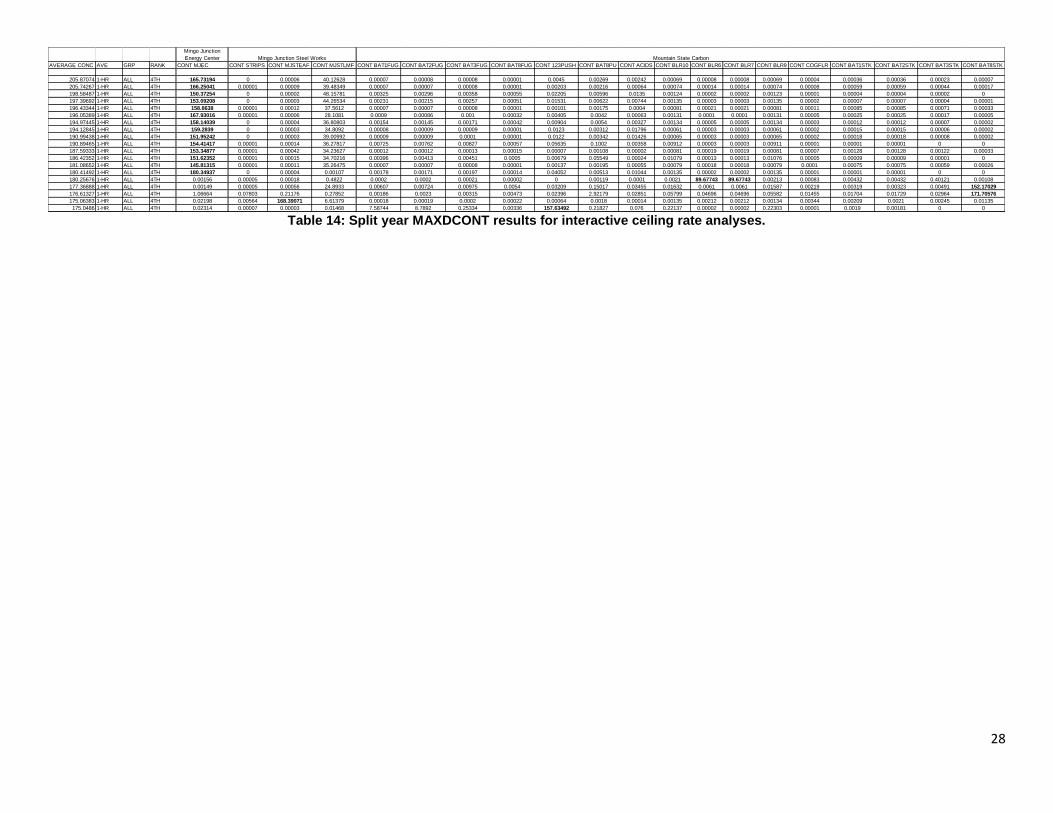
The results shown in Table 13 indicate that the ceiling rates determined by Ohio EPA eliminate all facility specific hotspots when modeled alone (compared to 175.0104 ug/m3). However, the combined impacts of all facilities in the interactive analysis demonstrate exceedances of the standard, necessitating further reductions to demonstrate area-wide attainment of the standard. Note that the individual design value of Mountain State Carbon is slightly above the standard at the ceiling rates. This is addressed in the final attainment modeling analysis. To allocate the final reductions necessary to demonstrate modeled attainment of the standard, Ohio EPA considered several factors. Firstly, the results of the base case analysis indicate that Mountain State Carbon contributed significantly to modeled exceedances. It should be noted; however, that the base case did not include Mingo Junction Energy Center or Mingo Junction Steel Works because these facilities were not in operation during the base case actual emission period. Ohio EPA also assessed the contribution of each facility and unit to modeled exceedances. Table 14 shows the MAXDCONT output for all exceedances of the standard generated from the interactive ceiling rate analysis. For clarity with respect to facility specific contributions, Ohio EPA is not including background concentration in Table 14. Thus, all modeled design values exceeding 175.0104 ug/m3 are considered exceedances for this analysis. A total of 19 receptors in the nonattainment area exceeded the standard when all northern facilities were modeled interactively at the ceiling rates. The largest contributor(s) to each of the 19 exceedances are highlighted in bold text.
28
Table 14: Split year MAXDCONT results for interactive ceiling rate analyses.
Mingo Junction
Energy Center
AVERAGE CONC AVE GRP RANK CONT MJEC CONT STRIPS CONT MJSTEAF CONT MJSTLMF CONT BAT1FUG CONT BAT2FUG CONT BAT3FUG CONT BAT8FUG CONT 123PUSH CONT BAT8PU CONT ACIDS CONT BLR10 CONT BLR6 CONT BLR7 CONT BLR9 CONT COGFLR CONT BAT1STK CONT BAT2STK CONT BAT3STK CONT BAT8STK
205.87074 1-HR ALL 4TH 165.73194 0 0.00006 40.12628 0.00007 0.00008 0.00008 0.00001 0.0045 0.00269 0.00242 0.00069 0.00008 0.00008 0.00069 0.00004 0.00036 0.00036 0.00023 0.00007
205.74267 1-HR ALL 4TH 166.25041 0.00001 0.00009 39.48349 0.00007 0.00007 0.00008 0.00001 0.00203 0.00216 0.00064 0.00074 0.00014 0.00014 0.00074 0.00008 0.00059 0.00059 0.00044 0.00017
198.58487 1-HR ALL 4TH 150.37254 0 0.00002 48.15781 0.00325 0.00296 0.00358 0.00055 0.02205 0.00596 0.0135 0.00124 0.00002 0.00002 0.00123 0.00001 0.00004 0.00004 0.00002 0
197.39692 1-HR ALL 4TH 153.09208 0 0.00003 44.26534 0.00231 0.00215 0.00257 0.00051 0.01531 0.00622 0.00744 0.00135 0.00003 0.00003 0.00135 0.00002 0.00007 0.00007 0.00004 0.00001
196.43344 1-HR ALL 4TH 158.8638 0.00001 0.00012 37.5612 0.00007 0.00007 0.00008 0.00001 0.00101 0.00175 0.0004 0.00081 0.00021 0.00021 0.00081 0.00011 0.00085 0.00085 0.00071 0.00033
196.05389 1-HR ALL 4TH 167.93016 0.00001 0.00006 28.1081 0.0009 0.00086 0.001 0.00032 0.00405 0.0042 0.00063 0.00131 0.0001 0.0001 0.00131 0.00005 0.00025 0.00025 0.00017 0.00005
194.97445 1-HR ALL 4TH 158.14039 0 0.00004 36.80803 0.00154 0.00145 0.00171 0.00042 0.00904 0.0054 0.00327 0.00134 0.00005 0.00005 0.00134 0.00003 0.00012 0.00012 0.00007 0.00002
194.12845 1-HR ALL 4TH 159.2839 0 0.00003 34.8092 0.00008 0.00009 0.00009 0.00001 0.0123 0.00312 0.01796 0.00061 0.00003 0.00003 0.00061 0.00002 0.00015 0.00015 0.00006 0.00002
190.99438 1-HR ALL 4TH 151.95242 0 0.00003 39.00992 0.00009 0.00009 0.0001 0.00001 0.0122 0.00342 0.01426 0.00065 0.00003 0.00003 0.00065 0.00002 0.00018 0.00018 0.00008 0.00002
190.89465 1-HR ALL 4TH 154.41417 0.00001 0.00014 36.27817 0.00725 0.00762 0.00827 0.00057 0.05635 0.1002 0.00358 0.00912 0.00003 0.00003 0.00911 0.00001 0.00001 0.00001 0 0
187.59333 1-HR ALL 4TH 153.34877 0.00001 0.00042 34.23627 0.00012 0.00012 0.00013 0.00015 0.00007 0.00108 0.00002 0.00081 0.00019 0.00019 0.00081 0.00007 0.00128 0.00128 0.00122 0.00033
186.42352 1-HR ALL 4TH 151.62352 0.00001 0.00015 34.70216 0.00396 0.00413 0.00451 0.0005 0.00679 0.05549 0.00024 0.01079 0.00013 0.00013 0.01076 0.00005 0.00009 0.00009 0.00001 0
181.08652 1-HR ALL 4TH 145.81315 0.00001 0.00011 35.26475 0.00007 0.00007 0.00008 0.00001 0.00137 0.00195 0.00055 0.00079 0.00018 0.00018 0.00079 0.0001 0.00075 0.00075 0.00059 0.00026
180.41492 1-HR ALL 4TH 180.34937 0 0.00004 0.00107 0.00178 0.00171 0.00197 0.00014 0.04052 0.00513 0.01044 0.00135 0.00002 0.00002 0.00135 0.00001 0.00001 0.00001 0 0
180.25676 1-HR ALL 4TH 0.00156 0.00005 0.00018 0.4822 0.0002 0.0002 0.00021 0.00002 0 0.00119 0.0001 0.0021 89.67743 89.67743 0.00213 0.00083 0.00432 0.00432 0.40121 0.00108
177.36888 1-HR ALL 4TH 0.00149 0.00005 0.00056 24.8933 0.00607 0.00724 0.00975 0.0054 0.03209 0.15017 0.03455 0.01632 0.0061 0.0061 0.01587 0.00219 0.00319 0.00323 0.00491 152.17029
176.61327 1-HR ALL 4TH 1.06664 0.07803 0.21176 0.27852 0.00186 0.0023 0.00315 0.00473 0.02396 2.92179 0.02851 0.05799 0.04696 0.04696 0.05582 0.01455 0.01704 0.01729 0.02964 171.70576
175.06383 1-HR ALL 4TH 0.02198 0.00564 168.39071 6.61379 0.00018 0.00019 0.0002 0.00022 0.00064 0.0018 0.00014 0.00135 0.00212 0.00212 0.00134 0.00344 0.00209 0.0021 0.00245 0.01135
175.0486 1-HR ALL 4TH 0.02314 0.00007 0.00003 0.01468 7.58744 8.7892 0.25334 0.00336 157.63492 0.21827 0.076 0.22137 0.00002 0.00002 0.22303 0.00001 0.0019 0.00181 0 0
Mingo Junction Steel Works Mountain State Carbon

29
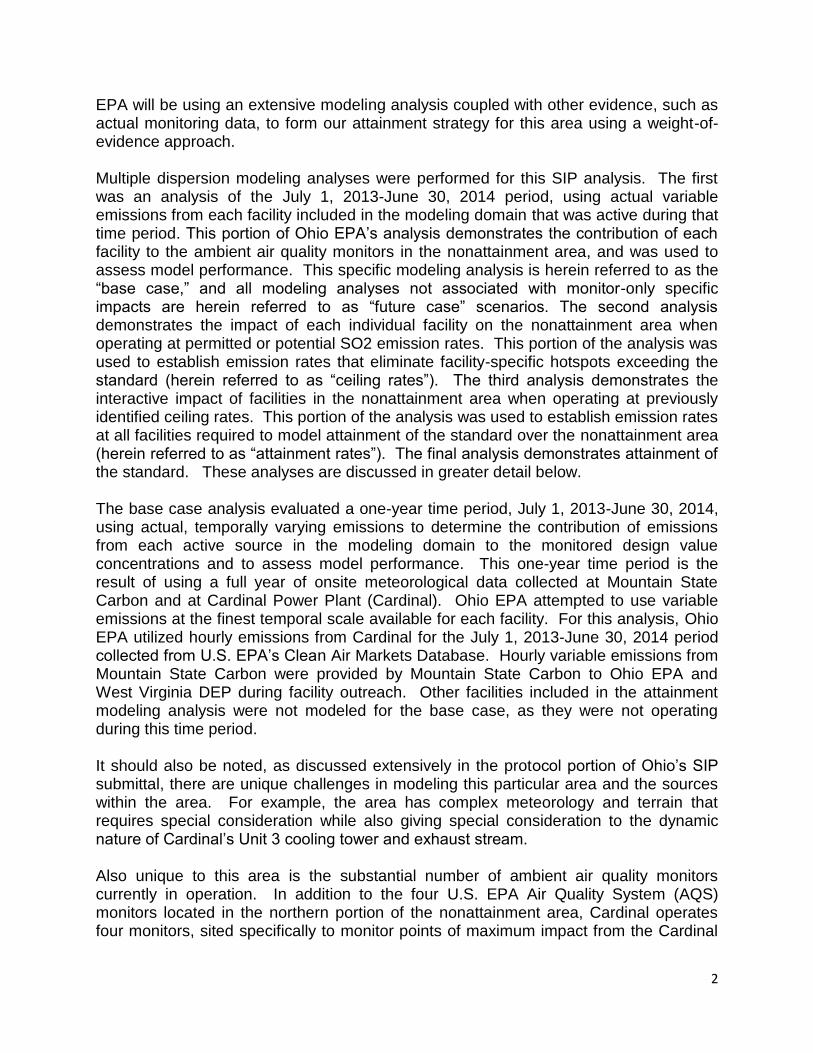
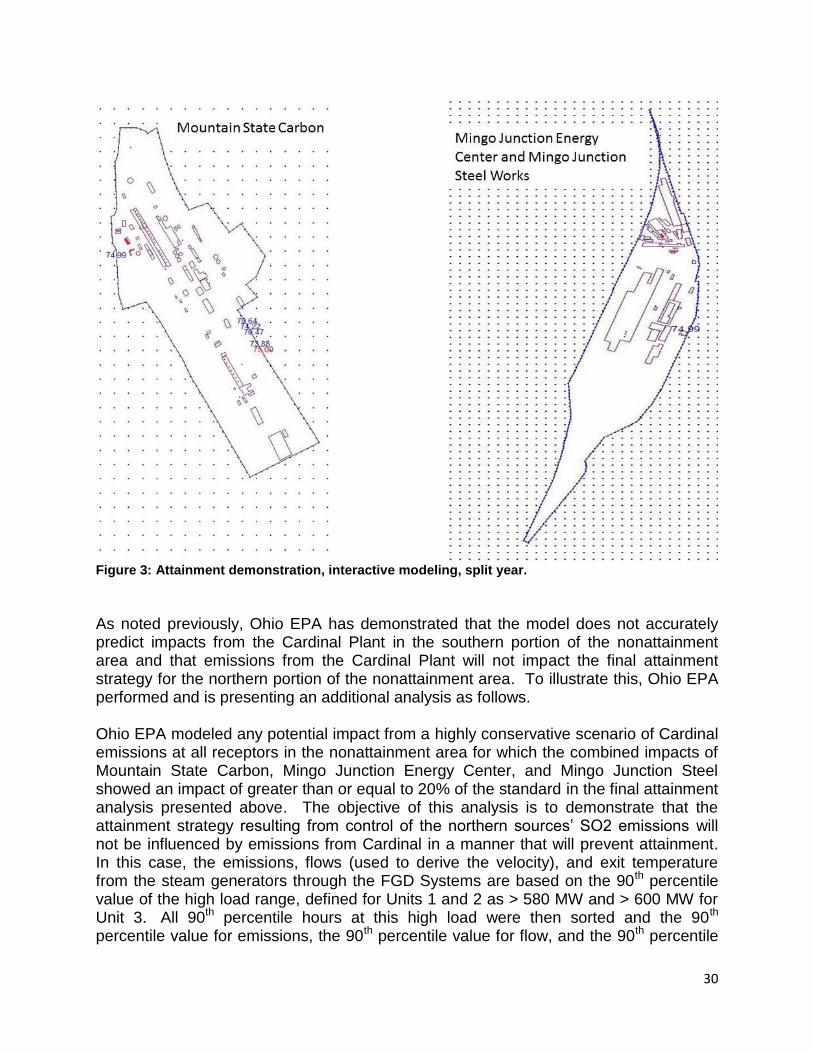
As shown in Table 14, with all facilities modeled at previously established ceiling rates, results in 19 receptors exceeding the standard. Fourteen exceedances demonstrate that the major contributor is emissions from Mingo Junction Energy Center, two exceedances demonstrate that the major contributor is emissions from the Battery 8 Stack at Mountain State Carbon. The three other exceedances demonstrate that emissions from the Electric Arc Furnace (EAF) at Mingo Junction Steel, Boilers 6 and 7 at Mountain State Carbon, and emissions from the Batteries 1-3 pushing stacks at Mountain State Carbon are the primary contributors. Further examination of the impacts of the facilities to the modeled exceedances shown in Table 14 indicate that reductions at only a single facility or unit will not yield modeled attainment at all monitors in the modeling domain. Thus, Ohio EPA applied further reductions to all facilities that will demonstrate modeled attainment of the standard at all receptors. The above results and subsequent reductions yielded final emission rates necessary to model attainment at all receptors in the modeling domain. These final attainment rates are given in the last column of Table 11, above. Figure 3, below, shows the results of the combined attainment run for the split year. For clarity, Ohio EPA is showing only those receptors with modeled design values greater than or equal to 70 ppb, inclusive of background. Further, as the maximum impacts occur at or near each facility fenceline, Ohio EPA is showing the maximum impacts around each facility. The highest modeled five-year design value, 75.00 ppb inclusive of background, is highlighted in red text. This value occurs on the fenceline of Mountain State Carbon.
30
Figure 3: Attainment demonstration, interactive modeling, split year.
As noted previously, Ohio EPA has demonstrated that the model does not accurately predict impacts from the Cardinal Plant in the southern portion of the nonattainment area and that emissions from the Cardinal Plant will not impact the final attainment strategy for the northern portion of the nonattainment area. To illustrate this, Ohio EPA performed and is presenting an additional analysis as follows. Ohio EPA modeled any potential impact from a highly conservative scenario of Cardinal emissions at all receptors in the nonattainment area for which the combined impacts of Mountain State Carbon, Mingo Junction Energy Center, and Mingo Junction Steel showed an impact of greater than or equal to 20% of the standard in the final attainment analysis presented above. The objective of this analysis is to demonstrate that the attainment strategy resulting from control of the northern sources’ SO2 emissions will not be influenced by emissions from Cardinal in a manner that will prevent attainment. In this case, the emissions, flows (used to derive the velocity), and exit temperature from the steam generators through the FGD Systems are based on the 90th percentile value of the high load range, defined for Units 1 and 2 as > 580 MW and > 600 MW for Unit 3. All 90th percentile hours at this high load were then sorted and the 90th percentile value for emissions, the 90th percentile value for flow, and the 90th percentile
31
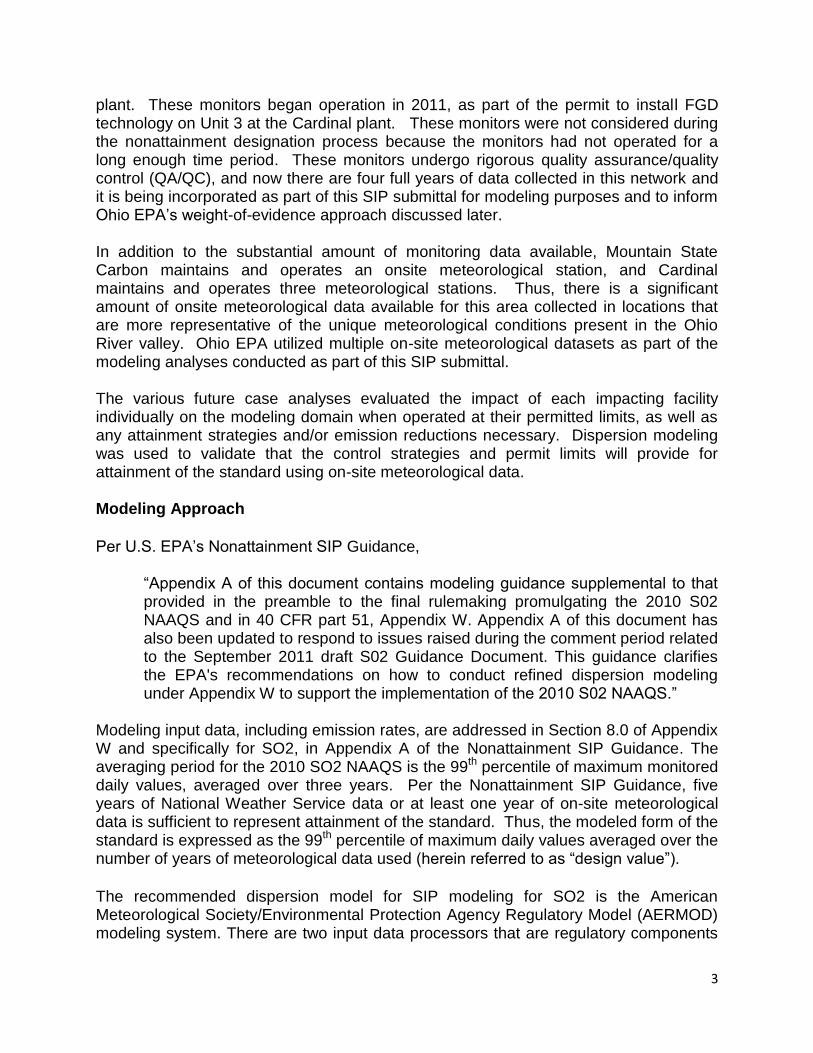
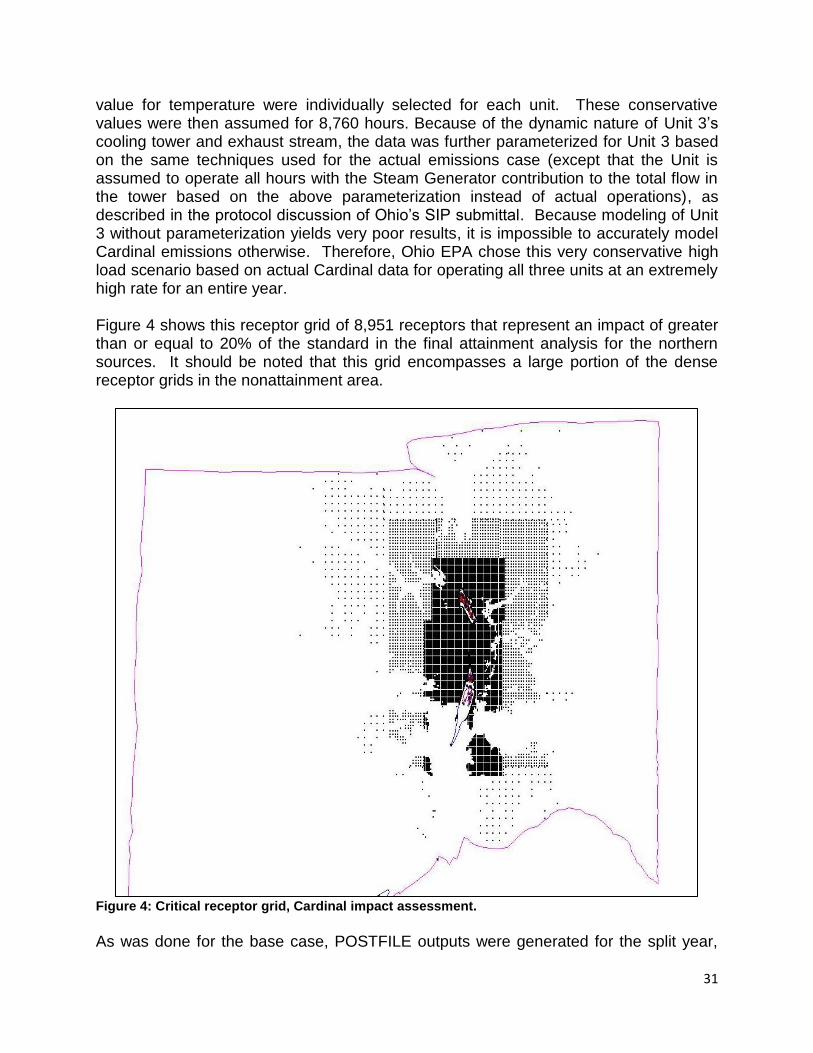
value for temperature were individually selected for each unit. These conservative values were then assumed for 8,760 hours. Because of the dynamic nature of Unit 3’s cooling tower and exhaust stream, the data was further parameterized for Unit 3 based on the same techniques used for the actual emissions case (except that the Unit is assumed to operate all hours with the Steam Generator contribution to the total flow in the tower based on the above parameterization instead of actual operations), as described in the protocol discussion of Ohio’s SIP submittal. Because modeling of Unit 3 without parameterization yields very poor results, it is impossible to accurately model Cardinal emissions otherwise. Therefore, Ohio EPA chose this very conservative high load scenario based on actual Cardinal data for operating all three units at an extremely high rate for an entire year. Figure 4 shows this receptor grid of 8,951 receptors that represent an impact of greater than or equal to 20% of the standard in the final attainment analysis for the northern sources. It should be noted that this grid encompasses a large portion of the dense receptor grids in the nonattainment area.
Figure 4: Critical receptor grid, Cardinal impact assessment.
As was done for the base case, POSTFILE outputs were generated for the split year,

32
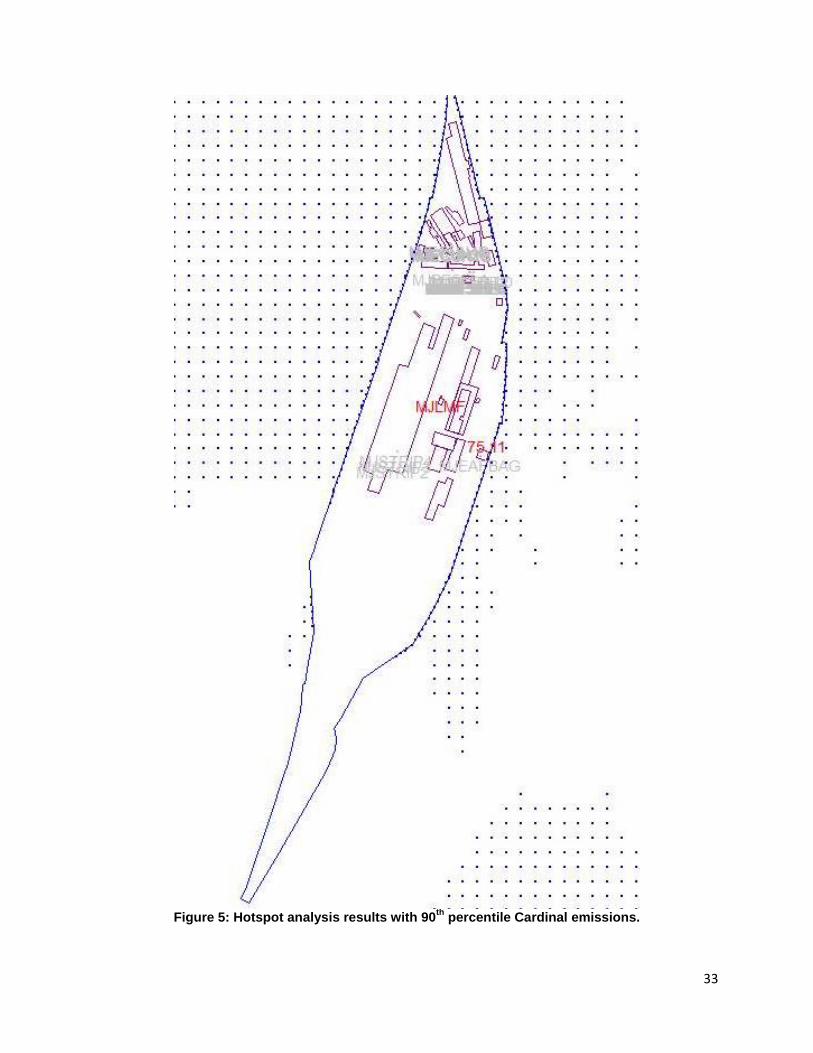
and combined external to AERMOD. Figure 5 shows the results of this analysis, indicating that a single receptor, located on the Mingo Junction Energy Center/Mingo Junction Steel Works fenceline, is above the standard at 75.11 ppb, including background.
33
Figure 5: Hotspot analysis results with 90
th percentile Cardinal emissions.
34
Incorporating Cardinal’s high load conservative emissions (at 8,760 hours) into the attainment strategy shows that continued operation of Cardinal, without the need for additional control beyond the current FGD systems, will not interfere with attainment of the standard in this area. Our weight-of-evidence is as follows:
As discussed extensively in the protocol portion of Ohio’s SIP submittal, there are unique challenges in modeling this particular area and the sources within the area. The complex meteorology and terrain requires special consideration while also giving special consideration to the dynamic nature of Cardinal’s Unit 3 cooling tower and exhaust stream.
The base case analysis and long existing violating northern monitoring network demonstrates the importance of the northern portion of this area.
Ohio EPA has provided ample modeling results in the northern portion of the nonattainment area that demonstrates attainment will occur due to necessary reductions at Mountain State Carbon and the control of emissions from Mingo Junction Energy Center, and Mingo Junction Steel.
As additional assurance, Ohio EPA modeled the potential for Cardinal’s influence on the attainment strategy resulting from control of the northern sources. A very conservative high load scenario of Cardinal emissions was modeled with the attainment rates of the northern sources. Ohio EPA demonstrated that the attainment strategy resulting from control of the northern sources’ SO2 emissions will not be influenced by emissions from Cardinal in a manner that will prevent attainment. Although one receptor showed a very minor exceedance under this scenario, it is highly unrealistic that Cardinal could maintain operations for 8,760 hours at high load at all three units. It is similarly unrealistic that one receptor showing a modeled exceedance of 0.11 ppb over this period would ever occur in the real world.
Cardinal is a well-controlled facility with each of the three boilers’ SO2 emissions controlled by FGD. Any additional control of Cardinal will not assist in bringing the northern portion of the Steubenville, OH-WV nonattainment area into attainment as indicated by the limited impact Cardinal demonstrated in the base case analysis.
There are enough inaccuracies and inconsistencies evident in the base case (using actual emissions) modeling results for the southern portion of this nonattainment area and that these inaccuracies are significant enough that deference must be given to the now extensive amount of actual monitoring data in demonstrating attainment in the southern portion of the nonattainment area.
The complex meteorology and terrain coupled with the dynamic nature of Cardinal’s Unit 3 cooling tower and exhaust stream makes it challenging, if not impossible, to accurately characterize near-field impacts using current modeling

35
capabilities. For this very reason, as part of the Unit 3 FGD PTI, the Cardinal ambient air monitoring network was needed.
It is acknowledged in Appendix W that there are some conditions where measured data may lend credence to modeling results, and that certain criteria should be considered, such as monitors being sited at maximum impact, monitors that meet U.S. EPA quality control standards, and most importantly, a demonstration the modeled results are not representative of monitored data. Weight must be given to actual monitoring results compared to modeling results.
Monitoring at the Cardinal location did not begin until 2011 and was not considered when making designations for this area. There are now four years of monitoring data available around the Cardinal facility, from locations expected to show maximum.
There is ample real monitoring evidence showing that Cardinal emissions are not causing an exceedance in the southern portion of the nonattainment area. Four years of monitoring data sited to identify high impacts clearly shows the area is well under the 75 ppb standard. The highest three-year design values for the Cardinal network are 48 ppb for 2011-2013 and 42 ppb for 2012-2014. There is ample “cushion” between the monitor design values and standard to account for any fluctuation in emissions from Cardinal.
Had the monitoring data available today existed at the time of designations, the nonattainment area may have been decided very differently. If that were the case, Cardinal would be subject to U.S. EPA’s unclassifiable area requirements which would include the option of monitoring in lieu of modeling. Monitoring shows attainment.
Ultimately the purpose of the attainment demonstration analysis is to provide sufficient evidence, and reductions when necessary, of attainment of the standard. An attainment demonstration does not assume required reductions from all sources in the area. Ohio EPA has clearly demonstrated through reductions at the northern facilities that attainment will be achieved in the northern portion of the nonattainment area. Ohio EPA has also clearly demonstrated through the use of actual monitoring data that the southern portion of the nonattainment area is in attainment. Based on the current controls at Cardinal and reductions from the northern facilities, the entire nonattainment area will continue to attain the standard.
Ambient air quality has greatly improved in the nonattainment area and the area is very close to achieving attainment. The design value monitor for this nonattainment area is currently showing nonattainment at 76 ppb (2012 to 2014). In fact, the other monitors in the northern area have current design values ranging from 45 to 53 ppb.
36
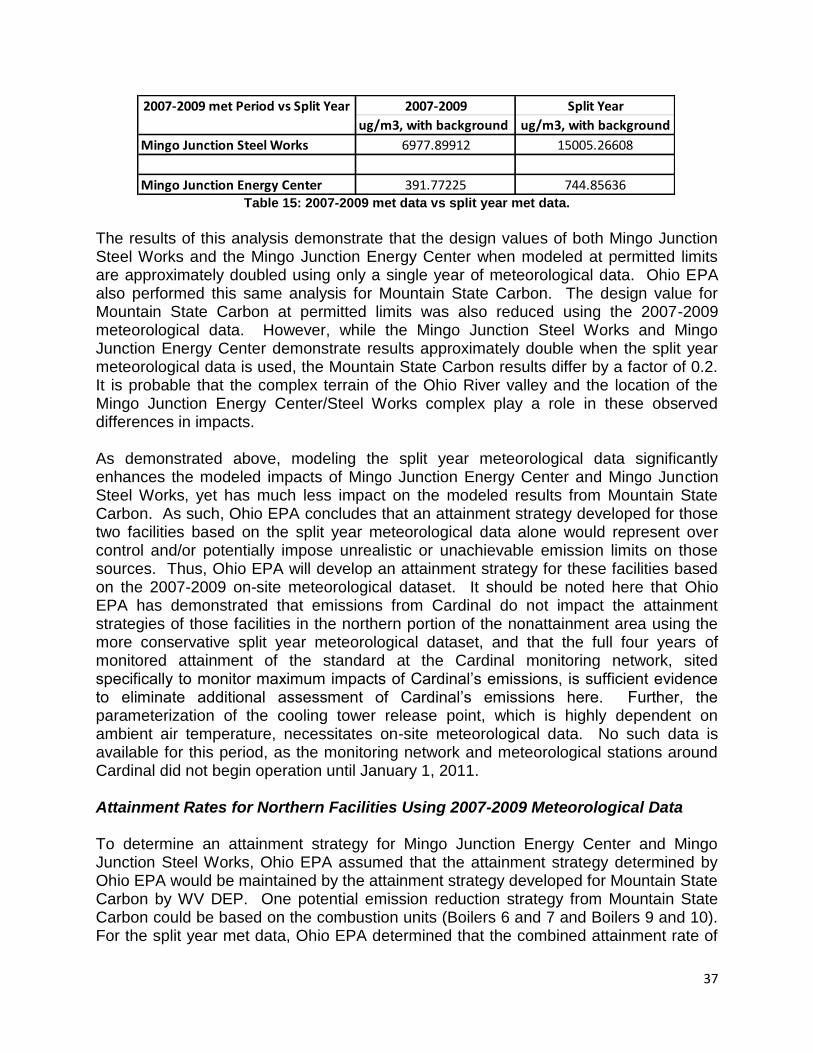
Therefore, based upon the above analysis and weight-of-evidence, the attainment and control strategy for this nonattainment area is only required from, and limited to, the three sources located in the northern portion of this nonattainment area: Mountain State Carbon, Mingo Junction Energy Center, and Mingo Junction Steel Works. Additional Analysis using an Expanded Meteorology Data Set Examination of the final attainment emission rates for Mingo Junction Steel Works and the Mingo Junction Energy Center demonstrates that substantial emission reductions are required (see Table 11). In particular, the level of emission reductions required for the Mingo Junction Steel Works EAF, which is a new unit based on the Consteel process and designed to have substantially less emissions than a typical EAF, suggests that the use of a single year of meteorological data (split year) is leading to over-control of some units. The details of the Consteel process are provided as Appendix D of Ohio’s SIP submittal. The July 1, 2013-June 30, 2014 split year meteorological dataset encompasses an unusually cold winter season experienced in Ohio. Further, the use of a single year of meteorological data could potentially bias the design value through the impacts of unusual weather events or rare meteorological conditions that would otherwise be averaged out over three or more years of meteorological data. Recall, the original reason the single year of meteorological data (split year) was selected was because it was the only period of time that a full year of data was available for both the meteorologically distinct northern and southern portions of the nonattainment area (Mountains State Carbon on-site data and Cardinal Power Plant on-site data) and also encompassed a time period Cardinal was fully controlled by FGD. Since Ohio EPA has determined that Cardinal does not need to be a part of the attainment strategy for this area, we are now able to consider larger, earlier (prior to Cardinal monitors and Unit 3 FGD being in operation) meteorological data sets from the Mountain State Carbon sites (that represents the northern portion of this area). As such, Ohio EPA explored the use of an extended 2007-2009 meteorological dataset collected at the Mountain State Carbon facility. Ohio EPA notes here that the West Virginia Department of Environmental Protection (WV DEP) will be responsible for determining the ultimate attainment strategy for Mountain State Carbon and deciding which meteorological data set they will use in their analysis. Ohio EPA understands, via consultation with WV DEP and Mountain State Carbon, that the critical attainment values ultimately included in WV DEP’s attainment strategy will be consistent with the principles behind the analysis performed by Ohio EPA. However, multiple reduction strategies, or variations in strategy, for Mountain State Carbon may achieve the same results as presented here. To examine the impact of modeling an extended on-site meteorological dataset, Ohio EPA first individually modeled both Mingo Junction Steel Works and Mingo Junction Energy Center, using their permitted rates. These results were compared to those results obtained when these facilities were modeled in the same manner using the split year meteorology. The results of this analysis are shown in Table 15.
37
Table 15: 2007-2009 met data vs split year met data.
The results of this analysis demonstrate that the design values of both Mingo Junction Steel Works and the Mingo Junction Energy Center when modeled at permitted limits are approximately doubled using only a single year of meteorological data. Ohio EPA also performed this same analysis for Mountain State Carbon. The design value for Mountain State Carbon at permitted limits was also reduced using the 2007-2009 meteorological data. However, while the Mingo Junction Steel Works and Mingo Junction Energy Center demonstrate results approximately double when the split year meteorological data is used, the Mountain State Carbon results differ by a factor of 0.2. It is probable that the complex terrain of the Ohio River valley and the location of the Mingo Junction Energy Center/Steel Works complex play a role in these observed differences in impacts. As demonstrated above, modeling the split year meteorological data significantly enhances the modeled impacts of Mingo Junction Energy Center and Mingo Junction Steel Works, yet has much less impact on the modeled results from Mountain State Carbon. As such, Ohio EPA concludes that an attainment strategy developed for those two facilities based on the split year meteorological data alone would represent over control and/or potentially impose unrealistic or unachievable emission limits on those sources. Thus, Ohio EPA will develop an attainment strategy for these facilities based on the 2007-2009 on-site meteorological dataset. It should be noted here that Ohio EPA has demonstrated that emissions from Cardinal do not impact the attainment strategies of those facilities in the northern portion of the nonattainment area using the more conservative split year meteorological dataset, and that the full four years of monitored attainment of the standard at the Cardinal monitoring network, sited specifically to monitor maximum impacts of Cardinal’s emissions, is sufficient evidence to eliminate additional assessment of Cardinal’s emissions here. Further, the parameterization of the cooling tower release point, which is highly dependent on ambient air temperature, necessitates on-site meteorological data. No such data is available for this period, as the monitoring network and meteorological stations around Cardinal did not begin operation until January 1, 2011. Attainment Rates for Northern Facilities Using 2007-2009 Meteorological Data To determine an attainment strategy for Mingo Junction Energy Center and Mingo Junction Steel Works, Ohio EPA assumed that the attainment strategy determined by Ohio EPA would be maintained by the attainment strategy developed for Mountain State Carbon by WV DEP. One potential emission reduction strategy from Mountain State Carbon could be based on the combustion units (Boilers 6 and 7 and Boilers 9 and 10). For the split year met data, Ohio EPA determined that the combined attainment rate of
2007-2009 Split Year
ug/m3, with background ug/m3, with background
Mingo Junction Steel Works 6977.89912 15005.26608
Mingo Junction Energy Center 391.77225 744.85636
2007-2009 met Period vs Split Year
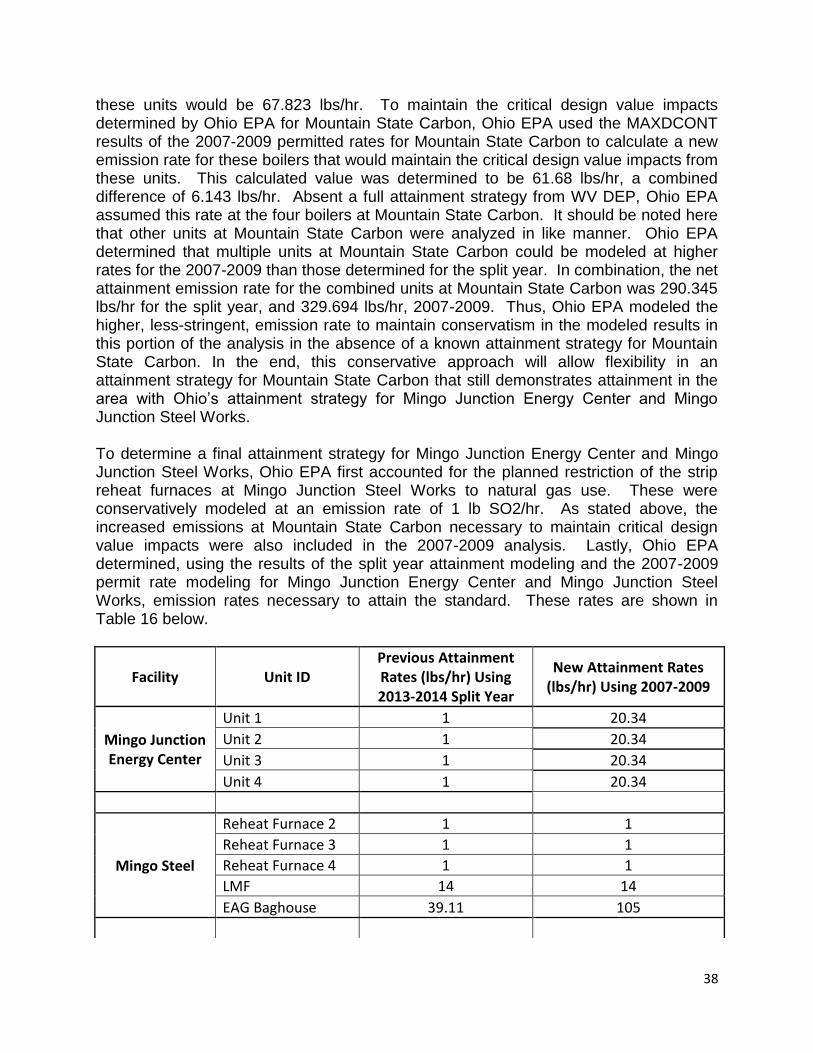
38
these units would be 67.823 lbs/hr. To maintain the critical design value impacts determined by Ohio EPA for Mountain State Carbon, Ohio EPA used the MAXDCONT results of the 2007-2009 permitted rates for Mountain State Carbon to calculate a new emission rate for these boilers that would maintain the critical design value impacts from these units. This calculated value was determined to be 61.68 lbs/hr, a combined difference of 6.143 lbs/hr. Absent a full attainment strategy from WV DEP, Ohio EPA assumed this rate at the four boilers at Mountain State Carbon. It should be noted here that other units at Mountain State Carbon were analyzed in like manner. Ohio EPA determined that multiple units at Mountain State Carbon could be modeled at higher rates for the 2007-2009 than those determined for the split year. In combination, the net attainment emission rate for the combined units at Mountain State Carbon was 290.345 lbs/hr for the split year, and 329.694 lbs/hr, 2007-2009. Thus, Ohio EPA modeled the higher, less-stringent, emission rate to maintain conservatism in the modeled results in this portion of the analysis in the absence of a known attainment strategy for Mountain State Carbon. In the end, this conservative approach will allow flexibility in an attainment strategy for Mountain State Carbon that still demonstrates attainment in the area with Ohio’s attainment strategy for Mingo Junction Energy Center and Mingo Junction Steel Works. To determine a final attainment strategy for Mingo Junction Energy Center and Mingo Junction Steel Works, Ohio EPA first accounted for the planned restriction of the strip reheat furnaces at Mingo Junction Steel Works to natural gas use. These were conservatively modeled at an emission rate of 1 lb SO2/hr. As stated above, the increased emissions at Mountain State Carbon necessary to maintain critical design value impacts were also included in the 2007-2009 analysis. Lastly, Ohio EPA determined, using the results of the split year attainment modeling and the 2007-2009 permit rate modeling for Mingo Junction Energy Center and Mingo Junction Steel Works, emission rates necessary to attain the standard. These rates are shown in Table 16 below.
Facility Unit ID Previous Attainment Rates (lbs/hr) Using 2013-2014 Split Year
New Attainment Rates (lbs/hr) Using 2007-2009
Mingo Junction Energy Center
Unit 1 1 20.34
Unit 2 1 20.34
Unit 3 1 20.34
Unit 4 1 20.34
Mingo Steel
Reheat Furnace 2 1 1
Reheat Furnace 3 1 1
Reheat Furnace 4 1 1
LMF 14 14
EAG Baghouse 39.11 105
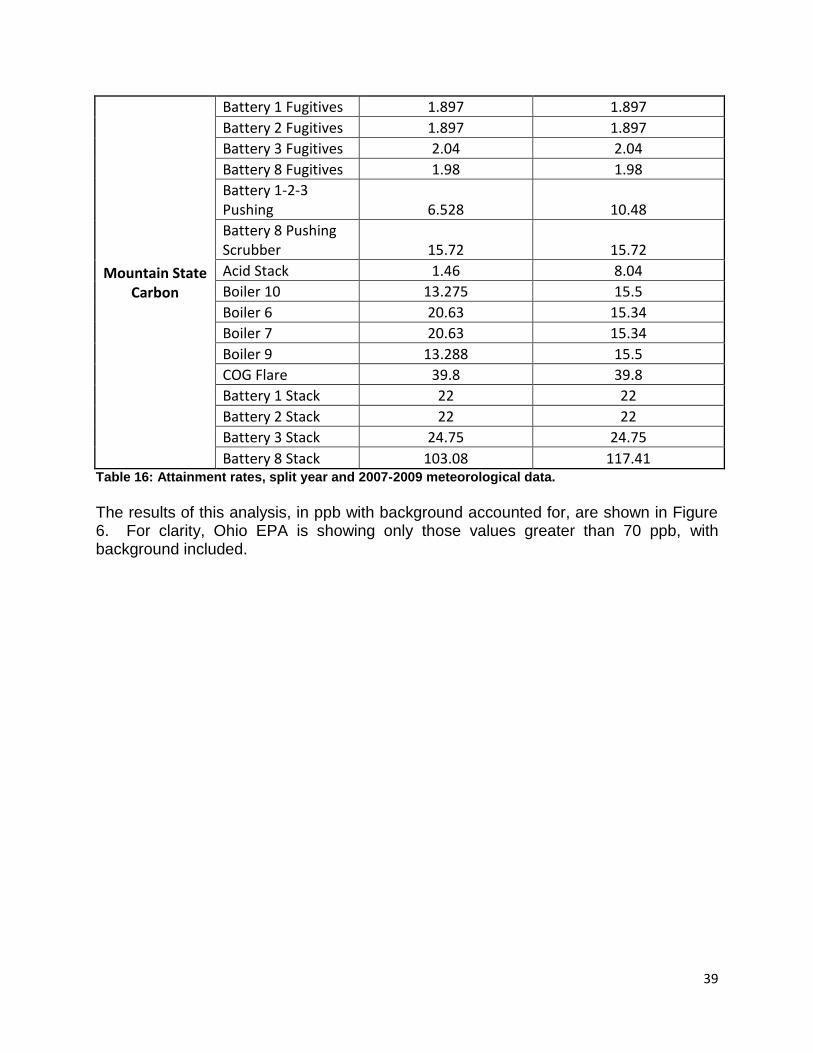
39
Mountain State Carbon
Battery 1 Fugitives 1.897 1.897
Battery 2 Fugitives 1.897 1.897
Battery 3 Fugitives 2.04 2.04
Battery 8 Fugitives 1.98 1.98
Battery 1-2-3 Pushing 6.528 10.48
Battery 8 Pushing Scrubber 15.72 15.72
Acid Stack 1.46 8.04
Boiler 10 13.275 15.5
Boiler 6 20.63 15.34
Boiler 7 20.63 15.34
Boiler 9 13.288 15.5
COG Flare 39.8 39.8
Battery 1 Stack 22 22
Battery 2 Stack 22 22
Battery 3 Stack 24.75 24.75
Battery 8 Stack 103.08 117.41 Table 16: Attainment rates, split year and 2007-2009 meteorological data.
The results of this analysis, in ppb with background accounted for, are shown in Figure 6. For clarity, Ohio EPA is showing only those values greater than 70 ppb, with background included.
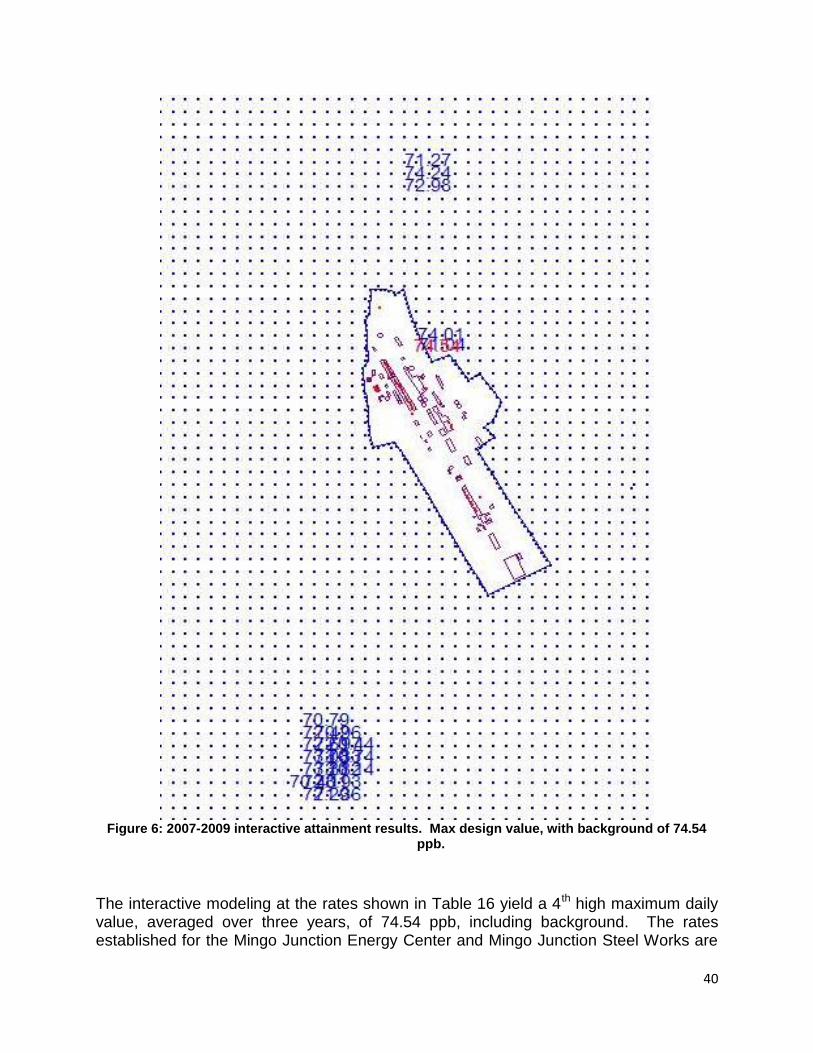
40
Figure 6: 2007-2009 interactive attainment results. Max design value, with background of 74.54
ppb.
The interactive modeling at the rates shown in Table 16 yield a 4th high maximum daily value, averaged over three years, of 74.54 ppb, including background. The rates established for the Mingo Junction Energy Center and Mingo Junction Steel Works are
41
far more representative of an attainment strategy than the severe reductions in emissions needed to demonstrate attainment using the split year meteorological data. As such, these rates will be incorporated into Ohio’s attainment plan for the Steubenville, OH-WV nonattainment area. Attainment Rates for Ohio’s Northern Facilities Using 2007-2009 Meteorological Data if Attainment Rates for Mountain State Carbon are based on 2013-2014 Meteorological Data As a final confirmation of the suitability of the attainment rates established using the 2007-2009 meteorological data for Mingo Junction Steel Works and Mingo Junction Energy Center, Ohio EPA interactively modeled these new attainment rates with the attainment rates determined using the split year met data for Mountain State Carbon. The purpose of this modeling is to ensure that Ohio’s adoption of rates established using the 2007-2009 meteorological data will provide for attainment regardless of which meteorological data set WV DEP uses when adopting rates for Mountain State Carbon. The rates modeled in this analysis are shown in Table 17.
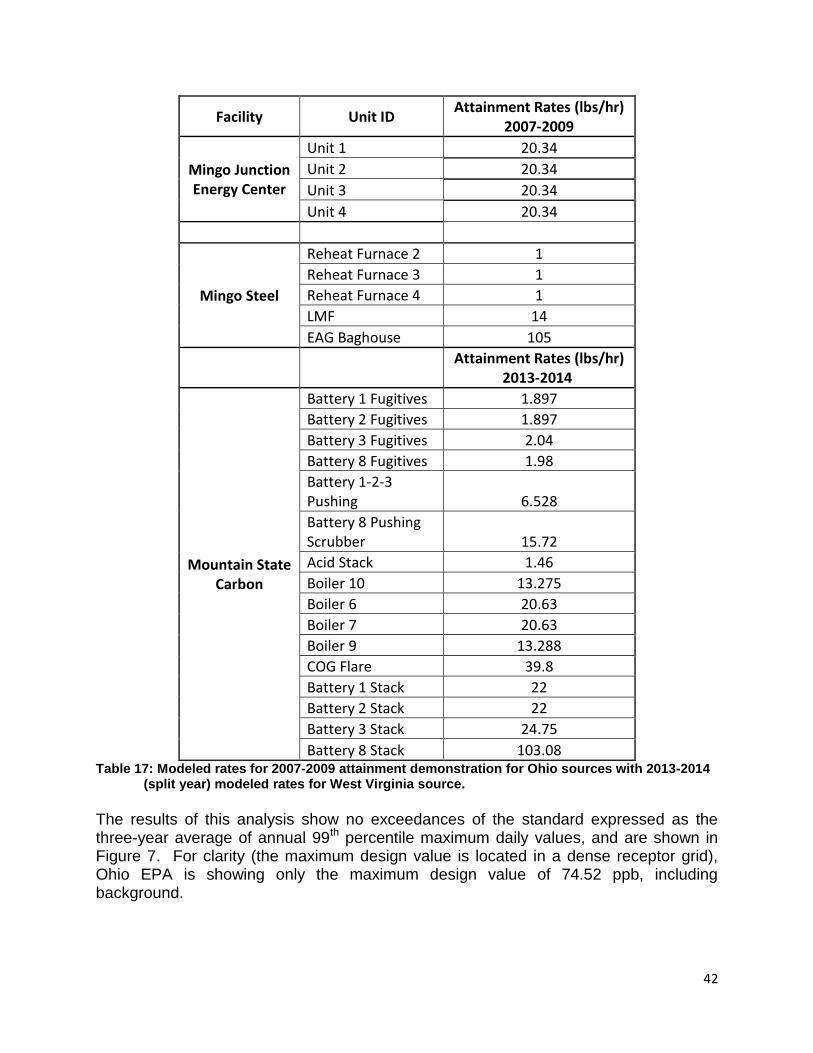
42
Facility Unit ID Attainment Rates (lbs/hr)
2007-2009
Mingo Junction Energy Center
Unit 1 20.34
Unit 2 20.34
Unit 3 20.34
Unit 4 20.34
Mingo Steel
Reheat Furnace 2 1
Reheat Furnace 3 1
Reheat Furnace 4 1
LMF 14
EAG Baghouse 105
Attainment Rates (lbs/hr) 2013-2014
Mountain State Carbon
Battery 1 Fugitives 1.897
Battery 2 Fugitives 1.897
Battery 3 Fugitives 2.04
Battery 8 Fugitives 1.98
Battery 1-2-3 Pushing 6.528
Battery 8 Pushing Scrubber 15.72
Acid Stack 1.46
Boiler 10 13.275
Boiler 6 20.63
Boiler 7 20.63
Boiler 9 13.288
COG Flare 39.8
Battery 1 Stack 22
Battery 2 Stack 22
Battery 3 Stack 24.75
Battery 8 Stack 103.08 Table 17: Modeled rates for 2007-2009 attainment demonstration for Ohio sources with 2013-2014
(split year) modeled rates for West Virginia source.
The results of this analysis show no exceedances of the standard expressed as the three-year average of annual 99th percentile maximum daily values, and are shown in Figure 7. For clarity (the maximum design value is located in a dense receptor grid), Ohio EPA is showing only the maximum design value of 74.52 ppb, including background.
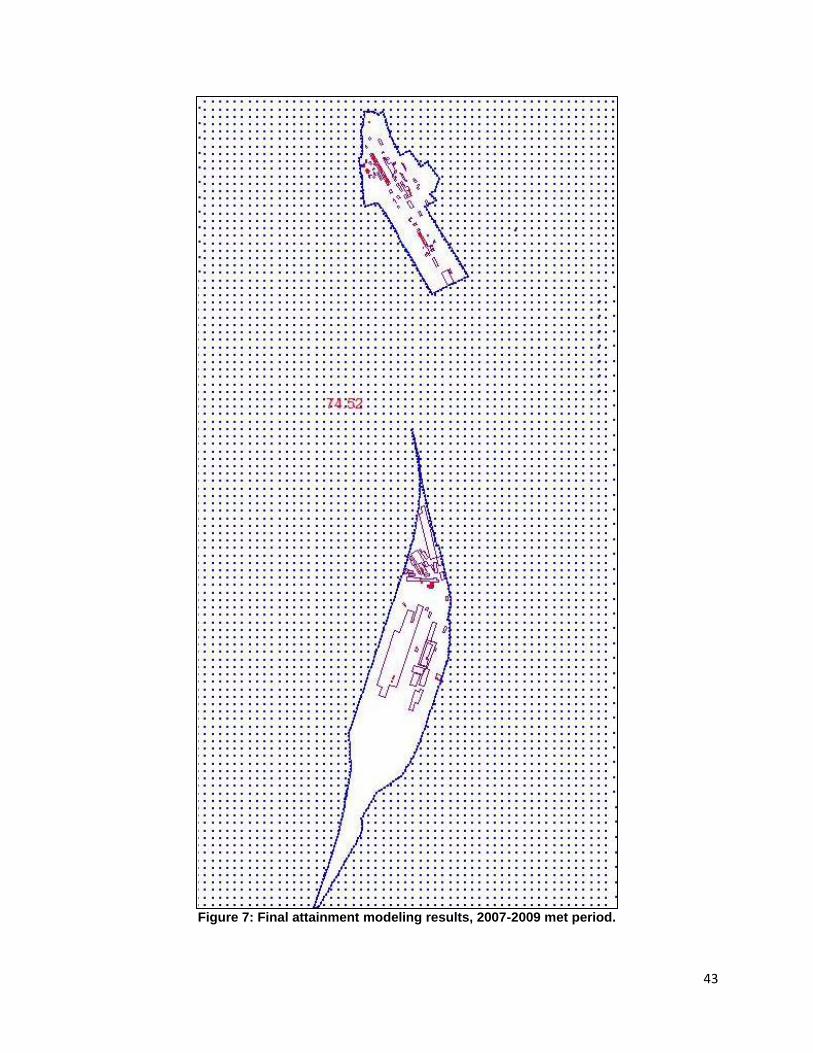
43
Figure 7: Final attainment modeling results, 2007-2009 met period.
44
The two modeling analyses performed by Ohio EPA using on-site 2007-2009 meteorological data demonstrate that the use of the split year meteorological data would lead to over-control of both the Mingo Junction Energy Center and Mingo Junction Steel Works, but the choice of meteorological data set has less of an impact on the attainment rates for Mountain State Carbon. In both analyses, Ohio’s adoption of attainment rates for Ohio’s northern facilities using 2007-2009 meteorological data provided for no exceedances of the standard regardless of which meteorological data set (2007-2009 or 2013-2014) WV DEP uses when developing attainment rates for Mountain State Carbon. Therefore, the attainment rates established for Mingo Junction Energy Center and Mingo Junction Steel Works, using three years (2007-2009) of on-site meteorological data will not cause or contribute to exceedances of the standard, irrespective of the attainment strategy implemented by WV DEP for Mountain State Carbon.