Embed Size (px)
Citation preview
Appendix LHydrological Modeling
USF
WS
Appendix AAppropriate Use Findings
Appendix BCompatibility Determinations
Appendix CImplementation
Appendix DWilderness Review
Appendix EBiological Resources of Concern
Appendix FStatement of Compliance
Appendix GIntegrated Pest Management
Appendix HGlossary
Appendix IContributors
Appendix JAcquisition History
Appendix KPublic Involvement
Appendix LHydrological Modeling
Appendix MReferences
Appendix NList of Refuge Species
Appendix OWildland Fire Management Plan
Appendix PMaps

Tualatin River National Wildlife Refuge Comprehensive Conservation Plan
Appendix L. Hydrological Modeling L-1
Appendix L. Hydrological Modeling
L.1 Introduction/Overview
To identify habitat alternatives, the Tualatin River National Wildlife Refuge developed a habitat modeling exercise to determine what habitats would likely develop if the refuge relied solely on natural flows (flows as they currently exist) from the Tualatin River. The essential question that we attempt to answer in this analysis can be framed as: Given our current ecological understanding and best available data, how much support do we have that current habitat patch x will develop into future habitat type y if the Tualatin River National Wildlife Refuge managed the refuge using the current natural flows of the Tualatin River?”
The refuge was interested in modeling four floodplain habitat types for the refuge: emergent wetland, wet prairie, bottomland riparian forest, and scrub-shrub wetland.
L.2 Methods
L.2.1 Overview of Methods
The methods for this modeling exercise incorporate Light Detection and Ranging (LiDAR) topographic data, hydrological data from the Farmington Gaging Station, a hydrological model to understand the potential future conditions on the refuge under the management direction, and a decision support modeling framework to use the best existing knowledge on soils and current and historical vegetation to predict future habitat types (Figure L-1).
Figure L-1. Steps taken in the modeling process.
1) Develop Terrain Model
2) Collect Hydrological
Data
3) Floodplain Modeling
4) Develop Decision Support Model
5) Review and Refine
6) Develop Alternatives

Tualatin River National Wildlife Refuge Comprehensive Conservation Plan
L-2 Appendix L. Hydrological Modeling
L.2.1.1 Develop a Terrain Model
LiDAR topographic data were acquired over the entire refuge as part of the Portland Metro LiDAR acquisition of 2005-2007. A digital elevation model (DEM) was produced that provides a terrain model of these data.
The LiDAR data were acquired during the fall of 2005. Thus, several of the wetland ponds were full of water during the acquisition. This made terrain modeling across the wetland ponds impossible. A mixture of ground-based surveys and engineering as-built data provided a data source to “fill-in” the flat areas caused by water. These data were collected and “burnt-in” to the LiDAR-based DEM.
L.2.1.2 Collect Hydrological Data
Daily data were gathered over a 10-year period from the Farmington Gaging Station located about 8 miles upstream of the nearest refuge unit. From this, we developed hydrographs (Figure L-2) that depict the frequency that river levels on the Tualatin reached for particular heights.
Figure L-2. Average and peak river level at Farmington Gage.
L.2.1.3 Floodplain Modeling
Hydrological modeling was conducted using a set of ArcGIS tools for floodplain and riparian areas, the Riparian Topography Toolbox (Dilts et al. 2009). This method works primarily by developing height above river (HAR) layers. The HAR outputs can be used to calculate ecologically important variables such as inundation area with some knowledge of the terrain, high-resolution LiDAR data, and information on the stream gage.
Average and Peak River Level at Farmington Gage 2002 - 2010
100.00
105.00
110.00
115.00
120.00
125.00
130.00
135.00
140.00
1-Oct 1-Nov 1-Dec 1-Jan 1-Feb 1-Mar 1-Apr 1-May 1-Jun 1-Jul 1-Aug 1-Sep
Date
Riv
er E
leva
tion
Flood Stage
Average Stage
Peak flow

Tualatin River National Wildlife Refuge Comprehensive Conservation Plan
Appendix L. Hydrological Modeling L-3
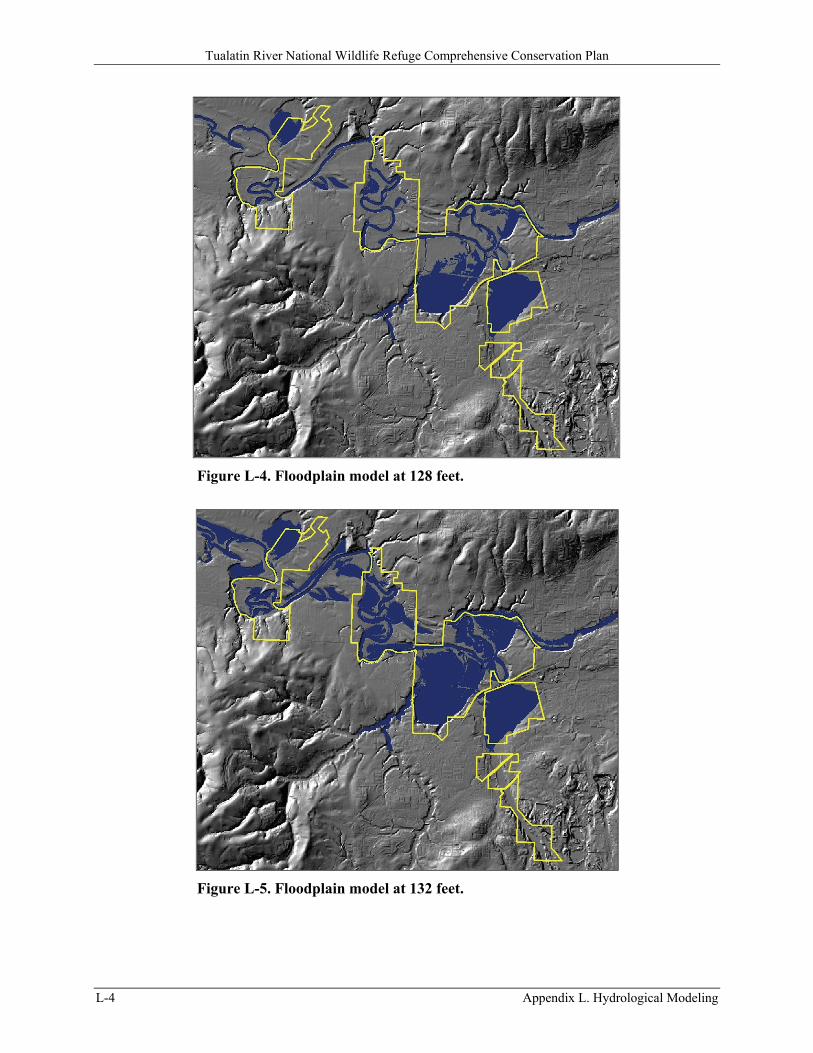
The first step was to develop a HAR layer. For this, we needed the LiDAR DEM and a binary stream/not-stream data layer. A kernel size of 3,500 meters was used to determine the height of the surrounding landscape above the river. Larger kernel sizes mean that larger stretches of river are being averaged. HAR is estimated by subtracting the elevation from the weighted average of the river elevation. The elevation was simply subtracted from the river elevations to come up with HAR. Then, flood scenarios were developed for different river elevations at an increment of 0.5 foot, starting at 118 feet (see Figures L-3 to L-5), which is normal river winter flow.
The Riparian Topography Toolbox has an algorithm that takes the flows of the river at a given height and develops a flow model based upon least cost path estimates. For the water to flow realistically across the landscape, we had to refine the LiDAR DEM. This included doing typical “hydro-enforcement,” or removing structures that impede the flow of water on the LiDAR data such as levees and culverts.
Figure L-3. Floodplain model at 120.5 feet.
Tualatin River National Wildlife Refuge Comprehensive Conservation Plan
L-4 Appendix L. Hydrological Modeling
Figure L-4. Floodplain model at 128 feet.
Figure L-5. Floodplain model at 132 feet.

Tualatin River National Wildlife Refuge Comprehensive Conservation Plan
Appendix L. Hydrological Modeling L-5
L.2.1.4 Decision Support Modeling
The process outlined above provides modeling for planners to know how frequently a patch of vegetation is flooded by the flows of the Tualatin River. The next step involved incorporating these data with other information including soils and vegetation.
Ecosystem Management Decision Support (EMDS) provides a flexible tool for managers to assess various scenarios with a quantifiable amount of certainty that an outcome will occur. From a geographic information system (GIS) perspective, it provides many advantages to traditional overlay analyses. In concept, EMDS provides functionality that is similar to combining different layers into an index. However, it uses formal logic operators, combined with methods and concepts from fuzzy logic and knowledge-based decision support (Reynolds et al. 2000). Using EMDS, a “knowledge base” is developed that articulates formal logic specifications of how attributes relate to a proposition. For example, one of our propositions is that “scrub-shrub wetlands will develop over time.” The attributes in our knowledge base to support this proposition are flooding frequency, soils, and current and historical vegetation. EMDS allows the user to specify the “good” and “poor” qualities of these attributes to support the proposition. For example, we know that areas that are not flooded are “poor” for supporting scrub-shrub wetland. Instead of merely a binary “good” and “poor,” EMDS allows fuzzy gradations between good and poor, which is more realistic in the real world.
The decision support model was developed with the refuge biologist and Regional Office staff. The initial exercise involved the refuge biologist providing suitability scores for soils, historical vegetation, current vegetation, and flooding frequency. These scores were translated to the EMDS system. A score of +1 indicates “Full Support” for the proposition, and a score of −1 indicates “No Support” for the proposition, with varying levels of support in between.
For example, if the refuge biologist determined that a high frequency of flooding was highly suitable in terms of supporting scrub-shrub wetlands, then that characteristic would get a +1. If the biologist determined that a certain soil type would never support scrub-shrub wetlands, then that characteristic would receive a score of −1. Or, if the current vegetation type is an indicator that scrub-shrub wetlands are not likely, but would be possible if other characteristics were favorable, then an intermediate score of .25 or .50 would have been given to that attribute.
As noted, four attributes were used in the decision support model. Below is a list of the attributes, their rationale, and source data.
Flood Frequency o Rationale: Predicted flood frequency is a primary influence on potential wetland
types. o Data source: Described in the water modeling section.
Soils o Rationale: Soil types are a good indicator of potential vegetation types. For example,
Labish Mucky Clays are very likely to support scrub-shrub wetlands. o Data source: U.S. Department of Agriculture (USDA) Soils Survey data (SSURGO),
Washington County.

Tualatin River National Wildlife Refuge Comprehensive Conservation Plan
L-6 Appendix L. Hydrological Modeling
Current Vegetation o Rationale: Current vegetation type provides some support for what could develop. It
also provides support for where habitat will not develop. For example, developed areas will remain developed in the future.
o Data source: Vegetation map developed by the refuge in 2007.
Historical Vegetation o Rationale: Historical vegetation provides another piece of evidence to support the
habitat propositions. For example, if an area was historically oak savanna, it would provide low support for an emergent wetland proposition.
o Data source: Oregon Natural Heritage Program
Each patch of vegetation was given a score that is a summary of the four different attributes.
L.2.1.5 Review and Refine the Model
The results are spatial depictions of the amount of support for the different habitat types of interest. This could be interpreted as a suitability model. It is similar in concept, but what is being quantified is the amount of support for a given proposition. Higher scores from −1 to 1 indicate higher support. Figures L-6 to L-9 provide spatial depictions of all the different habitat types that were assessed.
L.2.1.6 Development of Alternatives
Refuge staff spent a day going over the modeling results. This provided the science-based data that facilitated the decision-making process. In the figures below, darker blue represents higher support.
Figure L-6. Decision support for emergent wetland.

Tualatin River National Wildlife Refuge Comprehensive Conservation Plan
Appendix L. Hydrological Modeling L-7
Figure L-7. Decision support for wet prairie
Figure L-8. Decision support for bottomland riparian forest.

Tualatin River National Wildlife Refuge Comprehensive Conservation Plan
L-8 Appendix L. Hydrological Modeling
Figure L-9. Decision support for scrub-shrub wetland.
L.3 Conclusion
It is important to note that the modeling exercise did not make the decision, but rather provided support for the final decisions. Models and data played an important role in the alternative development dialogue.