Embed Size (px)
Citation preview
Appendix H: Expedient Coastal Protection
Appendix H Expedient Coastal Protection
H - 1
Appendix H: Expedient Coastal Protection
TABLE OF CONTENTS
1 Introduction................................................................................................................. 4 2 Shoreline Processes..................................................................................................... 5
2.1 Wave Action ....................................................................................................... 5 2.2 Sediment Transport............................................................................................. 7 2.3 Water Level Variations ....................................................................................... 9 2.4 Sources of Water Level Information................................................................. 10
3 The Erosion Problem ................................................................................................ 13 3.1 The Importance of Shoreform........................................................................... 13 3.2 Erosion in Response to Sea Level Rise............................................................. 15 3.3 The Effects of Erosion ...................................................................................... 16
4 Options for Expedient Shoreline Protection ............................................................. 16 4.1 Fundamentals of a successful Shoreline Protection Project ............................. 17 4.2 Engineered Sandbag Revetment ....................................................................... 21
4.2.1 Revetment Design............................................................................................ 22 4.2.2 Geotextile Bag Design ..................................................................................... 23 4.2.3 Construction Considerations............................................................................ 28 4.2.4 Maintenance Considerations............................................................................ 29 4.2.4 Cost Considerations ......................................................................................... 30
4.3 Beach Nourishment (Fill) ................................................................................. 31 4.4.1 Design Considerations ..................................................................................... 32 4.4.2 Example Expedient Beach Fill......................................................................... 34
4.4 Modified Geotextile Wrap-Around Revetments............................................... 37 5.1 References................................................................................................................. 40
LIST OF FIGURES Figure 1 Failed shoreline project several months after completion of construction. __________________ 5 Figure 2: Characteristics of Waves. _______________________________________________________ 6 Figure 3: Wave Diffraction and Reflection __________________________________________________ 7 Figure 4: Alongshore Sediment Transport __________________________________________________ 8 Figure 5: Tidal Phases _________________________________________________________________ 9 Figure 6: NOAA Water Level Stations ____________________________________________________ 11 Figure 7: NOAA Storm Surge Prediction Locations. _________________________________________ 12 Figure 8: An idealized Beach Profile _____________________________________________________ 14 Figure 9: The Bruun Rule of shoreline retreat (After Cooper and Pilkey, 2004) ____________________ 15 Figure 10 Example of a Gabion Revetment.________________________________________________ 19 Figure 11: Inadequate Filtering (Left Side) Proper Filter Design (Right Side) _____________________ 19 Figure 12: Wave Runup _______________________________________________________________ 20 Figure 13: Photos ____________________________________________________________________ 22 Figure 14: Engineered Sandbag Revetment Typical Section ___________________________________ 23 Figure 15: Photo of Engineered Sandbag Double Closure System_______________________________ 24 Figure 16: Typical 2 cubic yard engineered sandbag (Courtesy of Syn-Tex Bag Corporation)_________ 24 Figure 17: Threshold Wave Heights for Gravel Bag Instability _________________________________ 26 Figure 18 Typical section for Sandbag revetment built on a 1.5H to 1V slope______________________ 27 Figure 19 Photo from 2007 USACE Laboratory Sandbag Revetment testing. ______________________ 27 Figure 20 Sand Bag Filling Racks. _______________________________________________________ 28 Figure 21 Excavator with modified round half pipe over grab teeth. ____________________________ 30
H - 2

Appendix H: Expedient Coastal Protection
Figure 22 Steel pipe modified to transport large (4 CY) sandbags. ______________________________ 31 Figure 23 After a beach nourishment project is constructed, ___________________________________ 32 Figure 24 Fill placed directly on the beach to extend the natural berm seaward. ___________________ 34 Figure 25 June 25th 2008 Kivalina Aerial Photograph _______________________________________ 36 Figure 26 Kivalina Beach Profiles in front of the Fuel tank farm. _______________________________ 37 Figure 27 Geotextile wrap-around revetment (after Saathoff and Zitscher 2001)___________________ 38 Figure 28 GWR with layers sewn together (after Recio-Molina and K. Yashara) ___________________ 39
H - 3
Appendix H: Expedient Coastal Protection
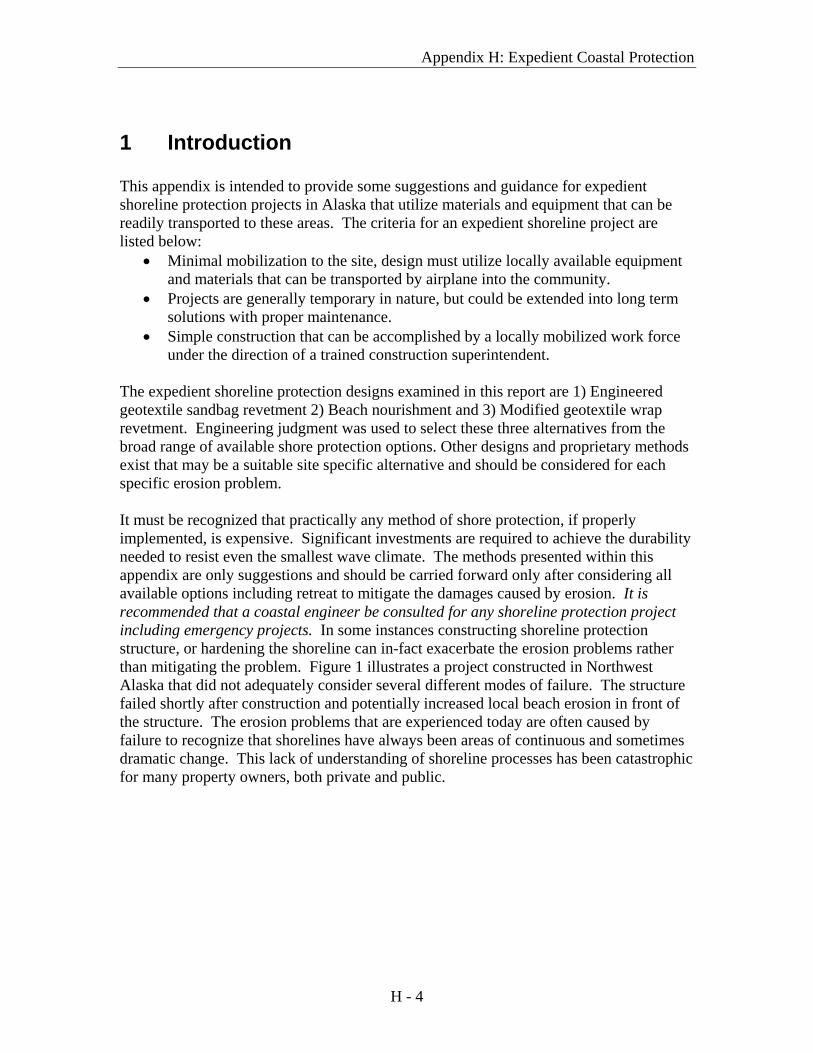
1 Introduction This appendix is intended to provide some suggestions and guidance for expedient shoreline protection projects in Alaska that utilize materials and equipment that can be readily transported to these areas. The criteria for an expedient shoreline project are listed below:
• Minimal mobilization to the site, design must utilize locally available equipment and materials that can be transported by airplane into the community.
• Projects are generally temporary in nature, but could be extended into long term solutions with proper maintenance.
• Simple construction that can be accomplished by a locally mobilized work force under the direction of a trained construction superintendent.
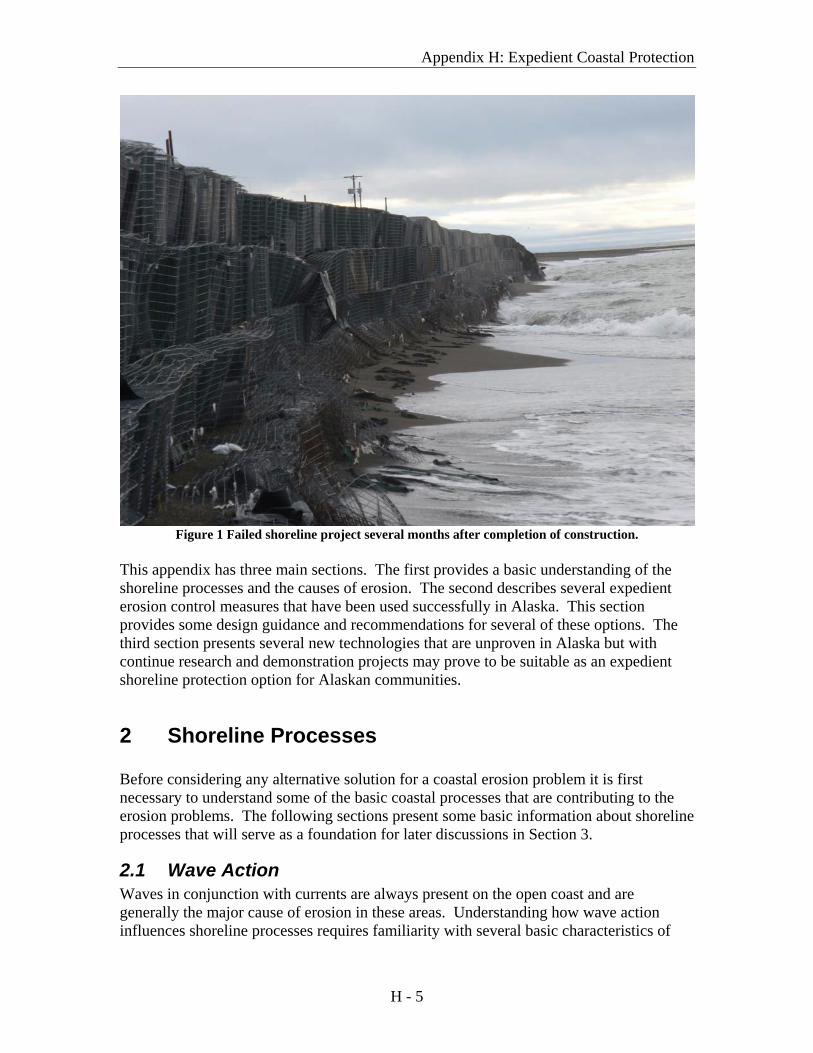
The expedient shoreline protection designs examined in this report are 1) Engineered geotextile sandbag revetment 2) Beach nourishment and 3) Modified geotextile wrap revetment. Engineering judgment was used to select these three alternatives from the broad range of available shore protection options. Other designs and proprietary methods exist that may be a suitable site specific alternative and should be considered for each specific erosion problem. It must be recognized that practically any method of shore protection, if properly implemented, is expensive. Significant investments are required to achieve the durability needed to resist even the smallest wave climate. The methods presented within this appendix are only suggestions and should be carried forward only after considering all available options including retreat to mitigate the damages caused by erosion. It is recommended that a coastal engineer be consulted for any shoreline protection project including emergency projects. In some instances constructing shoreline protection structure, or hardening the shoreline can in-fact exacerbate the erosion problems rather than mitigating the problem. Figure 1 illustrates a project constructed in Northwest Alaska that did not adequately consider several different modes of failure. The structure failed shortly after construction and potentially increased local beach erosion in front of the structure. The erosion problems that are experienced today are often caused by failure to recognize that shorelines have always been areas of continuous and sometimes dramatic change. This lack of understanding of shoreline processes has been catastrophic for many property owners, both private and public.
H - 4
Appendix H: Expedient Coastal Protection
Figure 1 Failed shoreline project several months after completion of construction.
This appendix has three main sections. The first provides a basic understanding of the shoreline processes and the causes of erosion. The second describes several expedient erosion control measures that have been used successfully in Alaska. This section provides some design guidance and recommendations for several of these options. The third section presents several new technologies that are unproven in Alaska but with continue research and demonstration projects may prove to be suitable as an expedient shoreline protection option for Alaskan communities.
2 Shoreline Processes Before considering any alternative solution for a coastal erosion problem it is first necessary to understand some of the basic coastal processes that are contributing to the erosion problems. The following sections present some basic information about shoreline processes that will serve as a foundation for later discussions in Section 3.
2.1 Wave Action Waves in conjunction with currents are always present on the open coast and are generally the major cause of erosion in these areas. Understanding how wave action influences shoreline processes requires familiarity with several basic characteristics of
H - 5
Appendix H: Expedient Coastal Protection
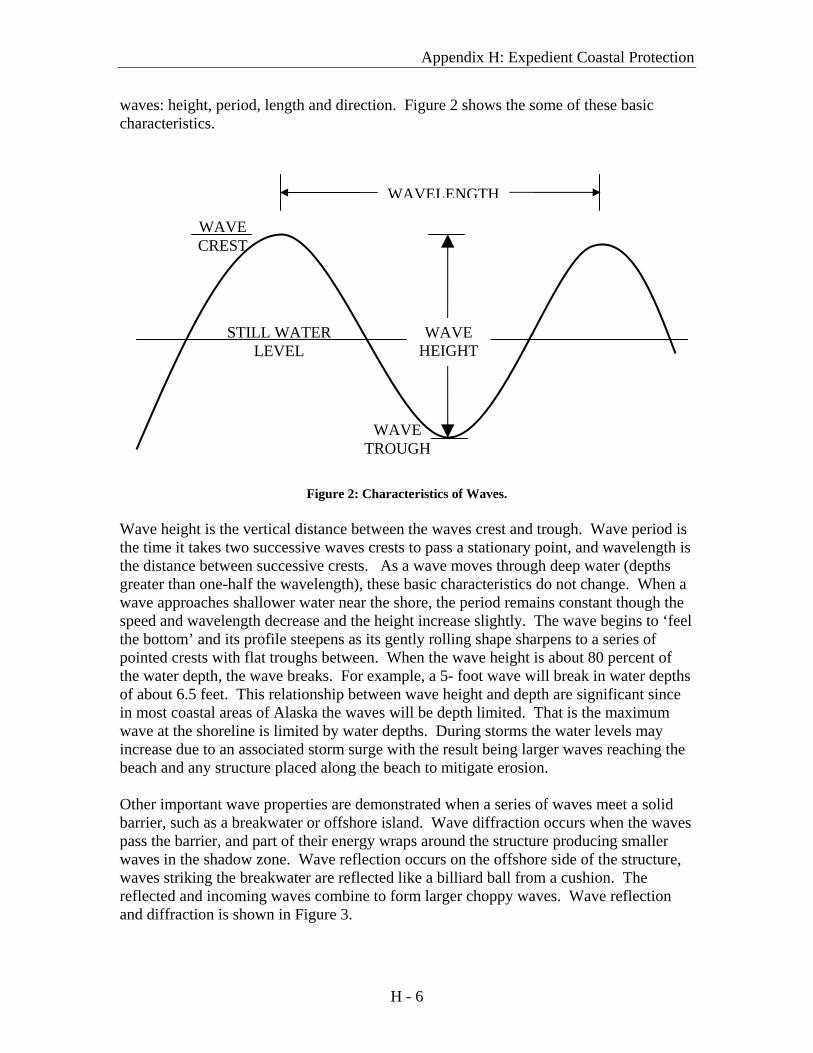
waves: height, period, length and direction. Figure 2 shows the some of these basic characteristics.
WAVE TROUGH
WAVE CREST
STILL WATER LEVEL
WAVE HEIGHT
WAVELENGTH
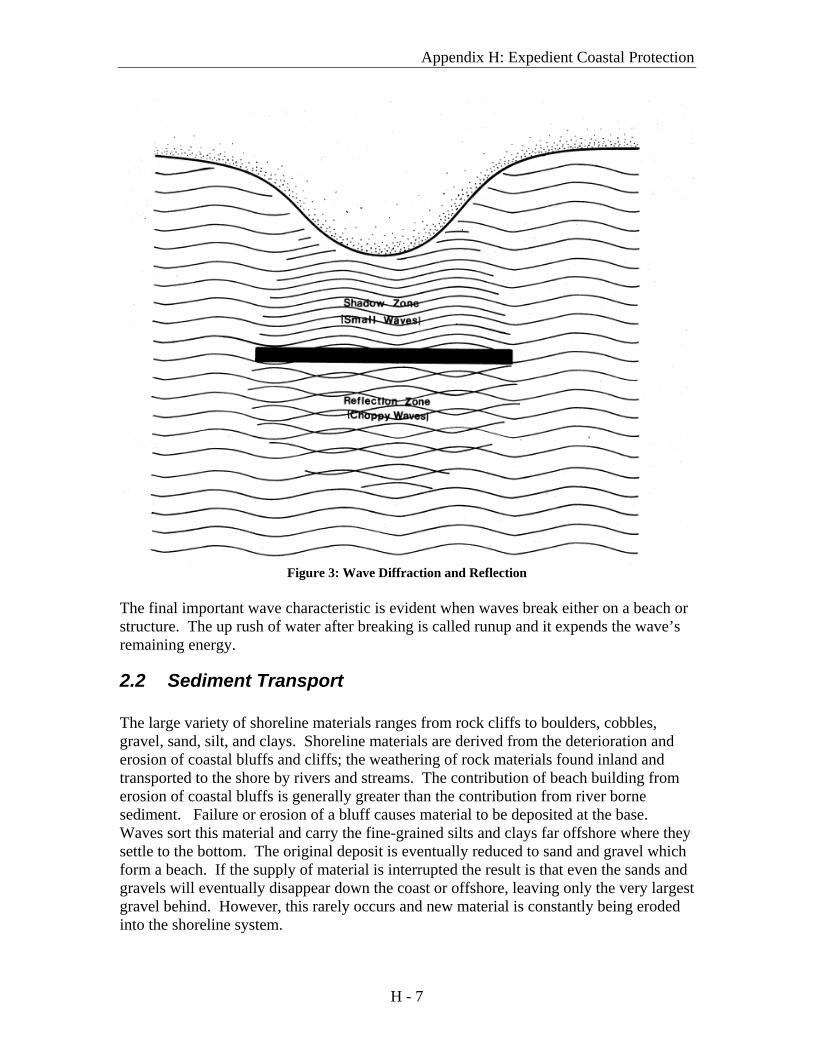
Figure 2: Characteristics of Waves. Wave height is the vertical distance between the waves crest and trough. Wave period is the time it takes two successive waves crests to pass a stationary point, and wavelength is the distance between successive crests. As a wave moves through deep water (depths greater than one-half the wavelength), these basic characteristics do not change. When a wave approaches shallower water near the shore, the period remains constant though the speed and wavelength decrease and the height increase slightly. The wave begins to ‘feel the bottom’ and its profile steepens as its gently rolling shape sharpens to a series of pointed crests with flat troughs between. When the wave height is about 80 percent of the water depth, the wave breaks. For example, a 5- foot wave will break in water depths of about 6.5 feet. This relationship between wave height and depth are significant since in most coastal areas of Alaska the waves will be depth limited. That is the maximum wave at the shoreline is limited by water depths. During storms the water levels may increase due to an associated storm surge with the result being larger waves reaching the beach and any structure placed along the beach to mitigate erosion. Other important wave properties are demonstrated when a series of waves meet a solid barrier, such as a breakwater or offshore island. Wave diffraction occurs when the waves pass the barrier, and part of their energy wraps around the structure producing smaller waves in the shadow zone. Wave reflection occurs on the offshore side of the structure, waves striking the breakwater are reflected like a billiard ball from a cushion. The reflected and incoming waves combine to form larger choppy waves. Wave reflection and diffraction is shown in Figure 3.
H - 6
Appendix H: Expedient Coastal Protection
Figure 3: Wave Diffraction and Reflection
The final important wave characteristic is evident when waves break either on a beach or structure. The up rush of water after breaking is called runup and it expends the wave’s remaining energy.
2.2 Sediment Transport The large variety of shoreline materials ranges from rock cliffs to boulders, cobbles, gravel, sand, silt, and clays. Shoreline materials are derived from the deterioration and erosion of coastal bluffs and cliffs; the weathering of rock materials found inland and transported to the shore by rivers and streams. The contribution of beach building from erosion of coastal bluffs is generally greater than the contribution from river borne sediment. Failure or erosion of a bluff causes material to be deposited at the base. Waves sort this material and carry the fine-grained silts and clays far offshore where they settle to the bottom. The original deposit is eventually reduced to sand and gravel which form a beach. If the supply of material is interrupted the result is that even the sands and gravels will eventually disappear down the coast or offshore, leaving only the very largest gravel behind. However, this rarely occurs and new material is constantly being eroded into the shoreline system.
H - 7
Appendix H: Expedient Coastal Protection
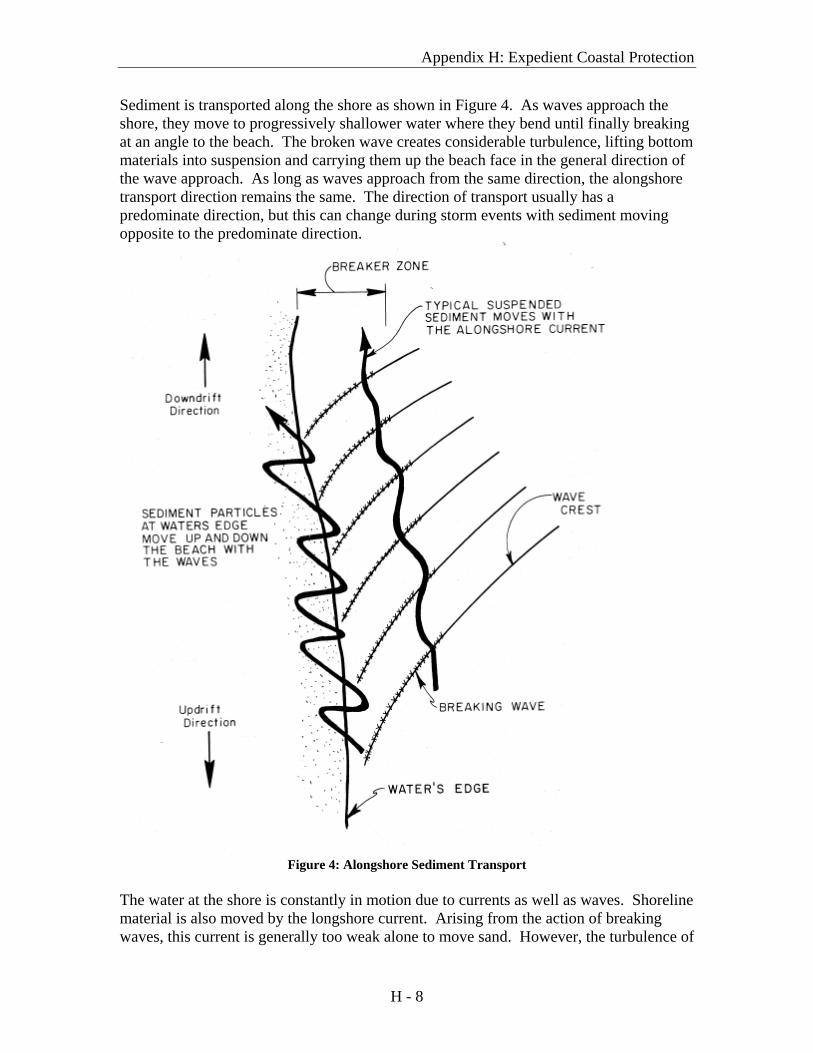
Sediment is transported along the shore as shown in Figure 4. As waves approach the shore, they move to progressively shallower water where they bend until finally breaking at an angle to the beach. The broken wave creates considerable turbulence, lifting bottom materials into suspension and carrying them up the beach face in the general direction of the wave approach. As long as waves approach from the same direction, the alongshore transport direction remains the same. The direction of transport usually has a predominate direction, but this can change during storm events with sediment moving opposite to the predominate direction.
Figure 4: Alongshore Sediment Transport
The water at the shore is constantly in motion due to currents as well as waves. Shoreline material is also moved by the longshore current. Arising from the action of breaking waves, this current is generally too weak alone to move sand. However, the turbulence of
H - 8
Appendix H: Expedient Coastal Protection
breaking waves places sand in suspension and permits longshore current to carry it down drift. Tides produce currents in sheltered bays connected to the open sea. As the tide begins to rise in the ocean, the bay’s water surface elevation lags behind, generating a current into the bay. As the tide falls, the ocean drops more quickly so that the bay surface becomes higher and current flows out of the bay. Tidal currents are generally not strong enough to cause erosion problems except in the throat area of tidal inlets connecting bays to the ocean.
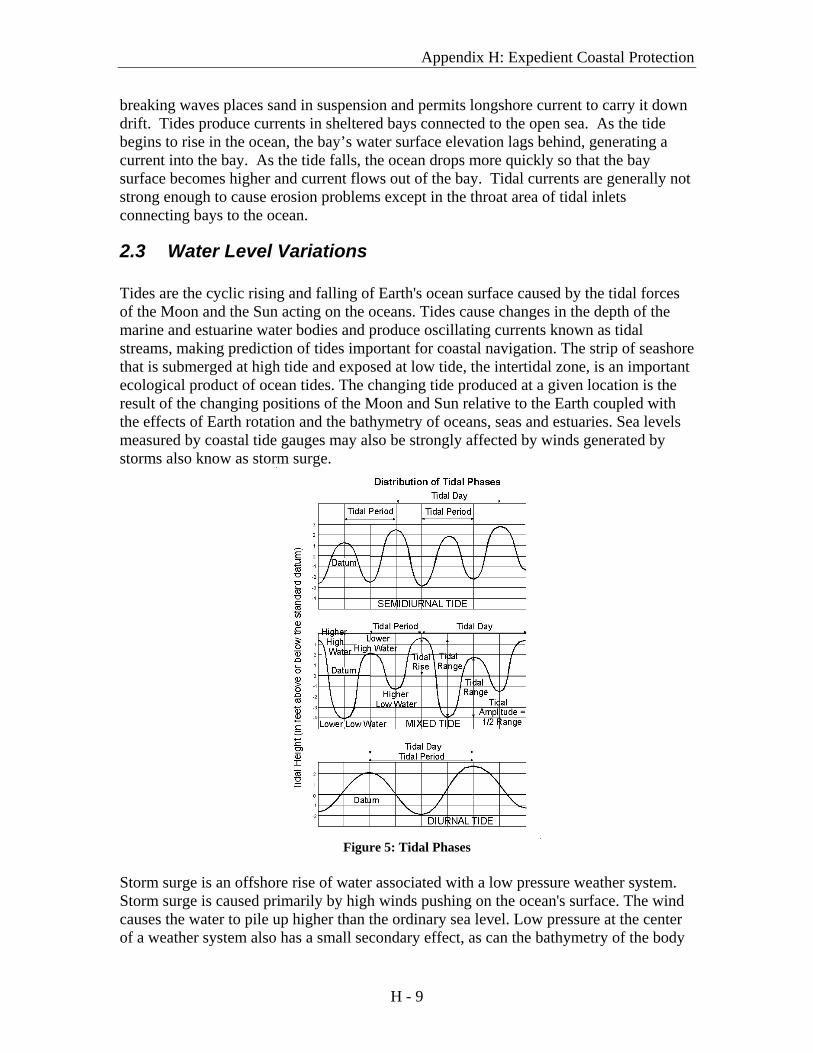
2.3 Water Level Variations Tides are the cyclic rising and falling of Earth's ocean surface caused by the tidal forces of the Moon and the Sun acting on the oceans. Tides cause changes in the depth of the marine and estuarine water bodies and produce oscillating currents known as tidal streams, making prediction of tides important for coastal navigation. The strip of seashore that is submerged at high tide and exposed at low tide, the intertidal zone, is an important ecological product of ocean tides. The changing tide produced at a given location is the result of the changing positions of the Moon and Sun relative to the Earth coupled with the effects of Earth rotation and the bathymetry of oceans, seas and estuaries. Sea levels measured by coastal tide gauges may also be strongly affected by winds generated by storms also know as storm surge.
Figure 5: Tidal Phases
Storm surge is an offshore rise of water associated with a low pressure weather system. Storm surge is caused primarily by high winds pushing on the ocean's surface. The wind causes the water to pile up higher than the ordinary sea level. Low pressure at the center of a weather system also has a small secondary effect, as can the bathymetry of the body
H - 9
Appendix H: Expedient Coastal Protection
of water. It is this combined effect of low pressure and persistent wind over a shallow water body which is the most common cause of storm surge flooding problems. The term "storm surge" often refers to the rise of water associated with the storm, plus tide, wave run-up, and freshwater flooding. When referencing storm surge height, it is important to clarify the usage, as well as the reference point. Typically storm surges in Alaska are referenced to Mean Lower Low Water which is the average of the lowest tide recorded each day. In addition to driving up the water surface the strong winds associated with a storm surge often generate large waves, which tend to pile water on the shore as they break, raising the stillwater level further. Generally in areas of Northern Alaska the increase in water level can be the primary indicator of storm severity. Typical water level increases associated with storms along a majority of Alaska’s coast are on the order of 2 to 3 feet. However a storm surge may raise water levels by ten feet or more above the highest tides normal for a particular coastal zone. References identified in section 2.4 identify areas susceptible to large storm surges. High water levels can result in flooding of low-lying coastal areas and shift the wave breaking zone landward so that waves directly attack coastal properties and structures. Higher water levels also allow for larger waves to reach the beach, increasing the erosion forces at work along the beach or bluff.
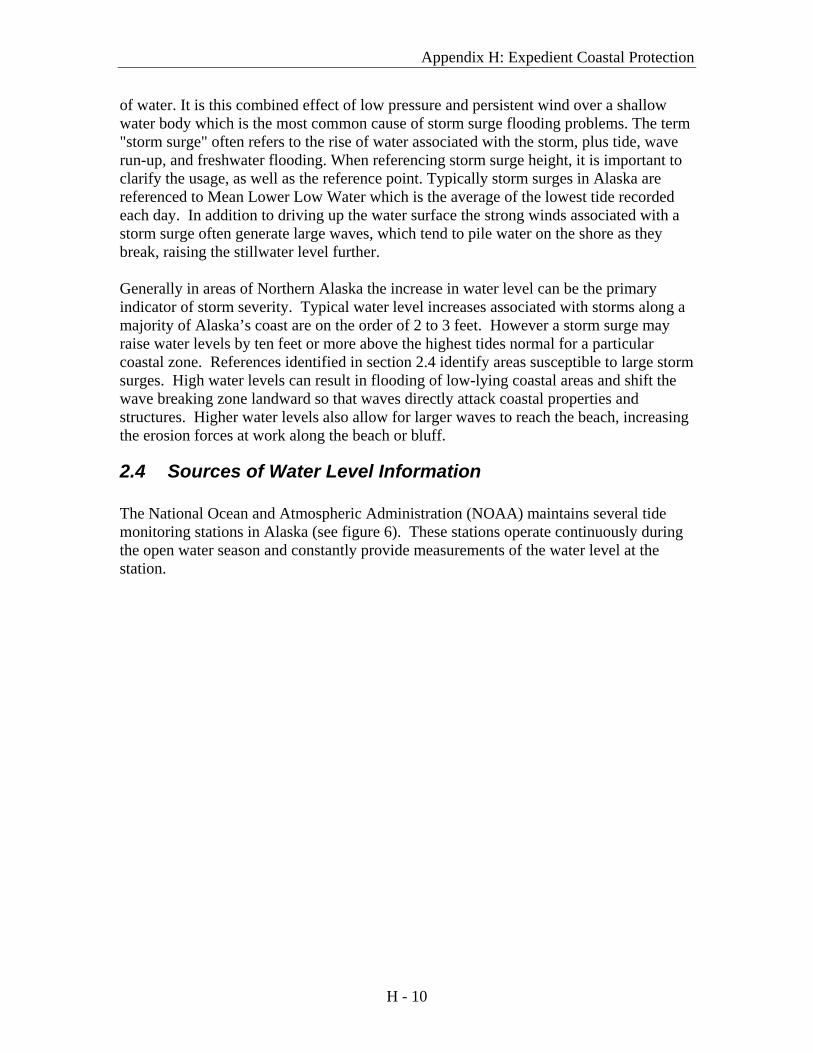
2.4 Sources of Water Level Information The National Ocean and Atmospheric Administration (NOAA) maintains several tide monitoring stations in Alaska (see figure 6). These stations operate continuously during the open water season and constantly provide measurements of the water level at the station.
H - 10
Appendix H: Expedient Coastal Protection
Figure 6: NOAA Water Level Stations
Data from these sites are available in near-real time from NOAA’s Tides Online website:
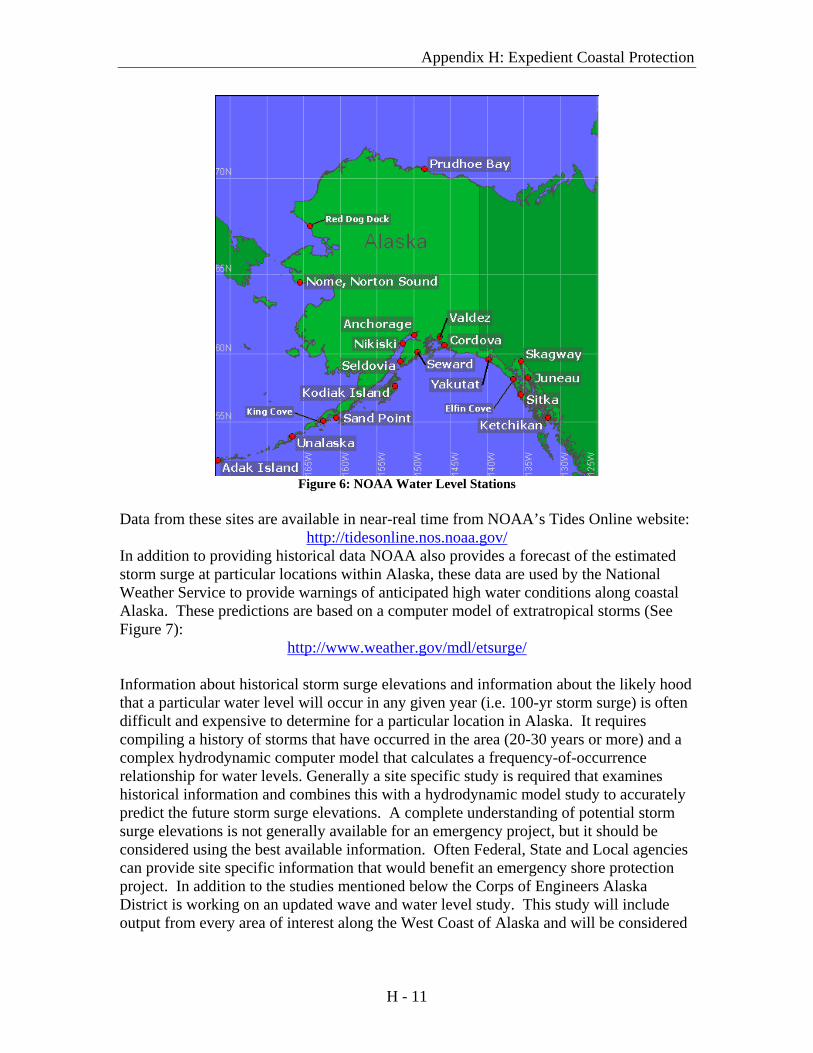
http://tidesonline.nos.noaa.gov/ In addition to providing historical data NOAA also provides a forecast of the estimated storm surge at particular locations within Alaska, these data are used by the National Weather Service to provide warnings of anticipated high water conditions along coastal Alaska. These predictions are based on a computer model of extratropical storms (See Figure 7):
http://www.weather.gov/mdl/etsurge/ Information about historical storm surge elevations and information about the likely hood that a particular water level will occur in any given year (i.e. 100-yr storm surge) is often difficult and expensive to determine for a particular location in Alaska. It requires compiling a history of storms that have occurred in the area (20-30 years or more) and a complex hydrodynamic computer model that calculates a frequency-of-occurrence relationship for water levels. Generally a site specific study is required that examines historical information and combines this with a hydrodynamic model study to accurately predict the future storm surge elevations. A complete understanding of potential storm surge elevations is not generally available for an emergency project, but it should be considered using the best available information. Often Federal, State and Local agencies can provide site specific information that would benefit an emergency shore protection project. In addition to the studies mentioned below the Corps of Engineers Alaska District is working on an updated wave and water level study. This study will include output from every area of interest along the West Coast of Alaska and will be considered
H - 11
Appendix H: Expedient Coastal Protection
the best available source for storm surge elevations and design wave height parameters for this area of Alaska.
Figure 7: NOAA Storm Surge Prediction Locations.
Sources of information about site specific Storm Surges Elevations in Alaska include: 2008. National Weather Service, Alaska Region Headquarters.
http://www.arh.noaa.gov/ 2008. Flood Hazard Data Sheets for Communities in Alaska.
http://www.poa.usace.army.mil/en/cw/fld_haz/communities.htm Wise, James, Albert Comiskey, and Richard Becker, Jr. 1981. Storm Surge Climatology
and Forecasting in Alaska. Arctic Environmental Information and Data Center. 2005. Regional Tide and Storm-Induced Water Level Prediction Study for the West
Coast of Alaska (DRAFT). USACE – Coastal and Hydraulics Laboratory. April 2005. Blier, Warren, Stanley Keefe, Wilson A. Shaffer, and Sung C. Kim. 1997. Storm Surges
in the Region of Western Alaska. Monthly Weather Review. American Meteorological Society. Vol. 125. No. 12. pp. 3094-3108.
H - 12
Appendix H: Expedient Coastal Protection
Bureau of Land Management (BLM). 1967. Flood Hazard Report Map. Prepared by USACE for BLM. A copy of the map can be viewed at the Archives Section of the University of Alaska Anchorage Library.
Mason, Owen, David Salmon, and Stefanie Ludwing. 1996. The Periodicity of Storm
Surges in the Bering Sea from 1898 to 1993, Based on Newspaper Accounts. Climatic Change 34: 109-123.
3 The Erosion Problem
3.1 The Importance of Shoreform Shoreforms are the distinct configuration which marks the transition between land and sea. Throughout Alaska the basic shoreforms that predominate are bluffs; gently sloping plains or sand beaches often marked by the presence of permafrost or perennially frozen ground. Bluff shorelines are generally composed on sediments such as clay, sand, gravel, or erodible rock. The most prevalent causes of bluff erosion are toe scour by wave action, surface runoff and drainage and infiltration problems that lead to slope instability failures. In Alaska bluff erosion is further complicated in some areas due to the presence of permafrost, or perennially frozen soils. As waves scour the base of the bluff, this creates a niche into the lower portion of the frozen bluff material exposing the bluff to warmer temperatures resulting in the upper portions of the bluff melting and slumping downward, sometimes in large blocks. This material is then carried away by normal wave action. In the absence of permafrost the erosion of the bluff at the base causes the bluff to become unstable due to the increases in the slope angle. This instability causes movement of material down the slope and then subsequently carried away by waves. When evaluating conditions at a site, it is necessary to determine which of the above processes is primarily responsible for the erosion problem. Erosion problems that are not aggravated by toe undercutting should be treated using established practices for slope stability. Typical solutions include horizontal or vertical drains, slope re-grading, surface drainage controls and buttressing the toe of the slope. Wave action at the toe which undermines the bluff can be treated with a shore protection structure. The slope of the offshore bottom is important to wave action on a bluff. If the offshore slopes are steep, deep water is close to shore and more severe wave activity is possible making maintenance of a protective beach structure more difficult. Flat offshore slopes result in shallower water near the shoreline which reduces heavy wave action at the bluff and provides for more protective beaches. An example of bluff erosion in Alaska would be certain beaches at Barrow and Shismaref; both communities are underlain by permafrost. Erodible plains and sand beaches are also common beach forms throughout Alaska. The plains are composed of silty material that may be frozen, the sand beaches are primarily composed of sands and gravels that gently rise from the water’s edge and seldom attain a height of more than five or ten feet above the still water level. Examples of sandy
H - 13
Appendix H: Expedient Coastal Protection
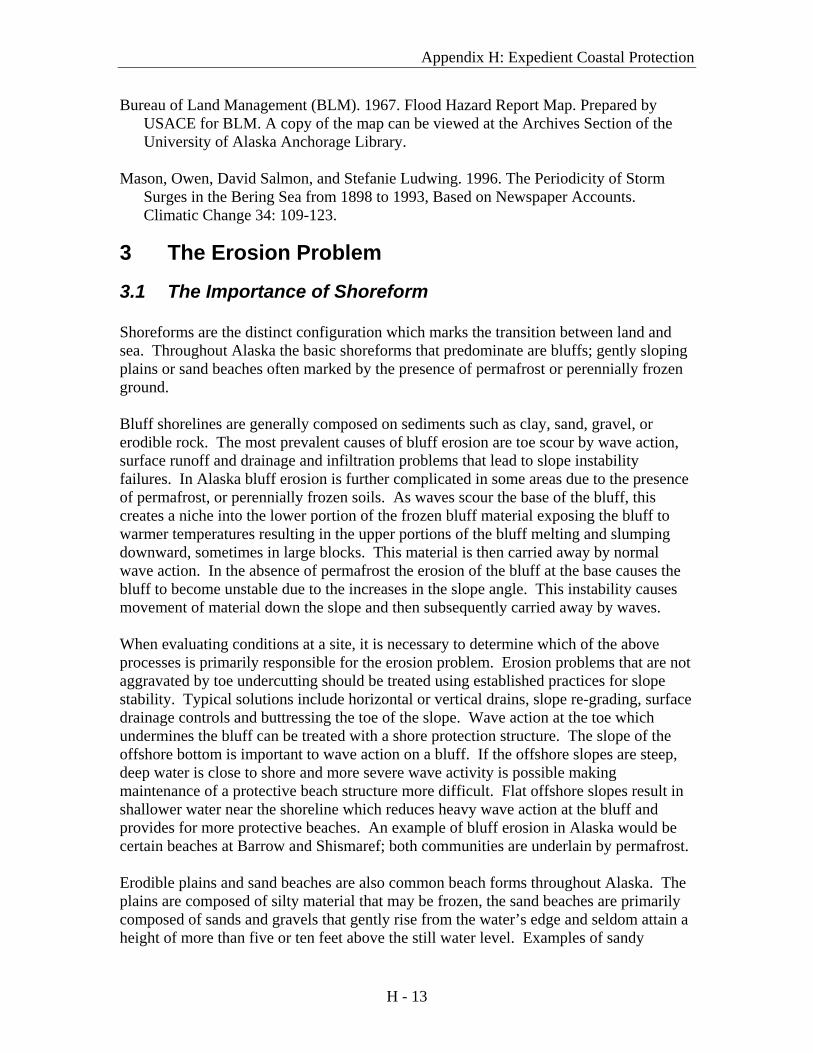
beaches in Alaska are Wales and Kivalina. Both communities lie on low dunes with relatively low gradient beaches in front of the communities that dampen the wave energy. Figure 8 shows an idealize beach profile. Waves approach from offshore, finally breaking and surging up the foreshore. Above the nearshore zone, the profile flattens considerable to form a broad beach berm which is not reached by normal wave activity. In the case of Kivalina the beach berm is backed by a low scarp on the leading edge of barrier island sand dunes.
Figure 8: An idealized Beach Profile
The beach profile will reach some equilibrium shape in response to normal water levels, wave activity and a steady supply of sediment that equals sediment transport in the region. This equilibrium will be disturbed and erosion will begin if the long-term water level rises, predominant wave heights increase or the sediment supply is reduced. During periods of either increased water levels or wave heights, the sand above the low water level is eroded, carried offshore, and deposited in a bar. Eventually, enough sand collects to effectively decrease the depths and cause storm waves to break farther offshore. This reduces wave action on the beach, and helps to re-establish the long term equilibrium. At sites along the open coast the long period swells that occur between storms return sand to the beach after storms. In Northern portions of Alaska the summer months are generally calmer periods where beach building occurs and a distinctive ‘summer’ beach profile is established that is higher than the ‘winter’ storm beach profile. Fall is often marked by large storms that move beach material offshore and develop the lower ‘winter’ beach profile. It is important to understand this dynamic process and realize that natural beaches are dynamic over the course of a calendar year. Perceived erosion that occurs each fall can very quickly be rebuilt the following summer. Often an analysis of historical aerial photographs can be used to determine if the area is experiencing erosion over a multi-year time scale. When examining beach information from different years it is often necessary to consider what time of the year the survey information or aerial photographs were taken so that the natural beach process can also be considered in the analysis. In
H - 14
Appendix H: Expedient Coastal Protection
some cases additional information must be considered to determine the likelihood for future erosion. For instance after a 100 year storm has occurred aerial photo interpretation might indicate that future erosion will occur at the calculated time averaged rate based on the date of photographs when in fact the beach may recover (possibly over decades) to its original condition.
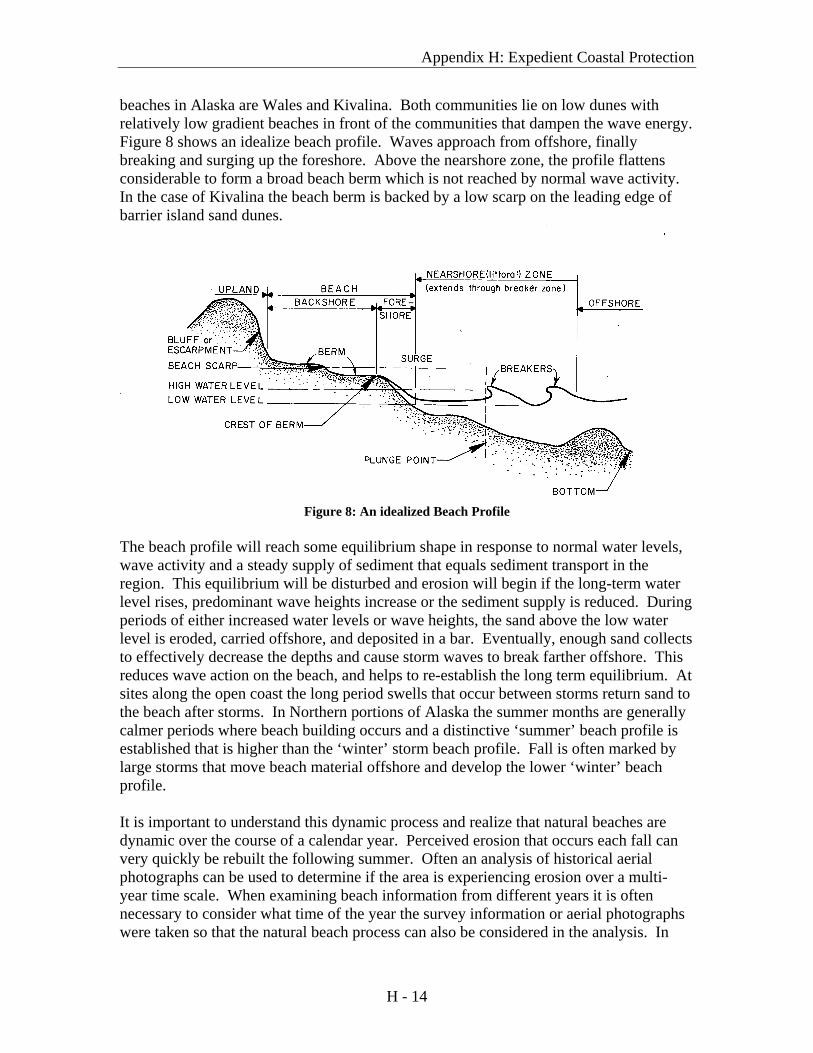
3.2 Erosion in Response to Sea Level Rise Recent climate research has documented global warming during the 20th Century, and has predicted either continued or accelerated global warming for the 21st Century and possibly beyond (IPCC 2007a). One impact of continued or accelerated climate warming is thus continued or accelerated rise of global mean sea level. Global Sea level rise over the previous 100 years has been approximately 0.5 to 1.0 feet. Current best estimates are that global sea level rise will be on the order of 1.0 to 5.0 feet based on various predictive model estimates. The rise in sea level is combined with either subsidence or uplift of the adjacent land to calculate the relative change in sea level at a particular location. Some areas of Southeast Alaska are experiencing tectonic uplift at a rate faster than sea level rise, resulting in a relative lowering of the sea level. It is important to consider the relative change in sea level for a particular location. While relative sea level rise will contribute to higher storm surges in the future, another important implication is an increase in coastal erosion associated with higher sea levels (Bruun, 1962). Figure 9 below shows the general concept that as sea level rises there is a corresponding retreat of the shoreline. The shorelines erode to reestablish an equilibrium profile. This idea of shoreline retreat can be thought of as a global idea with the potential for individual sites behaving much differently than the conceptual model.
Figure 9: The Bruun Rule of shoreline retreat (After Cooper and Pilkey, 2004)
Communities should consider the possibility of increased shoreline erosion in the future and that an expedient erosion protection project may only provide near team erosion protection. Proper planning and consideration of all alternatives should continue beyond a near term coastal protection project.
H - 15
Appendix H: Expedient Coastal Protection
3.3 The Effects of Erosion Wave action is the most obvious cause of erosion. Waves keep moving beach material down the beach in the down drift direction. The long standing theory is that as long as the equal quantities of material are transported from the up drift direction, the shoreline should remain stable. This will still generally be true in areas that have a beach shore form; however this may not be the case in areas that have bluff shoreforms underlain by permafrost. Much of the beach material supplied to shorelines results from up drift erosion. Therefore, if large amounts of up drift shoreline are suddenly protected, material is lost the sediment transport system. This decreases the supply to the down drift shores, resulting in erosion problems unless they are protected. Determining the transport direction is necessary in some cases but usually difficult because of variations in wave directions throughout the year. Summer winds and waves may be primarily from one direction, while winter storm winds may come from an entirely different quadrant. When winds and waves change direction, the transport direction also changes. The most obvious and noticeable effect of erosion is the loss of shorefront property. Less apparent are the increase in sedimentation caused by erosion in adjoining areas since all materials eroded from a shoreline at one point are eventually deposited elsewhere. It is likely this will occur in deeper water such as a navigation channel crossing or closely paralleling the shore. The first step in evaluating the effect of erosion is to examine the long-term erosion rate. The key to this step is to identify reliable historical data on past shoreline positions. Possible sources of data include a time sequence of aerial photographs, shoreline maps, property plats and previous surveys. If two shoreline positions are identified with many years between the observations (say 25 or more) the average annual rate of erosion can be approximated by dividing the total amount of retreat by the number of years between observations.
4 Options for Expedient Shoreline Protection Shoreline protection is used to (1) reduce storm damage to the shore caused by large waves and/or coastal flooding; (2) to mitigate erosion caused by long-term shoreline recession or erosion caused by adjacent projects. Five general categories of engineering response to shoreline erosion are listed below:
• ‘Draw the Line’ or Armor the Shoreline with Protection • ‘Slow the Loss’ or Moderation • ‘Fill it up’ or Restore the Shoreline • ‘Live with it’ or Adapt to a Receding Shoreline • ‘Abandon’ or Do Nothing
H - 16
Appendix H: Expedient Coastal Protection
Implementation of the shoreline protection is usually in the form of one of the above or a combination of the above responses. An expedient shoreline protection project falls into the same general categories, but can further be defined as:
A shoreline protection project that can be constructed in one summer season using a locally available labor and equipment with materials that can be transported using routine methods such as scheduled air service or regular barge service. Expedient protection should not be considered low cost protection. Any shore protection structure generally requires a substantial investment.
As with all coastal protection projects careful consideration should be given to the ‘Live with it’ and ‘abandon’ options. These two options recognize long-term erosion consequences and accommodate the expected erosion by imposing restrictions on new development, developing warning/evacuation procedures and retreating systematically from the shoreline. The ‘Live with it’ and ‘abandon’ options are also decision-aids that can be used to evaluate different alternatives. The decision to retreat is largely based on the cost to provide adequate protection versus the cost to move structures to an area outside of the expected erosion potential. In some cases it may be less expensive to relocate endangered structures than to heavily invest in a shore protection project. If the erosion rate is slow and steady a systematic retreat can be planned and implemented that follows the same timeline as the normal project cycle process in a community. As infrastructure in a community requires maintenance or re-construction considerations for potential erosion could be incorporated in the projects design life (i.e. 20-50 years). An examination of potential erosion should be considered in all large community projects. Expedient shoreline protection projects are in response to ongoing erosion that requires action in the near term. These projects usually fall in the ‘Draw the Line’ or ‘Slow the Loss’ category of shore protection projects. The following sections present several options available for expedient shoreline protection. This information should be considered a guide that can assist property owners and communities with the planning and implementation of a shoreline protection project. The key design constraints that should be considered in detail prior to undertaking any shoreline protection project are:
Table 1: Shoreline Protection Project Design Constraints • Scientific and Engineering Understanding of Nature • Economic • Environmental • Institutional, Political, Social and Legal • Aesthetics
4.1 Fundamentals of a successful Shoreline Protection Project Several fundamental elements are required for a successful shoreline protection project. These requirements are outlined briefly below and explained in more detail in each respective section. Consultation with an engineer experienced with coastal design is a
H - 17
Appendix H: Expedient Coastal Protection
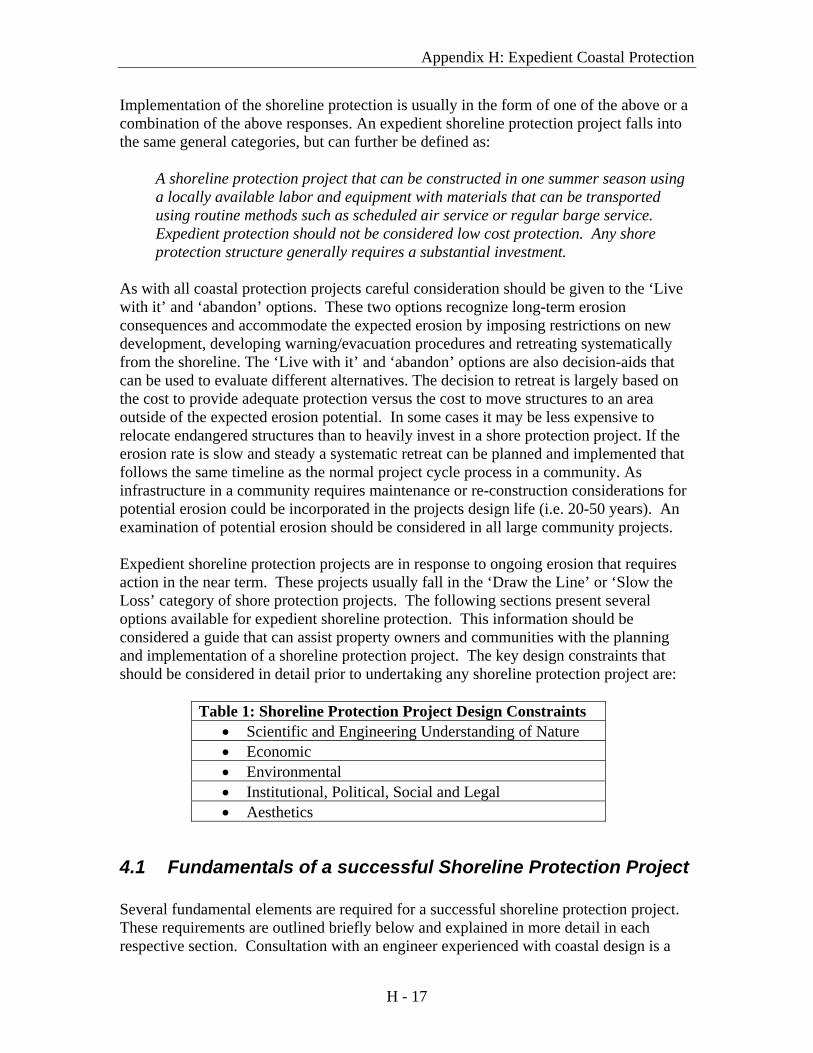
pre-requisite for any shore protection project; this is required through the regulatory permitting process. Section 4 of this report provides detailed information that can assist a community when they are considering and expedient erosion protection project. The fundamentals of coastal erosion project are presented as well as several alternatives for expedient shoreline protection. Strength Shore protection structures must be strong to withstand wave attack. This is usually achieved by using massive components that cannot be dislodged by waves, or smaller components that interlock to form a large mass. The problem with small interlocking units is that, once damage occurs, the structure generally progress to complete failure rapidly. Flexibility Flexibility if desired because it allows structures to compensate for settlement, consolidation and toe scour. The revetment shown in figure 1 is not flexible and rapidly deforms once any movement occurs to the point of complete failure. Toe Protection Any coastal project built on sands and gravels may be susceptible to damage from scour in front of the structure. Toe protection is the supplemental armoring of the beach surface in front of a structure which prevents waves from scouring or undercutting the structure. Failure to provide toe protection invites an almost certain failure. Scour at the toe of a shoreline protection project is one of the leading causes of failure. Despite considerable research there is very little guidance for estimation of the maximum scour depth or planform extents of scour in front of a sloping revetment structure; however, the scour potential for a sloping rock revetment is generally considered low. Maximum scour at the toe of a sloping structure is expected to be somewhat less than scour for a vertical wall at the same location and under the same wave conditions. Generally structures with milder slopes and greater porosity will experience less wave-induced scour. Shore protection structures that have vertical or near vertical faces should consider the increase in scour that will likely occur as opposed to a sloping structure. Figure 10 shows an example of a sloping structure. Gabions walls are often built in a stair step fashion that results in short 2 to 3 foot vertical faces that reflect wave energy and increase toe scour. Using the same materials a gabion revetment can be constructed on a slope, providing additional toe protection.
H - 18
Appendix H: Expedient Coastal Protection
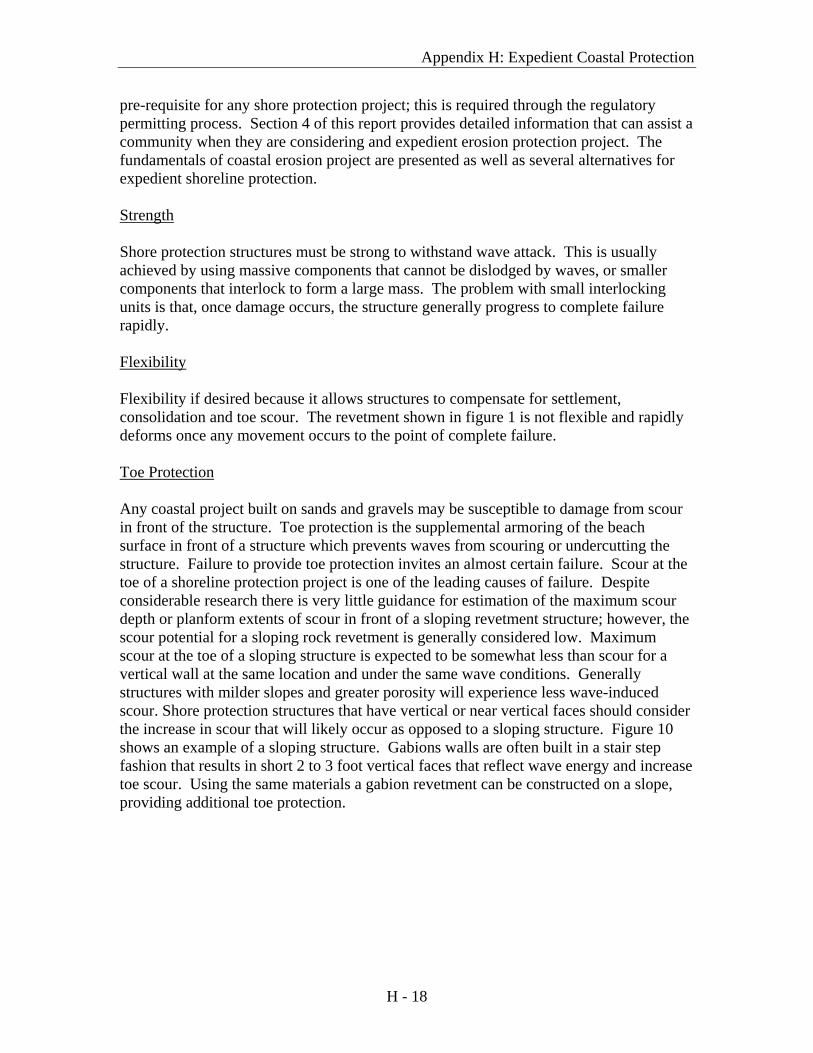
Figure 10 Example of a Gabion Revetment. Sloped Gabion revetments are preferred to a vertical gabion wall. Sloped structures reflect less wave energy resulting in less toe scour making them more stable. Filtering Filtering, one of the most important technical design details of shore protection structure is probably the most neglected detail. This is particularly true of emergency or expedient shore protection structures. Inadequate filtering leads to more failures than any other cause. The consequences of not providing proper filtering are illustrated in Figure 11.
Figure 11: Inadequate Filtering (Left Side) Proper Filter Design (Right Side)
Shore protection structures that do not have adequate filtering included in the design will in essence ‘sink’ in the beach or shoreline they are protecting and allow erosion to continue to occur. There are two primary methods to provide adequate filtering. The first
H - 19
Appendix H: Expedient Coastal Protection
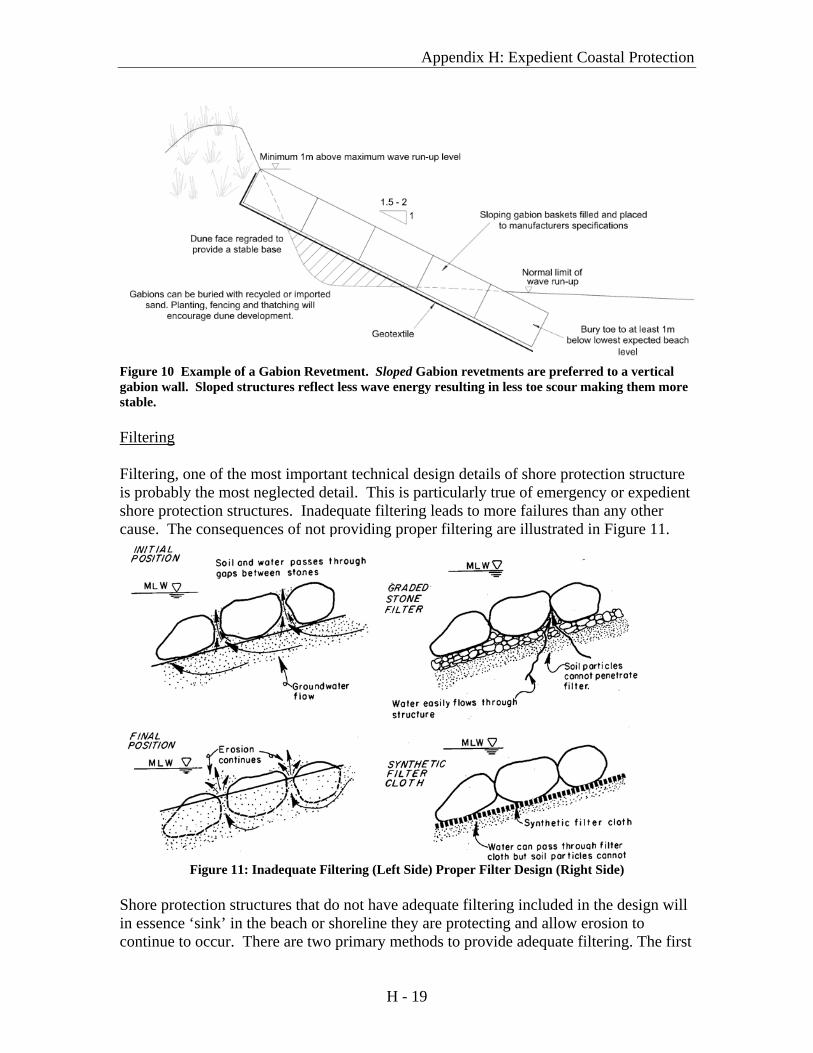
is through the use of properly sized rock layers that get progressively smaller. Several layers of progressively smaller rock are placed upon the existing beach material. Each layer ‘traps’ the layer beneath it effectively preventing the existing beach material from passing up through the structure. The second primary method to Flank Protection Flank or end protection is important because any shore protection structure, such as a rock revetment is vulnerable as erosion continues around its ends. If the ends of a structure are not adequately protected the, the land behind the ends of structure could be eroded and lead to a failure at these ends. Typically return sections, a section of the revetment or structure that is angled landward, are provided to prevent failure of the revetment ends as erosion continues. Providing proper return end sections can easily be constructed when protecting beach shorelines or low bluffs; however, when high bluffs are protected it is often difficult to provide adequate end sections, in these cases the revetment can be continuously lengthened as erosion continues. Structure Height Waves breaking against a vertical or an inclined structure will run up to an elevation higher than the calm water level just offshore. Smooth structures experience higher runup than rough stone slopes. Also steeper structures experience higher runup than less steep structures. It is counter intuitive, but a vertical structure can actually have much higher runup than a sloping structure. A rough estimate for wave runup on a vertical structure would be twice the wave height (H) a similar estimate for porous rock would be 1.25 times the wave height. Figure 12 shows the wave runup in relation to the wave height. Generally speaking waves runup the beach and structures to a point higher than the top of the wave prior to breaking.
Figure 12: Wave Runup
In addition to adequately address the fundamental elements listed above shoreline protection projects in Alaska consider the Arctic factors: Low temperatures (-50ºC), short open water season to construct a project (typically 90 to 120 days), a lack of native
H - 20
Appendix H: Expedient Coastal Protection
construction materials, a lack of baseline engineering data to design structures and extremely high costs to import both construction labor and materials.
4.2 Engineered Sandbag Revetment Engineered sandbag revetments have been used on the Northslope of Alaska for over 30 years. These structures fall into the category of ‘soft armor’ which refers to the use of geotextile containers filled with local sediment to provide slope protection. There are a wide range of geotextile shore protection options available, many of these are proprietary solutions such as the Geotube© or longard tube which are massive units filled with sand. Experience has indicated that these large units are susceptible to puncture from ice and debris damage and should generally only be considered for areas of shallow water, low tidal range and low wave energy. An early USACE report on low cost shore protection recommended that longard tubes only be used in areas with wave heights less than five feet are expected. One Geotube© structure has been constructed in Alaska on the lagoon side of a barrier island, the ideal location for this type of soft structure. The Alaskan oil industry, in order to meet the need for a shore protection system that offered moderate cost and used local materials developed the engineered sandbag revetment using large gravel-filled bags. This system has been proven through years of experience that it is well suited for Arctic service. Using individual bags provides for residual protection should damage to individual bags occur resulting in a non-catastrophic mode off failure as opposed to the larger monolithic structures. Given the lack of engineering design data available and the nature of an expedient project this inherent residual strength is important for causes when the design conditions have been underestimated.
Pros • Materials can be transported by airplane • Lower cost (not necessarily Low Cost) • Minimal Construction Skill • No specialized equipment required
Cons • Lack of Design Guidance • Data and knowledge base is proprietary • Semi-permanent, REQUIRES annual maintenance • Susceptible to vandalism, ice and woody debris punctures • Durable engineered sandbags are expensive (~$200 ea., 2008)
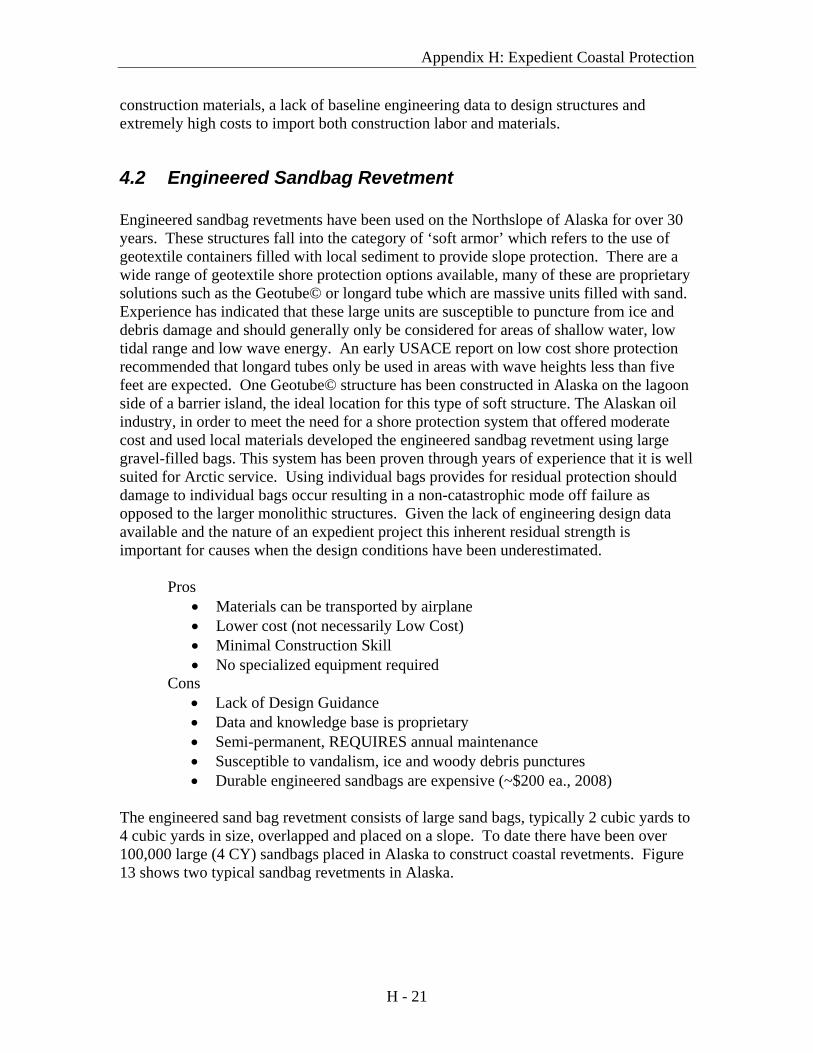
The engineered sand bag revetment consists of large sand bags, typically 2 cubic yards to 4 cubic yards in size, overlapped and placed on a slope. To date there have been over 100,000 large (4 CY) sandbags placed in Alaska to construct coastal revetments. Figure 13 shows two typical sandbag revetments in Alaska.
H - 21
Appendix H: Expedient Coastal Protection
Figure 13: Photos August 2000 (Left) West Dock 4 cubic yard sandbag revetment. Constructed in 1993, no maintenance has been performed. Lower strength polypropylene bags, tensile strength 500 lbs per inch. (Right) West Dock 4 CY revetment constructed in 2003. These bags use a stronger 1100 lbs per inch polyester fabric. Coastal Frontiers is currently extending this revetment around the end of the West Dock Causeway.
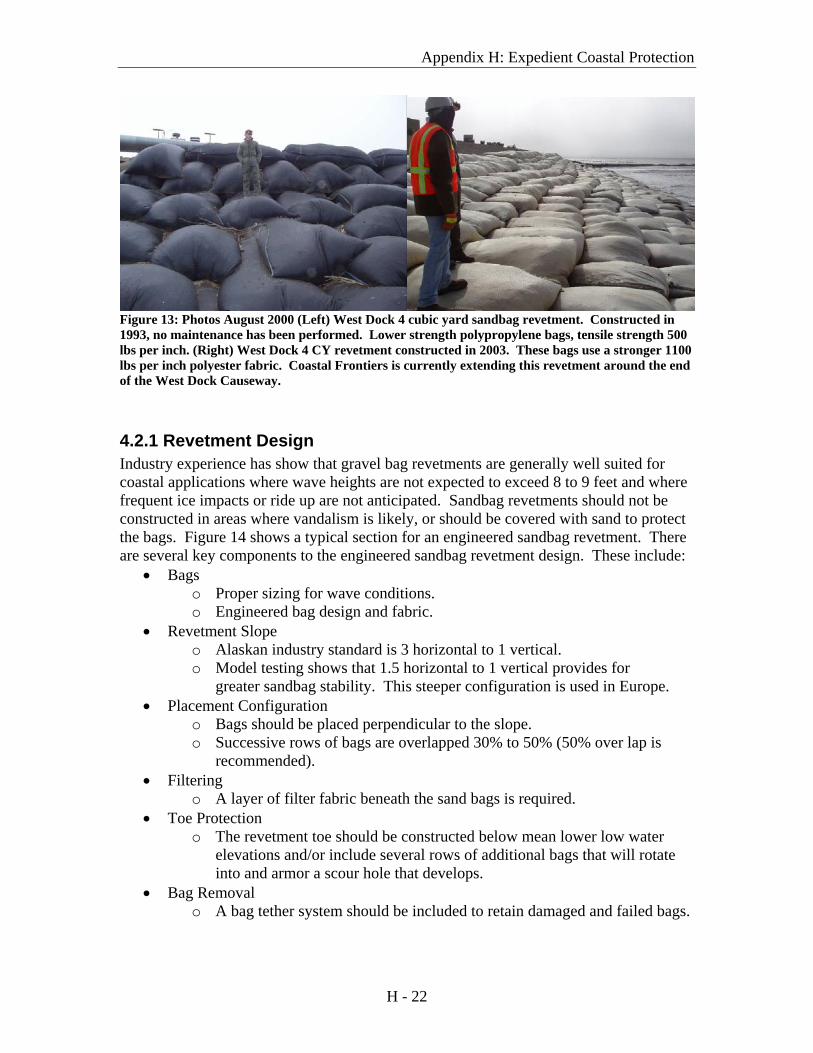
4.2.1 Revetment Design Industry experience has show that gravel bag revetments are generally well suited for coastal applications where wave heights are not expected to exceed 8 to 9 feet and where frequent ice impacts or ride up are not anticipated. Sandbag revetments should not be constructed in areas where vandalism is likely, or should be covered with sand to protect the bags. Figure 14 shows a typical section for an engineered sandbag revetment. There are several key components to the engineered sandbag revetment design. These include:
• Bags o Proper sizing for wave conditions. o Engineered bag design and fabric.
• Revetment Slope o Alaskan industry standard is 3 horizontal to 1 vertical. o Model testing shows that 1.5 horizontal to 1 vertical provides for
greater sandbag stability. This steeper configuration is used in Europe. • Placement Configuration
o Bags should be placed perpendicular to the slope. o Successive rows of bags are overlapped 30% to 50% (50% over lap is
recommended). • Filtering
o A layer of filter fabric beneath the sand bags is required. • Toe Protection
o The revetment toe should be constructed below mean lower low water elevations and/or include several rows of additional bags that will rotate into and armor a scour hole that develops.
• Bag Removal o A bag tether system should be included to retain damaged and failed bags.
H - 22
Appendix H: Expedient Coastal Protection
Figure 14: Engineered Sandbag Revetment Typical Section
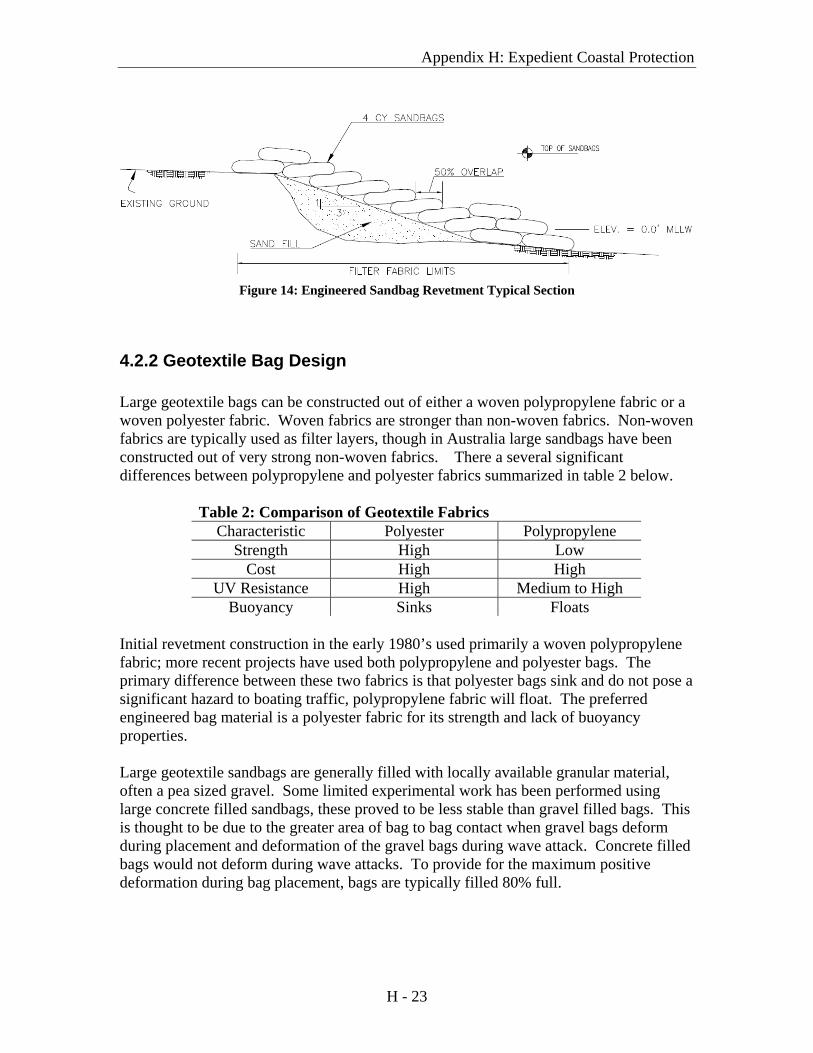
4.2.2 Geotextile Bag Design Large geotextile bags can be constructed out of either a woven polypropylene fabric or a woven polyester fabric. Woven fabrics are stronger than non-woven fabrics. Non-woven fabrics are typically used as filter layers, though in Australia large sandbags have been constructed out of very strong non-woven fabrics. There a several significant differences between polypropylene and polyester fabrics summarized in table 2 below.
Table 2: Comparison of Geotextile Fabrics
Characteristic Polyester Polypropylene Strength High Low
Cost High High UV Resistance High Medium to High
Buoyancy Sinks Floats
Initial revetment construction in the early 1980’s used primarily a woven polypropylene fabric; more recent projects have used both polypropylene and polyester bags. The primary difference between these two fabrics is that polyester bags sink and do not pose a significant hazard to boating traffic, polypropylene fabric will float. The preferred engineered bag material is a polyester fabric for its strength and lack of buoyancy properties. Large geotextile sandbags are generally filled with locally available granular material, often a pea sized gravel. Some limited experimental work has been performed using large concrete filled sandbags, these proved to be less stable than gravel filled bags. This is thought to be due to the greater area of bag to bag contact when gravel bags deform during placement and deformation of the gravel bags during wave attack. Concrete filled bags would not deform during wave attacks. To provide for the maximum positive deformation during bag placement, bags are typically filled 80% full.
H - 23
Appendix H: Expedient Coastal Protection
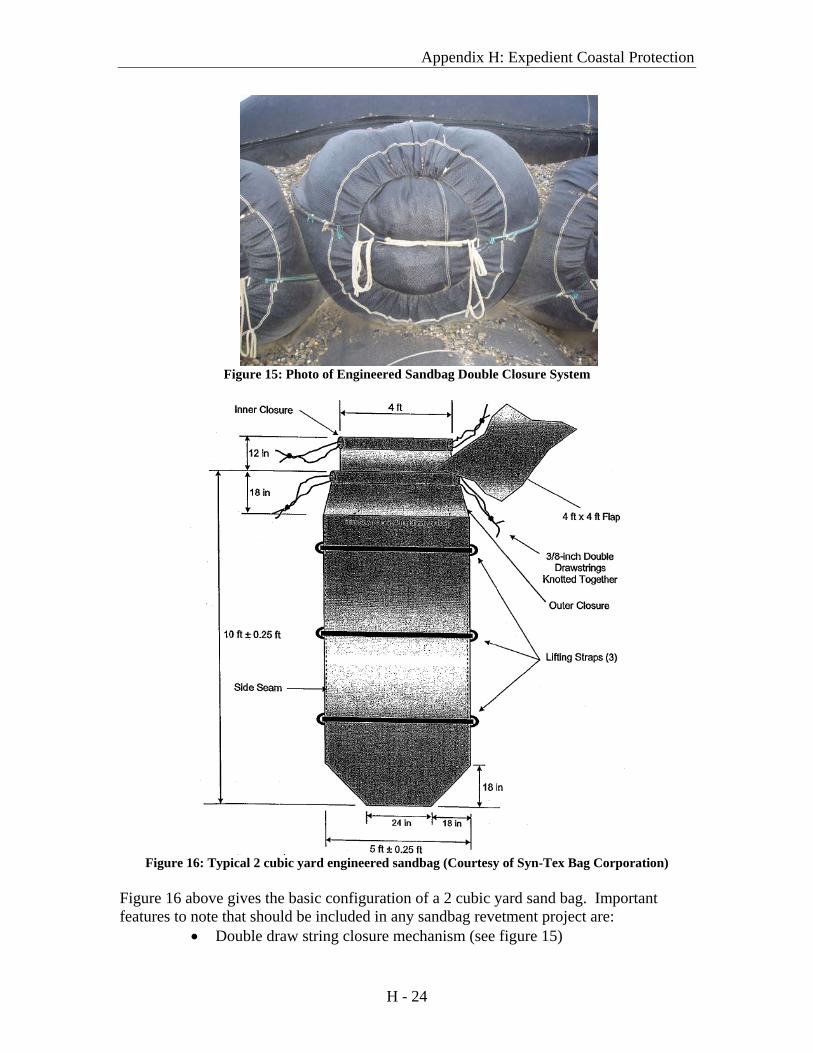
Figure 15: Photo of Engineered Sandbag Double Closure System
Figure 16: Typical 2 cubic yard engineered sandbag (Courtesy of Syn-Tex Bag Corporation)
Figure 16 above gives the basic configuration of a 2 cubic yard sand bag. Important features to note that should be included in any sandbag revetment project are:
• Double draw string closure mechanism (see figure 15)
H - 24
Appendix H: Expedient Coastal Protection
• Length to width ratio of approximately 2:1 when filled • Lifting Straps
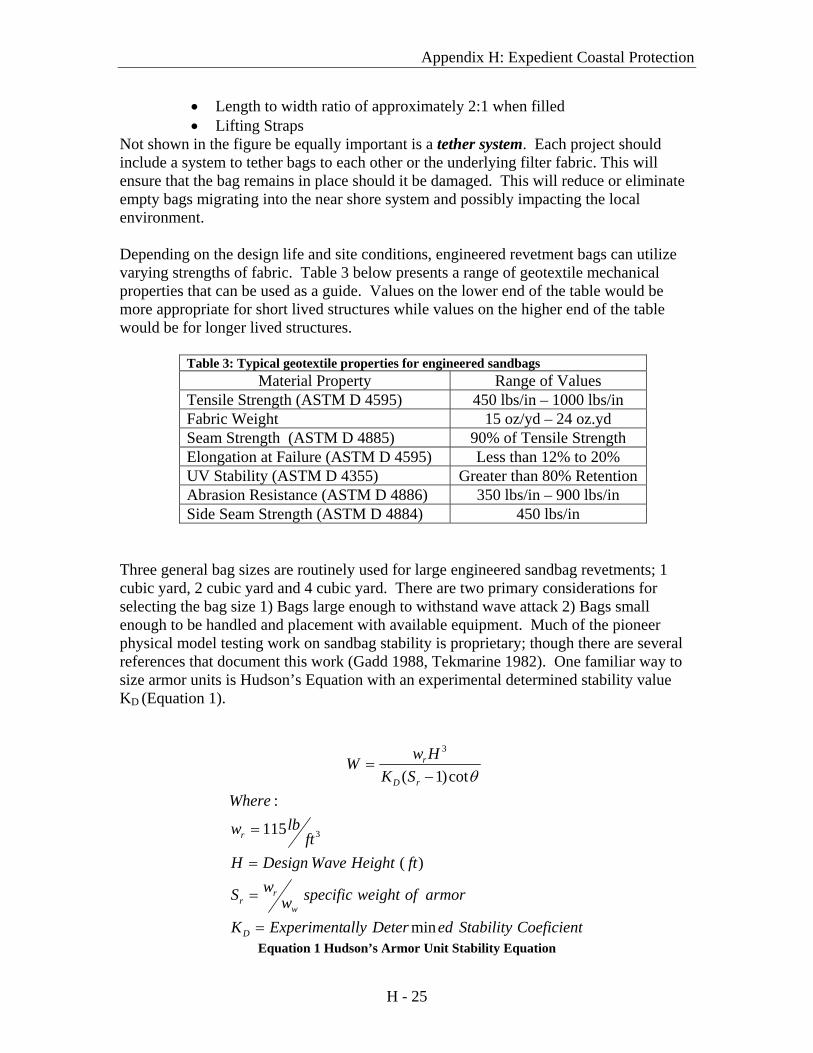
Not shown in the figure be equally important is a tether system. Each project should include a system to tether bags to each other or the underlying filter fabric. This will ensure that the bag remains in place should it be damaged. This will reduce or eliminate empty bags migrating into the near shore system and possibly impacting the local environment. Depending on the design life and site conditions, engineered revetment bags can utilize varying strengths of fabric. Table 3 below presents a range of geotextile mechanical properties that can be used as a guide. Values on the lower end of the table would be more appropriate for short lived structures while values on the higher end of the table would be for longer lived structures.
Table 3: Typical geotextile properties for engineered sandbags Material Property Range of Values
Tensile Strength (ASTM D 4595) 450 lbs/in – 1000 lbs/in Fabric Weight 15 oz/yd – 24 oz.yd Seam Strength (ASTM D 4885) 90% of Tensile Strength Elongation at Failure (ASTM D 4595) Less than 12% to 20% UV Stability (ASTM D 4355) Greater than 80% Retention Abrasion Resistance (ASTM D 4886) 350 lbs/in – 900 lbs/in Side Seam Strength (ASTM D 4884) 450 lbs/in
Three general bag sizes are routinely used for large engineered sandbag revetments; 1 cubic yard, 2 cubic yard and 4 cubic yard. There are two primary considerations for selecting the bag size 1) Bags large enough to withstand wave attack 2) Bags small enough to be handled and placement with available equipment. Much of the pioneer physical model testing work on sandbag stability is proprietary; though there are several references that document this work (Gadd 1988, Tekmarine 1982). One familiar way to size armor units is Hudson’s Equation with an experimental determined stability value KD (Equation 1).
CoeficientStabilityedDeterallyExperimentK
armorofweightspecificwwS
ftHeightWaveDesignHft
lbw
WhereSK
HwW
D
w
rr
r
rD
r
min
)(
115
:cot)1(
3
3
=
=
=
=
−=
θ
Equation 1 Hudson’s Armor Unit Stability Equation
H - 25
Appendix H: Expedient Coastal Protection
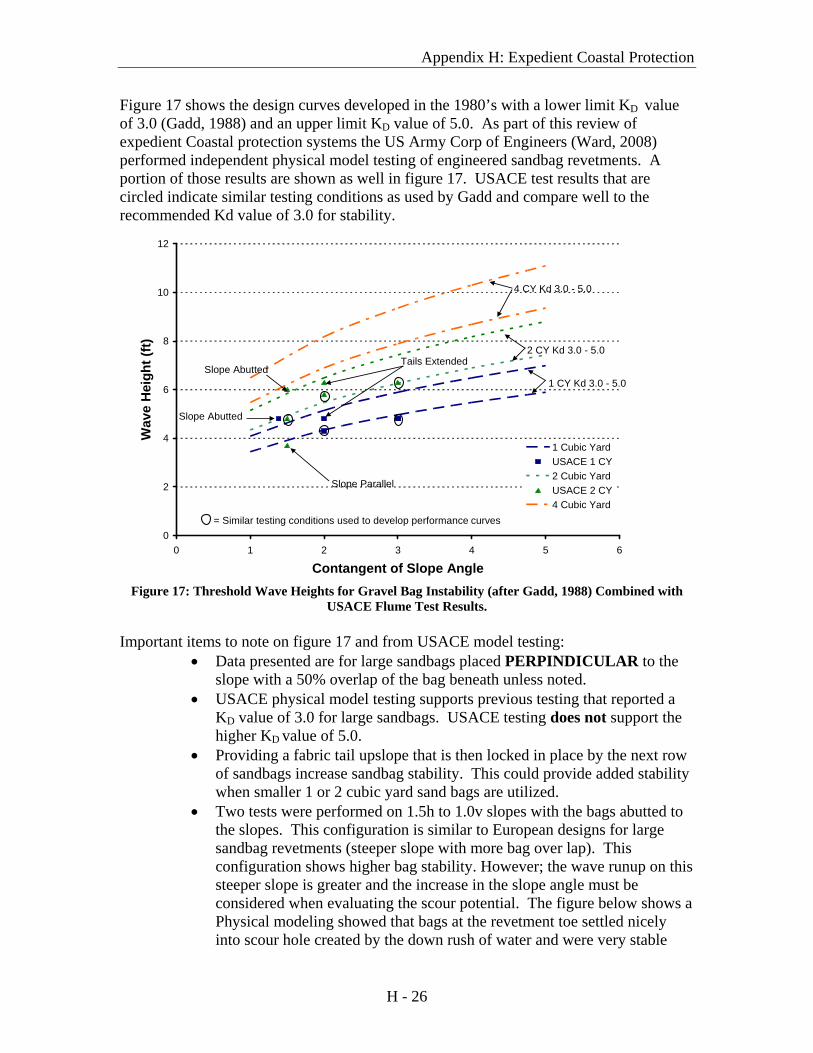
Figure 17 shows the design curves developed in the 1980’s with a lower limit KD value of 3.0 (Gadd, 1988) and an upper limit KD value of 5.0. As part of this review of expedient Coastal protection systems the US Army Corp of Engineers (Ward, 2008) performed independent physical model testing of engineered sandbag revetments. A portion of those results are shown as well in figure 17. USACE test results that are circled indicate similar testing conditions as used by Gadd and compare well to the recommended Kd value of 3.0 for stability.
0
2
4
6
8
10
12
0 1 2 3 4 5
Contangent of Slope Angle
Wav
e H
eigh
t (ft)
6
1 Cubic YardUSACE 1 CY2 Cubic YardUSACE 2 CY4 Cubic Yard
Tails ExtendedSlope Abutted
Slope Parallel
Slope Abutted
4 CY Kd 3.0 - 5.0
2 CY Kd 3.0 - 5.0
1 CY Kd 3.0 - 5.0
= Similar testing conditions used to develop performance curves
Figure 17: Threshold Wave Heights for Gravel Bag Instability (after Gadd, 1988) Combined with
USACE Flume Test Results. Important items to note on figure 17 and from USACE model testing:
• Data presented are for large sandbags placed PERPINDICULAR to the slope with a 50% overlap of the bag beneath unless noted.
• USACE physical model testing supports previous testing that reported a KD value of 3.0 for large sandbags. USACE testing does not support the higher KD value of 5.0.
• Providing a fabric tail upslope that is then locked in place by the next row of sandbags increase sandbag stability. This could provide added stability when smaller 1 or 2 cubic yard sand bags are utilized.
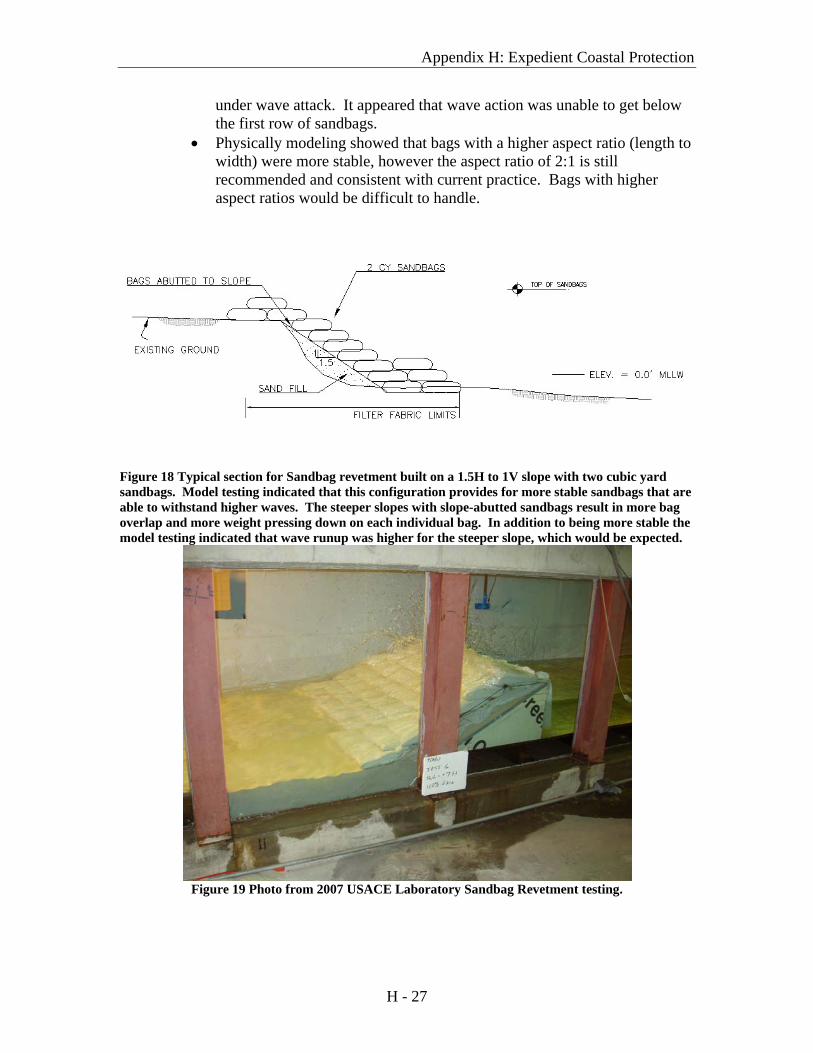
• Two tests were performed on 1.5h to 1.0v slopes with the bags abutted to the slopes. This configuration is similar to European designs for large sandbag revetments (steeper slope with more bag over lap). This configuration shows higher bag stability. However; the wave runup on this steeper slope is greater and the increase in the slope angle must be considered when evaluating the scour potential. The figure below shows a Physical modeling showed that bags at the revetment toe settled nicely into scour hole created by the down rush of water and were very stable
H - 26
Appendix H: Expedient Coastal Protection
under wave attack. It appeared that wave action was unable to get below the first row of sandbags.
• Physically modeling showed that bags with a higher aspect ratio (length to width) were more stable, however the aspect ratio of 2:1 is still recommended and consistent with current practice. Bags with higher aspect ratios would be difficult to handle.
Figure 18 Typical section for Sandbag revetment built on a 1.5H to 1V slope with two cubic yard sandbags. Model testing indicated that this configuration provides for more stable sandbags that are able to withstand higher waves. The steeper slopes with slope-abutted sandbags result in more bag overlap and more weight pressing down on each individual bag. In addition to being more stable the model testing indicated that wave runup was higher for the steeper slope, which would be expected.
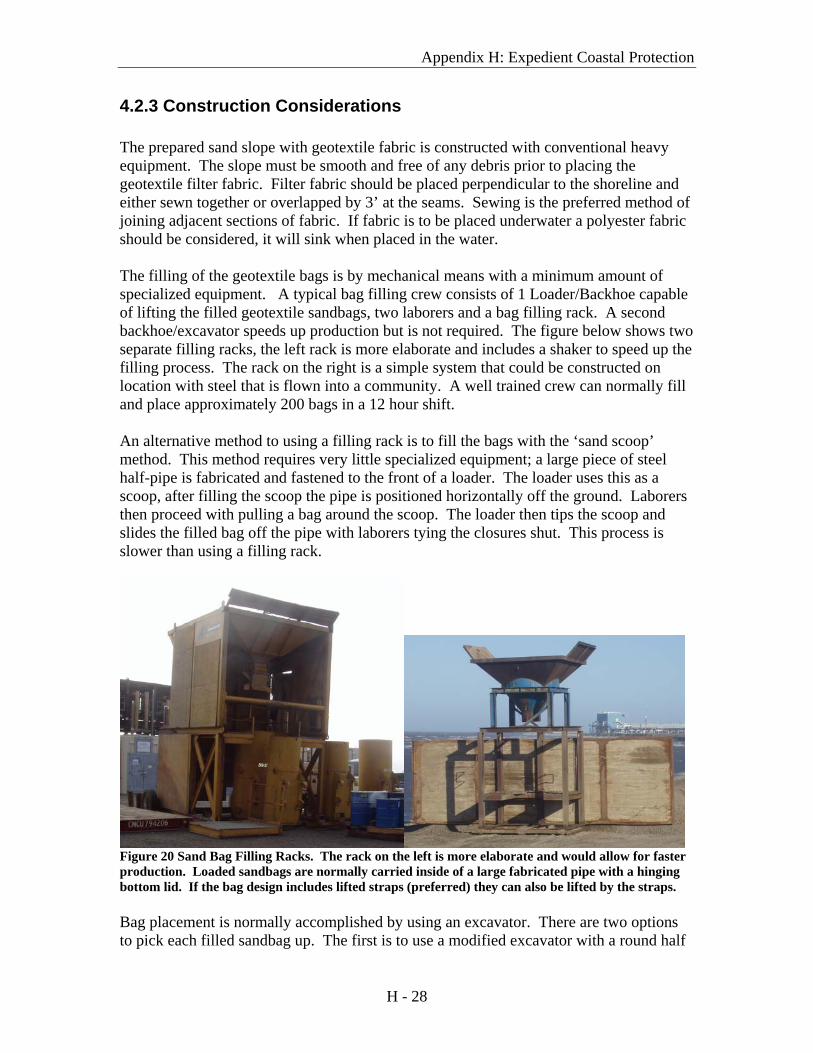
Figure 19 Photo from 2007 USACE Laboratory Sandbag Revetment testing.
H - 27
Appendix H: Expedient Coastal Protection
4.2.3 Construction Considerations The prepared sand slope with geotextile fabric is constructed with conventional heavy equipment. The slope must be smooth and free of any debris prior to placing the geotextile filter fabric. Filter fabric should be placed perpendicular to the shoreline and either sewn together or overlapped by 3’ at the seams. Sewing is the preferred method of joining adjacent sections of fabric. If fabric is to be placed underwater a polyester fabric should be considered, it will sink when placed in the water. The filling of the geotextile bags is by mechanical means with a minimum amount of specialized equipment. A typical bag filling crew consists of 1 Loader/Backhoe capable of lifting the filled geotextile sandbags, two laborers and a bag filling rack. A second backhoe/excavator speeds up production but is not required. The figure below shows two separate filling racks, the left rack is more elaborate and includes a shaker to speed up the filling process. The rack on the right is a simple system that could be constructed on location with steel that is flown into a community. A well trained crew can normally fill and place approximately 200 bags in a 12 hour shift. An alternative method to using a filling rack is to fill the bags with the ‘sand scoop’ method. This method requires very little specialized equipment; a large piece of steel half-pipe is fabricated and fastened to the front of a loader. The loader uses this as a scoop, after filling the scoop the pipe is positioned horizontally off the ground. Laborers then proceed with pulling a bag around the scoop. The loader then tips the scoop and slides the filled bag off the pipe with laborers tying the closures shut. This process is slower than using a filling rack.
Figure 20 Sand Bag Filling Racks. The rack on the left is more elaborate and would allow for faster production. Loaded sandbags are normally carried inside of a large fabricated pipe with a hinging bottom lid. If the bag design includes lifted straps (preferred) they can also be lifted by the straps. Bag placement is normally accomplished by using an excavator. There are two options to pick each filled sandbag up. The first is to use a modified excavator with a round half
H - 28
Appendix H: Expedient Coastal Protection
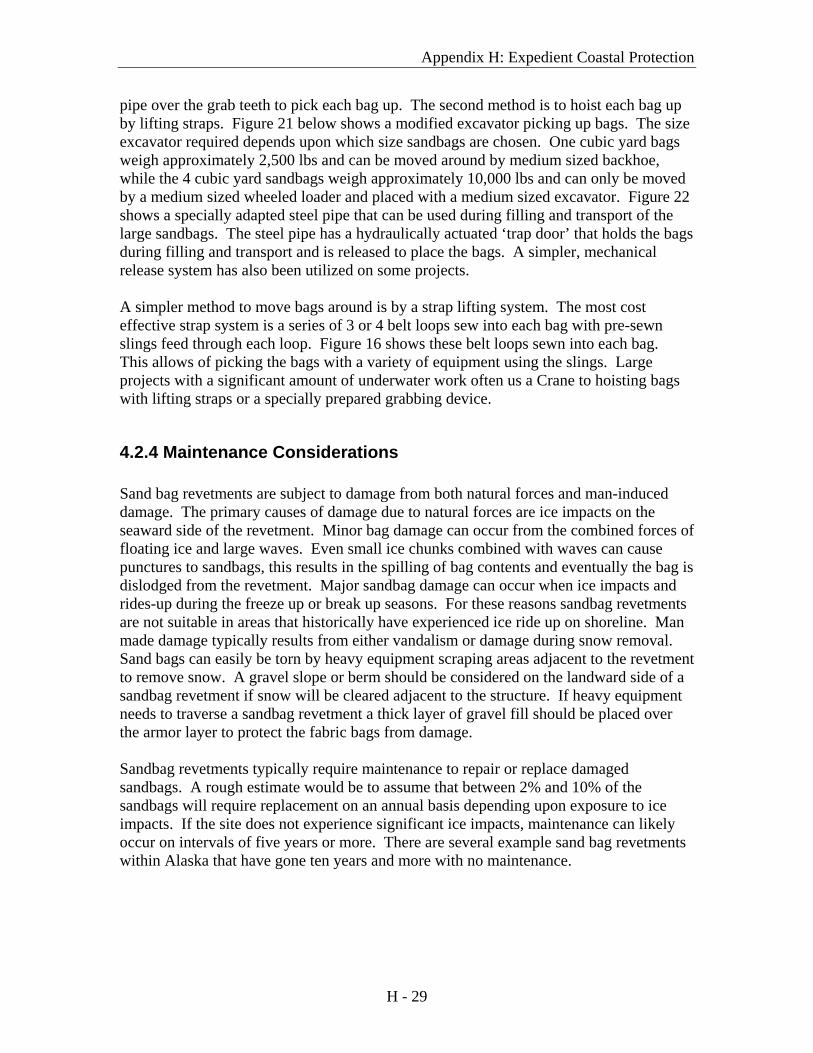
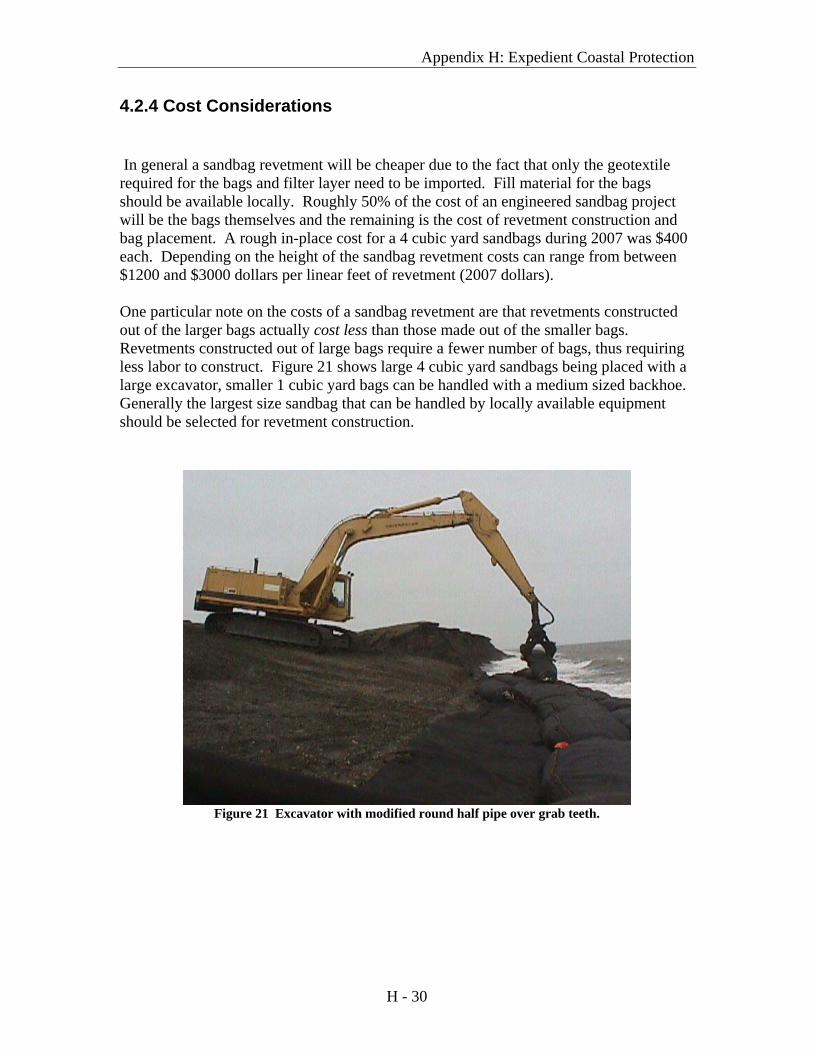
pipe over the grab teeth to pick each bag up. The second method is to hoist each bag up by lifting straps. Figure 21 below shows a modified excavator picking up bags. The size excavator required depends upon which size sandbags are chosen. One cubic yard bags weigh approximately 2,500 lbs and can be moved around by medium sized backhoe, while the 4 cubic yard sandbags weigh approximately 10,000 lbs and can only be moved by a medium sized wheeled loader and placed with a medium sized excavator. Figure 22 shows a specially adapted steel pipe that can be used during filling and transport of the large sandbags. The steel pipe has a hydraulically actuated ‘trap door’ that holds the bags during filling and transport and is released to place the bags. A simpler, mechanical release system has also been utilized on some projects. A simpler method to move bags around is by a strap lifting system. The most cost effective strap system is a series of 3 or 4 belt loops sew into each bag with pre-sewn slings feed through each loop. Figure 16 shows these belt loops sewn into each bag. This allows of picking the bags with a variety of equipment using the slings. Large projects with a significant amount of underwater work often us a Crane to hoisting bags with lifting straps or a specially prepared grabbing device.
4.2.4 Maintenance Considerations Sand bag revetments are subject to damage from both natural forces and man-induced damage. The primary causes of damage due to natural forces are ice impacts on the seaward side of the revetment. Minor bag damage can occur from the combined forces of floating ice and large waves. Even small ice chunks combined with waves can cause punctures to sandbags, this results in the spilling of bag contents and eventually the bag is dislodged from the revetment. Major sandbag damage can occur when ice impacts and rides-up during the freeze up or break up seasons. For these reasons sandbag revetments are not suitable in areas that historically have experienced ice ride up on shoreline. Man made damage typically results from either vandalism or damage during snow removal. Sand bags can easily be torn by heavy equipment scraping areas adjacent to the revetment to remove snow. A gravel slope or berm should be considered on the landward side of a sandbag revetment if snow will be cleared adjacent to the structure. If heavy equipment needs to traverse a sandbag revetment a thick layer of gravel fill should be placed over the armor layer to protect the fabric bags from damage. Sandbag revetments typically require maintenance to repair or replace damaged sandbags. A rough estimate would be to assume that between 2% and 10% of the sandbags will require replacement on an annual basis depending upon exposure to ice impacts. If the site does not experience significant ice impacts, maintenance can likely occur on intervals of five years or more. There are several example sand bag revetments within Alaska that have gone ten years and more with no maintenance.
H - 29
Appendix H: Expedient Coastal Protection
4.2.4 Cost Considerations
In general a sandbag revetment will be cheaper due to the fact that only the geotextile required for the bags and filter layer need to be imported. Fill material for the bags should be available locally. Roughly 50% of the cost of an engineered sandbag project will be the bags themselves and the remaining is the cost of revetment construction and bag placement. A rough in-place cost for a 4 cubic yard sandbags during 2007 was $400 each. Depending on the height of the sandbag revetment costs can range from between $1200 and $3000 dollars per linear feet of revetment (2007 dollars). One particular note on the costs of a sandbag revetment are that revetments constructed out of the larger bags actually cost less than those made out of the smaller bags. Revetments constructed out of large bags require a fewer number of bags, thus requiring less labor to construct. Figure 21 shows large 4 cubic yard sandbags being placed with a large excavator, smaller 1 cubic yard bags can be handled with a medium sized backhoe. Generally the largest size sandbag that can be handled by locally available equipment should be selected for revetment construction.
Figure 21 Excavator with modified round half pipe over grab teeth.
H - 30
Appendix H: Expedient Coastal Protection
Figure 22 Steel pipe modified to transport large (4 CY) sandbags.
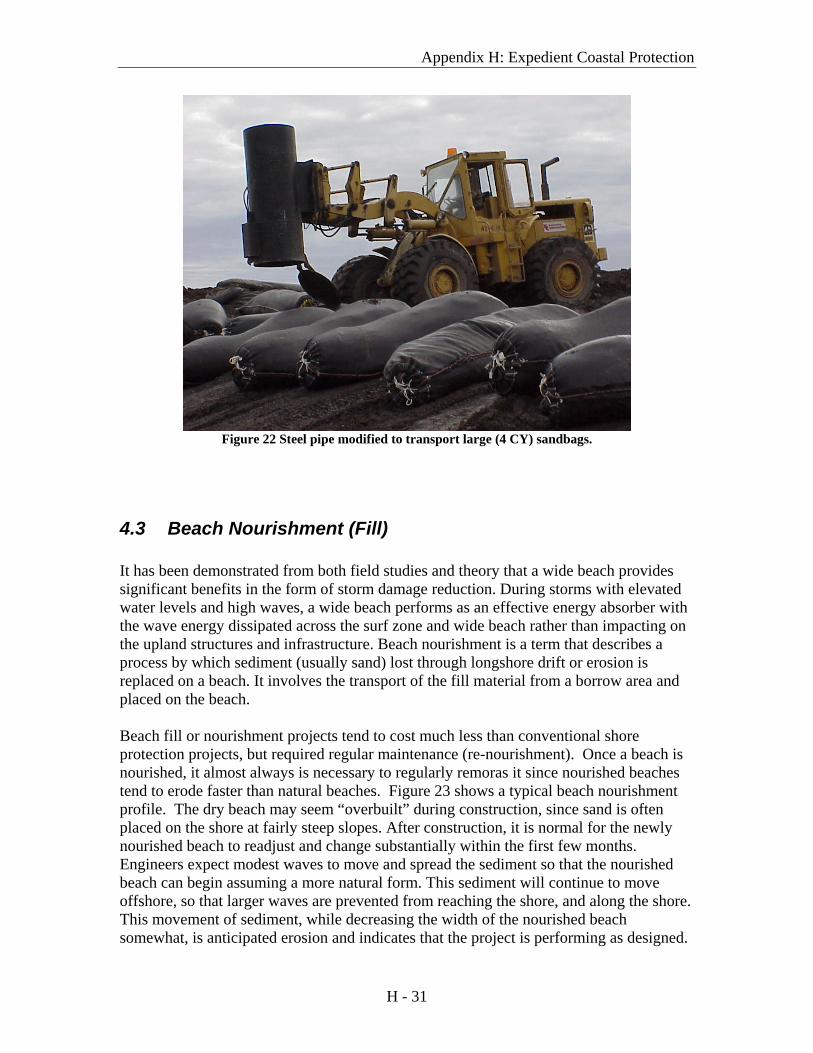
4.3 Beach Nourishment (Fill) It has been demonstrated from both field studies and theory that a wide beach provides significant benefits in the form of storm damage reduction. During storms with elevated water levels and high waves, a wide beach performs as an effective energy absorber with the wave energy dissipated across the surf zone and wide beach rather than impacting on the upland structures and infrastructure. Beach nourishment is a term that describes a process by which sediment (usually sand) lost through longshore drift or erosion is replaced on a beach. It involves the transport of the fill material from a borrow area and placed on the beach. Beach fill or nourishment projects tend to cost much less than conventional shore protection projects, but required regular maintenance (re-nourishment). Once a beach is nourished, it almost always is necessary to regularly remoras it since nourished beaches tend to erode faster than natural beaches. Figure 23 shows a typical beach nourishment profile. The dry beach may seem “overbuilt” during construction, since sand is often placed on the shore at fairly steep slopes. After construction, it is normal for the newly nourished beach to readjust and change substantially within the first few months. Engineers expect modest waves to move and spread the sediment so that the nourished beach can begin assuming a more natural form. This sediment will continue to move offshore, so that larger waves are prevented from reaching the shore, and along the shore. This movement of sediment, while decreasing the width of the nourished beach somewhat, is anticipated erosion and indicates that the project is performing as designed.
H - 31
Appendix H: Expedient Coastal Protection
Figure 23 After a beach nourishment project is constructed, coastal engineers expect the beach to change over time and assume a more natural form.
Primary functions of a Beach Nourishment Project:
• to provide protection to backshore property • to increase the recreational and subsistence space along the shore • May replicate natural coastal processes by augmenting coastal sand budgets • Sediment texture (grain size and sorting) is critical for success. Sand fill must be
compatible with native beach sand.
4.4.1 Design Considerations Beach nourishment is not an exact science; variables and uncertainties exist. Actual periodic re-nourishment intervals may differ from planned intervals based on conditions at the nourished beach and the frequency and intensity of storms from year to year. By understanding beach topography above and below the water, coastal engineers can identify coastal processes at the site, calculate the volume of beach fill needed, and determine how long the project will last before re-nourishment is required. Periodic re-nourishment intervals – which vary based on the initial design, wave climate, sand used, types of storms, and project age – range on average from two to 10 years.
H - 32
Appendix H: Expedient Coastal Protection
Formally developed beach nourishment projects are designed to optimize storm damage reduction benefits relative to costs. Designing a project to protect against any and all storms is not economically feasible. Extreme conditions and severe storms could exceed the capacity of a beach nourishment project to protect people and property. A nourishment project must consider:
• Climatology • Environmental consequences of both the beach and borrow sources • Natural shape of the beach • Native beach sand • Volumes and rates of sediment transport • Waves and water levels • Historical information about previous storms
Temporary or emergency beach nourishment projects will likely not have this information readily available. An experienced coastal engineer should be consulted to provide recommendations on where to place beach nourishment and also suitable borrow sources. As with all projects, even emergency projects, the environmental consequences should be considered. Despite a lack of available engineering information, temporary or emergency beach nourishment projects can be constructed quickly using local equipment, a suitable borrow source, local knowledge, coastal engineering and a bit of trial and error. A beach fill project is considered successful if damages from waves, inundation, and erosion have been prevented or reduced significantly, and development and ecosystems behind the dunes are still intact. General Guidelines for a temporary beach fill project:
• Beach Fill Material Borrow material that is coarser than the native material will produce a beach which is at least as stable as a fill comprised of native material. Fills with coarser material provide improved resistance to storm induced erosion. A lesser volume of coarser fill will be required to create a beach of a given width, compared to the volume of native beach sand that would be needed. If the borrow material is significantly larger than the native material, a noticeably steeper beach may form. A steeper beach is much more acceptable than a shallower eroding beach. Use of material finer than the native material should be avoided, if possible. A much greater volume of material will be required to form a beach of a given width, compared to the volume of native sand that would be required.
• Beach Fill Location Borrow material is always placed in the erosion area and is often placed as a feeder beach for distribution naturally to areas that are eroding. These feeder beach fills are placed in the upstream longshore drift direction. Due to longshore drift it will be difficult to maintain the beach fill at the ends of a project. Beach
H - 33
Appendix H: Expedient Coastal Protection
fills are usually extended in the upstream sediment transport direction. These feeder portions of the fill provide sediment that can be transport down to the area of concern. The beach fill along the feeder portions of the project should be gradually tapered into the existing beach line to decrease perturbation effects of the project.
• Placement Techniques
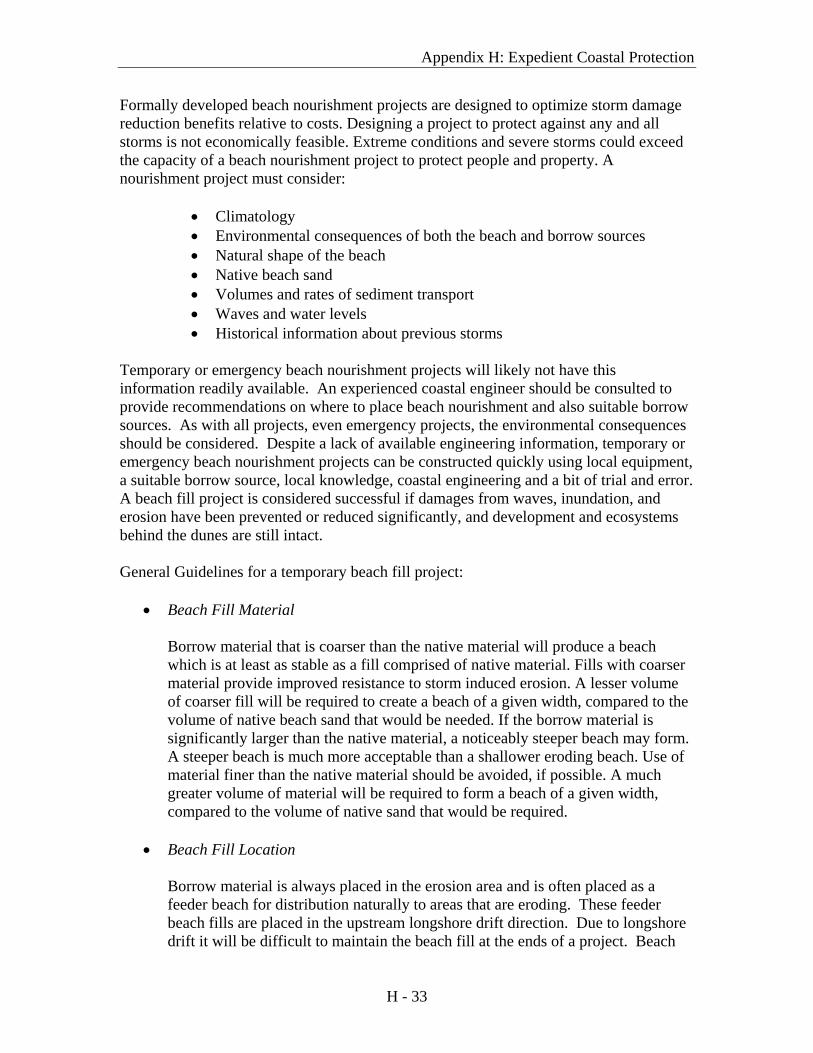
Beach fill should be placed in a quick efficient manner on the upper slopes of the beach that are easily accessible by mechanical equipment (Trucks and Loaders). Large windrowed stockpiles will later be shaped naturally by wave action. Any existing vegetated beach dunes should be preserved throughout the project; these are nature’s way of preventing erosion. In areas outside Alaska Beach fill is often placed using pumps and pipes. A sand and water mixture is pumped from a borrow source directly onto the beach, the water flows downhill while the sand remains in place. This technique is not common in Alaska but would be an option where equipment could be flown in by airplane to a community. Figure 24 shows one typical beach fill profile.
Figure 24 Fill placed directly on the beach to extend the natural berm seaward.
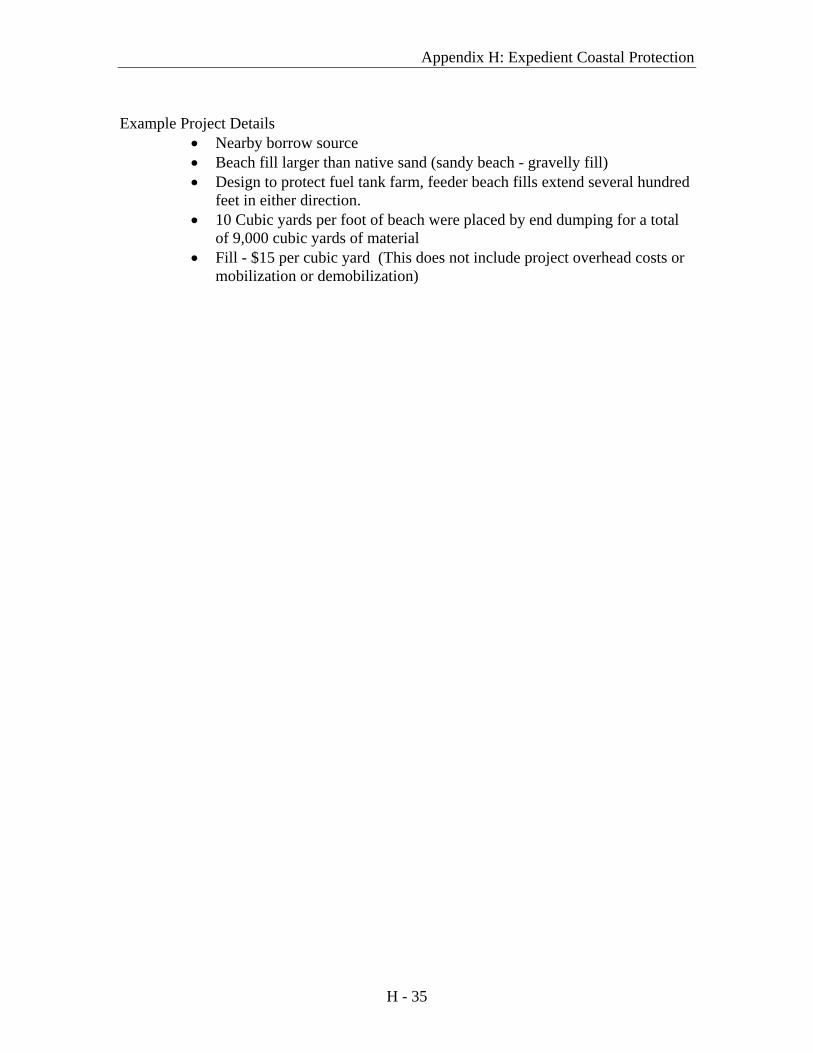
4.4.2 Example Expedient Beach Fill In order to provide temporary ( 1 year) erosion protection at Kivalina Alaska beach fill was selected as the preferred alternative. A Corp of Engineers construction project is currently constructing a rock revetment to replace a failed seawall. Due to construction a limited construction season construction of the rock revetment will take three years. As a temporary measure during the first year of construction beach fill was placed in front of the un-protected seawall. Figure 25 below shows the original failed seawall with little to no beach in front of the structure to dissipate wave energy. Approximately ten cubic yards per running foot of local borrow material was placed in front of the seawall to provide short term erosion protection until the rock revetment construction is complete. A suitable borrow source with material larger than the native beach sand was identified during the planning process and included in the environmental evaluation of the project.
H - 34
Appendix H: Expedient Coastal Protection
Example Project Details
• Nearby borrow source • Beach fill larger than native sand (sandy beach - gravelly fill) • Design to protect fuel tank farm, feeder beach fills extend several hundred
feet in either direction. • 10 Cubic yards per foot of beach were placed by end dumping for a total
of 9,000 cubic yards of material • Fill - $15 per cubic yard (This does not include project overhead costs or
mobilization or demobilization)
H - 35
Appendix H: Expedient Coastal Protection
Figure 25 June 25th 2008 Kivalina Aerial Photograph prior to beach fill (Top) The arrow indicates
the location of the two photos taken after the beach fill was complete. October 17th, 2008 Beach Photos taken in front of fuel tank farm (Bottom)
H - 36
Appendix H: Expedient Coastal Protection
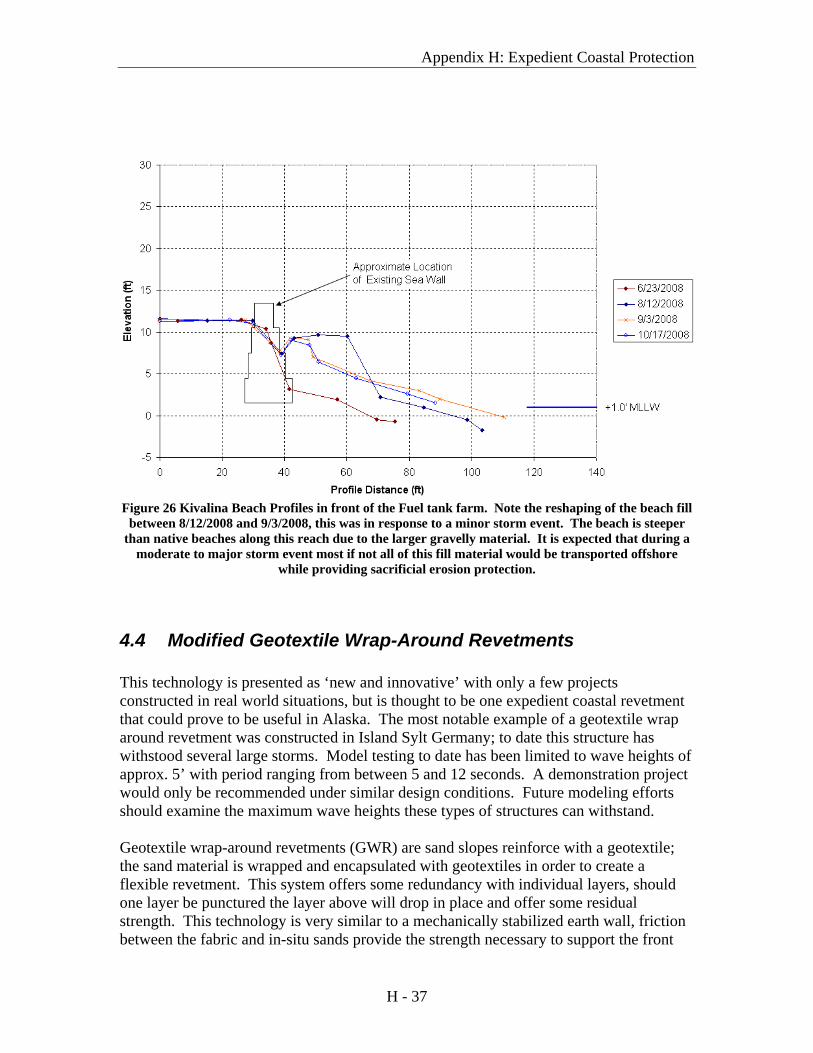
Figure 26 Kivalina Beach Profiles in front of the Fuel tank farm. Note the reshaping of the beach fill
between 8/12/2008 and 9/3/2008, this was in response to a minor storm event. The beach is steeper than native beaches along this reach due to the larger gravelly material. It is expected that during a
moderate to major storm event most if not all of this fill material would be transported offshore while providing sacrificial erosion protection.
4.4 Modified Geotextile Wrap-Around Revetments This technology is presented as ‘new and innovative’ with only a few projects constructed in real world situations, but is thought to be one expedient coastal revetment that could prove to be useful in Alaska. The most notable example of a geotextile wrap around revetment was constructed in Island Sylt Germany; to date this structure has withstood several large storms. Model testing to date has been limited to wave heights of approx. 5’ with period ranging from between 5 and 12 seconds. A demonstration project would only be recommended under similar design conditions. Future modeling efforts should examine the maximum wave heights these types of structures can withstand. Geotextile wrap-around revetments (GWR) are sand slopes reinforce with a geotextile; the sand material is wrapped and encapsulated with geotextiles in order to create a flexible revetment. This system offers some redundancy with individual layers, should one layer be punctured the layer above will drop in place and offer some residual strength. This technology is very similar to a mechanically stabilized earth wall, friction between the fabric and in-situ sands provide the strength necessary to support the front
H - 37
Appendix H: Expedient Coastal Protection
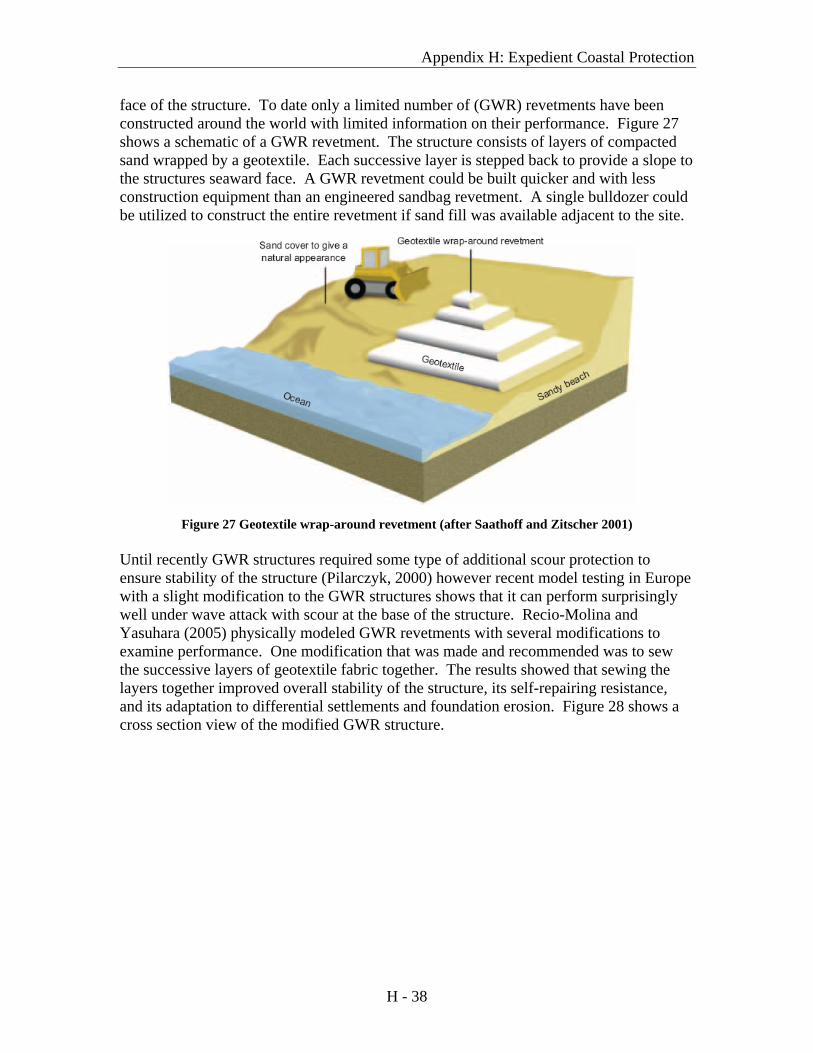
face of the structure. To date only a limited number of (GWR) revetments have been constructed around the world with limited information on their performance. Figure 27 shows a schematic of a GWR revetment. The structure consists of layers of compacted sand wrapped by a geotextile. Each successive layer is stepped back to provide a slope to the structures seaward face. A GWR revetment could be built quicker and with less construction equipment than an engineered sandbag revetment. A single bulldozer could be utilized to construct the entire revetment if sand fill was available adjacent to the site.
Figure 27 Geotextile wrap-around revetment (after Saathoff and Zitscher 2001)
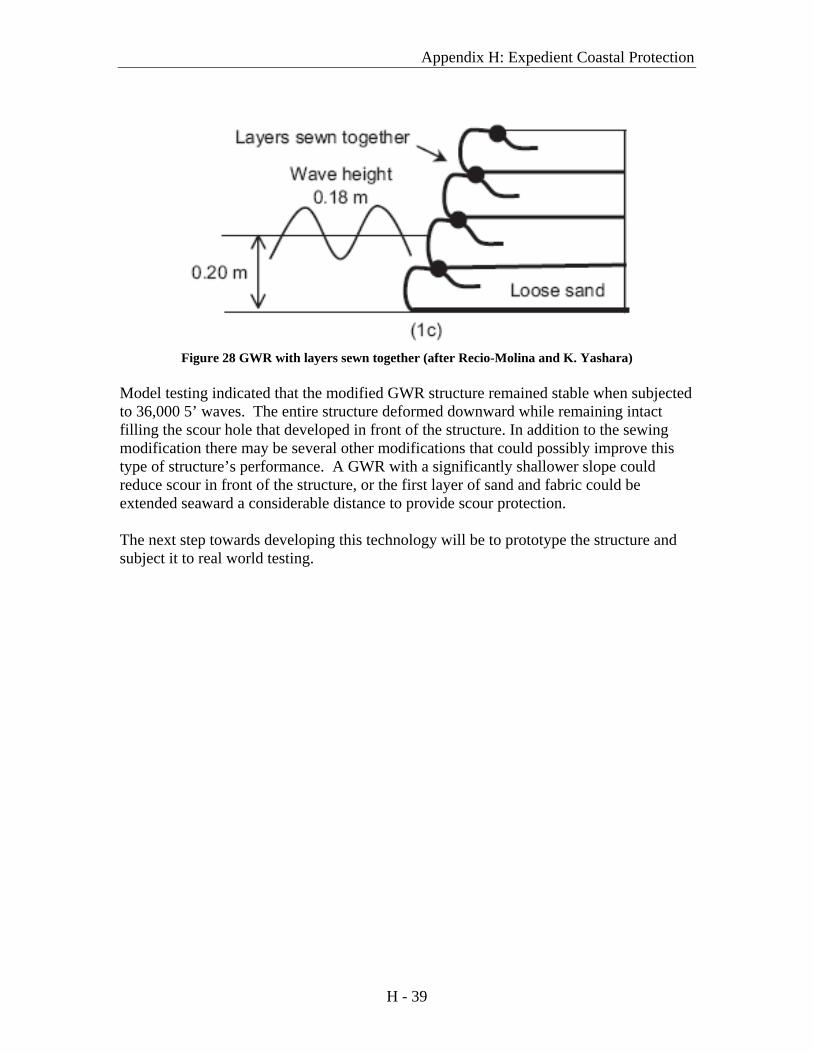
Until recently GWR structures required some type of additional scour protection to ensure stability of the structure (Pilarczyk, 2000) however recent model testing in Europe with a slight modification to the GWR structures shows that it can perform surprisingly well under wave attack with scour at the base of the structure. Recio-Molina and Yasuhara (2005) physically modeled GWR revetments with several modifications to examine performance. One modification that was made and recommended was to sew the successive layers of geotextile fabric together. The results showed that sewing the layers together improved overall stability of the structure, its self-repairing resistance, and its adaptation to differential settlements and foundation erosion. Figure 28 shows a cross section view of the modified GWR structure.
H - 38
Appendix H: Expedient Coastal Protection
Figure 28 GWR with layers sewn together (after Recio-Molina and K. Yashara)
Model testing indicated that the modified GWR structure remained stable when subjected to 36,000 5’ waves. The entire structure deformed downward while remaining intact filling the scour hole that developed in front of the structure. In addition to the sewing modification there may be several other modifications that could possibly improve this type of structure’s performance. A GWR with a significantly shallower slope could reduce scour in front of the structure, or the first layer of sand and fabric could be extended seaward a considerable distance to provide scour protection. The next step towards developing this technology will be to prototype the structure and subject it to real world testing.
H - 39
Appendix H: Expedient Coastal Protection
H - 40
5.1 References Bruun, P.M. (1962) Sea-Level rise as a cause of shore erosion, J. Coast Eng.,(7)1, 77-89. Cooper, J.A.G., and Pilkey, O.H., 2004, Sea-level rise and shoreline retreat; time to
abandon the Bruun Rule: Global and Planetary Change, v. 43, p. 157-171. IPCC, 2007: Climate Change 2007: Impacts, Adaptation and Vulnerability. Contribution
of Working Group II to the Fourth Assessment Report of the Intergovernmental Panel on Climate Change, M.L. Parry, O.F. Canziani, J.P. Palutikof, P.J. van der Linden and C.E. Hanson, Eds., Cambridge University Press, Cambridge, UK, 976pp.
Gadd, P.E., 1988, “Sand Bag Slope Protection Design, Construction, and Performance”,
in Chen, A.C.T., and C.B. Liedersdorf, eds., Arctic Coastal Processes and Slope Protection Design, ASCE, New York, NY, p. 145-165.
Tekmarine Inc. 1982, Large-scale model studies of arctic island slope protection. Sierra
California. U.S. Army Corps of Engineers. 2002. Coastal Engineering Manual. Engineer Manual
1110-2-1100, U.S. Army Corps of Engineers, Washington, D.C. (in 6 volumes). Ward, D.L. 2008. Physical Model Study of Sandbag-Covered Revetments. USACE
ERDC/LCHL TR-08-X. Kobayashi, N., and Jacobs, B.K. 1985. “Experimental study on Sandbag Stability and
Runup.” Coastal Zone ’85, O.T. Magoon, et al., eds., Vol.2, ASCE, NY, 1612-1626. Gadd, P.E., Wanikian, V., and Machemehl J.L. 1988. Wave Run-up Prediction vs. Model
Test Results: A Comparison”. Proceedings of the 21st International Coastal Engineering Conference, Torremolinos, Spain.
Gadd, P.E. 1988. “Sand Bag Slope Protection: Design, Construction, and Performance.”
Arctic Coastal Processes and Slope Protection Design, ASCE 1988. Recio-Molina, J. and Yasuhara, K. 2005. Stability of Modified Geotextile Wrap-Around
Revetments (GWR) for Coastal Protection. Geosynthetics International, Vol. 12, No.5.