Embed Size (px)
Citation preview
AQUIS RESORT AT THE GREAT BARRIER REEF PTY LTD
ENVIRONMENTAL IMPACT STATEMENT
VOLUME 8
APPENDIX JCOASTAL PROCESSES
AQUIS Resort at Great Barrier Reef Coastal Processes Assessments Report to Support EIS
R.B20270.004.04.Coastal.docx April 2014 Confidential
A part of BMT in Energy and Environment
G:\Admin\B20270_g_nc_Yorkeys Knob Development\R.B20270.004.04.Coastal.docx
AQUIS Resort at Great Barrier Reef Coastal Processes Assessments Report to Support EIS AQUIS Resort at Great Barrier Reef Coastal Processes Assessments Report
Prepared for: AQUIS Resort at Great Barrier Reef Pty Ltd
Prepared by: BMT WBM Pty Ltd (Member of the BMT group of companies)
Offices Brisbane Denver London Mackay Melbourne Newcastle Perth Sydney Vancouver
G:\Admin\B20270_g_nc_Yorkeys Knob Development\R.B20270.004.04.Coastal.docx
Document Control Sheet
BMT WBM Pty Ltd Level 8, 200 Creek Street Brisbane 4000 Queensland Australia PO Box 203 Spring Hill 4004 Tel: +61 7 3831 6744 Fax: + 61 7 3832 3627 ABN 54 010 830 421 www.bmtwbm.com.au
Document: R.B20270.004.04.Coastal.docx
Title: AQUIS Resort at Great Barrier Reef Coastal Processes Assessments Report to Support EIS
Project Manager: Neil Collins
Author: Malcolm Andrews
Client: AQUIS Resort at Great Barrier Reef Pty Ltd c/- Flanagan Consulting
Client Contact: Pat Flanagan
Client Reference: 3528-02EIS
Synopsis: Coastal Processes Report prepared for AQUIS Resort at Great Barrier Reef Pty Ltd to support EIS
REVISION/CHECKING HISTORY
Revision Number Date Checked by Issued by
1 25/9/13 N. Collins M. Andrews
2 26/3/14 N. Collins M. Andrews
3 17/4/14 N. Collins M. Andrews
4 28/4/14 N. Collins M. Andrews
DISTRIBUTION
Destination Revision
0 1 2 3 4 5 6 7 8 9 10
AQUIS Resort at Great Barrier Reef Pty Ltd
BMT WBM File
BMT WBM Library
AQUIS Resort at Great Barrier Reef Coastal Processes Assessments Report to Support EIS
i
Contents
G:\Admin\B20270_g_nc_Yorkeys Knob Development\R.B20270.004.04.Coastal.docx
Contents
1 Introduction 1
2 Methodology 2
3 Site Resources and Values 3
3.1 Location and Background 3
3.2 Geological Background 3
3.3 Current Coastal Processes 5
3.4 Sediment Supply 5
3.4.1 Waves 6
3.4.2 Wind 8
3.4.3 Sea Level Rise 12
3.4.4 Tide and Storm Surge 12
3.4.4.1 Tidal Planes 12
3.4.4.2 Storm Tide 12
3.4.5 Tsunami 14
3.4.6 Longshore Sand Transport 17
3.4.7 Short Term Storm Erosion Potential 18
3.4.8 Wave Overtopping 19
3.4.9 Erosion Prone Area 20
3.4.9.1 Introduction 22
3.4.9.2 Basic Considerations 22
3.4.9.3 Planning Period 23
3.4.9.4 Rate of Long Term Erosion 23
3.4.9.5 Short Term Erosion 23
3.4.9.6 Erosion Due to Greenhouse Effect 24
3.4.9.7 Factor of Safety 25
3.4.9.8 Dune Scarp Component 25
3.4.9.9 Erosion Prone Area Width for Project Site 25
3.5 Legislation 28
3.5.1 Queensland Coastal Plan 28
3.5.1.1 Legislative Requirement 28
3.5.1.2 Mitigation Options 29
3.5.2 State Development Assessment Provisions 29
3.5.2.1 Legislative Requirements 29
3.5.2.2 Mitigation Options 36
3.5.3 Coastal Protection State Planning Regulatory Provision 37
AQUIS Resort at Great Barrier Reef Coastal Processes Assessments Report to Support EIS
ii
Contents
G:\Admin\B20270_g_nc_Yorkeys Knob Development\R.B20270.004.04.Coastal.docx
3.5.3.1 Legislative Requirements 37
3.5.3.2 Mitigation Options 37
4 Opportunities and Constraints 38
5 Description of the Project 39
5.1 Precincts 39
6 Likely Impacts and Management Needs 42
6.1 Potential Impacts 42
6.1.1 Storm Tide Inundation 42
6.1.2 Shoreline Erosion 42
6.1.3 Loss of Sediment Supply due to Barron River Changes 42
6.2 Management of Coastal Processes 43
6.2.1 Cyclonic Storm Tide 43
6.2.2 Estuary and Shoreline Dynamics 43
6.2.3 Coastal Erosion 45
6.2.4 Extreme Event Erosion and Waves 45
6.2.5 Emergency Event Management 46
7 References 47
8 Qualifications 48
9 Acronyms 49
List of Figures
Figure 3-1 Quaternary Geology of Trinity Bay 4
Figure 3-2 Recent Barron River Entrance Changes (from H&M 1981) 5
Figure 3-3 Data from BPA 1975 - 1981 7
Figure 3-4 All Data from DEHP 1975 – 2005 7
Figure 3-5 Cyclone Data from DEHP 1975 – 2005 8
Figure 3-6 Cairns Aero Long Term Average Wind Rose (1948 to 2011) 9
Figure 3-7 Low Isles 9am Long Term Average Wind Rose (1967 to 2010) 10
Figure 3-8 Low Isles 3pmLong Term Average Wind Rose (1967 to 2010) 11
Figure 3-9 AEP 1% Tsunami Risk for Cairns (Geoscience Australia) 16
Figure 3-10 Cairns Regional Council Tsunami Evacuation Plan 17
Figure 3-11 Example Storm Erosion Assessment Results at Location MU 223.0 19
Figure 3-12 DEHP Erosion Prone Area Mapping 21
Figure 3-13 Bruun Rule for Shoreline Response to Rising Sea Level 24
Figure 3-14 Predicted Shoreline Erosion Prone Area Widths 27
Figure 5-1 AQUIS Local Plan Precinct Plan ALP1 39
AQUIS Resort at Great Barrier Reef Coastal Processes Assessments Report to Support EIS
iii
Contents
G:\Admin\B20270_g_nc_Yorkeys Knob Development\R.B20270.004.04.Coastal.docx
Figure 5-2 AQUIS Local Plan Concept Master Plan ALP-2 40
Figure 6-1 Thomatis Creek Entrance 2002 (Google Earth) 43
Figure 6-2 Thomatis Creek Entrance 2011 (Aerial Photo) 44
Figure 6-3 Richters Creek Entrance 1952 – 1982 (BPA) 44
Figure 6-4 Richters Creek Entrance 2011 (Aerial Photo) 45
List of Tables
Table 3-1 Tidal Planes at Cairns 12
Table 3-2 Peak Storm Tide (Surge Plus Tide Only) 13
Table 3-3 Peak Storm Tide Including Wave Effects AEPs 13
Table 3-4 Projected 2100 1% AEP Storm Tide Including Wave Effects and Sea Level Rise 14
Table 3-5 Vellinga Model Erosion Estimates 19
Table 3-6 SDAP outcomes and suggested compliance 30
AQUIS Resort at Great Barrier Reef Coastal Processes Assessments Report to Support EIS
1
Introduction
G:\Admin\B20270_g_nc_Yorkeys Knob Development\R.B20270.004.04.Coastal.docx
1 Introduction BMT WBM has been commission to carry out some of the hydraulic studies relating to this
development including coastal processes, flooding and water quality. This report relates to the
coastal processes component.
The AQUIS site is located approximately six kilometres north of the current Barron River entrance
in the Barron River delta between Richters Creek and Yorkeys Creek. However, the proposed
development is located approximately 600m from the shoreline and as such coastal erosion is not
of concern for the proposal. However, the site will be inundated by storm surge during significant
cyclonic events.
This report describes the existing coastal environment, specific site coastal constraints including
legislative constraints, opportunities for development, and an assessment of development impacts
on the environment.
Key components in relation to Coastal processes to be addressed are:
a. Design and extreme event water levels across the site.
b. Shoreline and creek mouth bank stability and erosion.
c. Potential for partial loss of frontal dune with wave overtopping in direct hit severe to extreme
cyclone events including wave set-up, run-up and overtopping volume.
d. Long term shoreline trends particularly in relation to the consistency ongoing sediment supply
from the Barron River.
e. Potential for impacts relating to major channel changes and in particular the risk that Thomatis
Creek becomes the major channel.
f. Emergency evacuation and management, co-ordinated with emergency flood management.
g. Planning / legislative requirements and project compliance.
AQUIS Resort at Great Barrier Reef Coastal Processes Assessments Report to Support EIS
2
Methodology
G:\Admin\B20270_g_nc_Yorkeys Knob Development\R.B20270.004.04.Coastal.docx
2 Methodology This report has relied on several previous State Government studies into the Barron River Delta
and associated coastal processes and beach erosion These studies were completed in the 1980s
and are called the Barron River Delta Investigation (BRDI) by the then Queensland Department of
Harbours and Marine (H&M) in 1981 and the Mulgrave Shire Northern Beaches Report (MSNBR)
by the then Queensland Beach Protection Authority (BPA) in 1984. These have considered the
flood plain and coastal processes for the Barron River Delta in detail including comprehensive
investigations of geology, floods, sediment movements, channel stability and coastal processes.
This report included information on a range of processes from those that are expected to remain
stable over centuries e.g. geological, to daily varying wave littoral processes such as wind, wave
and sediment transport conditions.
No new data collection or process analyses have been carried out for this study.
AQUIS Resort at Great Barrier Reef Coastal Processes Assessments Report to Support EIS
3
Site Resources and Values
G:\Admin\B20270_g_nc_Yorkeys Knob Development\R.B20270.004.04.Coastal.docx
3 Site Resources and Values
3.1 Location and Background The AQUIS site is located approximately six kilometres north of the current Barron River entrance
in the Barron River delta between Richters Creek and Yorkeys Creek. Richters Creek is a major
distributary of the Barron River and the associated interactions are a key consideration. Several
studies into coastal processes and beach erosion in the region have been completed since the
1980s. Of particular interest are the Barron River Delta Investigation (BRDI) by the then
Queensland Department of Harbours and Marine (H&M) in 1981 and the Mulgrave Shire Northern
Beaches Report (MSNBR) by the then Queensland Beach Protection Authority (BPA) in 1984.
These have considered the flood plain and coastal processes for the Barron River Delta in detail
including comprehensive investigations of geology, floods, sediment movements, channel stability
and coastal processes. This report included information on a range of processes from those that
are expected to remain stable over centuries e.g. geological, to daily varying wave littoral
processes such as wind, wave and sediment transport conditions.
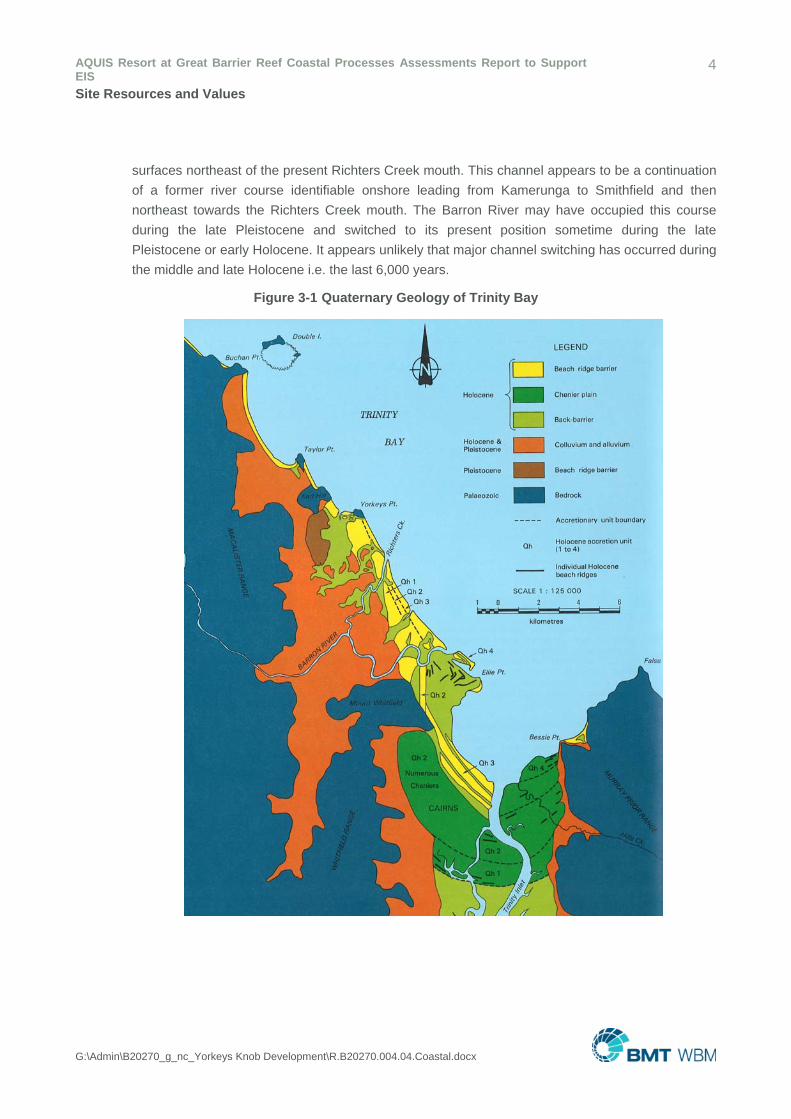
In terms of coastal processes these reports found that in geological timescales the beaches have
been accreting (refer Figure 3-1) but that local disturbances such as interruptions to the fluvial
supply from rivers such as the Barron River (refer Figure 3-2) have caused large scale
disturbances. These fluctuations pre-date the arrival of Europeans and are a natural rather than
anthropogenic occurrence. The Barron River delta is the largest source of sediment to the northern
beaches and supplies about 23,000 m3 annually.
Coastal data has continued to be collected since the 1980’s by the BPA and now Department of
Environment and Heritage Protection (DEHP) on the processes that change daily and for which
longer datasets can provide meaningful statistical information. These are:
Wave recording off Double Island;
Beach profile surveys at the beaches to the north and the south; and
Storm Surge recording at Trinity Inlet.
An analysis of the more recently collected data was added to the MSNBR data set by WBM in 2005
to form the technical basis for a Shoreline Erosion Management Plan (WBM 2005). The subject of
Greenhouse induced sea level rise was not considered at the time of the MSNBR and was included
in the later WBM report. Details of these data sets and the associated coastal processes are given
in Chapter 3.
3.2 Geological Background The previously mentioned significant studies of the Barron River Delta were carried out by the
Queensland Government in the 1980’s. Much of the background information for this report is taken
from these studies. It is known that the Barron River entrance has switched locally during the time
of European settlement (refer Figure 3-2), the location of the River in more distant times is less
certain. Marine seismic profiles show a relatively young major channel across the former land
AQUIS Resort at Great Barrier Reef Coastal Processes Assessments Report to Support EIS
4
Site Resources and Values
G:\Admin\B20270_g_nc_Yorkeys Knob Development\R.B20270.004.04.Coastal.docx
surfaces northeast of the present Richters Creek mouth. This channel appears to be a continuation
of a former river course identifiable onshore leading from Kamerunga to Smithfield and then
northeast towards the Richters Creek mouth. The Barron River may have occupied this course
during the late Pleistocene and switched to its present position sometime during the late
Pleistocene or early Holocene. It appears unlikely that major channel switching has occurred during
the middle and late Holocene i.e. the last 6,000 years.
Figure 3-1 Quaternary Geology of Trinity Bay
AQUIS Resort at Great Barrier Reef Coastal Processes Assessments Report to Support EIS
5
Site Resources and Values
G:\Admin\B20270_g_nc_Yorkeys Knob Development\R.B20270.004.04.Coastal.docx
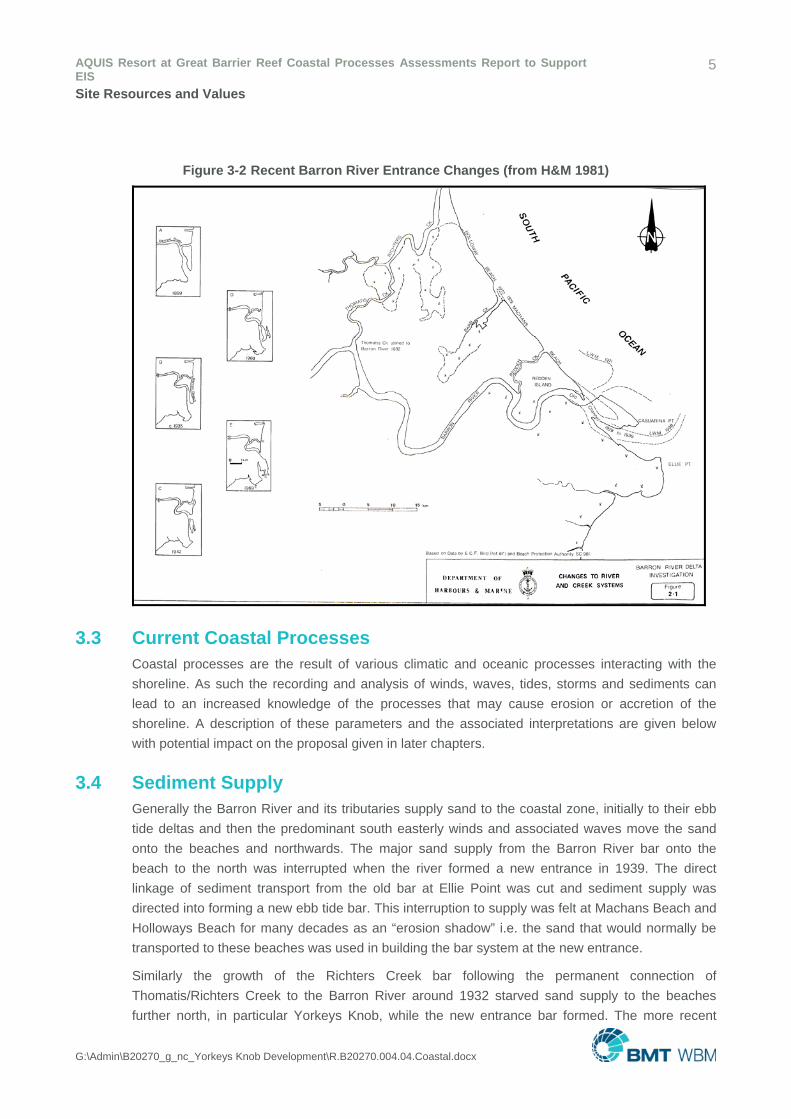
Figure 3-2 Recent Barron River Entrance Changes (from H&M 1981)
3.3 Current Coastal Processes Coastal processes are the result of various climatic and oceanic processes interacting with the
shoreline. As such the recording and analysis of winds, waves, tides, storms and sediments can
lead to an increased knowledge of the processes that may cause erosion or accretion of the
shoreline. A description of these parameters and the associated interpretations are given below
with potential impact on the proposal given in later chapters.
3.4 Sediment Supply Generally the Barron River and its tributaries supply sand to the coastal zone, initially to their ebb
tide deltas and then the predominant south easterly winds and associated waves move the sand
onto the beaches and northwards. The major sand supply from the Barron River bar onto the
beach to the north was interrupted when the river formed a new entrance in 1939. The direct
linkage of sediment transport from the old bar at Ellie Point was cut and sediment supply was
directed into forming a new ebb tide bar. This interruption to supply was felt at Machans Beach and
Holloways Beach for many decades as an “erosion shadow” i.e. the sand that would normally be
transported to these beaches was used in building the bar system at the new entrance.
Similarly the growth of the Richters Creek bar following the permanent connection of
Thomatis/Richters Creek to the Barron River around 1932 starved sand supply to the beaches
further north, in particular Yorkeys Knob, while the new entrance bar formed. The more recent
AQUIS Resort at Great Barrier Reef Coastal Processes Assessments Report to Support EIS
6
Site Resources and Values
G:\Admin\B20270_g_nc_Yorkeys Knob Development\R.B20270.004.04.Coastal.docx
build-up of substantial quantities of sand at Yorkeys Knob is an indication that the supply from the
Richters Creek bar has returned. However, concern regarding the increased Barron River flows
through Thomatis/Richters Creek (up to 35% in the 1980s) lead to a significant study (H&M 1981)
into the stabilisation of the bifurcation to prevent further flow diversion into this tributary. Some of
these works were carried out and the entrance has remained stable.
3.4.1 Waves
The Cairns region is located within the lagoon of the Great Barrier Reef and is generally exposed to
relatively low wave energy from locally generated wind waves. However, tropical cyclones are often
present in the region during summer and these can present extreme, although relatively short lived
events in terms of waves and storm surge.
As part of the WBM 2005 study, EPA (now DEHP) was requested to produce a report for the period
May 1975 to May 2005. This request was made so that comparisons could be made with the
previous report (BPA 1981). There are many different methods available for interpreting and
analysing wave data including the method of handling gaps in the data as well as the parameters
used in the spectral analysis of the individual wave records. Therefore, for consistency over the 30
year intervening period it was considered desirable to apply similar techniques so that any reported
differences were related to the wave conditions rather than the analysis methodology.
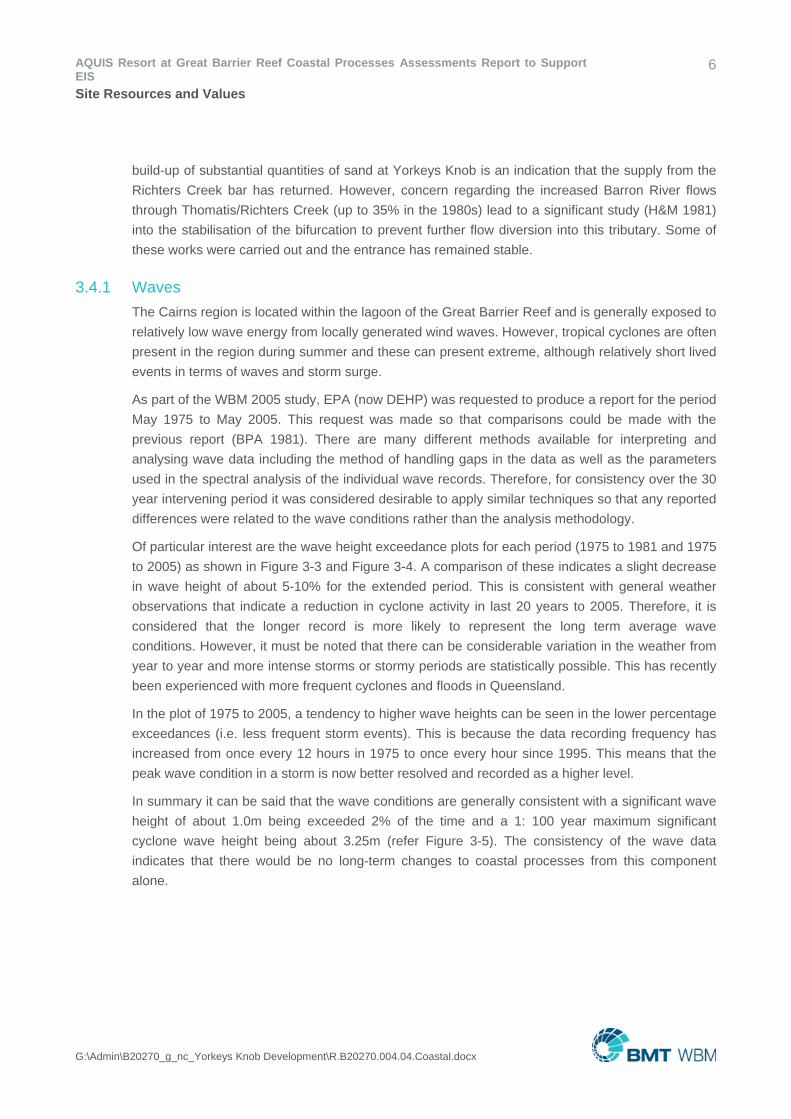
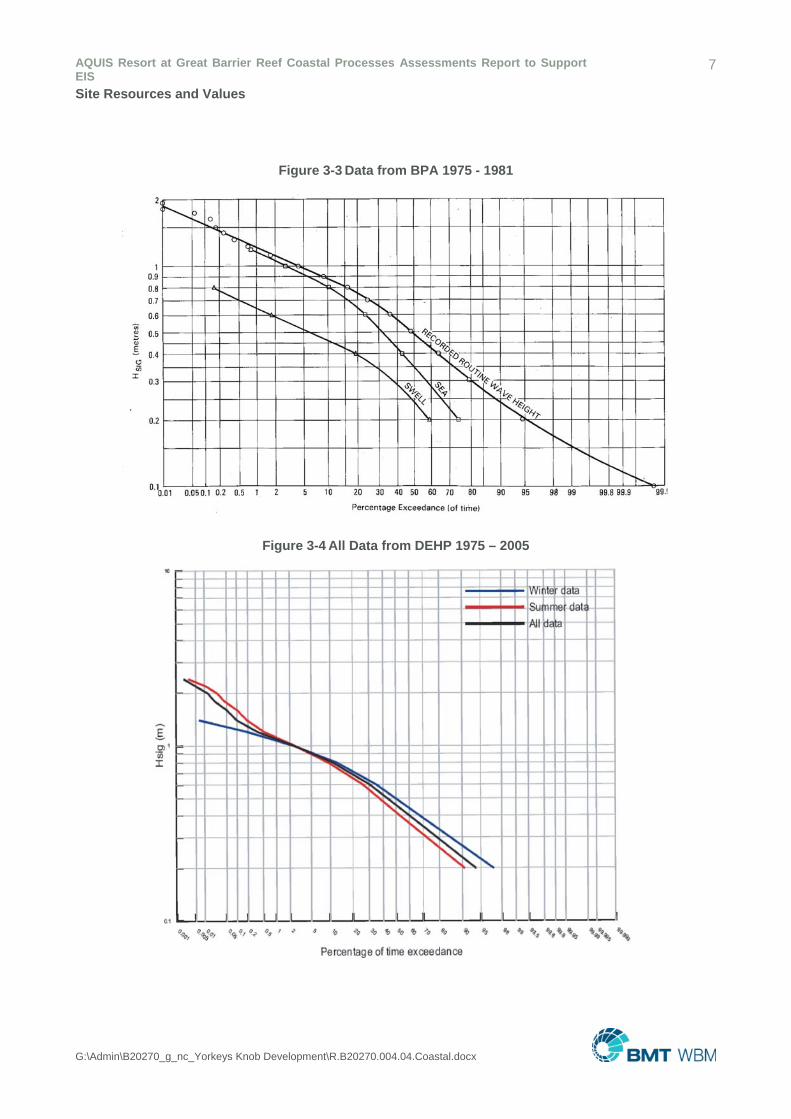
Of particular interest are the wave height exceedance plots for each period (1975 to 1981 and 1975
to 2005) as shown in Figure 3-3 and Figure 3-4. A comparison of these indicates a slight decrease
in wave height of about 5-10% for the extended period. This is consistent with general weather
observations that indicate a reduction in cyclone activity in last 20 years to 2005. Therefore, it is
considered that the longer record is more likely to represent the long term average wave
conditions. However, it must be noted that there can be considerable variation in the weather from
year to year and more intense storms or stormy periods are statistically possible. This has recently
been experienced with more frequent cyclones and floods in Queensland.
In the plot of 1975 to 2005, a tendency to higher wave heights can be seen in the lower percentage
exceedances (i.e. less frequent storm events). This is because the data recording frequency has
increased from once every 12 hours in 1975 to once every hour since 1995. This means that the
peak wave condition in a storm is now better resolved and recorded as a higher level.
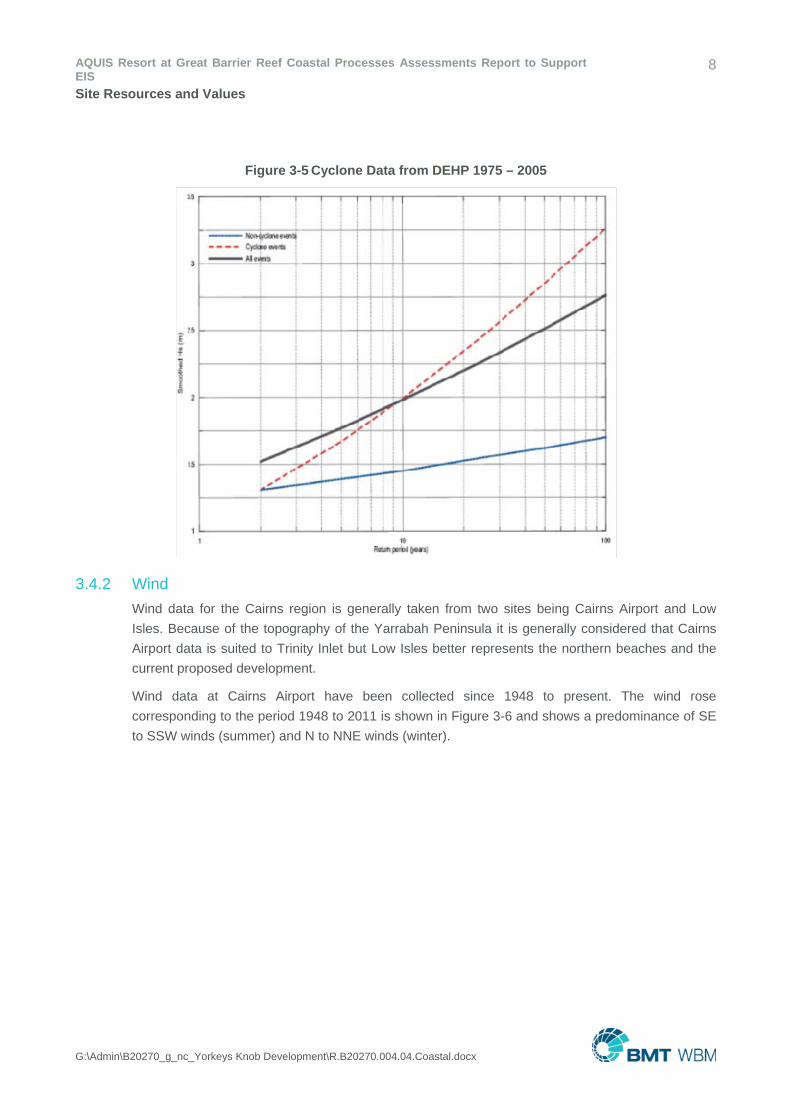
In summary it can be said that the wave conditions are generally consistent with a significant wave
height of about 1.0m being exceeded 2% of the time and a 1: 100 year maximum significant
cyclone wave height being about 3.25m (refer Figure 3-5). The consistency of the wave data
indicates that there would be no long-term changes to coastal processes from this component
alone.
AQUIS Resort at Great Barrier Reef Coastal Processes Assessments Report to Support EIS
7
Site Resources and Values
G:\Admin\B20270_g_nc_Yorkeys Knob Development\R.B20270.004.04.Coastal.docx
Figure 3-3 Data from BPA 1975 - 1981
Figure 3-4 All Data from DEHP 1975 – 2005
AQUIS Resort at Great Barrier Reef Coastal Processes Assessments Report to Support EIS
8
Site Resources and Values
G:\Admin\B20270_g_nc_Yorkeys Knob Development\R.B20270.004.04.Coastal.docx
Figure 3-5 Cyclone Data from DEHP 1975 – 2005
3.4.2 Wind
Wind data for the Cairns region is generally taken from two sites being Cairns Airport and Low
Isles. Because of the topography of the Yarrabah Peninsula it is generally considered that Cairns
Airport data is suited to Trinity Inlet but Low Isles better represents the northern beaches and the
current proposed development.
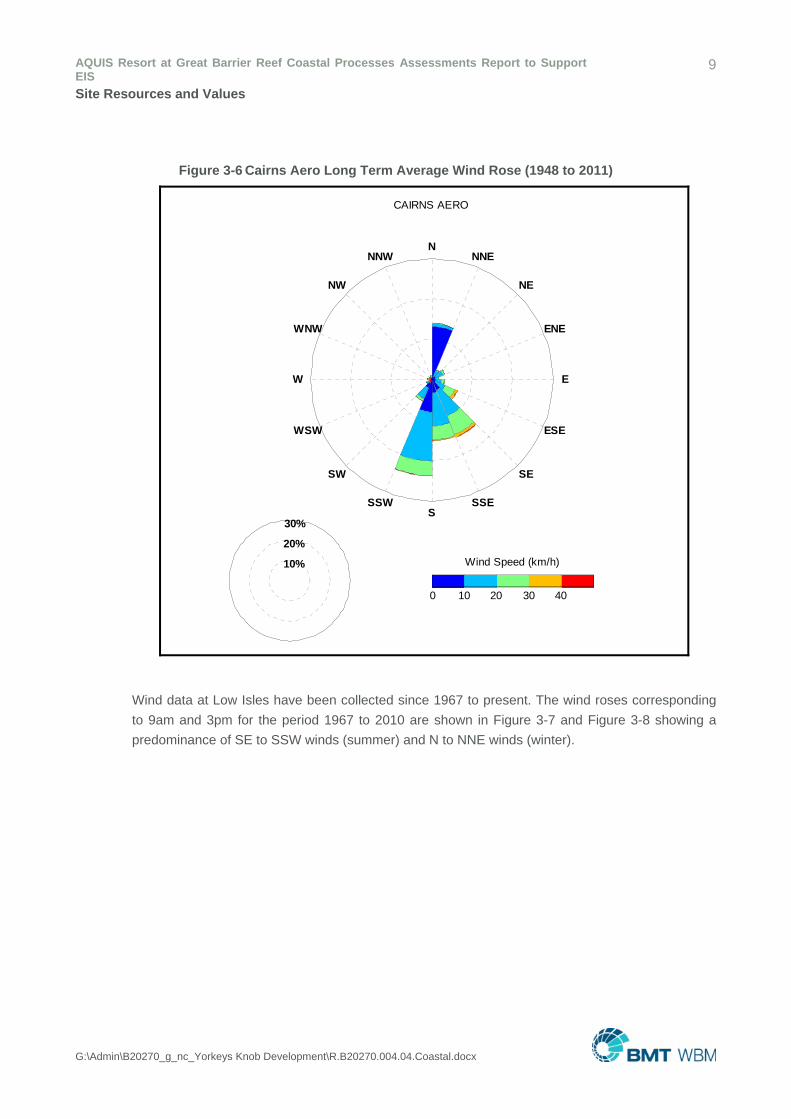
Wind data at Cairns Airport have been collected since 1948 to present. The wind rose
corresponding to the period 1948 to 2011 is shown in Figure 3-6 and shows a predominance of SE
to SSW winds (summer) and N to NNE winds (winter).
AQUIS Resort at Great Barrier Reef Coastal Processes Assessments Report to Support EIS
9
Site Resources and Values
G:\Admin\B20270_g_nc_Yorkeys Knob Development\R.B20270.004.04.Coastal.docx
Figure 3-6 Cairns Aero Long Term Average Wind Rose (1948 to 2011)
ENE
WSW
NE
SW
NNE
SSW
N
S
NNW
SSE
NW
SE
WNW
ESE
W E
CAIRNS AERO
10%
20%
30%
Wind Speed (km/h)
0 10 20 30 40
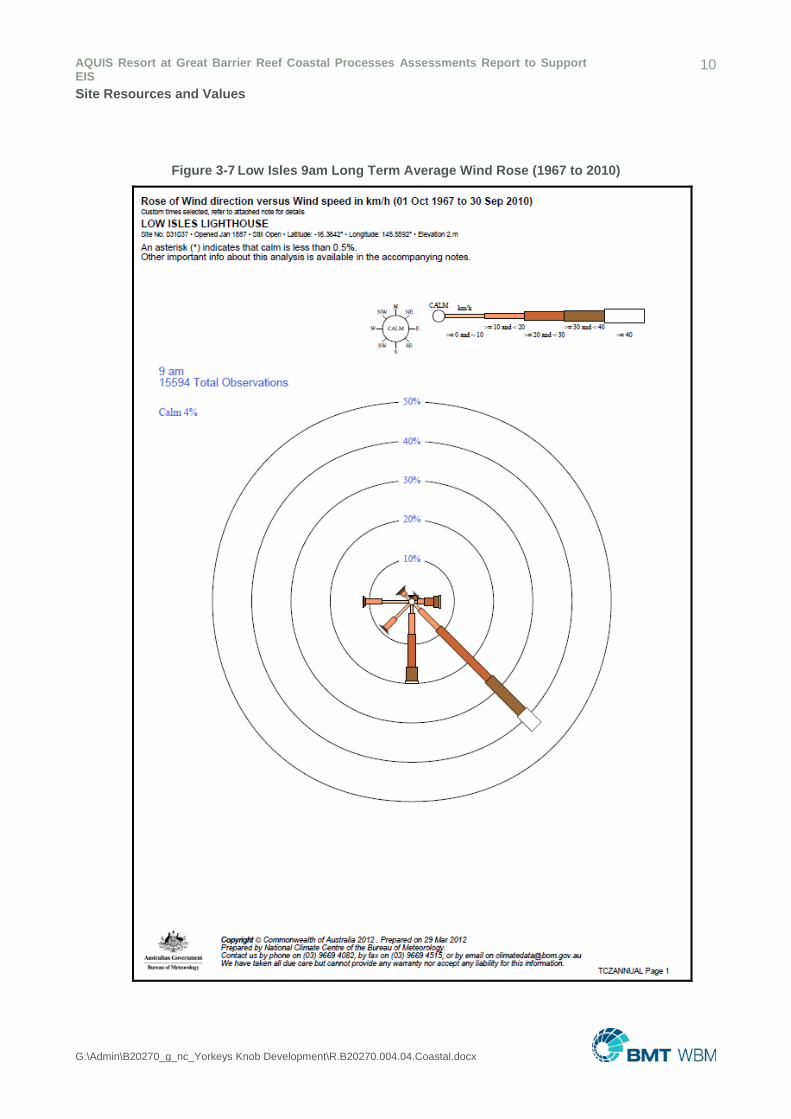
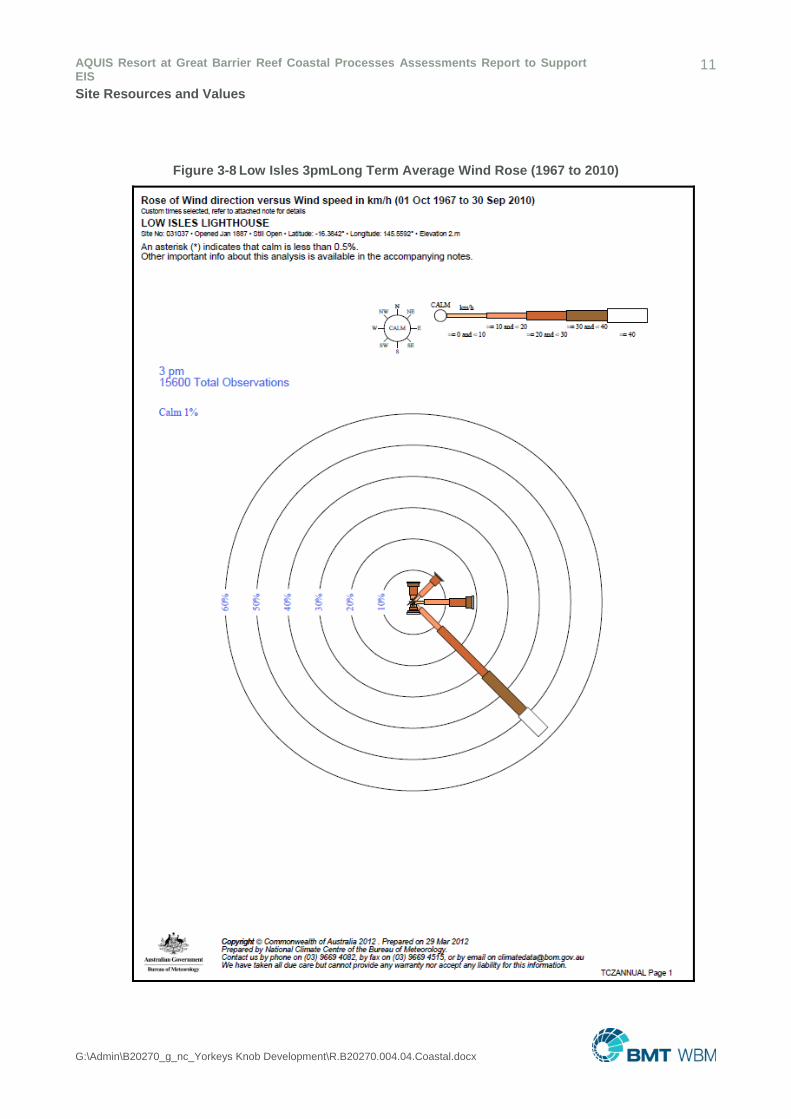
Wind data at Low Isles have been collected since 1967 to present. The wind roses corresponding
to 9am and 3pm for the period 1967 to 2010 are shown in Figure 3-7 and Figure 3-8 showing a
predominance of SE to SSW winds (summer) and N to NNE winds (winter).
AQUIS Resort at Great Barrier Reef Coastal Processes Assessments Report to Support EIS
10
Site Resources and Values
G:\Admin\B20270_g_nc_Yorkeys Knob Development\R.B20270.004.04.Coastal.docx
Figure 3-7 Low Isles 9am Long Term Average Wind Rose (1967 to 2010)
AQUIS Resort at Great Barrier Reef Coastal Processes Assessments Report to Support EIS
11
Site Resources and Values
G:\Admin\B20270_g_nc_Yorkeys Knob Development\R.B20270.004.04.Coastal.docx
Figure 3-8 Low Isles 3pmLong Term Average Wind Rose (1967 to 2010)
AQUIS Resort at Great Barrier Reef Coastal Processes Assessments Report to Support EIS
12
Site Resources and Values
G:\Admin\B20270_g_nc_Yorkeys Knob Development\R.B20270.004.04.Coastal.docx
3.4.3 Sea Level Rise
Consideration needs to be given to the potential for coastal recession associated with an expected
sea level rise (SLR) due to the Greenhouse Effect. Most recent predictions of SLR have been
provided by the Intergovernmental Panel on Climate Change (IPCC 2007) which predicts sea level
rise using world atmospheric models on a 5 yearly basis for different scenarios. Current predictions
of sea level rise for the mid case scenario are 0.4m for 2060 (50 years) and 0.8m for 2100 (100
years).
3.4.4 Tide and Storm Surge
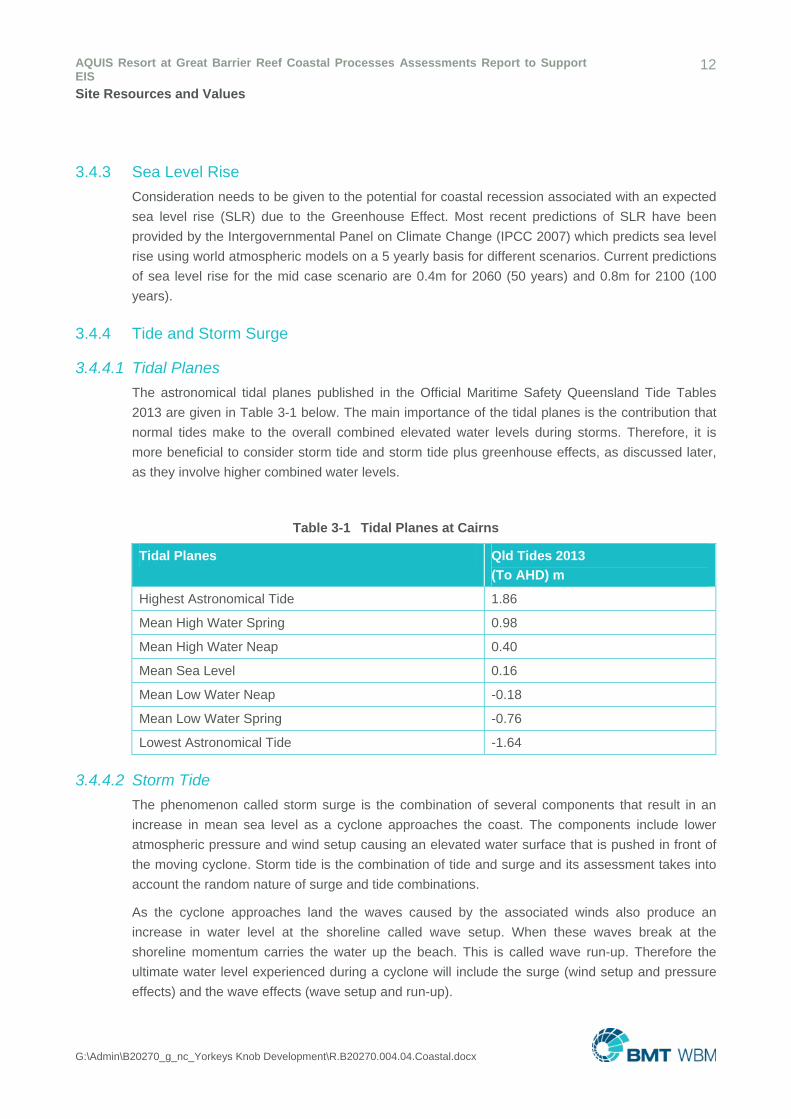
3.4.4.1 Tidal Planes
The astronomical tidal planes published in the Official Maritime Safety Queensland Tide Tables
2013 are given in Table 3-1 below. The main importance of the tidal planes is the contribution that
normal tides make to the overall combined elevated water levels during storms. Therefore, it is
more beneficial to consider storm tide and storm tide plus greenhouse effects, as discussed later,
as they involve higher combined water levels.
Table 3-1 Tidal Planes at Cairns
Tidal Planes Qld Tides 2013
(To AHD) m
Highest Astronomical Tide 1.86
Mean High Water Spring 0.98
Mean High Water Neap 0.40
Mean Sea Level 0.16
Mean Low Water Neap -0.18
Mean Low Water Spring -0.76
Lowest Astronomical Tide -1.64
3.4.4.2 Storm Tide
The phenomenon called storm surge is the combination of several components that result in an
increase in mean sea level as a cyclone approaches the coast. The components include lower
atmospheric pressure and wind setup causing an elevated water surface that is pushed in front of
the moving cyclone. Storm tide is the combination of tide and surge and its assessment takes into
account the random nature of surge and tide combinations.
As the cyclone approaches land the waves caused by the associated winds also produce an
increase in water level at the shoreline called wave setup. When these waves break at the
shoreline momentum carries the water up the beach. This is called wave run-up. Therefore the
ultimate water level experienced during a cyclone will include the surge (wind setup and pressure
effects) and the wave effects (wave setup and run-up).
AQUIS Resort at Great Barrier Reef Coastal Processes Assessments Report to Support EIS
13
Site Resources and Values
G:\Admin\B20270_g_nc_Yorkeys Knob Development\R.B20270.004.04.Coastal.docx
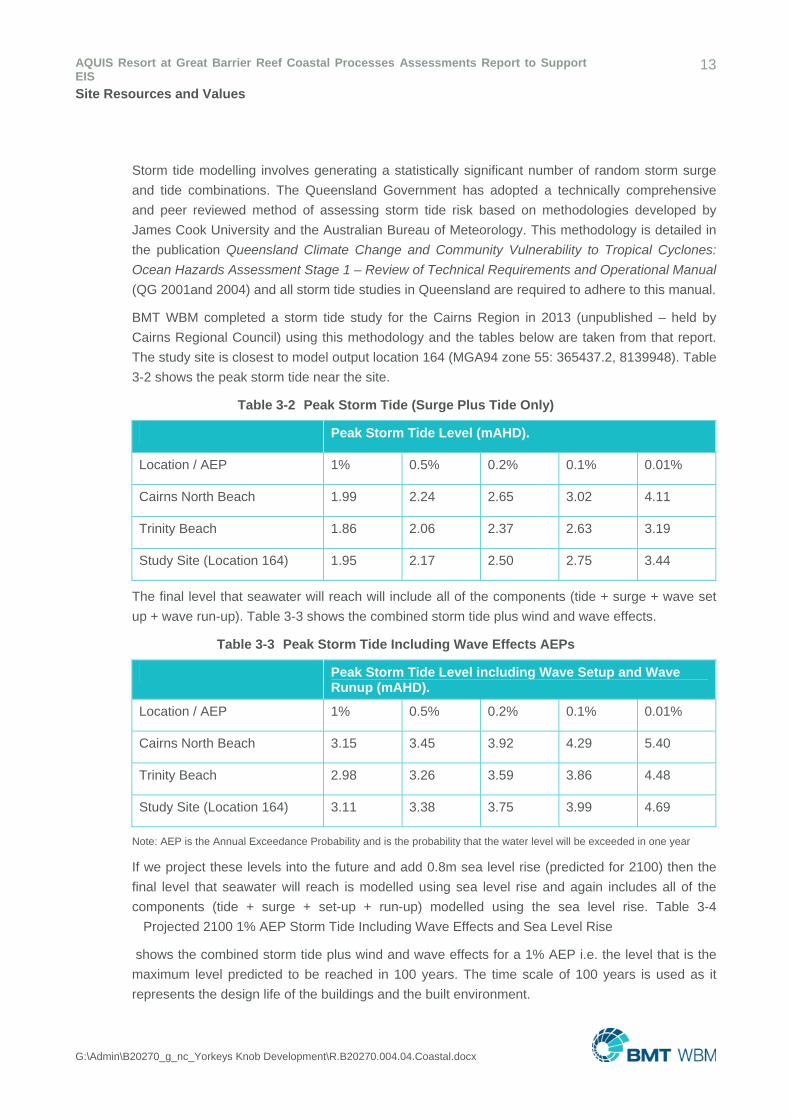
Storm tide modelling involves generating a statistically significant number of random storm surge
and tide combinations. The Queensland Government has adopted a technically comprehensive
and peer reviewed method of assessing storm tide risk based on methodologies developed by
James Cook University and the Australian Bureau of Meteorology. This methodology is detailed in
the publication Queensland Climate Change and Community Vulnerability to Tropical Cyclones:
Ocean Hazards Assessment Stage 1 – Review of Technical Requirements and Operational Manual
(QG 2001and 2004) and all storm tide studies in Queensland are required to adhere to this manual.
BMT WBM completed a storm tide study for the Cairns Region in 2013 (unpublished – held by
Cairns Regional Council) using this methodology and the tables below are taken from that report.
The study site is closest to model output location 164 (MGA94 zone 55: 365437.2, 8139948). Table
3-2 shows the peak storm tide near the site.
Table 3-2 Peak Storm Tide (Surge Plus Tide Only)
Peak Storm Tide Level (mAHD).
Location / AEP 1% 0.5% 0.2% 0.1% 0.01%
Cairns North Beach 1.99 2.24 2.65 3.02 4.11
Trinity Beach 1.86 2.06 2.37 2.63 3.19
Study Site (Location 164) 1.95 2.17 2.50 2.75 3.44
The final level that seawater will reach will include all of the components (tide + surge + wave set
up + wave run-up). Table 3-3 shows the combined storm tide plus wind and wave effects.
Table 3-3 Peak Storm Tide Including Wave Effects AEPs
Peak Storm Tide Level including Wave Setup and Wave Runup (mAHD).
Location / AEP 1% 0.5% 0.2% 0.1% 0.01%
Cairns North Beach 3.15 3.45 3.92 4.29 5.40
Trinity Beach 2.98 3.26 3.59 3.86 4.48
Study Site (Location 164) 3.11 3.38 3.75 3.99 4.69
Note: AEP is the Annual Exceedance Probability and is the probability that the water level will be exceeded in one year
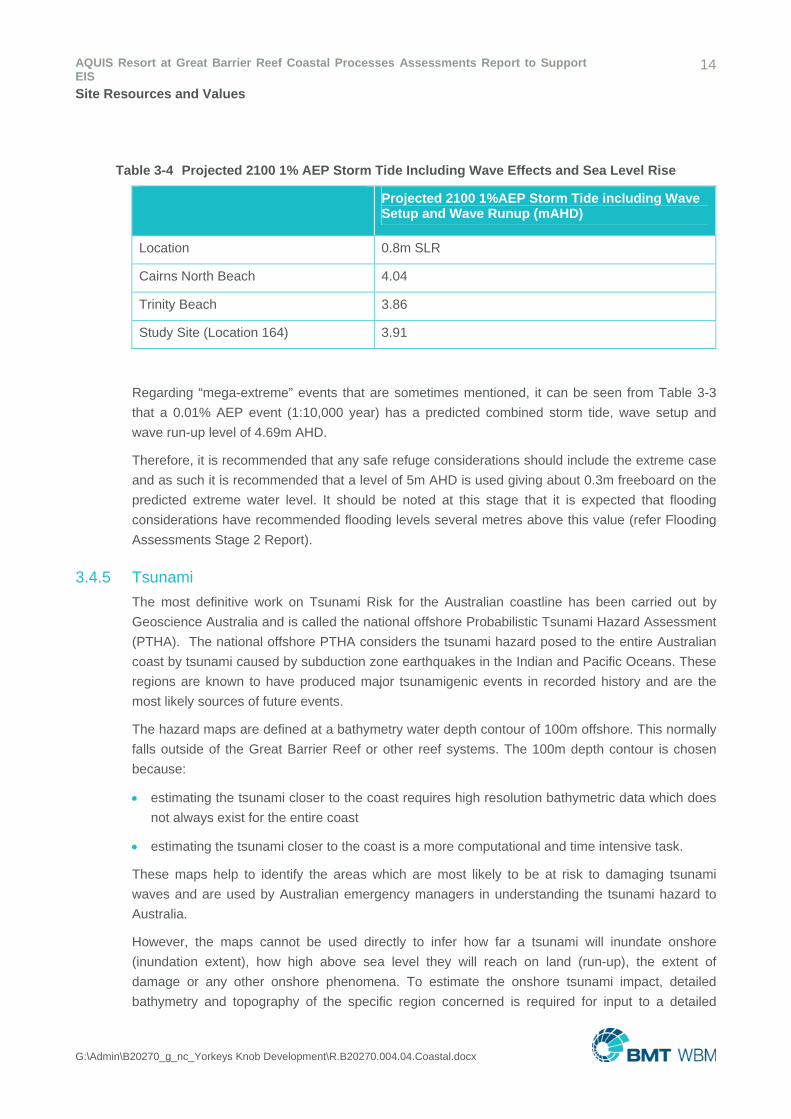
If we project these levels into the future and add 0.8m sea level rise (predicted for 2100) then the
final level that seawater will reach is modelled using sea level rise and again includes all of the
components (tide + surge + set-up + run-up) modelled using the sea level rise. Table 3-4
Projected 2100 1% AEP Storm Tide Including Wave Effects and Sea Level Rise
shows the combined storm tide plus wind and wave effects for a 1% AEP i.e. the level that is the
maximum level predicted to be reached in 100 years. The time scale of 100 years is used as it
represents the design life of the buildings and the built environment.
AQUIS Resort at Great Barrier Reef Coastal Processes Assessments Report to Support EIS
14
Site Resources and Values
G:\Admin\B20270_g_nc_Yorkeys Knob Development\R.B20270.004.04.Coastal.docx
Table 3-4 Projected 2100 1% AEP Storm Tide Including Wave Effects and Sea Level Rise
Projected 2100 1%AEP Storm Tide including Wave Setup and Wave Runup (mAHD)
Location 0.8m SLR
Cairns North Beach 4.04
Trinity Beach 3.86
Study Site (Location 164) 3.91
Regarding “mega-extreme” events that are sometimes mentioned, it can be seen from Table 3-3
that a 0.01% AEP event (1:10,000 year) has a predicted combined storm tide, wave setup and
wave run-up level of 4.69m AHD.
Therefore, it is recommended that any safe refuge considerations should include the extreme case
and as such it is recommended that a level of 5m AHD is used giving about 0.3m freeboard on the
predicted extreme water level. It should be noted at this stage that it is expected that flooding
considerations have recommended flooding levels several metres above this value (refer Flooding
Assessments Stage 2 Report).
3.4.5 Tsunami
The most definitive work on Tsunami Risk for the Australian coastline has been carried out by
Geoscience Australia and is called the national offshore Probabilistic Tsunami Hazard Assessment
(PTHA). The national offshore PTHA considers the tsunami hazard posed to the entire Australian
coast by tsunami caused by subduction zone earthquakes in the Indian and Pacific Oceans. These
regions are known to have produced major tsunamigenic events in recorded history and are the
most likely sources of future events.
The hazard maps are defined at a bathymetry water depth contour of 100m offshore. This normally
falls outside of the Great Barrier Reef or other reef systems. The 100m depth contour is chosen
because:
estimating the tsunami closer to the coast requires high resolution bathymetric data which does
not always exist for the entire coast
estimating the tsunami closer to the coast is a more computational and time intensive task.
These maps help to identify the areas which are most likely to be at risk to damaging tsunami
waves and are used by Australian emergency managers in understanding the tsunami hazard to
Australia.
However, the maps cannot be used directly to infer how far a tsunami will inundate onshore
(inundation extent), how high above sea level they will reach on land (run-up), the extent of
damage or any other onshore phenomena. To estimate the onshore tsunami impact, detailed
bathymetry and topography of the specific region concerned is required for input to a detailed
AQUIS Resort at Great Barrier Reef Coastal Processes Assessments Report to Support EIS
15
Site Resources and Values
G:\Admin\B20270_g_nc_Yorkeys Knob Development\R.B20270.004.04.Coastal.docx
inundation model. The catalogue of tsunami events used to derive the national offshore PTHA can
be used by emergency managers, researchers and individuals however to develop detailed
inundation models at any onshore location.
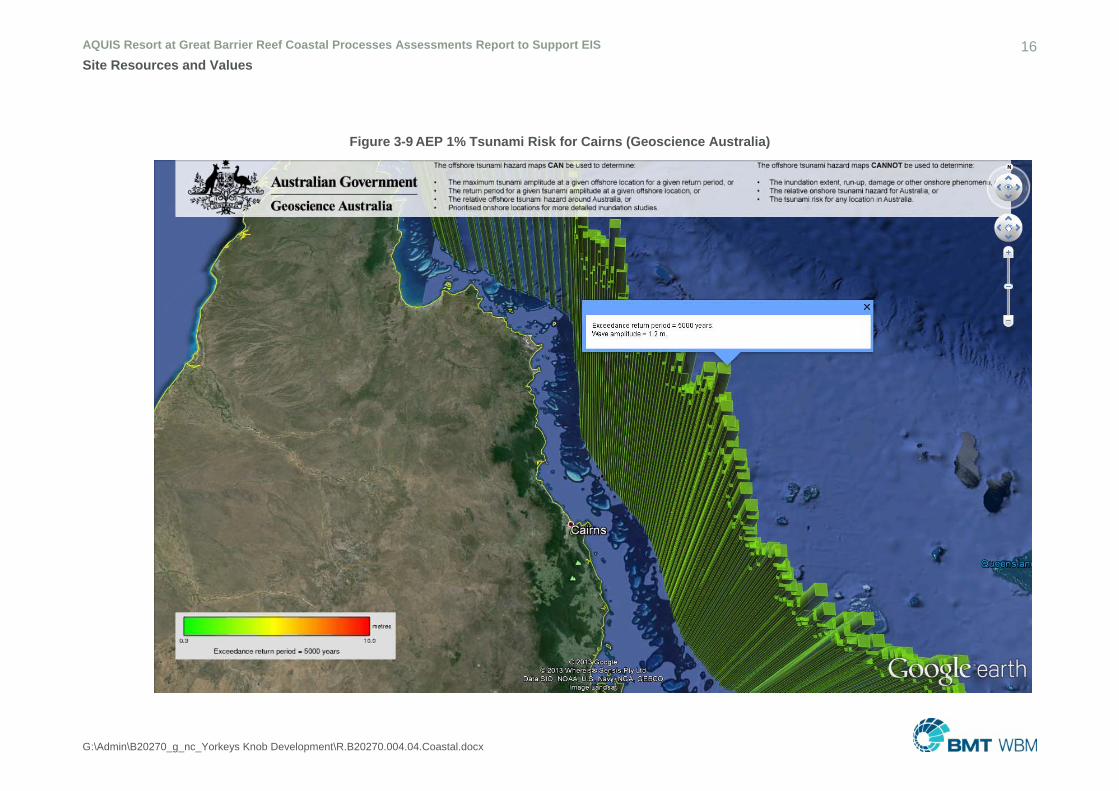
An excerpt from the mapping for the Cairns Region is shown in Figure 3-9 (0.02% AEP). This map
indicates the expected wave height in 100m of water depth outside of the Barrier Reef is 1.2m. As
this wave propagates towards shore it will lose considerable energy passing through the reef but
will gain height as it traverses shallow water near the shore and shoals.
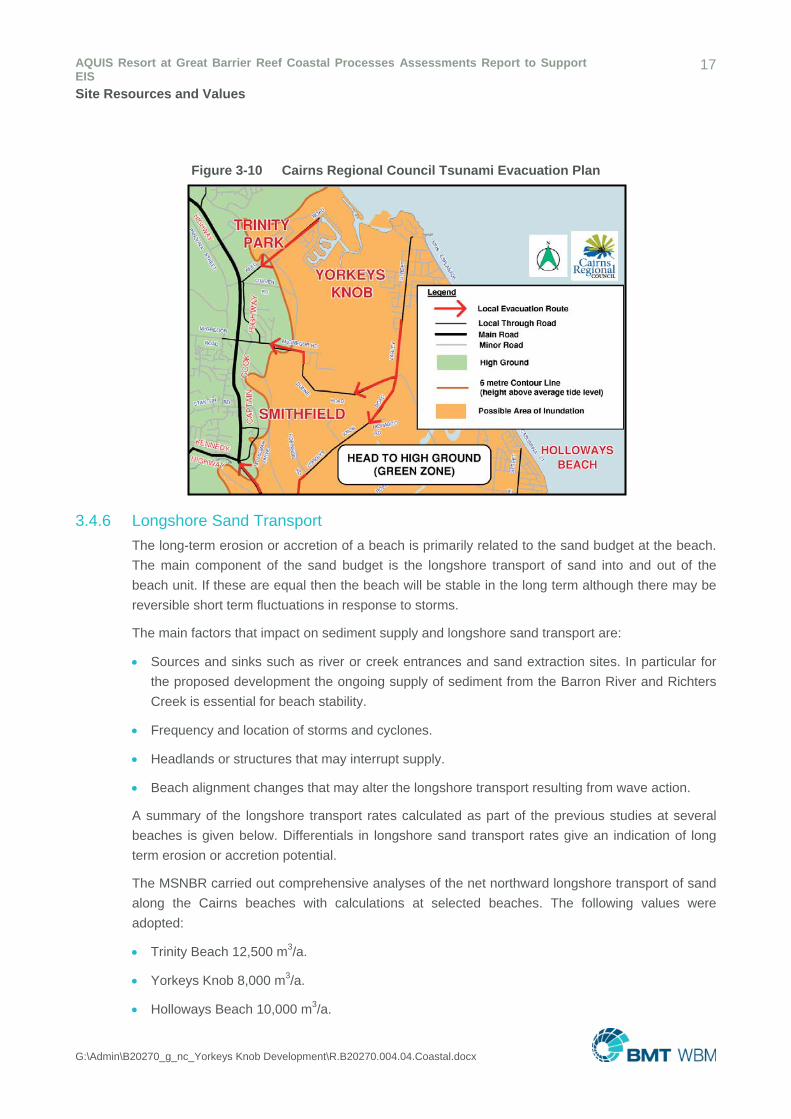
The Cairns Regional Council has produced a Tsunami Evacuation Guide which recommends
evacuation to high ground when a tsunami warning is given. The map relevant to the project site is
shown in Figure 3-10. It should be noted that this guideline warns that “Until the Tsunami alert
system is developed further, the Bureau of Meteorology will only be able to advise that a Tsunami
is approaching. It will not be able to indicate how high the wave is. As a result, Cairns City Council
has developed the attached maps to assist the community should a Tsunami alert be issued”.
AQUIS Resort at Great Barrier Reef Coastal Processes Assessments Report to Support EIS 16 Site Resources and Values
G:\Admin\B20270_g_nc_Yorkeys Knob Development\R.B20270.004.04.Coastal.docx
Figure 3-9 AEP 1% Tsunami Risk for Cairns (Geoscience Australia)
AQUIS Resort at Great Barrier Reef Coastal Processes Assessments Report to Support EIS
17
Site Resources and Values
G:\Admin\B20270_g_nc_Yorkeys Knob Development\R.B20270.004.04.Coastal.docx
Figure 3-10 Cairns Regional Council Tsunami Evacuation Plan
3.4.6 Longshore Sand Transport
The long-term erosion or accretion of a beach is primarily related to the sand budget at the beach.
The main component of the sand budget is the longshore transport of sand into and out of the
beach unit. If these are equal then the beach will be stable in the long term although there may be
reversible short term fluctuations in response to storms.
The main factors that impact on sediment supply and longshore sand transport are:
Sources and sinks such as river or creek entrances and sand extraction sites. In particular for
the proposed development the ongoing supply of sediment from the Barron River and Richters
Creek is essential for beach stability.
Frequency and location of storms and cyclones.
Headlands or structures that may interrupt supply.
Beach alignment changes that may alter the longshore transport resulting from wave action.
A summary of the longshore transport rates calculated as part of the previous studies at several
beaches is given below. Differentials in longshore sand transport rates give an indication of long
term erosion or accretion potential.
The MSNBR carried out comprehensive analyses of the net northward longshore transport of sand
along the Cairns beaches with calculations at selected beaches. The following values were
adopted:
Trinity Beach 12,500 m3/a.
Yorkeys Knob 8,000 m3/a.
Holloways Beach 10,000 m3/a.
AQUIS Resort at Great Barrier Reef Coastal Processes Assessments Report to Support EIS
18
Site Resources and Values
G:\Admin\B20270_g_nc_Yorkeys Knob Development\R.B20270.004.04.Coastal.docx
This resulted in the prediction of accretion of sand on Yorkeys Knob in the order of 2000 m3/a.
Analysis of survey data after the construction of the Yorkeys Point groyne indicates that Yorkeys
Knob beach north of the Richters Creek bar accreted at a rate of 10,000m3/a between 1979 and
1994 which is consistent with the predicted values.
3.4.7 Short Term Storm Erosion Potential
Storm erosion occurs when increased wave heights and water levels result in the erosion of
material from the upper shoreline. On open coasts, the eroded material is taken offshore where it is
deposited as a sand bar located in the vicinity of the wave break area. After the storm event the
sediment is slowly transported onshore, often over many months or several years, rebuilding the
beach.
The potential for short-term storm erosion due to severe wave and elevated sea water levels (surge
conditions) has been predicted using the simple cross-shore equilibrium profile model of Vellinga
(1983). This empirical model calculates upper shoreline erosion associated with storm induced
surge and wave conditions. The amount of shoreline recession is determined from the significant
wave height, the storm surge plus tide level and the initial beach profile shape. The model assumes
the volume of material eroded from the upper shoreline and deposited offshore is balanced by a
setback of the shoreline.
Storm erosion assessment was performed at locations where sufficient offshore profile data was
available. This information was gained from previous surveys of the study area reported by WBM
(2005).
Design water level and wave conditions for the study site were obtained from the Cairns Storm
Tide Study Review (BMT WBM, 2013). The design storm defined for this assessment combined the
1% AEP cyclonic design water level (1.95mAHD) with the 2% AEP cyclonic design wave height
(2.85m). This design storm definition follows guidance for storm erosion assessments described in
the Queensland Coastal Hazard Technical Guide (Queensland Government, 2013).
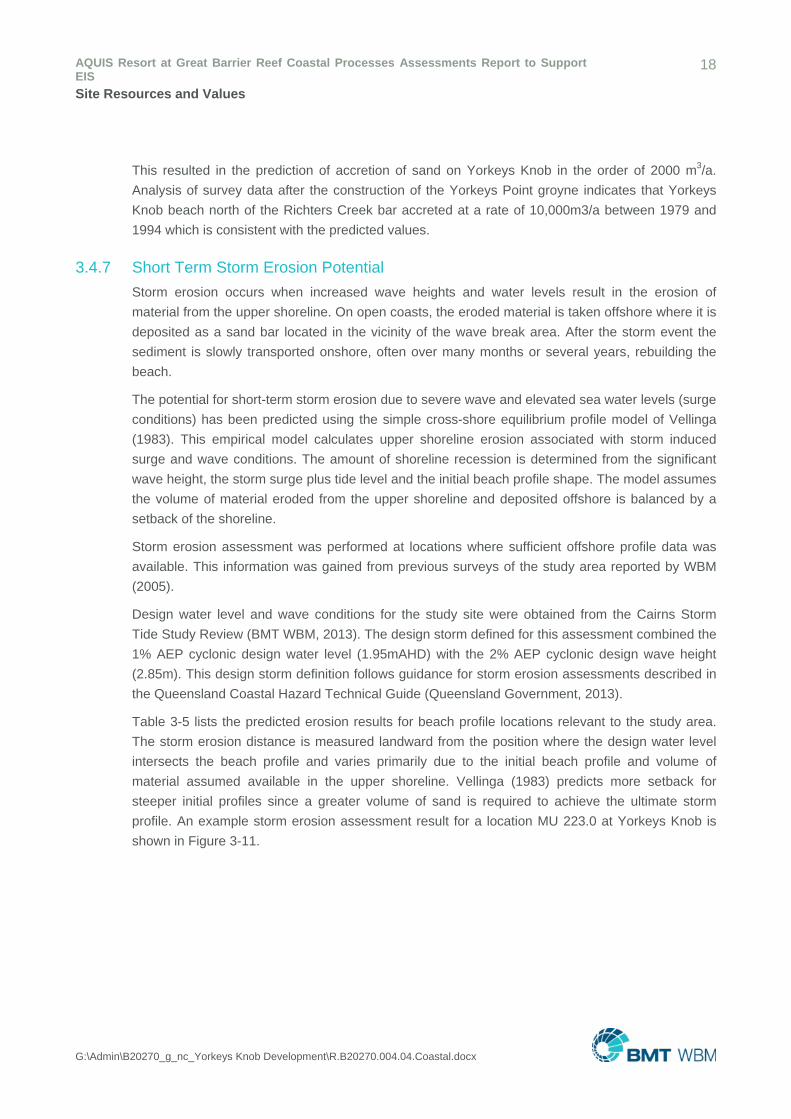
Table 3-5 lists the predicted erosion results for beach profile locations relevant to the study area.
The storm erosion distance is measured landward from the position where the design water level
intersects the beach profile and varies primarily due to the initial beach profile and volume of
material assumed available in the upper shoreline. Vellinga (1983) predicts more setback for
steeper initial profiles since a greater volume of sand is required to achieve the ultimate storm
profile. An example storm erosion assessment result for a location MU 223.0 at Yorkeys Knob is
shown in Figure 3-11.
AQUIS Resort at Great Barrier Reef Coastal Processes Assessments Report to Support EIS
19
Site Resources and Values
G:\Admin\B20270_g_nc_Yorkeys Knob Development\R.B20270.004.04.Coastal.docx
Table 3-5 Vellinga Model Erosion Estimates
Location Vellinga Storm Erosion Potential (m)
MU 219.0 34
MU 219.5 32
MU 220.0 42
MU 222.0 30
MU 222.5 6
MU 223.0 28
Figure 3-11 Example Storm Erosion Assessment Results at Location MU 223.0
It is noted that no attempt to verify the Vellinga (1983) model estimates has been undertaken and
the assessment is assumed to provide conservative erosion potentials. The calculations consider
the upper shoreline to consist of erodible material only and therefore erosion will be overestimated
in areas where rock, dense vegetation and/or manmade structures exist.
The mean storm erosion width estimate across the study area (between existing residential
development at Yorkeys Knob and Holloways Beach) is approximately 29m with an upper value of
42m.
3.4.8 Wave Overtopping
The existing natural surface profile in front of the project site is variable with a general elevation of
about 2.0m AHD. It is assumed that the site itself will be filled to this level before landscaping.
At this level, a 0.2% AEP (500 year) storm tide alone (2.50m AHD) will inundate the site across the
frontal dunes as well as by earlier penetration into the creeks. This storm tide level is expected to
AQUIS Resort at Great Barrier Reef Coastal Processes Assessments Report to Support EIS
20
Site Resources and Values
G:\Admin\B20270_g_nc_Yorkeys Knob Development\R.B20270.004.04.Coastal.docx
be associated with offshore wave conditions in the order of 3.5m Hs. The extreme elevated water
level, assuming run-up will occur, is expected to be 3.75mAHD at present or 3.91mAHD in 2100
(with climate change sea level rise). Under a cyclonic event lasting several hours these waves are
expected to cause significant damage or complete erosion of the frontal dunes allowing depth
limited waves will begin to propagate across the foreshore and dunal area towards the site.
At 0.01% AEP storm tide level (3.44m AHD) inundation and some depth limited wave action are
expected to extend across the foreshore and dunal area to the proposed building and
infrastructure. It is unlikely that wave set up or run up will occur in this scenario and wave energy
will be significantly dissipated by natural surface roughness and turbulence. The design of these
elements may require consideration of armouring against wave attack at final design stage. The
sizing of any armour will be dependent on the details of infrastructure and the design return period
used.
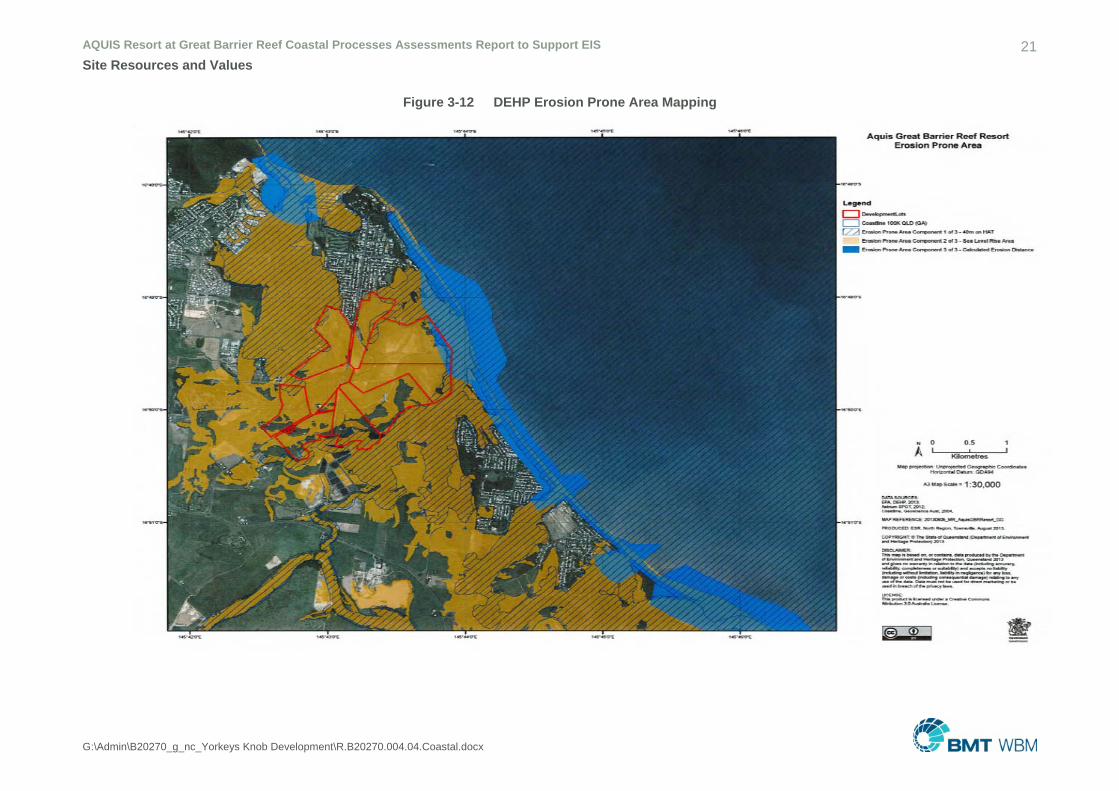
3.4.9 Erosion Prone Area
The current legislation includes three components to a declared Coastal Management District
based on erosion prone area. These include:
Extent of current HAT + 40m;
Calculated shoreline erosion based on the original BPA formula (refer 3.4.9.1); and
HAT + 0.8m to take into account future sea level rise to 2100.
These extents have been mapped by DEHP (refer Figure 3-12).
This section reviews previous technical coastal studies where the expected shoreline erosion due
to coastal processes over the selected planning period has been assessed. The background to the
calculations and the results are given below.
AQUIS Resort at Great Barrier Reef Coastal Processes Assessments Report to Support EIS 21 Site Resources and Values
G:\Admin\B20270_g_nc_Yorkeys Knob Development\R.B20270.004.04.Coastal.docx
Figure 3-12 DEHP Erosion Prone Area Mapping
AQUIS Resort at Great Barrier Reef Coastal Processes Assessments Report to Support EIS
22
Site Resources and Values
G:\Admin\B20270_g_nc_Yorkeys Knob Development\R.B20270.004.04.Coastal.docx
3.4.9.1 Introduction
The then Beach Protection Authority (BPA) introduced the concept of an erosion prone area width
for a beach in the 1980s. These calculations included the short term (storm and cyclonic erosion)
and the long term trends over the planning period of 50 years as well as applying a 40% safety
factor and including a dune scarp component. Although the calculations are for a 50 year planning
period the resulting calculated widths have been applied as ambulatory values by BPA and DEHP
i.e. the width remains constant even if erosion or accretion occurs. Also the calculated width is
taken from the seaward toe of the frontal dune which is usually interpreted as the seaward edge of
vegetation.
The erosion prone area widths were calculated for the entire eastern Queensland coastline by the
then BPA in the early 1980s and represent the area that is prone to erosion. It is generally
recommended that erosion prone areas be retained free of development where possible to
accommodate erosion and avoid the need for protection measures which may be expensive and
detrimental to beach amenity. Plans showing the erosion prone area widths were sent to all
relevant Local Authorities in the 1980’s to assist in their forward planning. These calculated widths
have generally been found to be a robust estimation of the potential erosion width and recently
several independent analyses, using updated and local data, generally result in variations of less
than 20%.
Therefore a discussion of the components considered and the calculation methodology for an
erosion prone area width is given below to assist in the understanding of statements relating to
these widths and the implications for infrastructure and development within these areas.
3.4.9.2 Basic Considerations
Erosion prone area widths are determined to identify the potential extent of erosion of the dune
system over a specified planning period. Both short term (cyclone-related) and longer term
(gradual) trends are included in the assessment together with an allowance for potential sea level
rise associated with the Greenhouse Effect. Provision must also be included for a factor of safety
on the estimates and an allowance made for slumping of the dune scarp following erosion. The
following relationship has been used by the Beach Protection Authority for determination of the
erosion prone area widths. This formula continues to be recognised by EPA as a reasonable
method of assessing shoreline recession risk.
E = [(N x R) + C + G] x (1 + F) + D
Where E = Erosion Prone Area Width (metres)
N = Planning Period (years)
R = Rate of Long Term Erosion (metres/year)
C = Short Term Erosion from the design cyclone (metres)
G = Erosion due to Greenhouse Effect (metres)
F = Factor of Safety
AQUIS Resort at Great Barrier Reef Coastal Processes Assessments Report to Support EIS
23
Site Resources and Values
G:\Admin\B20270_g_nc_Yorkeys Knob Development\R.B20270.004.04.Coastal.docx
D = Dune Scarp Component
The various components in the above relationship are determined on the basis of the
characteristics of the individual beaches together with presently accepted practices as discussed
below with the calculated erosion prone area widths presented in Section 3.4.9.9.
3.4.9.3 Planning Period
The duration of the planning period (N) influences the erosion prone area width calculations by
effecting:
The total extent of gradual long term erosion;
The extent of possible sea level rise due to the Greenhouse Effect; and
The selection of design cyclone conditions which are based on an accepted risk level.
In accordance with current DEHP policy, a planning period of 50 years is used. If a longer design
life is expected then the long term erosion component may increase. However, it should be noted
that as the shoreline south of the Yorkeys Headland control point moves westward then the long
term component will decrease as the angle of the shoreline to dominant wave action will increase
which results in decreased longshore transport.
3.4.9.4 Rate of Long Term Erosion
The rate of long term erosion (R) can be estimated by extrapolating past trends and/or determining
any deficit in the local sediment budget. Consideration is also given to local features and/or
characteristics which may influence the potential extent of long term erosion.
As discussed in Section 2.2 (Geology) sediment has consistently been discharged from the Barron
River delta during the Holocene period with the only interruptions being Barron River entrance
changes when new bars have formed (erosive impact) and the connection of Thomatis Creek to
the Barron River (re-distribution – neutral overall impact). Even though the 1939 entrance change
reduced sand supply to the beaches immediately north of the entrance, the impacts from a similar
event in the future, where development was threatened, could be mitigated by terminal structures
(e.g. Machans and Holloways beaches) or beach and dune nourishment from old bar sand
reserves at Ellie Point. The proposed development is not at threat from shoreline erosion although
the loss of frontal dunes may increase wave penetration during cyclones.
3.4.9.5 Short Term Erosion
Short term erosion (C) of the upper beach and dune can occur from time to time, associated with
cyclone or severe storm events. Such events usually involve co-existing storm surges and high
waves. Storm erosion involves the movement of sand from the upper beach and dune in the
offshore direction. This sand would be returned gradually to the upper beach by wave and wind
action over a relatively longer period of time. In cases where the dune is low and overtopped, sand
may also be carried landwards.
Where appropriate the erosion distance can be calculated on the basis that a characterised
equilibrium beach profile is developed during the cyclone attack and that this profile provides a
AQUIS Resort at Great Barrier Reef Coastal Processes Assessments Report to Support EIS
24
Site Resources and Values
G:\Admin\B20270_g_nc_Yorkeys Knob Development\R.B20270.004.04.Coastal.docx
volume balance between the material eroded from the upper beach/dune and that deposited on the
lower zone of the beach slope. The empirical Edelman method as modified by Vellinga, 1983 can
be used for this type of calculation. This method predicts an equilibrium profile based on the wave
height and grain size of the dune sand.
3.4.9.6 Erosion Due to Greenhouse Effect
Provision is required for coastal recession associated with an expected sea level rise due to the
Greenhouse Effect (G). It is impossible to state conclusively by how much the sea will rise, and no
policy yet exists regarding the appropriate provision which should be made in the design of new
coastal developments. However, the Intergovernmental Panel on Climate Change predicts sea
level rise using world atmospheric models on a 5 yearly basis. Currently the EPA uses a predicted
rise of 0.4m for a 50 year planning timeframe.
In assessing the coastal recession associated with an increase in mean sea level, consideration
has been given to the geography of the area, existing beach profiles and sediment characteristics.
It is considered that beach ridges are likely to be predominantly wave formed with the coarser
particles being moved onshore to the upper beach face/dune and the finer particles remaining in
the nearshore zone. This has resulted in beach profiles with two distinct slopes; a steep upper
beach face with coarse sand and a flat nearshore zone with fine sand.
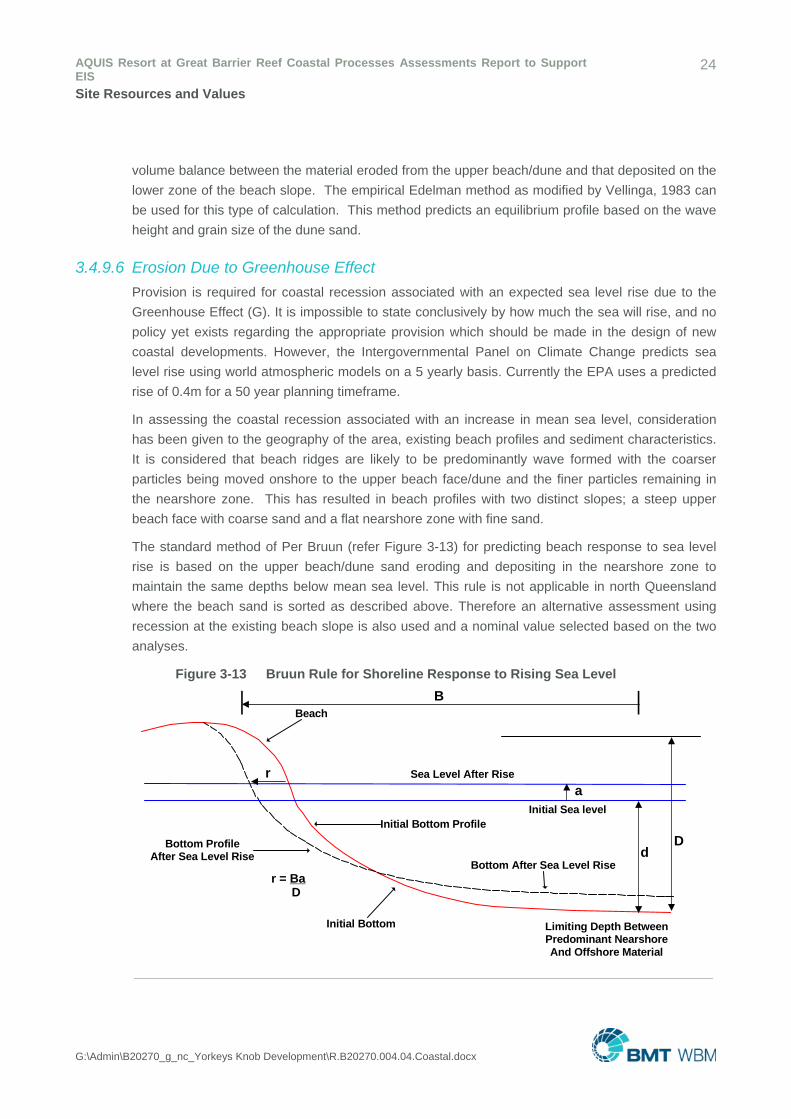
The standard method of Per Bruun (refer Figure 3-13) for predicting beach response to sea level
rise is based on the upper beach/dune sand eroding and depositing in the nearshore zone to
maintain the same depths below mean sea level. This rule is not applicable in north Queensland
where the beach sand is sorted as described above. Therefore an alternative assessment using
recession at the existing beach slope is also used and a nominal value selected based on the two
analyses.
Figure 3-13 Bruun Rule for Shoreline Response to Rising Sea Level
Bottom After Sea Level Rise
Initial Bottom Limiting Depth BetweenPredominant NearshoreAnd Offshore Material
Sea Level After Rise
Initial Sea level
Beach
Initial Bottom Profile
Bottom ProfileAfter Sea Level Rise
r = Ba D
r
B
a
d D
AQUIS Resort at Great Barrier Reef Coastal Processes Assessments Report to Support EIS
25
Site Resources and Values
G:\Admin\B20270_g_nc_Yorkeys Knob Development\R.B20270.004.04.Coastal.docx
3.4.9.7 Factor of Safety
A factor of safety (F) is included in the assessments of the short term, long term and Greenhouse
Effect erosion components to provide for uncertainties and error margins in the calculation
procedures. In accordance with current policies, this factor of safety has been set at 40%.
3.4.9.8 Dune Scarp Component
The erosion prone areas are specified as measured from the toe of the frontal dune. The short and
long term erosion components provide a measure of the recession of the dune toe. The dune
scarp component (D) provides for the horizontal distance between the toe and the crest after
slumping to a stable slope (about 1 in 3).
3.4.9.9 Erosion Prone Area Width for Project Site
For the beach between Richters Creek entrance and Yorkeys Knob the then BPA declared an
erosion prone area of 40m at the protected northern end of the beach and 70m at the unprotected
southern end in 1984. This included a short term erosion component of 25m and a long term rate of
nil for the protected northern end and of 0.4m/a for the unprotected southern end. A dune scarp
component of 5m was included but not the impact of sea level rise due to the Greenhouse effect.
The more recent assessments (WBM 2005) of the impact of sea level rise have adopted a nominal
width of 10m (for a 100 year planning period the predicted 100 year SLR of 0.8m lead to an
expected width of 20m). It is considered that all the values adopted in the assessment are still
acceptable and adopted an erosion prone area width including Greenhouse effects of 50m for the
northern end and 80m for the southern end. Further recent detailed analysis of storm erosion
suggests that the short term erosion component is likely to be 30-40m rather than 20-25m.
Therefore, a conservative value of 20m has been added to the previous values. The resulting
recommended erosion prone area width in metres is:
E = (((50yr x 0.4m/a) + 40m + 10m) x 1.4) + 5m = 103m (adopt 105m)
In the area between Yorkeys Creek and Richters Creek a default value of 400m was used by the
then BPA in consideration of the likely movement of the entrances to the creeks over time. This is
an indication of channel meander widths and is not suggestive of wave erosion processes. The
more recent assessments (WBM 2005) considered that this value is still acceptable as no further
information is available on likely creek meandering.
South of the Richters Creek entrance the then BPA declared an erosion prone area of 105m in
1984. This included a short term erosion component of 20m, a long term rate of 1.0m/a and a dune
scarp component of 5m but has not included the impact of sea level rise due to the Greenhouse
effect. It is considered that all the values adopted in the assessment are still acceptable. Recent
regional assessments of the impact of sea level rise have adopted a nominal width of 10m (for a
100 year planning period the predicted 100 year SLR of 0.8m lead to an expected width of 20m).
Further recent detailed analysis of storm erosion suggests that the short term erosion component is
likely to be 30-40m rather than 20-25m. Therefore, a conservative value of 20m has been added to
the previous values. The resulting recommended erosion prone area is:
E = (((50yr x 1.0m/a) + 40m + 10m) x 1.4) + 5m = 145m
AQUIS Resort at Great Barrier Reef Coastal Processes Assessments Report to Support EIS
26
Site Resources and Values
G:\Admin\B20270_g_nc_Yorkeys Knob Development\R.B20270.004.04.Coastal.docx
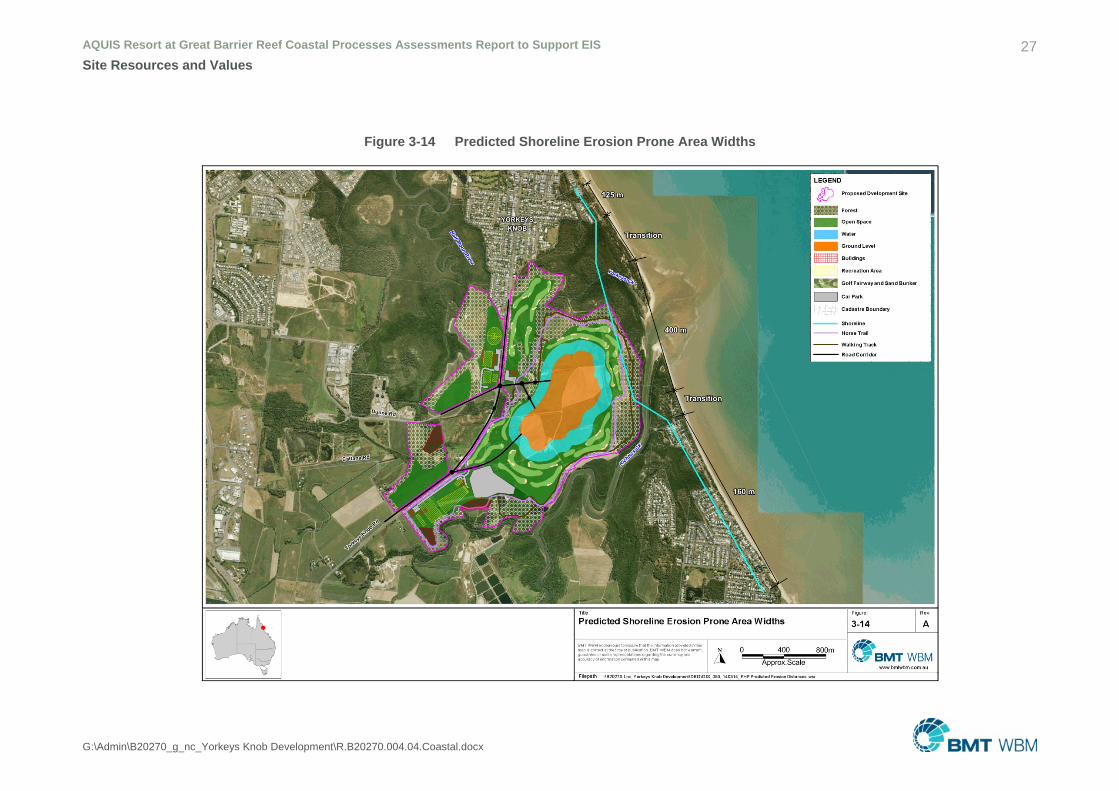
The shoreline erosion widths are shown in Figure 3-14 below. While the predicted shoreline
erosion is within the site boundary, the proposed buildings and infrastructure are just outside.
AQUIS Resort at Great Barrier Reef Coastal Processes Assessments Report to Support EIS 27 Site Resources and Values
G:\Admin\B20270_g_nc_Yorkeys Knob Development\R.B20270.004.04.Coastal.docx
Figure 3-14 Predicted Shoreline Erosion Prone Area Widths
AQUIS Resort at Great Barrier Reef Coastal Processes Assessments Report to Support EIS
28
Site Resources and Values
G:\Admin\B20270_g_nc_Yorkeys Knob Development\R.B20270.004.04.Coastal.docx
3.5 Legislation Development and land management activities in the coastal zone in Queensland are regulated
under a number of different Acts, including the Coastal Protection and Management Act 1995 and
the Sustainable Planning Act 2009. Under these Acts, different planning instruments apply
constraints and/or requirements upon development activities. These instruments include:
Queensland Coastal Plan (QCP);
State Development Assessment Provisions (SDAP); and
Coastal Protection State Planning Regulatory Provisions (SPRP).
Each of these instruments has particular focus for development in the erosion prone area (EPA),
storm-tide inundation area (STIA) and coastal management district (CMD), and relate in particular
to the coastal hazards of erosion, sea-level rise (SLR) and defined storm tide events (DSTE).
Other coastal matters considered under these instruments include ecological values and
ecosystems, and public access. These matters are considered in other AQUIS studies.
3.5.1 Queensland Coastal Plan
3.5.1.1 Legislative Requirement
The QCP is a planning instrument under the Coastal Protection and Management Act 1995 which
guides managers of land and coastal resources within the coastal zone. For the purposes of
development assessment, the SDAP and Coastal Protection SPRP are the relevant assessment
instruments, as the QCP applies only to management of coastal land.
In relation to the EPA and CMD, the QCP has two relevant policies:
2 Buildings and structures in erosion prone areas; and
7 Buildings and structures on State coastal land.
The QCP requires buildings and structures in the EPA to be located as landward as possible in a
manner that minimises the need for erosion protection works (2.1). If the land is reserved State
land, the development needs to be in accordance with the purpose of the reserve (2.2). This will
apply for the aspects of the development which do occur on reserved land.
If the land is State coastal land (usually the CMD) there needs to be proof of a public need for the
development to support use and enjoyment of the coast (7.1). The development must also
complement the local landscape character (7.2). These provisions do not apply to freehold land.
Other policies under the QCP include areas of high ecological significance (HES) (4), indigenous
cultural heritage (5) and public access (6). Relevant considerations under these policies include
avoiding adverse impacts on areas of HES (but see Coastal Protection SPRP 3.2.4), encouraging
Traditional Owners to participate in planning for the management of the coast, and maintaining or
enhancing public access except where there was a net public benefit. These policies are further
reflected under the Coastal Protection SPRP (see Section 3.5.3.1).
AQUIS Resort at Great Barrier Reef Coastal Processes Assessments Report to Support EIS
29
Site Resources and Values
G:\Admin\B20270_g_nc_Yorkeys Knob Development\R.B20270.004.04.Coastal.docx
3.5.1.2 Mitigation Options
The project infrastructure shown in the IAS concept plans is located approximately 600m landward
of the current shoreline and is outside of the calculated shoreline erosion prone area (maximum
400m) and at the western extent of the Holocene accretion zone which is the result of continued
accretion over the last 6000 years due to sediment discharge from the Barron River.
The assessment of coastal erosion in this report indicates that the landward location of the
proposed development will ensure it has no impact on coastal processes.
3.5.2 State Development Assessment Provisions
3.5.2.1 Legislative Requirements
The SDAP represent the collection of planning requirements under all referral jurisdictions that
previously existed under the Integrated Development Assessment System (IDAS). It is a planning
instrument used by the Single Assessment and Referral Agency (SARA).1 The SDAP applies
when assessing development applications.
Module 10: Coastal protection applies to tidal works and other development in the CMD and
coastal zone. This module is based on one overarching purpose: ‘to ensure development in
coastal areas (1) is managed to protect and conserve environmental, social and economic coastal
resources, (2) enhances the resilience of coastal communities to coastal hazards.’ This is
achieved by either by meeting the acceptable outcomes or performance outcomes of the
assessment table, or by meeting the purpose of the module.
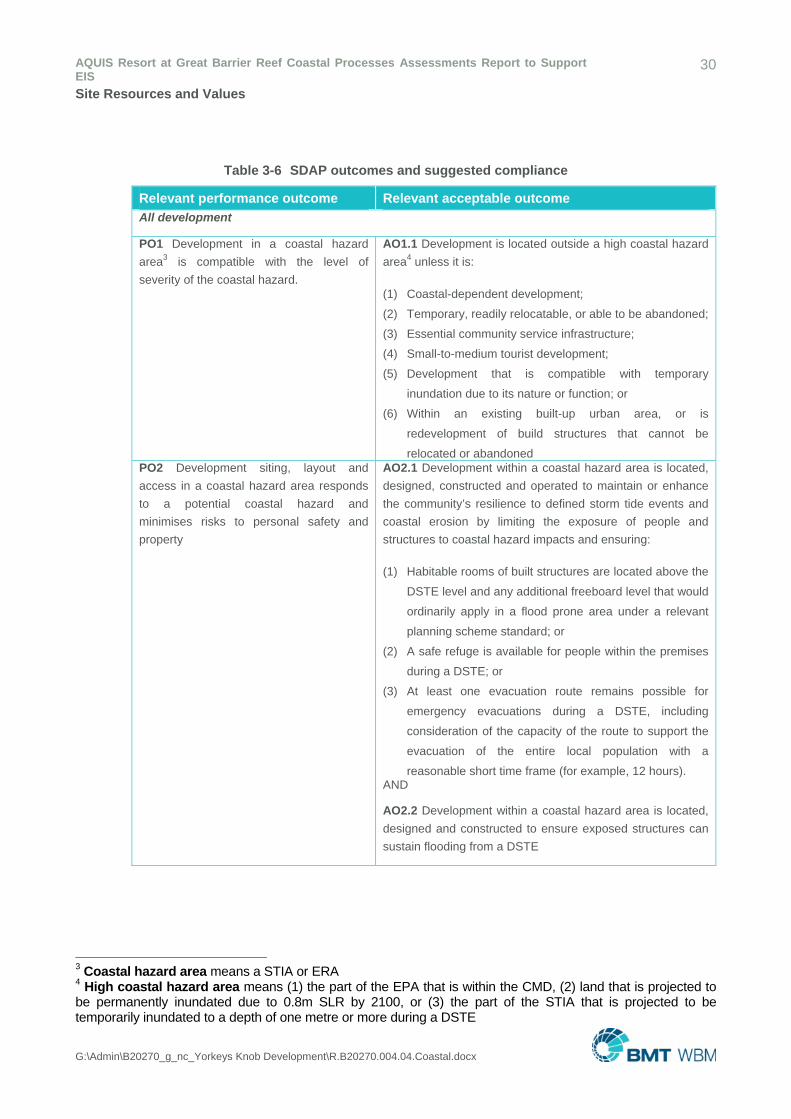
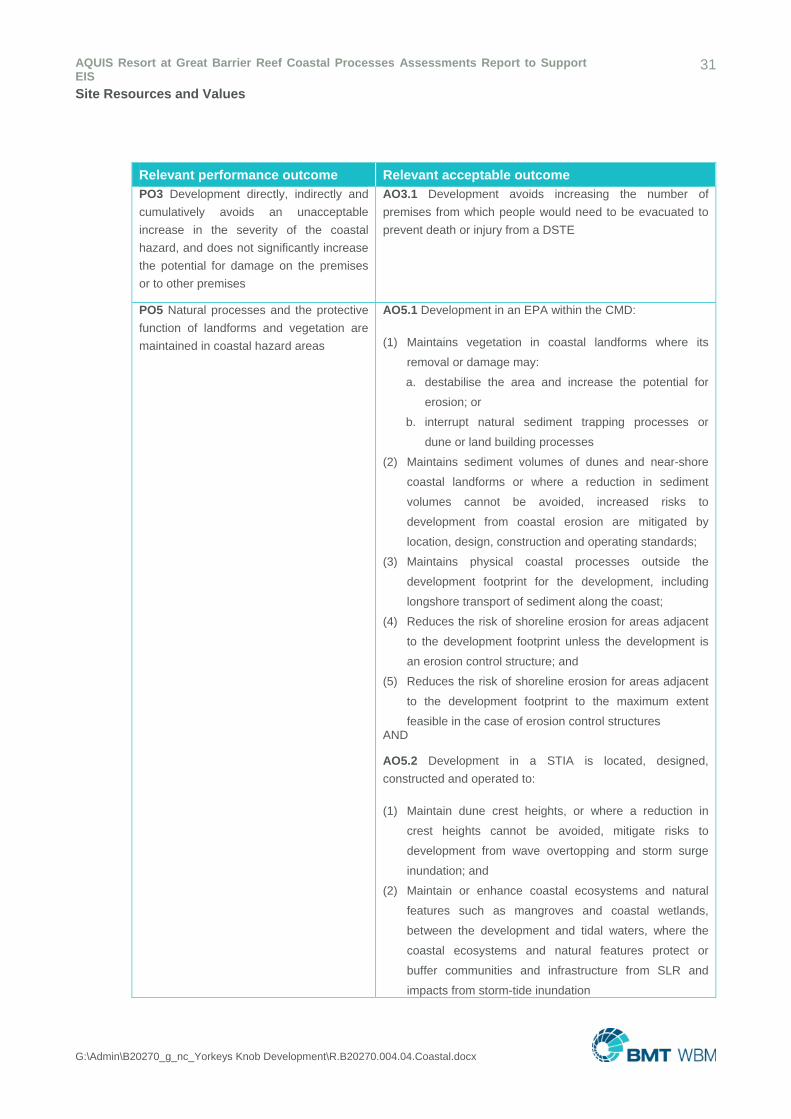
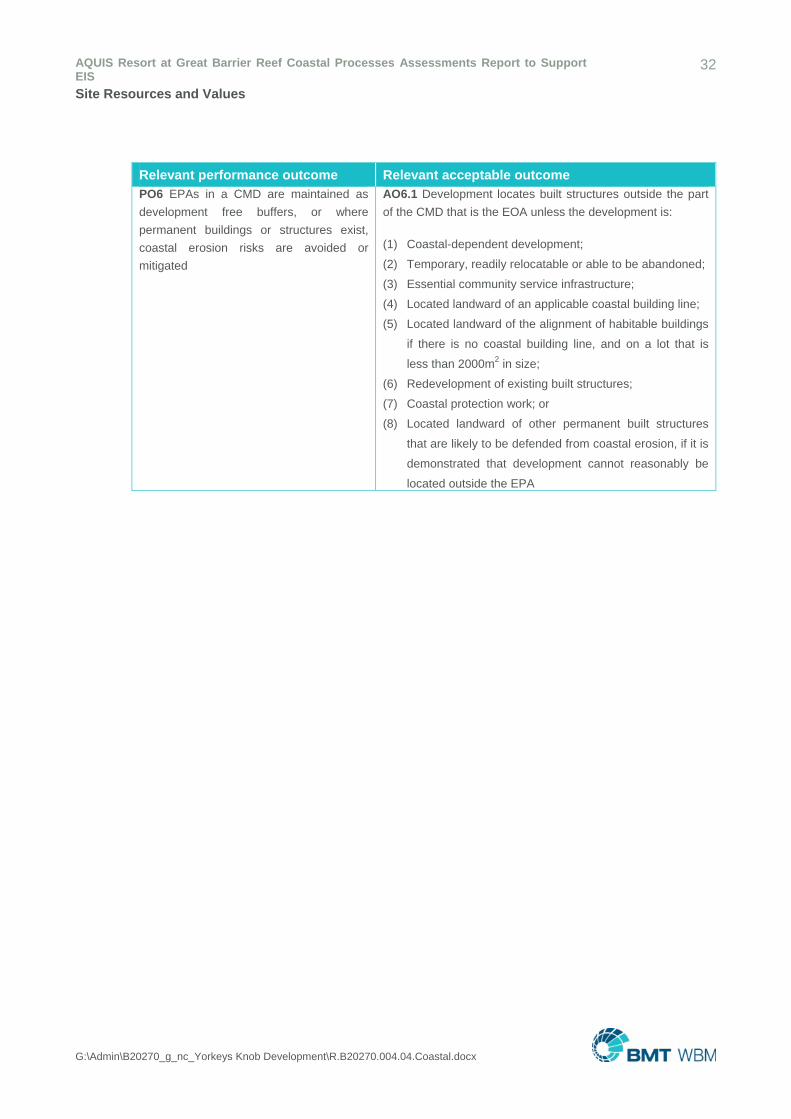
Table 3-6 summarises the relevant outcomes for the proposed development. Proposed/potential
compliance is discussed below. In summary, the SDAP require development in the EPA and CMD
to consider and account for coastal hazards, including by planning for SLR and evacuation during a
DSTE. Other concerns are the need to avoid adverse impacts on coastal resources and values,
including matters of state environmental significance (MSES),2 and maintaining public access to
the foreshore.
NB – where compliance with the relevant performance outcome or acceptable outcome cannot be
established, development may still be approved as long as it complies with the purpose of the
module.
1 Department of State Development, Infrastructure and Planning (DSDIP) 2 MSES are identified under the DSDIP’s draft Matters of National and State Significance: State Planning Policy fact sheet (http://www.dsdip.qld.gov.au/resources/policy/state-planning/draft-spp-fact-sheet-mnses.pdf)
AQUIS Resort at Great Barrier Reef Coastal Processes Assessments Report to Support EIS
30
Site Resources and Values
G:\Admin\B20270_g_nc_Yorkeys Knob Development\R.B20270.004.04.Coastal.docx
Table 3-6 SDAP outcomes and suggested compliance
Relevant performance outcome Relevant acceptable outcome
All development
PO1 Development in a coastal hazard
area3 is compatible with the level of
severity of the coastal hazard.
AO1.1 Development is located outside a high coastal hazard
area4 unless it is:
(1) Coastal-dependent development;
(2) Temporary, readily relocatable, or able to be abandoned;
(3) Essential community service infrastructure;
(4) Small-to-medium tourist development;
(5) Development that is compatible with temporary
inundation due to its nature or function; or
(6) Within an existing built-up urban area, or is
redevelopment of build structures that cannot be
relocated or abandoned PO2 Development siting, layout and
access in a coastal hazard area responds
to a potential coastal hazard and
minimises risks to personal safety and
property
AO2.1 Development within a coastal hazard area is located,
designed, constructed and operated to maintain or enhance
the community’s resilience to defined storm tide events and
coastal erosion by limiting the exposure of people and
structures to coastal hazard impacts and ensuring:
(1) Habitable rooms of built structures are located above the
DSTE level and any additional freeboard level that would
ordinarily apply in a flood prone area under a relevant
planning scheme standard; or
(2) A safe refuge is available for people within the premises
during a DSTE; or
(3) At least one evacuation route remains possible for
emergency evacuations during a DSTE, including
consideration of the capacity of the route to support the
evacuation of the entire local population with a
reasonable short time frame (for example, 12 hours). AND
AO2.2 Development within a coastal hazard area is located,
designed and constructed to ensure exposed structures can
sustain flooding from a DSTE
3 Coastal hazard area means a STIA or ERA 4 High coastal hazard area means (1) the part of the EPA that is within the CMD, (2) land that is projected to be permanently inundated due to 0.8m SLR by 2100, or (3) the part of the STIA that is projected to be temporarily inundated to a depth of one metre or more during a DSTE
AQUIS Resort at Great Barrier Reef Coastal Processes Assessments Report to Support EIS
31
Site Resources and Values
G:\Admin\B20270_g_nc_Yorkeys Knob Development\R.B20270.004.04.Coastal.docx
Relevant performance outcome Relevant acceptable outcome
PO3 Development directly, indirectly and
cumulatively avoids an unacceptable
increase in the severity of the coastal
hazard, and does not significantly increase
the potential for damage on the premises
or to other premises
AO3.1 Development avoids increasing the number of
premises from which people would need to be evacuated to
prevent death or injury from a DSTE
PO5 Natural processes and the protective
function of landforms and vegetation are
maintained in coastal hazard areas
AO5.1 Development in an EPA within the CMD:
(1) Maintains vegetation in coastal landforms where its
removal or damage may:
a. destabilise the area and increase the potential for
erosion; or
b. interrupt natural sediment trapping processes or
dune or land building processes
(2) Maintains sediment volumes of dunes and near-shore
coastal landforms or where a reduction in sediment
volumes cannot be avoided, increased risks to
development from coastal erosion are mitigated by
location, design, construction and operating standards;
(3) Maintains physical coastal processes outside the
development footprint for the development, including
longshore transport of sediment along the coast;
(4) Reduces the risk of shoreline erosion for areas adjacent
to the development footprint unless the development is
an erosion control structure; and
(5) Reduces the risk of shoreline erosion for areas adjacent
to the development footprint to the maximum extent
feasible in the case of erosion control structures AND
AO5.2 Development in a STIA is located, designed,
constructed and operated to:
(1) Maintain dune crest heights, or where a reduction in
crest heights cannot be avoided, mitigate risks to
development from wave overtopping and storm surge
inundation; and
(2) Maintain or enhance coastal ecosystems and natural
features such as mangroves and coastal wetlands,
between the development and tidal waters, where the
coastal ecosystems and natural features protect or
buffer communities and infrastructure from SLR and
impacts from storm-tide inundation
AQUIS Resort at Great Barrier Reef Coastal Processes Assessments Report to Support EIS
32
Site Resources and Values
G:\Admin\B20270_g_nc_Yorkeys Knob Development\R.B20270.004.04.Coastal.docx
Relevant performance outcome Relevant acceptable outcome
PO6 EPAs in a CMD are maintained as
development free buffers, or where
permanent buildings or structures exist,
coastal erosion risks are avoided or
mitigated
AO6.1 Development locates built structures outside the part
of the CMD that is the EOA unless the development is:
(1) Coastal-dependent development;
(2) Temporary, readily relocatable or able to be abandoned;
(3) Essential community service infrastructure;
(4) Located landward of an applicable coastal building line;
(5) Located landward of the alignment of habitable buildings
if there is no coastal building line, and on a lot that is
less than 2000m2 in size;
(6) Redevelopment of existing built structures;
(7) Coastal protection work; or
(8) Located landward of other permanent built structures
that are likely to be defended from coastal erosion, if it is
demonstrated that development cannot reasonably be
located outside the EPA
AQUIS Resort at Great Barrier Reef Coastal Processes Assessments Report to Support EIS
33
Site Resources and Values
G:\Admin\B20270_g_nc_Yorkeys Knob Development\R.B20270.004.04.Coastal.docx
Relevant performance outcome Relevant acceptable outcome
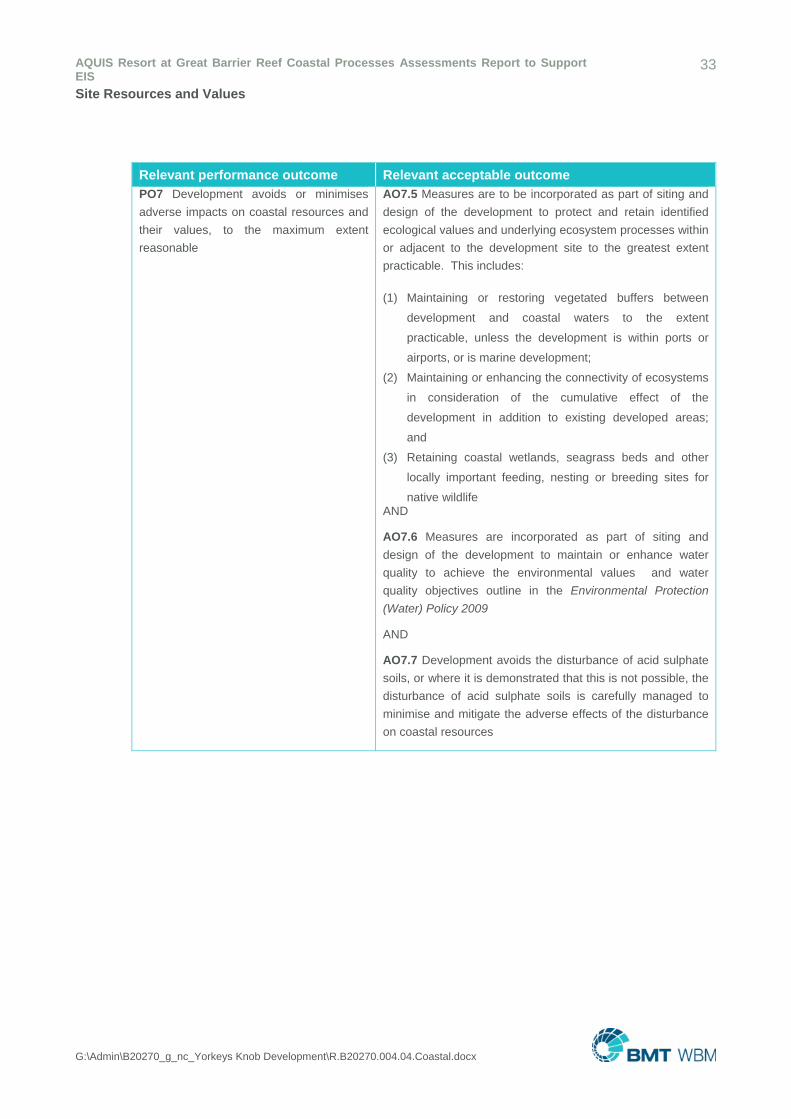
PO7 Development avoids or minimises
adverse impacts on coastal resources and
their values, to the maximum extent
reasonable
AO7.5 Measures are to be incorporated as part of siting and
design of the development to protect and retain identified
ecological values and underlying ecosystem processes within
or adjacent to the development site to the greatest extent
practicable. This includes:
(1) Maintaining or restoring vegetated buffers between
development and coastal waters to the extent
practicable, unless the development is within ports or
airports, or is marine development;
(2) Maintaining or enhancing the connectivity of ecosystems
in consideration of the cumulative effect of the
development in addition to existing developed areas;
and
(3) Retaining coastal wetlands, seagrass beds and other
locally important feeding, nesting or breeding sites for
native wildlife AND
AO7.6 Measures are incorporated as part of siting and
design of the development to maintain or enhance water
quality to achieve the environmental values and water
quality objectives outline in the Environmental Protection
(Water) Policy 2009
AND
AO7.7 Development avoids the disturbance of acid sulphate
soils, or where it is demonstrated that this is not possible, the
disturbance of acid sulphate soils is carefully managed to
minimise and mitigate the adverse effects of the disturbance
on coastal resources
AQUIS Resort at Great Barrier Reef Coastal Processes Assessments Report to Support EIS
34
Site Resources and Values
G:\Admin\B20270_g_nc_Yorkeys Knob Development\R.B20270.004.04.Coastal.docx
Relevant performance outcome Relevant acceptable outcome
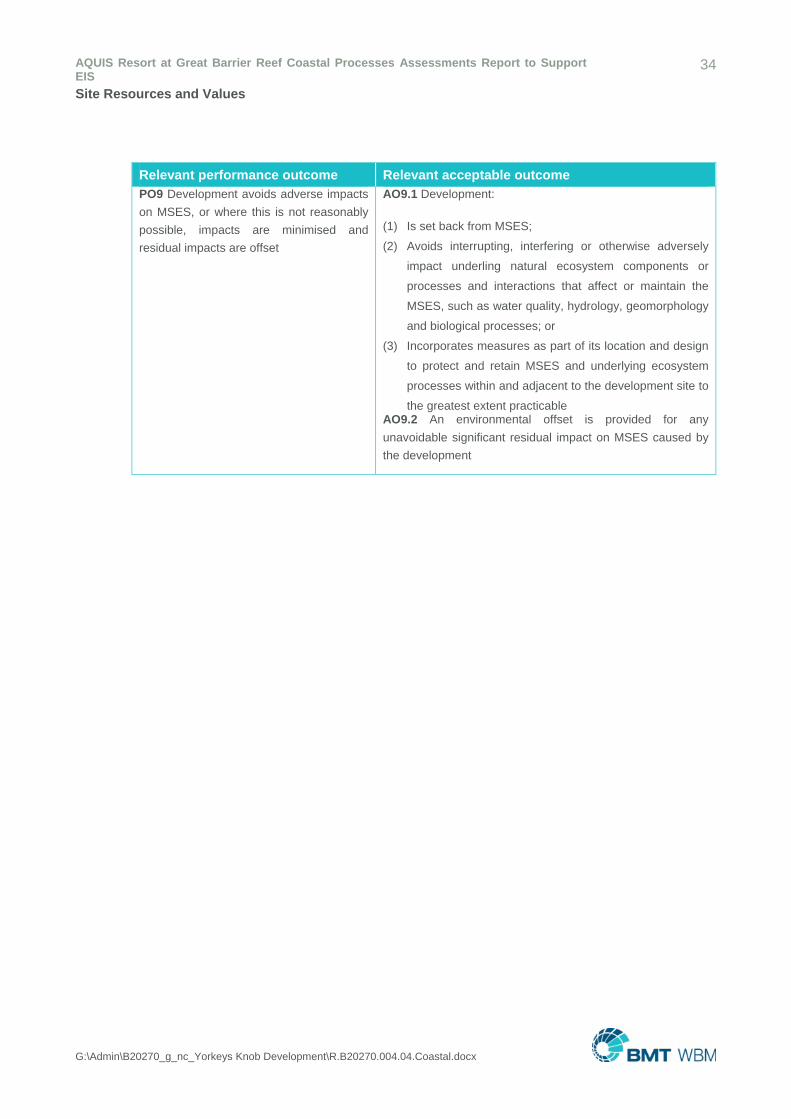
PO9 Development avoids adverse impacts
on MSES, or where this is not reasonably
possible, impacts are minimised and
residual impacts are offset
AO9.1 Development:
(1) Is set back from MSES;
(2) Avoids interrupting, interfering or otherwise adversely
impact underling natural ecosystem components or
processes and interactions that affect or maintain the
MSES, such as water quality, hydrology, geomorphology
and biological processes; or
(3) Incorporates measures as part of its location and design
to protect and retain MSES and underlying ecosystem
processes within and adjacent to the development site to
the greatest extent practicable AO9.2 An environmental offset is provided for any
unavoidable significant residual impact on MSES caused by
the development
AQUIS Resort at Great Barrier Reef Coastal Processes Assessments Report to Support EIS
35
Site Resources and Values
G:\Admin\B20270_g_nc_Yorkeys Knob Development\R.B20270.004.04.Coastal.docx
Relevant performance outcome Relevant acceptable outcome
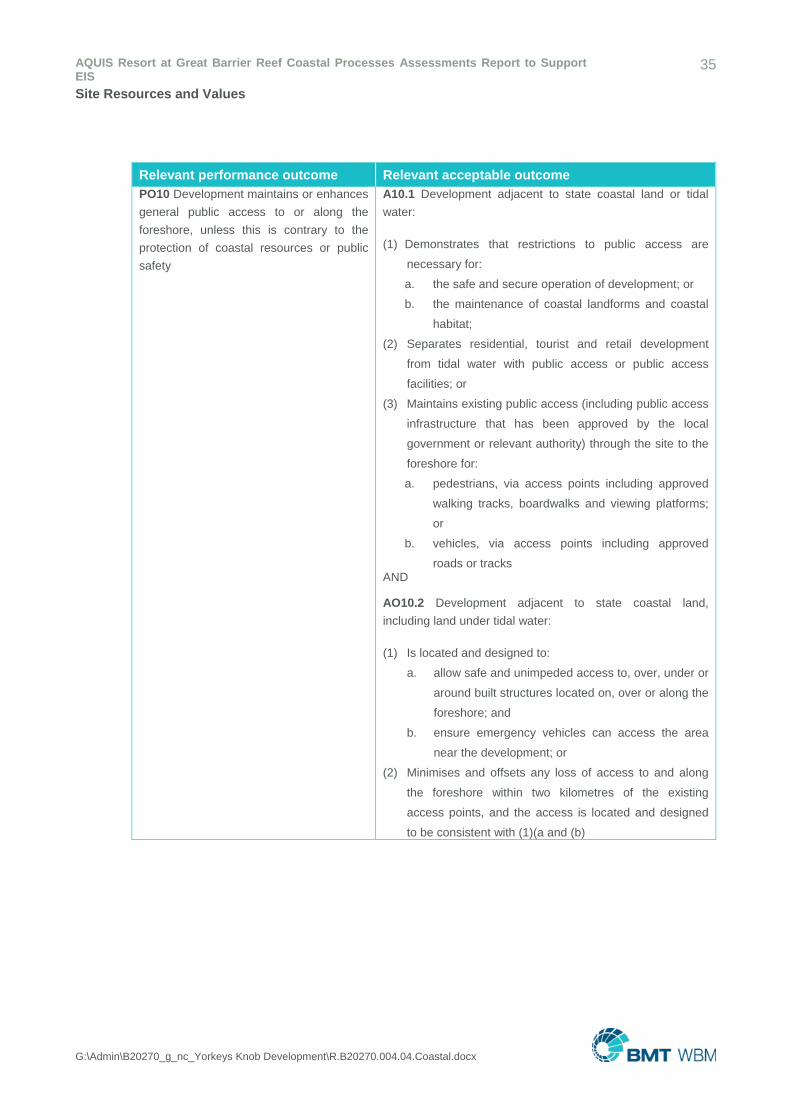
PO10 Development maintains or enhances
general public access to or along the
foreshore, unless this is contrary to the
protection of coastal resources or public
safety
A10.1 Development adjacent to state coastal land or tidal
water:
(1) Demonstrates that restrictions to public access are
necessary for:
a. the safe and secure operation of development; or
b. the maintenance of coastal landforms and coastal
habitat;
(2) Separates residential, tourist and retail development
from tidal water with public access or public access
facilities; or
(3) Maintains existing public access (including public access
infrastructure that has been approved by the local
government or relevant authority) through the site to the
foreshore for:
a. pedestrians, via access points including approved
walking tracks, boardwalks and viewing platforms;
or
b. vehicles, via access points including approved
roads or tracks AND
AO10.2 Development adjacent to state coastal land,
including land under tidal water:
(1) Is located and designed to:
a. allow safe and unimpeded access to, over, under or
around built structures located on, over or along the
foreshore; and
b. ensure emergency vehicles can access the area
near the development; or
(2) Minimises and offsets any loss of access to and along
the foreshore within two kilometres of the existing
access points, and the access is located and designed
to be consistent with (1)(a and (b)
AQUIS Resort at Great Barrier Reef Coastal Processes Assessments Report to Support EIS
36
Site Resources and Values
G:\Admin\B20270_g_nc_Yorkeys Knob Development\R.B20270.004.04.Coastal.docx
Relevant performance outcome Relevant acceptable outcome
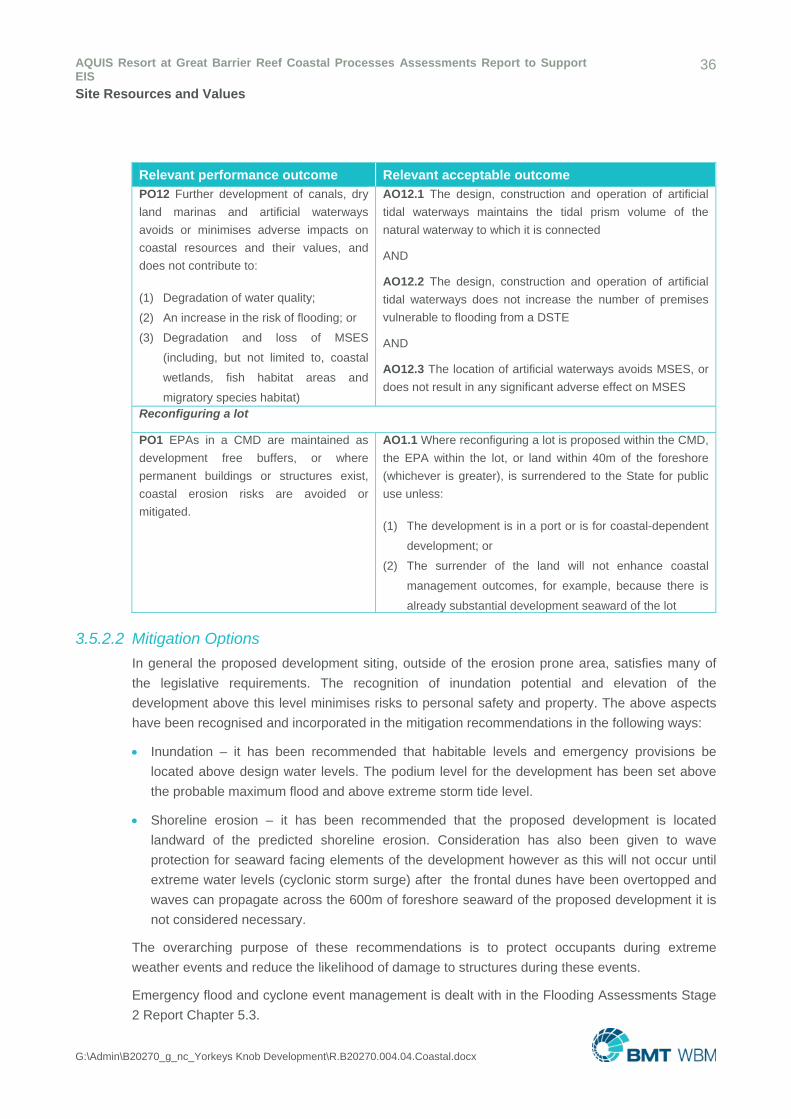
PO12 Further development of canals, dry
land marinas and artificial waterways
avoids or minimises adverse impacts on
coastal resources and their values, and
does not contribute to:
(1) Degradation of water quality;
(2) An increase in the risk of flooding; or
(3) Degradation and loss of MSES
(including, but not limited to, coastal
wetlands, fish habitat areas and
migratory species habitat)
AO12.1 The design, construction and operation of artificial
tidal waterways maintains the tidal prism volume of the
natural waterway to which it is connected
AND
AO12.2 The design, construction and operation of artificial
tidal waterways does not increase the number of premises
vulnerable to flooding from a DSTE
AND
AO12.3 The location of artificial waterways avoids MSES, or
does not result in any significant adverse effect on MSES
Reconfiguring a lot
PO1 EPAs in a CMD are maintained as
development free buffers, or where
permanent buildings or structures exist,
coastal erosion risks are avoided or
mitigated.
AO1.1 Where reconfiguring a lot is proposed within the CMD,
the EPA within the lot, or land within 40m of the foreshore
(whichever is greater), is surrendered to the State for public
use unless:
(1) The development is in a port or is for coastal-dependent
development; or
(2) The surrender of the land will not enhance coastal
management outcomes, for example, because there is
already substantial development seaward of the lot
3.5.2.2 Mitigation Options
In general the proposed development siting, outside of the erosion prone area, satisfies many of
the legislative requirements. The recognition of inundation potential and elevation of the
development above this level minimises risks to personal safety and property. The above aspects
have been recognised and incorporated in the mitigation recommendations in the following ways:
Inundation – it has been recommended that habitable levels and emergency provisions be
located above design water levels. The podium level for the development has been set above
the probable maximum flood and above extreme storm tide level.
Shoreline erosion – it has been recommended that the proposed development is located
landward of the predicted shoreline erosion. Consideration has also been given to wave
protection for seaward facing elements of the development however as this will not occur until
extreme water levels (cyclonic storm surge) after the frontal dunes have been overtopped and
waves can propagate across the 600m of foreshore seaward of the proposed development it is
not considered necessary.
The overarching purpose of these recommendations is to protect occupants during extreme
weather events and reduce the likelihood of damage to structures during these events.
Emergency flood and cyclone event management is dealt with in the Flooding Assessments Stage
2 Report Chapter 5.3.
AQUIS Resort at Great Barrier Reef Coastal Processes Assessments Report to Support EIS
37
Site Resources and Values
G:\Admin\B20270_g_nc_Yorkeys Knob Development\R.B20270.004.04.Coastal.docx
3.5.3 Coastal Protection State Planning Regulatory Provision
3.5.3.1 Legislative Requirements
The Coastal Protection SPRP is also an assessment instrument that applies to development in the
CMD. The Coastal Protection SPRP requires developers of land to consider whether or not land
within the EPA should be left undeveloped (3.2.1(1)). This would potentially draw upon outcomes
identified in the SDAP. For areas within the STIA, the vulnerability of the site and needs for
evacuation must also be considered (3.2.1(2)). To the greatest extent practicable, EPAs are to
remain undeveloped apart from temporary or relocatable structures for safety and recreational
purposes only (3.2.2(1).
The Coastal Protection SPRP also requires the safeguarding of biodiversity (3.2.3(1)). This is
primarily achieved through protecting significant wildlife habitats such as beaches important for
roosting, nesting and breeding for turtles, birds or crocodiles, and other shorebird feeding and
roosting habitat; and by retaining native vegetation, especially riparian vegetation (3.2.3(2)).
Development for tourism purposes may disturb areas of high ecological significance (HES) (3.2.4).
No net loss of public access to the foreshore unless it compromises the provision or operation of
infrastructure of state economic significance or the protection of coastal resources (3.2.5).
3.5.3.2 Mitigation Options
Significant pre-feasibility design effort has established that the proposed development can be
progressed on the site whilst meeting all relevant design standards required in a flood plain and in
some proximity to the shoreline.
As noted in regards to the SDAP requirements, the interaction of the development with significant
ecological features will be designed to either avoid or offset the loss of these areas. Any loss of
public access is likely to be mitigated by economic significance of the development.
AQUIS Resort at Great Barrier Reef Coastal Processes Assessments Report to Support EIS
38
Opportunities and Constraints
G:\Admin\B20270_g_nc_Yorkeys Knob Development\R.B20270.004.04.Coastal.docx
4 Opportunities and Constraints The proposed development is well set back from the coast and is outside the shoreline erosion
prone area. As such it is not likely to influence coastal process of longshore and cross-shore sand
transport and is not likely to encounter shoreline erosion. Existing adjacent communities will be
under severe threat while the proposed development is still several hundreds of metres from the
shoreline.
However it will experience elevated water levels during storm events and depth limited wave
penetration to the proposed development infrastructure during very extreme events. The proposed
development will need to be elevated and protected such that storm event water levels and wave
attack do not pose a threat. It should be noted that flood levels will dominate storm tide levels in
water level design considerations (refer Flooding Assessments Stage 2 Report) with the podium
level proposed to be above the Probable Maximum Flood level at RL- 7.5mAHD.
With regard to river migration it is noted that the development is in a major delta and extreme
events can cause significant changes in a short time. However, the available studies have
indicated that the major changes in recent times have been in the lower estuary below the
Thomatis Creek bifurcation. Concern regarding the stability of the Thomatis Creek bifurcation was
such that a major study recommended erosion mitigations options for the site. Some of these
options have been implemented and the creek currently appears stable with significant mangrove
populations in the lower sections with the exception of one bend adjacent to a farm where riparian
vegetation has been lost and bank erosion is occurring.
These elements will need to be catered for in the proposed development by:
elevating the built environment above extreme water levels;
including armouring of the built environment against wave and waterway attack for extreme
events;
lodge a sufficient bond to allow Thomatis Creek bifurcation and channel erosion stabilisation
works to be undertaken if channel flows increase in the tributary.
AQUIS Resort at Great Barrier Reef Coastal Processes Assessments Report to Support EIS
39
Description of the Project
G:\Admin\B20270_g_nc_Yorkeys Knob Development\R.B20270.004.04.Coastal.docx
5 Description of the Project
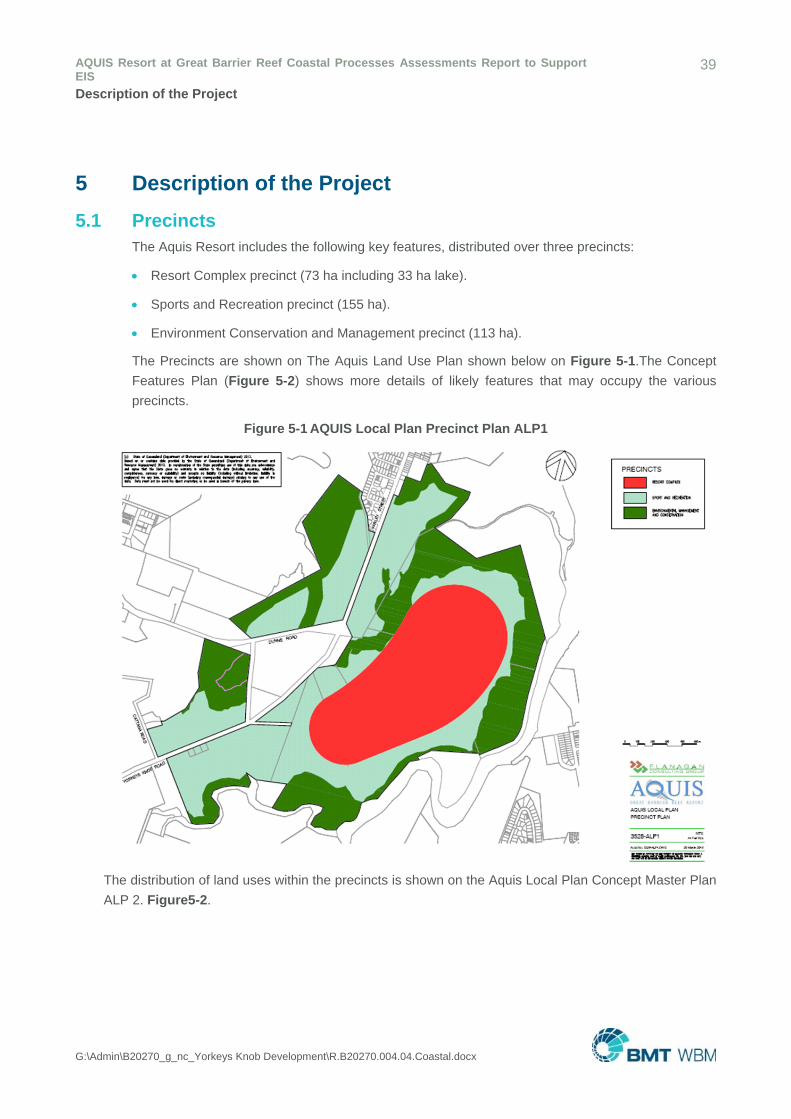
5.1 Precincts The Aquis Resort includes the following key features, distributed over three precincts:
Resort Complex precinct (73 ha including 33 ha lake).
Sports and Recreation precinct (155 ha).
Environment Conservation and Management precinct (113 ha).
The Precincts are shown on The Aquis Land Use Plan shown below on Figure 5-1.The Concept
Features Plan (Figure 5-2) shows more details of likely features that may occupy the various
precincts.
Figure 5-1 AQUIS Local Plan Precinct Plan ALP1
The distribution of land uses within the precincts is shown on the Aquis Local Plan Concept Master Plan
ALP 2. Figure5-2.
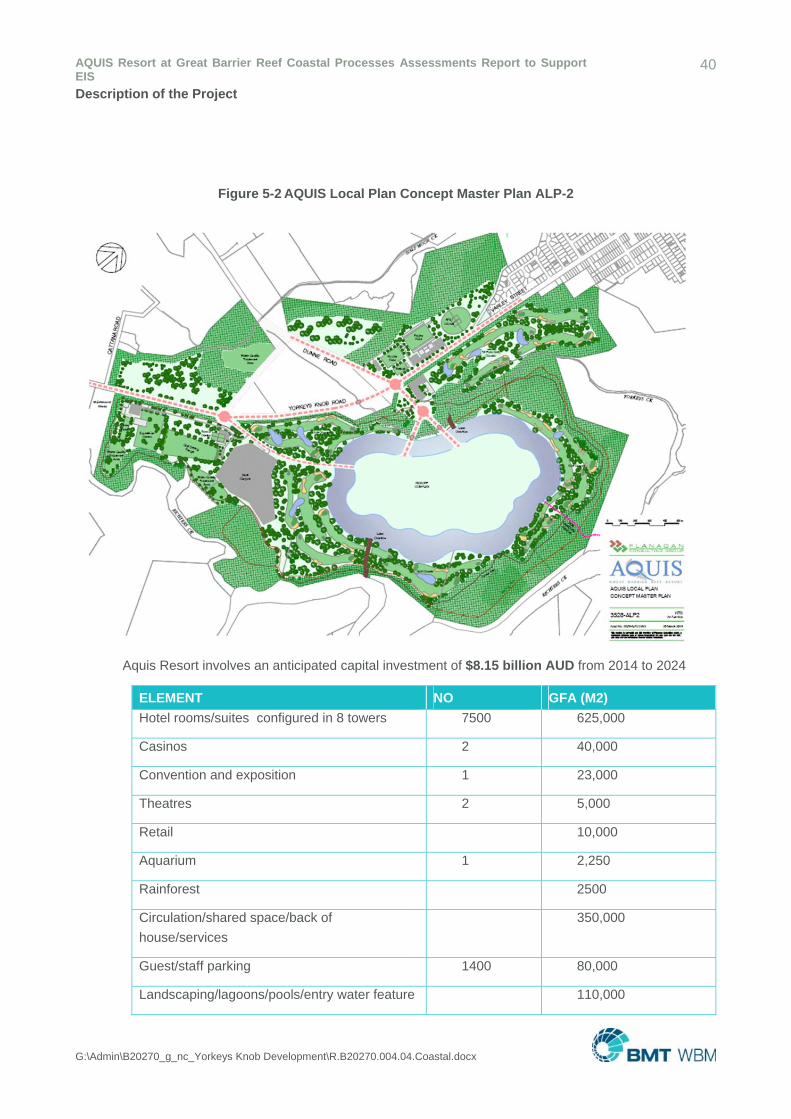
AQUIS Resort at Great Barrier Reef Coastal Processes Assessments Report to Support EIS
40
Description of the Project
G:\Admin\B20270_g_nc_Yorkeys Knob Development\R.B20270.004.04.Coastal.docx
Figure 5-2 AQUIS Local Plan Concept Master Plan ALP-2
Aquis Resort involves an anticipated capital investment of $8.15 billion AUD from 2014 to 2024
ELEMENT NO GFA (M2)
Hotel rooms/suites configured in 8 towers 7500 625,000
Casinos 2 40,000
Convention and exposition 1 23,000
Theatres 2 5,000
Retail 10,000
Aquarium 1 2,250
Rainforest 2500
Circulation/shared space/back of
house/services
350,000
Guest/staff parking 1400 80,000
Landscaping/lagoons/pools/entry water feature 110,000
AQUIS Resort at Great Barrier Reef Coastal Processes Assessments Report to Support EIS
41
Description of the Project
G:\Admin\B20270_g_nc_Yorkeys Knob Development\R.B20270.004.04.Coastal.docx
The aquarium and rainforest are architectural features and not stand-alone uses. The proposal
does not include any permanent residential elements.
The resort complex will be constructed over a basement level which will incorporate back-of-house
support facilities including:
kitchens
staff facilities
stores
laundry
refuse collection
security
maintenance facilities
staff and guest parking facilities
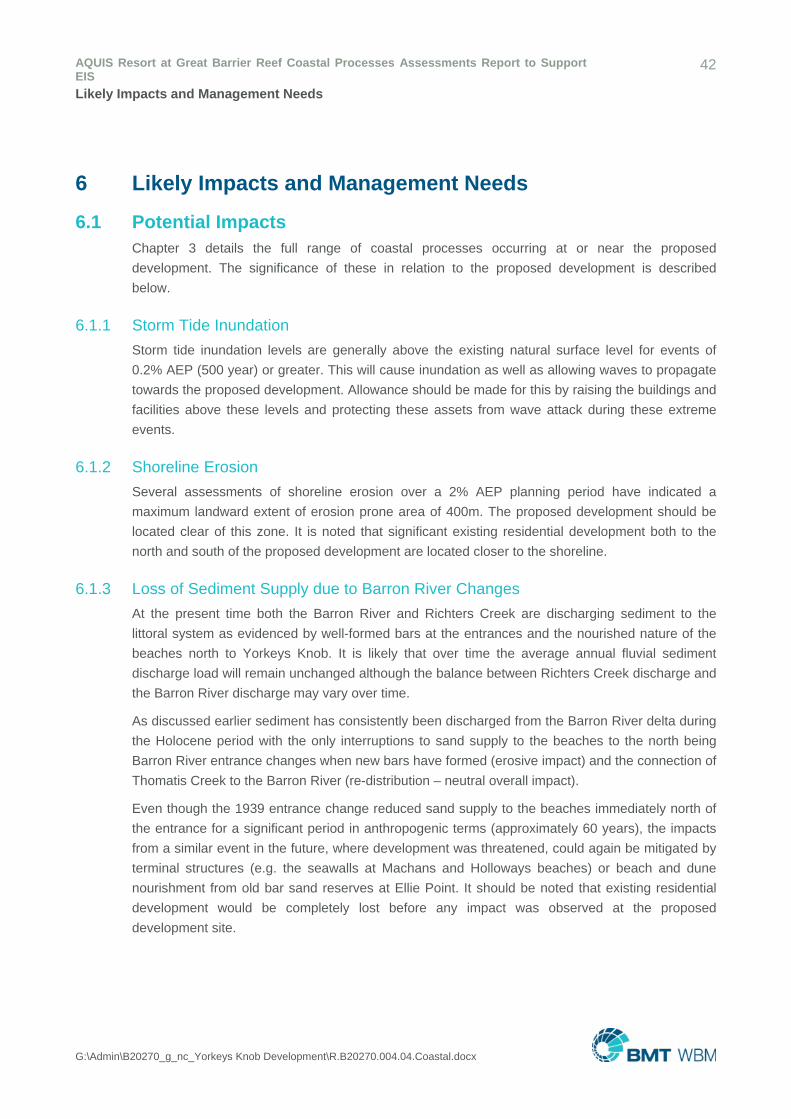
AQUIS Resort at Great Barrier Reef Coastal Processes Assessments Report to Support EIS
42
Likely Impacts and Management Needs
G:\Admin\B20270_g_nc_Yorkeys Knob Development\R.B20270.004.04.Coastal.docx
6 Likely Impacts and Management Needs
6.1 Potential Impacts Chapter 3 details the full range of coastal processes occurring at or near the proposed
development. The significance of these in relation to the proposed development is described
below.
6.1.1 Storm Tide Inundation
Storm tide inundation levels are generally above the existing natural surface level for events of
0.2% AEP (500 year) or greater. This will cause inundation as well as allowing waves to propagate
towards the proposed development. Allowance should be made for this by raising the buildings and
facilities above these levels and protecting these assets from wave attack during these extreme
events.
6.1.2 Shoreline Erosion
Several assessments of shoreline erosion over a 2% AEP planning period have indicated a
maximum landward extent of erosion prone area of 400m. The proposed development should be
located clear of this zone. It is noted that significant existing residential development both to the
north and south of the proposed development are located closer to the shoreline.
6.1.3 Loss of Sediment Supply due to Barron River Changes
At the present time both the Barron River and Richters Creek are discharging sediment to the
littoral system as evidenced by well-formed bars at the entrances and the nourished nature of the
beaches north to Yorkeys Knob. It is likely that over time the average annual fluvial sediment
discharge load will remain unchanged although the balance between Richters Creek discharge and
the Barron River discharge may vary over time.
As discussed earlier sediment has consistently been discharged from the Barron River delta during
the Holocene period with the only interruptions to sand supply to the beaches to the north being
Barron River entrance changes when new bars have formed (erosive impact) and the connection of
Thomatis Creek to the Barron River (re-distribution – neutral overall impact).
Even though the 1939 entrance change reduced sand supply to the beaches immediately north of
the entrance for a significant period in anthropogenic terms (approximately 60 years), the impacts
from a similar event in the future, where development was threatened, could again be mitigated by
terminal structures (e.g. the seawalls at Machans and Holloways beaches) or beach and dune
nourishment from old bar sand reserves at Ellie Point. It should be noted that existing residential
development would be completely lost before any impact was observed at the proposed
development site.
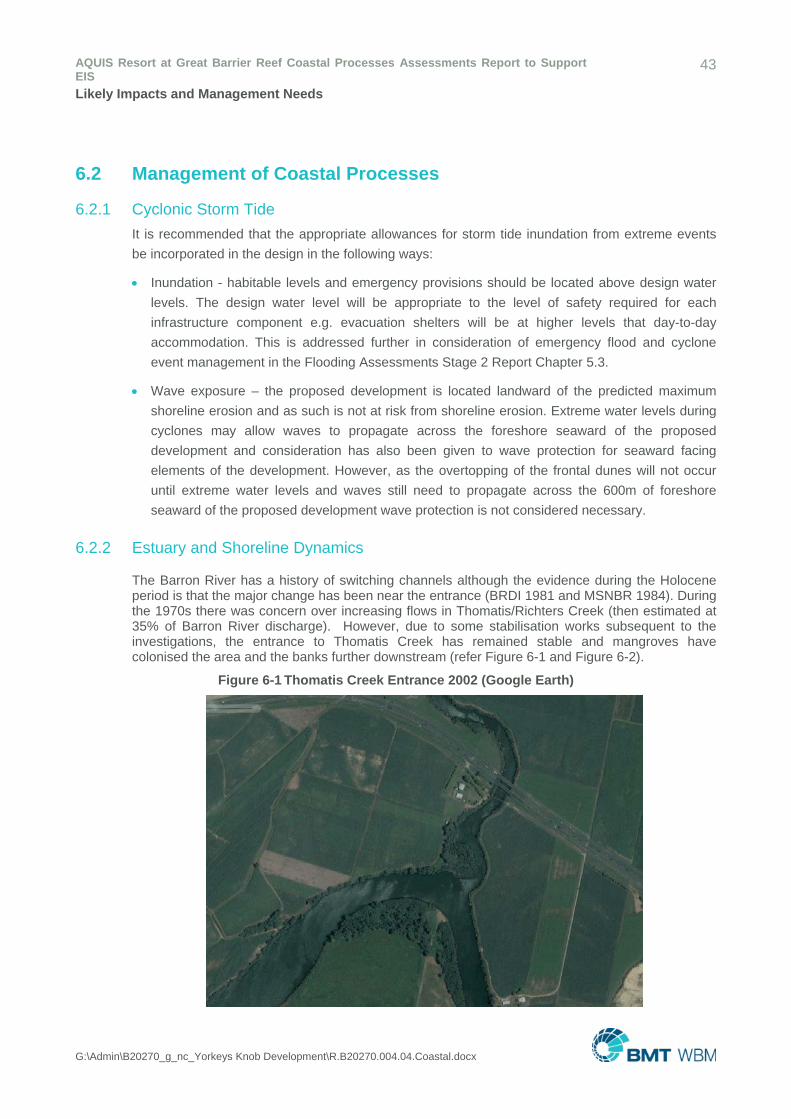
AQUIS Resort at Great Barrier Reef Coastal Processes Assessments Report to Support EIS
43
Likely Impacts and Management Needs
G:\Admin\B20270_g_nc_Yorkeys Knob Development\R.B20270.004.04.Coastal.docx
6.2 Management of Coastal Processes
6.2.1 Cyclonic Storm Tide
It is recommended that the appropriate allowances for storm tide inundation from extreme events
be incorporated in the design in the following ways:
Inundation - habitable levels and emergency provisions should be located above design water
levels. The design water level will be appropriate to the level of safety required for each
infrastructure component e.g. evacuation shelters will be at higher levels that day-to-day
accommodation. This is addressed further in consideration of emergency flood and cyclone
event management in the Flooding Assessments Stage 2 Report Chapter 5.3.
Wave exposure – the proposed development is located landward of the predicted maximum
shoreline erosion and as such is not at risk from shoreline erosion. Extreme water levels during
cyclones may allow waves to propagate across the foreshore seaward of the proposed
development and consideration has also been given to wave protection for seaward facing
elements of the development. However, as the overtopping of the frontal dunes will not occur
until extreme water levels and waves still need to propagate across the 600m of foreshore
seaward of the proposed development wave protection is not considered necessary.
6.2.2 Estuary and Shoreline Dynamics
The Barron River has a history of switching channels although the evidence during the Holocene period is that the major change has been near the entrance (BRDI 1981 and MSNBR 1984). During the 1970s there was concern over increasing flows in Thomatis/Richters Creek (then estimated at 35% of Barron River discharge). However, due to some stabilisation works subsequent to the investigations, the entrance to Thomatis Creek has remained stable and mangroves have colonised the area and the banks further downstream (refer Figure 6-1 and Figure 6-2).
Figure 6-1 Thomatis Creek Entrance 2002 (Google Earth)
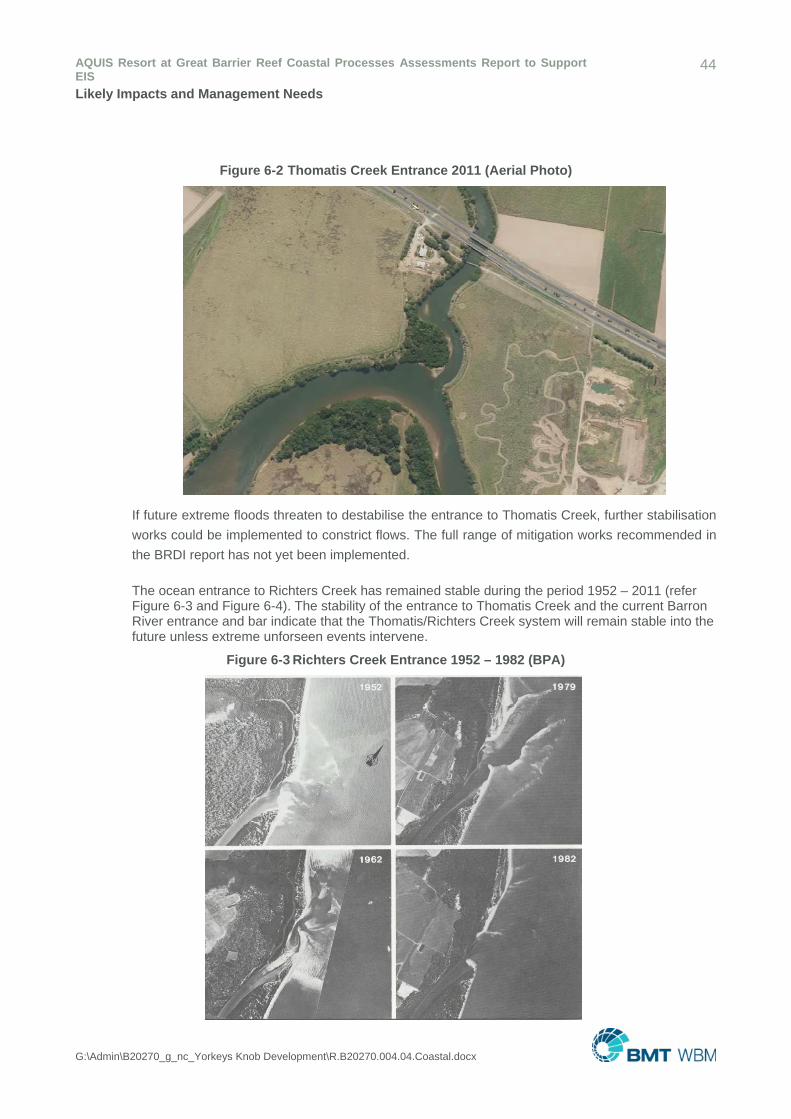
AQUIS Resort at Great Barrier Reef Coastal Processes Assessments Report to Support EIS
44
Likely Impacts and Management Needs
G:\Admin\B20270_g_nc_Yorkeys Knob Development\R.B20270.004.04.Coastal.docx
Figure 6-2 Thomatis Creek Entrance 2011 (Aerial Photo)
If future extreme floods threaten to destabilise the entrance to Thomatis Creek, further stabilisation
works could be implemented to constrict flows. The full range of mitigation works recommended in
the BRDI report has not yet been implemented.
The ocean entrance to Richters Creek has remained stable during the period 1952 – 2011 (refer Figure 6-3 and Figure 6-4). The stability of the entrance to Thomatis Creek and the current Barron River entrance and bar indicate that the Thomatis/Richters Creek system will remain stable into the future unless extreme unforseen events intervene.
Figure 6-3 Richters Creek Entrance 1952 – 1982 (BPA)
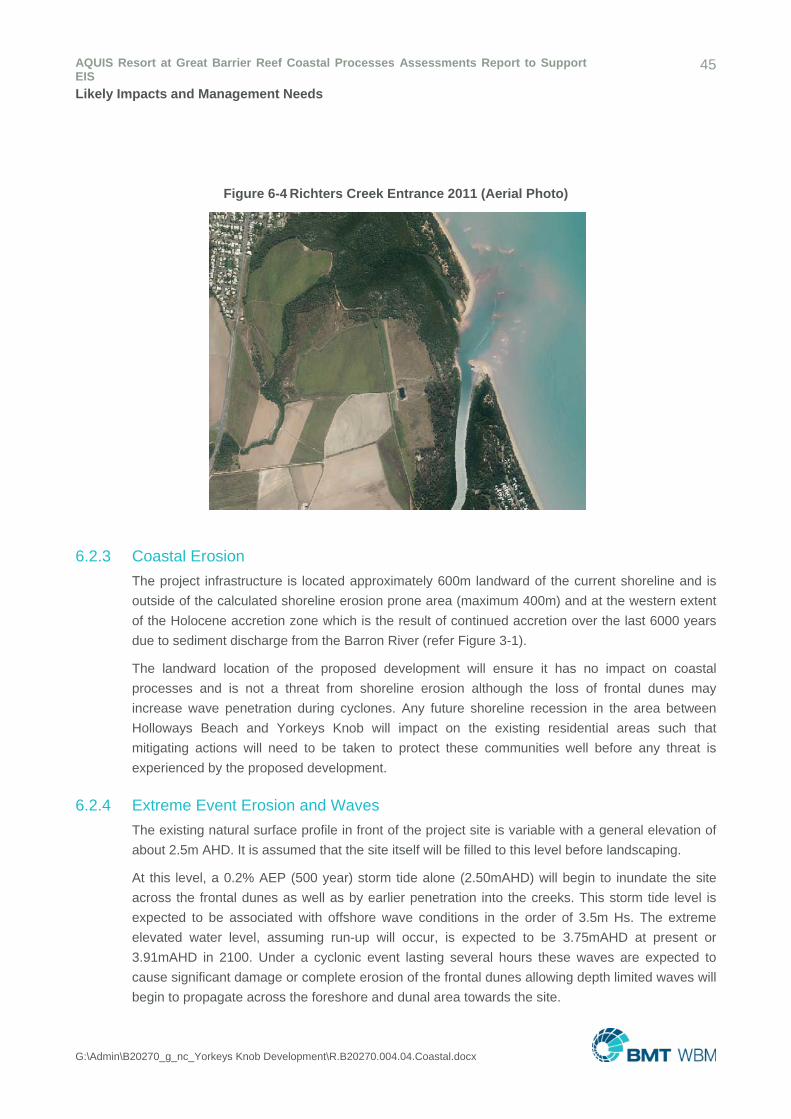
AQUIS Resort at Great Barrier Reef Coastal Processes Assessments Report to Support EIS
45
Likely Impacts and Management Needs
G:\Admin\B20270_g_nc_Yorkeys Knob Development\R.B20270.004.04.Coastal.docx
Figure 6-4 Richters Creek Entrance 2011 (Aerial Photo)
6.2.3 Coastal Erosion
The project infrastructure is located approximately 600m landward of the current shoreline and is
outside of the calculated shoreline erosion prone area (maximum 400m) and at the western extent
of the Holocene accretion zone which is the result of continued accretion over the last 6000 years
due to sediment discharge from the Barron River (refer Figure 3-1).
The landward location of the proposed development will ensure it has no impact on coastal
processes and is not a threat from shoreline erosion although the loss of frontal dunes may
increase wave penetration during cyclones. Any future shoreline recession in the area between
Holloways Beach and Yorkeys Knob will impact on the existing residential areas such that
mitigating actions will need to be taken to protect these communities well before any threat is
experienced by the proposed development.
6.2.4 Extreme Event Erosion and Waves
The existing natural surface profile in front of the project site is variable with a general elevation of
about 2.5m AHD. It is assumed that the site itself will be filled to this level before landscaping.
At this level, a 0.2% AEP (500 year) storm tide alone (2.50mAHD) will begin to inundate the site
across the frontal dunes as well as by earlier penetration into the creeks. This storm tide level is
expected to be associated with offshore wave conditions in the order of 3.5m Hs. The extreme
elevated water level, assuming run-up will occur, is expected to be 3.75mAHD at present or
3.91mAHD in 2100. Under a cyclonic event lasting several hours these waves are expected to
cause significant damage or complete erosion of the frontal dunes allowing depth limited waves will
begin to propagate across the foreshore and dunal area towards the site.
AQUIS Resort at Great Barrier Reef Coastal Processes Assessments Report to Support EIS
46
Likely Impacts and Management Needs
G:\Admin\B20270_g_nc_Yorkeys Knob Development\R.B20270.004.04.Coastal.docx
At 0.01% AEP storm tide level (3.44m AHD) inundation and some depth limited wave action are
expected to extend across the foreshore and dunal area to the proposed building and
infrastructure. It is unlikely that wave set up or run up will occur in this scenario and wave energy
will be significantly dissipated by natural surface roughness and turbulence. The design of these
elements may require consideration of armouring against wave attack at final design stage. The
sizing of any armour will be dependent on the details of infrastructure and the design return period
used
6.2.5 Emergency Event Management
This is addressed in detail in terms of combined flood and cyclone event emergency management
in the Flooding Assessment Stage 2 Report Chapter 5.3.
AQUIS Resort at Great Barrier Reef Coastal Processes Assessments Report to Support EIS
47
References
G:\Admin\B20270_g_nc_Yorkeys Knob Development\R.B20270.004.04.Coastal.docx
7 References Beach Protection Authority Queensland, 1984. Mulgrave Shire Northern Beaches. A report prepared for Mulgrave Shire Council.
BMT WBM 2013, Cairns Region Storm Tide Inundation Review
Boswood, PK. 2013. Tsunami Modelling along the East Queensland Coast, Report 1: Regional
Modelling. Brisbane: Department of Science, Information Technology, Innovation and the Arts,
Queensland Government.
Department of Harbours and Marine Queensland, 1981, Barron River Delta Investigation. A report to the Queensland Government.
McPherson Maclean Wargon Chapman in association with Patterson Britton and Partners, 1995. Bramston Beach Erosion Study Assessment of Coastal Processes and Management Options.
Queensland Government, Environmental Protection Agency, 2002. Holloways Beach Coastal Protection Study.
Queensland Government (2001). Queensland Climate Change and Community Vulnerability to
Tropical Cyclones: Ocean Hazards Assessment Stage 1 – Review of Technical Requirements.
QLD Department of Natural Resources and Mines, QLD Department of Emergency Services, QLD
Environmental Protection Agency, QLD Bureau of Meteorology, Systems Engineering Australia Pty
Ltd (the so-called “Blue Book”).
Queensland Government (2004). Queensland Climate Change and Community Vulnerability to
Tropical Cyclones: Ocean Hazards Assessment Stage 1a – Operational Manual March 2004. QLD
Department of Natural Resources and Mines, QLD Department of Emergency Services, QLD
Environmental Protection Agency, QLD Bureau of Meteorology, Systems Engineering Australia Pty
Ltd
Queensland Government (2013). Coastal hazard technical guide: Determining coastal hazard
areas, prepared by Environmental Planning, Department of Environment and Heritage Protection.
Vellinga, P. (1983). Predictive computation model for beach and dune erosion during storm surges.
Delft Hydraulics Laboratory, Publication No. 294.
WBM 2005, Cairns Region Shoreline Erosion Management Plan
AQUIS Resort at Great Barrier Reef Coastal Processes Assessments Report to Support EIS
48
Qualifications
G:\Admin\B20270_g_nc_Yorkeys Knob Development\R.B20270.004.04.Coastal.docx
8 Qualifications This report has been prepared using available information within the allocated time to demonstrate
that the proposed development can be feasibly built and operated within a coastal management
district where the major constraint is storm tide level and associated wave action in extreme
events. The proposed development is well set back from the shoreline resulting in a low risk of
environmental harm or environmental nuisance in relation to coastal protection works.
Whilst previous (1980s) and recent (2000s) studies have provided detailed and reliable information
to assist in the assessments, more detailed work will be required to allow refinement of the
development in subsequent stages of investigation. Chapter 6 of this report describes additional
elements of refinement required.
The accuracy of this report is therefore limited to the exactness of the information used in the
creation of the report.
AQUIS Resort at Great Barrier Reef Coastal Processes Assessments Report to Support EIS
49
Acronyms
G:\Admin\B20270_g_nc_Yorkeys Knob Development\R.B20270.004.04.Coastal.docx
9 Acronyms
AEP – Annual Exceedance Probability
AHD – Australian Height Datum
BPA – Beach Protection Authority
BRDI – Barron River Delta Investigation
CMD – Coastal management District
DEHP – Queensland Department of Heritage and Protection
DSTE – Design Storm Tide Event
EPA – Queensland Environmental Protection Agency
EPA – erosion prone area
HAT – Highest Astronomical Tide
HES – high environmental significance
Hs – Significant Wave height
IAS – Impact Assessment Statement
IDAS - Integrated Development Assessment System
MSNBR – Mulgrave Shire Northern Beaches Report
QCP – Queensland Coastal Plan
SDAP – Queensland State Development Assessment Provisions
SPRP – Queensland Coastal Protection State Planning Regulatory Provisions
BMT WBM Bangalow 6/20 Byron Street Bangalow 2479 Tel +61 2 6687 0466 Fax +61 2 66870422 Email [email protected] Web www.bmtwml.com.au
BMT WBM Brisbane Level 8, 200 Creek Street Brisbane 4000 PO Box 203 Spring Hill QLD 4004 Tel +61 7 3831 6744 Fax +61 7 3832 3627 Email [email protected] Web www.bmtwml.com.au
BMT WBM Denver 8200 S. Akron Street, #B120 Centennial Denver Colorado 80112 USA Tel +1 303 792 9814 Fax +1 303 792 9742 Email [email protected] Web www.bmtwbm.com
BMT WBM London 1st Floor, International House St Katherine’s Way London E1W1TW Email [email protected] Web www.bmtwbm.com.au
BMT WBM Mackay Suite 1, 138 Wood Street Mackay 4740 PO Box 4447 Mackay QLD 4740 Tel +61 7 4953 5144 Fax +61 7 4953 5132 Email [email protected] Web www.bmtwbm.com.au
BMT WBM Melbourne Level 5, 99 King Street Melbourne 3000 PO Box 604 Collins Street West VIC 8007 Tel +61 3 8620 6100 Fax +61 3 8620 6105 Email [email protected] Web www.bmtwbm.com.au
BMT WBM Newcastle 126 Belford Street Broadmeadow 2292 PO Box 266 Broadmeadow NSW 2292 Tel +61 2 4940 8882 Fax +61 2 4940 8887 Email [email protected] Web www.bmtwbm.com.au
BMT WBM Perth Suite 6, 29 Hood Street Subiaco 6008 Tel +61 8 9328 2029 Fax +61 8 9486 7588 Email [email protected] Web www.bmtwbm.com.au
BMT WBM Sydney Level 1, 256-258 Norton Street Leichhardt 2040 PO Box 194 Leichhardt NSW 2040 Tel +61 2 8987 2900 Fax +61 2 8987 2999 Email [email protected] Web www.bmtwbm.com.au
BMT WBM Vancouver Suite 401, 611 Alexander Street Vancouver British Columbia V6E 3W1 Canada Tel +1 604 683 5777 Fax +1 604 608 3232 Email [email protected] Web www.bmtwbm.com