Embed Size (px)
Citation preview

ONONDAGA LAKE PDI:
PHASE II SUMMARY REPORT
PARSONS
P:\Honeywell -SYR\442636 Phase II PDI\09 Reports\9.7 Phase II Summary Report\DEC Approval copy\Phase II Summary Report_Final.doc August 4, 2009
APPENDIX D
POREWATER EQUILIBRATION STUDY REPORT
Final Report
P:\HONEYWELL -SYR\442636 PHASE II PDI\09 REPORTS\9.7 PHASE II SUMMARY REPORT\APPENDIX D-POREWATER EQUILIBRATION
STUDY\REVISED DRAFT 2008\FINAL EQ STUDY 091808.DOC
SEPTEMBER 24, 2008
Diffusion Sampler Equilibration Study Using Teflon (PTFE) and Tuffryn Membranes in Onondaga Lake Sediments
Final Report
Prepared By:
W. Andrew Jackson and Todd A. Anderson
Prepared For:
Parsons 290 Elwood Davis Road, Suite 312
Liverpool, New York 13088 Phone: (315) 451-9560
Fax: (315) 451-9570
September 18, 2008

Final Report
P:\HONEYWELL -SYR\442636 PHASE II PDI\09 REPORTS\9.7 PHASE II SUMMARY REPORT\APPENDIX D-POREWATER EQUILIBRATION
STUDY\REVISED DRAFT 2008\FINAL EQ STUDY 091808.DOC
SEPTEMBER 24, 2008
1
GENERAL
The work presented herein was completed as part of the Onondaga Lake Pre-Design Investigation Equilibrium Study Work Plan (Parsons, 2006). Results and recommendations presented herein are based on the authors’ experience, expertise and professional opinion and are provide for informational purposes only. The application of these recommendations is the responsibility of Honeywell and Parsons and will be determined in conjunction with the New York State Department of Environmental Conservation (NYSDEC).
OVERVIEW
The required equilibration time for diffusion samplers for sediments beneath Onondaga Lake was determined by modeling the equilibration of diffusion samplers in the laboratory and adjusting the field equilibration time to account for the difference in the volume to surface area ratio of the Lake samplers. This work was completed in accordance with the Onondaga Lake Pre-Design Investigation Equilibrium Study Work Plan (Parsons, 2006).
Equilibration rates were identified at three sites (20006, 10009, and S4C) for Volatile Organic Compounds (VOCs) and Chloride (Cl-) and at one site (TR05B) for Mercury (Hg) and Cl- using both Teflon and Tuffryn membranes. Equilibration times for compounds that were measured at more than one site were also evaluated to compare similarities or differences between sites. VOCs equilibrated at similar rates for both membranes at all three sites. Laboratory equilibration times varied for the VOCs from 5 - 33 days (average of 13 ± 10 days) and 16 - 49* days (average of 28.5* ± 11 days) for the Teflon and Tuffryn membranes, respectively. Cl- and Hg equilibration rates were very different for the two membrane types. Laboratory equilibration times using the Teflon membrane were >250 days for Cl- and 104 days for Hg. Laboratory equilibration times using the Tuffryn membrane were 9 - 19 days (average of 12 ± 4) for Cl- and 6.3 - 7.3 days (average of 6.8 ± 0.7 days) for Hg.
Required equilibration times for the lake samplers were determined using the laboratory measured mass transfer coefficients determined for each compound and site. Those results were adjusted for the larger surface area to volume ratio of the lake samplers to identify the required equilibration time. The results indicate that, in general, less than 16 days would be required to achieve 90% equilibrium for VOCs for either type of membrane. Equilibration times for VOCs using either membrane are largely comparable. However, predicted equilibration times for Cl- (86 - 115 days) and Hg (34 days) are substantially longer using the Teflon membrane than the Tuffryn (2.7 – 6.1 days for Cl- and 2.1 - 2.4 days for Hg). It should also be noted that Tuffryn equilibration times for Cl- and Hg were even shorter than those for VOCs.

Final Report
P:\HONEYWELL -SYR\442636 PHASE II PDI\09 REPORTS\9.7 PHASE II SUMMARY REPORT\APPENDIX D-POREWATER EQUILIBRATION
STUDY\REVISED DRAFT 2008\FINAL EQ STUDY 091808.DOC
SEPTEMBER 24, 2008
2
Based on this evaluation Tuffryn, with an in situ equilibrium period of 21 days, is recommended for future lake sampling activities. The choice of membrane is based on a number of factors, the most important of which is the exceedingly slow equilibration rates of Cl- and Hg (using the Teflon membrane) and by extension any non-volatile component. The Tuffryn membrane was also much more durable during field experiments at the Lake during 2006. Other negative issues associated with the Teflon membrane include the potential formation of bubbles. This may not impact VOC concentrations, but it would impact the volume of liquid collected from each sampling port. The recommended equilibration time of 21 days is based mainly on the predicted equilibration times for the lake samplers. The 21 day period is in excess for both Cl- and Hg and by extension other ionic species. The 21 day equilibration period is also longer than all of the required predicted VOC equilibration times (5.2 - 16 days). The study-derived equilibration time of 21 days also indicates that previous porewater analyses for VOCs completed using this residence time are valid for both membrane types with minor adjustments as discussed in more detail in the Recommendations section of this report. A complete discussion of the methods, analysis, results and recommendations is given in detail below.
EXPERIMENTAL PROCEDURE
The required equilibration time for the lake diffusion samplers was determined in a series of experiments. The first experiment was designed to evaluate the impact of membrane type on equilibration rates. The second series of experiments was designed to evaluate equilibration rates for VOCs, and Cl- for sediment from three different locations in the lake and Hg and Cl- from one additional location. Laboratory results were then used to determine site and compound specific mass transfer coefficients for use in predicting equilibration times for the lake samplers. These methods are described in more detail below. Modifications to the original work plan include: (1) The acquisition of cores from TR05B due to the low concentrations of Hg in the core form OLA-STA-10009; (2) the use of 1000 mg/l of Cl instead of 100 mg/l for the membrane evaluation study; and (3) the bottle samplers used in the “simulation of the site equilibration times” study did not have identical V/A ratios as the deployment samplers as no bottle with the appropriate volume, surface area and size could be found to accommodate the Teflon centrifuge bottles. These changes did not impact the results of the investigation.
Evaluation of Membrane Resistance
The impact of the membrane on equilibration time, in the absence of other limiting processes, was determined for both Teflon and Tuffryn membranes using small bottle-type samplers (~8.8 mL) with an F value (ratio of the volume of sampler to open surface area of the sampler) of 7.3 cm. Twenty four samples, half covered with Teflon membrane (0.45 µm pore size) and the other half covered with Tuffryn (Polysulfone) membrane (0.45 µm pore size), were filled with distilled deionized water (DDI) water and placed in a large container (100 times the total volume of the sampler) filled with a solution of NaCl (~1,000 mg/L as Cl). Each sampler contained a Teflon-coated magnetic
Final Report
P:\HONEYWELL -SYR\442636 PHASE II PDI\09 REPORTS\9.7 PHASE II SUMMARY REPORT\APPENDIX D-POREWATER EQUILIBRATION
STUDY\REVISED DRAFT 2008\FINAL EQ STUDY 091808.DOC
SEPTEMBER 24, 2008
3
e with DDI water, and removing the internal solution using a syringe and needle.
Sediment Equilibration Study
12 centrifuge bottles comprised one experiment for each site and each membrane type.
sion sampler water were identical to minimize any differences due to sample handling.
Data Analysis
e laboratory experiments were modeled using the following exponential equation,
C = C α (1-exp(-K *t/F) Equation 1
stir bar that was rotated slowly throughout the experimental time period. The bulk solution in which the samplers were placed was continuously recirculated throughout the experiment. Bottle samplers were sacrificed at varying time intervals by removing 2 samplers for each membrane type from the bulk solution, gently rinsing the bottle and membran
Sediment samples were received from Parsons in 2-foot sealed sections from 3 locations: 10009 (SMU 1), 20006 (SMU 2), and S4C (SMU 7). Later, due to the low Hg content of these particular sediment samples, additional cores were collected from location TR05B. The bulk sediment was homogenized and distributed in a N2 atmosphere into 250-mL Teflon centrifuge bottles with no headspace. One bottle style diffusion sampler covered with a Teflon or Tuffryn membrane (0.45 µm) and filled with distilled deionized (DDI) water was inserted into each centrifuge bottle. These bottle style samplers had a total volume (V) of 8.8 mL (7.7 mL for Site 20006 Teflon Study due to inclusion of stir bar) and an open surface area (A) of 1.13 cm2 with an F value of 7.7. This value is different from the membrane evaluation study as these bottles did not contain a stir bar and thus their liquid volume was greater. Duplicate centrifuge bottles were generally sacrificed after 5, 10, 15, 22, 29, and 36 days of incubation. Experiments were completed in duplicate to assess variability. Therefore,
Sampling consisted of removing the diffusion sampler from each centrifuge bottle. The bottles were then centrifuged at 4 °C for 10 to 20 minutes at approximately 4,000 rpm to separate the porewater and sediment. The supernatant was removed using a glass syringe and injected through a 0.2 µm Teflon syringe filter into a no-headspace vial for analysis. Water from each diffusion sampler was also removed using a glass syringe and filtered through a 0.2 µm Teflon syringe filter into a no-headspace vial for analysis. While the diffusion samples did not require filtration, they were filtered to insure that the processing of the centrifuged sediment porewater and diffu
All data from th
t o m
where Ct is the concentration of any measured species at time t in the sampler, Co is the average concentration in the bulk liquid, Km is the mass transfer coefficient, and F = V/A (the ratio of the volume of the sampler to open area of the sampler), and α is a constant that is equal to the final asymptotic ratio of measured concentrations (i.e, % equilibrium with respect to the average bulk water concentration). The α value is variable due to the

Final Report
P:\HONEYWELL -SYR\442636 PHASE II PDI\09 REPORTS\9.7 PHASE II SUMMARY REPORT\APPENDIX D-POREWATER EQUILIBRATION
STUDY\REVISED DRAFT 2008\FINAL EQ STUDY 091808.DOC
SEPTEMBER 24, 2008
4
in Appendix 1. The normalized data (C C ) vs. time were fit using non-linear regression. Both K and α wer
escribing the equilibration of the samplers and allowing changes in F to be evaluated. For a more in depth discussion of the modeling effort and data analysis, see Appendix 1.
potential difference in the measured bulk porewater concentration and equilibrium concentration in the samplers. It should be noted that sampler equilibration may not correspond to 100% of the average bulk water concentration. For conserved (non reactive) species like Cl- with no solid phase component, the α value should be close to 1. However, for compounds such as these VOCs, which can have non-dissolved phase fractions, the processing of the centrifuged bottle samples can distort the bulk porewater concentrations such that it no longer strictly represents the dissolved phase concentrations. An explanation for the use of this equation is presented
t/ o me outputs of the best fit line as determined by non-linear regression.
Equation 1 is formally derived for equilibration of a species in which two compartments are separated by a boundary layer (e.g. membrane or other permeable surface). It is also a common saturation type function used to describe a wide range of kinetic processes in which the rate is proportional to the concentration of the modeled species. The equation is used as an empirical means of d

Final Report
P:\HONEYWELL -SYR\442636 PHASE II PDI\09 REPORTS\9.7 PHASE II SUMMARY REPORT\APPENDIX D-POREWATER EQUILIBRATION
STUDY\REVISED DRAFT 2008\FINAL EQ STUDY 091808.DOC
SEPTEMBER 24, 2008
5
RESULTS
Evaluation of Membrane Resistance
The equilibration rate in these experiments is controlled by the membrane and diffusion coefficient because the bulk porewater and sampler are kept well mixed (i.e., the other resistances to diffusion generally observed while sampling porewater in sediments, including the diffusion sampler geometry and the sediment matrix itself, were not a factor). The observed equilibration rates were much slower with the use of the Teflon rather than Tuffryn membrane (Figure 1). The value of Km was 16.51 cm/day and 0.065 cm/day for Tuffryn and Teflon membranes, respectively. The Km for Tuffryn has been reported as 23.32 cm/day (Webster et al., 1998), while no literature value was found for Teflon.
The slow rate of equilibration with the use of the Teflon membrane is likely due to its hydrophobic nature. A design characteristic of Teflon is that it does not wet easily. As Cl- and other non-volatile species can only diffuse through water filled pores, the repulsion of water from the membrane pores would decrease the surface area available for diffusion and result in the reduced equilibration rate.

Final Report
P:\HONEYWELL -SYR\442636 PHASE II PDI\09 REPORTS\9.7 PHASE II SUMMARY REPORT\APPENDIX D-POREWATER EQUILIBRATION
Time (hours)0 100 200 300 400 500 600
Nor
mal
ized
Per
cent
Equ
ilibr
ium
% o
f Ave
rage
Bul
k C
once
ntra
tion
0
20
40
60
80
100
120
TuffrynTeflonTuffryn ModelPTFE Model
Figure 1. Equilibration of Cl- in laboratory samplers in a fully mixed system. The impact of membrane type on equilibration time is illustrated.
STUDY\REVISED DRAFT 2008\FINAL EQ STUDY 091808.DOC
SEPTEMBER 24, 2008
6

Final Report
P:\HONEYWELL -SYR\442636 PHASE II PDI\09 REPORTS\9.7 PHASE II SUMMARY REPORT\APPENDIX D-POREWATER EQUILIBRATION
STUDY\REVISED DRAFT 2008\FINAL EQ STUDY 091808.DOC
SEPTEMBER 24, 2008
7
VOC Sediment Equilibration Study by Site
The results of the sediment equilibration studies are discussed in detail below. The results are discussed first by site and then by compound. Not all compounds could be evaluated for each site as there were large variations in the concentrations of VOCs for sediments from each site. A summary of the fitted parameters and goodness of fit for each compound at each site are listed in Tables 1 and 2 for the Teflon and Tuffryn membrane equilibration studies respectively. It should also be noted that the Teflon and Tuffryn studies were conducted sequentially. While sediment for each study came from the same core, different core sections were used to conduct each of the two sets of experiments. This also led to slight variation in the compounds monitored for each site, although in general, they were very similar.
Site 20006
This sample material came from SMU 2, and was a white Solvay waste with no apparent NAPL, though a sheen formed on water when mixed with sediment; the pH ranged from 11-12.
Teflon Membrane Study - Three VOCs (Benzene, Toluene, and Naphthalene) and Cl- were at high enough concentrations to evaluate equilibration rates (Figure 2). The concentrations of each compound in the diffusion samplers were normalized to the average bulk porewater concentration. This allows all of the compounds to be presented on a single figure. The average bulk porewater concentration is useful as a relative benchmark although it is not the exact end point for equilibrium, therefore, equilibration times can not be read directly from the figures. In predicting equilibration times, this phenomena is taken onto account through the incorporation of α as described above. While the final equilibrium concentration for non-conserved species may not equal the average bulk porewater concentration, it should be relatively similar, see Appendix 1.
The VOCs equilibrated at a much faster rate than Cl- when using the Teflon membrane. Resistance of the membrane does not appear to be a significant issue in the sediment studies for VOCs. Transport of the VOCs is likely accomplished by volatilization to the air trapped in the non-wetted membrane and subsequent dissolution into the sampler water. In general, the data were well modeled by Equation 1 as indicated by the solid lines in Figure 2 and the regression coefficients (Table 1) that were greater than 0.9 for the VOCs and 0.8 for Cl-. Mass transfer coefficients (Km), determined from the output of curve fitting equation 1 to the experimental data, for the VOCs ranged from a high of 1.5 cm/d for Naphthalene to a low of 0.47 cm/d for Toluene. It should be noted that (Km) for Cl- is almost identical between the sediment equilibration study and the membrane evaluation study (0.066 cm/day and 0.065 cm/day, respectively), indicating that with the Teflon membrane for non-volatile components, the membrane is the primary impediment to equilibration.

Final Report
P:\HONEYWELL -SYR\442636 PHASE II PDI\09 REPORTS\9.7 PHASE II SUMMARY REPORT\APPENDIX D-POREWATER EQUILIBRATION
STUDY\REVISED DRAFT 2008\FINAL EQ STUDY 091808.DOC
SEPTEMBER 24, 2008
8
tively, by the end of the experimental period (note that equilibration times for lake samplers will be shown to be
The VOCs achieved 90% of the predicted equilibrium concentration (α*100) in 17, 33, and 10 days for Benzene, Toluene, and Naphthalene, respec
significantly shorter than those for laboratory bottle samplers).
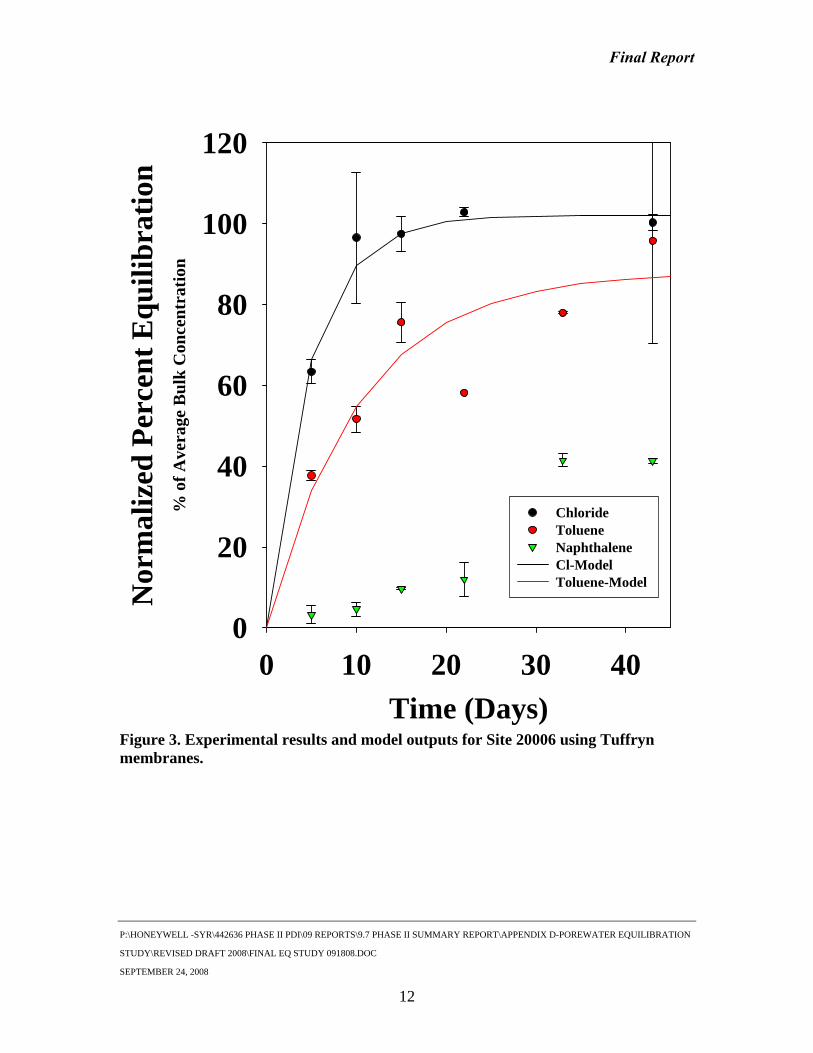
Tuffryn Membrane Study - Only two VOCs (Toluene and Naphthalene) were at high enough concentrations in sediment from Site 20006 for the Tuffryn membrane study (Figure 3). VOC results of the Tuffryn membrane study largely parallel the Teflon membrane study, but the equilibration of Cl- was mu apid with the Tuffryn mem
evious published studies. For Toluene, the only VOC for this site for which K could be determined using both types of membranes, K w
be expected for a conserved species, while there was little difference in the α values for Toluene whether using Tuffryn or Teflon membranes (0.88 and 0.74, respectively).
ch more rbrane for reasons discussed previously.
Toluene and Cl- were well fit using Equation 1 (r2 = 0.7 and 0.8, respectively), but the model was unable to find a solution that would converge or produced a solution with a physically possible solution for the Naphthalene data (Table 2). The mass transfer coefficient (Km) for Cl- using the Tuffryn membrane derived from the sediment equilibration study is less than Km for the membrane evaluation study (1.78 cm/day and 16.51 cm/day, respectively), indicating that the membrane resistance is not the primary resistance factor as would be expected from pr
m
m as similar regardless of membrane type.
Both Cl- and Toluene achieved equilibrium (i.e. final normalized equilibration percent approximately equaled α *100) in the experimental time period (11 and 23 days, respectively). The determined Cl- α value was 1.02 as would

Final Report
P:\HONEYWELL -SYR\442636 PHASE II PDI\09 REPORTS\9.7 PHASE II SUMMARY REPORT\APPENDIX D-POREWATER EQUILIBRATION STUDY\REVISED DRAFT 2008\FINAL EQ STUDY 091808.DOC
SEPTEMBER 24, 2008
9
Table 1. Mass transfer coefficients (Km), α, and correlation coefficients determined by fitting Equation 1 for data produced from laboratory equilibration studies using Teflon membranes.
Compound Km (± Standard Error) Cm/d
α(± Standard Error) r2
20006 10009 S4C
TR05B 20006 10009 S4C
TR05B
20006 10009 S4C
TR05B
Benzene 0.89 (0.15)
1.2 (0.12)
3.1 (1.6)
0.92 (0.05)
1.03 (0.03)
0.93 (0.05)
0.93 0.97 0.86
Toluene 0.47 (0.09)
1.6 (0.2)
1.1 (0.29)
0.71 (0.06)
0.69 (0.02)
1.2 (0.08)
0.95 0.96 0.90
Chlorobenzene 3.9 (1.5)
0.84 (0.03)
0.89
Xylene 2.1 (.61)
0.59 (0.03)
0.85
o-Xylene 2.1 (0.61)
0.57 (0.04)
0.87
Naphthalene 1.5 (0.20)
1.5 (0.29)
0.37 (0.02)
0.76 (0.04)
0.97 0.92
Chloride 0.066* (0.01)
0.061* (0.01)
0.05* (.006)
1* 1* 1* 0.81 0.82 0.72*
Mercury 0.17* (0.02)
1* 1* 1* 0.64*
* α assumed 1 in order to estimate equilibration rate.

Final Report
P:\HONEYWELL -SYR\442636 PHASE II PDI\09 REPORTS\9.7 PHASE II SUMMARY REPORT\APPENDIX D-POREWATER EQUILIBRATION STUDY\REVISED DRAFT 2008\FINAL EQ STUDY 091808.DOC
SEPTEMBER 24, 2008
10
Table 2. Mass transfer coefficients (Km), α, and correlation coefficients determined by fitting Equation 1 for data produced from laboratory equilibration studies using Tuffryn membranes.
Compound Km (± Standard Error) cm/d
α(± Standard Error) r2
20006 10009 S4C TR05B 20006 10009 S4C TR05B 20006 10009 S4C
TR05B
Benzene 1.1 (0.25)
0.42 (0.18)
0.72 (0.05)
1.2 (0.22)
0.77 0.82
Toluene 0.76 (0.2)
0.87 (0.23)
0.80 (0.08)
0.88 (.08)
0.7 (.07)
1.13 (.04)
0.7 0.73 0.94
Chlorobenzene 0.82 (0.16)
0.36 (0.09)
0.9 (0.05)
1.36 (0.18)
0.83 0.89
Ethylbenzene 0.61 (0.12)
0.9 (0.07)
0.85
Xylene 0.61 (0.16)
0.75 (0.09)
0.84
1,2-Dichlorobenzene
0.41 (0.1)
0.74 (0.09)
1,4-Dichlorobenzene
0.30* (0.19)
1.37* (0.47)
0.81*
Naphthalene 1.0 (.29)
0.21 (0.08)
0.52 (0.04)
1.12 (0.29)
0.76 0.92
Cl 1.6 (0.23)
0.95 (0.23)
2.0 (0.15)
1.6/2.1 (.29/.25)
1.02 (0.03)
0.98 (0.02)
1.1 (0.01)
0.9/0.9 (.02/.04)
0.83 0.95 0.91 0.73/0.91
Mercury 2.8/2.4 (1.2/.7)
0.9/1.1 (.07/.08)
0.26/0.78
* Data normalized by dividing each bottle sampler time point concentration by the concentration in the bulk porewater for that time point as opposed to the average of all bulk water time points. This was done due to the model not converging when the data was normalized to the average bulk water concentration for all time points.

Final Report
Time (Days)0 10 20 30 40
Nor
mal
ized
Per
cent
Equ
ilibr
atio
n%
of A
vera
ge B
ulk
Con
cent
ratio
n
0
20
40
60
80
100
120BenzeneTolueneNaphthaleneBenzene Model Toluene ModelNaphthalene Model ChlorideChloride Model
Figure 2. Experimental results and model outputs for Site 20006 using Teflon membranes.
P:\HONEYWELL -SYR\442636 PHASE II PDI\09 REPORTS\9.7 PHASE II SUMMARY REPORT\APPENDIX D-POREWATER EQUILIBRATION
STUDY\REVISED DRAFT 2008\FINAL EQ STUDY 091808.DOC
SEPTEMBER 24, 2008
11
Final Report
Time (Days)0 10 20 30 40
Nor
mal
ized
Per
cent
Equ
ilibr
atio
n%
of A
vera
ge B
ulk
Con
cent
ratio
n
0
20
40
60
80
100
120
ChlorideTolueneNaphthalene Cl-ModelToluene-Model
Figure 3. Experimental results and model outputs for Site 20006 using Tuffryn membranes.
P:\HONEYWELL -SYR\442636 PHASE II PDI\09 REPORTS\9.7 PHASE II SUMMARY REPORT\APPENDIX D-POREWATER EQUILIBRATION
STUDY\REVISED DRAFT 2008\FINAL EQ STUDY 091808.DOC
SEPTEMBER 24, 2008
12

Final Report
P:\HONEYWELL -SYR\442636 PHASE II PDI\09 REPORTS\9.7 PHASE II SUMMARY REPORT\APPENDIX D-POREWATER EQUILIBRATION
STUDY\REVISED DRAFT 2008\FINAL EQ STUDY 091808.DOC
SEPTEMBER 24, 2008
13
Site 10009
Sample material came from SMU 1, and was described as very white Solvay waste with bands of darker colors, a very strong smell with some NAPL present, and a pH ranging from 11-12. It should be noted that an oily emulsion was present in porewater from the site which could penetrate the filter. Care was taken to stop filtration before the emulsion broke through. Concentrations of VOCs at this site were generally quite high.
Teflon Membrane Study - Five compounds (Benzene, Toluene, m,p-Xylene, o-Xylene, and Naphthalene) were at sufficiently high enough concentrations in sediment from Site 10009. Results from this site generally paralleled those for Site 20006 using the Teflon membrane (Figure 4).
In general, the data were well fit by Equation 1 with r2 ranging from 0.85 to 0.97 for the VOCs and 0.81 for Cl- (Table 1). The mass transfer coefficients (Km) were quite similar for all VOCs (from a low of 1.2 cm/d to a high of 2.1 cm/d for o-Xylene; probably not statistically different given the standard error values). The Km value for Cl- (0.06 cm/d) was again very similar to the Km value from the Teflon membrane evaluation study (0.065 cm/d). The α values ranged from a high of 1.0 for Benzene to a low of 0.57 for Xylene. All VOCs achieved 90% equilibrium (α * 100) in 8-15 days.
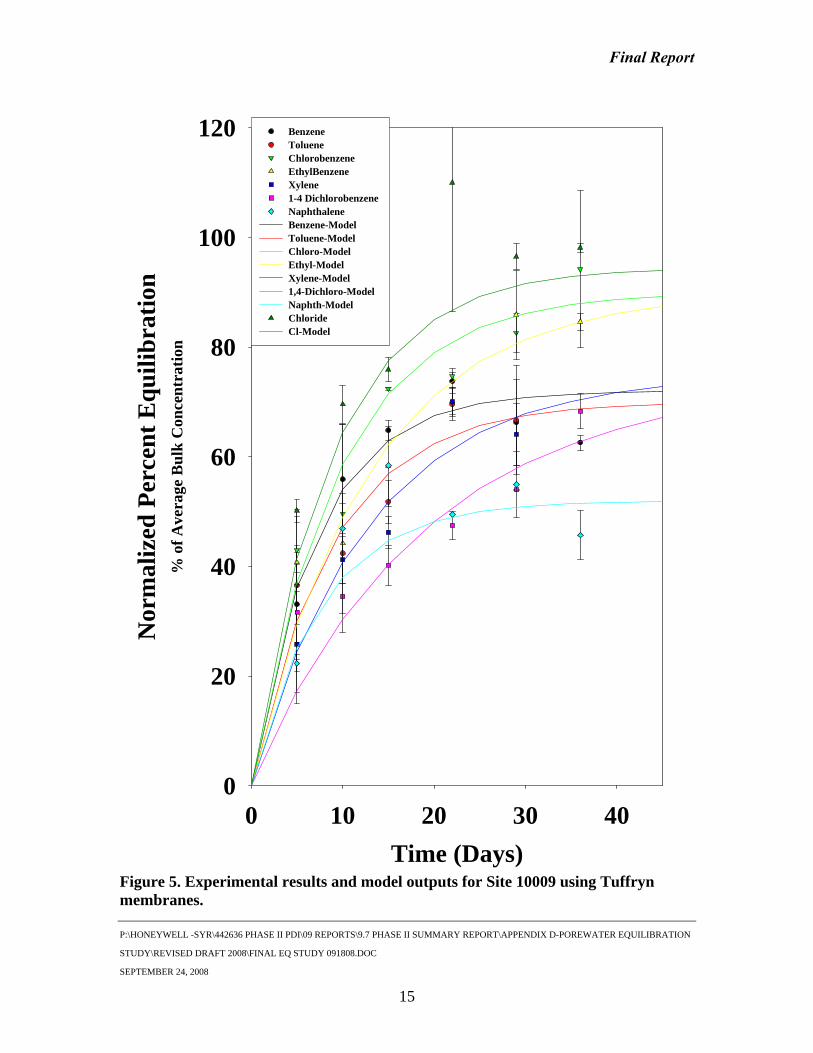
Tuffryn Membrane Study - Seven compounds (Benzene, Toluene, Chlorobenzene, Ethylbenzene, Xylene, 1,2-Dichlorobenzene, and Naphthalene) were at sufficiently high enough concentrations in sediment from Site 10009 for the Tuffryn membrane studies (Figure 5).
In general, the data were well fit by Equation 1 with r2 ranging from 0.73 to 0.85 for the VOCs and equal to 0.95 for Cl- (Table 2). The mass transfer coefficients (Km) varied over a narrow range for the VOCs from a low of 0.41 cm/d for 1,2-Dichlorobenzene to a high of 1.1 cm/d for Benzene. The Km value for Cl- was 0.95 cm/d. The α values for the VOCs varied over a narrow range (0.7-0.9) with the exception of Naphthalene (α = 0.52). As in the Site 20006 Tuffryn membrane study, the α value for Cl- (0.98) was essentially 1. All VOCs essentially achieved 90% equilibrium in the experimental time period (16-29 days) with the exception of 1, 2-Dichlorobenzene (43 days).

Final Report
Time (Days)0 10 20 30 40
Nor
mal
ized
Per
cent
Equ
ilibr
atio
n%
of A
vera
ge B
ulk
Con
cent
ratio
n
0
20
40
60
80
100
120 BenzeneTolueneXyleneO-XyleneNaphthaleneBenzene ModelToluene Model Xylene Model O-Xylene ModelNaphthalene ModelChlorideChloride Model
igure 4. Experimental results and model outputs for Site 10009 using Teflon Fmembranes.
P:\HONEYWELL -SYR\442636 PHASE II PDI\09 REPORTS\9.7 PHASE II SUMMARY REPORT\APPENDIX D-POREWATER EQUILIBRATION
STUDY\REVISED DRAFT 2008\FINAL EQ STUDY 091808.DOC
SEPTEMBER 24, 2008
14
Final Report
Time (Days)0 10 20 30 40
Nor
mal
ized
Per
cent
Equ
ilibr
atio
n%
of A
vera
ge B
ulk
Con
cent
ratio
n
0
20
40
60
80
100
120 BenzeneTolueneChlorobenzeneEthylBenzene Xylene1-4 Dichlorobenzene NaphthaleneBenzene-ModelToluene-Model Chloro-ModelEthyl-ModelXylene-Model1,4-Dichloro-Model Naphth-ModelChlorideCl-Model
Figure 5. Experimental results and model outputs for Site 10009 using Tuffryn membranes.
P:\HONEYWELL -SYR\442636 PHASE II PDI\09 REPORTS\9.7 PHASE II SUMMARY REPORT\APPENDIX D-POREWATER EQUILIBRATION
STUDY\REVISED DRAFT 2008\FINAL EQ STUDY 091808.DOC
SEPTEMBER 24, 2008
15

Final Report
P:\HONEYWELL -SYR\442636 PHASE II PDI\09 REPORTS\9.7 PHASE II SUMMARY REPORT\APPENDIX D-POREWATER EQUILIBRATION
STUDY\REVISED DRAFT 2008\FINAL EQ STUDY 091808.DOC
SEPTEMBER 24, 2008
16
Site S4C
Sample material from SMU 7 was a black oily waste material with a very strong asphalt-like odor and NAPL present. Porewater pH ranged from 7 to 9. In contrast to the other sites, sediment from this site was black with an obvious oil sheen and apparently highly organic, based on the color, texture, and buoyantly neutral suspended particles. It should also be noted that centrifuged bulk water samples were exceedingly difficult to filter regardless of centrifugation speed or time. In general, it required one syringe filter per 2 mL of filtrate.
Teflon Membrane Study - Three compounds (Benzene, Toluene, and Chlorobenzene) were at sufficiently high enough concentrations in sediment from Site S4C for evaluation (Figure 6). Results were generally similar to sites 20006 and 10009 with a few exceptions outlined below.
In general, the data were well fit by Equation 1 with r2 ranging from 0.86 to 0.90 for the VOCs (Table 1). The model was unable to fit the Cl- data, probably due to the low equilibrium rate combined with very variable results. The discrepancy between the VOCs and Cl- can again be related to the non-wetting membrane property of Teflon. For this site it may have also been aggravated by the frequent presence of bubbles in the samplers. The bubble origin is not completely understood, but is believed to be caused by a negative osmotic pressure in the sampler due to the large difference in ionic strength between the peeper water and porewater, and supersaturated gas (possibly biogenic due to lower pH) in the sediment. The highly hydrophobic nature of the membrane may then facilitate bubble formation on the membrane. Smaller bubbles were found in some samplers from the other sites when using Teflon membrane but only S4C consistently contained bubbles of significant size.
The mass transfer coefficients (Km) were generally similar for all three VOCs from a low of 1.1 cm/d to a high of 3.9 cm/d. The α values ranged from 0.84 - 1.2. All VOCs achieved 90% equilibrium in the experimental time period (4 - 16 days).
Tuffryn Membrane Study - Five compounds (Benzene, Toluene, Chlorobenzene, 1,4-Dichlorobenzene, and Naphthalene) were at sufficiently high enough concentrations in sediment from Site S4C for evaluation. Results generally paralleled the results for the Teflon membrane study with the exception of Cl- (Figure 7). For compound 1,4 dichlorobenzene the data was normalized by dividing each bottle samplers concentration by the average concentration in the bulk porewater for that time point as opposed to the average of all bulk water time points. This was done due to the model producing a non-realistic solution when the data was normalized to the average bulk water concentration for all time points. This analysis differs from that of all other compounds for all the sites but was done as a means of producing some estimate of the rate of equilibration of 1,4 dichlorobenzene.

Final Report
P:\HONEYWELL -SYR\442636 PHASE II PDI\09 REPORTS\9.7 PHASE II SUMMARY REPORT\APPENDIX D-POREWATER EQUILIBRATION
STUDY\REVISED DRAFT 2008\FINAL EQ STUDY 091808.DOC
SEPTEMBER 24, 2008
17
In general, the data were well fit by Equation 1 with r2 ranging from 0.82 to 0.94 for the VOCs and 0.91 for Cl- (Table 2). Data for 1,2-Dichlorobenzene could not be successfully fit to the model. The mass transfer coefficients (Km) varied for the VOCs from a low of 0.21 cm/d for Naphthalene to a high of 0.8 cm/d for Toluene. The Km value for Cl- was 2.0 cm/d. The α values for the VOCs varied over a narrow range (1.12 - 1.36), α values were higher than for the other two sites. While this increase in the value of α is generally small and the sample size is not large, a likely explanation may be increased size exclusion during filtering or increased loss during filtering of the bulk water samples. As mentioned, the filters clogged extremely quickly when centrifuged bulk porewater was filtered. This clogging essentially increases the particle exclusion of the filters. This particle exclusion would then theoretically decrease the difference in concentrations observed between the samplers and bulk porewater (centrifuged, filtered). As in the Site 20006 and 10009 Tuffryn membrane studies, the α value for Cl- (1.1) was essentially 1. VOCs were predicted to achieve 90% equilibrium in 22 - 49 days, with the exception of Naphthalene which was predicted to require 84 days.

Final Report
Time (Days)0 10 20 30 40
Nor
mal
ized
Per
cent
Equ
libra
tion
% o
f Ave
rgae
Bul
k C
once
ntra
tion
0
20
40
60
80
100
120
BenzeneTolueneChlorobenzeneBenzene ModelToluene Model Chlorobenzene Model Chloride
Figure 6. Experimental results and model outputs for Site S4C using Teflon membranes.
P:\HONEYWELL -SYR\442636 PHASE II PDI\09 REPORTS\9.7 PHASE II SUMMARY REPORT\APPENDIX D-POREWATER EQUILIBRATION
STUDY\REVISED DRAFT 2008\FINAL EQ STUDY 091808.DOC
SEPTEMBER 24, 2008
18

Final Report
Time (Days)0 10 20 30 40
Nor
mal
ized
Per
cent
Equ
ilibr
atio
n%
of A
vera
ge B
ulk
Con
cent
ratio
n
0
20
40
60
80
100
120
BenzeneTolueneChlorobenzene1,4 DichlorobenzeneNaphthaleneChlorideBenzene-ModelToluene-ModelChlorobenzene-Model 1,4-dichloro-ModelNaphth-Model Chloride-Model
Figure 7. Experimental results and model outputs for Site S4C using Tuffryn membranes.
P:\HONEYWELL -SYR\442636 PHASE II PDI\09 REPORTS\9.7 PHASE II SUMMARY REPORT\APPENDIX D-POREWATER EQUILIBRATION
STUDY\REVISED DRAFT 2008\FINAL EQ STUDY 091808.DOC
SEPTEMBER 24, 2008
19

Final Report
P:\HONEYWELL -SYR\442636 PHASE II PDI\09 REPORTS\9.7 PHASE II SUMMARY REPORT\APPENDIX D-POREWATER EQUILIBRATION
STUDY\REVISED DRAFT 2008\FINAL EQ STUDY 091808.DOC
SEPTEMBER 24, 2008
20
VOC Sediment Equilibration Study Inter-Site Membrane Comparison by Compound
The following discussion presents the same data as above, but organizes it based on compound rather than site. This more easily allows similarities or differences between sites to be evaluated. Only compounds which were present at more than one site are discussed.
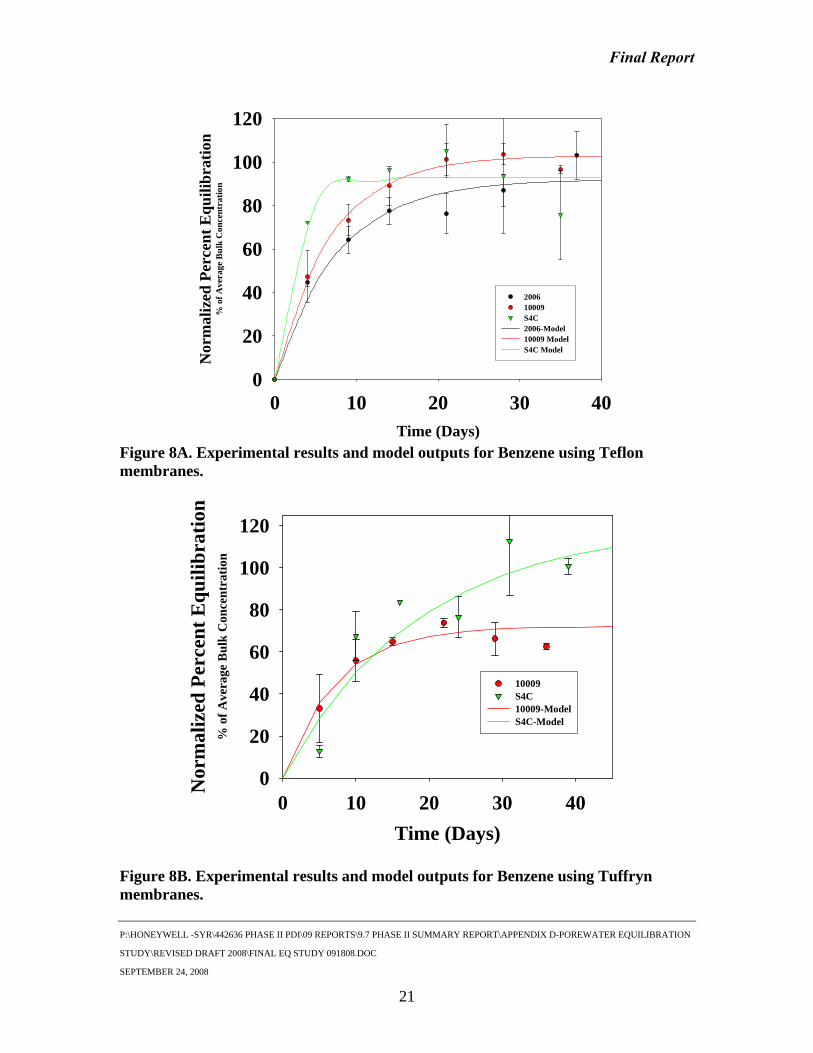
Benzene - Equilibration of benzene was similar between all three sites when Teflon was used as the membrane (Figure 8A). Mass transfer coefficients (Km) were similar as were α values (Table 1 and 2). Equilibration rates when using Tuffryn membranes (Figure 8B) were similar between sites while α values were more variable for reasons previously discussed.
Toluene - Equilibration of Toluene was the most consistent between sites and membrane types (Figure 9A and 9B). Mass transfer coefficients were highly similar for all three sites for the Tuffryn membrane studies (0.76-0.87), but more variable (0.47-1.6) for the Teflon studies (Tables 1 and 2). The α values were also very similar between sites 20006 and 10009 for both membrane types, but results from S4C for both membrane types were significantly higher as previously discussed.
Naphthalene- Equilibration of Naphthalene appeared to be the most variable between sites or membrane types (Figure 10A and 10B). However, with the exception of the Site S4C Tuffryn study, Km values were quite similar (1.0-1.3). The α values were much more variable ranging from 0.37 - 1.18, again with the highest value associated with the S4C sediment.
Chloride- Equilibration of Cl- was quite similar between sites for a given membrane type, but extremely different between membrane types (Figure 11A and 11B). The Km values for the Tuffryn studies were on average the highest for all compounds tested and were the lowest for the Teflon studies (Tables 1 and 2). The α values were consistently close to 1 as would be expected for a conserved species.
Final Report
Time (Days)
0 10 20 30 40
Nor
mal
ized
Per
cent
Equ
ilibr
atio
n%
of A
vera
ge B
ulk
Con
cent
ratio
n
0
20
40
60
80
100
120
200610009S4C2006-Model10009 ModelS4C Model
Figure 8A. Experimental results and model outputs for Benzene using Teflon membranes.
Time (Days)0 10 20 30 40
Nor
mal
ized
Per
cent
Equ
ilibr
atio
n%
of A
vera
ge B
ulk
Con
cent
ratio
n
0
20
40
60
80
100
120
10009S4C10009-ModelS4C-Model
Figure 8B. Experimental results and model outputs for Benzene using Tuffryn membranes.
P:\HONEYWELL -SYR\442636 PHASE II PDI\09 REPORTS\9.7 PHASE II SUMMARY REPORT\APPENDIX D-POREWATER EQUILIBRATION
STUDY\REVISED DRAFT 2008\FINAL EQ STUDY 091808.DOC
SEPTEMBER 24, 2008
21

Final Report
Time (Days)0 10 20 30 40
Rel
ativ
e E
quili
brat
ion
% o
f Ave
rage
Bul
k C
once
ntra
tion
0
20
40
60
80
100
120
200610009S4C2006 Model 10009 Model S4C Model
Figure 9A. Experimental results and model outputs for Toluene using Teflon membranes.
Time (Days)0 10 20 30 40
Nor
mal
ized
Per
cent
Equ
ilibr
atio
n%
of A
vera
ge B
ulk
Con
cent
ratio
n
0
20
40
60
80
100
120
200610009S4C2006-Model 10009-ModelS4C-Model
Figure 9B. Experimental results and model outputs for Toluene using Tuffryn membranes. P:\HONEYWELL -SYR\442636 PHASE II PDI\09 REPORTS\9.7 PHASE II SUMMARY REPORT\APPENDIX D-POREWATER EQUILIBRATION
STUDY\REVISED DRAFT 2008\FINAL EQ STUDY 091808.DOC
SEPTEMBER 24, 2008
22

Final Report
Time(days)
0 10 20 30 40
Rel
ativ
e E
quili
briu
m%
of A
vera
ge B
ulk
Con
cent
ratio
n
0
20
40
60
80
10020061000920006-Model 10009-Model
Figure 10A. Experimental results and model outputs for Naphthalene using Teflon membranes.
Time (Days)0 10 20 30 40
Nor
mal
ized
Per
cent
Equ
ilibr
atio
n%
of A
vera
ge B
ulk
Con
cent
ratio
n
0
20
40
60
80
100
120 200610009S4C2006-Model 10009-ModelS4C-Model
Figure 10B. Experimental results and model outputs for Naphthalene using Tuffryn membranes.
P:\HONEYWELL -SYR\442636 PHASE II PDI\09 REPORTS\9.7 PHASE II SUMMARY REPORT\APPENDIX D-POREWATER EQUILIBRATION
STUDY\REVISED DRAFT 2008\FINAL EQ STUDY 091808.DOC
SEPTEMBER 24, 2008
23

Final Report
Time(days)
0 10 20 30 40
Rel
ativ
e E
quili
brat
ion
% o
f Ave
rage
Bul
k C
once
ntra
tion
0
20
40
60
80
100200610009S4C20006-Model10009-Model
Figure 11A. Experimental results and model outputs for Cl- using Teflon membranes.
Time (Days)0 10 20 30 40
Nor
mal
ized
Per
cent
Equ
ilibr
atio
n%
of A
vera
ge B
ulk
Con
cent
ratio
n
0
20
40
60
80
100
120
200610009S4C2006-Model 10009-ModelS4C-Model
Figure 11B. Experimental results and model outputs for Cl- using Tuffryn membranes. P:\HONEYWELL -SYR\442636 PHASE II PDI\09 REPORTS\9.7 PHASE II SUMMARY REPORT\APPENDIX D-POREWATER EQUILIBRATION
STUDY\REVISED DRAFT 2008\FINAL EQ STUDY 091808.DOC
SEPTEMBER 24, 2008
24

Final Report
P:\HONEYWELL -SYR\442636 PHASE II PDI\09 REPORTS\9.7 PHASE II SUMMARY REPORT\APPENDIX D-POREWATER EQUILIBRATION
STUDY\REVISED DRAFT 2008\FINAL EQ STUDY 091808.DOC
SEPTEMBER 24, 2008
25
Mercury Sediment Equilibration Study
The equilibration study for Hg was conducted on sediment from Site TR05B. Sediment was white with a yellow tint, very fine, with an exceptionally strong odor similar to Ammonia. The pH was near 12. Some problems were encountered during the Hg study. Hg in the bulk porewater was not as stable as either the VOCs or Cl- from past studies. As there appeared to be a consistent loss of Hg from the bulk solution over time, the Tuffryn study was repeated to validate the results and to try to reduce the loss of Hg from the bulk porewater. As the pH in the porewater did not appear to change during the study, we hypothesized that O2 may have produced the loss. The second experiment was conducted with the centrifuge bottles incubated under water to try to reduce O2 diffusion through the Teflon bottle. This had little effect, so if O2 is the cause of the Hg loss, it is either from O2 in the Teflon bottles or it is introduced in the core processing. While this does introduce an uncertainty term into the results, a number of factors minimize the uncertainty including the similarity in repeated experiments, and the high similarity to Cl- equilibration in both cases.
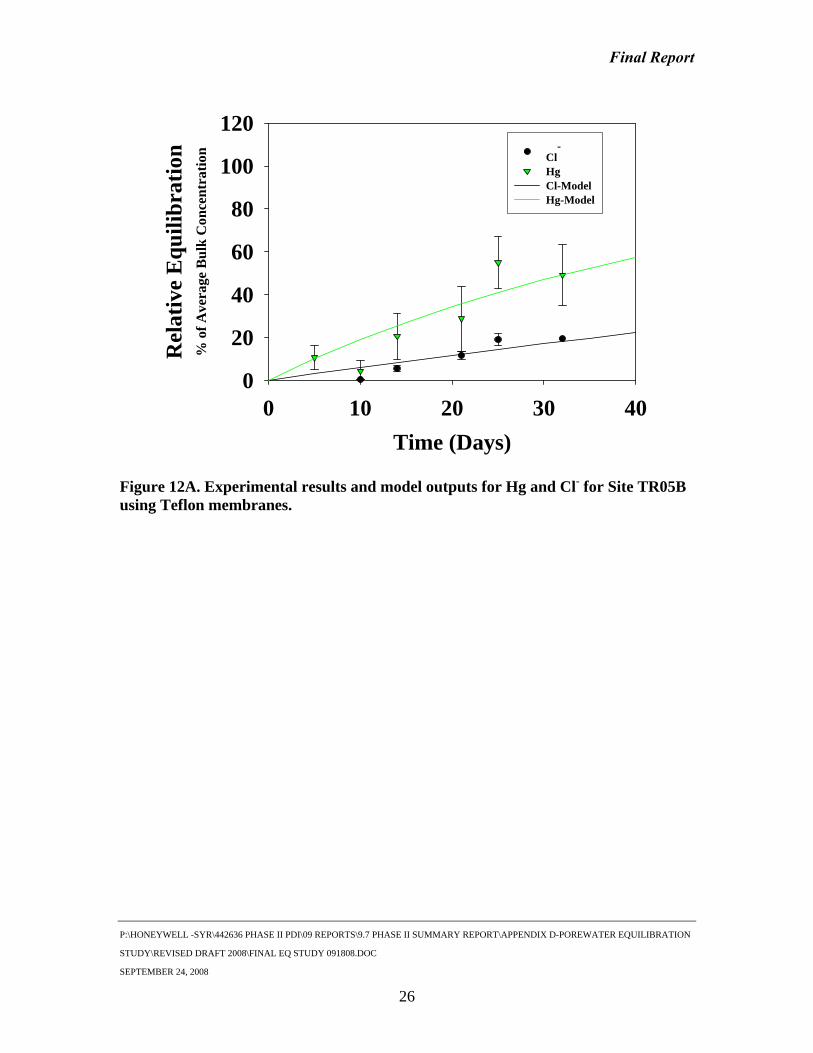
Teflon Membrane Study - Equilibration of Hg for the Teflon membrane study was similar to Cl- equilibration for both the TR05B site and other Teflon membrane studies (Figures 12a and 12b). Due to the very slow rate of equilibration, the model was unable to converge on a best fit if α was left as an unknown. Similar to Cl- for the Teflon membrane studies on other sites, we assumed an α value of 1, and were able to estimate the mass transfer coefficient (0.17). Assuming an α of 1 is not ideal, but is supported from the results of the Tuffryn study in which α ranged from 0.9-1.1. The Km value for Cl- was 0.05 cm/d, which is very similar to the results from sites 20006 and 10009 (0.067 and 0.058 cm/d, respectively).
Tuffryn Membrane Study - The experiments designed to determine the equilibration rate of Hg using Tuffryn membrane were conducted twice as explained above. Results from both sets of experiments were very similar (Figure 13A and 13B). The Hg equilibration was very similar to the equilibration of Cl-. The Km values between the two replicate Hg experiments were quite similar (2.8 and 2.4 cm/d) and the α values were 0.9 and 1.1. Results for Cl- were very similar to the results for Tuffryn studies from sites 20006, 10009, and S4C. In both studies using Tuffryn membrane, 90% equilibration was achieved in approximately 7 days.
Final Report
Time (Days)0 10 20 30 40
Rel
ativ
e E
quili
brat
ion
% o
f Ave
rage
Bul
k C
once
ntra
tion
0
20
40
60
80
100
120Cl
-
HgCl-Model Hg-Model
Figure 12A. Experimental results and model outputs for Hg and Cl- for Site TR05B using Teflon membranes.
P:\HONEYWELL -SYR\442636 PHASE II PDI\09 REPORTS\9.7 PHASE II SUMMARY REPORT\APPENDIX D-POREWATER EQUILIBRATION
STUDY\REVISED DRAFT 2008\FINAL EQ STUDY 091808.DOC
SEPTEMBER 24, 2008
26

Final Report
Time (Days)0 10 20
Rel
ativ
e E
quili
brat
ion
% o
f Ave
rage
Bul
k C
once
ntra
tion
0
20
40
60
80
100
120
Cl Run 1Hg Run 1Cl-Model Run 1Hg-Model Run 1Cl Run 2 Hg Run 2 Cl Model Run 2 Hg Model Run 2
Figure 12B. Experimental results and model outputs for Hg and Cl- for Site TR05B using Tuffryn membranes.
P:\HONEYWELL -SYR\442636 PHASE II PDI\09 REPORTS\9.7 PHASE II SUMMARY REPORT\APPENDIX D-POREWATER EQUILIBRATION
STUDY\REVISED DRAFT 2008\FINAL EQ STUDY 091808.DOC
SEPTEMBER 24, 2008
27

Final Report
P:\HONEYWELL -SYR\442636 PHASE II PDI\09 REPORTS\9.7 PHASE II SUMMARY REPORT\APPENDIX D-POREWATER EQUILIBRATION
STUDY\REVISED DRAFT 2008\FINAL EQ STUDY 091808.DOC
SEPTEMBER 24, 2008
28
PREDICTION OF LAKE DIFFUSION SAMPLER EQUILIBRATION TIMES
The required equilibrium times for the lake samplers were determined using the mass transfer coefficients from Tables 1 and 2 and correcting for the larger surface area to volume ratio of the lake samplers. The laboratory studies were conducted using bottle samplers with a volume to surface area ratio of 7.7 cm while the lake samplers have an F factor of 2.5 cm (the cells have a volume of 28 ml, a length of 6.9 cm, and a width of 1.6,cm per cell). The impact of surface area to volume on equilibration time has been well established (Webster et al., 1998).
Equation 1 can be rearranged to determine the time required to achieve 90% equilibrium (Teq
90). Teq
90= 2.3* F/Km Equation 2
Predicted equilibration times using Equation 2 are listed in Table 3. Predicted equilibration curves produced by Equation 1 for each compound at each site for both membrane types are presented in Figures 13A and B through Figures 16 A and B. A horizontal line at 90% equilibrium has been added to all of the figures.
The results indicate that, in general, less than 16 days would be required to achieve 90% equilibrium for all VOCs for either membrane type. The exception is Naphthalene for Site S4C using the Tuffryn membrane, which would require 28 days. Equilibration times for VOCs using either membrane type are largely comparable. However, predicted equilibration times for Cl- (86 - 115 days) and Hg (34 days) are substantially longer using the Teflon membrane. Required equilibration times for Cl- (2.7 - 6.1 days) and Hg (2.1 - 2.4 days) using the Tuffryn membrane were generally smaller than the VOCs. For some sites, only a few compounds were able to be evaluated, but given the similarity on compounds examined and reasonable similar results between sites, the overall data set is adequately robust to allow extrapolation between sites and other similar compounds.

Final Report
P:\HONEYWELL -SYR\442636 PHASE II PDI\09 REPORTS\9.7 PHASE II SUMMARY REPORT\APPENDIX D-POREWATER EQUILIBRATION
STUDY\REVISED DRAFT 2008\FINAL EQ STUDY 091808.DOC
SEPTEMBER 24, 2008
29
Table 3. Predicted times required for 90% equilibration for lake diffusion samplers.
Time Predicted to 90% Equilibrium (days)
Compound
Teflon Tuffryn
20006 10009 S4C TR05
B 20006 10009 S4C TR05B Benzene 6.46 4.95 1.8 5.2 13.7 Toluene 12.2 3.59 5.2 7.6 6.6 7.2
Chlorobenzene 1.45 7.0 16.0 Ethylbenzene 9.4
Xylene 2.7 9.4 o-Xylene 2.7
1,2-Dichlorobenzene 14.0 1,4-Dichlorobenzene 18.9
Naphthalene 3.83 3.85 5.6 27.4 Cl 86* 99* 115 3.5 6.1 2.9 3.6/2.7 Hg 34 2.1/2.4

Final Report
Time (Days)0 10 20 30 40 50
Perc
ent E
quili
brat
ion
0
20
40
60
80
100
120
BenzeneTolueneNaphthaleneChloride
Figure 13A. Predicted equilibration results for VOCs and Cl- for the lake diffusion samplers for Site 20006 using a Teflon membrane.
Time (Days)0 10 20 30 40 50
Perc
ent E
quili
brat
ion
0
20
40
60
80
100
120
ChlorideToluene
Figure 13B. Predicted equilibration results for VOCs and Cl- for the lake diffusion samplers for Site 20006 using a Tuffryn membrane.
P:\HONEYWELL -SYR\442636 PHASE II PDI\09 REPORTS\9.7 PHASE II SUMMARY REPORT\APPENDIX D-POREWATER EQUILIBRATION
STUDY\REVISED DRAFT 2008\FINAL EQ STUDY 091808.DOC
SEPTEMBER 24, 2008
30

Final Report
Time (Days)0 10 20 30 40 50
Perc
ent E
quili
brat
ion
0
20
40
60
80
100
120
BenzeneTolueneXyleneO-XyleneNaphthalene
Cl-
Figure 14A. Predicted equilibration results for VOCs and Cl- for the lake diffusion samplers for Site 10009 using a Teflon membrane.
Time (Days)0 10 20 30 40 50
Perc
ent E
quili
brat
ion
0
20
40
60
80
100
120
ChlorideBenzeneTolueneChlorobenzene EthylbenzeneXylene 1,2 DichlorobenzeneNaphthalene
Figure 14B. Predicted equilibration results for VOCs and Cl- for the lake diffusion samplers for Site 10009 using a Tuffryn membrane.
P:\HONEYWELL -SYR\442636 PHASE II PDI\09 REPORTS\9.7 PHASE II SUMMARY REPORT\APPENDIX D-POREWATER EQUILIBRATION
STUDY\REVISED DRAFT 2008\FINAL EQ STUDY 091808.DOC
SEPTEMBER 24, 2008
31

Final Report
Time (Days)0 10 20 30 40 50
Perc
ent E
qulib
ratio
n
0
20
40
60
80
100
120
BenzeneTolueneChlorobenzene
Figure 15A. Predicted equilibration results for VOCs and Cl- for the lake diffusion samplers for Site S4C using a Teflon membrane.
Time (Days)0 10 20 30 40 50
Perc
ent E
quili
brat
ion
0
20
40
60
80
100
ChlorideBenzeneTolueneChlorobenzene1-4 DichlorobenzeneNaphthalene
Figure 15B. Predicted equilibration results for VOCs and Cl- for the lake diffusion samplers for Site S4C using a Tuffryn membrane.
P:\HONEYWELL -SYR\442636 PHASE II PDI\09 REPORTS\9.7 PHASE II SUMMARY REPORT\APPENDIX D-POREWATER EQUILIBRATION
STUDY\REVISED DRAFT 2008\FINAL EQ STUDY 091808.DOC
SEPTEMBER 24, 2008
32

Final Report
Time (Days)0 10 20 30 40
Perc
ent E
quili
brat
ion
0
20
40
60
80
100Cl-Hg
Figure 16A. Predicted equilibration results for Hg and Cl- for the lake diffusion samplers for Site TR05B using a Teflon membrane.
Time (Days)0 5 10 15 20
Perc
ent E
quili
brat
ion
0
20
40
60
80
100
120
Cl Run 1 Cl Run 2 Hg Run 1Hg Run 2
Figure 16B. Predicted equilibration results for Hg and Cl- for the lake diffusion samplers for Site TR05B using a Tuffryn membrane.
P:\HONEYWELL -SYR\442636 PHASE II PDI\09 REPORTS\9.7 PHASE II SUMMARY REPORT\APPENDIX D-POREWATER EQUILIBRATION
STUDY\REVISED DRAFT 2008\FINAL EQ STUDY 091808.DOC
SEPTEMBER 24, 2008
33
Final Report
P:\HONEYWELL -SYR\442636 PHASE II PDI\09 REPORTS\9.7 PHASE II SUMMARY REPORT\APPENDIX D-POREWATER EQUILIBRATION
STUDY\REVISED DRAFT 2008\FINAL EQ STUDY 091808.DOC
SEPTEMBER 24, 2008
34
RECOMMENDATION
Given the preceding discussion, it is recommended that Tuffryn membranes be used in future studies and an equilibrium period of 21 days be used for the lake diffusion samplers. The choice of membrane is based on a number of factors. The most important of which is the exceedingly slow equilibration rates of Cl- and Hg and by extension any non-volatile component through the Teflon. The Teflon membrane is also not as durable as the Tuffryn. Other negative issues associated with the Teflon membrane include the potential formation of bubbles that may not impact VOC concentrations, but would impact the volume of liquid collected. It is true that the required equilibration times for the VOCs were slightly lower for the Teflon studies, but the relatively small difference does not appear to compensate for the issues discussed above.
The recommended equilibration time (21 days) is based mainly on the predicted equilibration times for the lake samplers. The 21 day period is in excess for both Cl- and Hg and by extension other ionic species. The 21 days is longer than all of the required predicted VOC equilibration times (5.2-16 days) with the exception of Naphthalene for site S4C. This value is considered an outlier for a number of reasons. First, the Km for Naphthalene (0.21 cm/day) for Site S4C is essentially less than the average mean VOC Km (0.66) by almost 2 standard deviations. Secondly, the long predicted equilibration time for S4C is also not supported by a comparison of relative diffusion coefficients. Reported diffusion coefficients for VOCs ranged from 1.1 x 10⁻⁶ cm2/s for Benzene to 0.8 x 10⁻⁶ cm2/s for Naphthalene (factor of 1.3), a fairly narrow range. For comparison, the diffusion coefficient for Cl- is reported as 2 x 10⁻⁶ cm2/s. The Km values, and thus the predicted equilibration times, should be proportional to the diffusion coefficients. Toluene, for which the data were very similar between sites, has a diffusion coefficient of 0.95 x 10⁻⁶ cm2/s and an average equilibration time of 7.1 days. This predicted equilibration time (7.1 days) is approximately twice the average predicted equilibrium time for Cl- and is roughly proportional to the difference in diffusion coefficients. As such, Naphthalene, which has a diffusion coefficient only slightly smaller than Toluene, should not have such a disproportional smaller Km value or larger predicted equilibrium time.
Based on the experimental results and the discussion above it is recommended that a correction factor of 1.1 will be sufficient for the VOC data collected from either the first round (PDI Phase I from 2005) or the second round of sampling (PDI Phase II from 2006) to adjust the data for the assumption of 90% equilibrium for those samplers deployed for three weeks or longer.
For Cl- and Hg for both the first round (PDI Phase I from 2005) or the second round of sampling (PDI Phase II from 2006) using the Teflon membrane, a correction factor will be required if the data is to be utilized. There are two potential correction factors which could be used for the samples collected with the Teflon membrane. The first is based on the Hg results for the Teflon membrane. Adjusting for the sampler geometry as described above, the Hg concentration in the lake samplers is predicted to reach 75% of the equilibrium value in 21 days and 85% in 28 days; the equilibrium times of the first

Final Report
P:\HONEYWELL -SYR\442636 PHASE II PDI\09 REPORTS\9.7 PHASE II SUMMARY REPORT\APPENDIX D-POREWATER EQUILIBRATION
STUDY\REVISED DRAFT 2008\FINAL EQ STUDY 091808.DOC
SEPTEMBER 24, 2008
35
orrection factors would equal 2.6 and 2.2 for the first and second round, respectively.
REFERENCES
Parsons Plan. Prepared for Honeywell, Morristown, New Jersey and Syracuse, New York.
Websteironmental Science and
Technology. Vol. 32, No. 11, Pages 1727-1733. 1998.
and second round, respectively. However, as only one experimental set of data was generated for Hg using the Teflon membrane and the slow equilibration rates required the assumption of α = 1, a conservative value could be used based on the Cl- data for the Teflon studies. This analysis predicts that the Hg would reach 38 and 46% of the equilibrium concentration in 21 and 28 days, respectively. In the first case, the correction factor based on Hg would equal 1.2 and 1.3 for the first and second round, respectively. If based on Cl-, the c
, 2006. Onondaga Lake Pre-Design Investigation: Phase II work
r, Ian T., Peter R. Teasdale, and Nicola J. Grigg. Theoretical and Experimental Analysis of Peeper Equilibration Dynamics. Env

Final Report
P:\HONEYWELL -SYR\442636 PHASE II PDI\09 REPORTS\9.7 PHASE II SUMMARY REPORT\APPENDIX D-POREWATER EQUILIBRATION
STUDY\REVISED DRAFT 2008\FINAL EQ STUDY 091808.DOC
SEPTEMBER 24, 2008
36
APPENDIX 1.
Modeling of diffusion sampler equilibration can be quite complex. Factors affecting the equilibration rate include: the diffusion coefficient of the species diffusing, porosity of the sediment, surface area to volume ratio of the sampler, 3D geometry of the sampler, orientation of the sampler, salinity of the sediments, and (in the case of species with non-dissolved reservoirs) the magnitude of the reservoir per volume of sediment and rate of re-supply (e.g. desorption or dissolution). While a 2D or 3D model could be made for this system, the overall usefulness would be questionable given the lack of certainty in many of the above terms. Instead, we have chosen to use a simpler equation with a lumped pseudo-mass transfer coefficient to describe the equilibration of the samplers.
For the membrane evaluation study where the bulk concentration is experimentally kept constant, the equation is an accurate physical model of the system. For chloride and Teflon membranes, the mass transfer coefficient was nearly identical between the sediment studies and membrane evaluation study. This implies that for the studies with Teflon, the membrane is the primary resistance term and controls the rate of equilibration. For the Tuffryn studies, the Km value for Cl- is ~10 X lower in the sediment studies than in the membrane evaluation study. In this case, the membrane is, therefore, not an important term in the overall resistance to equilibrium. However, the lumped mass transfer coefficient is still able to adequately describe the results of the physical system. In other words, the mass transfer coefficient captures, in one lumped term, the major processes controlling the rate of equilibrium.
Regardless of the processes controlling the mass transfer of a given species, it will be proportional to the surface area to volume ratio of the sampler. As the species flux is across a surface area (membrane) into a given volume, the larger the flux area in relation to the receiving volume, the faster must be the equilibration. The F factor is the scaling parameter that adjusts for this impact.
The other significant term in the model, α, is used to determine the value of the equilibrium concentration relative to the measured bulk water concentration. If the true dissolved bulk water concentration could be known, then α should equal 1. The main assumption in this approach is that the measured supernatant concentration represents the truly dissolved VOC concentration. While this is not an unreasonable assumption, it is likely not completely accurate. For species such as Cl- that are considered conserved and should not have any appreciable non-dissolved phase, the centrifuged filtered bulk porewater should be an accurate measure of the dissolved phase concentration, and thus α should equal 1. This is in fact the case (Table 2). However, for VOCs which can have both a significant non-dissolved reservoir and could be subject to sample processing losses, α would not be expected to equal 1. The nature of the processing of the centrifuged bottle samples can distort the sample such that it no longer represents the strictly dissolved phase concentration. Extraction and (pressure) filtration using a syringe could cause some fine particles and droplets of NAPL/DNAPL to penetrate the 0.2 µm syringe filter which may not have done so if diffusion had been the only active transport mechanism. It should be noted that the Onondaga Lake sediments are quite atypical,

Final Report
P:\HONEYWELL -SYR\442636 PHASE II PDI\09 REPORTS\9.7 PHASE II SUMMARY REPORT\APPENDIX D-POREWATER EQUILIBRATION
STUDY\REVISED DRAFT 2008\FINAL EQ STUDY 091808.DOC
SEPTEMBER 24, 2008
37
s of even exceedingly small particles (< 0.2 m).
featuring high particulate and dissolved organic contents, a ubiquitous free phase LNAPL/DNAPL component, and an unusual inorganic particulate composition. As such, what is reported as the measured dissolved supernatant concentration for the VOCs includes both the true dissolved component and potentially any sorbed component on the particulate matter that penetrates the filter, as well as potentially droplets of the NAPL/DNAPL that penetrates the filter. In contrast, the concentration of VOCs in the diffusion sampler is unlikely to be impacted by these effects, and thus represents the true dissolved concentration. As diffusion is the main or only transport process for VOCs into the diffusion samplers, the transport of particulate matter of even very small particles will be small given the slow diffusion constantµ