Embed Size (px)
Citation preview
ONONDAGA LAKESEDIMENT MANAGEMENT FINAL DESIGN
Parsons p:\honeywell -syr\444853 - lake detail design\09 reports\9.22 sediment management final design\110930 submittal\110906 onon lake sed mgmt final.docx September 21, 2011
APPENDIX D
MINERAL PROCESSING SERVICES PHASE IV ADDENDUM 6 SUMMARY REPORT
MINERAL PROCESSING SERVICES, LLC
Onondaga Lake Pre‐Design Investigation Geotextile Dewatering Structure
Geotube® Bench Scale Testing Summary Report
James E Meagher
1/22/2010
Prepared for PARSONS, 301 Plainfield Road, Suite 350, Syracuse, NY 13212. Prepared by Mineral Processing Services LLC, 50 Market Street, South Portland, ME 04106, Phone: (207) 741-2955 Fax: (207) 799-3782.
Onondaga Lake Pre‐Design Investigation Geotextile Dewatering Structure Geotube® 2 Bench Scale Testing Summary Report
Table of Contents
List of Appendices..........................................................................................................................................................ii
List of Tables ................................................................................................................................................................. iii
Executive Summary .......................................................................................................................................................1
Geotube® Geotextile Dewatering Structure Bench‐Scale Testing Report.....................................................................1
1.0 Introduction........................................................................................................................................................................... 1
2.0 Objectives .............................................................................................................................................................................. 1
3.0 Sample Handling.................................................................................................................................................................... 2
RDT Testing Sample Handling ......................................................................................................................................................................... 2
P‐GDT Testing Sample Handling ..................................................................................................................................................................... 2
4.0 Sample Testing Matrix ........................................................................................................................................................... 4
Testing Goals .................................................................................................................................................................................................. 4
Methods ......................................................................................................................................................................................................... 4
Evaluation....................................................................................................................................................................................................... 4
5.0 RDT Rapid Drainage Test ....................................................................................................................................................... 5
RDT Test Results ............................................................................................................................................................................................. 5
Chemical Program Screening.......................................................................................................................................................................... 5
Observations .................................................................................................................................................................................................. 6
RDT Testing and Screening Summary ............................................................................................................................................................. 6
6.0 Pressure‐Gravity Dewatering Test (P‐GDT)............................................................................................................................ 7
Assumptions ................................................................................................................................................................................................... 8
P‐GDT Log Mass Calculations Methods .......................................................................................................................................................... 8
P‐GDT Testing ................................................................................................................................................................................................. 8
P‐GDT Test Results ......................................................................................................................................................................................... 9
P‐GDT Testing Summary ............................................................................................................................................................................... 10
7.0 Polymer Make Up Using Filtrate Testing .............................................................................................................................. 10
Objective ...................................................................................................................................................................................................... 10
Test Method ................................................................................................................................................................................................. 10
Observations ................................................................................................................................................................................................ 11
Summary......................................................................................................................................................................12
Onondaga Lake Pre‐Design Investigation Geotextile Dewatering Structure Geotube® ii Bench Scale Testing Summary Report
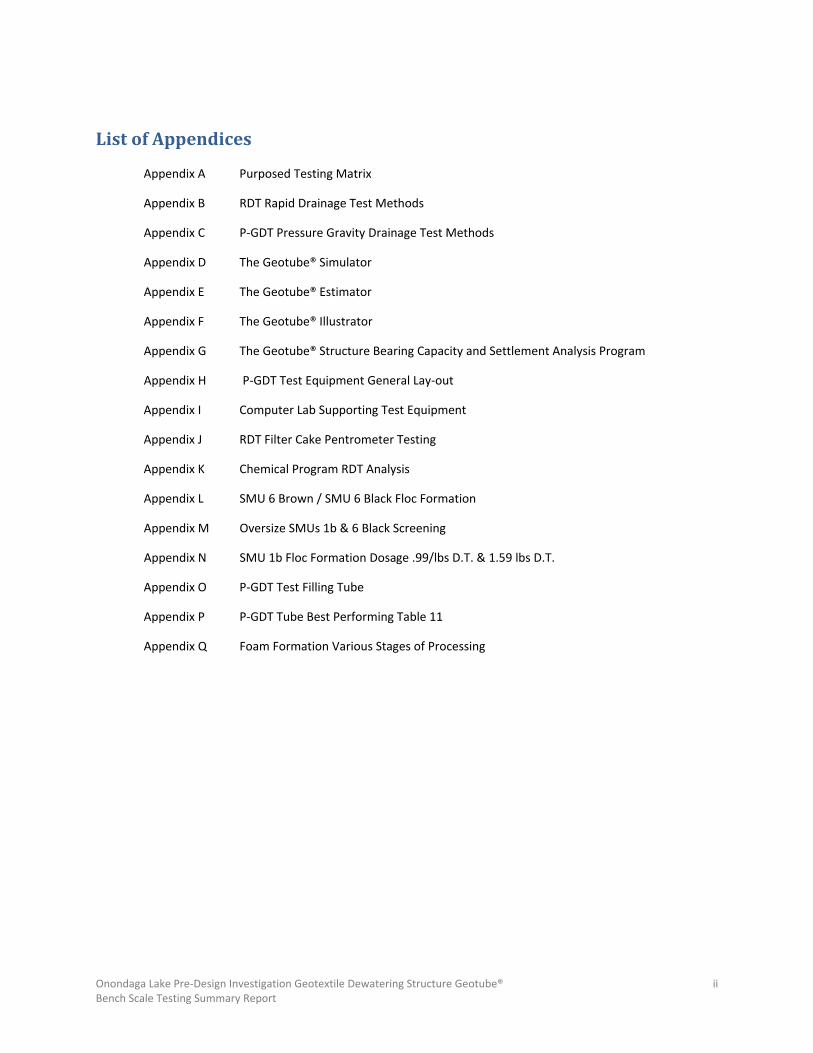
List of Appendices
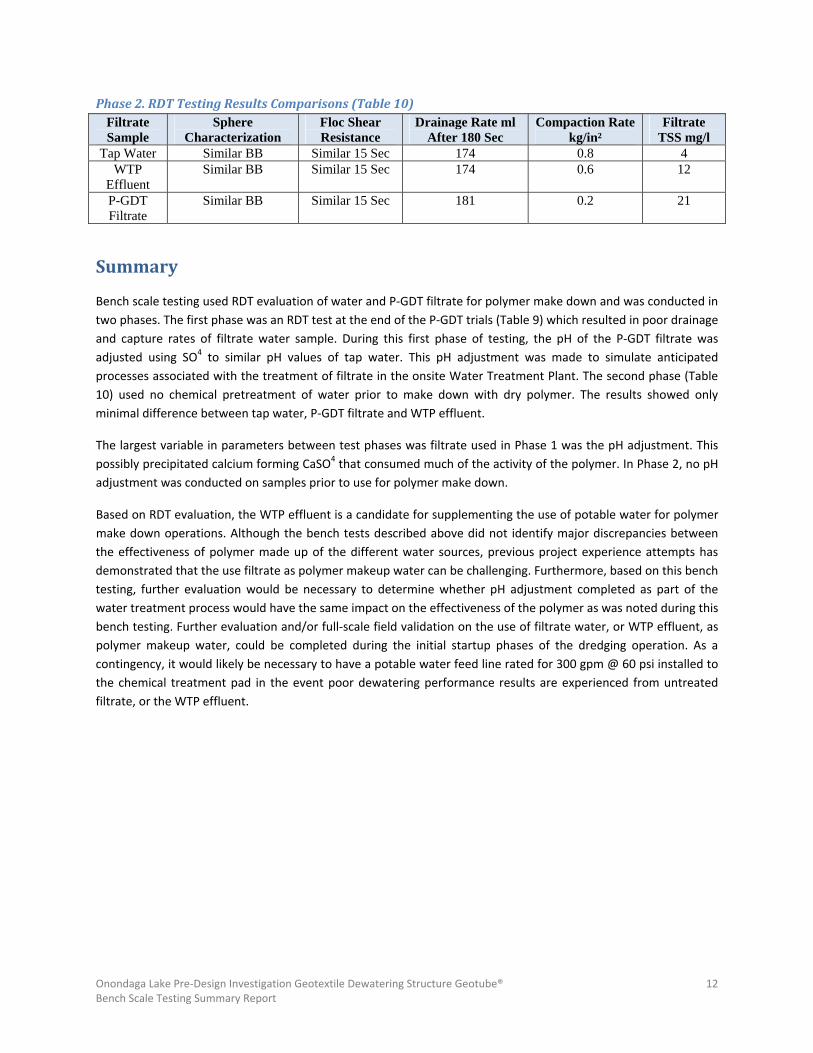
Appendix A Purposed Testing Matrix
Appendix B RDT Rapid Drainage Test Methods
Appendix C P‐GDT Pressure Gravity Drainage Test Methods
Appendix D The Geotube® Simulator
Appendix E The Geotube® Estimator
Appendix F The Geotube® Illustrator
Appendix G The Geotube® Structure Bearing Capacity and Settlement Analysis Program
Appendix H P‐GDT Test Equipment General Lay‐out
Appendix I Computer Lab Supporting Test Equipment
Appendix J RDT Filter Cake Pentrometer Testing
Appendix K Chemical Program RDT Analysis
Appendix L SMU 6 Brown / SMU 6 Black Floc Formation
Appendix M Oversize SMUs 1b & 6 Black Screening
Appendix N SMU 1b Floc Formation Dosage .99/lbs D.T. & 1.59 lbs D.T.
Appendix O P‐GDT Test Filling Tube
Appendix P P‐GDT Tube Best Performing Table 11
Appendix Q Foam Formation Various Stages of Processing
Onondaga Lake Pre‐Design Investigation Geotextile Dewatering Structure Geotube® iii Bench Scale Testing Summary Report
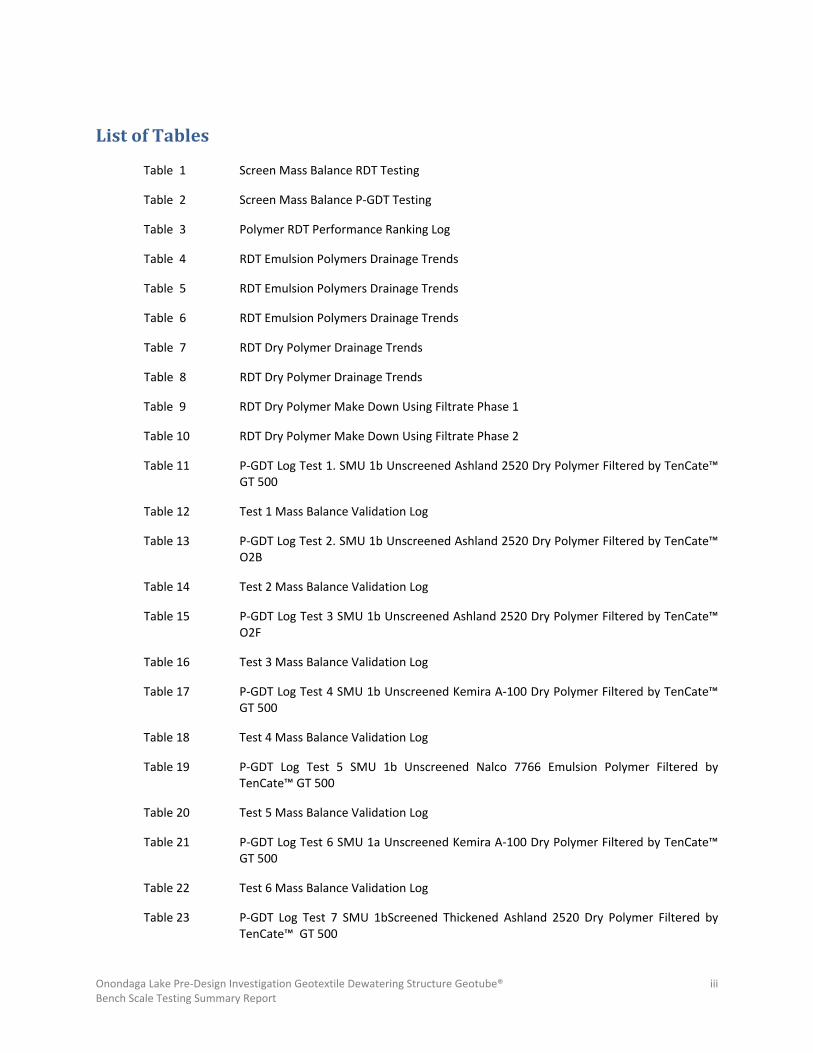
List of Tables
Table 1 Screen Mass Balance RDT Testing
Table 2 Screen Mass Balance P‐GDT Testing
Table 3 Polymer RDT Performance Ranking Log
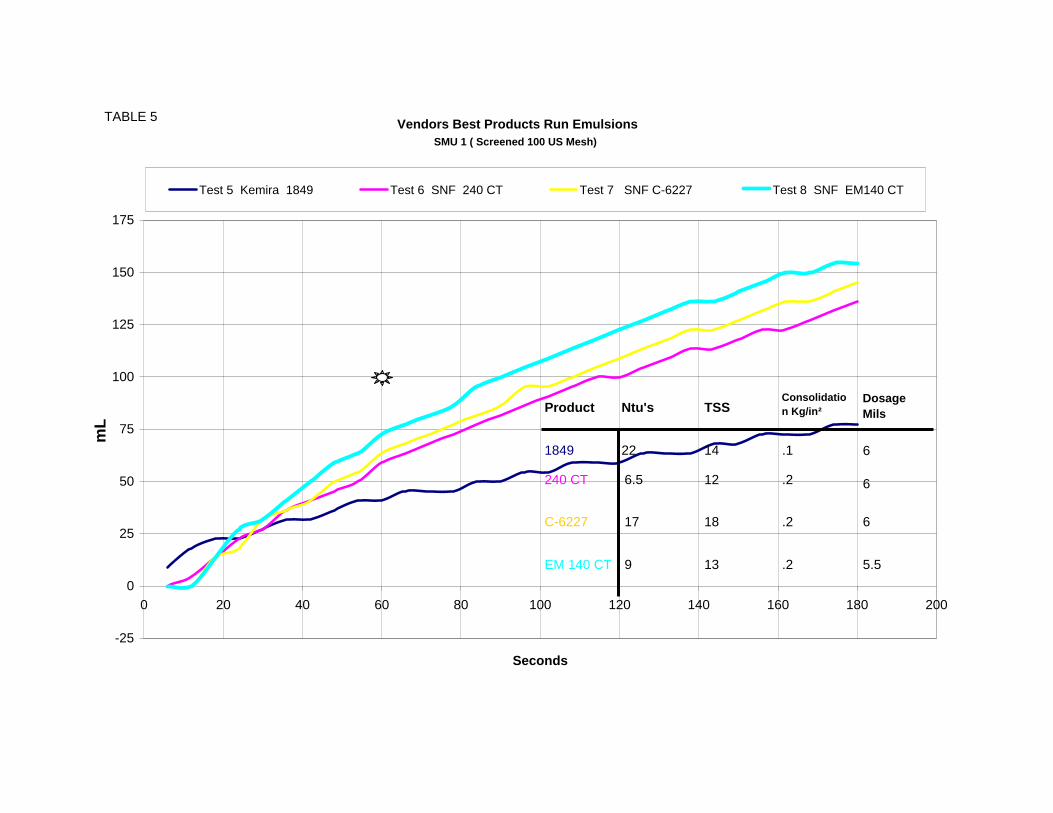
Table 4 RDT Emulsion Polymers Drainage Trends
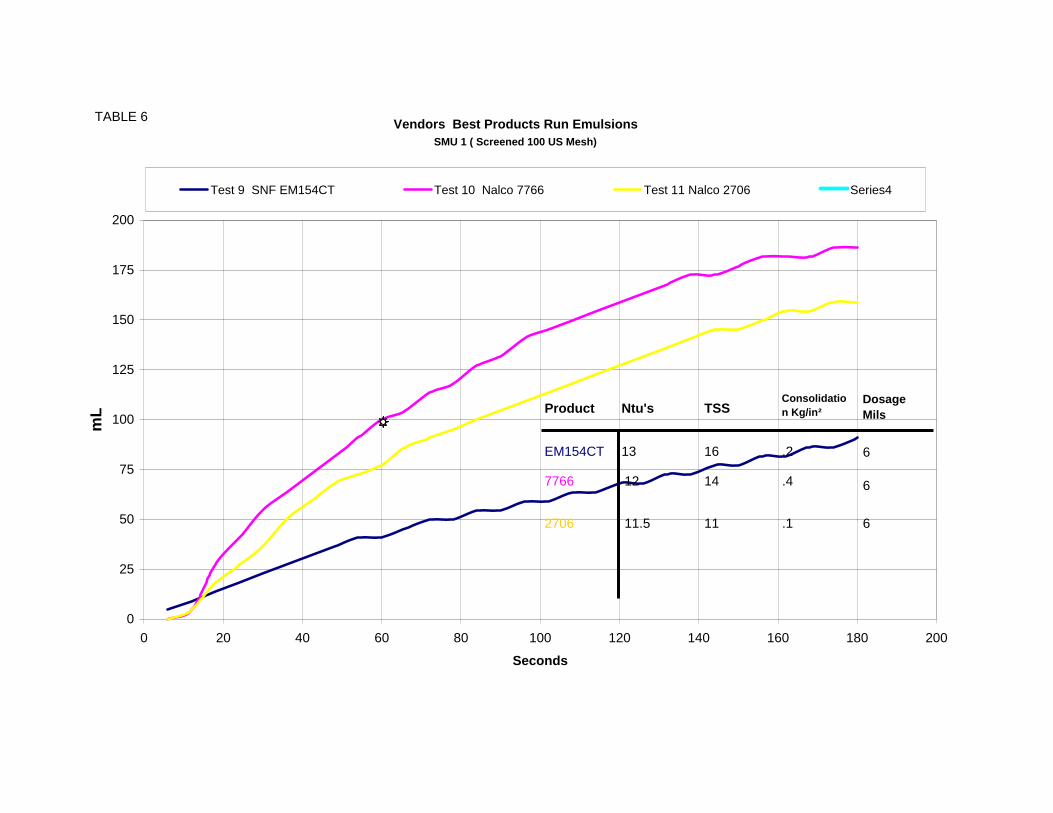
Table 5 RDT Emulsion Polymers Drainage Trends
Table 6 RDT Emulsion Polymers Drainage Trends
Table 7 RDT Dry Polymer Drainage Trends
Table 8 RDT Dry Polymer Drainage Trends
Table 9 RDT Dry Polymer Make Down Using Filtrate Phase 1
Table 10 RDT Dry Polymer Make Down Using Filtrate Phase 2
Table 11 P‐GDT Log Test 1. SMU 1b Unscreened Ashland 2520 Dry Polymer Filtered by TenCate™ GT 500
Table 12 Test 1 Mass Balance Validation Log
Table 13 P‐GDT Log Test 2. SMU 1b Unscreened Ashland 2520 Dry Polymer Filtered by TenCate™ O2B
Table 14 Test 2 Mass Balance Validation Log
Table 15 P‐GDT Log Test 3 SMU 1b Unscreened Ashland 2520 Dry Polymer Filtered by TenCate™ O2F
Table 16 Test 3 Mass Balance Validation Log
Table 17 P‐GDT Log Test 4 SMU 1b Unscreened Kemira A‐100 Dry Polymer Filtered by TenCate™ GT 500
Table 18 Test 4 Mass Balance Validation Log
Table 19 P‐GDT Log Test 5 SMU 1b Unscreened Nalco 7766 Emulsion Polymer Filtered by TenCate™ GT 500
Table 20 Test 5 Mass Balance Validation Log
Table 21 P‐GDT Log Test 6 SMU 1a Unscreened Kemira A‐100 Dry Polymer Filtered by TenCate™ GT 500
Table 22 Test 6 Mass Balance Validation Log
Table 23 P‐GDT Log Test 7 SMU 1bScreened Thickened Ashland 2520 Dry Polymer Filtered by TenCate™ GT 500
Onondaga Lake Pre‐Design Investigation Geotextile Dewatering Structure Geotube® iv Bench Scale Testing Summary Report
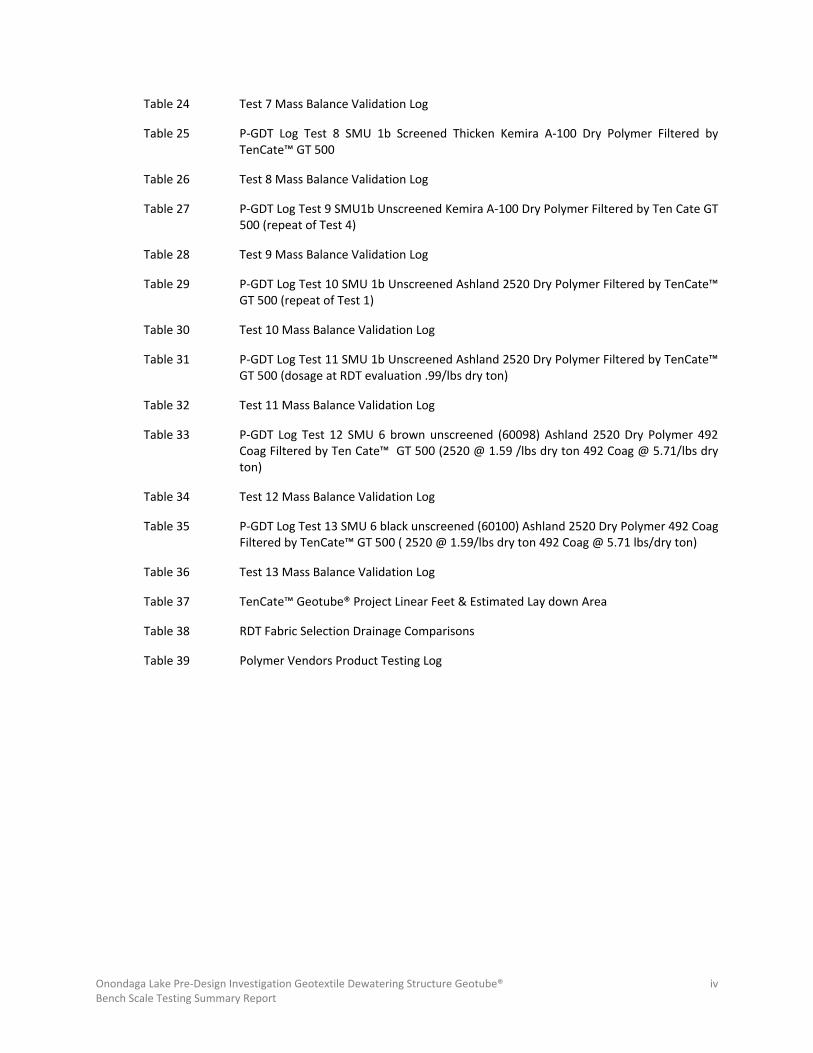
Table 24 Test 7 Mass Balance Validation Log
Table 25 P‐GDT Log Test 8 SMU 1b Screened Thicken Kemira A‐100 Dry Polymer Filtered by TenCate™ GT 500
Table 26 Test 8 Mass Balance Validation Log
Table 27 P‐GDT Log Test 9 SMU1b Unscreened Kemira A‐100 Dry Polymer Filtered by Ten Cate GT 500 (repeat of Test 4)
Table 28 Test 9 Mass Balance Validation Log
Table 29 P‐GDT Log Test 10 SMU 1b Unscreened Ashland 2520 Dry Polymer Filtered by TenCate™ GT 500 (repeat of Test 1)
Table 30 Test 10 Mass Balance Validation Log
Table 31 P‐GDT Log Test 11 SMU 1b Unscreened Ashland 2520 Dry Polymer Filtered by TenCate™ GT 500 (dosage at RDT evaluation .99/lbs dry ton)
Table 32 Test 11 Mass Balance Validation Log
Table 33 P‐GDT Log Test 12 SMU 6 brown unscreened (60098) Ashland 2520 Dry Polymer 492 Coag Filtered by Ten Cate™ GT 500 (2520 @ 1.59 /lbs dry ton 492 Coag @ 5.71/lbs dry ton)
Table 34 Test 12 Mass Balance Validation Log
Table 35 P‐GDT Log Test 13 SMU 6 black unscreened (60100) Ashland 2520 Dry Polymer 492 Coag Filtered by TenCate™ GT 500 ( 2520 @ 1.59/lbs dry ton 492 Coag @ 5.71 lbs/dry ton)
Table 36 Test 13 Mass Balance Validation Log
Table 37 TenCate™ Geotube® Project Linear Feet & Estimated Lay down Area
Table 38 RDT Fabric Selection Drainage Comparisons
Table 39 Polymer Vendors Product Testing Log
Onondaga Lake Pre‐Design Investigation Geotextile Dewatering Structure Geotube® 1 Bench Scale Testing Summary Report
Executive Summary
Mineral Processing Services, LLC conducted application testing of TenCate™ Geotube® dewatering structures and chemical program evaluations to ascertain best dewatering performance combinations of fabric design and polymers for sediments from Onondaga Lake Sediment Management Units (SMUs) 1a, 1b and 6.
The results of the tests indicated that TenCate™ GT 500 filter cloth design combined with a dry polymer program provided by Ashland Chemical and Kemira Chemical offers the best performance for dewaterability. The processing programs are compatible with sediments from SMU 1a, 1b and 6 using a similar range of polymer dosage rates. SMU 6 required post addition of a coagulant to achieve similar filtrate capture rates within the Geotube® dewatering structure as SMU 1a and SMU 1b.
The characteristics of the SMU 1a and 1b sediments, and corresponding dredge slurry, are similar to mining slurry applications, where the filter cloth selection has been used successfully in many applications.
The SMU 6 slurry characteristic is similar to marine sediments with high biological content, in which the fabric selection has extensive applications.
Overall, the testing demonstrated soundness of the processing program and its application on sediment samples provided. Specific recommendations pertaining to the fabric design of the Geotube® containers, and the type and dosage of the polymer, can be incorporated into the Remedial Design.
Geotube® Geotextile Dewatering Structure BenchScale Testing Report
1.0 Introduction
The Rapid Dewatering Test (RDT) and the Pressure‐Gravity Dewatering Test (P‐GDT) were developed by TenCate and Mineral Processing Services LLC, respectively. RDT evaluates proper chemical agents and dosage for sediment conditioning. P‐GDT validates full‐scale application of the chemical program, sediment dewatering rate, filter cake dryness and filtrate parameters. RDT testing has been TenCate’s standard for chemical program evaluation since 2005. P‐GDT testing was developed in 2006 to augment RDT results. MPS has used RDT and P‐GDT test results to support more than 20 projects, including mining, sediment dredging, water and wastewater treatment sludge. A detailed description of RDT and P‐GDT, including descriptions of the process steps, are provided in Appendices B and C.
Application of the RDT and P‐GDT testing to Onondaga Lake samples was described in the New York State Department of Environmental Conservation (NYSDEC) approved Onondaga Lake Pre‐Design investigation Phase IV– Addendum 6 Workplan (Parsons, 2009). The purpose of this report is to provide results of bench scale evaluation for application of geotextile dewatering structures using a polymer conditioning program. This report details the chemical program selection process, geotextile fabric evaluation process and process mass balance for geotextile dewatering structures design.
2.0 Objectives
The specific objectives for the bench scale testing completed as part of this investigation includes testing and identifying best‐performing chemical agents and filtration fabrics associated with a full‐scale Geotube® dewatering operation. More specifically, the testing described in this report was designed to accomplish the following:
Onondaga Lake Pre‐Design Investigation Geotextile Dewatering Structure Geotube® 2 Bench Scale Testing Summary Report
• Evaluate commercially available polymer programs using RDT (Rapid Dewatering Test) on sediment samples from SMUs 1 and 6.
• Evaluate Geotube® fabric design for compatibility with sediment samples from Onondaga Lake, and with polymer programs identified as best performing.
• Filtration evaluation of polymer programs and filter fabric design for thickened and non‐thickened slurry, and screened (removing particle sizes greater than 100 US Mesh) and unscreened (removing particle sizes greater than 20 US Mesh) to allow samples to pass through P‐GDT test stand meters.
• Provide estimate of Geotube® filtration area based on test results for project anticipated dredge yd³ screened and non‐screened options.
3.0 Sample Handling
Slurry preparation and bench‐scale testing were performed by Mineral Processing Services, LLC (MPS) at its facility in South Portland, ME for RDT chemical program evaluation, and at Honeywell’s Ground Water Treatment plant (WTP) on Willis Avenue in Syracuse, NY for bench scale filtration evaluation testing via P‐GDT.
RDT Testing Sample Handling
Conducted at MPS Facility Location
Samples were shipped by Parson to MPS’s South Portland, ME facility for an evaluation of commercially available polymer programs. SMU sediment samples were received in 5‐gallon buckets from SMU 1b (location OL‐STA‐10118), SMU 1a (location OL‐STA‐10114); and SMU 6 (locations OL‐STA‐60098 and 60100). Additionally, water from Onondaga Lake was received to prepare slurries to the estimated dredge percent solids. Lake water was shipped in 55‐gallon drums from Lake Onondaga, marked as “background water.”
Samples from SMU 1a and 1b were a grayish‐white color that exhibited slight hydrocarbon naphthalene odor characterization during mixing. Samples were mixed with blender with a tip speed of 600 rpm for duration of 15 minutes. As footnote on Table 1 indicates, samples averaged 41.5 percent dry solids pre‐screening and 36.1 percent dry solids after screening with a 100 US Mesh screen. A 100 US Mesh screen was determined to be the most efficient screen size for this type of slurry. The SMU 1 samples had a wet weight reduction of 28.6 percent after screening at 100 US Mesh and exhibited light grey color with hydrocarbon smell.
The sample from SMU 6 was brown in color and exhibited slight organic septic odor during mixing. Sample was mixed with blender with a tip speed of 600 rpm for duration of 15 minutes. Sample measured 55.1 percent dry solids pre‐screening and 35.1 percent dry solids after 100 US Mesh screening. Screening of the SMU 6 sample resulted in a 34 percent reduction in the wet weight.
Table 1 Volume Relationship Screened Particles RDT Test
PGDT Testing Sample Handling
Conducted at Honeywell Ground Water Treatment Facility
SMU 1 and SMU 6 samples were delivered to Honeywell’s Willis Avenue WTP location for P‐GDT evaluation. Samples were received in 55‐gallon drums and/or 5‐gallon pails. Samples were mixed using a twin‐prop shear mixer that extended the full length of the drum. Sample drums from SMU 1b required mechanical excavation using steel bar and shovel to create a 6‐inch‐diamenter hole through the settled solids, under the water cap, allowing installation of mixer shaft.
Onondaga Lake Pre‐Design Investigation Geotextile Dewatering Structure Geotube® 3 Bench Scale Testing Summary Report
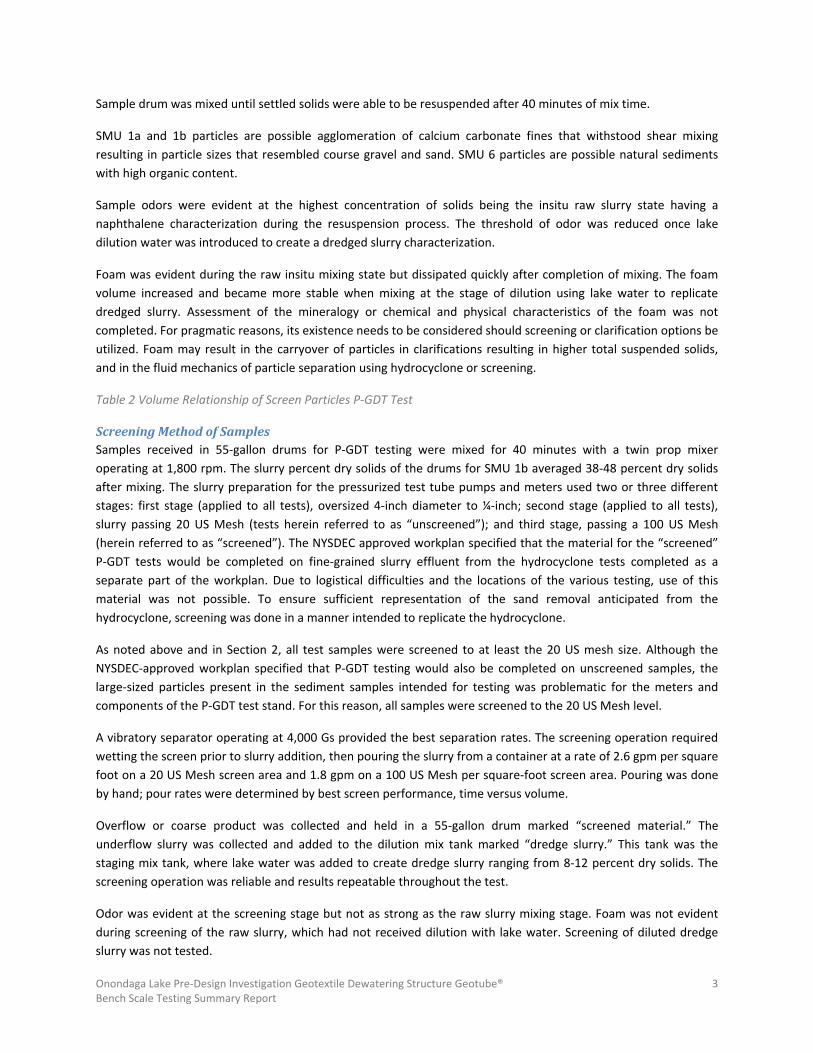
Sample drum was mixed until settled solids were able to be resuspended after 40 minutes of mix time.
SMU 1a and 1b particles are possible agglomeration of calcium carbonate fines that withstood shear mixing resulting in particle sizes that resembled course gravel and sand. SMU 6 particles are possible natural sediments with high organic content.
Sample odors were evident at the highest concentration of solids being the insitu raw slurry state having a naphthalene characterization during the resuspension process. The threshold of odor was reduced once lake dilution water was introduced to create a dredged slurry characterization.
Foam was evident during the raw insitu mixing state but dissipated quickly after completion of mixing. The foam volume increased and became more stable when mixing at the stage of dilution using lake water to replicate dredged slurry. Assessment of the mineralogy or chemical and physical characteristics of the foam was not completed. For pragmatic reasons, its existence needs to be considered should screening or clarification options be utilized. Foam may result in the carryover of particles in clarifications resulting in higher total suspended solids, and in the fluid mechanics of particle separation using hydrocyclone or screening.
Table 2 Volume Relationship of Screen Particles P‐GDT Test
Screening Method of Samples Samples received in 55‐gallon drums for P‐GDT testing were mixed for 40 minutes with a twin prop mixer operating at 1,800 rpm. The slurry percent dry solids of the drums for SMU 1b averaged 38‐48 percent dry solids after mixing. The slurry preparation for the pressurized test tube pumps and meters used two or three different stages: first stage (applied to all tests), oversized 4‐inch diameter to ¼‐inch; second stage (applied to all tests), slurry passing 20 US Mesh (tests herein referred to as “unscreened”); and third stage, passing a 100 US Mesh (herein referred to as “screened”). The NYSDEC approved workplan specified that the material for the “screened” P‐GDT tests would be completed on fine‐grained slurry effluent from the hydrocyclone tests completed as a separate part of the workplan. Due to logistical difficulties and the locations of the various testing, use of this material was not possible. To ensure sufficient representation of the sand removal anticipated from the hydrocyclone, screening was done in a manner intended to replicate the hydrocyclone.
As noted above and in Section 2, all test samples were screened to at least the 20 US mesh size. Although the NYSDEC‐approved workplan specified that P‐GDT testing would also be completed on unscreened samples, the large‐sized particles present in the sediment samples intended for testing was problematic for the meters and components of the P‐GDT test stand. For this reason, all samples were screened to the 20 US Mesh level.
A vibratory separator operating at 4,000 Gs provided the best separation rates. The screening operation required wetting the screen prior to slurry addition, then pouring the slurry from a container at a rate of 2.6 gpm per square foot on a 20 US Mesh screen area and 1.8 gpm on a 100 US Mesh per square‐foot screen area. Pouring was done by hand; pour rates were determined by best screen performance, time versus volume.
Overflow or coarse product was collected and held in a 55‐gallon drum marked “screened material.” The underflow slurry was collected and added to the dilution mix tank marked “dredge slurry.” This tank was the staging mix tank, where lake water was added to create dredge slurry ranging from 8‐12 percent dry solids. The screening operation was reliable and results repeatable throughout the test.
Odor was evident at the screening stage but not as strong as the raw slurry mixing stage. Foam was not evident during screening of the raw slurry, which had not received dilution with lake water. Screening of diluted dredge slurry was not tested.
Onondaga Lake Pre‐Design Investigation Geotextile Dewatering Structure Geotube® 4 Bench Scale Testing Summary Report
4.0 Sample Testing Matrix
Appendix A provides a testing matrix that shows the interaction of test methods submitted prior to commencement of testing. Tables are provided with the results of each test method listed in the testing matrix.
Testing Goals
The use of geotextile structures requires application testing, which determines limits of structure design, fabric filtration rates “units required”, dewatered “solid phase” and filtrate “water phase” characteristics. This data will support the design team in its evaluation of technology performance and its design relationship with dredging, slurry processing, geotextile structures selection and water treatment.
Methods
Testing methods of the activities included in this investigation are designed to analyze the effect of several contributing factors in a geotextile dewatering structure application. In preparation of bench testing, slurry samples are prepared to simulate the slurry feed from dredge operations. Chemical conditioning is required to facilitate water and solids destabilization and flocculation to facilitate dewatering. Chemical program testing examines the flocculation particle best suited for geotextile applications in regard to shear and consolidation.
Geotextile fabric evaluation is based on filtration rate, retention of colloidal solids and geotextile fabric characteristic for tube structure design. Full‐scale simulation applies hydraulic shear forces to chemical program, examining colloid stability and solids capture rate evaluated by total suspended solids (TSS) values of the filtrate released through the fabric under full‐scale design operating pressure. The results provide data on solids consolidation rates within a known filtration area to determine estimated geotextile dewatering structure consumption per dry ton of solids processed.
Evaluation
The objectives for evaluation will employ the following means:
• Sample preparation for non‐thicken dredging will use dilution of sample to 12 percent dry solids with no screening or thickening conducted in P‐GDT tests 1 through 6.
• Sample preparation for thickening will utilized vibratory screens removing greater than 100 US Mesh and thickening to 26 percent dry solids with chemical conditioning with in‐cone thickener.
• Chemical conditioning program will utilize Rapid Dewatering Test (RDT) methods for evaluation. See Appendix B for method details.
• Geotextile filter cloth application will utilize RDT methods where the chemical conditioning program is a constant and filter cloth selection is a variable.
• Full‐scale simulation testing of chemical program and filter cloth selection will utilize Pressure‐Gravity Dewatering Test (P‐GDT) methods for evaluation.
• Test report will submit raw data with discussions for each test method with a statistical conclusion on technology design parameters.
Onondaga Lake Pre‐Design Investigation Geotextile Dewatering Structure Geotube® 5 Bench Scale Testing Summary Report
5.0 RDT Rapid Drainage Test
The Rapid Dewatering Test (RDT), outlined in Appendix B, was developed to evaluate chemical program requirements for water‐solids separation. The test allows evaluation of 250 ml samples with various conditioning programs.
The evaluation uses gravity drainage of a known quantity of sediment, over 180 seconds. The drainage rate is evaluated using volume over time, monitored every 3 seconds using RDT software that plots results for comparisons. The drainage graph comparisons provide rates of drainage and total volume of filtrate.
Additional data produced from the RDT test includes filtrate quality (TSS) and turbidity (NTUs). Filter‐cake compaction is also measured using a penetrometer recorded as kg/in², referred to as “consolidation” in the P‐GDT test log. These tests provide the starting point for chemical program comparisons.
RDT Test Results
The test program utilized slurry created with sediment samples from SMU 1 and SMU 6, screened to 100 US Mesh prior to testing. For this phase of testing, samples from SMU 1a and 2b were mixted together, and tests were conducted on the mixed SMU 1 sample. Several chemical manufactures products were evaluated, usingtest kits that are provided by manufacturers. A list of manufactures and test kits used during testing is provided on Table 39. Several evaluation factors were considered when assessing the results of the various chemical products. Desirable performance characteristics of the chemical program include:
• Production of flocculants described as a “BB” or “small sphere,” 6‐4 mm in diameter. Flocculants with these characteristics typically result in the best dewatering performance, as it typically provides optimum free‐water transport (drainage) with lowest moisture absorption (retention) in the filter cake.
• Resistance to shear resulting from hydraulic transport in piping and valves is evaluated using a mixer station speed setting and duration based on 6‐7 velocity feet per second at 15 seconds.
• Ability to maintain drainage and capture rate with exposure to pH range of 8.2 – 10.8.
• Ability to retain sufficient surface charge potential to maintain flocculation characterization in salinity application of 1.7‐4.3 ppt (parts per thousand).
• Comparable performance for sediments from SMUs 1 and 6.
• Chemical program dosage range has a “window of dewaterability” if operating 20 percent out of its target dosage rate.
MPS screened the manufacturers’ products to evaluate what chemical program best meets the described goals of the RDT test method. Polymer manufactures were invited to participate in the evaluations of their respective products. Several of the vendors came to MPS’s facility to participate in the optimization of their products. Tables 4 through 8 detail the results of RDT testing.
The subsections below outline the steps taken during the RDT testing, and key observations from the testing conducted.
Chemical Program Screening
• Sample aliquots of 250 ml slurry using lake water and insitu samples were created to 8‐12 percent dry solids, representing the anticipated dredge slurry.
• Anionic and cationic emulsions were made down to 0.5 percent dilutions.
Onondaga Lake Pre‐Design Investigation Geotextile Dewatering Structure Geotube® 6 Bench Scale Testing Summary Report
• Anionic and cationic dries were made down to 0.2 percent dilutions.
• Dilutions were aged after preparation for one hour before testing.
• Polymers were selected based on their background for treating carbonate mine slurry applications with high pH, and sediment dewatering for marine applications due to the salinity levels.
• Polymers were jar tested using a Kost and Sons paddle mixer to generate slurry velocity of 6‐7 fps to establish desired flocculation structure at 15 seconds on dries and 10 seconds on emulsions.
• Products and dose rates were evaluated first by the ability to create flocculation characterization of a “BB”‐size sphere with clear filtrate.
• Products meeting the first criteria were then applied to the RDT for drainage and capture‐rate testing.
• Products were then ranked using RDT software that correlated drainage rates.
• One of the two dry‐chemical programs selected was then tested on four filter fabric designs manufactured by TenCate™. The test results shown in Table 38 indicate that fabrics 02B and 02F had higher drainage rates than GT 500, with similar capture rates when gravity drainage tested.
Observations
• Cationic and anionic polymers show the slurry could be flocculated prior to RDT testing.
• Emulsion polymers tested showed that the flocculated sphere broke down when exposed to the higher pH and salinity slurry during shear mixing phase of testing.
• An emulsion polymer with a cationic charge provided the best overall results for the cationic emulsion products tested at 2.98 lbs/dry ton.
• Dry polymers with anionic charge provided the best overall results for dry products tested at .99 lbs/dry ton dosage.
• Best performing polymer programs were anionic dries, being low‐charge, high‐molecular‐weight polyacrylamide formulations.
• Shear benchmarked at 6‐7 fps for 15 seconds showed anionic dries ranked 1 and 2 as having the highest shear resistance.
• Products with the highest resistance to flocculated sphere deterioration resulting from high pH and salinity was anionic dries ranked 1 and 2, found in Table 3.
• Sample testing of SMU 1and SMU 6 showed similar drainage rate, with capture rates slightly lower for SMU 6 sample, indicating a coagulant program in addition to the flocculent may be required should results from P‐GDT testing prove poorer capture rates on SMU 6 sample.
• RDT samples with same percent dry solids showed variability in drainage rates based on the relationship of pH, salinity and conductivity. This was most interesting as with large sediment projects, flow and percent dry solids have the largest upper and lower limits of values. But with the SMU slurries, it is expected that pH, salinity and conductivity will share these large ranges of values.
• RDT drainage rates trends have a benchmark, at X axis 60 seconds and Y axis 100 ml, to assist in evaluation comparisons.
RDT Testing and Screening Summary
The RDT test method is the first step in selection of chemical program and fabric design.
Results showed SMUs 1and 6 are successful applications for Geotube® containment dewatering structures when using the selected anionic dries polymer chemical programs.
Onondaga Lake Pre‐Design Investigation Geotextile Dewatering Structure Geotube® 7 Bench Scale Testing Summary Report
The drainage characteristics of sediment from SMU 1 is much like mining ore slurries, having moderate but consistent water release due to the high percentage of particle fines of equal size. The drainage characteristics of sediment from SMU 6 was similar to marine sediment, having organic matter resulting in higher drainage rate than sediment from SMU 1.
The RDT testing program resulted in three out of six chemical manufacturers having products that would advance to the P‐GDT testing program. These products are ranked in Table 3, showing anionic dry products as best selected chemical program with a dosage rate of .99 lbs/dry ton with filtrate total suspended solids (TSS) < 20 mg/l and filter cake compaction of .8 kg/in².
Screening requirements for the evaluation was to remove oversized particles down to 20 US Mesh and 100 US Mesh to generate comparable slurries from hydrocyclone operation. Screening preparation of the samples was not intended to be an evaluation of particle classification technologies. The vibratory screen method used in sample preparation was efficient in removing oversized particle with repeatable results. A volumetric mass balance estimate of values retained on 100 US Mesh of the SMU 1 and 6 samples received for testing is shown in Tables 1 and 2.
6.0 PressureGravity Dewatering Test (PGDT)
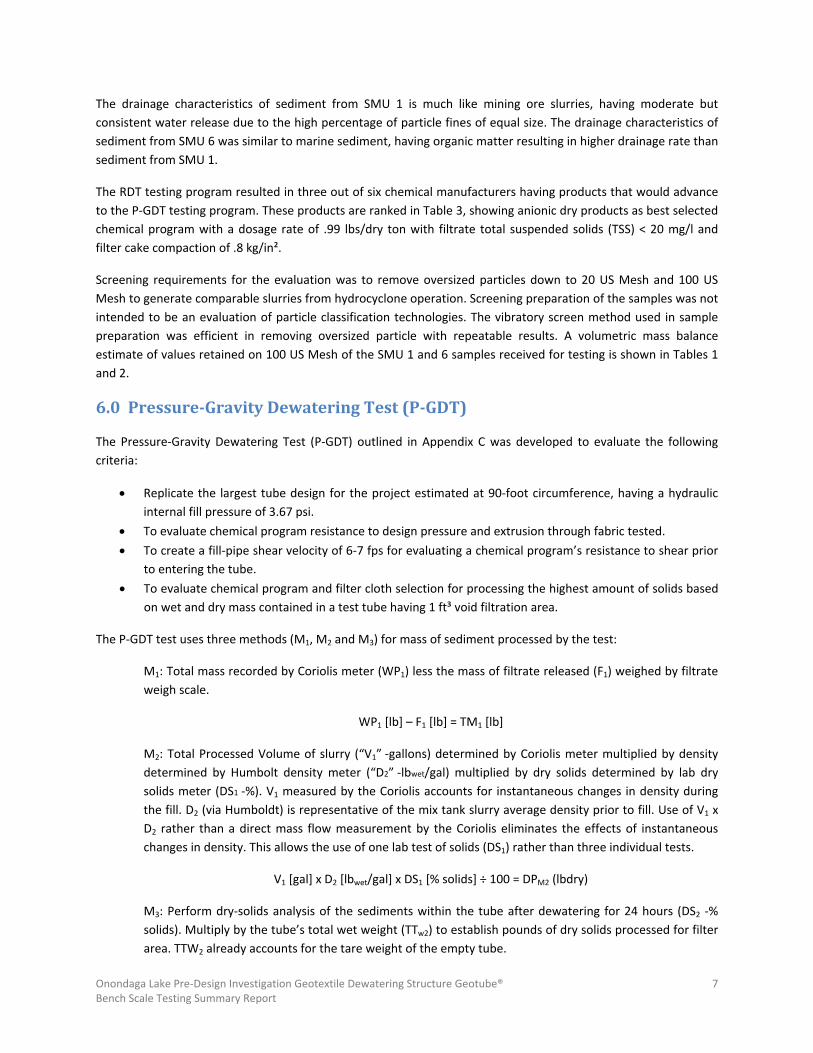
The Pressure‐Gravity Dewatering Test (P‐GDT) outlined in Appendix C was developed to evaluate the following criteria:
• Replicate the largest tube design for the project estimated at 90‐foot circumference, having a hydraulic internal fill pressure of 3.67 psi.
• To evaluate chemical program resistance to design pressure and extrusion through fabric tested.
• To create a fill‐pipe shear velocity of 6‐7 fps for evaluating a chemical program’s resistance to shear prior to entering the tube.
• To evaluate chemical program and filter cloth selection for processing the highest amount of solids based on wet and dry mass contained in a test tube having 1 ft³ void filtration area.
The P‐GDT test uses three methods (M1, M2 and M3) for mass of sediment processed by the test:
M1: Total mass recorded by Coriolis meter (WP1) less the mass of filtrate released (F1) weighed by filtrate weigh scale.
WP1 [lb] – F1 [lb] = TM1 [lb]
M2: Total Processed Volume of slurry (“V1” ‐gallons) determined by Coriolis meter multiplied by density determined by Humbolt density meter (“D2” ‐lbwet/gal) multiplied by dry solids determined by lab dry solids meter (DS1 ‐%). V1 measured by the Coriolis accounts for instantaneous changes in density during the fill. D2 (via Humboldt) is representative of the mix tank slurry average density prior to fill. Use of V1 x D2 rather than a direct mass flow measurement by the Coriolis eliminates the effects of instantaneous changes in density. This allows the use of one lab test of solids (DS1) rather than three individual tests.
V1 [gal] x D2 [lbwet/gal] x DS1 [% solids] ÷ 100 = DPM2 (lbdry)
M3: Perform dry‐solids analysis of the sediments within the tube after dewatering for 24 hours (DS2 ‐% solids). Multiply by the tube’s total wet weight (TTw2) to establish pounds of dry solids processed for filter area. TTW2 already accounts for the tare weight of the empty tube.
Onondaga Lake Pre‐Design Investigation Geotextile Dewatering Structure Geotube® 8 Bench Scale Testing Summary Report
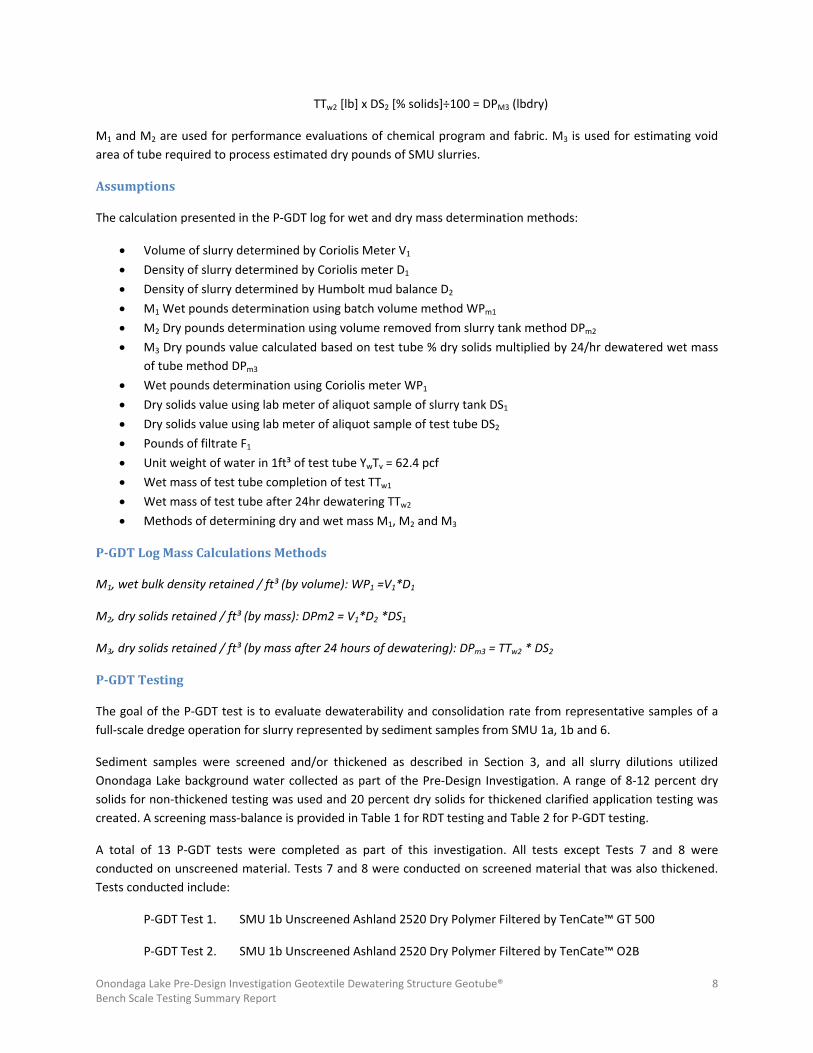
TTw2 [lb] x DS2 [% solids]÷100 = DPM3 (lbdry)
M1 and M2 are used for performance evaluations of chemical program and fabric. M3 is used for estimating void area of tube required to process estimated dry pounds of SMU slurries.
Assumptions
The calculation presented in the P‐GDT log for wet and dry mass determination methods:
• Volume of slurry determined by Coriolis Meter V1
• Density of slurry determined by Coriolis meter D1
• Density of slurry determined by Humbolt mud balance D2
• M1 Wet pounds determination using batch volume method WPm1
• M2 Dry pounds determination using volume removed from slurry tank method DPm2
• M3 Dry pounds value calculated based on test tube % dry solids multiplied by 24/hr dewatered wet mass of tube method DPm3
• Wet pounds determination using Coriolis meter WP1
• Dry solids value using lab meter of aliquot sample of slurry tank DS1
• Dry solids value using lab meter of aliquot sample of test tube DS2
• Pounds of filtrate F1
• Unit weight of water in 1ft³ of test tube YwTv = 62.4 pcf
• Wet mass of test tube completion of test TTw1
• Wet mass of test tube after 24hr dewatering TTw2
• Methods of determining dry and wet mass M1, M2 and M3
PGDT Log Mass Calculations Methods
M1, wet bulk density retained / ft³ (by volume): WP1 =V1*D1
M2, dry solids retained / ft³ (by mass): DPm2 = V1*D2 *DS1
M3, dry solids retained / ft³ (by mass after 24 hours of dewatering): DPm3 = TTw2 * DS2
PGDT Testing
The goal of the P‐GDT test is to evaluate dewaterability and consolidation rate from representative samples of a full‐scale dredge operation for slurry represented by sediment samples from SMU 1a, 1b and 6.
Sediment samples were screened and/or thickened as described in Section 3, and all slurry dilutions utilized Onondaga Lake background water collected as part of the Pre‐Design Investigation. A range of 8‐12 percent dry solids for non‐thickened testing was used and 20 percent dry solids for thickened clarified application testing was created. A screening mass‐balance is provided in Table 1 for RDT testing and Table 2 for P‐GDT testing.
A total of 13 P‐GDT tests were completed as part of this investigation. All tests except Tests 7 and 8 were conducted on unscreened material. Tests 7 and 8 were conducted on screened material that was also thickened. Tests conducted include:
P‐GDT Test 1. SMU 1b Unscreened Ashland 2520 Dry Polymer Filtered by TenCate™ GT 500
P‐GDT Test 2. SMU 1b Unscreened Ashland 2520 Dry Polymer Filtered by TenCate™ O2B
Onondaga Lake Pre‐Design Investigation Geotextile Dewatering Structure Geotube® 9 Bench Scale Testing Summary Report
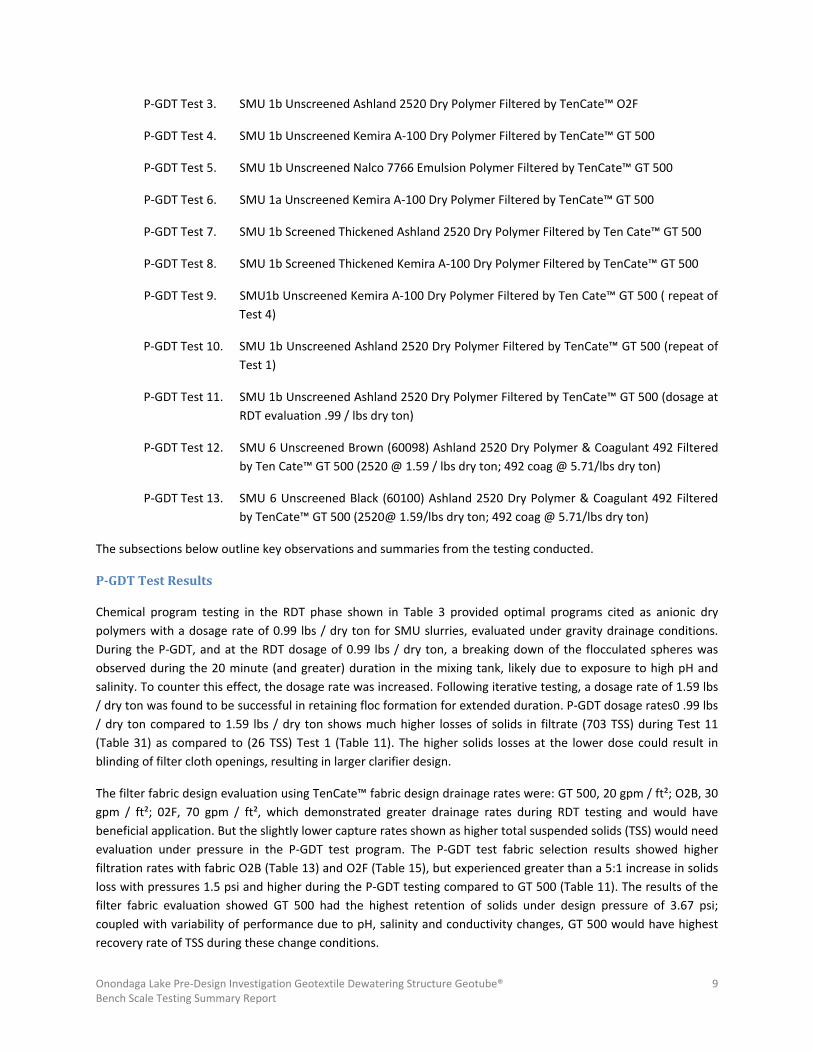
P‐GDT Test 3. SMU 1b Unscreened Ashland 2520 Dry Polymer Filtered by TenCate™ O2F
P‐GDT Test 4. SMU 1b Unscreened Kemira A‐100 Dry Polymer Filtered by TenCate™ GT 500
P‐GDT Test 5. SMU 1b Unscreened Nalco 7766 Emulsion Polymer Filtered by TenCate™ GT 500
P‐GDT Test 6. SMU 1a Unscreened Kemira A‐100 Dry Polymer Filtered by TenCate™ GT 500
P‐GDT Test 7. SMU 1b Screened Thickened Ashland 2520 Dry Polymer Filtered by Ten Cate™ GT 500
P‐GDT Test 8. SMU 1b Screened Thickened Kemira A‐100 Dry Polymer Filtered by TenCate™ GT 500
P‐GDT Test 9. SMU1b Unscreened Kemira A‐100 Dry Polymer Filtered by Ten Cate™ GT 500 ( repeat of Test 4)
P‐GDT Test 10. SMU 1b Unscreened Ashland 2520 Dry Polymer Filtered by TenCate™ GT 500 (repeat of Test 1)
P‐GDT Test 11. SMU 1b Unscreened Ashland 2520 Dry Polymer Filtered by TenCate™ GT 500 (dosage at RDT evaluation .99 / lbs dry ton)
P‐GDT Test 12. SMU 6 Unscreened Brown (60098) Ashland 2520 Dry Polymer & Coagulant 492 Filtered by Ten Cate™ GT 500 (2520 @ 1.59 / lbs dry ton; 492 coag @ 5.71/lbs dry ton)
P‐GDT Test 13. SMU 6 Unscreened Black (60100) Ashland 2520 Dry Polymer & Coagulant 492 Filtered by TenCate™ GT 500 (2520@ 1.59/lbs dry ton; 492 coag @ 5.71/lbs dry ton)
The subsections below outline key observations and summaries from the testing conducted.
PGDT Test Results
Chemical program testing in the RDT phase shown in Table 3 provided optimal programs cited as anionic dry polymers with a dosage rate of 0.99 lbs / dry ton for SMU slurries, evaluated under gravity drainage conditions. During the P‐GDT, and at the RDT dosage of 0.99 lbs / dry ton, a breaking down of the flocculated spheres was observed during the 20 minute (and greater) duration in the mixing tank, likely due to exposure to high pH and salinity. To counter this effect, the dosage rate was increased. Following iterative testing, a dosage rate of 1.59 lbs / dry ton was found to be successful in retaining floc formation for extended duration. P‐GDT dosage rates0 .99 lbs / dry ton compared to 1.59 lbs / dry ton shows much higher losses of solids in filtrate (703 TSS) during Test 11 (Table 31) as compared to (26 TSS) Test 1 (Table 11). The higher solids losses at the lower dose could result in blinding of filter cloth openings, resulting in larger clarifier design.
The filter fabric design evaluation using TenCate™ fabric design drainage rates were: GT 500, 20 gpm / ft²; O2B, 30 gpm / ft²; 02F, 70 gpm / ft², which demonstrated greater drainage rates during RDT testing and would have beneficial application. But the slightly lower capture rates shown as higher total suspended solids (TSS) would need evaluation under pressure in the P‐GDT test program. The P‐GDT test fabric selection results showed higher filtration rates with fabric O2B (Table 13) and O2F (Table 15), but experienced greater than a 5:1 increase in solids loss with pressures 1.5 psi and higher during the P‐GDT testing compared to GT 500 (Table 11). The results of the filter fabric evaluation showed GT 500 had the highest retention of solids under design pressure of 3.67 psi; coupled with variability of performance due to pH, salinity and conductivity changes, GT 500 would have highest recovery rate of TSS during these change conditions.
Onondaga Lake Pre‐Design Investigation Geotextile Dewatering Structure Geotube® 10 Bench Scale Testing Summary Report
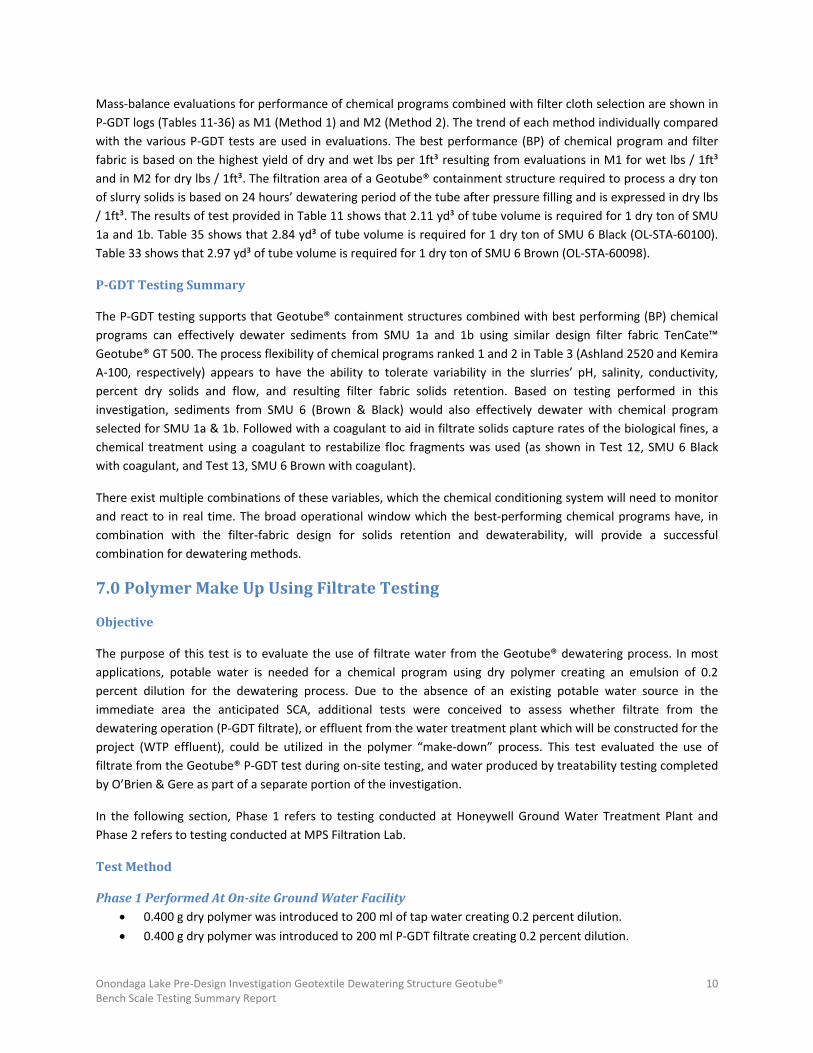
Mass‐balance evaluations for performance of chemical programs combined with filter cloth selection are shown in P‐GDT logs (Tables 11‐36) as M1 (Method 1) and M2 (Method 2). The trend of each method individually compared with the various P‐GDT tests are used in evaluations. The best performance (BP) of chemical program and filter fabric is based on the highest yield of dry and wet lbs per 1ft³ resulting from evaluations in M1 for wet lbs / 1ft³ and in M2 for dry lbs / 1ft³. The filtration area of a Geotube® containment structure required to process a dry ton of slurry solids is based on 24 hours’ dewatering period of the tube after pressure filling and is expressed in dry lbs / 1ft³. The results of test provided in Table 11 shows that 2.11 yd³ of tube volume is required for 1 dry ton of SMU 1a and 1b. Table 35 shows that 2.84 yd³ of tube volume is required for 1 dry ton of SMU 6 Black (OL‐STA‐60100). Table 33 shows that 2.97 yd³ of tube volume is required for 1 dry ton of SMU 6 Brown (OL‐STA‐60098).
PGDT Testing Summary
The P‐GDT testing supports that Geotube® containment structures combined with best performing (BP) chemical programs can effectively dewater sediments from SMU 1a and 1b using similar design filter fabric TenCate™ Geotube® GT 500. The process flexibility of chemical programs ranked 1 and 2 in Table 3 (Ashland 2520 and Kemira A‐100, respectively) appears to have the ability to tolerate variability in the slurries’ pH, salinity, conductivity, percent dry solids and flow, and resulting filter fabric solids retention. Based on testing performed in this investigation, sediments from SMU 6 (Brown & Black) would also effectively dewater with chemical program selected for SMU 1a & 1b. Followed with a coagulant to aid in filtrate solids capture rates of the biological fines, a chemical treatment using a coagulant to restabilize floc fragments was used (as shown in Test 12, SMU 6 Black with coagulant, and Test 13, SMU 6 Brown with coagulant).
There exist multiple combinations of these variables, which the chemical conditioning system will need to monitor and react to in real time. The broad operational window which the best‐performing chemical programs have, in combination with the filter‐fabric design for solids retention and dewaterability, will provide a successful combination for dewatering methods.
7.0 Polymer Make Up Using Filtrate Testing
Objective
The purpose of this test is to evaluate the use of filtrate water from the Geotube® dewatering process. In most applications, potable water is needed for a chemical program using dry polymer creating an emulsion of 0.2 percent dilution for the dewatering process. Due to the absence of an existing potable water source in the immediate area the anticipated SCA, additional tests were conceived to assess whether filtrate from the dewatering operation (P‐GDT filtrate), or effluent from the water treatment plant which will be constructed for the project (WTP effluent), could be utilized in the polymer “make‐down” process. This test evaluated the use of filtrate from the Geotube® P‐GDT test during on‐site testing, and water produced by treatability testing completed by O’Brien & Gere as part of a separate portion of the investigation.
In the following section, Phase 1 refers to testing conducted at Honeywell Ground Water Treatment Plant and Phase 2 refers to testing conducted at MPS Filtration Lab.
Test Method
Phase 1 Performed At Onsite Ground Water Facility • 0.400 g dry polymer was introduced to 200 ml of tap water creating 0.2 percent dilution.
• 0.400 g dry polymer was introduced to 200 ml P‐GDT filtrate creating 0.2 percent dilution.
Onondaga Lake Pre‐Design Investigation Geotextile Dewatering Structure Geotube® 11 Bench Scale Testing Summary Report
• Polymer was aged for 6 hours, reflecting a hold time duration for temporary shut down as normal process aging is 1‐2 hours.
• Polymer was added to 250 ml raw sample of SMU 1b anticipated from a dredging operation at 1.50 lbs / dry ton.
• Samples flocculated were run on the Rapid Dewatering Test (RDT).
• Drainage and capture rates were monitored and recorded as provided in Table 9.
Phase 2 Performed At MPS Facility • 0.400 g dry polymer was introduced to 200 ml of tap water creating 0.2 percent dilution.
• 0.400 g dry polymer was introduced to 200 ml P‐GDT filtrate creating 0.2 percent dilution.
• 0.400 g dry polymer was introduced to 200 ml WTP effluent rate creating 0.2 percent dilution.
• Polymer was aged for 6 hours, reflecting a hold time duration for temporary shut down as normal hold
time aging is 1‐2 hours.
• Polymer make up water variables were used to flocculate the three samples.
• Sample drainage and capture rates were monitored and recorded on Table 10.
Observations
Phase1, 6 hours aging time • Test utilizing P‐GDT filtrate failed drainage test and had TSS 4 times higher than potable water.
• TSS for tap water was 20 TSS and 86 TSS for P‐GDT filtrate.
• Flocculation of slurry using P‐GDT filtrate did not result in sphere characterization as did the tap water.
• Filter cake from untreated filtrate did not register compaction.
Phase 2, 6 hours aging time • Test utilizing P‐GDT filtrate had required sphere characterization.
• Test utilizing WTP effluent had required sphere characterization.
• Test utilizing tap water had required sphere characterization.
• Dewatering rates were similar for all three samples tested.
• RDT cake compaction was similar for all three samples tested.
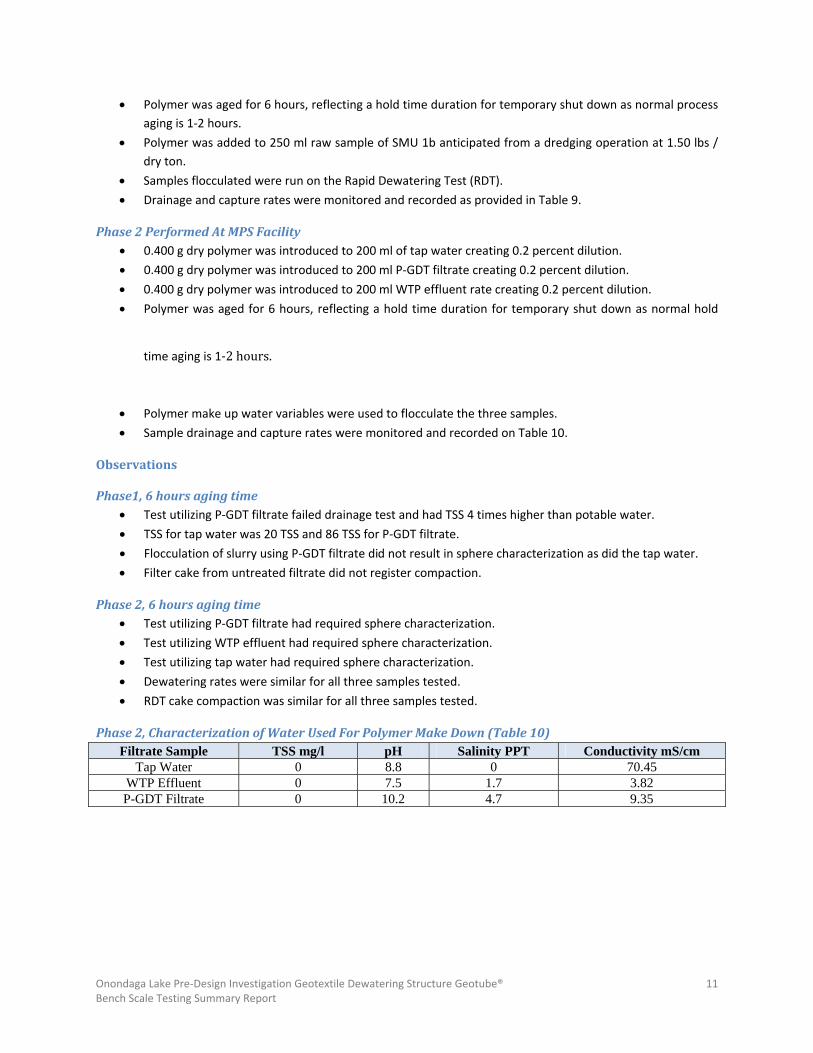
Phase 2, Characterization of Water Used For Polymer Make Down (Table 10) Filtrate Sample TSS mg/l pH Salinity PPT Conductivity mS/cm
Tap Water 0 8.8 0 70.45 WTP Effluent 0 7.5 1.7 3.82 P-GDT Filtrate 0 10.2 4.7 9.35
Onondaga Lake Pre‐Design Investigation Geotextile Dewatering Structure Geotube® 12 Bench Scale Testing Summary Report
Phase 2. RDT Testing Results Comparisons (Table 10)
Summary
Bench scale testing used RDT evaluation of water and P‐GDT filtrate for polymer make down and was conducted in two phases. The first phase was an RDT test at the end of the P‐GDT trials (Table 9) which resulted in poor drainage and capture rates of filtrate water sample. During this first phase of testing, the pH of the P‐GDT filtrate was adjusted using SO4 to similar pH values of tap water. This pH adjustment was made to simulate anticipated processes associated with the treatment of filtrate in the onsite Water Treatment Plant. The second phase (Table 10) used no chemical pretreatment of water prior to make down with dry polymer. The results showed only minimal difference between tap water, P‐GDT filtrate and WTP effluent.
The largest variable in parameters between test phases was filtrate used in Phase 1 was the pH adjustment. This possibly precipitated calcium forming CaSO4 that consumed much of the activity of the polymer. In Phase 2, no pH adjustment was conducted on samples prior to use for polymer make down.
Based on RDT evaluation, the WTP effluent is a candidate for supplementing the use of potable water for polymer make down operations. Although the bench tests described above did not identify major discrepancies between the effectiveness of polymer made up of the different water sources, previous project experience attempts has demonstrated that the use filtrate as polymer makeup water can be challenging. Furthermore, based on this bench testing, further evaluation would be necessary to determine whether pH adjustment completed as part of the water treatment process would have the same impact on the effectiveness of the polymer as was noted during this bench testing. Further evaluation and/or full‐scale field validation on the use of filtrate water, or WTP effluent, as polymer makeup water, could be completed during the initial startup phases of the dredging operation. As a contingency, it would likely be necessary to have a potable water feed line rated for 300 gpm @ 60 psi installed to the chemical treatment pad in the event poor dewatering performance results are experienced from untreated filtrate, or the WTP effluent.
Filtrate Sample
Sphere Characterization
Floc Shear Resistance
Drainage Rate ml After 180 Sec
Compaction Rate kg/in²
Filtrate TSS mg/l
Tap Water Similar BB Similar 15 Sec 174 0.8 4 WTP
Effluent Similar BB Similar 15 Sec 174 0.6 12
P-GDT Filtrate
Similar BB Similar 15 Sec 181 0.2 21

Appendix A
Purposed Testing Matrix
Appendix B
RDT Rapid Drainage Test Methods
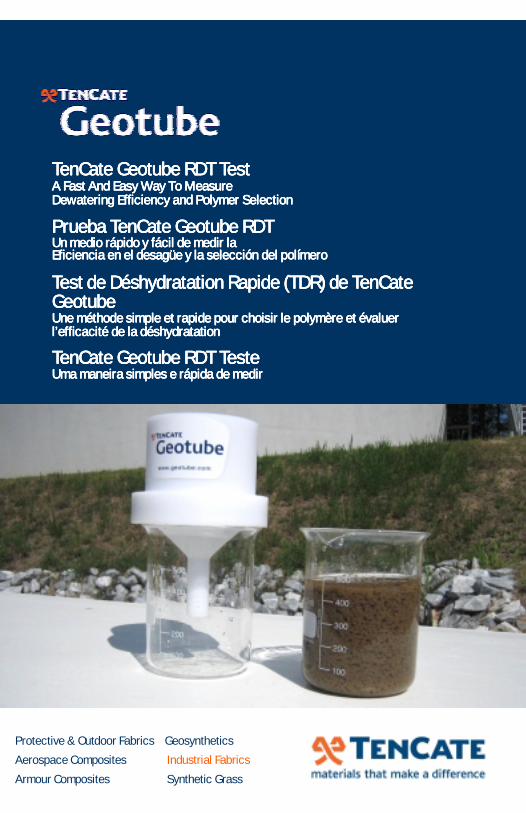
TenCate Geotube RDT Test TenCate Geotube RDT Test TenCate Geotube RDT Test TenCate Geotube RDT Test A Fast And Easy Way To Measure A Fast And Easy Way To Measure A Fast And Easy Way To Measure A Fast And Easy Way To Measure Dewatering Efficiency and Polymer SelectionDewatering Efficiency and Polymer SelectionDewatering Efficiency and Polymer SelectionDewatering Efficiency and Polymer Selection
Prueba TenCate Geotube RDTPrueba TenCate Geotube RDTPrueba TenCate Geotube RDTPrueba TenCate Geotube RDT Un medio rápido y fácil de medir laUn medio rápido y fácil de medir laUn medio rápido y fácil de medir laUn medio rápido y fácil de medir la Eficiencia en el desagüe y la selección del polímero Eficiencia en el desagüe y la selección del polímero Eficiencia en el desagüe y la selección del polímero Eficiencia en el desagüe y la selección del polímero
Test de Déshydratation Rapide (TDR) de TenCate Test de Déshydratation Rapide (TDR) de TenCate Test de Déshydratation Rapide (TDR) de TenCate Test de Déshydratation Rapide (TDR) de TenCate Geotube Geotube Geotube Geotube Une méthode simple et rapide pour choisir le polymère et évaluer Une méthode simple et rapide pour choisir le polymère et évaluer Une méthode simple et rapide pour choisir le polymère et évaluer Une méthode simple et rapide pour choisir le polymère et évaluer l’efficacité de la déshydratationl’efficacité de la déshydratationl’efficacité de la déshydratationl’efficacité de la déshydratation
TenCate Geotube RDT Teste TenCate Geotube RDT Teste TenCate Geotube RDT Teste TenCate Geotube RDT Teste Uma maneira simples e rápida de medir Uma maneira simples e rápida de medir Uma maneira simples e rápida de medir Uma maneira simples e rápida de medir
Protective & Outdoor Fabrics Geosynthetics
Aerospace Composites Industrial Fabrics
Armour Composites Synthetic Grass
DEWATERING: RDT TEST I 3
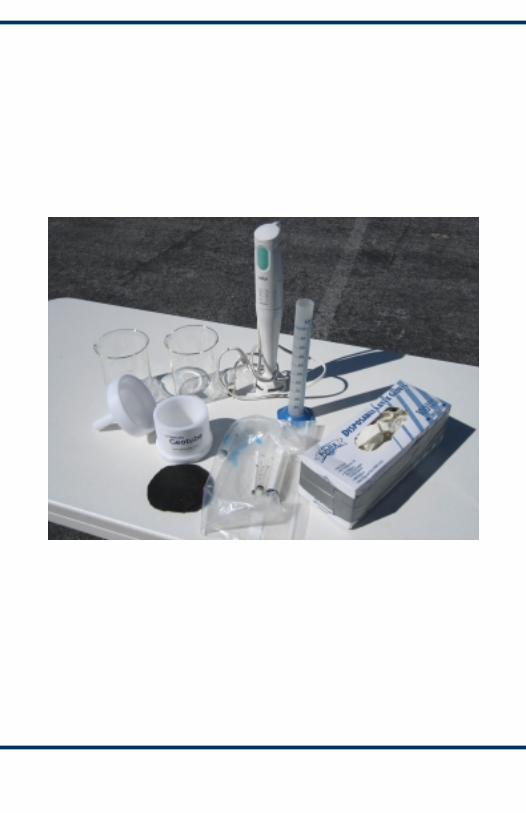
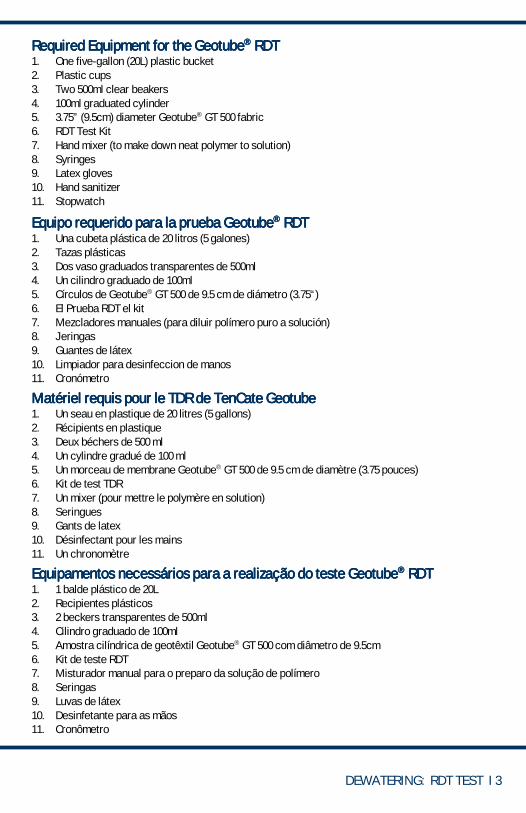
Required Equipment for the GeotubeRequired Equipment for the GeotubeRequired Equipment for the GeotubeRequired Equipment for the Geotube®®®® RDT RDT RDT RDT
1. One five-gallon (20L) plastic bucket 2. Plastic cups 3. Two 500ml clear beakers 4. 100ml graduated cylinder 5. 3.75” (9.5cm) diameter Geotube® GT 500 fabric 6. RDT Test Kit 7. Hand mixer (to make down neat polymer to solution) 8. Syringes 9. Latex gloves 10. Hand sanitizer 11. Stopwatch
Equipo requerido para la prueba GeotubeEquipo requerido para la prueba GeotubeEquipo requerido para la prueba GeotubeEquipo requerido para la prueba Geotube®®®® RDT RDT RDT RDT
1. Una cubeta plástica de 20 litros (5 galones) 2. Tazas plásticas 3. Dos vaso graduados transparentes de 500ml 4. Un cilindro graduado de 100ml 5. Círculos de Geotube® GT 500 de 9.5 cm de diámetro (3.75“) 6. El Prueba RDT el kit 7. Mezcladores manuales (para diluir polímero puro a solución) 8. Jeringas 9. Guantes de látex 10. Limpiador para desinfeccion de manos 11. Cronómetro
Matériel requis pour le TDR de TenCate GeotubeMatériel requis pour le TDR de TenCate GeotubeMatériel requis pour le TDR de TenCate GeotubeMatériel requis pour le TDR de TenCate Geotube 1. Un seau en plastique de 20 litres (5 gallons) 2. Récipients en plastique 3. Deux béchers de 500 ml 4. Un cylindre gradué de 100 ml 5. Un morceau de membrane Geotube® GT 500 de 9.5 cm de diamètre (3.75 pouces) 6. Kit de test TDR 7. Un mixer (pour mettre le polymère en solution) 8. Seringues 9. Gants de latex 10. Désinfectant pour les mains 11. Un chronomètre
Equipamentos necessários para a realização do teste GeotubeEquipamentos necessários para a realização do teste GeotubeEquipamentos necessários para a realização do teste GeotubeEquipamentos necessários para a realização do teste Geotube®®®® RDT RDT RDT RDT 1. 1 balde plástico de 20L 2. Recipientes plásticos 3. 2 beckers transparentes de 500ml 4. Cilindro graduado de 100ml 5. Amostra cilíndrica de geotêxtil Geotube® GT 500 com diâmetro de 9.5cm 6. Kit de teste RDT 7. Misturador manual para o preparo da solução de polímero 8. Seringas 9. Luvas de látex 10. Desinfetante para as mãos 11. Cronômetro
4 I
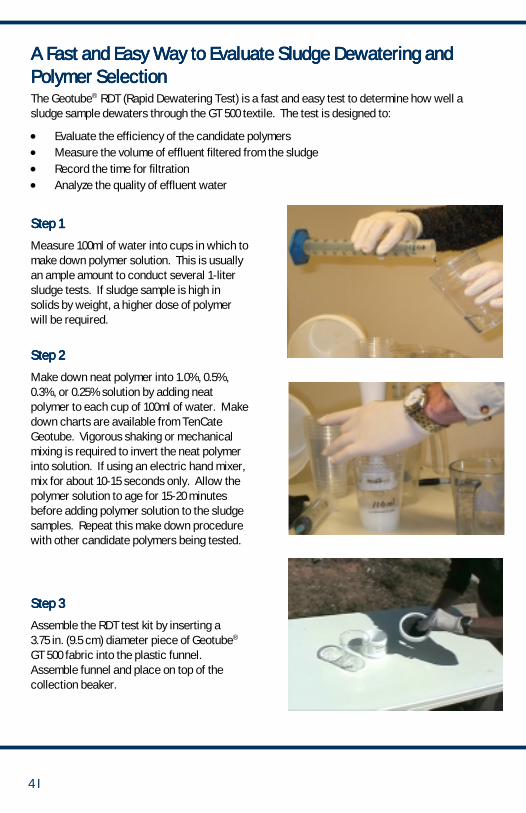
Step 1Step 1Step 1Step 1
Measure 100ml of water into cups in which to make down polymer solution. This is usually an ample amount to conduct several 1-liter sludge tests. If sludge sample is high in solids by weight, a higher dose of polymer will be required.
Step 2Step 2Step 2Step 2
Make down neat polymer into 1.0%, 0.5%, 0.3%, or 0.25% solution by adding neat polymer to each cup of 100ml of water. Make down charts are available from TenCate Geotube. Vigorous shaking or mechanical mixing is required to invert the neat polymer into solution. If using an electric hand mixer, mix for about 10-15 seconds only. Allow the polymer solution to age for 15-20 minutes before adding polymer solution to the sludge samples. Repeat this make down procedure with other candidate polymers being tested.
Step 3Step 3Step 3Step 3
Assemble the RDT test kit by inserting a 3.75 in. (9.5 cm) diameter piece of Geotube® GT 500 fabric into the plastic funnel. Assemble funnel and place on top of the collection beaker.
A Fast and Easy Way to Evaluate Sludge Dewatering and A Fast and Easy Way to Evaluate Sludge Dewatering and A Fast and Easy Way to Evaluate Sludge Dewatering and A Fast and Easy Way to Evaluate Sludge Dewatering and Polymer SelectionPolymer SelectionPolymer SelectionPolymer Selection
The Geotube® RDT (Rapid Dewatering Test) is a fast and easy test to determine how well a sludge sample dewaters through the GT 500 textile. The test is designed to:
• Evaluate the efficiency of the candidate polymers • Measure the volume of effluent filtered from the sludge • Record the time for filtration • Analyze the quality of effluent water
DEWATERING: RDT TEST I 5
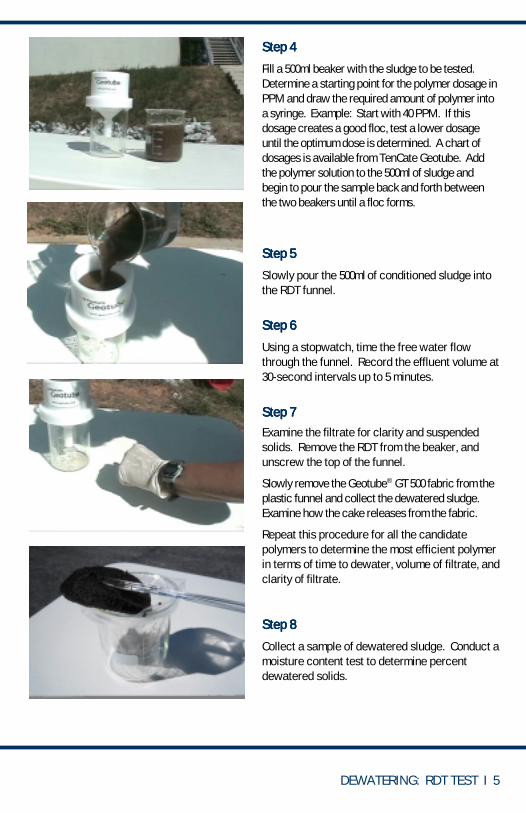
Step 4Step 4Step 4Step 4
Fill a 500ml beaker with the sludge to be tested. Determine a starting point for the polymer dosage in PPM and draw the required amount of polymer into a syringe. Example: Start with 40 PPM. If this dosage creates a good floc, test a lower dosage until the optimum dose is determined. A chart of dosages is available from TenCate Geotube. Add the polymer solution to the 500ml of sludge and begin to pour the sample back and forth between the two beakers until a floc forms.
Step 5Step 5Step 5Step 5
Slowly pour the 500ml of conditioned sludge into the RDT funnel.
Step 7Step 7Step 7Step 7
Examine the filtrate for clarity and suspended solids. Remove the RDT from the beaker, and unscrew the top of the funnel.
Slowly remove the Geotube® GT 500 fabric from the plastic funnel and collect the dewatered sludge. Examine how the cake releases from the fabric.
Repeat this procedure for all the candidate polymers to determine the most efficient polymer in terms of time to dewater, volume of filtrate, and clarity of filtrate.
Step 8Step 8Step 8Step 8
Collect a sample of dewatered sludge. Conduct a moisture content test to determine percent dewatered solids.
Step 6Step 6Step 6Step 6
Using a stopwatch, time the free water flow through the funnel. Record the effluent volume at 30-second intervals up to 5 minutes.
3680 Mount Olive Road Commerce, Georgia 30529
TenCate Geosynthetics North America assumes no liability for the accuracy or completeness of this information or for the ultimate use of the purchaser. TenCate disclaims any and all express, implied, or statutory standards, warranties, or guarantees, including without limitation any implied warranty as to merchantability or fitness for a particular purpose or arising from a course of dealing or usage of trade as to any equipment, materials, or information furnished herewith. This document should not be construed as engineering advice. Geotube® is a registered trademark of TenCate Geosynthetics North America.
TenCate Geosynthetics North America no asume ninguna responsabilidad por la exactitud y bastedad de esta información o por el uso final del comprador. TenCate rechaza cualquier y todas las garantías expresas, implícitas o establecidas por estándares, incluyendo sin limitación cualquier garantía implícita por la comercialización del producto o por capacidad de un fin particular o las que surjan en el curso del uso o comercio de cualquier equipo,.materiales o información aquí provista. Este documento no debe de ser usado sin una revisión de ingeniería. Geotube® es una marca registrada por TenCate Geosynthetics North America.
TenCate Geosynthetics North America n'assume aucune responsabilité quant au contenu ou à l'exactitude des informations contenues dans ce document ou encore à l'utilisation finale qu'en fera l'acheteur. TenCate n’assume aucune garantie quant aux équipements et matériaux décrits ci-dessus et qui ne sont pas fournis par TenCate. Ce document ne doit pas être interprété comme étant un avis d'ingénieur. Geotube® est une marque de commerce enregistrée deTenCate Geosynthetics North America.
A TenCate Geosynthetics North America não assume nenhuma responsabilidade pela precisão ou totalidade destas informações ou pelo último uso do comprador. A TenCate nega toda e qualquer ação expressa, subentendida ou padrão legal, autorização, garantia, incluindo sem restrição a qualquer garantia implícita como negociação ou conveniência para propósito particular ou surgimento em virtude de comercialização de qualquer equipamento, material ou informação inclusa.Este documento não deverá ser interpretado como recomendação técnica de Engenharia. A Geotube® é uma marca registrada da Ten Cate Geosynthetics North America.
©2007 TenCate Geosynthetics North America. All Rights Reserved.
706.693.1897 Toll Free 888.795.0808 Fax 706.693.1896 www.geotube.com
CAUTION! CAUTION! CAUTION! CAUTION!
Do Not Exceed Fill Height Printed On GeotubeDo Not Exceed Fill Height Printed On GeotubeDo Not Exceed Fill Height Printed On GeotubeDo Not Exceed Fill Height Printed On Geotube®®®® Unit. Unit. Unit. Unit. Always Install GeotubeAlways Install GeotubeAlways Install GeotubeAlways Install Geotube®®®® Containers On A Flat, Level Surface. Containers On A Flat, Level Surface. Containers On A Flat, Level Surface. Containers On A Flat, Level Surface.
If any questions, contact your TenCate Geotube Representative.If any questions, contact your TenCate Geotube Representative.If any questions, contact your TenCate Geotube Representative.If any questions, contact your TenCate Geotube Representative.
¡PRECAUCION!¡PRECAUCION!¡PRECAUCION!¡PRECAUCION! No exceda la altura de llenado impresa en el GeotubeNo exceda la altura de llenado impresa en el GeotubeNo exceda la altura de llenado impresa en el GeotubeNo exceda la altura de llenado impresa en el Geotube®®®®
Siempre instale el GeotubeSiempre instale el GeotubeSiempre instale el GeotubeSiempre instale el Geotube®®®® en una superficie plana y nivelada en una superficie plana y nivelada en una superficie plana y nivelada en una superficie plana y nivelada Para cualquier duda o ampliación contacte a su Para cualquier duda o ampliación contacte a su Para cualquier duda o ampliación contacte a su Para cualquier duda o ampliación contacte a su
representante de TenCate Geotube.representante de TenCate Geotube.representante de TenCate Geotube.representante de TenCate Geotube.
ATTENTION! ATTENTION! ATTENTION! ATTENTION! Ne pas dépasser la hauteur limite de remplissage imprimée sur chaque GeotubeNe pas dépasser la hauteur limite de remplissage imprimée sur chaque GeotubeNe pas dépasser la hauteur limite de remplissage imprimée sur chaque GeotubeNe pas dépasser la hauteur limite de remplissage imprimée sur chaque Geotube®®®®....
Toujours installer les containers GeotubeToujours installer les containers GeotubeToujours installer les containers GeotubeToujours installer les containers Geotube®®®® sur une surface plane et au niveau. sur une surface plane et au niveau. sur une surface plane et au niveau. sur une surface plane et au niveau. Pour toute question, contacter votre représentant TenCate Geotube.Pour toute question, contacter votre représentant TenCate Geotube.Pour toute question, contacter votre représentant TenCate Geotube.Pour toute question, contacter votre représentant TenCate Geotube.
Atenção!Atenção!Atenção!Atenção! Não exceda a altura máximas de enchimento Não exceda a altura máximas de enchimento Não exceda a altura máximas de enchimento Não exceda a altura máximas de enchimento
impressa nas unidades Geotubeimpressa nas unidades Geotubeimpressa nas unidades Geotubeimpressa nas unidades Geotube®®®®.... Sempre instale as unidades GeotubeSempre instale as unidades GeotubeSempre instale as unidades GeotubeSempre instale as unidades Geotube®®®® em superfície plana. em superfície plana. em superfície plana. em superfície plana.
Para quaisquer esclarecimentos, contate seu Para quaisquer esclarecimentos, contate seu Para quaisquer esclarecimentos, contate seu Para quaisquer esclarecimentos, contate seu representante TenCate Geotube.representante TenCate Geotube.representante TenCate Geotube.representante TenCate Geotube.
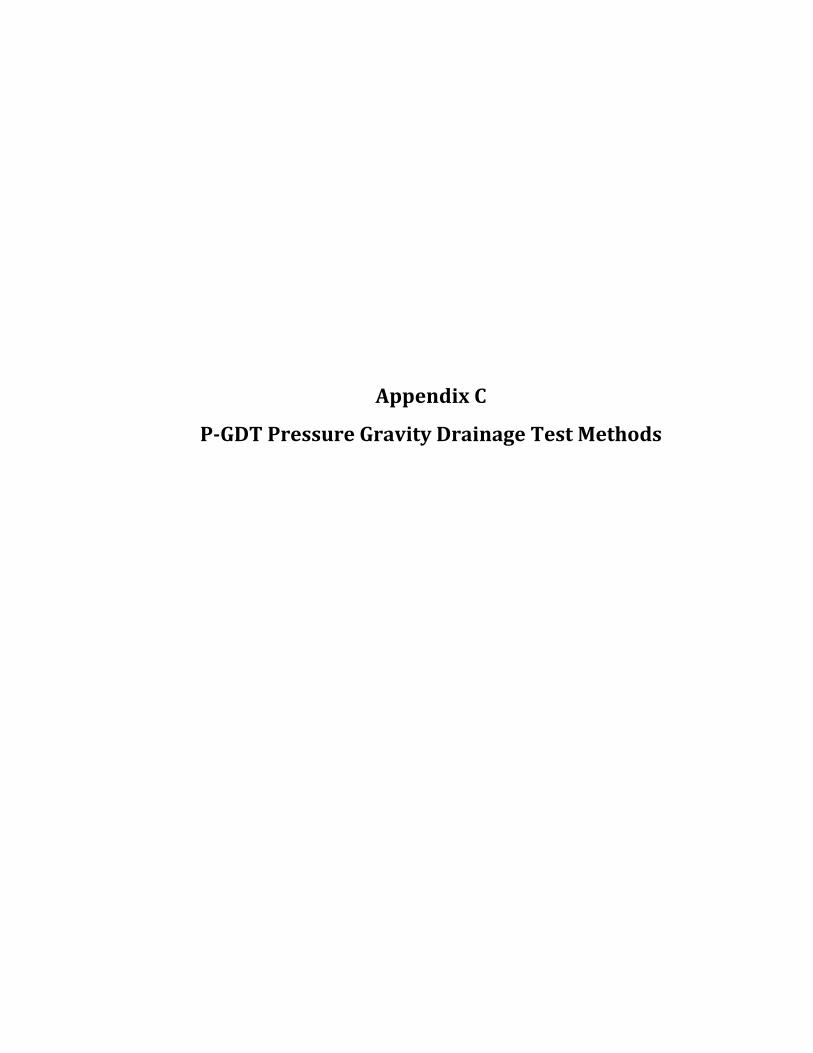
Appendix C
PGDT Pressure Gravity Drainage Test Methods

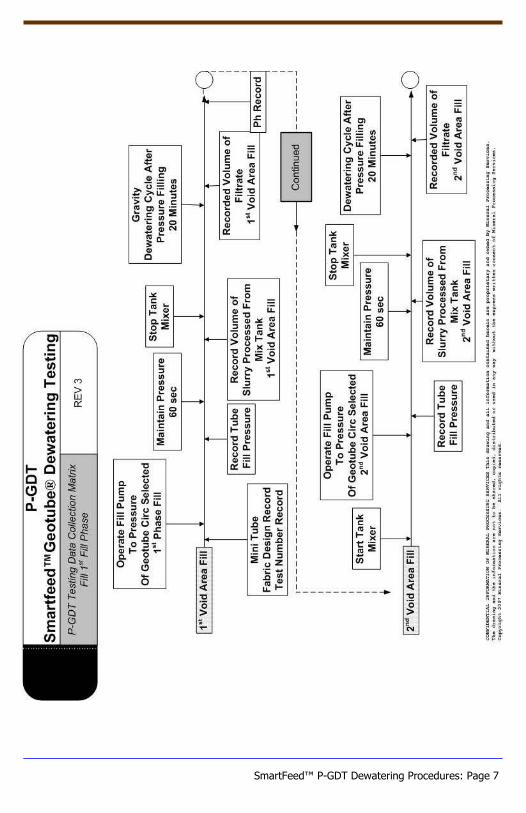
P-GDT Pressure-Gravity Dewatering Test Procedures Steps For A Successful Test Of SmartFeed™ Geotube® Dewatering Technology
SmartFeed™ is a patent-pending technology of Mineral Processing Services LLC. Geotube® is a registered trademark of TenCate. Used with permission.
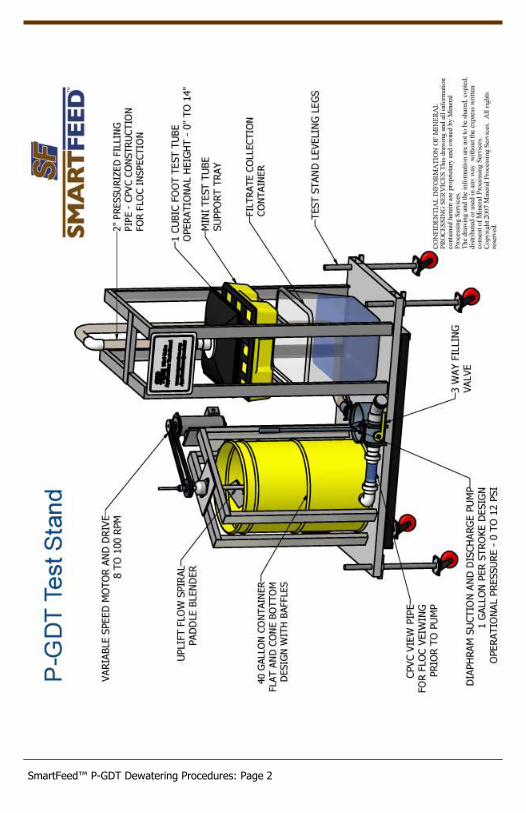
SmartFeed™ P-GDT Dewatering Procedures: Page 2
SmartFeed™ P-GDT Dewatering Procedures: Page 3
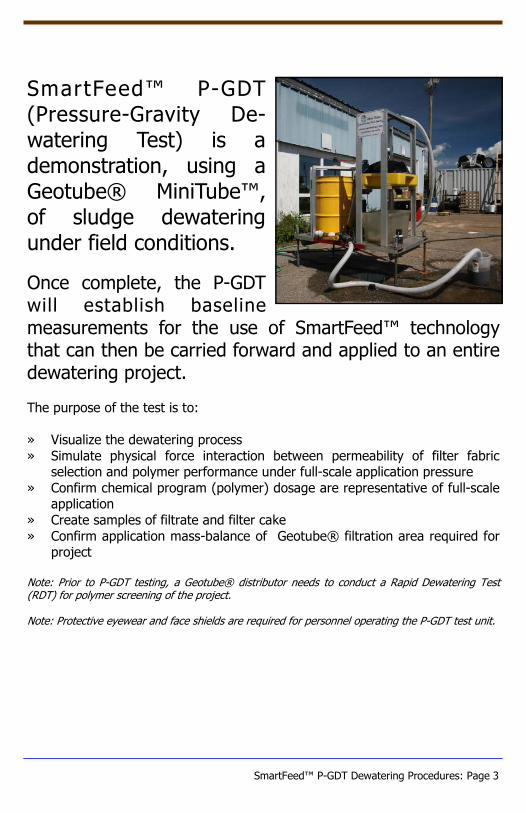
SmartFeed™ P-GDT (Pressure-Gravity De-watering Test) is a demonstration, using a Geotube® MiniTube™, of sludge dewatering under field conditions.
Once complete, the P-GDT will establish baseline measurements for the use of SmartFeed™ technology that can then be carried forward and applied to an entire dewatering project.
The purpose of the test is to:
» Visualize the dewatering process
» Simulate physical force interaction between permeability of filter fabric selection and polymer performance under full-scale application pressure
» Confirm chemical program (polymer) dosage are representative of full-scale application
» Create samples of filtrate and filter cake
» Confirm application mass-balance of Geotube® filtration area required for project
Note: Prior to P-GDT testing, a Geotube® distributor needs to conduct a Rapid Dewatering Test (RDT) for polymer screening of the project. Note: Protective eyewear and face shields are required for personnel operating the P-GDT test unit.
SmartFeed™ P-GDT Dewatering Procedures: Page 4
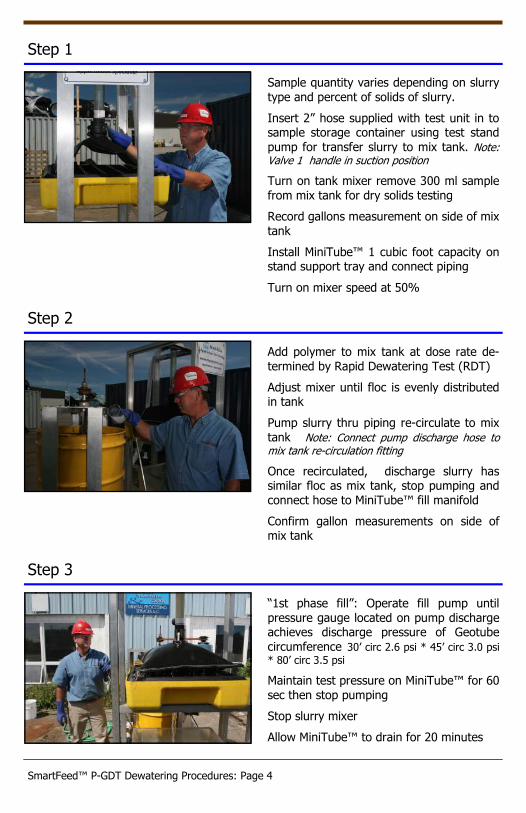
Sample quantity varies depending on slurry
type and percent of solids of slurry.
Insert 2” hose supplied with test unit in to sample storage container using test stand
pump for transfer slurry to mix tank. Note: Valve 1 handle in suction position
Turn on tank mixer remove 300 ml sample
from mix tank for dry solids testing
Record gallons measurement on side of mix
tank
Install MiniTube™ 1 cubic foot capacity on stand support tray and connect piping
Turn on mixer speed at 50%
Add polymer to mix tank at dose rate de-
termined by Rapid Dewatering Test (RDT)
Adjust mixer until floc is evenly distributed in tank
Pump slurry thru piping re-circulate to mix
tank Note: Connect pump discharge hose to mix tank re-circulation fitting
Once recirculated, discharge slurry has similar floc as mix tank, stop pumping and
connect hose to MiniTube™ fill manifold
Confirm gallon measurements on side of mix tank
Step 1
Step 2
“1st phase fill”: Operate fill pump until
pressure gauge located on pump discharge achieves discharge pressure of Geotube
circumference 30’ circ 2.6 psi * 45’ circ 3.0 psi * 80’ circ 3.5 psi
Maintain test pressure on MiniTube™ for 60
sec then stop pumping
Stop slurry mixer
Allow MiniTube™ to drain for 20 minutes
Step 3
SmartFeed™ P-GDT Dewatering Procedures: Page 5
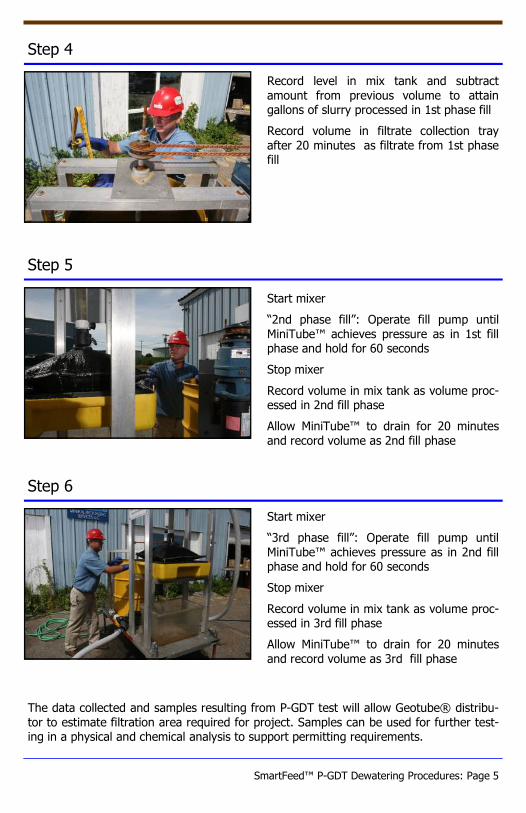
Record level in mix tank and subtract
amount from previous volume to attain gallons of slurry processed in 1st phase fill
Record volume in filtrate collection tray
after 20 minutes as filtrate from 1st phase fill
Step 4
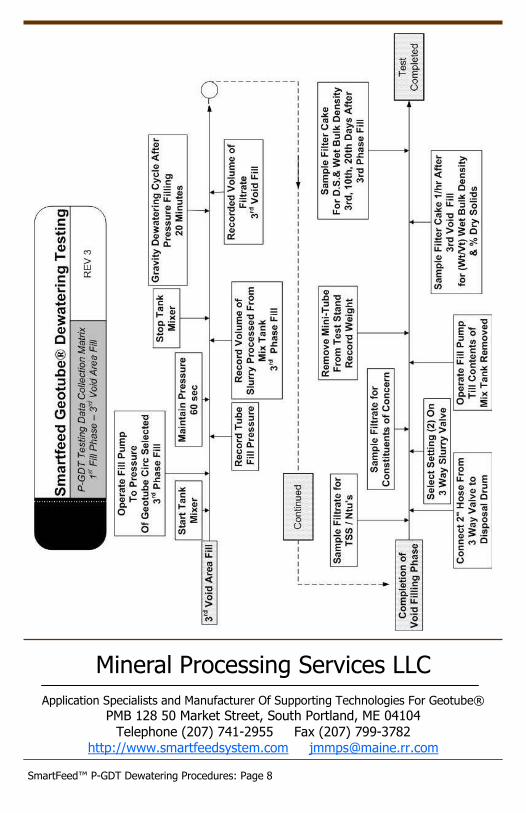
Start mixer
“2nd phase fill”: Operate fill pump until
MiniTube™ achieves pressure as in 1st fill phase and hold for 60 seconds
Stop mixer
Record volume in mix tank as volume proc-essed in 2nd fill phase
Allow MiniTube™ to drain for 20 minutes
and record volume as 2nd fill phase
Step 5
Start mixer
“3rd phase fill”: Operate fill pump until
MiniTube™ achieves pressure as in 2nd fill phase and hold for 60 seconds
Stop mixer
Record volume in mix tank as volume proc-essed in 3rd fill phase
Allow MiniTube™ to drain for 20 minutes
and record volume as 3rd fill phase
Step 6
The data collected and samples resulting from P-GDT test will allow Geotube® distribu-
tor to estimate filtration area required for project. Samples can be used for further test-ing in a physical and chemical analysis to support permitting requirements.
SmartFeed™ P-GDT Dewatering Procedures: Page 6
SmartFeed™ P-GDT Dewatering Procedures: Page 7
SmartFeed™ P-GDT Dewatering Procedures: Page 8
Mineral Processing Services LLC
Application Specialists and Manufacturer Of Supporting Technologies For Geotube®
PMB 128 50 Market Street, South Portland, ME 04104
Telephone (207) 741-2955 Fax (207) 799-3782 http://www.smartfeedsystem.com [email protected]

Appendix D
The Geotube® Simulator
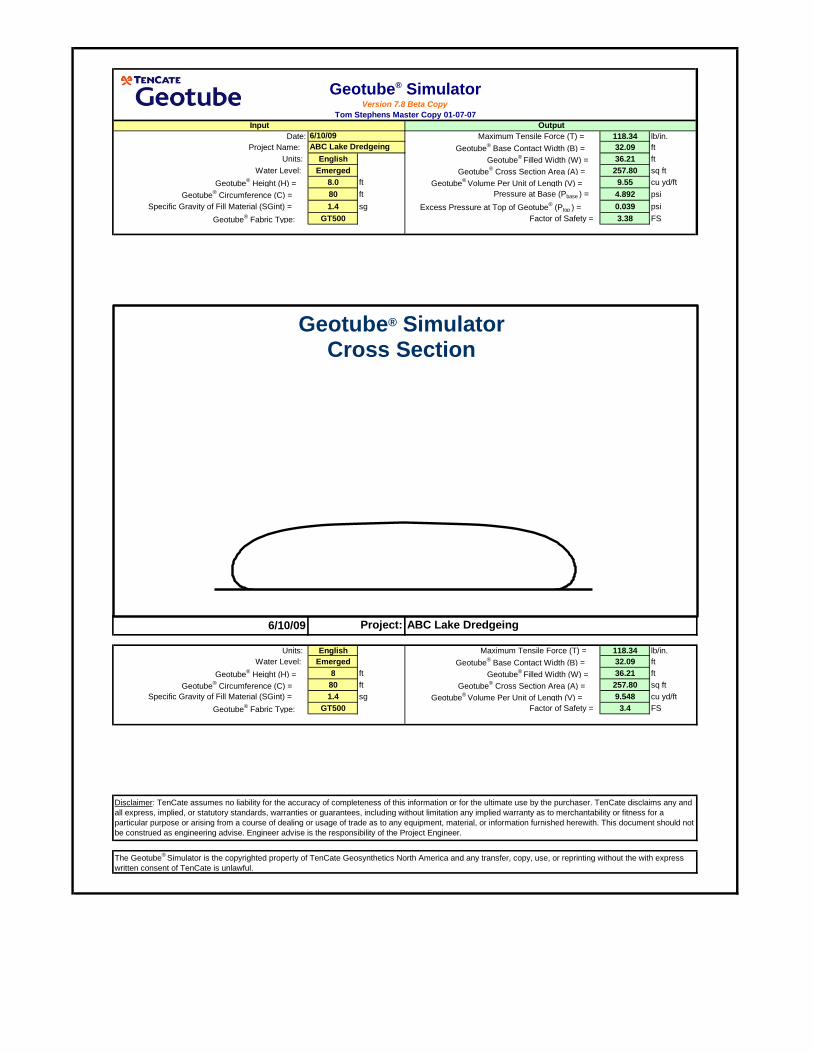
Date: Maximum Tensile Force (T) = 118.34 lb/in.
Project Name: Geotube® Base Contact Width (B) = 32.09 ft
Units: English Geotube®
Filled Width (W) = 36.21 ft
Water Level: Emerged Geotube® Cross Section Area (A) = 257.80 sq ft
Geotube® Height (H) = 8.0 ft Geotube
® Volume Per Unit of Length (V) = 9.55 cu yd/ft
Geotube® Circumference (C) = 80 ft Pressure at Base (Pbase ) = 4.892 psi
Specific Gravity of Fill Material (SGint) = 1.4 sg Excess Pressure at Top of Geotube® (Ptop ) = 0.039 psi
Geotube® Fabric Type: GT500 Factor of Safety = 3.38 FS
6/10/09
Units: English Maximum Tensile Force (T) = 118.34 lb/in.
Water Level: Emerged Geotube® Base Contact Width (B) = 32.09 ft
Geotube® Height (H) = 8 ft Geotube
® Filled Width (W) = 36.21 ft
Geotube® Circumference (C) = 80 ft Geotube
® Cross Section Area (A) = 257.80 sq ft
Specific Gravity of Fill Material (SGint) = 1.4 sg Geotube®
Volume Per Unit of Length (V) = 9.548 cu yd/ft
Geotube® Fabric Type: GT500 Factor of Safety = 3.4 FS
The Geotube®
Simulator is the copyrighted property of TenCate Geosynthetics North America and any transfer, copy, use, or reprinting without the with express
written consent of TenCate is unlawful.
ABC Lake DredgeingProject:
Disclaimer: TenCate assumes no liability for the accuracy of completeness of this information or for the ultimate use by the purchaser. TenCate disclaims any and
all express, implied, or statutory standards, warranties or guarantees, including without limitation any implied warranty as to merchantability or fitness for a
particular purpose or arising from a course of dealing or usage of trade as to any equipment, material, or information furnished herewith. This document should not
be construed as engineering advise. Engineer advise is the responsibility of the Project Engineer.
Input Output
ABC Lake Dredgeing
6/10/09
Version 7.8 Beta Copy
Tom Stephens Master Copy 01-07-07
Geotube® Simulator
Geotube® Simulator Cross Section

Appendix E
The Geotube® Estimator
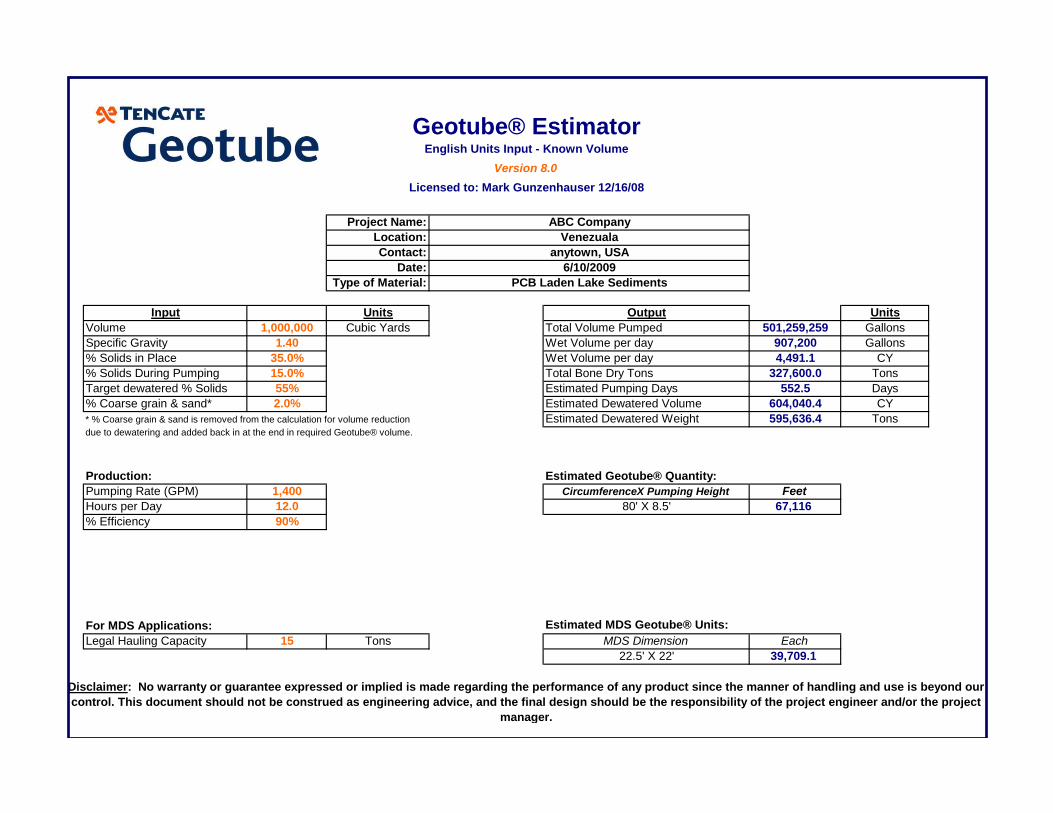
Project Name:
Location:
Contact:
Date:
Type of Material:
Input Units Output Units
Volume 1,000,000 Cubic Yards Total Volume Pumped 501,259,259 Gallons
Specific Gravity 1.40 Wet Volume per day 907,200 Gallons
% Solids in Place 35.0% Wet Volume per day 4,491.1 CY
% Solids During Pumping 15.0% Total Bone Dry Tons 327,600.0 Tons
Target dewatered % Solids 55% Estimated Pumping Days 552.5 Days
% Coarse grain & sand* 2.0% Estimated Dewatered Volume 604,040.4 CY
* % Coarse grain & sand is removed from the calculation for volume reduction Estimated Dewatered Weight 595,636.4 Tonsdue to dewatering and added back in at the end in required Geotube® volume.
Production: Estimated Geotube® Quantity:
Pumping Rate (GPM) 1,400 CircumferenceX Pumping Height Feet
Hours per Day 12.0 80' X 8.5' 67,116
% Efficiency 90%
For MDS Applications: Estimated MDS Geotube® Units:
Legal Hauling Capacity 15 Tons MDS Dimension Each
22.5' X 22' 39,709.1
Geotube® EstimatorEnglish Units Input - Known Volume
Version 8.0
Licensed to: Mark Gunzenhauser 12/16/08
Disclaimer: No warranty or guarantee expressed or implied is made regarding the performance of any product since the manner of handling and use is beyond our
control. This document should not be construed as engineering advice, and the final design should be the responsibility of the project engineer and/or the project
manager.
PCB Laden Lake Sediments
6/10/2009
ABC Company
Venezuala
anytown, USA

Appendix F
The Geotube® Illustrator
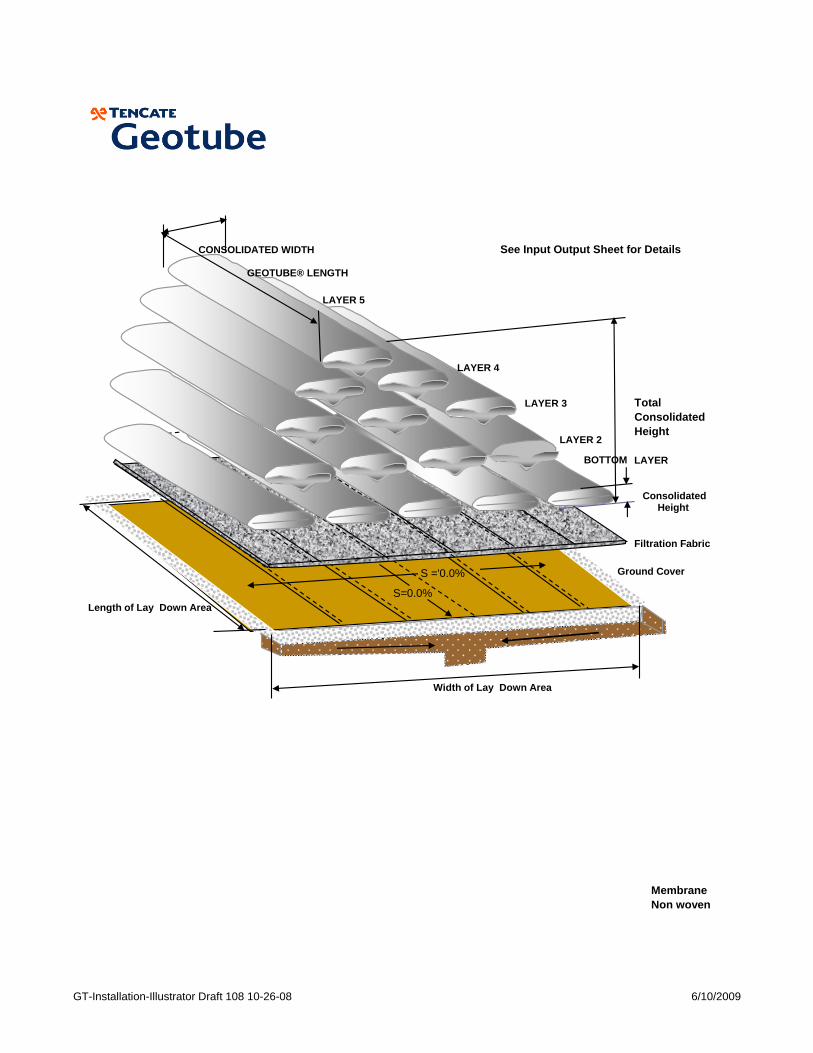
CONSOLIDATED WIDTH See Input Output Sheet for Details
Total
Consolidated
Height
BOTTOM LAYER
Filtration Fabric
Ground Cover
Membrane
Non woven
LAYER 5
LAYER 4
LAYER 3
Width of Lay Down Area
Length of Lay Down Area
ConsolidatedHeight
S=0.0%
S ='0.0%
LAYER 2
GEOTUBE® LENGTH
GT-Installation-Illustrator Draft 108 10-26-08 6/10/2009

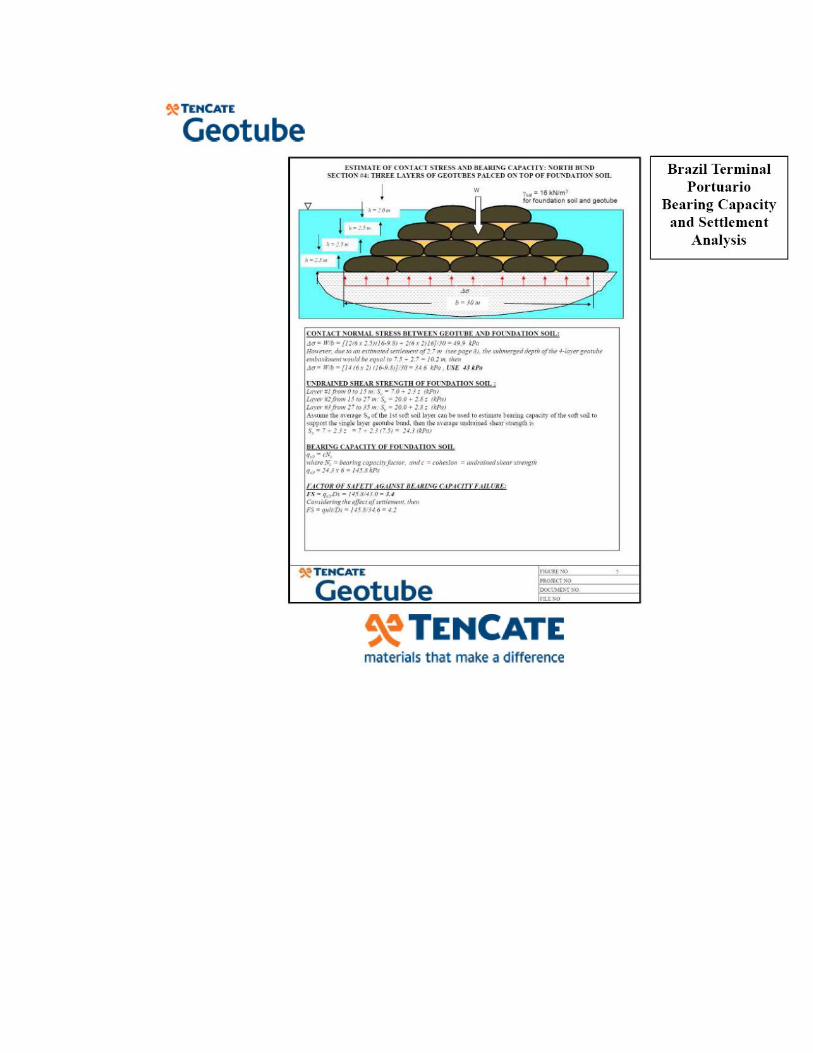
Appendix G
The Geotube® Structure Bearing Capacity and Settlement Analysis Program
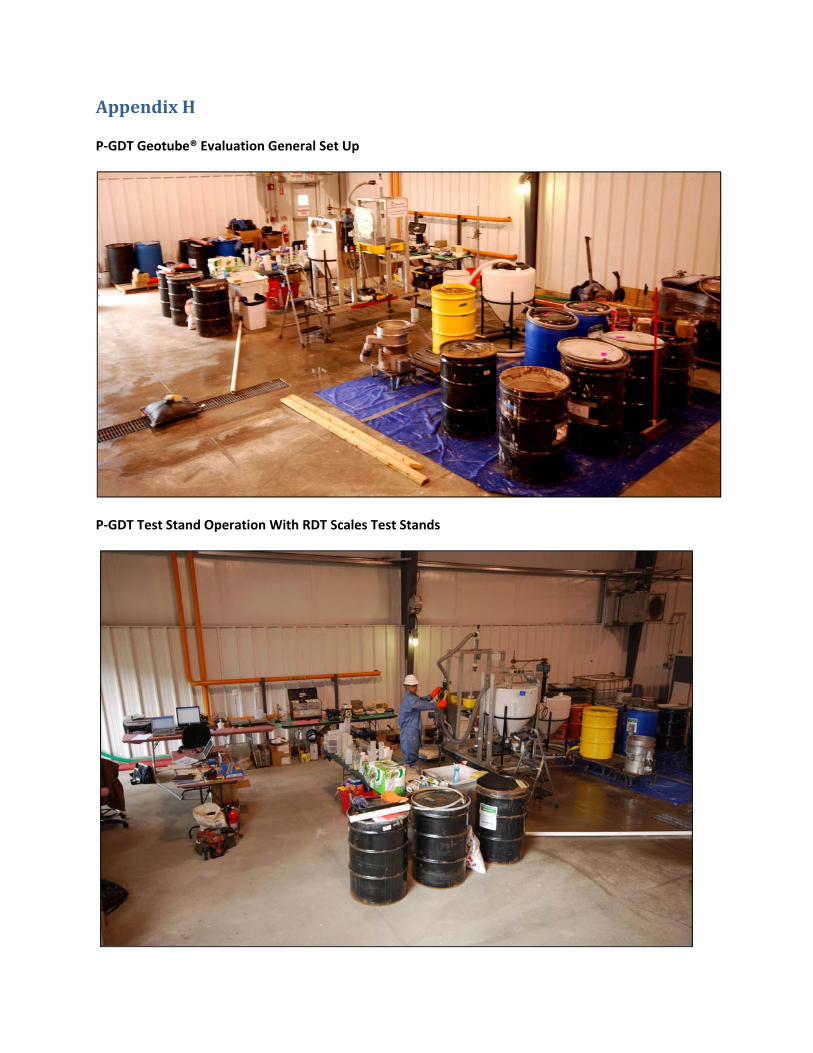
Appendix H
P‐GDT Geotube® Evaluation General Set Up
P‐GDT Test Stand Operation With RDT Scales Test Stands
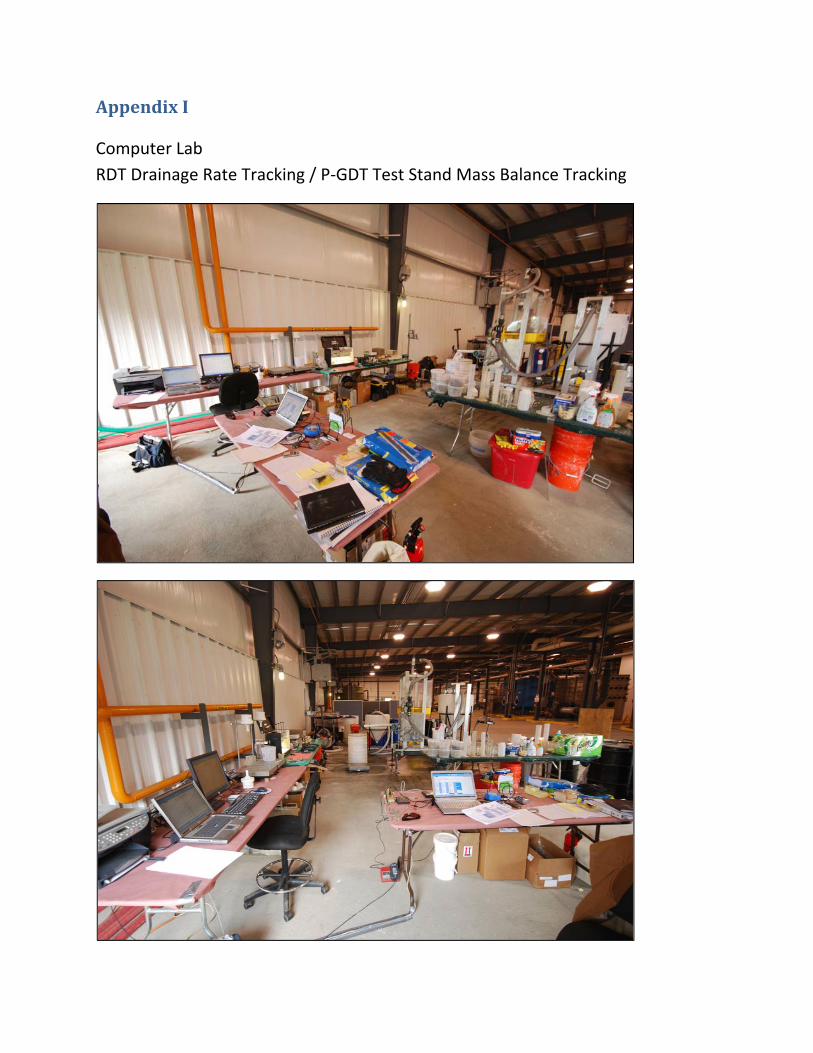
Appendix I
Computer Lab
RDT Drainage Rate Tracking / P‐GDT Test Stand Mass Balance Tracking
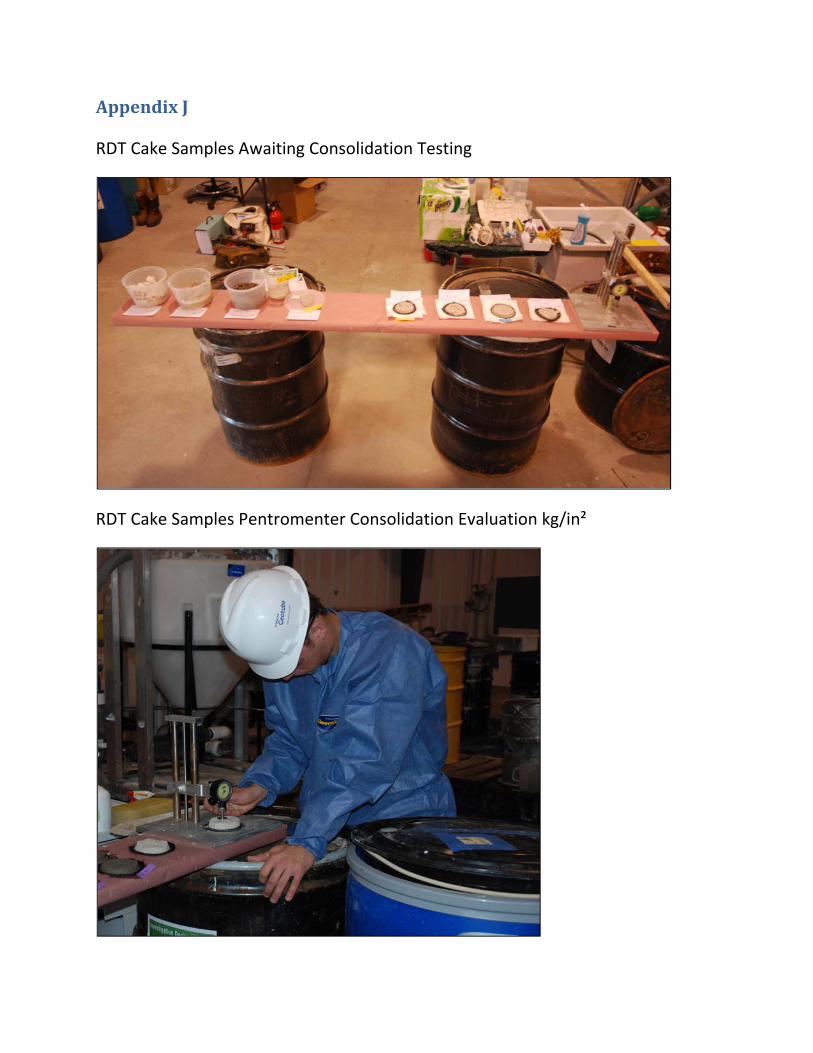
Appendix J
RDT Cake Samples Awaiting Consolidation Testing
RDT Cake Samples Pentromenter Consolidation Evaluation kg/in²
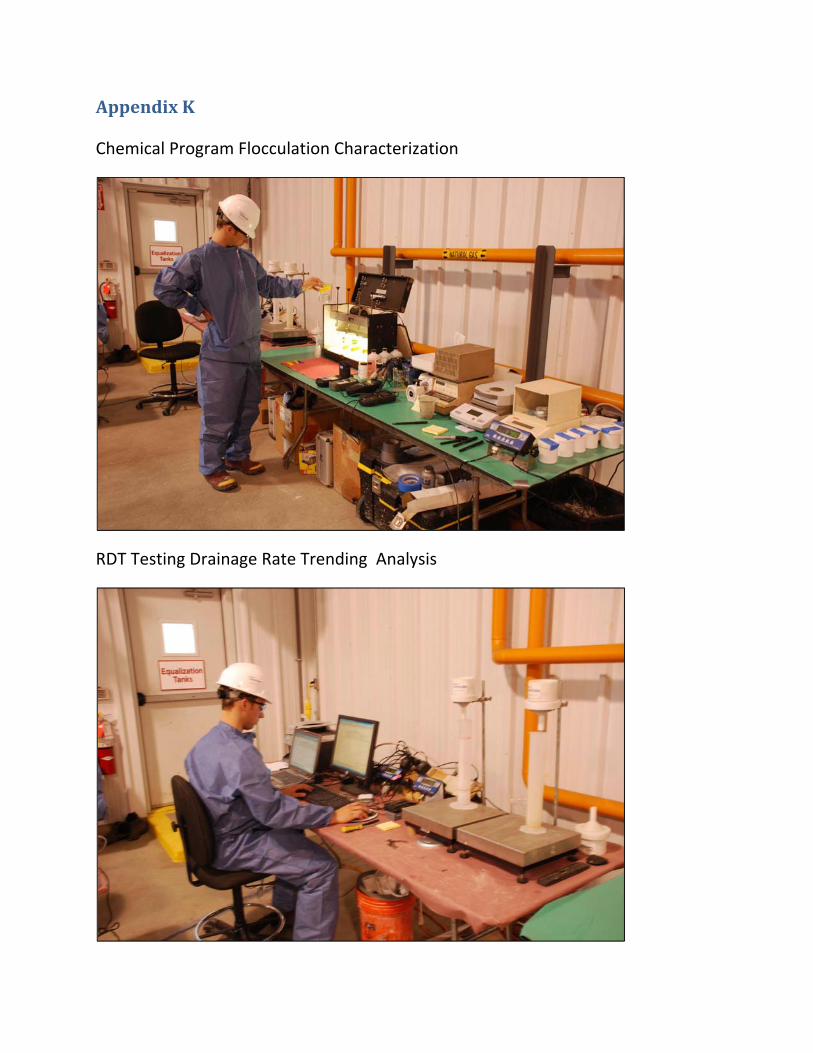
Appendix K
Chemical Program Flocculation Characterization
RDT Testing Drainage Rate Trending Analysis
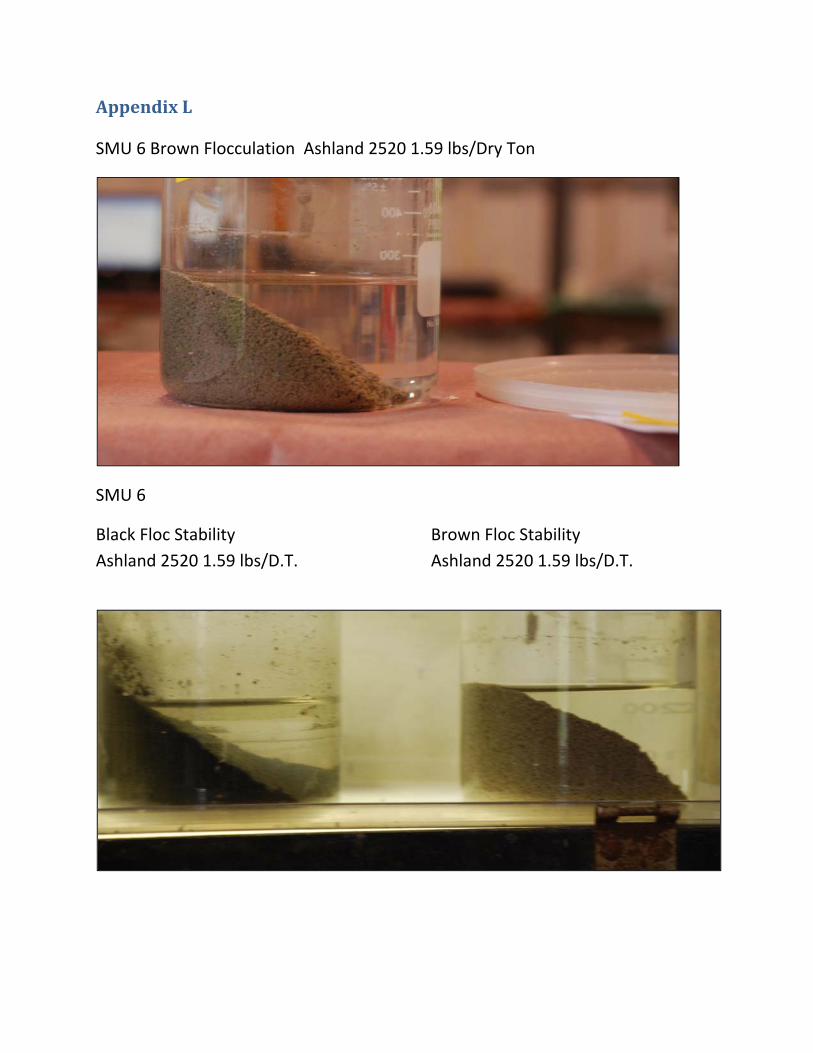
Appendix L
SMU 6 Brown Flocculation Ashland 2520 1.59 lbs/Dry Ton
SMU 6
Black Floc Stability Brown Floc Stability
Ashland 2520 1.59 lbs/D.T. Ashland 2520 1.59 lbs/D.T.
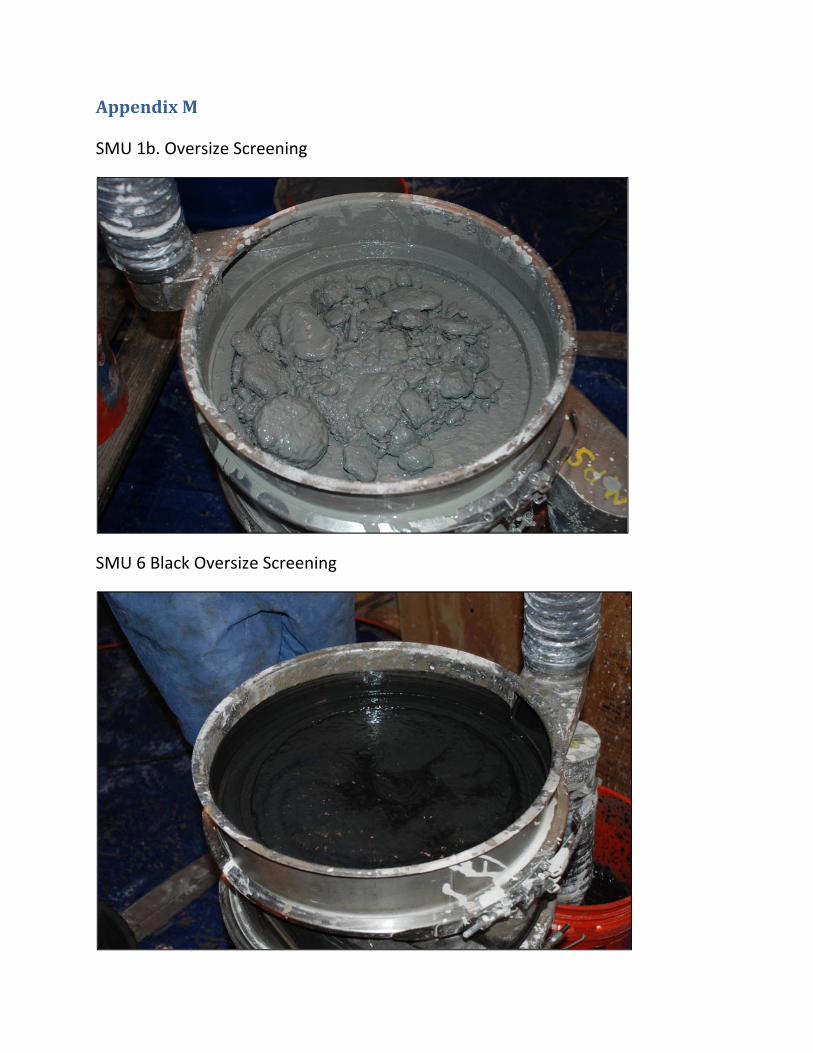
Appendix M
SMU 1b. Oversize Screening
SMU 6 Black Oversize Screening
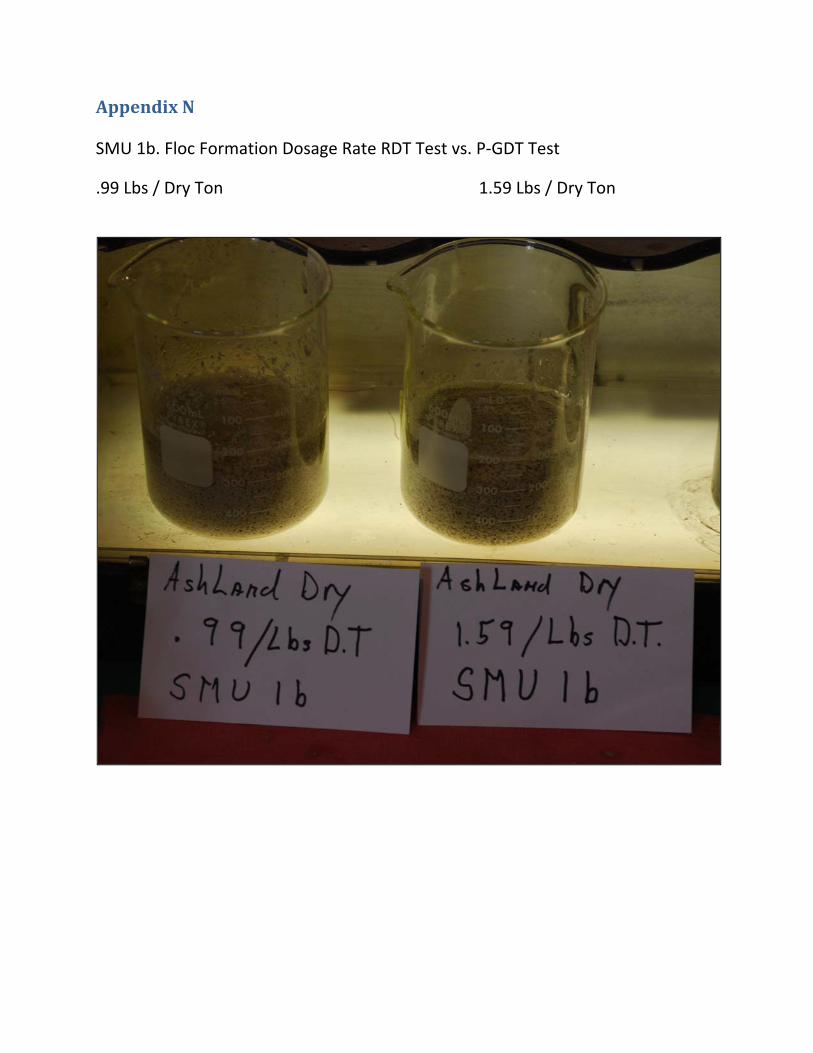
Appendix N
SMU 1b. Floc Formation Dosage Rate RDT Test vs. P‐GDT Test
.99 Lbs / Dry Ton 1.59 Lbs / Dry Ton
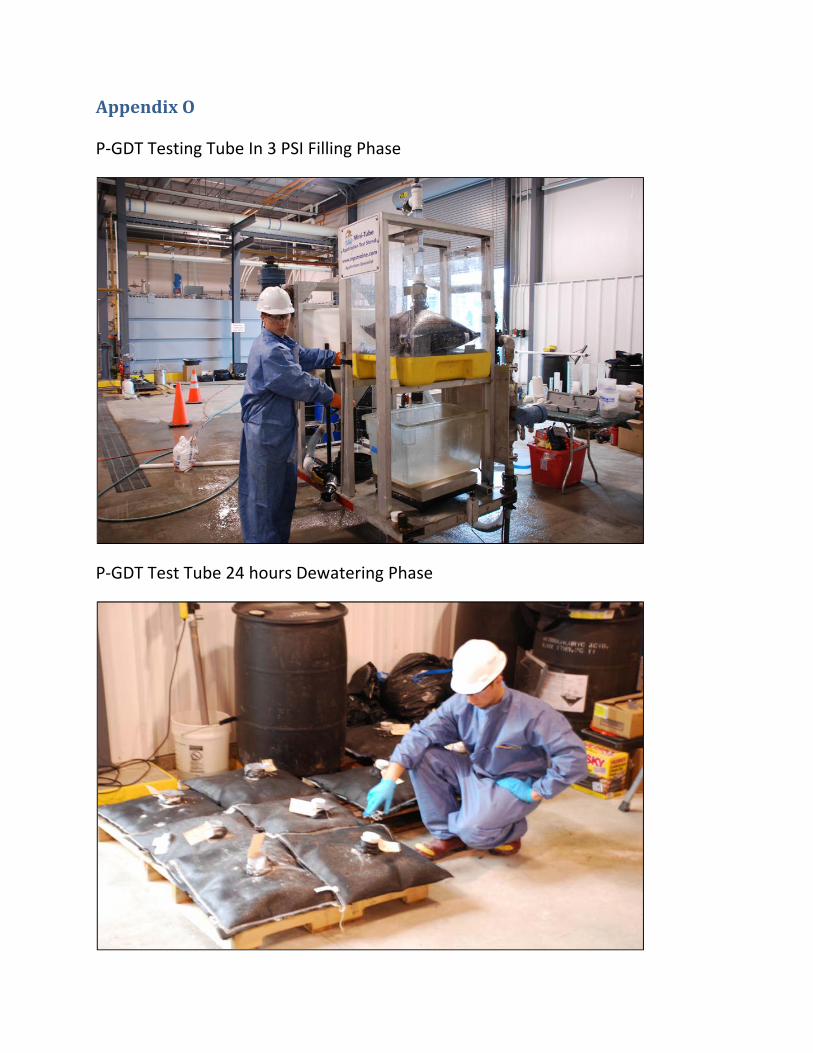
Appendix O
P‐GDT Testing Tube In 3 PSI Filling Phase
P‐GDT Test Tube 24 hours Dewatering Phase
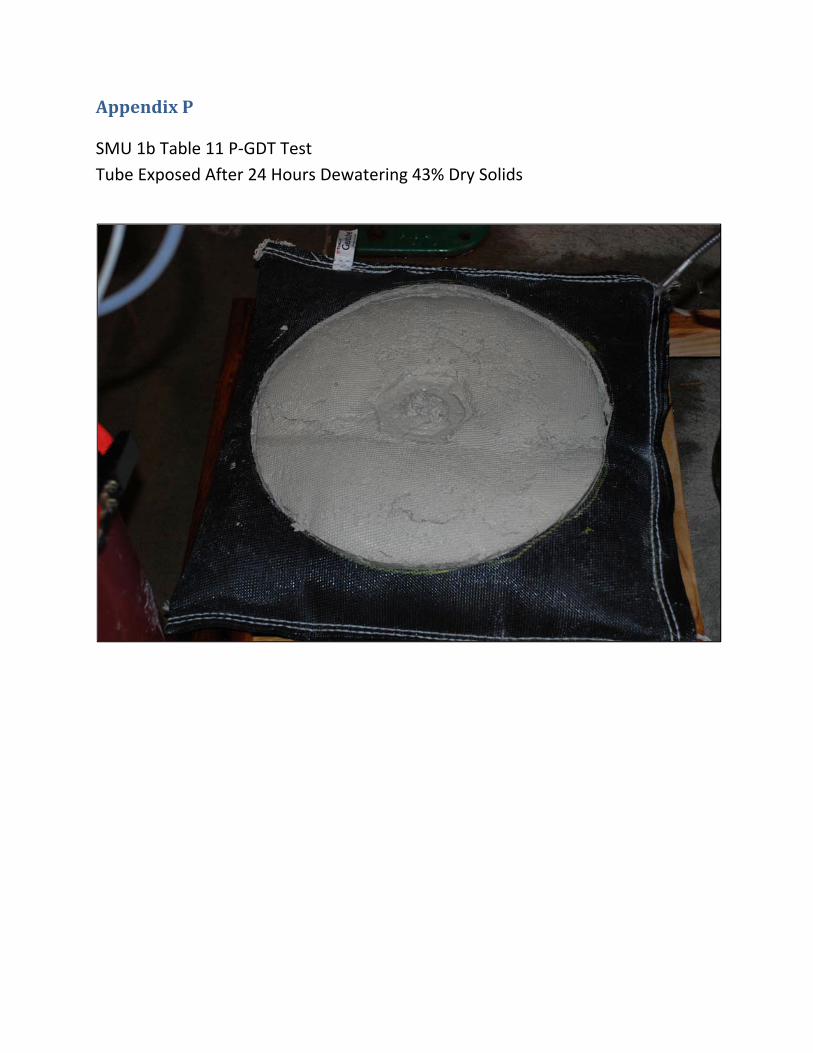
Appendix P
SMU 1b Table 11 P‐GDT Test
Tube Exposed After 24 Hours Dewatering 43% Dry Solids
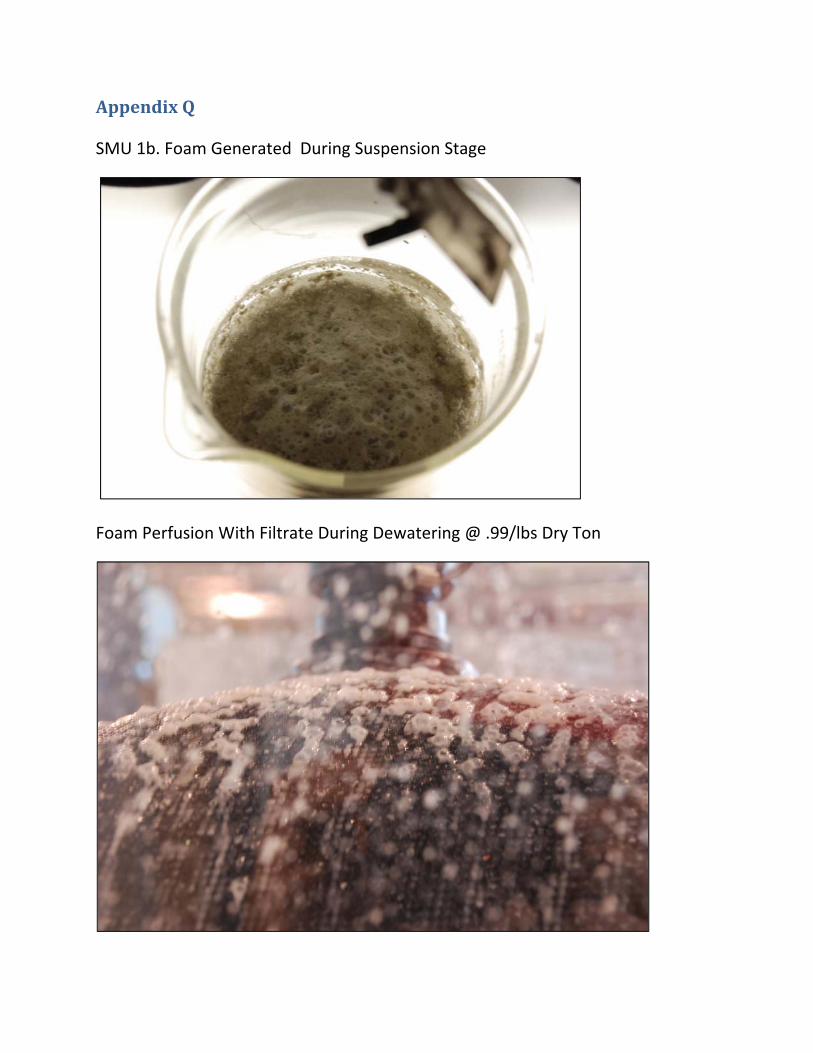
Appendix Q
SMU 1b. Foam Generated During Suspension Stage
Foam Perfusion With Filtrate During Dewatering @ .99/lbs Dry Ton

Tables
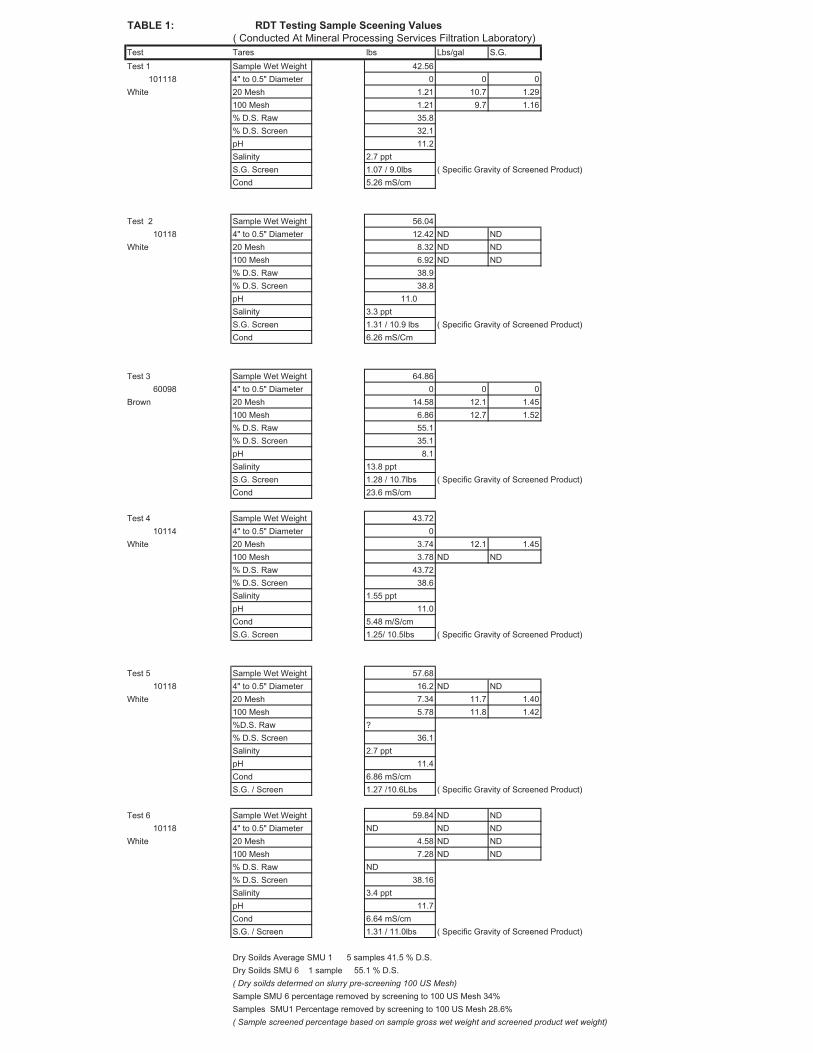
TABLE 1: RDT Testing Sample Sceening Values
( Conducted At Mineral Processing Services Filtration Laboratory)
Test Tares lbs Lbs/gal S.G.
Test 1 Sample Wet Weight 42.56
101118 4" to 0.5" Diameter 0 0 0
White 20 Mesh 1.21 10.7 1.29
100 Mesh 1.21 9.7 1.16
% D.S. Raw 35.8
% D.S. Screen 32.1
pH 11.2
Salinity 2.7 ppt
S.G. Screen 1.07 / 9.0lbs ( Specific Gravity of Screened Product)
Cond 5.26 mS/cm
Test 2 Sample Wet Weight 56.04
10118 4" to 0.5" Diameter 12.42 ND ND
White 20 Mesh 8.32 ND ND
100 Mesh 6.92 ND ND
% D.S. Raw 38.9
% D.S. Screen 38.8
pH 11.0
Salinity 3.3 ppt
S.G. Screen 1.31 / 10.9 lbs ( Specific Gravity of Screened Product)
Cond 6.26 mS/Cm
Test 3 Sample Wet Weight 64.86
60098 4" to 0.5" Diameter 0 0 0
Brown 20 Mesh 14.58 12.1 1.45
100 Mesh 6.86 12.7 1.52
% D.S. Raw 55.1
% D.S. Screen 35.1
pH 8.1
Salinity 13.8 ppt
S.G. Screen 1.28 / 10.7lbs ( Specific Gravity of Screened Product)
Cond 23.6 mS/cm
Test 4 Sample Wet Weight 43.72
10114 4" to 0.5" Diameter 0
White 20 Mesh 3.74 12.1 1.45
100 Mesh 3.78 ND ND
% D.S. Raw 43.72
% D.S. Screen 38.6
Salinity 1.55 ppt
pH 11.0
Cond 5.48 m/S/cm
S.G. Screen 1.25/ 10.5lbs ( Specific Gravity of Screened Product)
Test 5 Sample Wet Weight 57.68
10118 4" to 0.5" Diameter 16.2 ND ND
White 20 Mesh 7.34 11.7 1.40
100 Mesh 5.78 11.8 1.42
%D.S. Raw ?
% D.S. Screen 36.1
Salinity 2.7 ppt
pH 11.4
Cond 6.86 mS/cm
S.G. / Screen 1.27 /10.6Lbs ( Specific Gravity of Screened Product)
Test 6 Sample Wet Weight 59.84 ND ND
10118 4" to 0.5" Diameter ND ND ND
White 20 Mesh 4.58 ND ND
100 Mesh 7.28 ND ND
% D.S. Raw ND
% D.S. Screen 38.16
Salinity 3.4 ppt
pH 11.7
Cond 6.64 mS/cm
S.G. / Screen 1.31 / 11.0lbs ( Specific Gravity of Screened Product)
Dry Soilds Average SMU 1 5 samples 41.5 % D.S.
Dry Soilds SMU 6 1 sample 55.1 % D.S.
( Dry soilds determed on slurry pre-screening 100 US Mesh)
Sample SMU 6 percentage removed by screening to 100 US Mesh 34%
Samples SMU1 Percentage removed by screening to 100 US Mesh 28.6%
( Sample screened percentage based on sample gross wet weight and screened product wet weight)
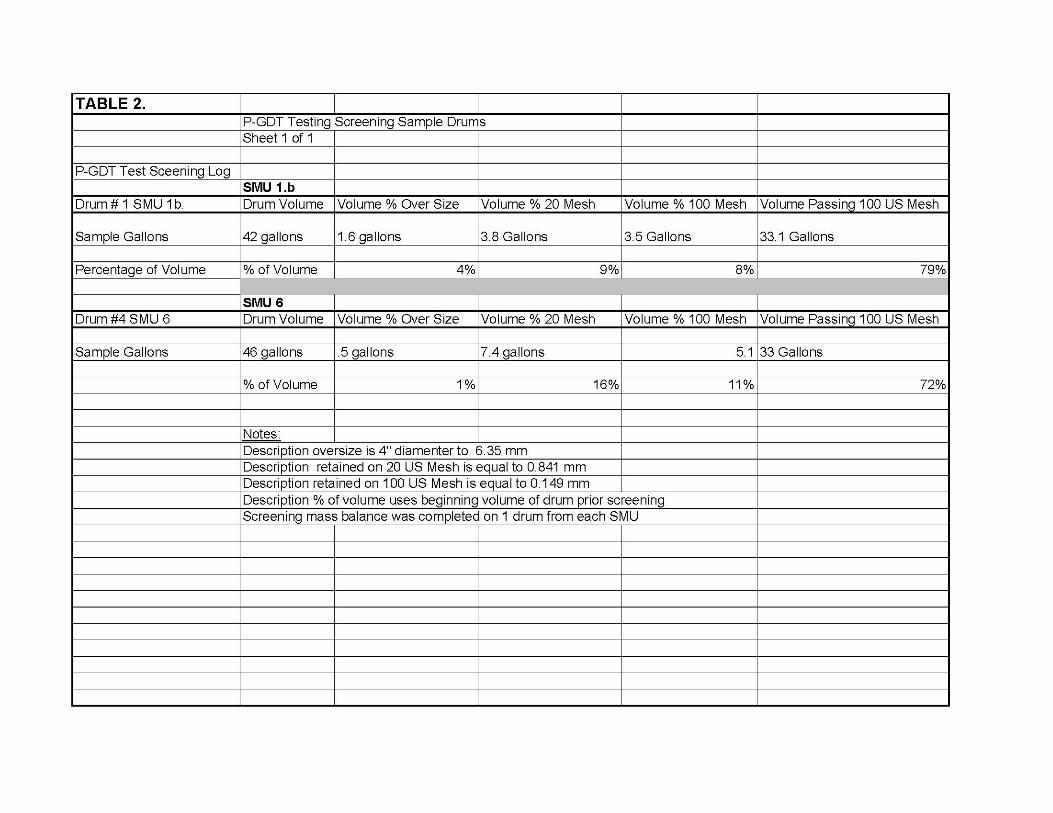
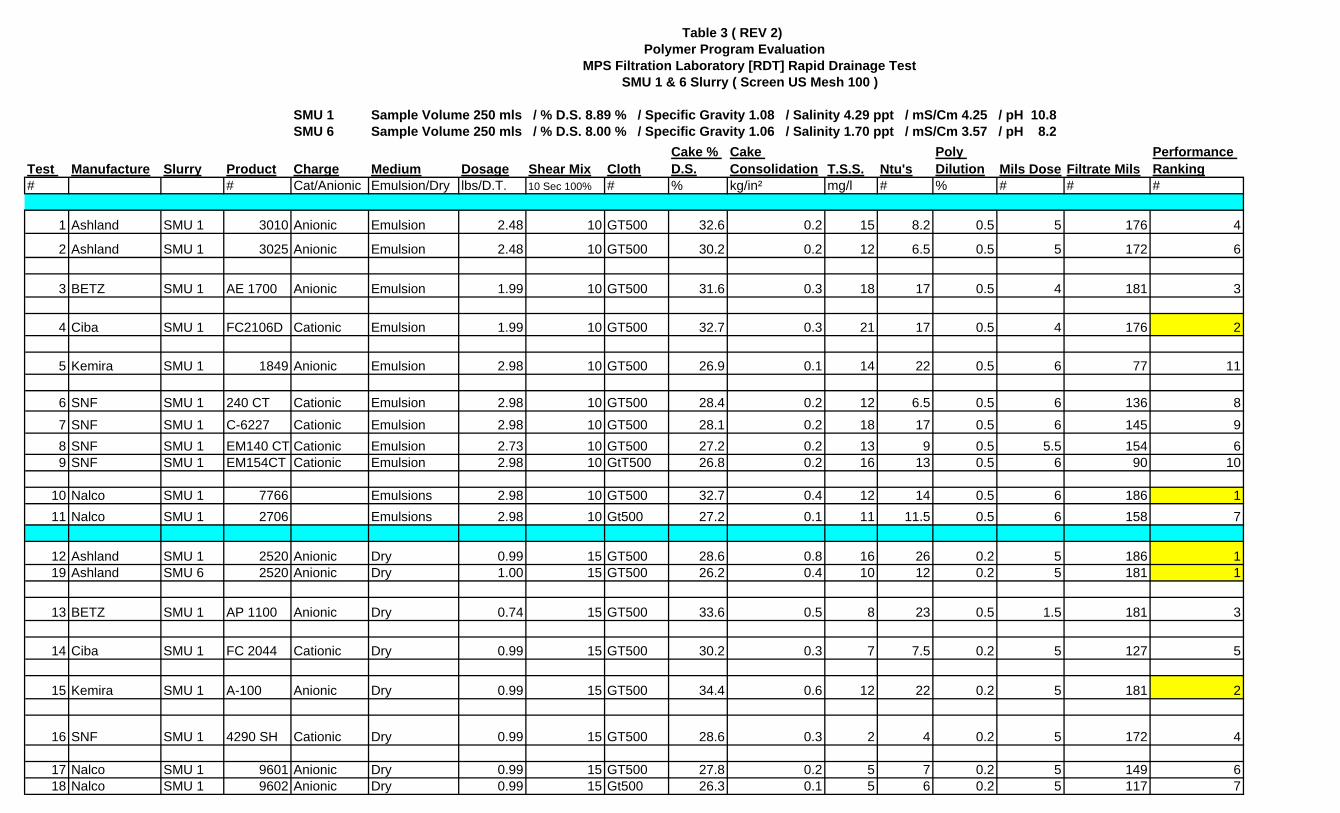
Table 3 ( REV 2) Polymer Program Evaluation
MPS Filtration Laboratory [RDT] Rapid Drainage Test SMU 1 & 6 Slurry ( Screen US Mesh 100 )
SMU 1 Sample Volume 250 mls / % D.S. 8.89 % / Specific Gravity 1.08 / Salinity 4.29 ppt / mS/Cm 4.25 / pH 10.8 SMU 6 Sample Volume 250 mls / % D.S. 8.00 % / Specific Gravity 1.06 / Salinity 1.70 ppt / mS/Cm 3.57 / pH 8.2
Test Manufacture Slurry Product Charge Medium Dosage Shear Mix ClothCake % D.S.
Cake Consolidation T.S.S. Ntu's
Poly Dilution Mils Dose Filtrate Mils
Performance Ranking
# # Cat/Anionic Emulsion/Dry lbs/D.T. 10 Sec 100% # % kg/in² mg/l # % # # #
1 Ashland SMU 1 3010 Anionic Emulsion 2.48 10 GT500 32.6 0.2 15 8.2 0.5 5 176 4
2 Ashland SMU 1 3025 Anionic Emulsion 2.48 10 GT500 30.2 0.2 12 6.5 0.5 5 172 6
3 BETZ SMU 1 AE 1700 Anionic Emulsion 1.99 10 GT500 31.6 0.3 18 17 0.5 4 181 3
4 Ciba SMU 1 FC2106D Cationic Emulsion 1.99 10 GT500 32.7 0.3 21 17 0.5 4 176 2
5 Kemira SMU 1 1849 Anionic Emulsion 2.98 10 GT500 26.9 0.1 14 22 0.5 6 77 11
6 SNF SMU 1 240 CT Cationic Emulsion 2.98 10 GT500 28.4 0.2 12 6.5 0.5 6 136 8
7 SNF SMU 1 C-6227 Cationic Emulsion 2.98 10 GT500 28.1 0.2 18 17 0.5 6 145 98 SNF SMU 1 EM140 CT Cationic Emulsion 2.73 10 GT500 27.2 0.2 13 9 0.5 5.5 154 69 SNF SMU 1 EM154CT Cationic Emulsion 2.98 10 GtT500 26.8 0.2 16 13 0.5 6 90 10
10 Nalco SMU 1 7766 Emulsions 2.98 10 GT500 32.7 0.4 12 14 0.5 6 186 111 Nalco SMU 1 2706 Emulsions 2.98 10 Gt500 27.2 0.1 11 11.5 0.5 6 158 7
12 Ashland SMU 1 2520 Anionic Dry 0.99 15 GT500 28.6 0.8 16 26 0.2 5 186 119 Ashland SMU 6 2520 Anionic Dry 1.00 15 GT500 26.2 0.4 10 12 0.2 5 181 1
13 BETZ SMU 1 AP 1100 Anionic Dry 0.74 15 GT500 33.6 0.5 8 23 0.5 1.5 181 3
14 Ciba SMU 1 FC 2044 Cationic Dry 0.99 15 GT500 30.2 0.3 7 7.5 0.2 5 127 5
15 Kemira SMU 1 A-100 Anionic Dry 0.99 15 GT500 34.4 0.6 12 22 0.2 5 181 2
16 SNF SMU 1 4290 SH Cationic Dry 0.99 15 GT500 28.6 0.3 2 4 0.2 5 172 4
17 Nalco SMU 1 9601 Anionic Dry 0.99 15 GT500 27.8 0.2 5 7 0.2 5 149 618 Nalco SMU 1 9602 Anionic Dry 0.99 15 Gt500 26.3 0.1 5 6 0.2 5 117 7
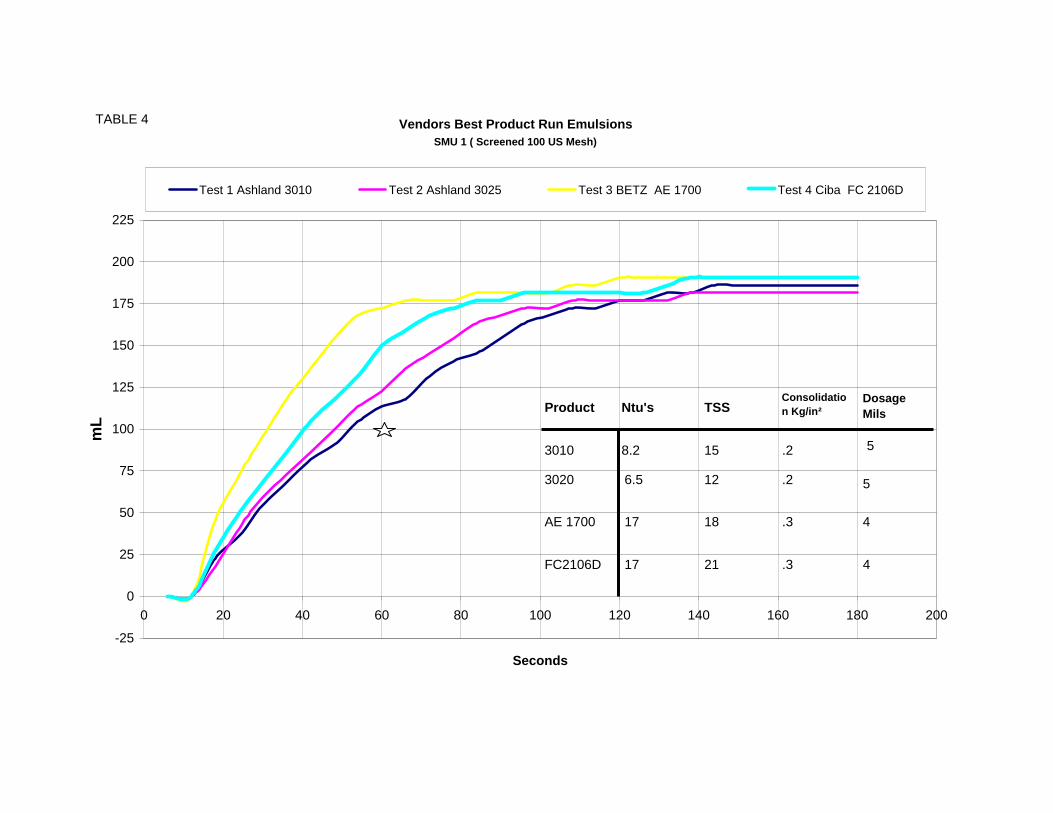
Vendors Best Product Run EmulsionsSMU 1 ( Screened 100 US Mesh)
-25
0
25
50
75
100
125
150
175
200
225
0 20 40 60 80 100 120 140 160 180 200
Seconds
mL
Test 1 Ashland 3010 Test 2 Ashland 3025 Test 3 BETZ AE 1700 Test 4 Ciba FC 2106D
.2
Product Ntu's TSS
3010 8.2 15
3020 6.5 12 .2
AE 1700 17 18
FC2106D
.3
17 21 .3
Consolidation Kg/in²
DosageMils
5
4
4
5
TABLE 4
Vendors Best Products Run EmulsionsSMU 1 ( Screened 100 US Mesh)
-25
0
25
50
75
100
125
150
175
0 20 40 60 80 100 120 140 160 180 200
Seconds
mL
Test 5 Kemira 1849 Test 6 SNF 240 CT Test 7 SNF C-6227 Test 8 SNF EM140 CT
.1
Product Ntu's TSS
1849 22 14
240 CT 6.5 12 .2
C-6227 17 18
EM 140 CT
.2
9 13 .2
Consolidation Kg/in²
DosageMils
6
6
6
5.5
TABLE 5
Vendors Best Products Run EmulsionsSMU 1 ( Screened 100 US Mesh)
0
25
50
75
100
125
150
175
200
0 20 40 60 80 100 120 140 160 180 200
Seconds
mL
Test 9 SNF EM154CT Test 10 Nalco 7766 Test 11 Nalco 2706 Series4
.2
Product Ntu's TSS
EM154CT 13 16
7766 12 14 .4
2706 11.5 11 .1
Consolidation Kg/in²
DosageMils
6
6
6
TABLE 6
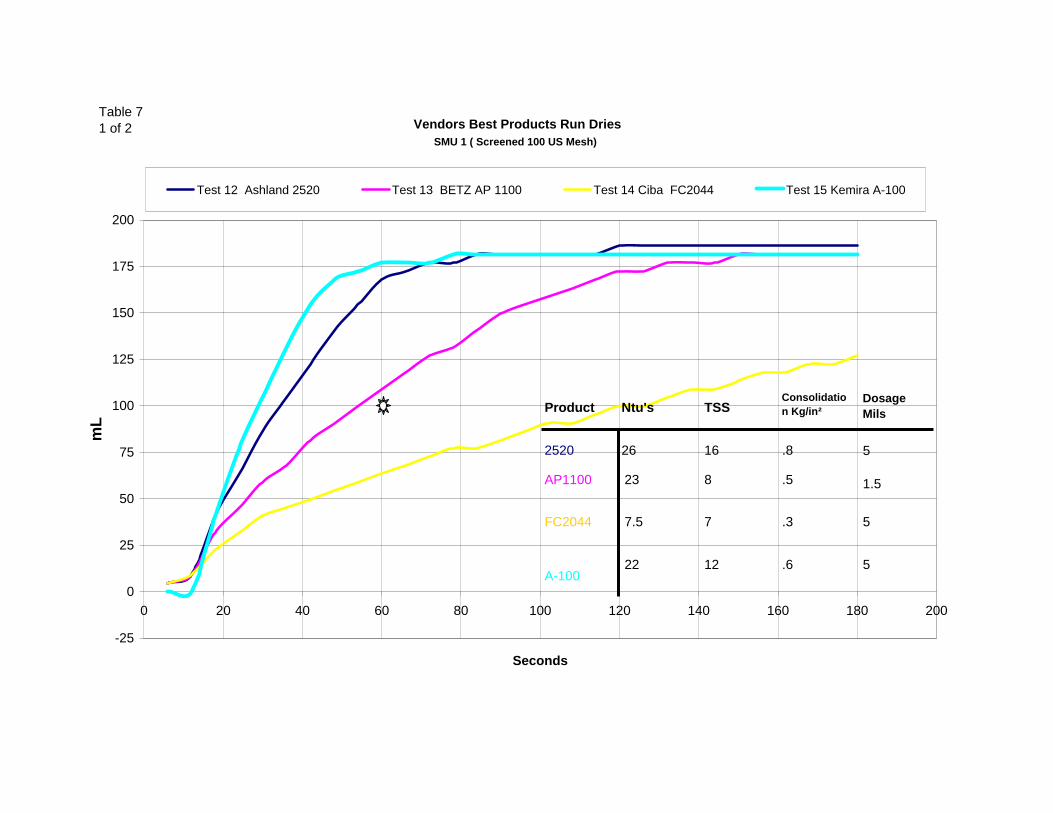
Vendors Best Products Run DriesSMU 1 ( Screened 100 US Mesh)
-25
0
25
50
75
100
125
150
175
200
0 20 40 60 80 100 120 140 160 180 200
Seconds
mL
Test 12 Ashland 2520 Test 13 BETZ AP 1100 Test 14 Ciba FC2044 Test 15 Kemira A-100
.8
Product Ntu's TSS
2520 26 16
AP1100 23 8 .5
FC2044 7.5 7
A-100
.3
22 12 .6
Consolidation Kg/in²
DosageMils
5
1.5
5
5
Table 7 1 of 2
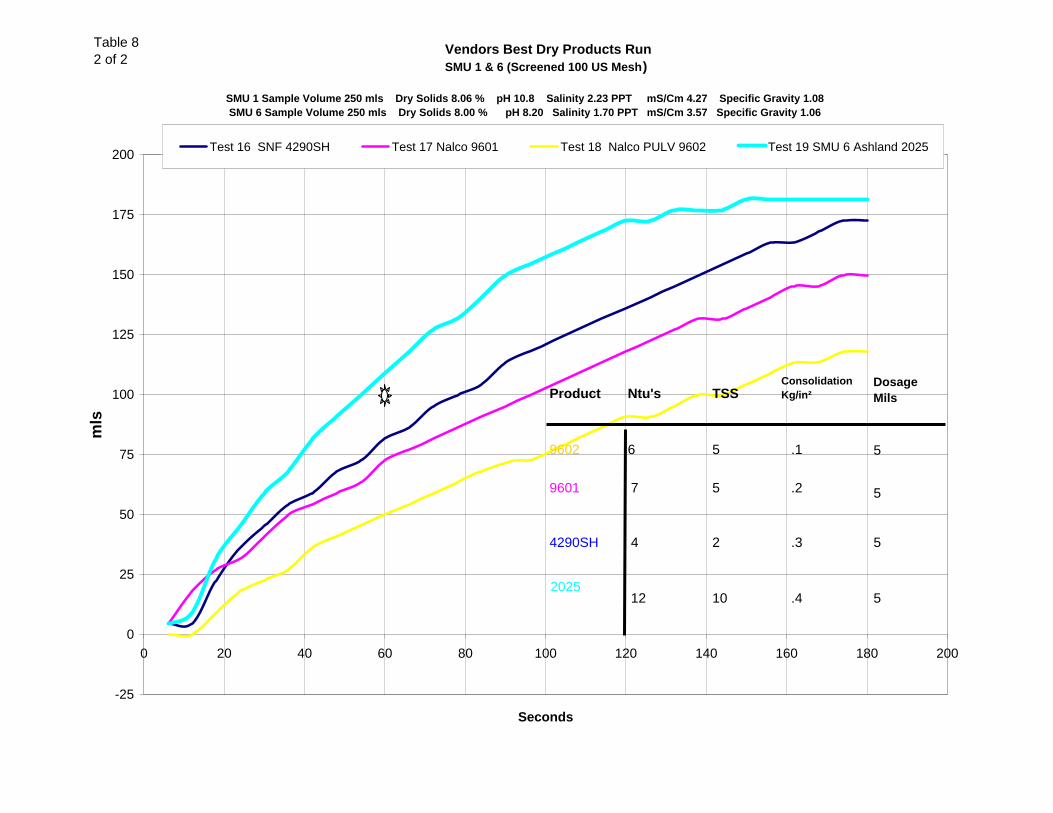
SMU 1 Sample Volume 250 mls Dry Solids 8.06 % pH 10.8 Salinity 2.23 PPT mS/Cm 4.27 Specific Gravity 1.08SMU 6 Sample Volume 250 mls Dry Solids 8.00 % pH 8.20 Salinity 1.70 PPT mS/Cm 3.57 Specific Gravity 1.06
-25
0
25
50
75
100
125
150
175
200
0 20 40 60 80 100 120 140 160 180 200
Seconds
mls
Test 16 SNF 4290SH Test 17 Nalco 9601 Test 18 Nalco PULV 9602 Test 19 SMU 6 Ashland 2025
.1
Product Ntu's TSS
9602 6 5
9601 7 5 .2
4290SH 4 2
2025
.3
12 10 .4
Consolidation Kg/in²
DosageMils
5
5
5
5
Table 82 of 2
Vendors Best Dry Products Run SMU 1 & 6 (Screened 100 US Mesh)
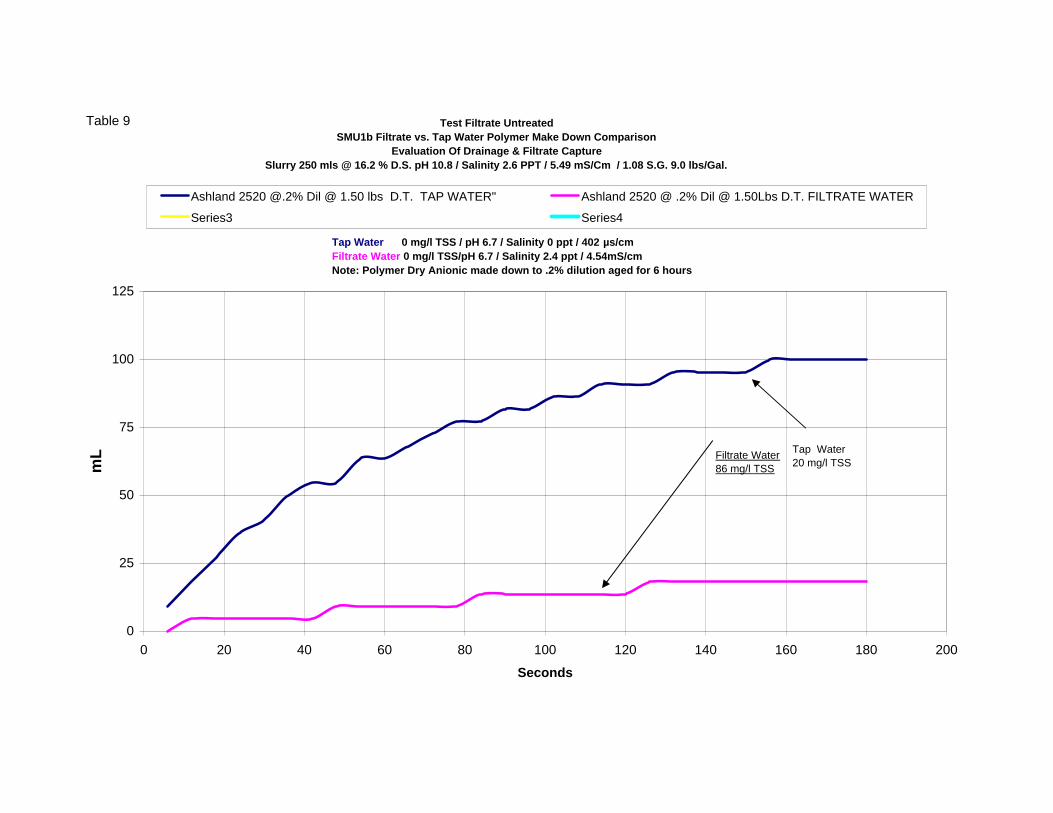
Test Filtrate Untreated SMU1b Filtrate vs. Tap Water Polymer Make Down Comparison
Evaluation Of Drainage & Filtrate CaptureSlurry 250 mls @ 16.2 % D.S. pH 10.8 / Salinity 2.6 PPT / 5.49 mS/Cm / 1.08 S.G. 9.0 lbs/Gal.
0
25
50
75
100
125
0 20 40 60 80 100 120 140 160 180 200
Seconds
mL
Ashland 2520 @.2% Dil @ 1.50 lbs D.T. TAP WATER" Ashland 2520 @ .2% Dil @ 1.50Lbs D.T. FILTRATE WATER
Series3 Series4
Filtrate Water86 mg/l TSS
Tap Water 0 mg/l TSS / pH 6.7 / Salinity 0 ppt / 402 µs/cmFiltrate Water 0 mg/l TSS/pH 6.7 / Salinity 2.4 ppt / 4.54mS/cm Note: Polymer Dry Anionic made down to .2% dilution aged for 6 hours
Tap Water20 mg/l TSS
Table 9
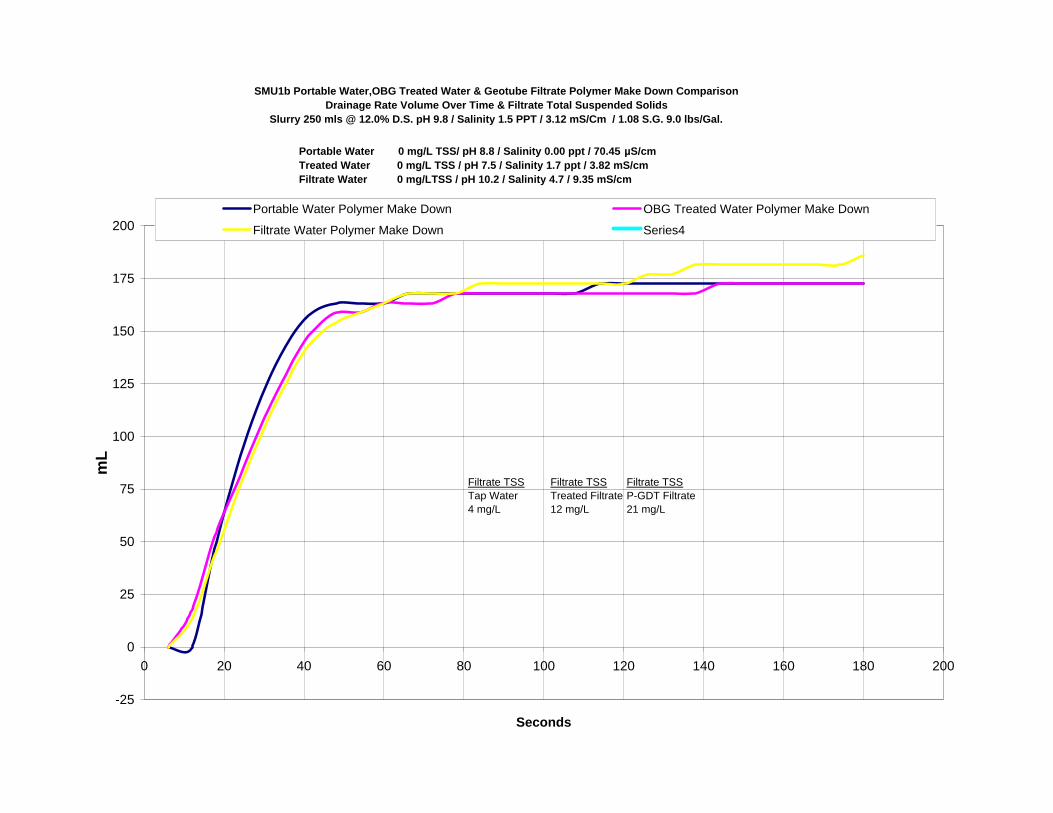
SMU1b Portable Water,OBG Treated Water & Geotube Filtrate Polymer Make Down ComparisonDrainage Rate Volume Over Time & Filtrate Total Suspended Solids
Slurry 250 mls @ 12.0% D.S. pH 9.8 / Salinity 1.5 PPT / 3.12 mS/Cm / 1.08 S.G. 9.0 lbs/Gal.
-25
0
25
50
75
100
125
150
175
200
0 20 40 60 80 100 120 140 160 180 200
Seconds
mL
Portable Water Polymer Make Down OBG Treated Water Polymer Make Down
Filtrate Water Polymer Make Down Series4
Filtrate TSSP-GDT Filtrate21 mg/L
Portable Water 0 mg/L TSS/ pH 8.8 / Salinity 0.00 ppt / 70.45 µS/cmTreated Water 0 mg/L TSS / pH 7.5 / Salinity 1.7 ppt / 3.82 mS/cmFiltrate Water 0 mg/LTSS / pH 10.2 / Salinity 4.7 / 9.35 mS/cm
Filtrate TSSTap Water4 mg/L
Filtrate TSSTreated Filtrate12 mg/L

P-GDT TEST Pressurized Gravity Dewatering Test Table 11Project : Parsons Geotube® P-GDT Test 1 Comments:Slurry Type: SMU 1b TenCate Fabric Testing GT500Customer: Parsons Dry Polymer Ashland 2520Date: May 8th 2009Test Tracking Code Line 11
Values Totals Values Avg1st Void Fill Phase 2nd Void Fill Phase 3rd Void Fill Phase 1st Fill Phase Processed Mass Lbs 109.23 Processed Mass Lbs 14.31 Processed Mass Lbs 10.12 133.66Filtrate Lbs 12.00 Filtrate Lbs 8.60 Filtrate Lbs 6.02 26.62Tube Mass Retained M1 97.23 Tube Mass Retained M1 5.71 Tube Mass Retained M1 4.10 107.04Processed Gallons 10.88 Processed Gallons 1.43 Processed Gallons 0.99 13.30Filtrate Gallons 1.44 Filtrate Gallons 1.03 Filtrate Gallons 0.72 3.19Tube Gallons Retained 9.44 Tube Gallons Retained 0.40 Tube Gallons Retained 0.27 10.11% Dry Solids Raw 12.10 % Dry Solids Raw 12.10 % Dry Solids Raw 12.10 12.10Dry Solids Retained /1ft³ M2 12.90 Dry Solids Retained /1ft³ M2 1.70 Dry Solids Retained /1ft³ M2 1.17 15.77T.S.S. 28.00 T.S.S. 26.00 T.S.S. 24.00 26.00Ntu's 49.00 Ntu's 48.00 Ntu's 45.00 47.33pH 11.10 pH 11.00 pH 10.80 10.97Conductivity mS/cm 4.40 Conductivity mS/cm 5.76 Conductivity mS/cm 5.76 5.31Salinity ppt 3.10 Salinity ppt 2.70 Salinity ppt 2.70 2.83Slurry Density lbs/gal calc 10.04 Slurry Density lbs/gal calc 10.01 Slurry Density lbs/gal calc 10.22 10.09Slurry Density lbs/gal lab scale 9.80 Slurry Density lbs/gal lab scale 9.80 Slurry Density lbs/gal lab scale 9.80Chemical Dose Anonic lbs/dt 1.59 Chemical Dose Anonic lbs/dt 1.59 Chemical Dose Anonic lbs/dt 1.59 1.59Chemical Dose Catonic Chemical Dose Catonic Chemical Dose CatonicChemical Dose Agent Chemical Dose Agent Chemical Dose AgentOdor Level Odor Level Odor LevelPolymer Vendor Ashland Polymer Vendor Ashland Polymer Vendor AshlandFabric Vendor GT 500 Fabric Vendor GT500 Fabric Vendor GT500
24/hr Cake Density 10.7024/hr Cake S.g 1.2824/hr Cake % Dry Solids 43.601ft³ lbs 24hrs Dewatering 80.34Dry Solids Retained /1ft³ M3 35.03
Color legend: 1ft³ lbs End of Fill 92.00Wet lbs P-GDT test tube 1ft³ Method 1 M1 Penetrometer RDT Kg/in² 3.62Dry lbs 1ft³ Method 2 M2 Penetrometer P-GDT Kg/in² 0.90Dry lbs 1ft³ Method 3 M3 RDT T.S.S. 43.00
RDT Ntu's 45.70RDT Cake % Dry Solids 40.40
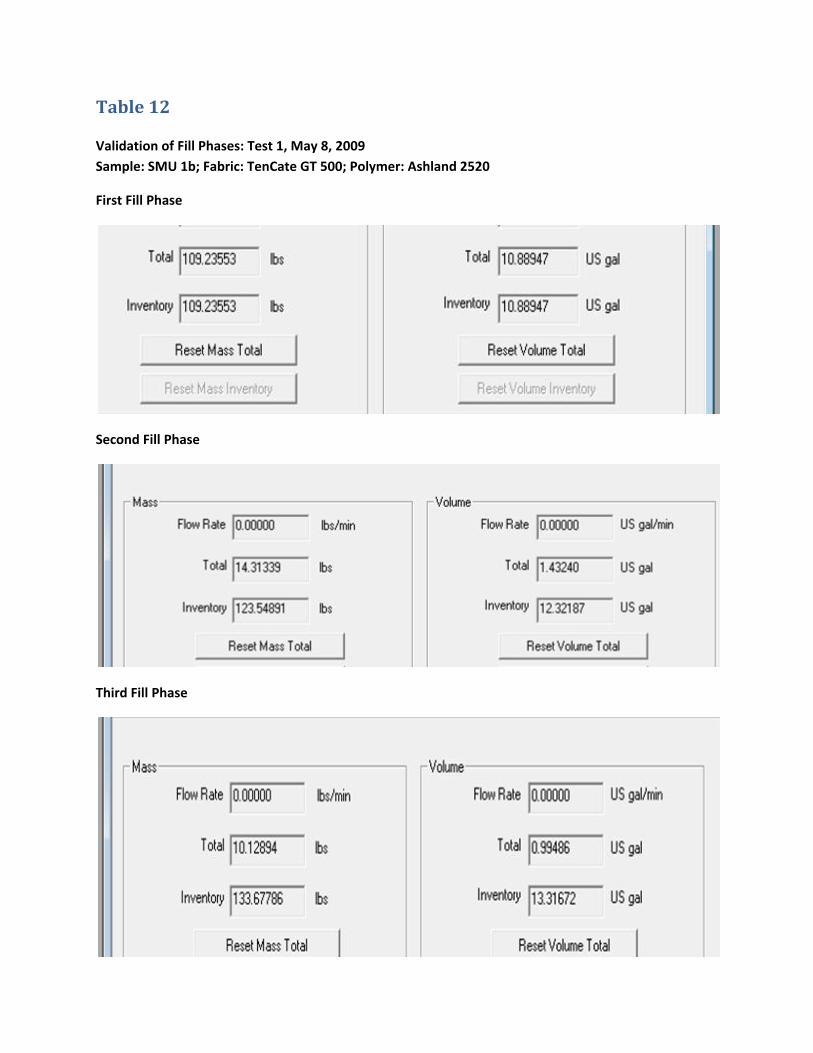
Table 12
Validation of Fill Phases: Test 1, May 8, 2009
Sample: SMU 1b; Fabric: TenCate GT 500; Polymer: Ashland 2520
First Fill Phase
Second Fill Phase
Third Fill Phase
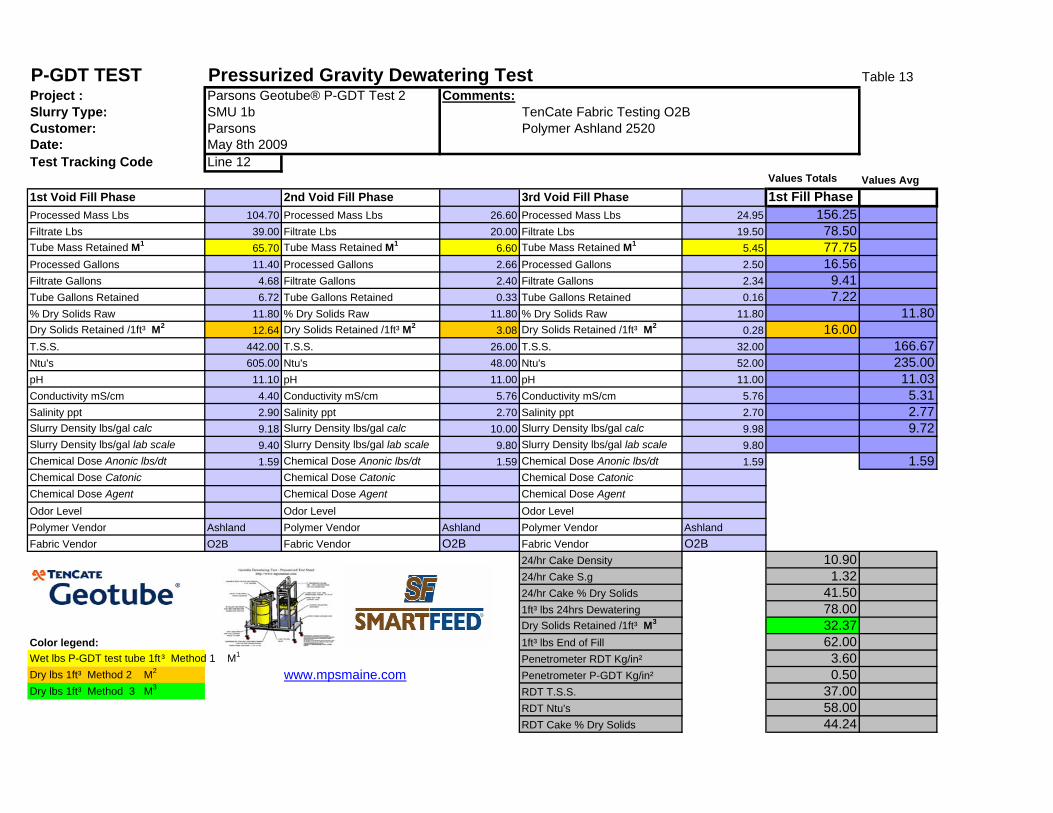
P-GDT TEST Pressurized Gravity Dewatering Test Table 13Project : Parsons Geotube® P-GDT Test 2 Comments:Slurry Type: SMU 1b TenCate Fabric Testing O2BCustomer: Parsons Polymer Ashland 2520Date: May 8th 2009Test Tracking Code Line 12
Values Totals Values Avg1st Void Fill Phase 2nd Void Fill Phase 3rd Void Fill Phase 1st Fill Phase Processed Mass Lbs 104.70 Processed Mass Lbs 26.60 Processed Mass Lbs 24.95 156.25Filtrate Lbs 39.00 Filtrate Lbs 20.00 Filtrate Lbs 19.50 78.50Tube Mass Retained M1 65.70 Tube Mass Retained M1 6.60 Tube Mass Retained M1 5.45 77.75Processed Gallons 11.40 Processed Gallons 2.66 Processed Gallons 2.50 16.56Filtrate Gallons 4.68 Filtrate Gallons 2.40 Filtrate Gallons 2.34 9.41Tube Gallons Retained 6.72 Tube Gallons Retained 0.33 Tube Gallons Retained 0.16 7.22% Dry Solids Raw 11.80 % Dry Solids Raw 11.80 % Dry Solids Raw 11.80 11.80Dry Solids Retained /1ft³ M2 12.64 Dry Solids Retained /1ft³ M2 3.08 Dry Solids Retained /1ft³ M2 0.28 16.00T.S.S. 442.00 T.S.S. 26.00 T.S.S. 32.00 166.67Ntu's 605.00 Ntu's 48.00 Ntu's 52.00 235.00pH 11.10 pH 11.00 pH 11.00 11.03Conductivity mS/cm 4.40 Conductivity mS/cm 5.76 Conductivity mS/cm 5.76 5.31Salinity ppt 2.90 Salinity ppt 2.70 Salinity ppt 2.70 2.77Slurry Density lbs/gal calc 9.18 Slurry Density lbs/gal calc 10.00 Slurry Density lbs/gal calc 9.98 9.72Slurry Density lbs/gal lab scale 9.40 Slurry Density lbs/gal lab scale 9.80 Slurry Density lbs/gal lab scale 9.80Chemical Dose Anonic lbs/dt 1.59 Chemical Dose Anonic lbs/dt 1.59 Chemical Dose Anonic lbs/dt 1.59 1.59Chemical Dose Catonic Chemical Dose Catonic Chemical Dose CatonicChemical Dose Agent Chemical Dose Agent Chemical Dose AgentOdor Level Odor Level Odor LevelPolymer Vendor Ashland Polymer Vendor Ashland Polymer Vendor AshlandFabric Vendor O2B Fabric Vendor O2B Fabric Vendor O2B
24/hr Cake Density 10.9024/hr Cake S.g 1.3224/hr Cake % Dry Solids 41.501ft³ lbs 24hrs Dewatering 78.00Dry Solids Retained /1ft³ M3 32.37
Color legend: 1ft³ lbs End of Fill 62.00Wet lbs P-GDT test tube 1ft³ Method 1 M1 Penetrometer RDT Kg/in² 3.60Dry lbs 1ft³ Method 2 M2 www.mpsmaine.com Penetrometer P-GDT Kg/in² 0.50Dry lbs 1ft³ Method 3 M3 RDT T.S.S. 37.00
RDT Ntu's 58.00RDT Cake % Dry Solids 44.24
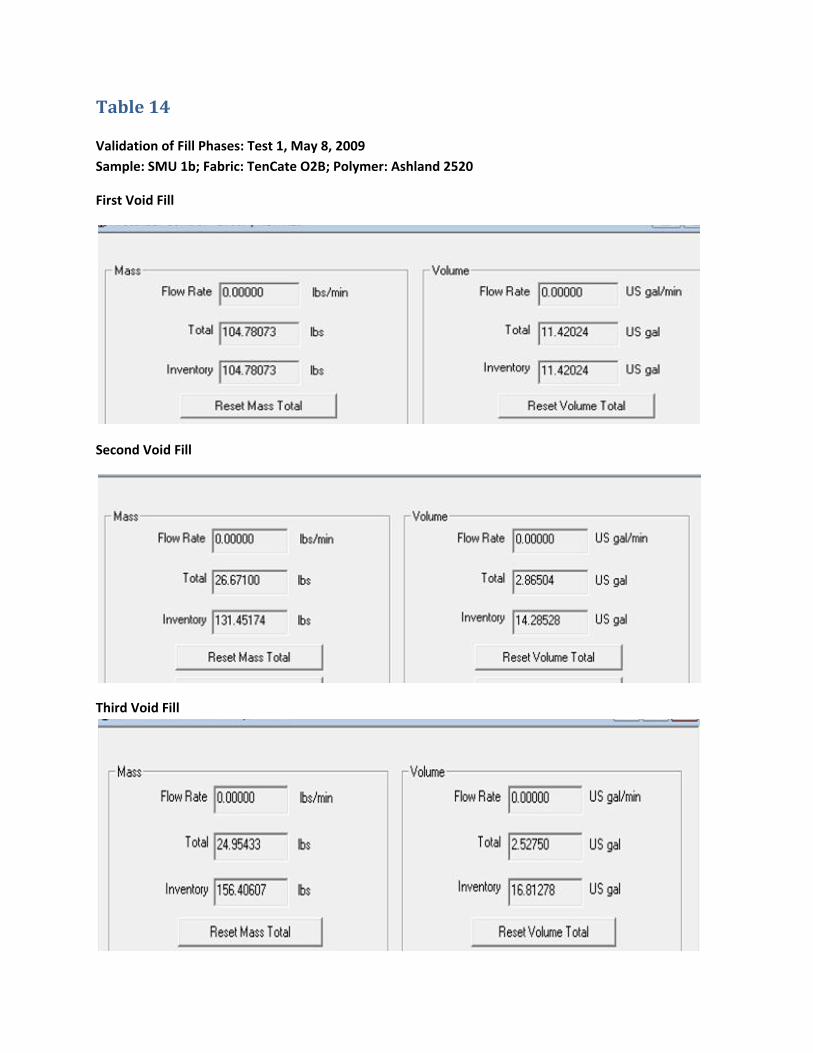
Table 14
Validation of Fill Phases: Test 1, May 8, 2009
Sample: SMU 1b; Fabric: TenCate O2B; Polymer: Ashland 2520
First Void Fill
Second Void Fill
Third Void Fill

P-GDT TEST Pressurized Gravity Dewatering Test Table 15Project : Parsons Geotube® P-GDT Test 3 Comments:Slurry Type: SMU 1b TenCate Fabric Testing O2FCustomer: Parsons Polymer Ashland 2520Date: May 9th 2009Test Tracking Code Line 13
Values Totals Values Avg1st Void Fill Phase 2nd Void Fill Phase 3rd Void Fill Phase 1st Fill Phase Processed Mass Lbs 108.94 Processed Mass Lbs 23.39 Processed Mass Lbs 13.38 145.71Filtrate Lbs 20.60 Filtrate Lbs 12.60 Filtrate Lbs 8.00 41.20Tube Mass Retained M1 88.34 Tube Mass Retained M1 10.79 Tube Mass Retained M1 5.38 104.51Processed Gallons 11.36 Processed Gallons 2.46 Processed Gallons 1.47 15.29Filtrate Gallons 2.47 Filtrate Gallons 1.51 Filtrate Gallons 0.96 4.94Tube Gallons Retained 8.89 Tube Gallons Retained 0.95 Tube Gallons Retained 0.51 10.35% Dry Solids Raw 12.10 % Dry Solids Raw 12.10 % Dry Solids Raw 12.10 12.10Dry Solids Retained /1ft³ M2 13.47 Dry Solids Retained /1ft³ M2 2.92 Dry Solids Retained /1ft³ M2 1.74 18.13T.S.S. 124.00 T.S.S. 116.00 T.S.S. 70.00 103.33Ntu's 167.00 Ntu's 155.00 Ntu's 78.00 133.33pH 11.20 pH 11.00 pH 10.80 11.00Conductivity mS/cm 4.52 Conductivity mS/cm 4.52 Conductivity mS/cm 4.52 4.52Salinity ppt 2.30 Salinity ppt 2.30 Salinity ppt 2.30 2.30Slurry Density lbs/gal calc 9.59 Slurry Density lbs/gal calc 9.51 Slurry Density lbs/gal calc 9.10 9.40Slurry Density lbs/gal lab scale 9.80 Slurry Density lbs/gal lab scale 9.80 Slurry Density lbs/gal lab scale 9.80Chemical Dose Anonic lbs/dt 1.59 Chemical Dose Anonic lbs/dt 1.59 Chemical Dose Anonic lbs/dt 1.59 1.59Chemical Dose Catonic Chemical Dose Catonic Chemical Dose CatonicChemical Dose Agent Chemical Dose Agent Chemical Dose AgentOdor Level Odor Level Odor LevelPolymer Vendor Ashland Polymer Vendor Ashland Polymer Vendor AshlandFabric Vendor TenCate O2F Fabric Vendor TenCate O2F Fabric Vendor TenCate O2F
24/hr Cake Density 10.6024/hr Cake S.g 1.2624/hr Cake % Dry Solids 38.101ft³ lbs 24hrs Dewatering 64.26Dry Solids Retained /1ft³ M3 24.48
Color legend: 1ft³ lbs End of Fill 78.00Wet lbs P-GDT test tube 1ft³ Method 1 M1 Penetrometer RDT Kg/in² 3.40Dry lbs 1ft³ Method 2 M2 www.mpsmaine.com Penetrometer P-GDT Kg/in² 0.40Dry lbs 1ft³ Method 3 M3 RDT T.S.S. 22.00
RDT Ntu's 18.80RDT Cake % Dry Solids 43.35
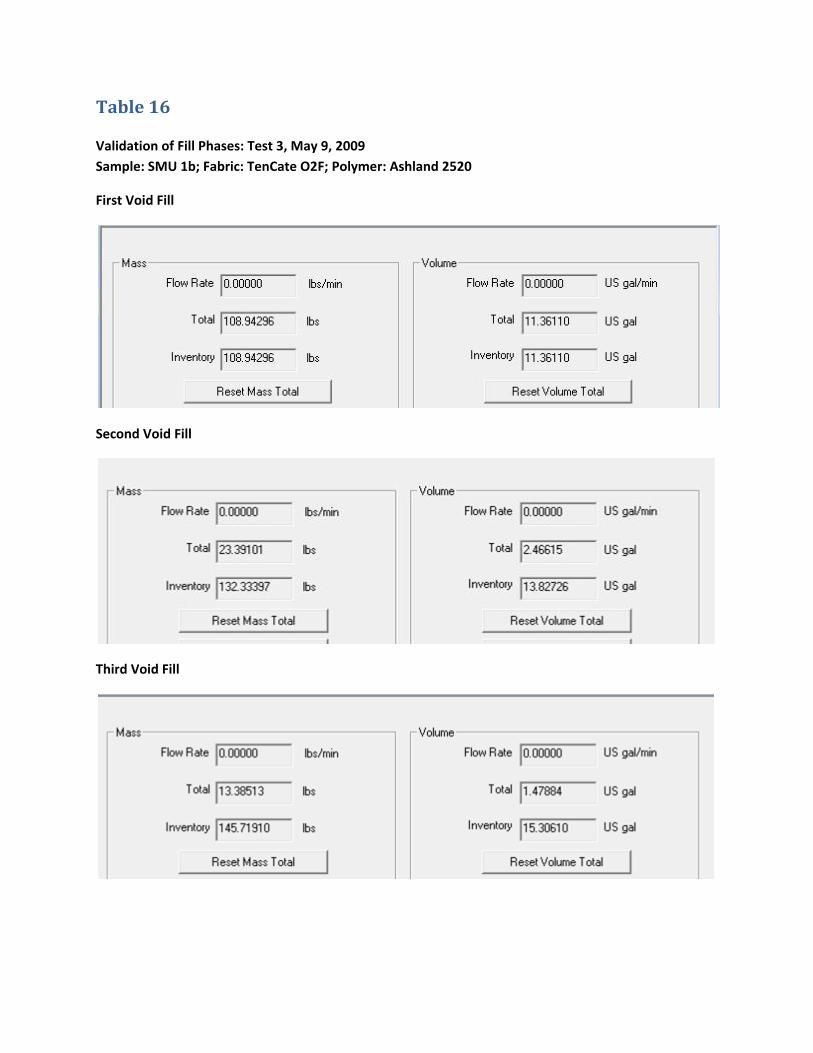
Table 16
Validation of Fill Phases: Test 3, May 9, 2009
Sample: SMU 1b; Fabric: TenCate O2F; Polymer: Ashland 2520
First Void Fill
Second Void Fill
Third Void Fill

P-GDT TEST Pressurized Gravity Dewatering Test Table 17Project : Parsons Geotube® P-GDT Test 4 Comments:Slurry Type: SMU 1b TenCate Fabric Testing GT500Customer: Parsons Polymer Kemira A-100Date: May 11th 2009
Values Totals Values Avg1st Void Fill Phase 2nd Void Fill Phase 3rd Void Fill Phase 1st Fill Phase Processed Mass Lbs 133.01 Processed Mass Lbs 26.45 Processed Mass Lbs 20.37 179.83Filtrate Lbs 32.44 Filtrate Lbs 11.44 Filtrate Lbs 12.74 56.62Tube Mass Retained M1 100.57 Tube Mass Retained M1 15.01 Tube Mass Retained M1 7.63 123.21Processed Gallons 13.88 Processed Gallons 3.06 Processed Gallons 2.40 19.34Filtrate Gallons 3.89 Filtrate Gallons 1.37 Filtrate Gallons 1.52 6.78Tube Gallons Retained 9.99 Tube Gallons Retained 1.69 Tube Gallons Retained 0.88 12.56% Dry Solids Raw 12.50 % Dry Solids Raw 12.50 % Dry Solids Raw 12.50 12.50Dry Solids Retained /1ft³ M2 17.35 Dry Solids Retained /1ft³ M2 3.75 Dry Solids Retained /1ft³ M2 2.94 24.04T.S.S. 30.00 T.S.S. 22.00 T.S.S. 23.00 25.00Ntu's 31.90 Ntu's 42.00 Ntu's 45.00 39.63pH 10.70 pH 11.30 pH 11.40 11.13Conductivity mS/cm 3.07 Conductivity mS/cm 4.47 Conductivity mS/cm 4.82 4.12Salinity ppt 1.51 Salinity ppt 2.30 Salinity ppt 2.30 2.04Slurry Density lbs/gal calc 9.58 Slurry Density lbs/gal calc 8.64 Slurry Density lbs/gal calc 8.49 8.90Slurry Density lbs/gal metered 10.00 Slurry Density lbs/gal metered 9.80 Slurry Density lbs/gal metered 9.80Chemical Dose Anonic lbs/dt 1.59 Chemical Dose Anonic lbs/dt 1.59 Chemical Dose Anonic lbs/dt 1.59 1.59Chemical Dose Catonic Chemical Dose Catonic Chemical Dose CatonicChemical Dose Agent Chemical Dose Agent Chemical Dose AgentOdor Level Odor Level Odor LevelPolymer Vendor Kemira A-100 Polymer Vendor Kemira A-100 Polymer Vendor Kemira K-100Fabric Vendor GT 500 Fabric Vendor GT500 Fabric Vendor GT500
24/hr Cakle Density 24/hr Cakle S.g24/hr Cake % Dry Solids1ft³ lbs 24hrs DewateringDry Solids Retained /1ft³ M3 0.00
Color legend: 1ft³ lbs End of Fill 81.52Wet lbs 1ft³ Method 1 M1 Penetrometer RDT Kg/in² 0.40Dry lbs 1ft³ Method 2 M2 www.mpsmaine.com Penetrometer P-GDT Kg/in² 0.90Dry lbs 1ft³ Method 3 M3 RDT T.S.S. 47.00
RDT Ntu's 53.00RDT Cake % Dry Solids 26.00
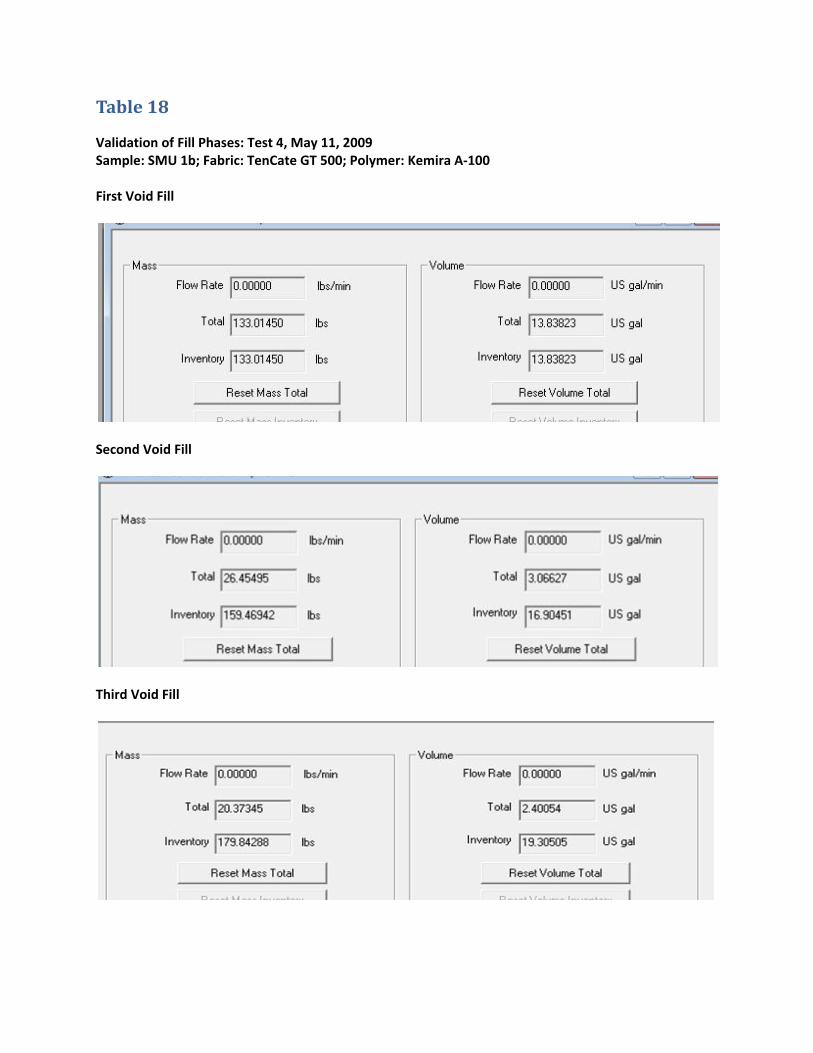
Table 18
Validation of Fill Phases: Test 4, May 11, 2009 Sample: SMU 1b; Fabric: TenCate GT 500; Polymer: Kemira A‐100 First Void Fill
Second Void Fill
Third Void Fill

P-GDT TEST Pressurized Gravity Dewatering Test Table 19Project : Parsons Geotube® P-GDT Test 5 Comments:Slurry Type: SMU 1b TenCate Fabric Testing GT500Customer: Parsons Polymer Nalco 7766Date: May 12,2009Test Tracking Code Line 15
Values Totals Values Avg1st Void Fill Phase 2nd Void Fill Phase 3rd Void Fill Phase 1st Fill Phase Processed Mass Lbs 107.84 Processed Mass Lbs 13.42 Processed Mass Lbs 14.32 135.58Filtrate Lbs 21.58 Filtrate Lbs 2.60 Filtrate Lbs 3.60 27.78Tube Mass Retained M1 86.26 Tube Mass Retained M1 10.82 Tube Mass Retained M1 10.56 107.64Processed Gallons 11.59 Processed Gallons 1.43 Processed Gallons 1.59 14.61Filtrate Gallons 2.59 Filtrate Gallons 0.31 Filtrate Gallons 0.43 3.33Tube Gallons Retained 9.00 Tube Gallons Retained 1.12 Tube Gallons Retained 1.16 11.28% Dry Solids Raw 12.60 % Dry Solids Raw 12.60 % Dry Solids Raw 12.60 12.60Dry Solids Retained /1ft³ M2 12.85 Dry Solids Retained /1ft³ M2 1.59 Dry Solids Retained /1ft³ M2 1.76 16.20T.S.S. 320.00 T.S.S. 312.00 T.S.S. 290.00 307.33Ntu's 50.70 Ntu's 41.00 Ntu's 38.50 43.40pH 10.90 pH 10.80 pH 10.70 10.80Conductivity mS/cm 3.76 Conductivity mS/cm 4.91 Conductivity mS/cm 4.86 4.51Salinity ppt 1.80 Salinity ppt 2.60 Salinity ppt 2.70 2.37Slurry Density lbs/gal calc 9.30 Slurry Density lbs/gal calc 9.38 Slurry Density lbs/gal calc 9.01 9.23Slurry Density lbs/gal lab scale 8.80 Slurry Density lbs/gal lab scale 8.80 Slurry Density lbs/gal lab scale 8.80Chemical Dose Anonic lbs/dt Chemical Dose Anonic lbs/dt Chemical Dose Anonic lbs/dt 0.00Chemical Dose Catoniclbs/dt 3.81 Chemical Dose Catonic 3.81 Chemical Dose Catonic 3.81Chemical Dose Agent Chemical Dose Agent Chemical Dose AgentOdor Level Odor Level Odor LevelPolymer Vendor Nalco Polymer Vendor Nalco Polymer Vendor NalcoFabric Vendor GT500 Fabric Vendor GT500 Fabric Vendor GT500
24/hr Cake Density 9.6024/hr Cake S.g 1.1524/hr Cake % Dry Solids 31.201ft³ lbs 24hrs Dewatering 52.00Dry Solids Retained /1ft³ M3 16.22
Color legend: 1ft³ lbs End of Fill 72.00Wet lbs P-GDT test tube 1ft³ Method 1 M1 Penetrometer RDT Kg/in² 1.40Dry lbs 1ft³ Method 2 M2 www.mpsmaine.com Penetrometer P-GDT Kg/in² 0.35Dry lbs 1ft³ Method 3 M3 RDT T.S.S. 16.00
RDT Ntu's 11.50RDT Cake % Dry Solids 40.10
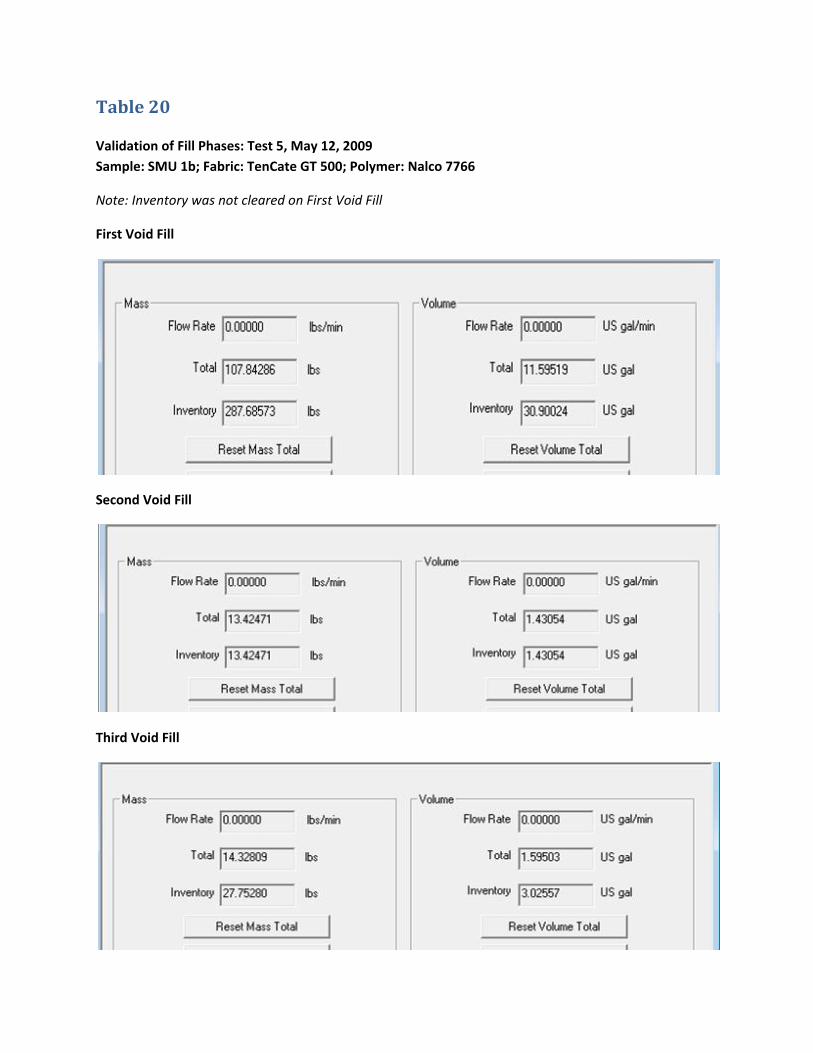
Table 20
Validation of Fill Phases: Test 5, May 12, 2009
Sample: SMU 1b; Fabric: TenCate GT 500; Polymer: Nalco 7766
Note: Inventory was not cleared on First Void Fill
First Void Fill
Second Void Fill
Third Void Fill

P-GDT TEST Pressurized Gravity Dewatering Test Table 21Project : Parsons Geotube® P-GDT Test 6 Comments:Slurry Type: SMU 1a TenCate Fabric Testing GT500Customer: Parsons Kemira A-100Date: May 13th 2009Test Tracking Code Line 16
Values Totals Values Avg1st Void Fill Phase 2nd Void Fill Phase 3rd Void Fill Phase 1st Fill Phase Processed Mass Lbs 124.68 Processed Mass Lbs 29.82 Processed Mass Lbs 36.80 191.30Filtrate Lbs 29.60 Filtrate Lbs 18.00 Filtrate Lbs 28.10 75.70Tube Mass Retained M1 95.08 Tube Mass Retained M1 11.82 Tube Mass Retained M1 8.70 115.60Processed Gallons 13.32 Processed Gallons 3.52 Processed Gallons 4.22 21.06Filtrate Gallons 3.55 Filtrate Gallons 2.16 Filtrate Gallons 3.37 9.08Tube Gallons Retained 9.77 Tube Gallons Retained 1.36 Tube Gallons Retained 0.85 11.98% Dry Solids Raw 13.90 % Dry Solids Raw 13.90 % Dry Solids Raw 13.90 13.90Dry Solids Retained /1ft³ M2 17.59 Dry Solids Retained /1ft³ M2 4.65 Dry Solids Retained /1ft³ M2 5.57 27.81T.S.S. 49.00 T.S.S. 41.00 T.S.S. 33.00 41.00Ntu's 57.00 Ntu's 97.00 Ntu's 20.00 58.00pH 10.00 pH 9.80 pH 10.00 9.93Conductivity mS/cm 4.38 Conductivity mS/cm 5.38 Conductivity mS/cm 5.76 5.17Salinity ppt 2.30 Salinity ppt 2.90 Salinity ppt 2.90 2.70Slurry Density lbs/gal calc 9.36 Slurry Density lbs/gal calc 8.47 Slurry Density lbs/gal calc 8.72 8.85Slurry Density lbs/gal lab scale 9.50 Slurry Density lbs/gal lab scale 9.50 Slurry Density lbs/gal lab scale 9.50Chemical Dose Anonic lbs/dt 1.59 Chemical Dose Anonic lbs/dt 1.59 Chemical Dose Anonic lbs/dt 1.59 1.59Chemical Dose Catonic Chemical Dose Catonic Chemical Dose CatonicChemical Dose Agent Chemical Dose Agent Chemical Dose AgentOdor Level Odor Level Odor LevelPolymer Vendor Kemira Polymer Vendor Kemira Polymer Vendor KemiraFabric Vendor GT 500 Fabric Vendor GT500 Fabric Vendor GT500
24/hr Cake Density 10.6024/hr Cake S.g 1.2624/hr Cake % Dry Solids 39.601ft³ lbs 24hrs Dewatering 62.00Dry Solids Retained /1ft³ M3 24.55
Color legend: 1ft³ lbs End of Fill 67.00Wet lbs P-GDT test tube 1ft³ Method 1 M1 Penetrometer RDT Kg/in² 1.60Dry lbs 1ft³ Method 2 M2 www.mpsmaine.com Penetrometer P-GDT Kg/in² 0.80Dry lbs 1ft³ Method 3 M3 RDT T.S.S. 10.00
RDT Ntu's 6.60RDT Cake % Dry Solids 39.45
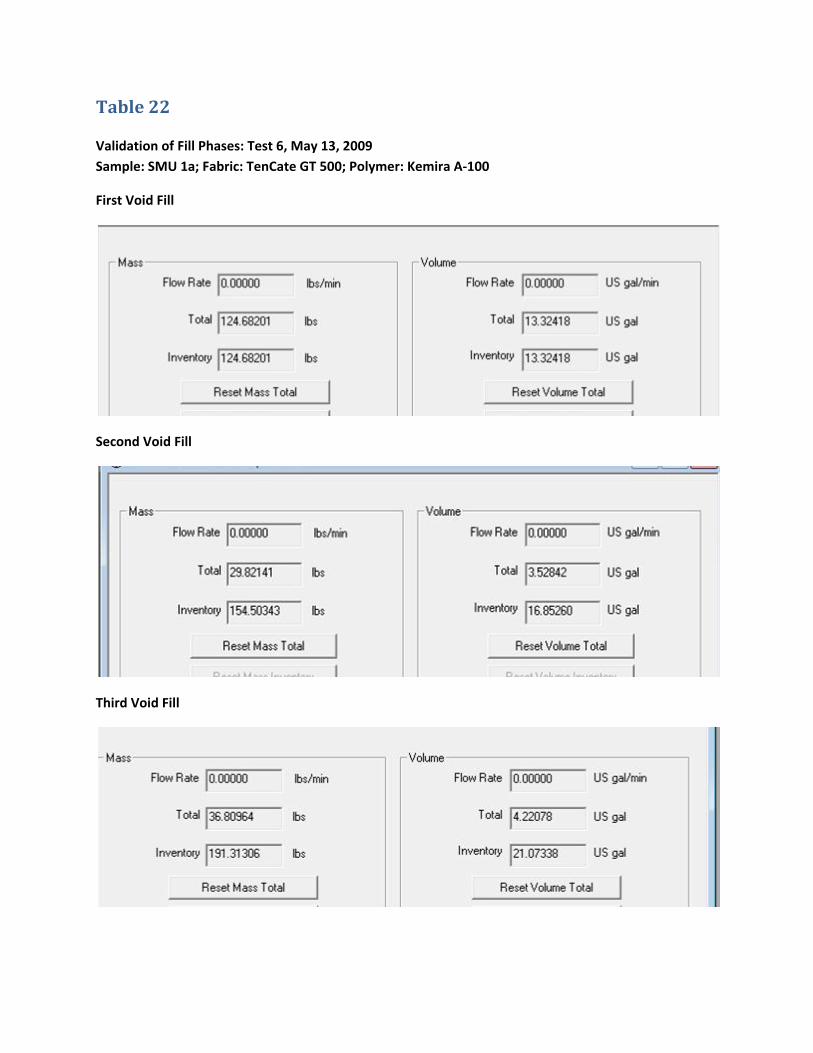
Table 22
Validation of Fill Phases: Test 6, May 13, 2009
Sample: SMU 1a; Fabric: TenCate GT 500; Polymer: Kemira A‐100
First Void Fill
Second Void Fill
Third Void Fill

P-GDT TEST Pressurized Gravity Dewatering Test Table 23Project : Parsons Geotube® P-GDT Test 7 Comments:Slurry Type: SMU 1b TenCate Fabric Testing GT500Customer: Parsons Polymer Ashland 2520Date: May 13th 2009 ThickenTest Tracking Code Line 16
Values Totals Values Avg1st Void Fill Phase 2nd Void Fill Phase 3rd Void Fill Phase 1st Fill Phase Processed Mass Lbs 109.00 Processed Mass Lbs 11.74 Processed Mass Lbs 4.06 124.80Filtrate Lbs 12.00 Filtrate Lbs 7.10 Filtrate Lbs 3.10 22.20Tube Mass Retained M1 97.00 Tube Mass Retained M1 4.64 Tube Mass Retained M1 0.96 102.60Processed Gallons 11.44 Processed Gallons 1.22 Processed Gallons 0.42 13.08Filtrate Gallons 1.44 Filtrate Gallons 0.85 Filtrate Gallons 0.37 2.66Tube Gallons Retained 10.00 Tube Gallons Retained 0.37 Tube Gallons Retained 0.05 10.42% Dry Solids Raw 26.60 % Dry Solids Raw 26.60 % Dry Solids Raw 26.60 26.60Dry Solids Retained /1ft³ M2 30.43 Dry Solids Retained /1ft³ M2 3.25 Dry Solids Retained /1ft³ M2 1.12 34.79T.S.S. 42.80 T.S.S. 65.00 T.S.S. 50.00 52.60Ntu's 77.60 Ntu's 89.00 Ntu's 76.00 80.87pH 11.20 pH 11.20 pH 10.80 11.07Conductivity mS/cm 4.47 Conductivity mS/cm 6.67 Conductivity mS/cm 6.45 5.86Salinity ppt 2.30 Salinity ppt 3.50 Salinity ppt 3.10 2.97Slurry Density lbs/gal calc 9.53 Slurry Density lbs/gal calc 9.62 Slurry Density lbs/gal calc 9.67 9.61Slurry Density lbs/gal lab scale 10.00 Slurry Density lbs/gal lab scale 10.00 Slurry Density lbs/gal lab scale 10.00Chemical Dose Anonic lbs/dt 1.56 Chemical Dose Anonic lbs/dt 1.56 Chemical Dose Anonic lbs/dt 1.59 1.57Chemical Dose Catonic Chemical Dose Catonic Chemical Dose CatonicChemical Dose Agent Chemical Dose Agent Chemical Dose AgentOdor Level Odor Level Odor LevelPolymer Vendor Ashland Polymer Vendor Ashland Polymer Vendor AshlandFabric Vendor GT 500 Fabric Vendor GT500 Fabric Vendor GT500
24/hr Cake Density 10.6024/hr Cake S.g 1.2724/hr Cake % Dry Solids 40.801ft³ lbs 24hrs Dewatering 62.50Dry Solids Retained /1ft³ M3 25.50
Color legend: 1ft³ lbs End of Fill 80.76Wet lbs P-GDT test tube 1ft³ Method 1 M1 Penetrometer RDT Kg/in² 3.70Dry lbs 1ft³ Method 2 M2 www.mpsmaine.com Penetrometer P-GDT Kg/in² 0.90Dry lbs 1ft³ Method 3 M3 RDT T.S.S. 25.00
RDT Ntu's 18.00RDT Cake % Dry Solids 46.20
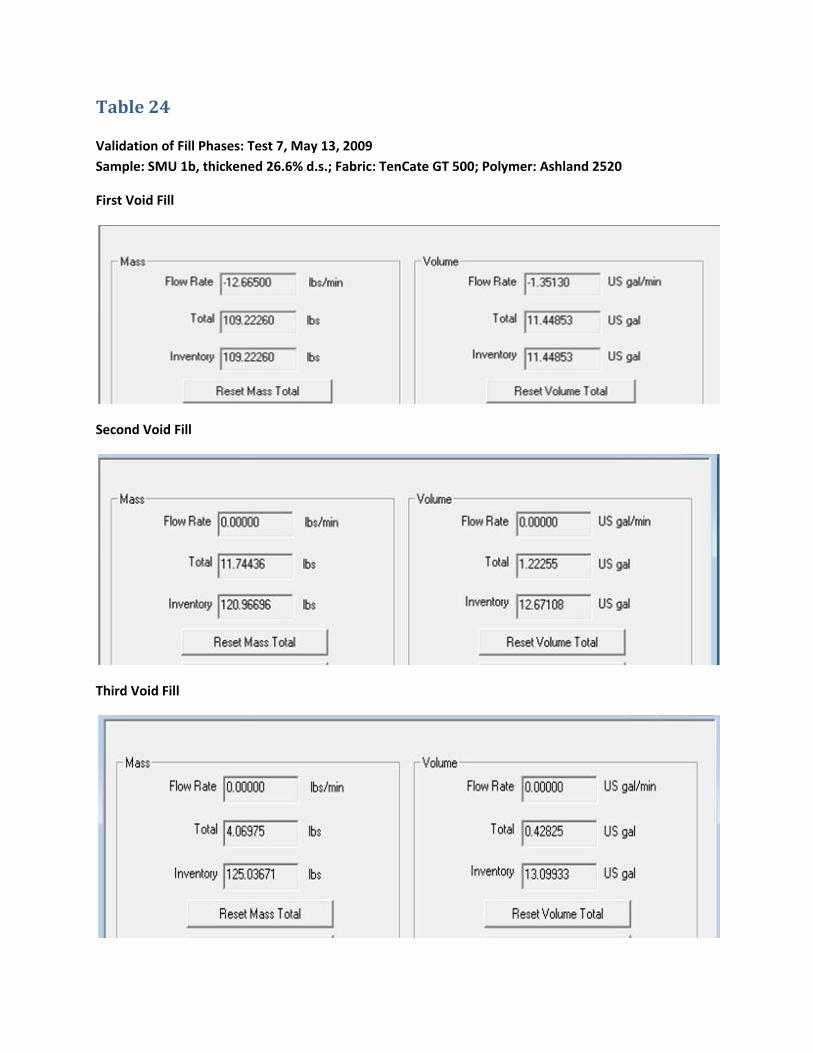
Table 24
Validation of Fill Phases: Test 7, May 13, 2009
Sample: SMU 1b, thickened 26.6% d.s.; Fabric: TenCate GT 500; Polymer: Ashland 2520
First Void Fill
Second Void Fill
Third Void Fill

P-GDT TEST Pressurized Gravity Dewatering Test Table 25Project : Parsons Geotube® P-GDT Test 8 Comments:Slurry Type: SMU 1b TenCate Fabric Testing GT500Customer: Parsons Polymer Kemira A-100Date: May 13th 2009 ThickenTest Tracking Code Line 18
Values Totals Values Avg1st Void Fill Phase 2nd Void Fill Phase 3rd Void Fill Phase 1st Fill Phase Processed Mass Lbs 125.03 Processed Mass Lbs 11.51 Processed Mass Lbs 14.20 150.74Filtrate Lbs 13.40 Filtrate Lbs 6.70 Filtrate Lbs 5.98 26.08Tube Mass Retained M1 111.63 Tube Mass Retained M1 4.81 Tube Mass Retained M1 8.22 124.66Processed Gallons 13.09 Processed Gallons 1.20 Processed Gallons 1.53 15.82Filtrate Gallons 1.61 Filtrate Gallons 0.80 Filtrate Gallons 0.72 3.13Tube Gallons Retained 11.48 Tube Gallons Retained 0.40 Tube Gallons Retained 0.81 12.69% Dry Solids Raw 26.60 % Dry Solids Raw 26.60 % Dry Solids Raw 26.60 26.60Dry Solids Retained /1ft³ M2 34.82 Dry Solids Retained /1ft³ M2 3.13 Dry Solids Retained /1ft³ M2 3.99 41.94T.S.S. 29.00 T.S.S. 34.00 T.S.S. 24.00 29.00Ntu's 35.00 Ntu's 23.00 Ntu's 45.00 34.33pH 10.90 pH 10.90 pH 10.80 10.87Conductivity mS/cm 5.87 Conductivity mS/cm 5.76 Conductivity mS/cm 5.76 5.80Salinity ppt 3.10 Salinity ppt 3.70 Salinity ppt 2.70 3.17Slurry Density lbs/gal calc 9.55 Slurry Density lbs/gal calc 9.59 Slurry Density lbs/gal calc 9.28 9.47Slurry Density lbs/gal lab scale 10.00 Slurry Density lbs/gal lab scale 9.80 Slurry Density lbs/gal lab scale 9.80Chemical Dose Anonic lbs/dt 1.59 Chemical Dose Anonic lbs/dt 1.59 Chemical Dose Anonic lbs/dt 1.59 1.59Chemical Dose Catonic Chemical Dose Catonic Chemical Dose CatonicChemical Dose Agent Chemical Dose Agent Chemical Dose AgentOdor Level Odor Level Odor LevelPolymer Vendor Kemira Polymer Vendor Kemira Polymer Vendor KemiraFabric Vendor GT 500 Fabric Vendor GT500 Fabric Vendor GT500
24/hr Cake Density 10.4024/hr Cake S.g 1.2524/hr Cake % Dry Solids 41.301ft³ lbs 24hrs Dewatering 67.50Dry Solids Retained /1ft³ M3 27.88
Color legend: 1ft³ lbs End of Fill 81.80Wet lbs P-GDT test tube 1ft³ Method 1 M1 Penetrometer RDT Kg/in² 3.70Dry lbs 1ft³ Method 2 M2 www.mpsmaine.com Penetrometer P-GDT Kg/in² 0.90Dry lbs 1ft³ Method 3 M3 RDT T.S.S. 24.00
RDT Ntu's 19.00RDT Cake % Dry Solids 44.80
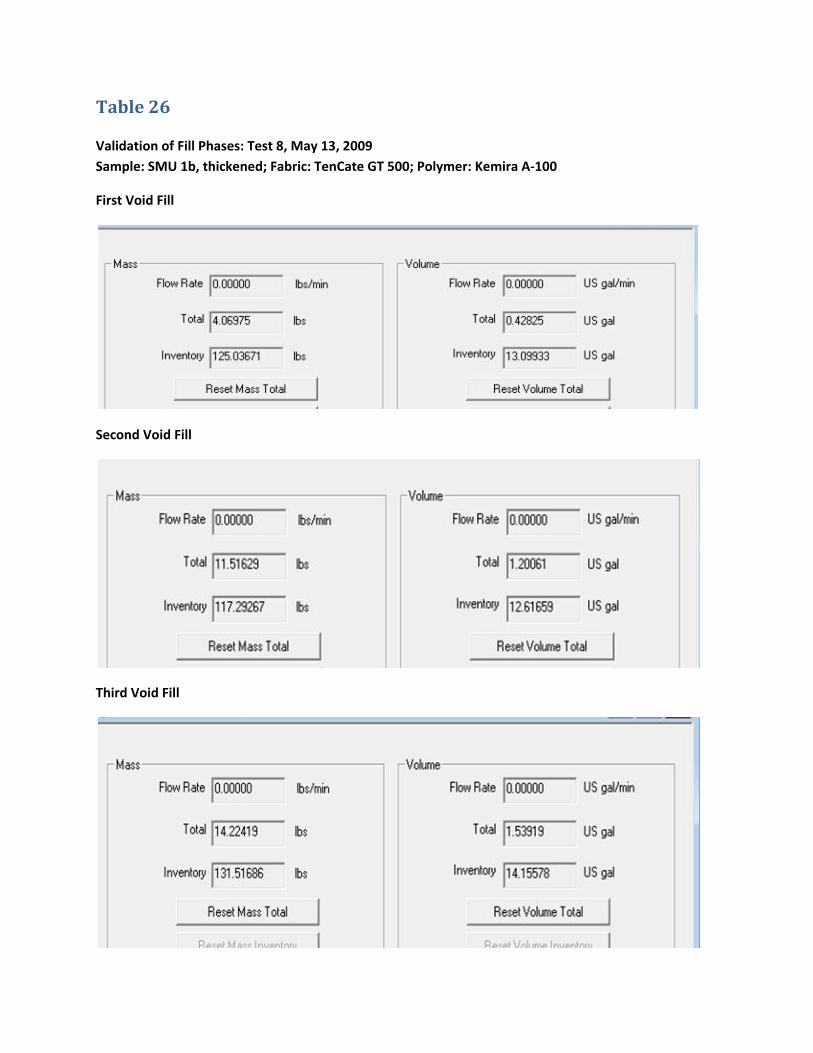
Table 26
Validation of Fill Phases: Test 8, May 13, 2009
Sample: SMU 1b, thickened; Fabric: TenCate GT 500; Polymer: Kemira A‐100
First Void Fill
Second Void Fill
Third Void Fill

P-GDT TEST Pressurized Gravity Dewatering Test Table 27Project : Parsons Geotube® P-GDT Test 9 Comments:Slurry Type: SMU 1b TenCate Fabric Testing GT500Customer: Parsons Polymer Kemira A-100Date: May 14th 2009Test Tracking Code Line 00
Values Totals Values Avg1st Void Fill Phase 2nd Void Fill Phase 3rd Void Fill Phase 1st Fill Phase Processed Mass Lbs 110.48 Processed Mass Lbs 30.22 Processed Mass Lbs 32.85 173.55Filtrate Lbs 15.96 Filtrate Lbs 13.52 Filtrate Lbs 10.47 39.95Tube Mass Retained M1 94.52 Tube Mass Retained M1 16.70 Tube Mass Retained M1 22.38 133.60Processed Gallons 11.60 Processed Gallons 3.33 Processed Gallons 3.89 18.82Filtrate Gallons 1.91 Filtrate Gallons 1.62 Filtrate Gallons 1.26 4.79Tube Gallons Retained 9.69 Tube Gallons Retained 1.71 Tube Gallons Retained 2.63 14.03% Dry Solids Raw 12.60 % Dry Solids Raw 12.60 % Dry Solids Raw 12.60 12.60Dry Solids Retained /1ft³ M2 14.32 Dry Solids Retained /1ft³ M2 4.11 Dry Solids Retained /1ft³ M2 4.80 23.24T.S.S. 195.00 T.S.S. 31.00 T.S.S. 23.00 83.00Ntu's 246.00 Ntu's 22.80 Ntu's 20.30 96.37pH 10.40 pH 10.90 pH 10.80 10.70Conductivity mS/cm 3.73 Conductivity mS/cm 4.75 Conductivity mS/cm 5.76 4.75Salinity ppt 3.10 Salinity ppt 2.40 Salinity ppt 2.60 2.70Slurry Density lbs/gal calc 9.52 Slurry Density lbs/gal calc 9.08 Slurry Density lbs/gal calc 8.44 9.01Slurry Density lbs/gal lab scale 9.80 Slurry Density lbs/gal lab scale 9.80 Slurry Density lbs/gal lab scale 9.80Chemical Dose Anonic lbs/dt 1.59 Chemical Dose Anonic lbs/dt 1.59 Chemical Dose Anonic lbs/dt 1.59 1.59Chemical Dose Catonic Chemical Dose Catonic Chemical Dose CatonicChemical Dose Agent Chemical Dose Agent Chemical Dose AgentOdor Level Odor Level Odor LevelPolymer Vendor Kemira Polymer Vendor Kemira Polymer Vendor KemiraFabric Vendor GT 500 Fabric Vendor GT500 Fabric Vendor GT500
24/hr Cake Density 0.0024/hr Cake S.g 0.0024/hr Cake % Dry Solids 37.901ft³ lbs 24hrs Dewatering 53.56Dry Solids Retained /1ft³ M3 20.30
Color legend: 1ft³ lbs End of Fill 72.46Wet lbs P-GDT test tube 1ft³ Method 1 M1 Penetrometer RDT Kg/in² NDDry lbs 1ft³ Method 2 M2 www.mpsmaine.com Penetrometer P-GDT Kg/in² 0.50Dry lbs 1ft³ Method 3 M3 RDT T.S.S. ND
RDT Ntu's NDRDT Cake % Dry Solids ND
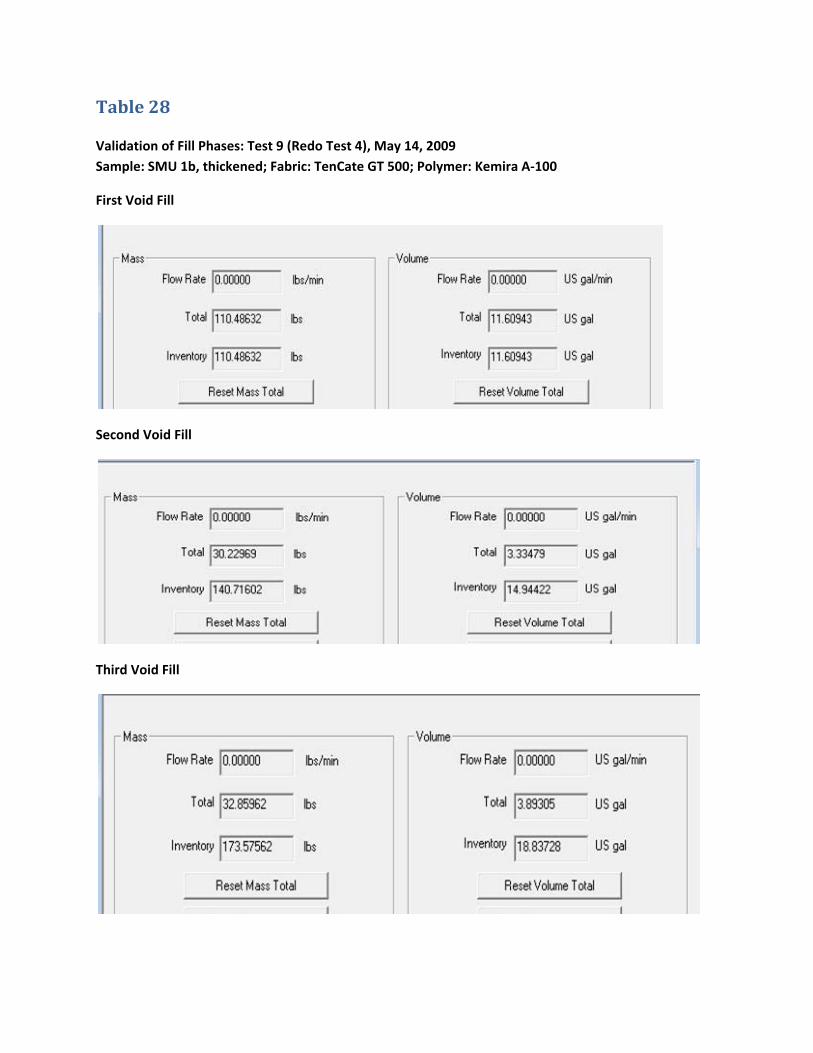
Table 28
Validation of Fill Phases: Test 9 (Redo Test 4), May 14, 2009
Sample: SMU 1b, thickened; Fabric: TenCate GT 500; Polymer: Kemira A‐100
First Void Fill
Second Void Fill
Third Void Fill
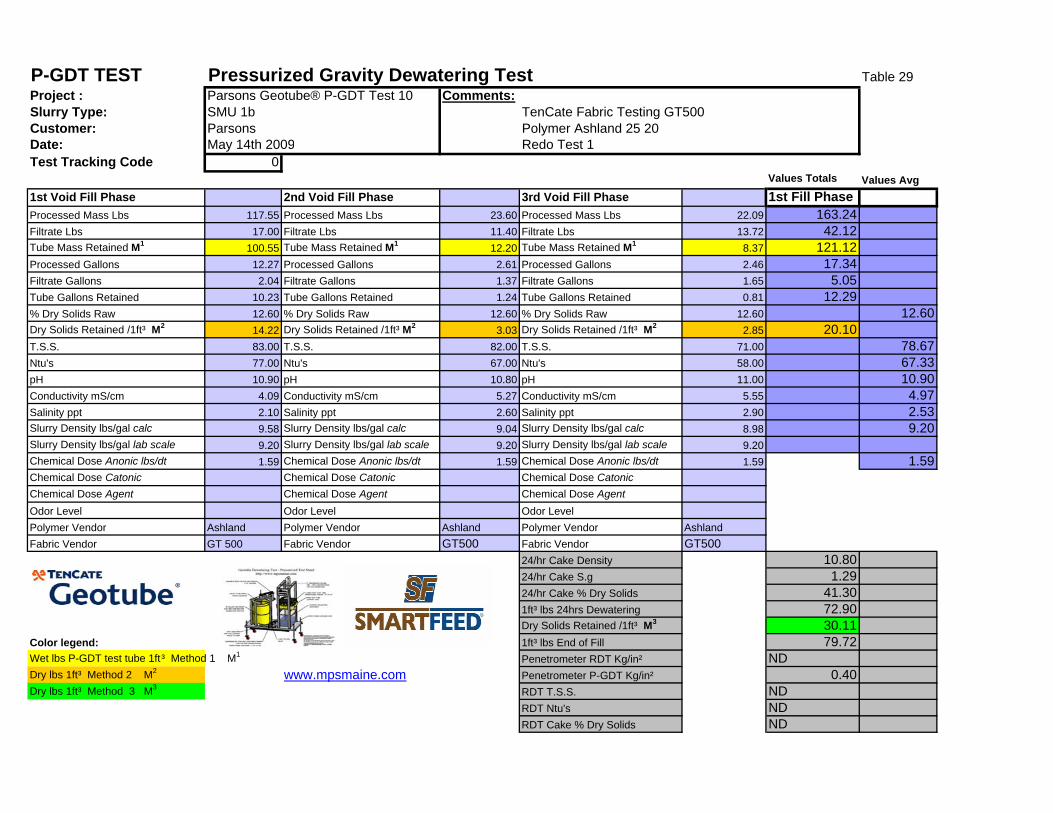
P-GDT TEST Pressurized Gravity Dewatering Test Table 29Project : Parsons Geotube® P-GDT Test 10 Comments:Slurry Type: SMU 1b TenCate Fabric Testing GT500Customer: Parsons Polymer Ashland 25 20Date: May 14th 2009 Redo Test 1Test Tracking Code 0
Values Totals Values Avg1st Void Fill Phase 2nd Void Fill Phase 3rd Void Fill Phase 1st Fill Phase Processed Mass Lbs 117.55 Processed Mass Lbs 23.60 Processed Mass Lbs 22.09 163.24Filtrate Lbs 17.00 Filtrate Lbs 11.40 Filtrate Lbs 13.72 42.12Tube Mass Retained M1 100.55 Tube Mass Retained M1 12.20 Tube Mass Retained M1 8.37 121.12Processed Gallons 12.27 Processed Gallons 2.61 Processed Gallons 2.46 17.34Filtrate Gallons 2.04 Filtrate Gallons 1.37 Filtrate Gallons 1.65 5.05Tube Gallons Retained 10.23 Tube Gallons Retained 1.24 Tube Gallons Retained 0.81 12.29% Dry Solids Raw 12.60 % Dry Solids Raw 12.60 % Dry Solids Raw 12.60 12.60Dry Solids Retained /1ft³ M2 14.22 Dry Solids Retained /1ft³ M2 3.03 Dry Solids Retained /1ft³ M2 2.85 20.10T.S.S. 83.00 T.S.S. 82.00 T.S.S. 71.00 78.67Ntu's 77.00 Ntu's 67.00 Ntu's 58.00 67.33pH 10.90 pH 10.80 pH 11.00 10.90Conductivity mS/cm 4.09 Conductivity mS/cm 5.27 Conductivity mS/cm 5.55 4.97Salinity ppt 2.10 Salinity ppt 2.60 Salinity ppt 2.90 2.53Slurry Density lbs/gal calc 9.58 Slurry Density lbs/gal calc 9.04 Slurry Density lbs/gal calc 8.98 9.20Slurry Density lbs/gal lab scale 9.20 Slurry Density lbs/gal lab scale 9.20 Slurry Density lbs/gal lab scale 9.20Chemical Dose Anonic lbs/dt 1.59 Chemical Dose Anonic lbs/dt 1.59 Chemical Dose Anonic lbs/dt 1.59 1.59Chemical Dose Catonic Chemical Dose Catonic Chemical Dose CatonicChemical Dose Agent Chemical Dose Agent Chemical Dose AgentOdor Level Odor Level Odor LevelPolymer Vendor Ashland Polymer Vendor Ashland Polymer Vendor AshlandFabric Vendor GT 500 Fabric Vendor GT500 Fabric Vendor GT500
24/hr Cake Density 10.8024/hr Cake S.g 1.2924/hr Cake % Dry Solids 41.301ft³ lbs 24hrs Dewatering 72.90Dry Solids Retained /1ft³ M3 30.11
Color legend: 1ft³ lbs End of Fill 79.72Wet lbs P-GDT test tube 1ft³ Method 1 M1 Penetrometer RDT Kg/in² NDDry lbs 1ft³ Method 2 M2 www.mpsmaine.com Penetrometer P-GDT Kg/in² 0.40Dry lbs 1ft³ Method 3 M3 RDT T.S.S. ND
RDT Ntu's NDRDT Cake % Dry Solids ND
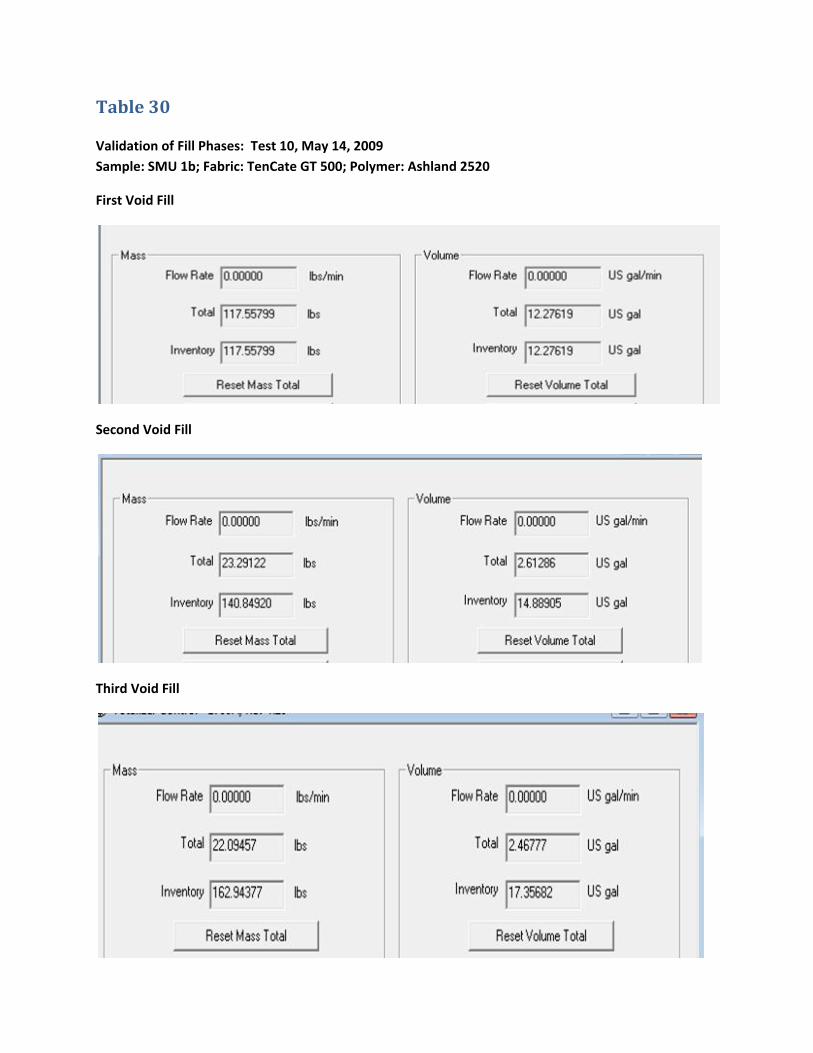
Table 30
Validation of Fill Phases: Test 10, May 14, 2009
Sample: SMU 1b; Fabric: TenCate GT 500; Polymer: Ashland 2520
First Void Fill
Second Void Fill
Third Void Fill

P-GDT TEST Pressurized Gravity Dewatering Test Table 31Project : Parsons Geotube® P-GDT Test 11 Comments:Slurry Type: SMU 1b TenCate Fabric Testing GT500Customer: Parsons Polymer Ashland 2520Date: May 15th,2009 Polymer Doage .99lbs/D.T.Test Tracking Code Line 11
Values Totals Values Avg1st Void Fill Phase 2nd Void Fill Phase 3rd Void Fill Phase 1st Fill Phase Processed Mass Lbs 101.09 Processed Mass Lbs 32.70 Processed Mass Lbs 9.80 143.59Filtrate Lbs 17.00 Filtrate Lbs 11.40 Filtrate Lbs 6.02 34.42Tube Mass Retained M1 84.09 Tube Mass Retained M1 21.30 Tube Mass Retained M1 3.78 109.17Processed Gallons 10.96 Processed Gallons 3.56 Processed Gallons 1.00 15.52Filtrate Gallons 2.04 Filtrate Gallons 1.37 Filtrate Gallons 0.72 4.13Tube Gallons Retained 8.92 Tube Gallons Retained 2.19 Tube Gallons Retained 0.28 11.39% Dry Solids Raw 16.50 % Dry Solids Raw 16.50 % Dry Solids Raw 16.50 16.50Dry Solids Retained /1ft³ M2 17.72 Dry Solids Retained /1ft³ M2 5.76 Dry Solids Retained /1ft³ M2 1.62 25.10T.S.S. 989.00 T.S.S. 620.00 T.S.S. 500.00 703.00Ntu's 380.00 Ntu's 310.00 Ntu's 355.00 348.33pH 11.10 pH 10.90 pH 10.60 10.87Conductivity mS/cm 4.92 Conductivity mS/cm 6.01 Conductivity mS/cm 5.76 5.56Salinity ppt 2.60 Salinity ppt 3.10 Salinity ppt 3.10 2.93Slurry Density lbs/gal calc 9.22 Slurry Density lbs/gal calc 9.19 Slurry Density lbs/gal calc 9.80 9.40Slurry Density lbs/gal lab scale 9.80 Slurry Density lbs/gal lab scale 9.80 Slurry Density lbs/gal lab scale 9.80Chemical Dose Anonic lbs/dt 0.99 Chemical Dose Anonic lbs/dt 0.99 Chemical Dose Anonic lbs/dt 0.99 0.99Chemical Dose Catonic Chemical Dose Catonic Chemical Dose CatonicChemical Dose Agent Chemical Dose Agent Chemical Dose AgentOdor Level Odor Level Odor LevelPolymer Vendor Ashland Polymer Vendor Ashland Polymer Vendor AshlandFabric Vendor GT 500 Fabric Vendor GT500 Fabric Vendor GT500
24/hr Cake Density 10.2024/hr Cake S.g 1.2224/hr Cake % Dry Solids 32.301ft³ lbs 24hrs Dewatering 63.58Dry Solids Retained /1ft³ M3 20.54
Color legend: 1ft³ lbs End of Fill 79.72Wet lbs P-GDT test tube 1ft³ Method 1 M1 Penetrometer RDT Kg/in² 2.60Dry lbs 1ft³ Method 2 M2 www.mpsmaine.com Penetrometer P-GDT Kg/in² 0.30Dry lbs 1ft³ Method 3 M3 RDT T.S.S. 11.00
RDT Ntu's 12.50RDT Cake % Dry Solids 43.13
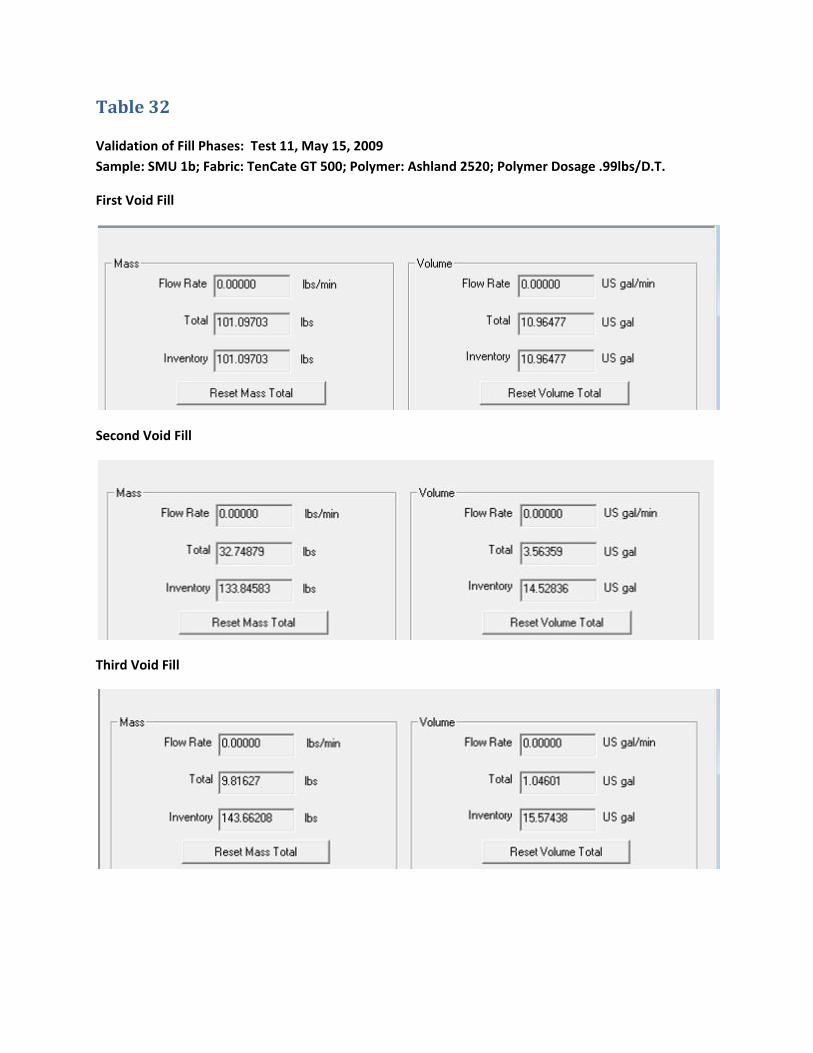
Table 32
Validation of Fill Phases: Test 11, May 15, 2009
Sample: SMU 1b; Fabric: TenCate GT 500; Polymer: Ashland 2520; Polymer Dosage .99lbs/D.T.
First Void Fill
Second Void Fill
Third Void Fill
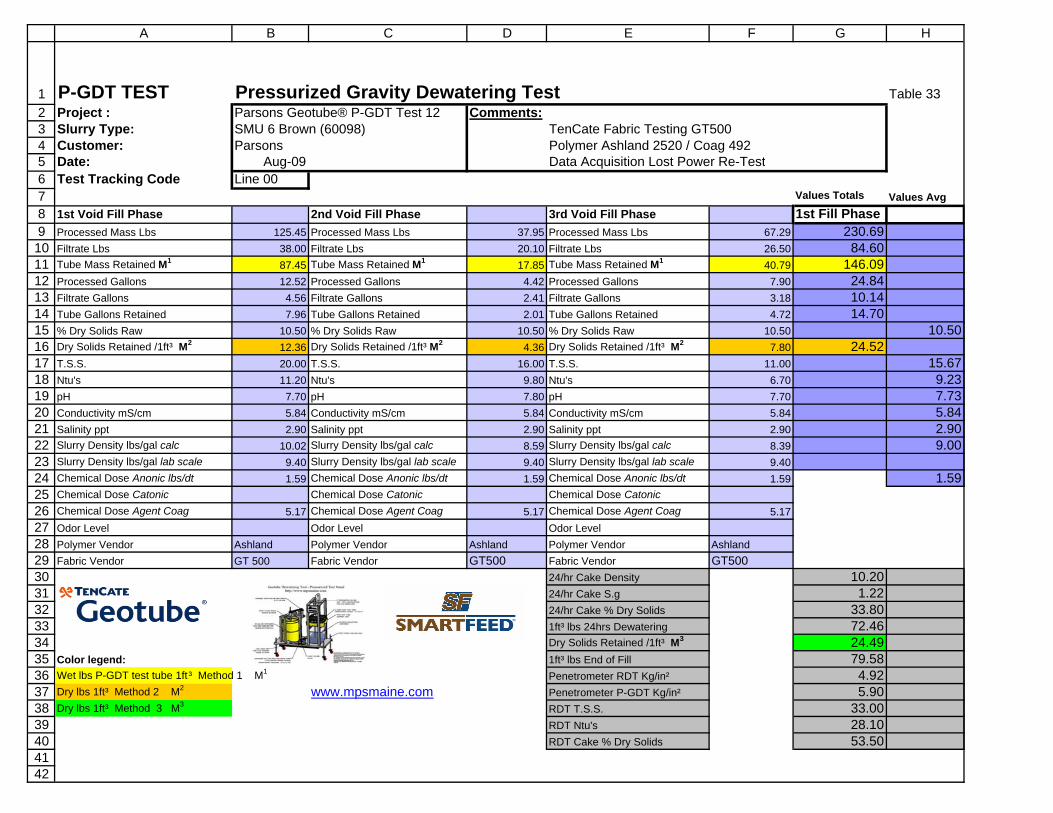
123456789101112131415161718192021222324252627282930313233343536373839404142
A B C D E F G H
P-GDT TEST Pressurized Gravity Dewatering Test Table 33Project : Parsons Geotube® P-GDT Test 12 Comments:Slurry Type: SMU 6 Brown (60098) TenCate Fabric Testing GT500Customer: Parsons Polymer Ashland 2520 / Coag 492Date: Aug-09 Data Acquisition Lost Power Re-TestTest Tracking Code Line 00
Values Totals Values Avg1st Void Fill Phase 2nd Void Fill Phase 3rd Void Fill Phase 1st Fill Phase Processed Mass Lbs 125.45 Processed Mass Lbs 37.95 Processed Mass Lbs 67.29 230.69Filtrate Lbs 38.00 Filtrate Lbs 20.10 Filtrate Lbs 26.50 84.60Tube Mass Retained M1 87.45 Tube Mass Retained M1 17.85 Tube Mass Retained M1 40.79 146.09Processed Gallons 12.52 Processed Gallons 4.42 Processed Gallons 7.90 24.84Filtrate Gallons 4.56 Filtrate Gallons 2.41 Filtrate Gallons 3.18 10.14Tube Gallons Retained 7.96 Tube Gallons Retained 2.01 Tube Gallons Retained 4.72 14.70% Dry Solids Raw 10.50 % Dry Solids Raw 10.50 % Dry Solids Raw 10.50 10.50Dry Solids Retained /1ft³ M2 12.36 Dry Solids Retained /1ft³ M2 4.36 Dry Solids Retained /1ft³ M2 7.80 24.52T.S.S. 20.00 T.S.S. 16.00 T.S.S. 11.00 15.67Ntu's 11.20 Ntu's 9.80 Ntu's 6.70 9.23pH 7.70 pH 7.80 pH 7.70 7.73Conductivity mS/cm 5.84 Conductivity mS/cm 5.84 Conductivity mS/cm 5.84 5.84Salinity ppt 2.90 Salinity ppt 2.90 Salinity ppt 2.90 2.90Slurry Density lbs/gal calc 10.02 Slurry Density lbs/gal calc 8.59 Slurry Density lbs/gal calc 8.39 9.00Slurry Density lbs/gal lab scale 9.40 Slurry Density lbs/gal lab scale 9.40 Slurry Density lbs/gal lab scale 9.40Chemical Dose Anonic lbs/dt 1.59 Chemical Dose Anonic lbs/dt 1.59 Chemical Dose Anonic lbs/dt 1.59 1.59Chemical Dose Catonic Chemical Dose Catonic Chemical Dose CatonicChemical Dose Agent Coag 5.17 Chemical Dose Agent Coag 5.17 Chemical Dose Agent Coag 5.17Odor Level Odor Level Odor LevelPolymer Vendor Ashland Polymer Vendor Ashland Polymer Vendor AshlandFabric Vendor GT 500 Fabric Vendor GT500 Fabric Vendor GT500
24/hr Cake Density 10.2024/hr Cake S.g 1.2224/hr Cake % Dry Solids 33.801ft³ lbs 24hrs Dewatering 72.46Dry Solids Retained /1ft³ M3 24.49
Color legend: 1ft³ lbs End of Fill 79.58Wet lbs P-GDT test tube 1ft³ Method 1 M1 Penetrometer RDT Kg/in² 4.92Dry lbs 1ft³ Method 2 M2 www.mpsmaine.com Penetrometer P-GDT Kg/in² 5.90Dry lbs 1ft³ Method 3 M3 RDT T.S.S. 33.00
RDT Ntu's 28.10RDT Cake % Dry Solids 53.50
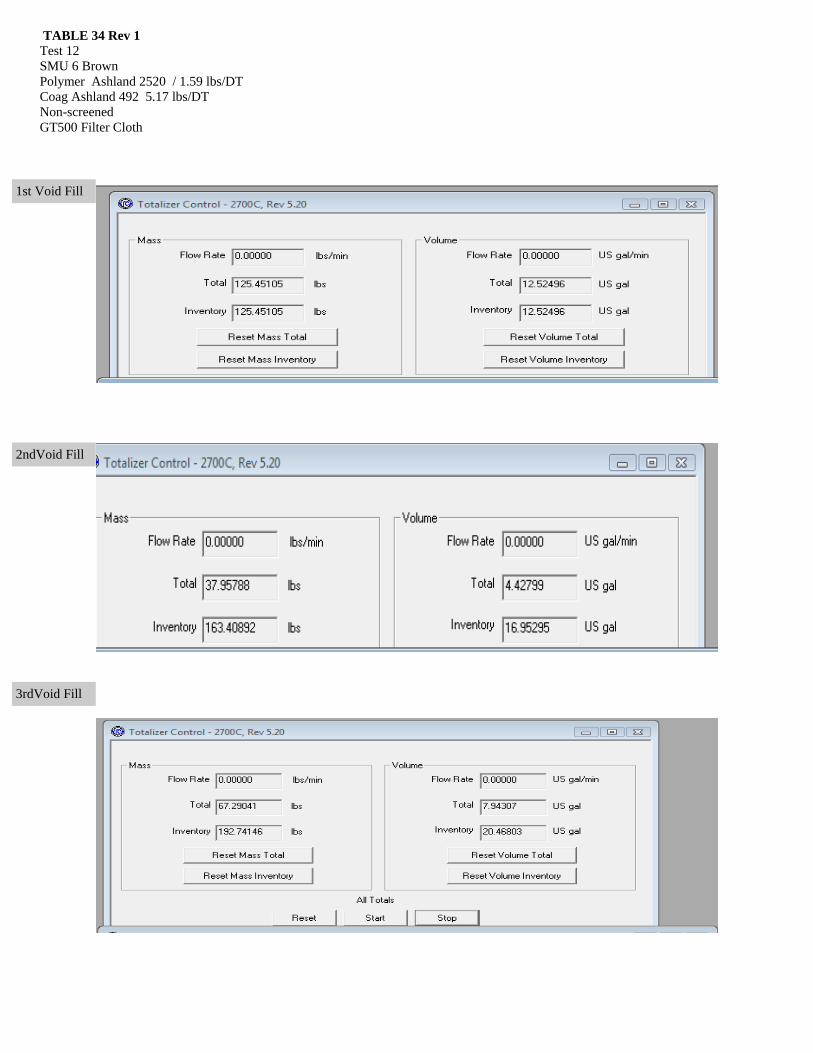
TABLE 34 Rev 1 Test 12 SMU 6 Brown Polymer Ashland 2520 / 1.59 lbs/DT Coag Ashland 492 5.17 lbs/DT Non-screened GT500 Filter Cloth
1st Void Fill
2ndVoid Fill
3rdVoid Fill
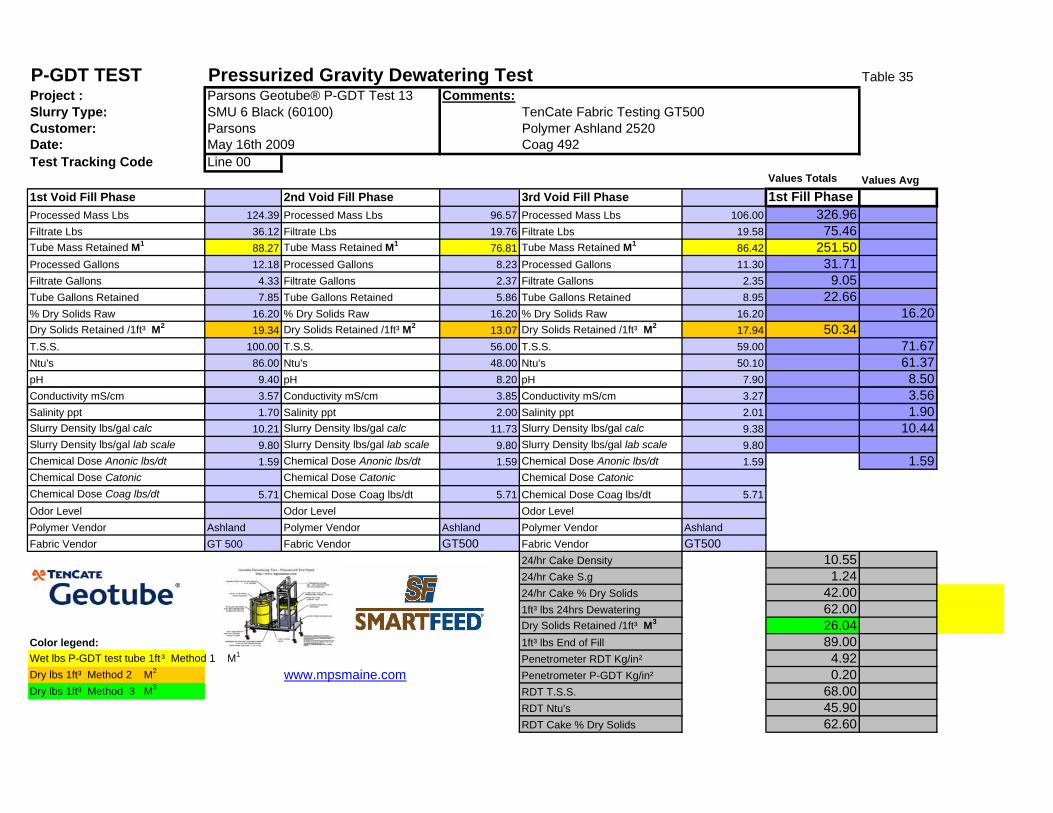
P-GDT TEST Pressurized Gravity Dewatering Test Table 35Project : Parsons Geotube® P-GDT Test 13 Comments:Slurry Type: SMU 6 Black (60100) TenCate Fabric Testing GT500Customer: Parsons Polymer Ashland 2520Date: May 16th 2009 Coag 492Test Tracking Code Line 00
Values Totals Values Avg1st Void Fill Phase 2nd Void Fill Phase 3rd Void Fill Phase 1st Fill Phase Processed Mass Lbs 124.39 Processed Mass Lbs 96.57 Processed Mass Lbs 106.00 326.96Filtrate Lbs 36.12 Filtrate Lbs 19.76 Filtrate Lbs 19.58 75.46Tube Mass Retained M1 88.27 Tube Mass Retained M1 76.81 Tube Mass Retained M1 86.42 251.50Processed Gallons 12.18 Processed Gallons 8.23 Processed Gallons 11.30 31.71Filtrate Gallons 4.33 Filtrate Gallons 2.37 Filtrate Gallons 2.35 9.05Tube Gallons Retained 7.85 Tube Gallons Retained 5.86 Tube Gallons Retained 8.95 22.66% Dry Solids Raw 16.20 % Dry Solids Raw 16.20 % Dry Solids Raw 16.20 16.20Dry Solids Retained /1ft³ M2 19.34 Dry Solids Retained /1ft³ M2 13.07 Dry Solids Retained /1ft³ M2 17.94 50.34T.S.S. 100.00 T.S.S. 56.00 T.S.S. 59.00 71.67Ntu's 86.00 Ntu's 48.00 Ntu's 50.10 61.37pH 9.40 pH 8.20 pH 7.90 8.50Conductivity mS/cm 3.57 Conductivity mS/cm 3.85 Conductivity mS/cm 3.27 3.56Salinity ppt 1.70 Salinity ppt 2.00 Salinity ppt 2.01 1.90Slurry Density lbs/gal calc 10.21 Slurry Density lbs/gal calc 11.73 Slurry Density lbs/gal calc 9.38 10.44Slurry Density lbs/gal lab scale 9.80 Slurry Density lbs/gal lab scale 9.80 Slurry Density lbs/gal lab scale 9.80Chemical Dose Anonic lbs/dt 1.59 Chemical Dose Anonic lbs/dt 1.59 Chemical Dose Anonic lbs/dt 1.59 1.59Chemical Dose Catonic Chemical Dose Catonic Chemical Dose CatonicChemical Dose Coag lbs/dt 5.71 Chemical Dose Coag lbs/dt 5.71 Chemical Dose Coag lbs/dt 5.71Odor Level Odor Level Odor LevelPolymer Vendor Ashland Polymer Vendor Ashland Polymer Vendor AshlandFabric Vendor GT 500 Fabric Vendor GT500 Fabric Vendor GT500
24/hr Cake Density 10.5524/hr Cake S.g 1.2424/hr Cake % Dry Solids 42.001ft³ lbs 24hrs Dewatering 62.00Dry Solids Retained /1ft³ M3 26.04
Color legend: 1ft³ lbs End of Fill 89.00Wet lbs P-GDT test tube 1ft³ Method 1 M1 Penetrometer RDT Kg/in² 4.92Dry lbs 1ft³ Method 2 M2 www.mpsmaine.com Penetrometer P-GDT Kg/in² 0.20Dry lbs 1ft³ Method 3 M3 RDT T.S.S. 68.00
RDT Ntu's 45.90RDT Cake % Dry Solids 62.60
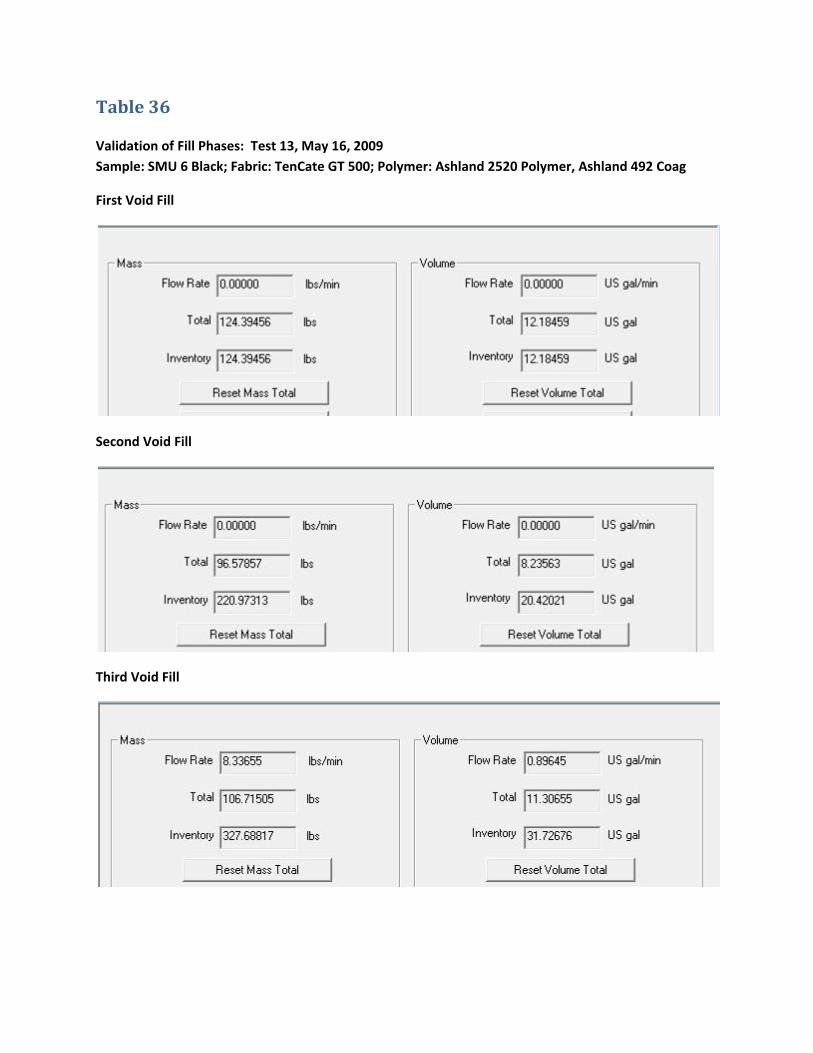
Table 36
Validation of Fill Phases: Test 13, May 16, 2009
Sample: SMU 6 Black; Fabric: TenCate GT 500; Polymer: Ashland 2520 Polymer, Ashland 492 Coag
First Void Fill
Second Void Fill
Third Void Fill
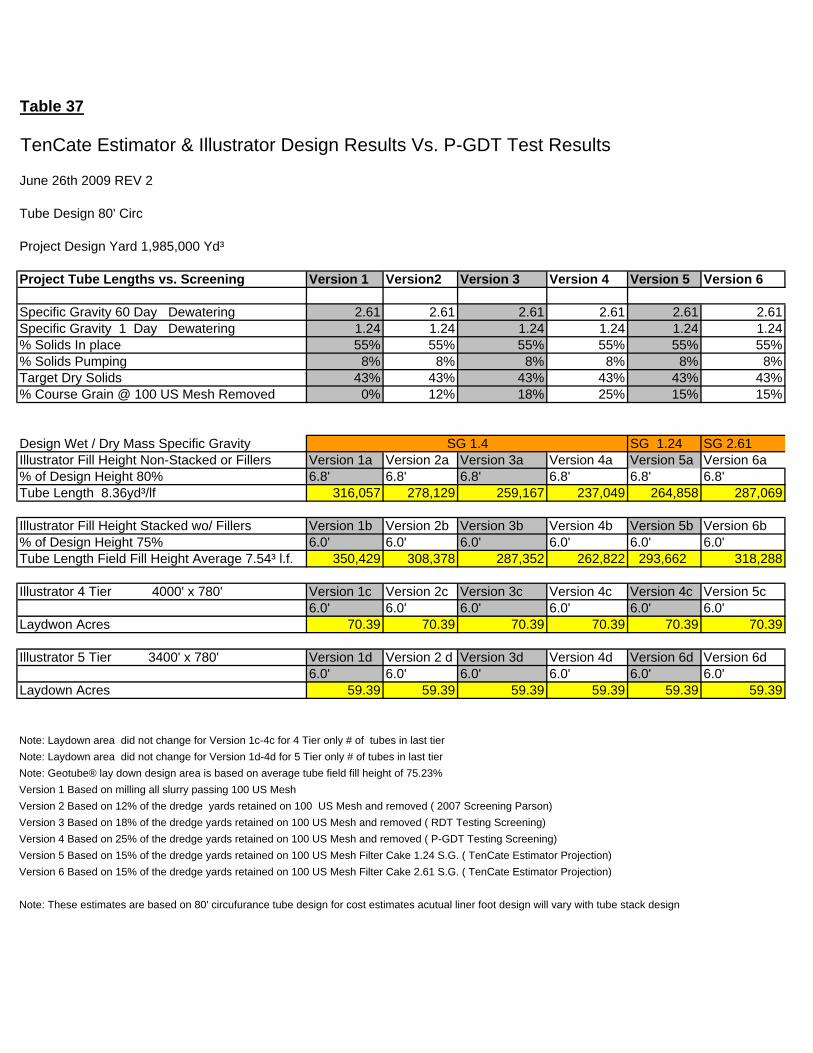
Table 37
TenCate Estimator & Illustrator Design Results Vs. P-GDT Test Results
June 26th 2009 REV 2
Tube Design 80' Circ
Project Design Yard 1,985,000 Yd³
Project Tube Lengths vs. Screening Version 1 Version2 Version 3 Version 4 Version 5 Version 6
Specific Gravity 60 Day Dewatering 2.61 2.61 2.61 2.61 2.61 2.61Specific Gravity 1 Day Dewatering 1.24 1.24 1.24 1.24 1.24 1.24% Solids In place 55% 55% 55% 55% 55% 55%% Solids Pumping 8% 8% 8% 8% 8% 8%Target Dry Solids 43% 43% 43% 43% 43% 43%% Course Grain @ 100 US Mesh Removed 0% 12% 18% 25% 15% 15%
Design Wet / Dry Mass Specific Gravity SG 1.24 SG 2.61Illustrator Fill Height Non-Stacked or Fillers Version 1a Version 2a Version 3a Version 4a Version 5a Version 6a% of Design Height 80% 6.8' 6.8' 6.8' 6.8' 6.8' 6.8'Tube Length 8.36yd³/lf 316,057 278,129 259,167 237,049 264,858 287,069
Illustrator Fill Height Stacked wo/ Fillers Version 1b Version 2b Version 3b Version 4b Version 5b Version 6b% of Design Height 75% 6.0' 6.0' 6.0' 6.0' 6.0' 6.0'Tube Length Field Fill Height Average 7.54³ l.f. 350,429 308,378 287,352 262,822 293,662 318,288
Illustrator 4 Tier 4000' x 780' Version 1c Version 2c Version 3c Version 4c Version 4c Version 5c6.0' 6.0' 6.0' 6.0' 6.0' 6.0'
Laydwon Acres 70.39 70.39 70.39 70.39 70.39 70.39
Illustrator 5 Tier 3400' x 780' Version 1d Version 2 d Version 3d Version 4d Version 6d Version 6d6.0' 6.0' 6.0' 6.0' 6.0' 6.0'
Laydown Acres 59.39 59.39 59.39 59.39 59.39 59.39
Note: Laydown area did not change for Version 1c-4c for 4 Tier only # of tubes in last tierNote: Laydown area did not change for Version 1d-4d for 5 Tier only # of tubes in last tierNote: Geotube® lay down design area is based on average tube field fill height of 75.23%Version 1 Based on milling all slurry passing 100 US MeshVersion 2 Based on 12% of the dredge yards retained on 100 US Mesh and removed ( 2007 Screening Parson)Version 3 Based on 18% of the dredge yards retained on 100 US Mesh and removed ( RDT Testing Screening)Version 4 Based on 25% of the dredge yards retained on 100 US Mesh and removed ( P-GDT Testing Screening)Version 5 Based on 15% of the dredge yards retained on 100 US Mesh Filter Cake 1.24 S.G. ( TenCate Estimator Projection)Version 6 Based on 15% of the dredge yards retained on 100 US Mesh Filter Cake 2.61 S.G. ( TenCate Estimator Projection)
Note: These estimates are based on 80' circufurance tube design for cost estimates acutual liner foot design will vary with tube stack design
SG 1.4
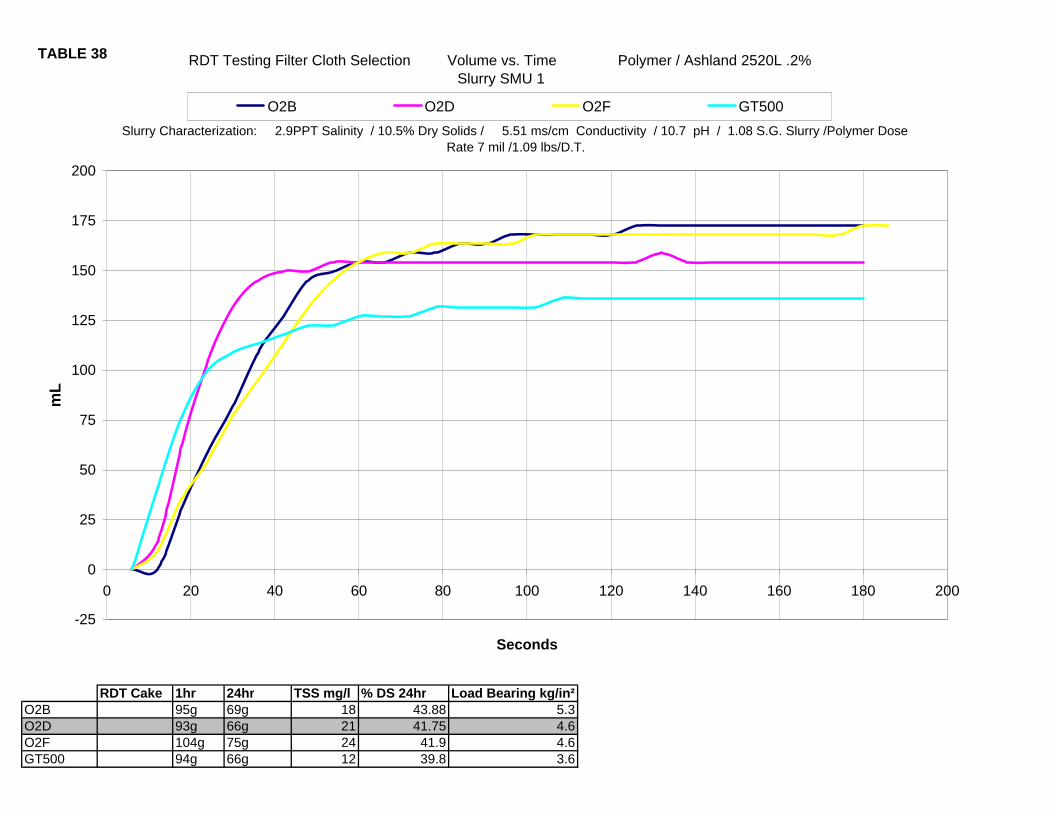
RDT Cake 1hr 24hr TSS mg/l % DS 24hr Load Bearing kg/in²O2B 95g 69g 18 43.88 5.3O2D 93g 66g 21 41.75 4.6O2F 104g 75g 24 41.9 4.6GT500 94g 66g 12 39.8 3.6
RDT Testing Filter Cloth Selection Volume vs. Time Polymer / Ashland 2520L .2%Slurry SMU 1
-25
0
25
50
75
100
125
150
175
200
0 20 40 60 80 100 120 140 160 180 200
Seconds
mL
O2B O2D O2F GT500Slurry Characterization: 2.9PPT Salinity / 10.5% Dry Solids / 5.51 ms/cm Conductivity / 10.7 pH / 1.08 S.G. Slurry /Polymer Dose
Rate 7 mil /1.09 lbs/D.T.
TABLE 38
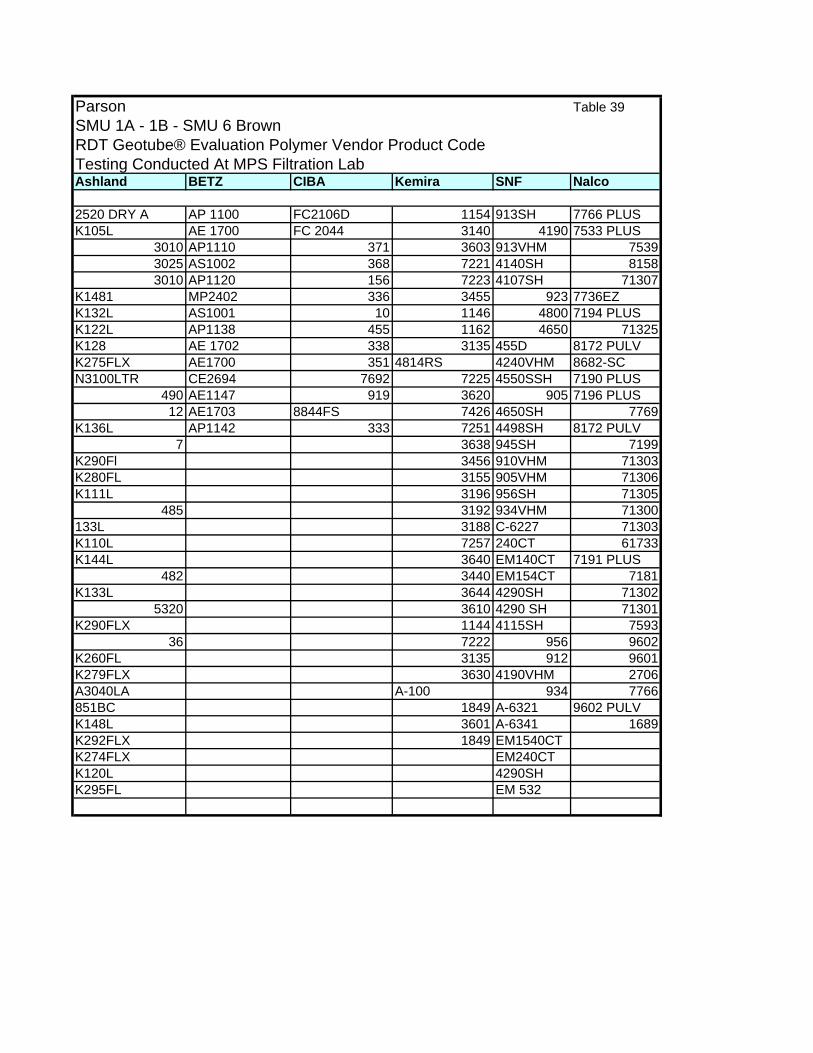
Parson Table 39SMU 1A - 1B - SMU 6 Brown RDT Geotube® Evaluation Polymer Vendor Product Code Testing Conducted At MPS Filtration LabAshland BETZ CIBA Kemira SNF Nalco
2520 DRY A AP 1100 FC2106D 1154 913SH 7766 PLUSK105L AE 1700 FC 2044 3140 4190 7533 PLUS
3010 AP1110 371 3603 913VHM 75393025 AS1002 368 7221 4140SH 81583010 AP1120 156 7223 4107SH 71307
K1481 MP2402 336 3455 923 7736EZK132L AS1001 10 1146 4800 7194 PLUSK122L AP1138 455 1162 4650 71325K128 AE 1702 338 3135 455D 8172 PULVK275FLX AE1700 351 4814RS 4240VHM 8682-SCN3100LTR CE2694 7692 7225 4550SSH 7190 PLUS
490 AE1147 919 3620 905 7196 PLUS12 AE1703 8844FS 7426 4650SH 7769
K136L AP1142 333 7251 4498SH 8172 PULV7 3638 945SH 7199
K290Fl 3456 910VHM 71303K280FL 3155 905VHM 71306K111L 3196 956SH 71305
485 3192 934VHM 71300133L 3188 C-6227 71303K110L 7257 240CT 61733K144L 3640 EM140CT 7191 PLUS
482 3440 EM154CT 7181K133L 3644 4290SH 71302
5320 3610 4290 SH 71301K290FLX 1144 4115SH 7593
36 7222 956 9602K260FL 3135 912 9601K279FLX 3630 4190VHM 2706A3040LA A-100 934 7766851BC 1849 A-6321 9602 PULVK148L 3601 A-6341 1689K292FLX 1849 EM1540CTK274FLX EM240CTK120L 4290SHK295FL EM 532