Embed Size (px)
Citation preview
Reducing the energy and water consumption of
TenCate Protect
Introducing process technology tools into the textile industry
29/05/2008
Public version S.I.M.L. van Golde Industrial Engineering and Management Master Thesis University of Twente Enschede, The Netherlands
2
Document title: Reducing the energy and water consumption of TenCate Protect Subtitle: Introducing process technology tools into the textile industry
Status: Master thesis Date: 29/05/2008
Initiator: TenCate Advanced Textiles BV (TCAT) Author: S.I.M.L. van Golde (s0044504)
Industrial Engineering and Management University Twente Faculty School of Management and Governance (SMG) Enschede, The Netherlands
Graduation Committee: Prof. dr. ir. M.J.F. Wouters SMG Dr. ir. A.G.J. van der Ham TNW H. Aal Bsc. TCAT
“The information contained in this report is subject to a confidentiality agreement between the author and Ten Cate Advanced Textiles bv. Hence, at least part of the information in this report is considered Confidential Information of Ten Cate Advanced Textiles bv and, as such, shall not be disclosed to any third party without the prior written consent of Ten Cate Advanced Textiles bv. Due to the confidential nature of the information in this document any unauthorized use or dissemination of the confidential information in whole or in part, in any way or form or to any extent, is strictly prohibited.”

3
“We moeten de achterkant meer naar de voorkant brengen!”
(Loek de Vries, CEO of TenCate; New Year’s speech, 30th January 2008)
4
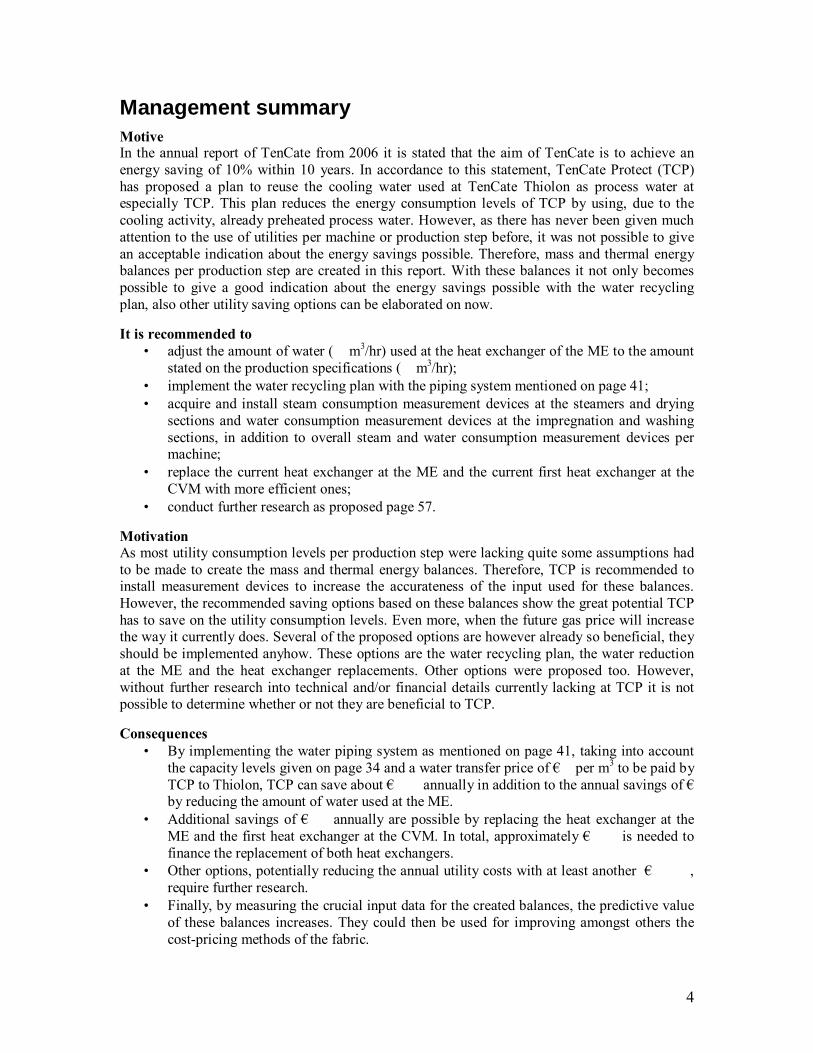
Management summary
Motive In the annual report of TenCate from 2006 it is stated that the aim of TenCate is to achieve an energy saving of 10% within 10 years. In accordance to this statement, TenCate Protect (TCP) has proposed a plan to reuse the cooling water used at TenCate Thiolon as process water at especially TCP. This plan reduces the energy consumption levels of TCP by using, due to the cooling activity, already preheated process water. However, as there has never been given much attention to the use of utilities per machine or production step before, it was not possible to give an acceptable indication about the energy savings possible. Therefore, mass and thermal energy balances per production step are created in this report. With these balances it not only becomes possible to give a good indication about the energy savings possible with the water recycling plan, also other utility saving options can be elaborated on now. It is recommended to
• adjust the amount of water ( m3/hr) used at the heat exchanger of the ME to the amount stated on the production specifications ( m3/hr);
• implement the water recycling plan with the piping system mentioned on page 41; • acquire and install steam consumption measurement devices at the steamers and drying
sections and water consumption measurement devices at the impregnation and washing sections, in addition to overall steam and water consumption measurement devices per machine;
• replace the current heat exchanger at the ME and the current first heat exchanger at the CVM with more efficient ones;
• conduct further research as proposed page 57. Motivation As most utility consumption levels per production step were lacking quite some assumptions had to be made to create the mass and thermal energy balances. Therefore, TCP is recommended to install measurement devices to increase the accurateness of the input used for these balances. However, the recommended saving options based on these balances show the great potential TCP has to save on the utility consumption levels. Even more, when the future gas price will increase the way it currently does. Several of the proposed options are however already so beneficial, they should be implemented anyhow. These options are the water recycling plan, the water reduction at the ME and the heat exchanger replacements. Other options were proposed too. However, without further research into technical and/or financial details currently lacking at TCP it is not possible to determine whether or not they are beneficial to TCP. Consequences
• By implementing the water piping system as mentioned on page 41, taking into account the capacity levels given on page 34 and a water transfer price of € per m3 to be paid by TCP to Thiolon, TCP can save about € annually in addition to the annual savings of € by reducing the amount of water used at the ME.
• Additional savings of € annually are possible by replacing the heat exchanger at the ME and the first heat exchanger at the CVM. In total, approximately € is needed to finance the replacement of both heat exchangers.
• Other options, potentially reducing the annual utility costs with at least another € , require further research.
• Finally, by measuring the crucial input data for the created balances, the predictive value of these balances increases. They could then be used for improving amongst others the cost-pricing methods of the fabric.
5
Index Abbreviations & Symbols .............................................................................................7 Acknowledgements........................................................................................................8 Chapter 1. Project outline.............................................................................................9
§1.1 Introduction.........................................................................................................9 §1.2 Research problem .............................................................................................. 10 §1.3 Research questions ............................................................................................ 10
Chapter 2. Current production situation ................................................................... 13 §2.1 General production process................................................................................ 13
§2.1.1 Pretreatment...........................................................................................................13 §2.1.2 Dyeing....................................................................................................................15 §2.1.3 Finishing ................................................................................................................16
§2.2 Energy and water consumption levels per machine ............................................ 18 §2.3 Selection of program to create mass and thermal energy balances...................... 21 §2.4 Mass and thermal energy balances per machine ................................................. 22
§2.4.1 General information ...............................................................................................22 §2.4.2 Singeing and continuous bleaching machine...........................................................24 §2.4.3 Mercerizing machine ..............................................................................................26 §2.4.4 Pre-dyeing machine with/without thermosol............................................................27 §2.4.5 Continuous dyeing machine ....................................................................................27 2.4.6 Discontinuous dyeing ...............................................................................................28 2.4.7 Stenter frames ..........................................................................................................29 2.4.8 Thermex hotflue........................................................................................................29 2.4.9 Sanfor ......................................................................................................................30
Chapter 3. Production situation in the near future ................................................... 31 §3.1 Integration of the flame retardant line with TCP ................................................ 31 §3.2 Effects of the water recycling plan..................................................................... 33
§3.2.1 Water allocation scenarios .....................................................................................35 §3.2.2 Cost savings per scenario .......................................................................................38 §3.2.3 Conclusions drawn from the water recycling plan analysis .....................................39
Chapter 4. Additional savings in utility consumption ............................................... 42 §4.1 Financial parameters used for investment decisions by TCP .............................. 42 §4.2 Savings at washing baths ................................................................................... 43
§4.2.1 Singeing and continuous bleaching machine...........................................................44 §4.2.2 Mercerizing machine ..............................................................................................46 §4.2.3 Continuous dyeing machine ....................................................................................46 §4.2.4 Flame retardant line...............................................................................................47
§4.3 Savings at drying sections.................................................................................. 47 §4.3.1 Drying cylinders.....................................................................................................48 §4.3.2 IR-dryers ................................................................................................................48 §4.3.3 Hotflue + drums .....................................................................................................48
§4.4 Savings at steamers............................................................................................ 49 §4.5 Savings at fixation sections................................................................................ 49 §4.6 Feasibility study of the proposed saving options ................................................ 50
§4.6.1 Heat exchangers at the singeing and continuous bleaching machine .......................51 §4.6.2 Replacement of the current heat exchanger at the mercerizing machine ..................52 §4.6.3 Replacement of the current heat exchanger at the continuous dyeing machine.........52
§4.7 Summary of the potential utility saving options ................................................. 53
6
Chapter 5. Results ....................................................................................................... 55 §5.1 Conclusions ....................................................................................................... 55 §5.2 Recommendations ............................................................................................. 56
References.................................................................................................................... 59 Appendix 1. TenCate Nijverdal-North....................................................................... 62 Appendix 2. Steam production at the TenCate location in Nijverdal-North ............ 63 Appendix 3. Gas price 2005-2008 ............................................................................... 64 Appendix 4. Created mass and energy balances ........................................................ 65
Appendix 4.1 ZE + CBB ............................................. Error! Bookmark not defined. Appendix 4.2 ME........................................................ Error! Bookmark not defined. Appendix 4.3 VV/TH.................................................. Error! Bookmark not defined. Appendix 4.4 CVM..................................................... Error! Bookmark not defined. Appendix 4.5 Discontinuous dyeing ............................ Error! Bookmark not defined. Appendix 4.6 SR......................................................... Error! Bookmark not defined.
Appendix 4.6.1 SR 6 ..............................................................Error! Bookmark not defined. Appendix 4.6.2 SR 7 ..............................................................Error! Bookmark not defined. Appendix 4.6.3 SR 8 ..............................................................Error! Bookmark not defined. Appendix 4.6.4 SR 9 ..............................................................Error! Bookmark not defined.
Appendix 4.7 Thermex................................................ Error! Bookmark not defined. Appendix 4.8 Sanfor ................................................... Error! Bookmark not defined.
Appendix 5. FRL............................................................... Error! Bookmark not defined. Appendix 6. Scenarios of the water recycling plan .......... Error! Bookmark not defined. Appendix 7. Utility costs per machine in the near future Error! Bookmark not defined.
Pages mentioned in this index are referring to the original and confidential report.
7
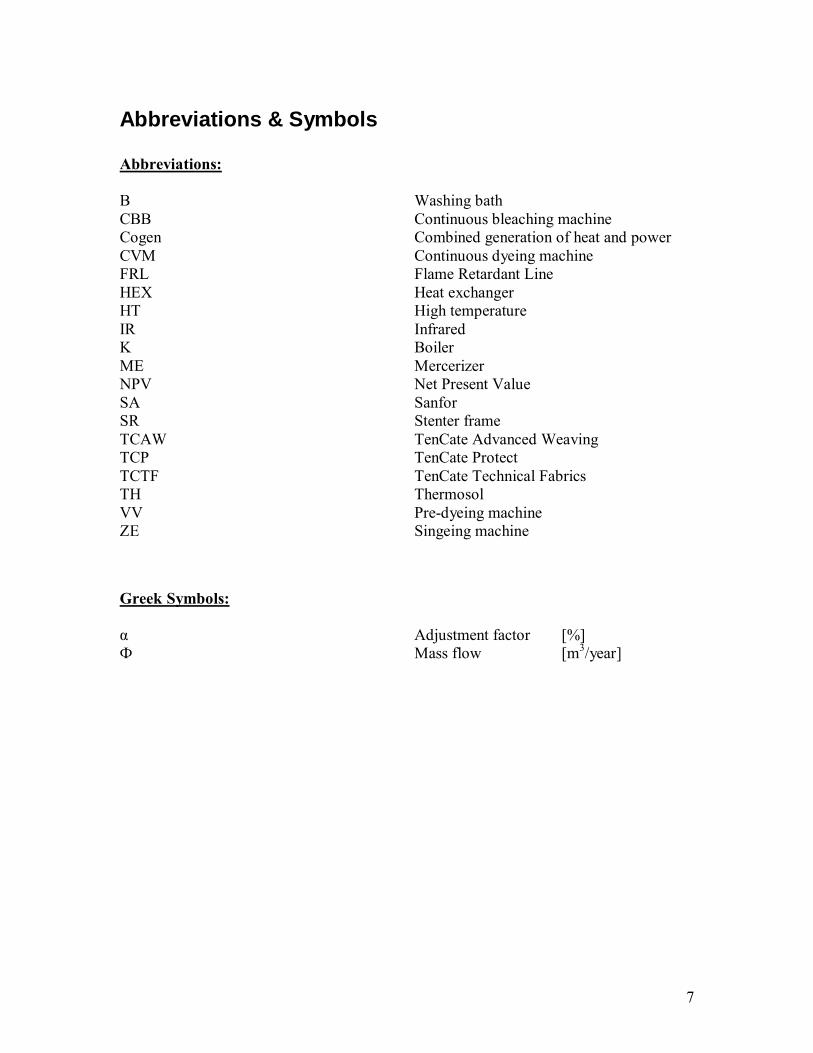
Abbreviations & Symbols Abbreviations: B Washing bath CBB Continuous bleaching machine Cogen Combined generation of heat and power CVM Continuous dyeing machine FRL Flame Retardant Line HEX Heat exchanger HT High temperature IR Infrared K Boiler ME Mercerizer NPV Net Present Value SA Sanfor SR Stenter frame TCAW TenCate Advanced Weaving TCP TenCate Protect TCTF TenCate Technical Fabrics TH Thermosol VV Pre-dyeing machine ZE Singeing machine Greek Symbols: α Adjustment factor [%] Ф Mass flow [m3/year]
8
Acknowledgements This research has been conducted as graduation assignment of my master Industrial Engineering and Management at the University of Twente. During the six months of work I have been accompanied and supported by many people. Here, I would like to take the opportunity to express my gratitude to all of them. First of all I would like to thank my supervisors from TenCate Protect, Henri Aal and Bert Heesink, for given me the opportunity to conduct this research under their guidance. Furthermore, I am very thankful for the fact they were always available for answering my questions. Next, I would like to express my gratitude to my supervisors from university, Louis van der Ham and Marc Wouters, for their guidance during this graduation assignment. Their advices for structuring the thesis are especially appreciated. I am also indebted to Dick Rosman, Gerard Scheffer, and all the other technology experts of TenCate Protect who helped me gathering the required information for completing the research. Without their cooperation most of this report could not have been written. A last, but certainly not least, thanks goes to my roommates Tatjana, Marijn, Charlotte, Simone, Monique, and Mike for their support and for providing an utmost pleasant atmosphere at the office. I am truly thankful to you all. The list above is far from complete. It is however impossible to name each and everyone who help me during the past six months. Big thanks to all of you and my apologies to those I may have forgotten. May 29th 2008, Bas van Golde
9
Chapter 1. Project outline
§1.1 Introduction TenCate has a history in the textile industry that goes back as far as 1704. By constantly adapting to changing circumstances, TenCate has developed from a craftsman driven textile manufacturer into a multinational company that combines advanced textile technology with related chemical processes. Nowadays, TenCate develops and produces specialist materials with specific properties within eight different market groups. Each market group has its own products, markets and customer base. One of these eight market groups is TenCate Protect (TCP) whose objective is to create fabrics to protect people on the job from the harmful effects of heat, flame and other related risks. The primary applications in which its products are used include fire fighting, military and many industrial areas such as chemical, petrochemical, electrical and molten metal processing. TCP has production sites in Union City in the USA and in Nijverdal in The Netherlands. This research focuses only on the production site of TCP in Nijverdal. Here, TCP shares the location in Nijverdal-North with production sites of several other market groups of TenCate (see Appendix 1). As can be read in the annual report of 2006 of TenCate, environmental protection has become a major issue for production sites of TenCate like the one of TCP in Nijverdal [1]: “Most Dutch production sites have been certified in accordance with ISO standard 14001. This environmental protection system is the basis on which TenCate strives to limit the use of raw materials, water and energy consumption and emissions. Working jointly with raw material suppliers and customers, the company continuously examines possible ways of reducing environmental effects. Examples include replacing chemical additives by environmentally friendly materials, improving the production process, reducing energy and water consumption, reusing hot process water and analyzing energy and waste flows.”
“Operating companies have also entered into agreements with industry associations to reduce water and energy consumption at industry level. These agreements have been set out in a covenant. The aim of this covenant is to achieve an energy saving of 10% within 10 years.” In accordance to this strategy, a research has been recently conducted concerning the reduction of the total water consumption at the TenCate location in Nijverdal-North by reusing water between production sites. This research resulted in a plan that reduces the total water consumption of the production location with % by reusing the cooling water used at one of the sites as process water at different other sites [2,3]. This plan also reduces the energy consumption levels by using, due to the cooling activity, already preheated process water, especially at TCP. This process water needs less additional heating to reach the required temperature for the processes it is needed for than the water previously used.
10
However, at TenCate, and thus at TCP too, there has never been given much attention to the use of utilities before due to the fact that the business culture at lower management and production levels is still craftsman like: “As long as the end product meets the quality standards and it can be sold for a good price in its specific market, the way it is produced is of secondary interest.” [11]. Due to this craftsman like mentality, little is known about the consumption levels of utilities per machine at TenCate, let alone, about the consumption levels per production step on a machine and the interaction subsequent production steps have on the utility usage of each other. Therefore, it is currently not possible to give an indication about the additional savings besides the reduction in total water usage that can be made by the above mentioned plan. This seems in conflict with the statements in the annual report of 2006. Loek de Vries, CEO of TenCate, has identified this same discrepancy between the higher management levels of TenCate and the work floor in several other areas too. He captured this difference in mentality during the New Year’s speech of 2008 for the employees of TenCate in the sentence quoted on page 3.
§1.2 Research problem The research mentioned above only looked at possibilities to reuse water between the different production sites in Nijverdal-North. However, the total savings possible with this plan could not be determined yet as information about possible savings in energy consumption levels especially at TCP due to the use of preheated water is not known. In order to give a good estimation about these savings a better understanding is needed about the energy consumption levels at TCP and the most important triggers influencing it. Furthermore, with a better understanding of the utility consumption at TCP it is possible to identify other options open for TCP to reduce the utility consumption levels in coherence with corporate strategy. So, by creating a better understanding of the utility consumption at TCP it is possible to continue to the next stage in the energy and water reduction strategy of TenCate for TCP. The resulting research problem is as follows:
How can the energy and water consumption levels be reduced optimally for TCP in addition to already existing plans affecting the use of these utilities at the location of
TenCate in Nijverdal-North?
§1.3 Research questions In order to find an answer to the research problem, an analysis of the current energy and water consumption of TCP is crucial and needs to be done first. At TCP there are about eight different machines used for the production of the fabrics. Most of these machines consist of multiple production steps. As these steps vary in their very nature, from impregnation to cooling and from washing to drying, it is decided to analyze the energy and water consumption of these different production steps per machine by means of combined mass and thermal energy balances. By doing so, not only the differences in energy and water consumption per production step can be analyzed, it is also possible for each of the production steps to take into account the influence preceding and subsequent steps on the same machine have on them, creating a more accurate picture of reality.
11
Now, one problem occurs as mentioned before. As the textile industry was a craftsman driven industry for not only decades but even for centuries, there has never been given much attention to data about water and energy consumption levels until relatively recently. As long as the fabric met the standards, the way it was produced was of secondary interest [11]. This can also be concluded from the fact that for most of the machines, let alone for most of the production steps on the different machines, equipment to measure the water and energy usage is lacking. Therefore, no consumption levels during a production run are known at TCP. As a result, only the total water and energy consumption per year of TCP as a whole is known from the yearly bills. The total gas usage forms an exception. For gas, the yearly consumption levels are already measured per machine, but not per production run [8]. In the year 2000, however, TCP has conducted a first and still most recent factory wide investigation in which the yearly consumption levels of water, gas, steam, and electricity per machine were determined [9]. The results of this investigation are still to be believed quite accurate by technology experts of TCP [4,11]. Based on these results and some additional information on changes on the machines during the last seven to eight years a yearly consumption level per machine for the other three utilities, in addition to the already known gas usage per machine, can be estimated. Measuring these data during this project was not possible due to time constraints. Furthermore, certain measuring devices were lacking and some machines do not give the option to measure certain parameters. As the mass and thermal energy balances mentioned before were not present at TCP prior to the project at hand, as can be expected when most utility consumption levels are not even being measured, the estimated consumption levels are used together with process specific information, like recipes and setting parameters, as starting point for the creation of these balances. Basing the mass and energy balances solely on the process specific information is not preferred, as for too many production steps these settings are not known due to the same reasons as for the consumption levels. This would result in many assumptions completely out of the blue without support of data from TCP. To create more accurate mass and energy balance this is tried to be overcome as much as possible and so the estimated yearly consumption levels per machine and the known process specific information are used both. To create these mass and thermal energy balances for the analysis of the current production and utility consumption at TCP the first eight research questions are being answered in Chapter 2. With this information in mind, the balances are programmed in such a matter that they are also useful for evaluating the energy and water savings proposed in latter stages of this research. The balances are presented in Appendix 4 as are the detailed calculations made in order to create these balances.
1. Which production machines are used at TCP? 2. What are the main production steps at these machines? 3. What are the energy and water sources used by TCP? 4. What is the energy and water consumption level per year of each of these
machines at TCP? 5. What are the cost prices for the energy sources and the water used by TCP? 6. Which software program can be used best to create the mass and thermal energy
balances with?
12
7. Which process specific information per machine is known by TCP? 8. Which parameters need to be estimated in order to be able to create the mass and
thermal energy balances? As several other current projects at TenCate influence the energy and water consumption levels at TCP for the coming year, Chapter 3 elaborates on these projects and gives an overview of the consequences of these projects for TCP. One of these projects is the already mentioned plan on page 9 for reusing the cooling water of one of the production sites of TenCate in Nijverdal-North at other production sites on the same location. For this plan the energy savings can now be estimated with the created balances. The information needed for this chapter results from interviews with the founders of the plans and with the different technology experts of TCP.
9. What other plan(s) exist(s) within TenCate that influence the energy and water consumption at TCP within the coming year?
10. What are the effects of these other plans on the energy and water consumption at TCP?
11. What are the consequences, especially financially, for TCP of using the water previously used as cooling water at one of the production sites at the TenCate location in Nijverdal-North?
When research questions 1 till 11 are answered, an overview and better understanding of the production processes and the energy and water consumption levels of TCP in the near future are given and the energy savings of the mentioned plan for reusing water between production sites are known. During the creation of the mass and thermal energy balances additional utility saving possibilities are being thought of. These possibilities are mentioned in Chapter 4. For all these options the potential utility cost savings are determined using the created mass and thermal energy balances. To rate the attractiveness of these options a net present value calculation [60] is done based on financial parameters, like discount rate and pay-back time, used by TenCate [63]. Due to time constraints the investment costs involved could not be determined for all options. For these options a sensitivity analysis is made to give at least an indication about the allowable investment costs.
12. What are the additional utility saving options for TCP reviewed in this research? 13. What are the potential utility cost savings of these proposed options? 14. What investments are needed for the different proposed options? 15. What are typical values used by TCP for the financial parameters needed in a net
present value calculation? 16. Which of the proposed options to potentially reduce the utility consumption levels
at TCP are interesting from a financial viewpoint? After answering all the research questions mentioned above, an answer to the research problem can be provided. The main conclusions and recommendations are stated in Chapter 5.
13
Chapter 2. Current production situation As was mentioned in Chapter 1, this chapter gives an analysis of the current production processes at TCP and the energy and water consumption levels per production step. This results in mass and energy balances for all the production machines of TCP. To create these balances, a general description of the production machines and their process steps is given in Paragraph 2.1 first. The energy and water consumption levels per machine are estimated in Paragraph 2.2. As already stated on page 11, only the gas usage per machine is known for 2007. The most recent and still quite accurate data for the other utilities resulted from an investigation in 2000 [4,11]. Combined with information about changes to the machines, the consumption levels for the other utilities in 2007 can be estimated. In Paragraph 2.3 the software program to create the mentioned mass and energy balances with for the different production steps per machine is chosen. This is mainly done on basis of the availability and accuracy of the gathered process specific information. The manner in which the balances are created and the conclusions resulting from them are given in Paragraph 2.4 and the balances themselves are presented in Appendix 4.
§2.1 General production process TCP produces fabrics, mainly combinations of cotton and polyester, which protect people on their job from the harmful effects of heat, flame and other related risks by refining unprocessed fabrics obtained from TCAW or other weavers. In general, the production processes at TCP can be subdivided in three major stages:
• Pretreatment • Dyeing • Finishing
The unprocessed fabric goes through all of these three stages. Within each stage the processing route and recipes used for the fabric can differ depending on the composition and required quality of the fabric. In the following three sub-paragraphs the production machines and their process steps are described. Per machine a general flowchart of the fabric through the process steps is given. A more detailed flowchart per machine is created and used for the creation of the mass and energy balances in Paragraph 2.4.
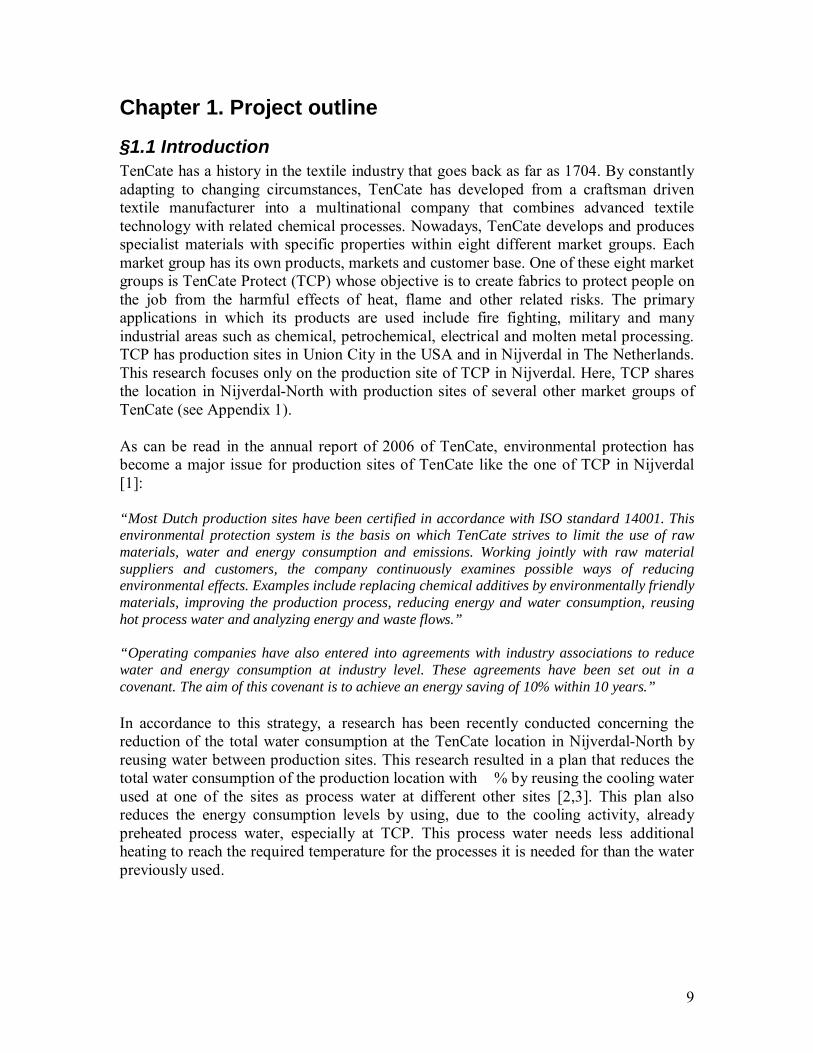
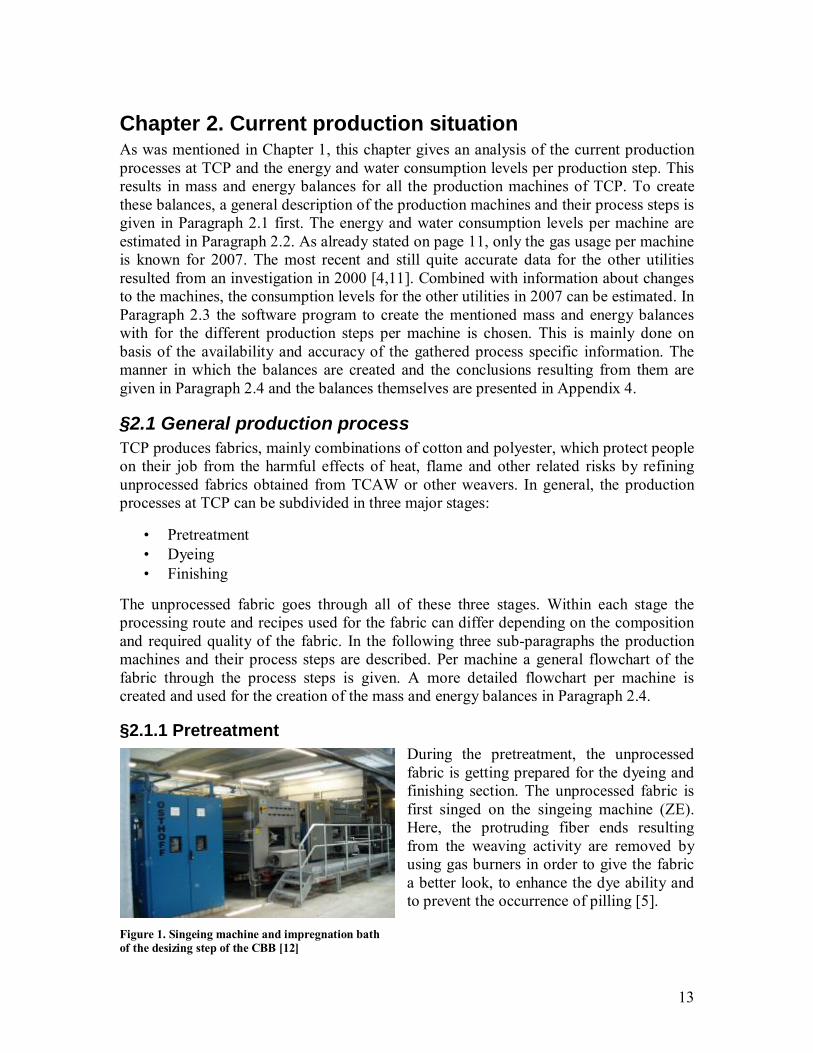
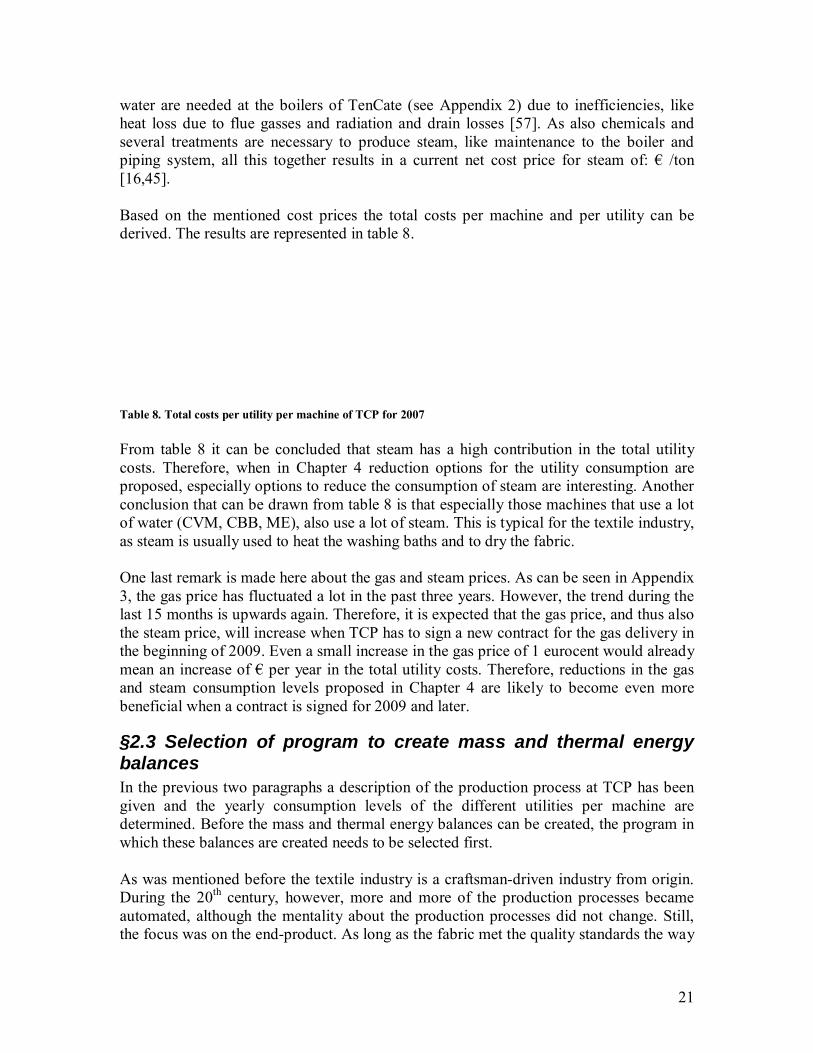
§2.1.1 Pretreatment During the pretreatment, the unprocessed fabric is getting prepared for the dyeing and finishing section. The unprocessed fabric is first singed on the singeing machine (ZE). Here, the protruding fiber ends resulting from the weaving activity are removed by using gas burners in order to give the fabric a better look, to enhance the dye ability and to prevent the occurrence of pilling [5].
Figure 1. Singeing machine and impregnation bath of the desizing step of the CBB [12]
14
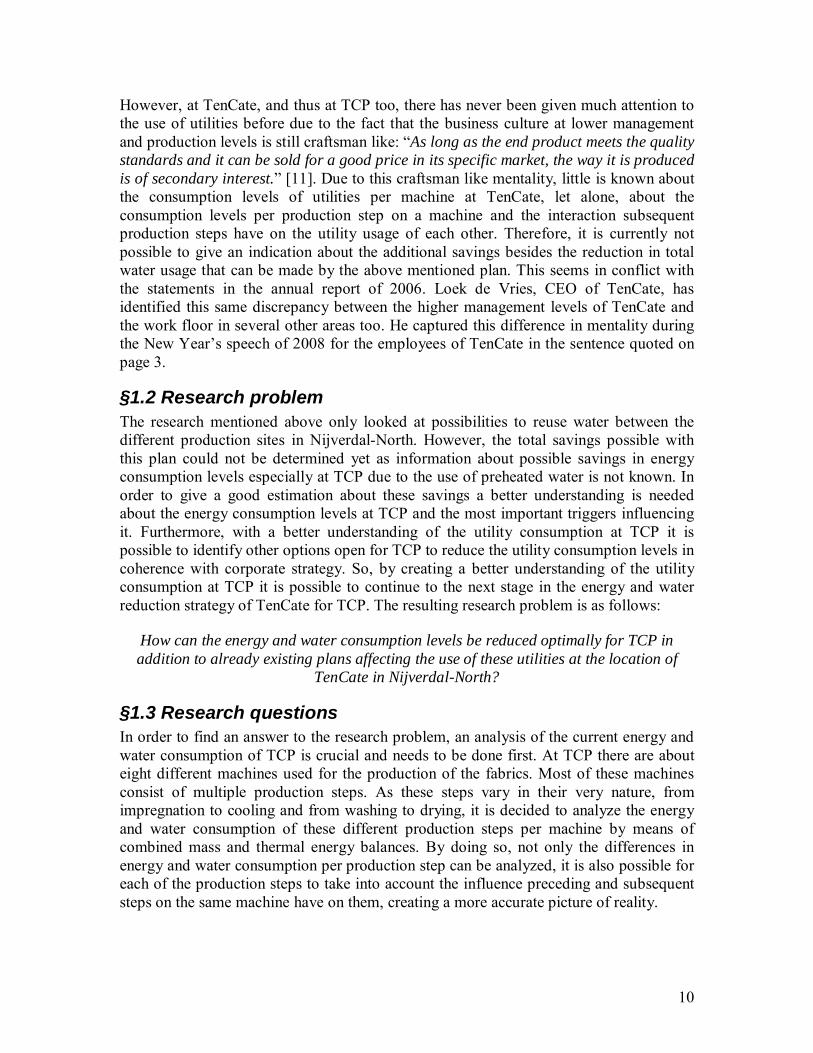
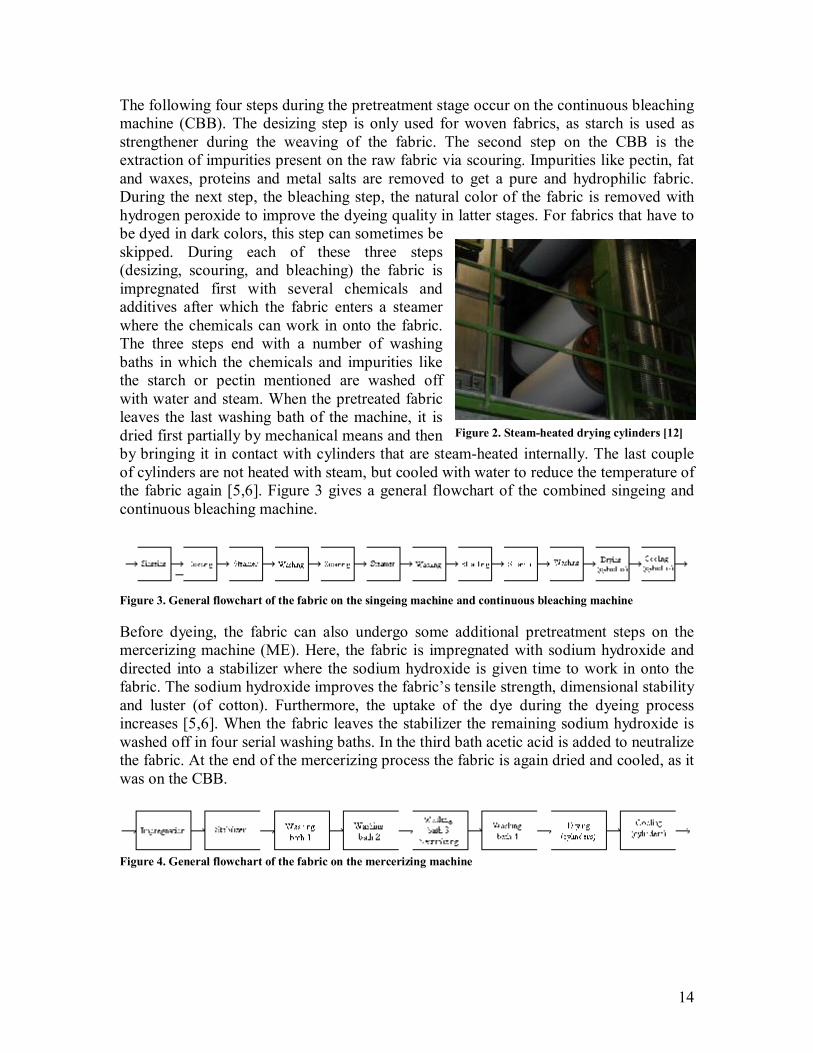
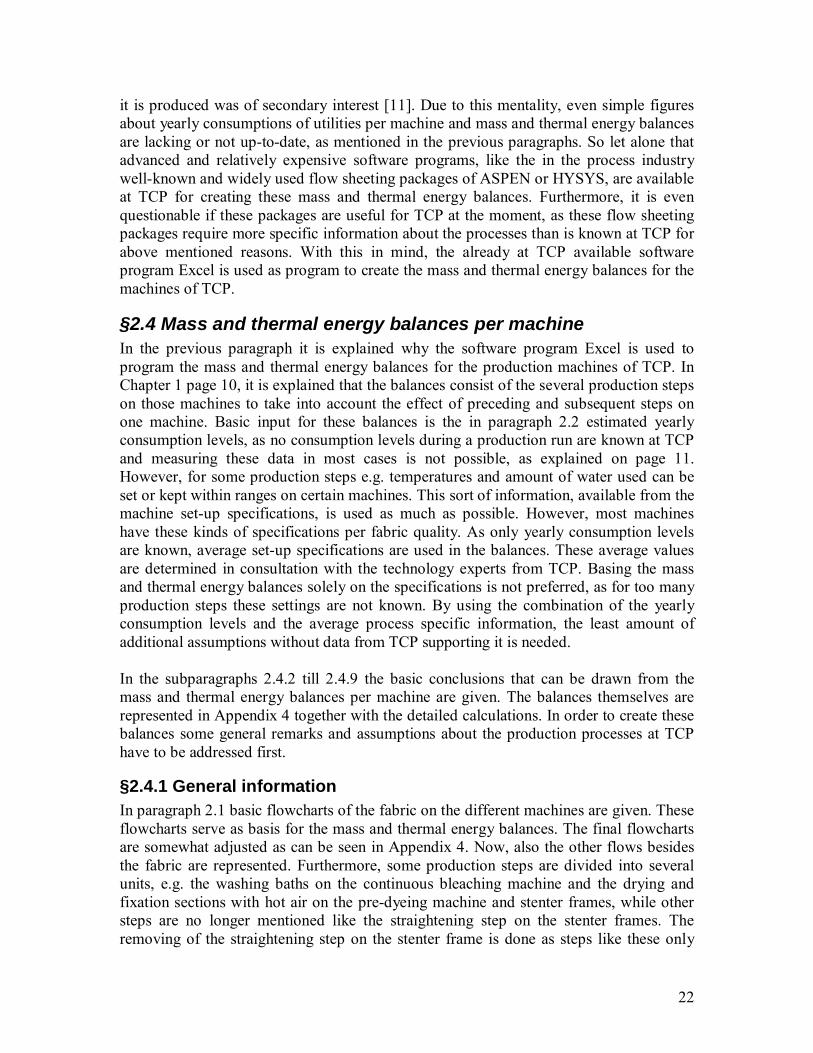
Figure 2. Steam-heated drying cylinders [12]
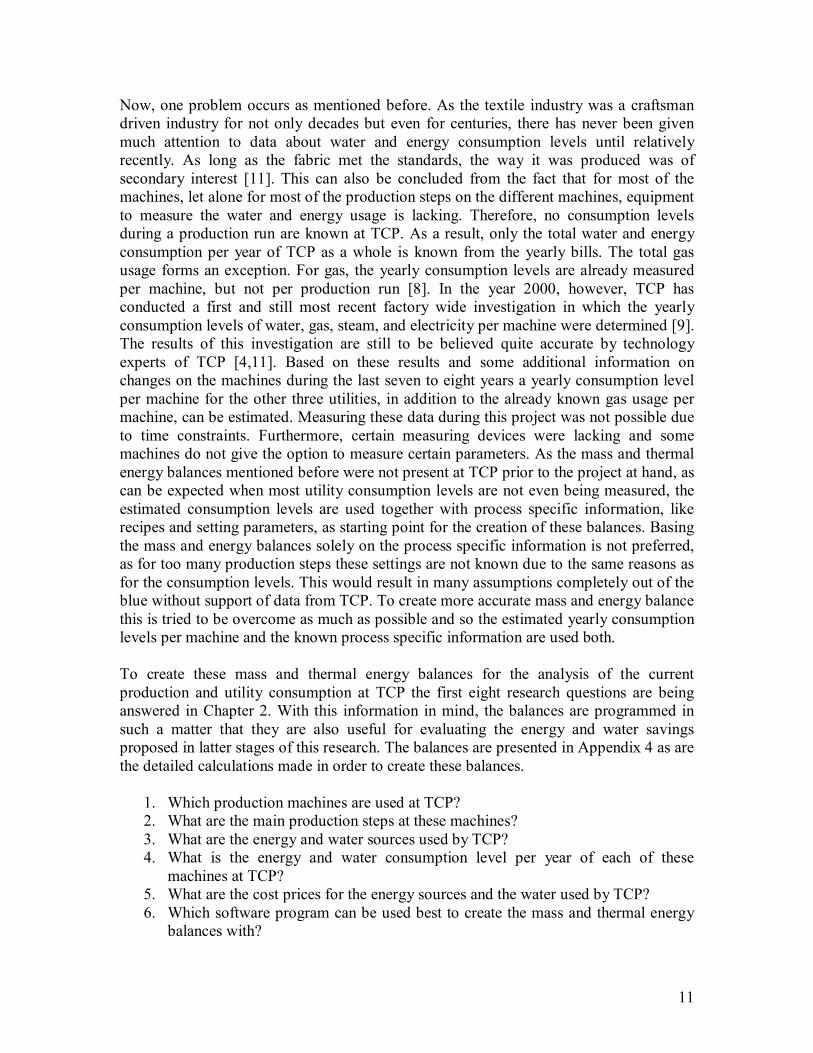
The following four steps during the pretreatment stage occur on the continuous bleaching machine (CBB). The desizing step is only used for woven fabrics, as starch is used as strengthener during the weaving of the fabric. The second step on the CBB is the extraction of impurities present on the raw fabric via scouring. Impurities like pectin, fat and waxes, proteins and metal salts are removed to get a pure and hydrophilic fabric. During the next step, the bleaching step, the natural color of the fabric is removed with hydrogen peroxide to improve the dyeing quality in latter stages. For fabrics that have to be dyed in dark colors, this step can sometimes be skipped. During each of these three steps (desizing, scouring, and bleaching) the fabric is impregnated first with several chemicals and additives after which the fabric enters a steamer where the chemicals can work in onto the fabric. The three steps end with a number of washing baths in which the chemicals and impurities like the starch or pectin mentioned are washed off with water and steam. When the pretreated fabric leaves the last washing bath of the machine, it is dried first partially by mechanical means and then by bringing it in contact with cylinders that are steam-heated internally. The last couple of cylinders are not heated with steam, but cooled with water to reduce the temperature of the fabric again [5,6]. Figure 3 gives a general flowchart of the combined singeing and continuous bleaching machine.
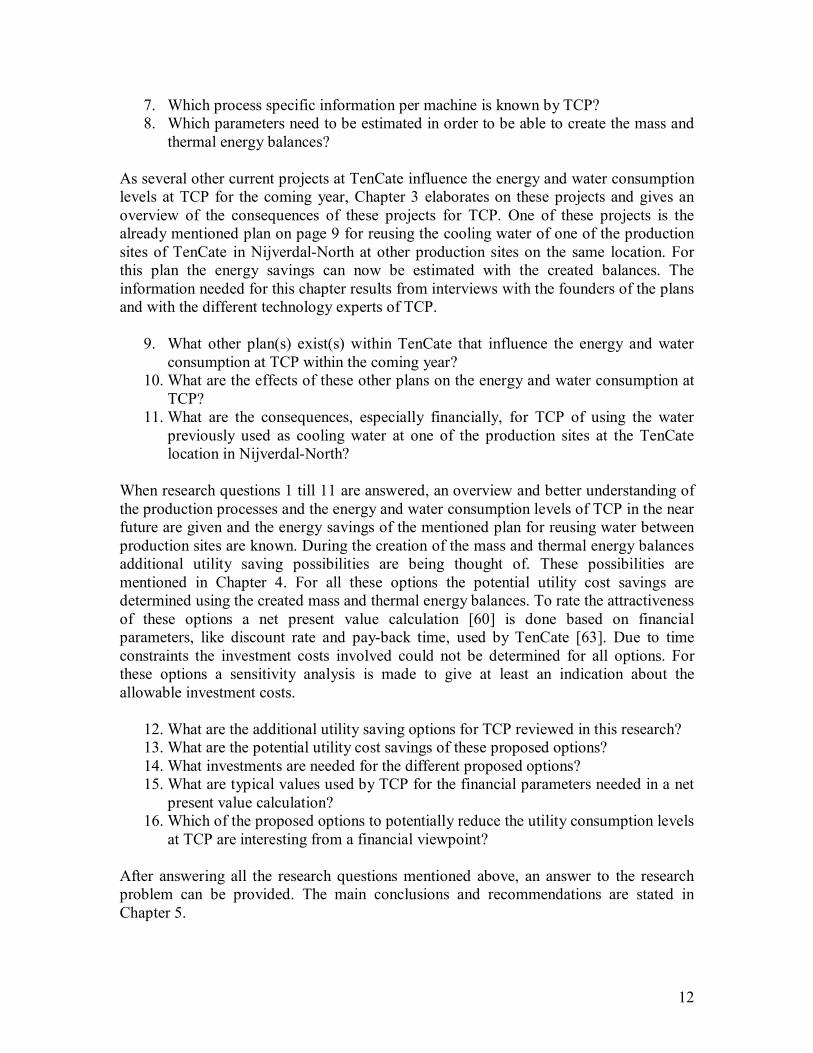
Figure 3. General flowchart of the fabric on the singeing machine and continuous bleaching machine Before dyeing, the fabric can also undergo some additional pretreatment steps on the mercerizing machine (ME). Here, the fabric is impregnated with sodium hydroxide and directed into a stabilizer where the sodium hydroxide is given time to work in onto the fabric. The sodium hydroxide improves the fabric’s tensile strength, dimensional stability and luster (of cotton). Furthermore, the uptake of the dye during the dyeing process increases [5,6]. When the fabric leaves the stabilizer the remaining sodium hydroxide is washed off in four serial washing baths. In the third bath acetic acid is added to neutralize the fabric. At the end of the mercerizing process the fabric is again dried and cooled, as it was on the CBB.
Figure 4. General flowchart of the fabric on the mercerizing machine
15
§2.1.2 Dyeing After the pretreatment stage, the dyeing of the fabric can take place. Dyeing can be carried out in batch or in continuous/semi-continuous mode. The choice between the two modes depends on the type of fiber, the type of dye, the equipment available and the costs involved. Both modes involve the following steps [6]:
• Preparation of the dye • Impregnation of the fabric with the dye • Fixation of the dye onto the fabric • Washing off redundant dye • Drying of the fabric • Cooling of the fabric
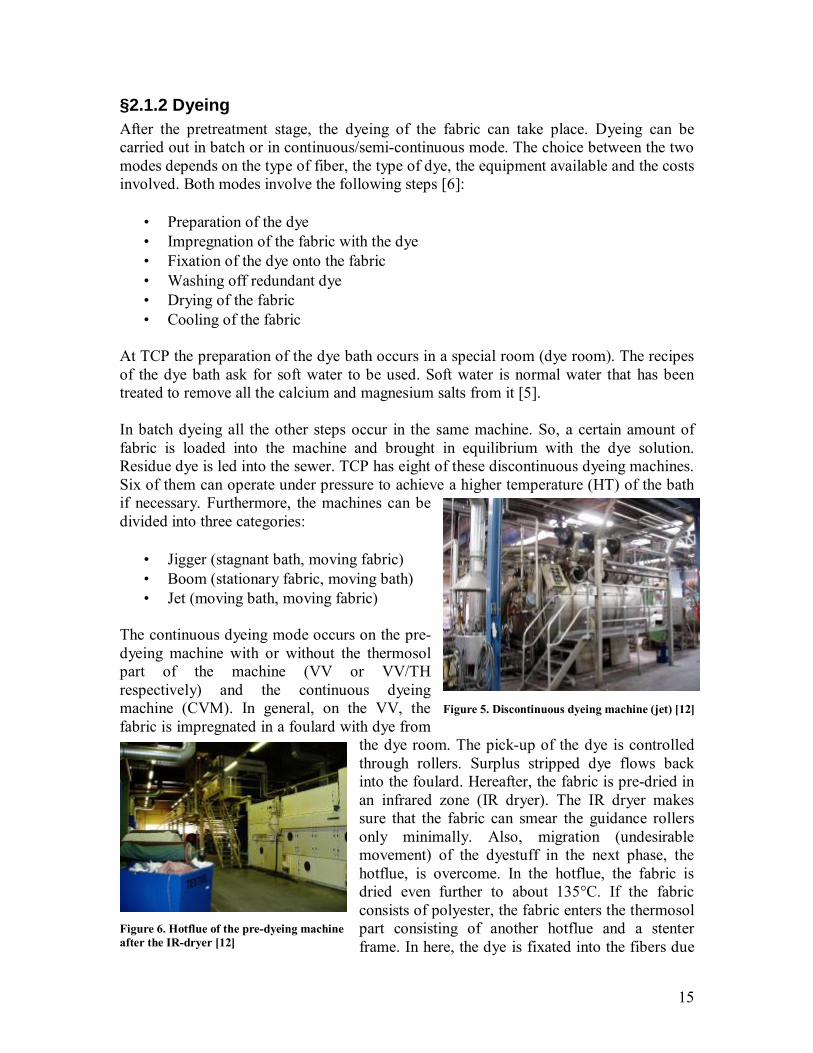
At TCP the preparation of the dye bath occurs in a special room (dye room). The recipes of the dye bath ask for soft water to be used. Soft water is normal water that has been treated to remove all the calcium and magnesium salts from it [5]. In batch dyeing all the other steps occur in the same machine. So, a certain amount of fabric is loaded into the machine and brought in equilibrium with the dye solution. Residue dye is led into the sewer. TCP has eight of these discontinuous dyeing machines. Six of them can operate under pressure to achieve a higher temperature (HT) of the bath if necessary. Furthermore, the machines can be divided into three categories:
• Jigger (stagnant bath, moving fabric) • Boom (stationary fabric, moving bath) • Jet (moving bath, moving fabric)
The continuous dyeing mode occurs on the pre-dyeing machine with or without the thermosol part of the machine (VV or VV/TH respectively) and the continuous dyeing machine (CVM). In general, on the VV, the fabric is impregnated in a foulard with dye from
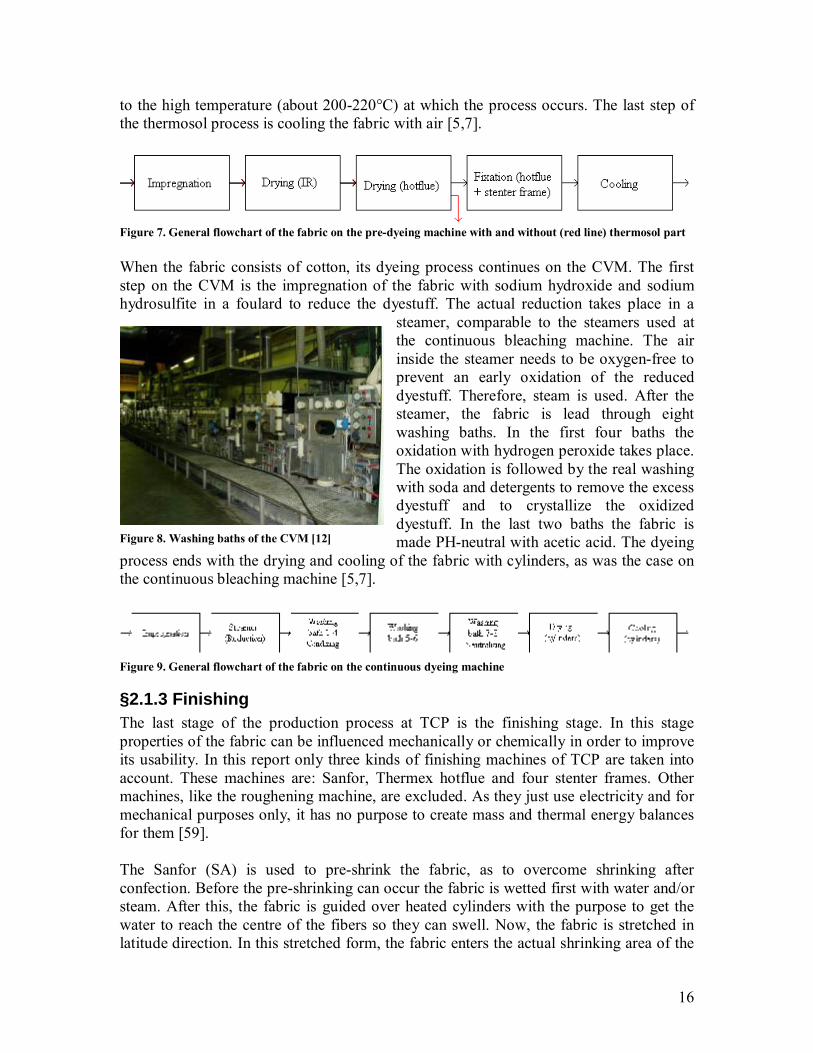
the dye room. The pick-up of the dye is controlled through rollers. Surplus stripped dye flows back into the foulard. Hereafter, the fabric is pre-dried in an infrared zone (IR dryer). The IR dryer makes sure that the fabric can smear the guidance rollers only minimally. Also, migration (undesirable movement) of the dyestuff in the next phase, the hotflue, is overcome. In the hotflue, the fabric is dried even further to about 135°C. If the fabric consists of polyester, the fabric enters the thermosol part consisting of another hotflue and a stenter frame. In here, the dye is fixated into the fibers due
Figure 5. Discontinuous dyeing machine (jet) [12]
Figure 6. Hotflue of the pre-dyeing machine after the IR-dryer [12]
16
to the high temperature (about 200-220°C) at which the process occurs. The last step of the thermosol process is cooling the fabric with air [5,7].
Figure 7. General flowchart of the fabric on the pre-dyeing machine with and without (red line) thermosol part When the fabric consists of cotton, its dyeing process continues on the CVM. The first step on the CVM is the impregnation of the fabric with sodium hydroxide and sodium hydrosulfite in a foulard to reduce the dyestuff. The actual reduction takes place in a
steamer, comparable to the steamers used at the continuous bleaching machine. The air inside the steamer needs to be oxygen-free to prevent an early oxidation of the reduced dyestuff. Therefore, steam is used. After the steamer, the fabric is lead through eight washing baths. In the first four baths the oxidation with hydrogen peroxide takes place. The oxidation is followed by the real washing with soda and detergents to remove the excess dyestuff and to crystallize the oxidized dyestuff. In the last two baths the fabric is made PH-neutral with acetic acid. The dyeing
process ends with the drying and cooling of the fabric with cylinders, as was the case on the continuous bleaching machine [5,7].
Figure 9. General flowchart of the fabric on the continuous dyeing machine
§2.1.3 Finishing The last stage of the production process at TCP is the finishing stage. In this stage properties of the fabric can be influenced mechanically or chemically in order to improve its usability. In this report only three kinds of finishing machines of TCP are taken into account. These machines are: Sanfor, Thermex hotflue and four stenter frames. Other machines, like the roughening machine, are excluded. As they just use electricity and for mechanical purposes only, it has no purpose to create mass and thermal energy balances for them [59]. The Sanfor (SA) is used to pre-shrink the fabric, as to overcome shrinking after confection. Before the pre-shrinking can occur the fabric is wetted first with water and/or steam. After this, the fabric is guided over heated cylinders with the purpose to get the water to reach the centre of the fibers so they can swell. Now, the fabric is stretched in latitude direction. In this stretched form, the fabric enters the actual shrinking area of the
Figure 8. Washing baths of the CVM [12]
17
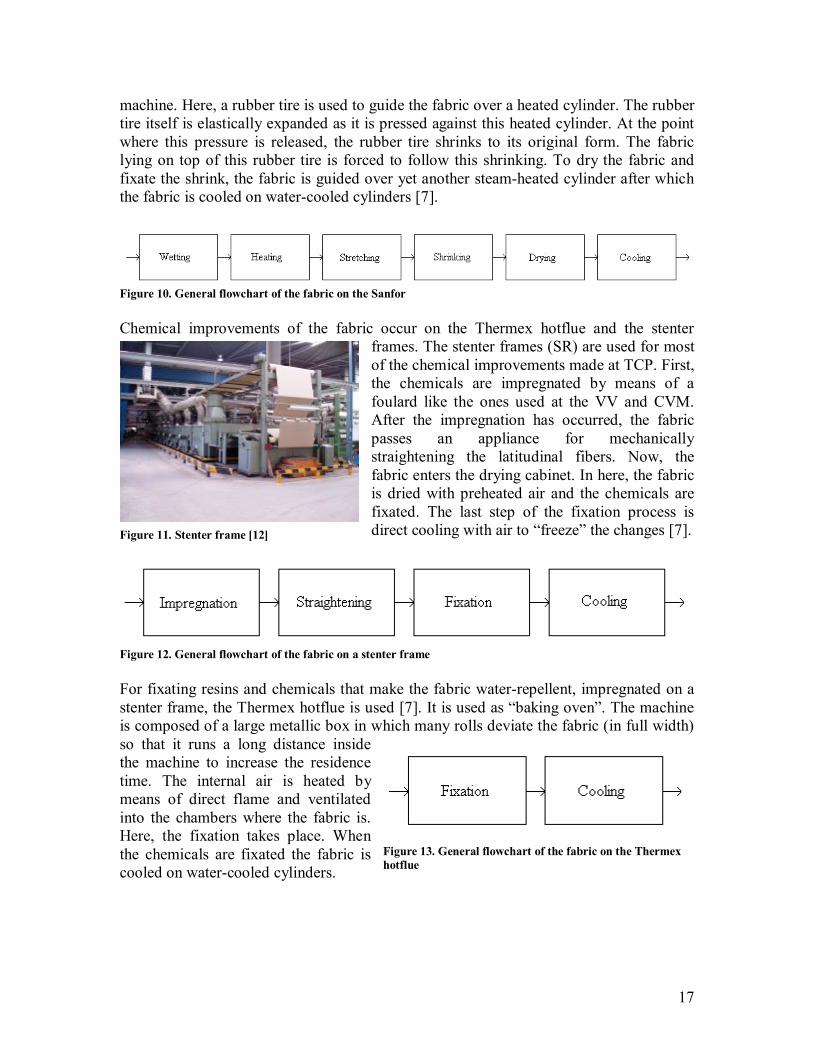
machine. Here, a rubber tire is used to guide the fabric over a heated cylinder. The rubber tire itself is elastically expanded as it is pressed against this heated cylinder. At the point where this pressure is released, the rubber tire shrinks to its original form. The fabric lying on top of this rubber tire is forced to follow this shrinking. To dry the fabric and fixate the shrink, the fabric is guided over yet another steam-heated cylinder after which the fabric is cooled on water-cooled cylinders [7].
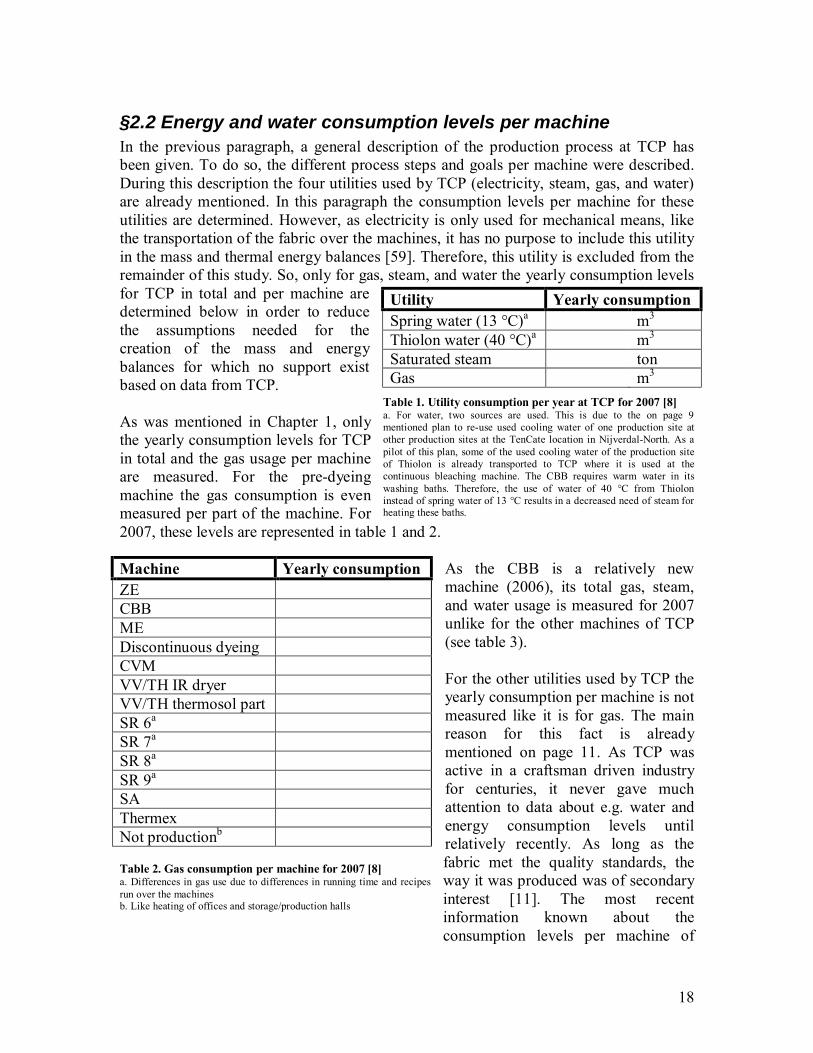
Figure 10. General flowchart of the fabric on the Sanfor Chemical improvements of the fabric occur on the Thermex hotflue and the stenter
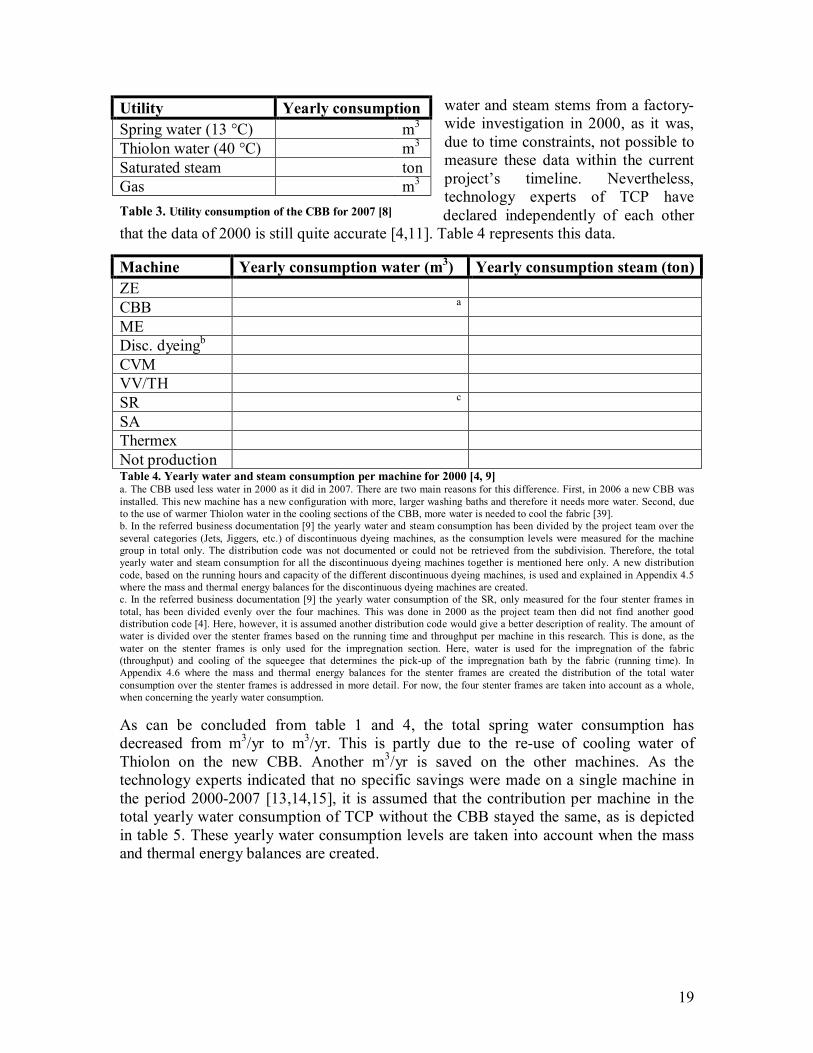
frames. The stenter frames (SR) are used for most of the chemical improvements made at TCP. First, the chemicals are impregnated by means of a foulard like the ones used at the VV and CVM. After the impregnation has occurred, the fabric passes an appliance for mechanically straightening the latitudinal fibers. Now, the fabric enters the drying cabinet. In here, the fabric is dried with preheated air and the chemicals are fixated. The last step of the fixation process is direct cooling with air to “freeze” the changes [7].
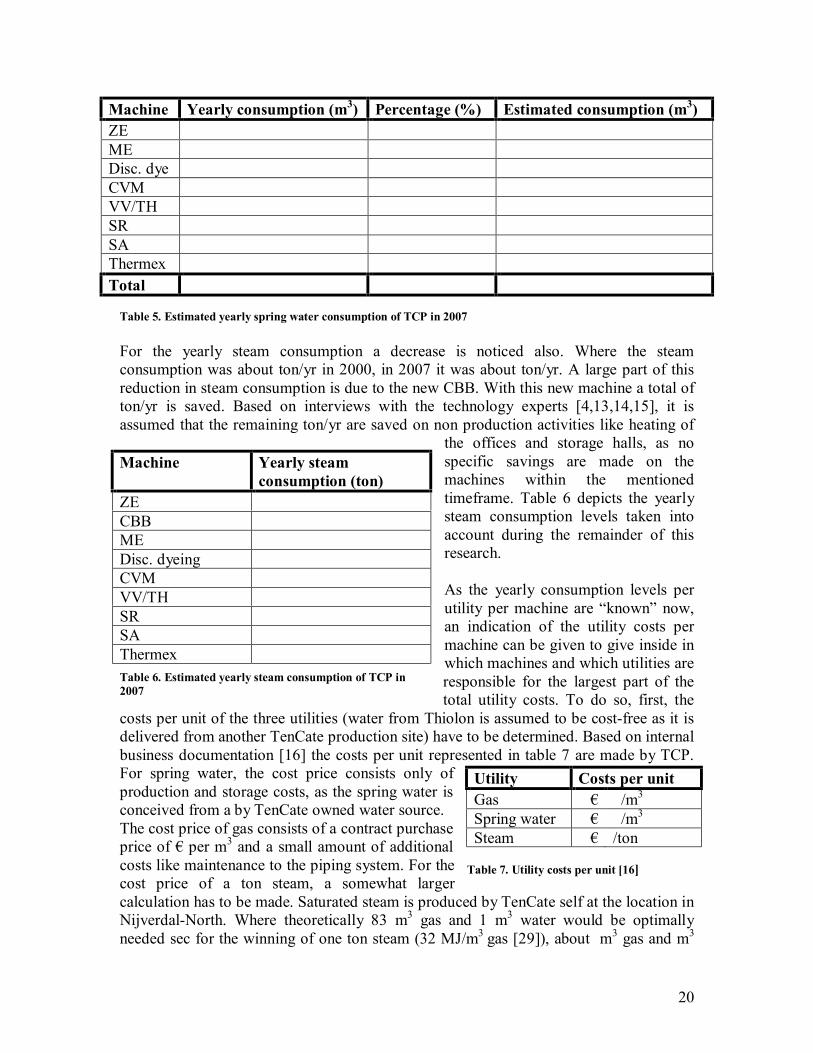
Figure 12. General flowchart of the fabric on a stenter frame For fixating resins and chemicals that make the fabric water-repellent, impregnated on a stenter frame, the Thermex hotflue is used [7]. It is used as “baking oven”. The machine is composed of a large metallic box in which many rolls deviate the fabric (in full width) so that it runs a long distance inside the machine to increase the residence time. The internal air is heated by means of direct flame and ventilated into the chambers where the fabric is. Here, the fixation takes place. When the chemicals are fixated the fabric is cooled on water-cooled cylinders.
Figure 11. Stenter frame [12]
Figure 13. General flowchart of the fabric on the Thermex hotflue
18
§2.2 Energy and water consumption levels per machine In the previous paragraph, a general description of the production process at TCP has been given. To do so, the different process steps and goals per machine were described. During this description the four utilities used by TCP (electricity, steam, gas, and water) are already mentioned. In this paragraph the consumption levels per machine for these utilities are determined. However, as electricity is only used for mechanical means, like the transportation of the fabric over the machines, it has no purpose to include this utility in the mass and thermal energy balances [59]. Therefore, this utility is excluded from the remainder of this study. So, only for gas, steam, and water the yearly consumption levels for TCP in total and per machine are determined below in order to reduce the assumptions needed for the creation of the mass and energy balances for which no support exist based on data from TCP. As was mentioned in Chapter 1, only the yearly consumption levels for TCP in total and the gas usage per machine are measured. For the pre-dyeing machine the gas consumption is even measured per part of the machine. For 2007, these levels are represented in table 1 and 2.
As the CBB is a relatively new machine (2006), its total gas, steam, and water usage is measured for 2007 unlike for the other machines of TCP (see table 3). For the other utilities used by TCP the yearly consumption per machine is not measured like it is for gas. The main reason for this fact is already mentioned on page 11. As TCP was active in a craftsman driven industry for centuries, it never gave much attention to data about e.g. water and energy consumption levels until relatively recently. As long as the fabric met the quality standards, the way it was produced was of secondary interest [11]. The most recent information known about the consumption levels per machine of
Utility Yearly consumption Spring water (13 °C)a m3 Thiolon water (40 °C)a m3 Saturated steam ton Gas m3
Table 1. Utility consumption per year at TCP for 2007 [8] a. For water, two sources are used. This is due to the on page 9 mentioned plan to re-use used cooling water of one production site at other production sites at the TenCate location in Nijverdal-North. As a pilot of this plan, some of the used cooling water of the production site of Thiolon is already transported to TCP where it is used at the continuous bleaching machine. The CBB requires warm water in its washing baths. Therefore, the use of water of 40 °C from Thiolon instead of spring water of 13 °C results in a decreased need of steam for heating these baths.
Machine Yearly consumption ZE CBB ME
Discontinuous dyeing CVM VV/TH IR dryer VV/TH thermosol part SR 6a SR 7a SR 8a SR 9a SA Thermex Not productionb
Table 2. Gas consumption per machine for 2007 [8] a. Differences in gas use due to differences in running time and recipes run over the machines b. Like heating of offices and storage/production halls
19
water and steam stems from a factory-wide investigation in 2000, as it was, due to time constraints, not possible to measure these data within the current project’s timeline. Nevertheless, technology experts of TCP have declared independently of each other
that the data of 2000 is still quite accurate [4,11]. Table 4 represents this data.
Machine Yearly consumption water (m3) Yearly consumption steam (ton) ZE CBB a ME Disc. dyeingb CVM VV/TH SR c SA Thermex Not production Table 4. Yearly water and steam consumption per machine for 2000 [4, 9] a. The CBB used less water in 2000 as it did in 2007. There are two main reasons for this difference. First, in 2006 a new CBB was installed. This new machine has a new configuration with more, larger washing baths and therefore it needs more water. Second, due to the use of warmer Thiolon water in the cooling sections of the CBB, more water is needed to cool the fabric [39]. b. In the referred business documentation [9] the yearly water and steam consumption has been divided by the project team over the several categories (Jets, Jiggers, etc.) of discontinuous dyeing machines, as the consumption levels were measured for the machine group in total only. The distribution code was not documented or could not be retrieved from the subdivision. Therefore, the total yearly water and steam consumption for all the discontinuous dyeing machines together is mentioned here only. A new distribution code, based on the running hours and capacity of the different discontinuous dyeing machines, is used and explained in Appendix 4.5 where the mass and thermal energy balances for the discontinuous dyeing machines are created. c. In the referred business documentation [9] the yearly water consumption of the SR, only measured for the four stenter frames in total, has been divided evenly over the four machines. This was done in 2000 as the project team then did not find another good distribution code [4]. Here, however, it is assumed another distribution code would give a better description of reality. The amount of water is divided over the stenter frames based on the running time and throughput per machine in this research. This is done, as the water on the stenter frames is only used for the impregnation section. Here, water is used for the impregnation of the fabric (throughput) and cooling of the squeegee that determines the pick-up of the impregnation bath by the fabric (running time). In Appendix 4.6 where the mass and thermal energy balances for the stenter frames are created the distribution of the total water consumption over the stenter frames is addressed in more detail. For now, the four stenter frames are taken into account as a whole, when concerning the yearly water consumption. As can be concluded from table 1 and 4, the total spring water consumption has decreased from m3/yr to m3/yr. This is partly due to the re-use of cooling water of Thiolon on the new CBB. Another m3/yr is saved on the other machines. As the technology experts indicated that no specific savings were made on a single machine in the period 2000-2007 [13,14,15], it is assumed that the contribution per machine in the total yearly water consumption of TCP without the CBB stayed the same, as is depicted in table 5. These yearly water consumption levels are taken into account when the mass and thermal energy balances are created.
Utility Yearly consumption Spring water (13 °C) m3 Thiolon water (40 °C) m3 Saturated steam ton Gas m3
Table 3. Utility consumption of the CBB for 2007 [8]
20
For the yearly steam consumption a decrease is noticed also. Where the steam consumption was about ton/yr in 2000, in 2007 it was about ton/yr. A large part of this reduction in steam consumption is due to the new CBB. With this new machine a total of ton/yr is saved. Based on interviews with the technology experts [4,13,14,15], it is assumed that the remaining ton/yr are saved on non production activities like heating of
the offices and storage halls, as no specific savings are made on the machines within the mentioned timeframe. Table 6 depicts the yearly steam consumption levels taken into account during the remainder of this research. As the yearly consumption levels per utility per machine are “known” now, an indication of the utility costs per machine can be given to give inside in which machines and which utilities are responsible for the largest part of the total utility costs. To do so, first, the
costs per unit of the three utilities (water from Thiolon is assumed to be cost-free as it is delivered from another TenCate production site) have to be determined. Based on internal business documentation [16] the costs per unit represented in table 7 are made by TCP. For spring water, the cost price consists only of production and storage costs, as the spring water is conceived from a by TenCate owned water source. The cost price of gas consists of a contract purchase price of € per m3 and a small amount of additional costs like maintenance to the piping system. For the cost price of a ton steam, a somewhat larger calculation has to be made. Saturated steam is produced by TenCate self at the location in Nijverdal-North. Where theoretically 83 m3 gas and 1 m3 water would be optimally needed sec for the winning of one ton steam (32 MJ/m3 gas [29]), about m3 gas and m3
Machine Yearly consumption (m3) Percentage (%) Estimated consumption (m3) ZE ME Disc. dye CVM VV/TH SR SA Thermex Total
Table 5. Estimated yearly spring water consumption of TCP in 2007
Machine Yearly steam consumption (ton)
ZE CBB ME Disc. dyeing CVM VV/TH SR SA Thermex Table 6. Estimated yearly steam consumption of TCP in 2007
Utility Costs per unit Gas € /m3
Spring water € /m3
Steam € /ton
Table 7. Utility costs per unit [16]
21
water are needed at the boilers of TenCate (see Appendix 2) due to inefficiencies, like heat loss due to flue gasses and radiation and drain losses [57]. As also chemicals and several treatments are necessary to produce steam, like maintenance to the boiler and piping system, all this together results in a current net cost price for steam of: € /ton [16,45]. Based on the mentioned cost prices the total costs per machine and per utility can be derived. The results are represented in table 8. Table 8. Total costs per utility per machine of TCP for 2007 From table 8 it can be concluded that steam has a high contribution in the total utility costs. Therefore, when in Chapter 4 reduction options for the utility consumption are proposed, especially options to reduce the consumption of steam are interesting. Another conclusion that can be drawn from table 8 is that especially those machines that use a lot of water (CVM, CBB, ME), also use a lot of steam. This is typical for the textile industry, as steam is usually used to heat the washing baths and to dry the fabric. One last remark is made here about the gas and steam prices. As can be seen in Appendix 3, the gas price has fluctuated a lot in the past three years. However, the trend during the last 15 months is upwards again. Therefore, it is expected that the gas price, and thus also the steam price, will increase when TCP has to sign a new contract for the gas delivery in the beginning of 2009. Even a small increase in the gas price of 1 eurocent would already mean an increase of € per year in the total utility costs. Therefore, reductions in the gas and steam consumption levels proposed in Chapter 4 are likely to become even more beneficial when a contract is signed for 2009 and later.
§2.3 Selection of program to create mass and thermal energy balances In the previous two paragraphs a description of the production process at TCP has been given and the yearly consumption levels of the different utilities per machine are determined. Before the mass and thermal energy balances can be created, the program in which these balances are created needs to be selected first. As was mentioned before the textile industry is a craftsman-driven industry from origin. During the 20th century, however, more and more of the production processes became automated, although the mentality about the production processes did not change. Still, the focus was on the end-product. As long as the fabric met the quality standards the way
22
it is produced was of secondary interest [11]. Due to this mentality, even simple figures about yearly consumptions of utilities per machine and mass and thermal energy balances are lacking or not up-to-date, as mentioned in the previous paragraphs. So let alone that advanced and relatively expensive software programs, like the in the process industry well-known and widely used flow sheeting packages of ASPEN or HYSYS, are available at TCP for creating these mass and thermal energy balances. Furthermore, it is even questionable if these packages are useful for TCP at the moment, as these flow sheeting packages require more specific information about the processes than is known at TCP for above mentioned reasons. With this in mind, the already at TCP available software program Excel is used as program to create the mass and thermal energy balances for the machines of TCP.
§2.4 Mass and thermal energy balances per machine In the previous paragraph it is explained why the software program Excel is used to program the mass and thermal energy balances for the production machines of TCP. In Chapter 1 page 10, it is explained that the balances consist of the several production steps on those machines to take into account the effect of preceding and subsequent steps on one machine. Basic input for these balances is the in paragraph 2.2 estimated yearly consumption levels, as no consumption levels during a production run are known at TCP and measuring these data in most cases is not possible, as explained on page 11. However, for some production steps e.g. temperatures and amount of water used can be set or kept within ranges on certain machines. This sort of information, available from the machine set-up specifications, is used as much as possible. However, most machines have these kinds of specifications per fabric quality. As only yearly consumption levels are known, average set-up specifications are used in the balances. These average values are determined in consultation with the technology experts from TCP. Basing the mass and thermal energy balances solely on the specifications is not preferred, as for too many production steps these settings are not known. By using the combination of the yearly consumption levels and the average process specific information, the least amount of additional assumptions without data from TCP supporting it is needed. In the subparagraphs 2.4.2 till 2.4.9 the basic conclusions that can be drawn from the mass and thermal energy balances per machine are given. The balances themselves are represented in Appendix 4 together with the detailed calculations. In order to create these balances some general remarks and assumptions about the production processes at TCP have to be addressed first.
§2.4.1 General information In paragraph 2.1 basic flowcharts of the fabric on the different machines are given. These flowcharts serve as basis for the mass and thermal energy balances. The final flowcharts are somewhat adjusted as can be seen in Appendix 4. Now, also the other flows besides the fabric are represented. Furthermore, some production steps are divided into several units, e.g. the washing baths on the continuous bleaching machine and the drying and fixation sections with hot air on the pre-dyeing machine and stenter frames, while other steps are no longer mentioned like the straightening step on the stenter frames. The removing of the straightening step on the stenter frame is done as steps like these only
23
use electricity which is not taken into account in this research. The subdividing of some of the washing baths on e.g. the continuous bleaching machine is done, as for these baths a grouping like on the continuous dyeing machine is not possible as there is an exchange of water, and thus an interaction, between a bath in the middle of a washing section and a bath of a different washing section (e.g. B6 en B9). B1 till B3 can be taken together as all the incoming water streams enter this section in B3 and leave it from B1 while having the same operating temperature inside the baths. The drying and fixation steps with hot air are subdivided in a heat exchanger or burner and the actual drying or fixating step. In the burner or heat exchanger the air is heated and in the drying or fixating step this heated air is brought in direct contact with the fabric in another chamber of the machine. Besides these small adjustments to the flowcharts, also some additional remarks and assumptions are needed, for example about the temperatures inside the production hall influencing the inlet temperature of the fabric, chemicals, and air. Normal temperatures in the production hall are about 25 °C. However, in the area where the pre-dyeing and continuous dyeing machines stand, this temperature is somewhat higher (about 30 °C on average) [14]. Other assumptions are needed too:
• Although most of the machines are semi-continuous - they require a short start-up, when another fabric quality is run over the machine – the balances that are created are all assumed stationary, as the required start-up time is very short compared to the steady-state situation [11]. For production steps in which this assumption is doubted, an extra parameter START is used to take into account the dynamic start-up.
• The general efficiencies of gas burners, steamers, and cooling equipment, is estimated at 85%, except on the continuous bleaching machine which is relatively new and better isolated. Here, a general efficiency is estimated of 95% [13].
• After each foulard and the impregnation sections on the continuous bleaching machine, there is a squeegee that controls partly the pick-up of chemicals and water during that production step [17]. It is assumed that this squeegee requires between m3/yr of cooling water [18], as this amount is not directly measurable [19].
• In general it is assumed that the temperature of the fabric does not change between production steps on the same machine. For most production steps, this temperature loss can indeed be neglected, as the fabric almost directly enters another step without much contact time with open air. Where there is much contact with open air and it was possible, the temperature loss is measured and taken into account.
• The natural moisture regain of the fabric is not mentioned in the balances, as it is assumed that the moisture regain of the fabric stays about the same at the beginning and end of the production process at TCP [13,15,17].
• The specific density of a fabric after being processed at the continuous bleaching machine at TCP is on average kg/m2 and has a width of meters [11,20].
24
• On average a fabric of TCP consists of % cotton and % polyester [11,20]. In reality there are more resources used, but cotton and polyester form the largest part. As the specific heat capacity of cotton is equal to 1,3 kJ/kgK [22] and of polyester is equal to 2 kJ/kgK [23], the specific heat capacity of a fabric produced by TCP is kJ/kgK.
• If the specific heat of a chemical is not known, the value of 3 kJ/kgK is used. However, the exact value does not really matter, as most chemicals only contribute for a minimal amount in the total mass present in a production step.
• When a fabric is dried the absorbed water evaporates when the fabric and water reach a temperature of °C [21]. Inside the steamers, this evaporation does not occur [33].
• During impregnation steps the baths or foulards are heated indirectly. The steam itself does not enter the foulard or bath. Washing baths and steamers, however, are heated directly [3].
• The fabric generally reaches the same temperature as the temperature at which the machine part is operating [5,7].
• The running hours of the machines are last estimated during the on page 19 mentioned factory-wide study in 2000 [9]. These values are assumed to be accurate enough to be used in this research [11].
• The throughput of fabric per machine in 2006 [10] was the most recent available information about the amount of produced fabric and so most in line with the throughput of 2007. Therefore, this throughput is used in this research.
• The annual consumption levels of most of the chemicals per machine are measured by TCP [24]. The values for 2007 are used in the balances.
As the general assumptions and remarks are given now, the main conclusions based on the created and in Appendix 4 stated mass and thermal energy balances are being described in the next eight paragraphs below.
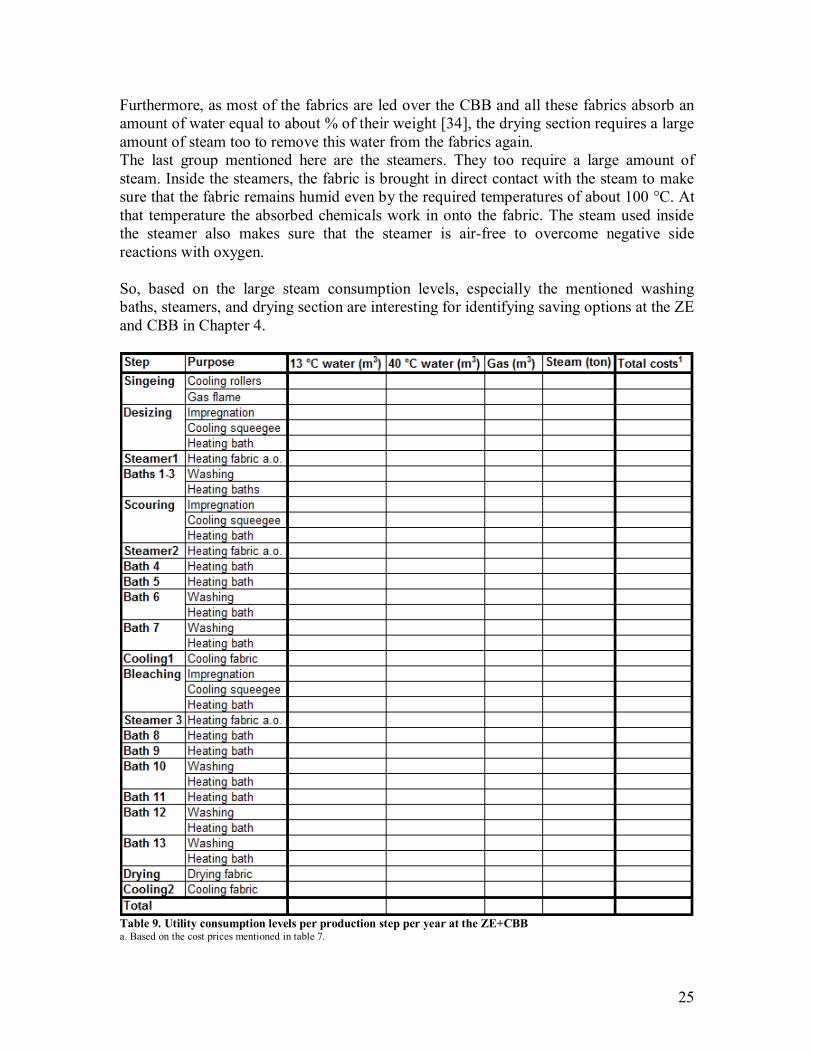
§2.4.2 Singeing and continuous bleaching machine For the creation of the mass and thermal energy balances for the singeing machine (ZE) and the continuous bleaching machine (CBB), these machines are viewed as one as the fabric is transported automatically from the ZE to the CBB. Furthermore, the amount of steam used at the ZE (see table 6, page 20) is the amount actually used at the desizing stage of the CBB and the amount of 13 °C water used in this step on the CBB is also part of the total spring water consumption of the ZE in table 5 [18]. Based on the created balances (see Appendix 4.1) the utility consumption levels for the ZE and CBB are determined per production step and represented in table 9. When looking at the baths, B1-3, B5, B6, B11, and B13 are the largest steam consumers. This is due to the fact that these baths need to heat the incoming water - fresh water or water from other baths as, is the case for B5, B6 and B11 - to maintain the required bath temperatures.
25
Furthermore, as most of the fabrics are led over the CBB and all these fabrics absorb an amount of water equal to about % of their weight [34], the drying section requires a large amount of steam too to remove this water from the fabrics again. The last group mentioned here are the steamers. They too require a large amount of steam. Inside the steamers, the fabric is brought in direct contact with the steam to make sure that the fabric remains humid even by the required temperatures of about 100 °C. At that temperature the absorbed chemicals work in onto the fabric. The steam used inside the steamer also makes sure that the steamer is air-free to overcome negative side reactions with oxygen. So, based on the large steam consumption levels, especially the mentioned washing baths, steamers, and drying section are interesting for identifying saving options at the ZE and CBB in Chapter 4.
Table 9. Utility consumption levels per production step per year at the ZE+CBB a. Based on the cost prices mentioned in table 7.
26
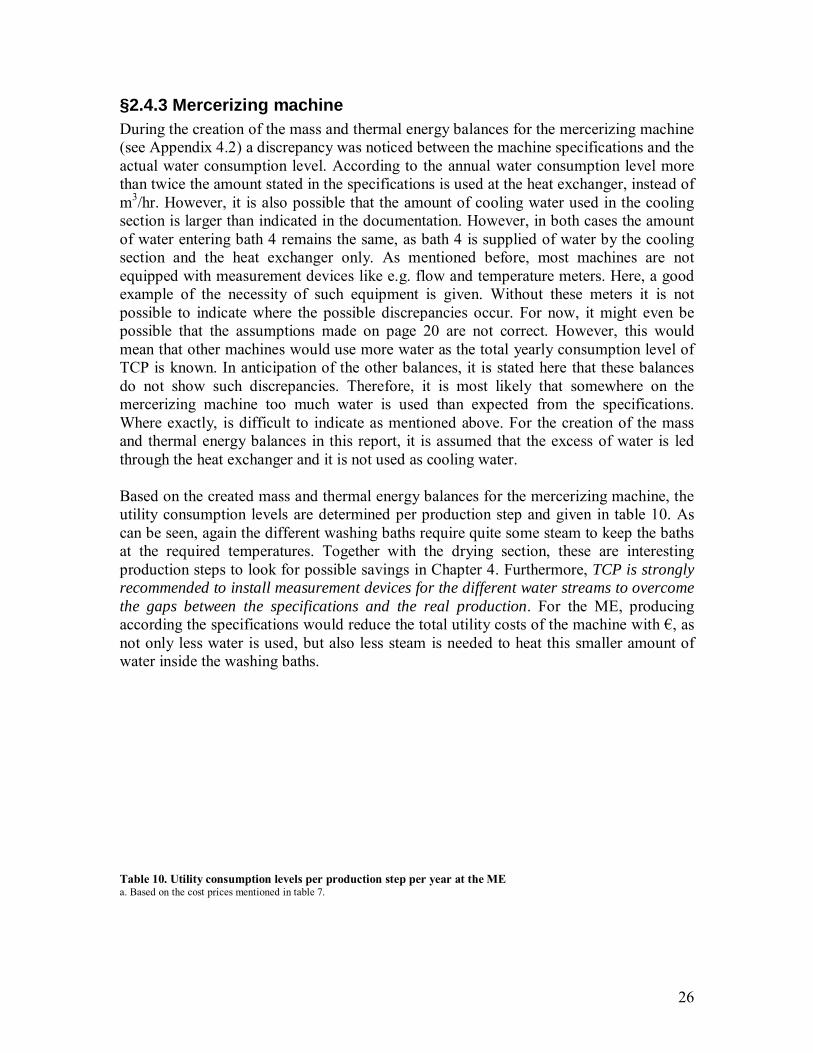
§2.4.3 Mercerizing machine During the creation of the mass and thermal energy balances for the mercerizing machine (see Appendix 4.2) a discrepancy was noticed between the machine specifications and the actual water consumption level. According to the annual water consumption level more than twice the amount stated in the specifications is used at the heat exchanger, instead of m3/hr. However, it is also possible that the amount of cooling water used in the cooling section is larger than indicated in the documentation. However, in both cases the amount of water entering bath 4 remains the same, as bath 4 is supplied of water by the cooling section and the heat exchanger only. As mentioned before, most machines are not equipped with measurement devices like e.g. flow and temperature meters. Here, a good example of the necessity of such equipment is given. Without these meters it is not possible to indicate where the possible discrepancies occur. For now, it might even be possible that the assumptions made on page 20 are not correct. However, this would mean that other machines would use more water as the total yearly consumption level of TCP is known. In anticipation of the other balances, it is stated here that these balances do not show such discrepancies. Therefore, it is most likely that somewhere on the mercerizing machine too much water is used than expected from the specifications. Where exactly, is difficult to indicate as mentioned above. For the creation of the mass and thermal energy balances in this report, it is assumed that the excess of water is led through the heat exchanger and it is not used as cooling water. Based on the created mass and thermal energy balances for the mercerizing machine, the utility consumption levels are determined per production step and given in table 10. As can be seen, again the different washing baths require quite some steam to keep the baths at the required temperatures. Together with the drying section, these are interesting production steps to look for possible savings in Chapter 4. Furthermore, TCP is strongly recommended to install measurement devices for the different water streams to overcome the gaps between the specifications and the real production. For the ME, producing according the specifications would reduce the total utility costs of the machine with €, as not only less water is used, but also less steam is needed to heat this smaller amount of water inside the washing baths. Table 10. Utility consumption levels per production step per year at the ME a. Based on the cost prices mentioned in table 7.
27
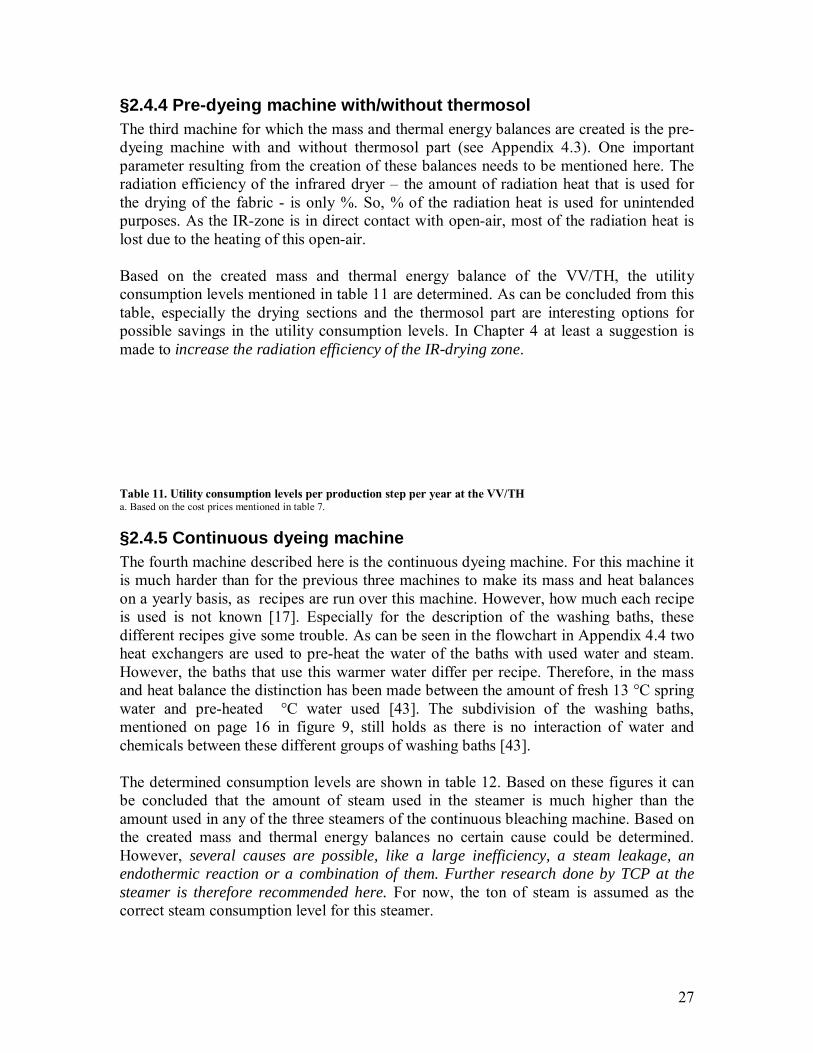
§2.4.4 Pre-dyeing machine with/without thermosol The third machine for which the mass and thermal energy balances are created is the pre-dyeing machine with and without thermosol part (see Appendix 4.3). One important parameter resulting from the creation of these balances needs to be mentioned here. The radiation efficiency of the infrared dryer – the amount of radiation heat that is used for the drying of the fabric - is only %. So, % of the radiation heat is used for unintended purposes. As the IR-zone is in direct contact with open-air, most of the radiation heat is lost due to the heating of this open-air. Based on the created mass and thermal energy balance of the VV/TH, the utility consumption levels mentioned in table 11 are determined. As can be concluded from this table, especially the drying sections and the thermosol part are interesting options for possible savings in the utility consumption levels. In Chapter 4 at least a suggestion is made to increase the radiation efficiency of the IR-drying zone. Table 11. Utility consumption levels per production step per year at the VV/TH a. Based on the cost prices mentioned in table 7.
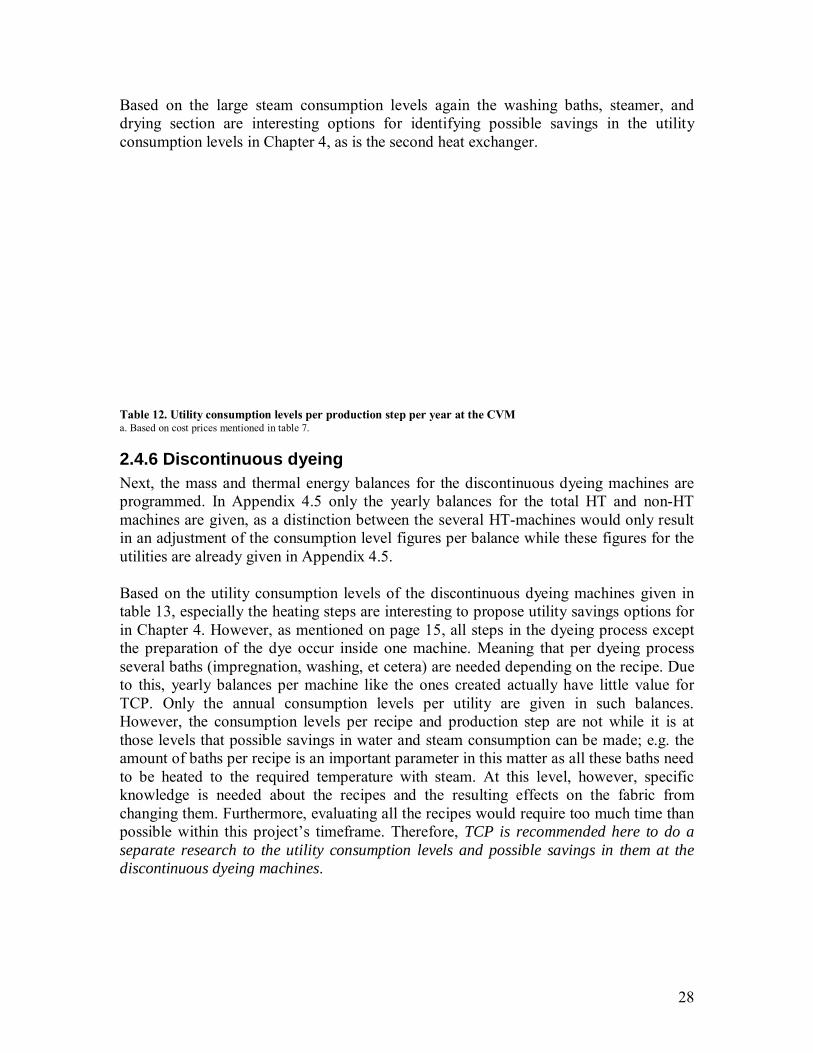
§2.4.5 Continuous dyeing machine The fourth machine described here is the continuous dyeing machine. For this machine it is much harder than for the previous three machines to make its mass and heat balances on a yearly basis, as recipes are run over this machine. However, how much each recipe is used is not known [17]. Especially for the description of the washing baths, these different recipes give some trouble. As can be seen in the flowchart in Appendix 4.4 two heat exchangers are used to pre-heat the water of the baths with used water and steam. However, the baths that use this warmer water differ per recipe. Therefore, in the mass and heat balance the distinction has been made between the amount of fresh 13 °C spring water and pre-heated °C water used [43]. The subdivision of the washing baths, mentioned on page 16 in figure 9, still holds as there is no interaction of water and chemicals between these different groups of washing baths [43]. The determined consumption levels are shown in table 12. Based on these figures it can be concluded that the amount of steam used in the steamer is much higher than the amount used in any of the three steamers of the continuous bleaching machine. Based on the created mass and thermal energy balances no certain cause could be determined. However, several causes are possible, like a large inefficiency, a steam leakage, an endothermic reaction or a combination of them. Further research done by TCP at the steamer is therefore recommended here. For now, the ton of steam is assumed as the correct steam consumption level for this steamer.
28
Based on the large steam consumption levels again the washing baths, steamer, and drying section are interesting options for identifying possible savings in the utility consumption levels in Chapter 4, as is the second heat exchanger. Table 12. Utility consumption levels per production step per year at the CVM a. Based on cost prices mentioned in table 7.
2.4.6 Discontinuous dyeing Next, the mass and thermal energy balances for the discontinuous dyeing machines are programmed. In Appendix 4.5 only the yearly balances for the total HT and non-HT machines are given, as a distinction between the several HT-machines would only result in an adjustment of the consumption level figures per balance while these figures for the utilities are already given in Appendix 4.5. Based on the utility consumption levels of the discontinuous dyeing machines given in table 13, especially the heating steps are interesting to propose utility savings options for in Chapter 4. However, as mentioned on page 15, all steps in the dyeing process except the preparation of the dye occur inside one machine. Meaning that per dyeing process several baths (impregnation, washing, et cetera) are needed depending on the recipe. Due to this, yearly balances per machine like the ones created actually have little value for TCP. Only the annual consumption levels per utility are given in such balances. However, the consumption levels per recipe and production step are not while it is at those levels that possible savings in water and steam consumption can be made; e.g. the amount of baths per recipe is an important parameter in this matter as all these baths need to be heated to the required temperature with steam. At this level, however, specific knowledge is needed about the recipes and the resulting effects on the fabric from changing them. Furthermore, evaluating all the recipes would require too much time than possible within this project’s timeframe. Therefore, TCP is recommended here to do a separate research to the utility consumption levels and possible savings in them at the discontinuous dyeing machines.
29
Table 13. Utility consumption levels per year for the discontinuous dyeing machine types a. Based on the cost prices mentioned in table 7.
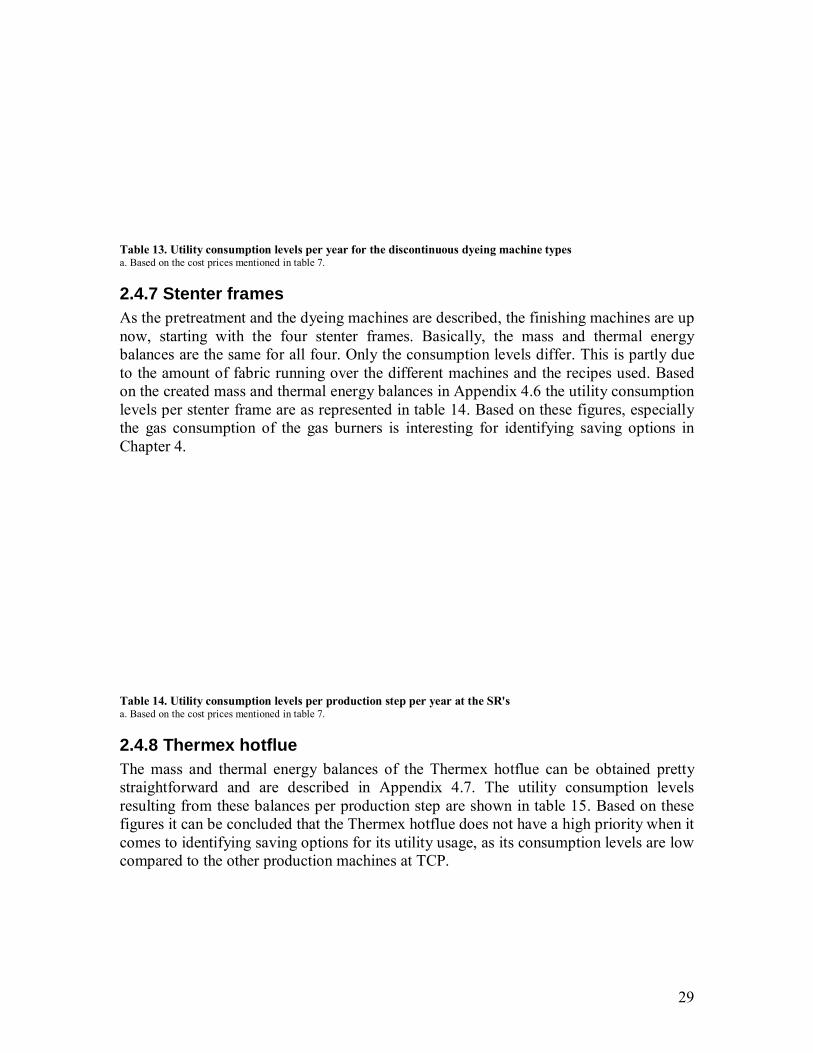
2.4.7 Stenter frames As the pretreatment and the dyeing machines are described, the finishing machines are up now, starting with the four stenter frames. Basically, the mass and thermal energy balances are the same for all four. Only the consumption levels differ. This is partly due to the amount of fabric running over the different machines and the recipes used. Based on the created mass and thermal energy balances in Appendix 4.6 the utility consumption levels per stenter frame are as represented in table 14. Based on these figures, especially the gas consumption of the gas burners is interesting for identifying saving options in Chapter 4. Table 14. Utility consumption levels per production step per year at the SR's a. Based on the cost prices mentioned in table 7.
2.4.8 Thermex hotflue The mass and thermal energy balances of the Thermex hotflue can be obtained pretty straightforward and are described in Appendix 4.7. The utility consumption levels resulting from these balances per production step are shown in table 15. Based on these figures it can be concluded that the Thermex hotflue does not have a high priority when it comes to identifying saving options for its utility usage, as its consumption levels are low compared to the other production machines at TCP.
30
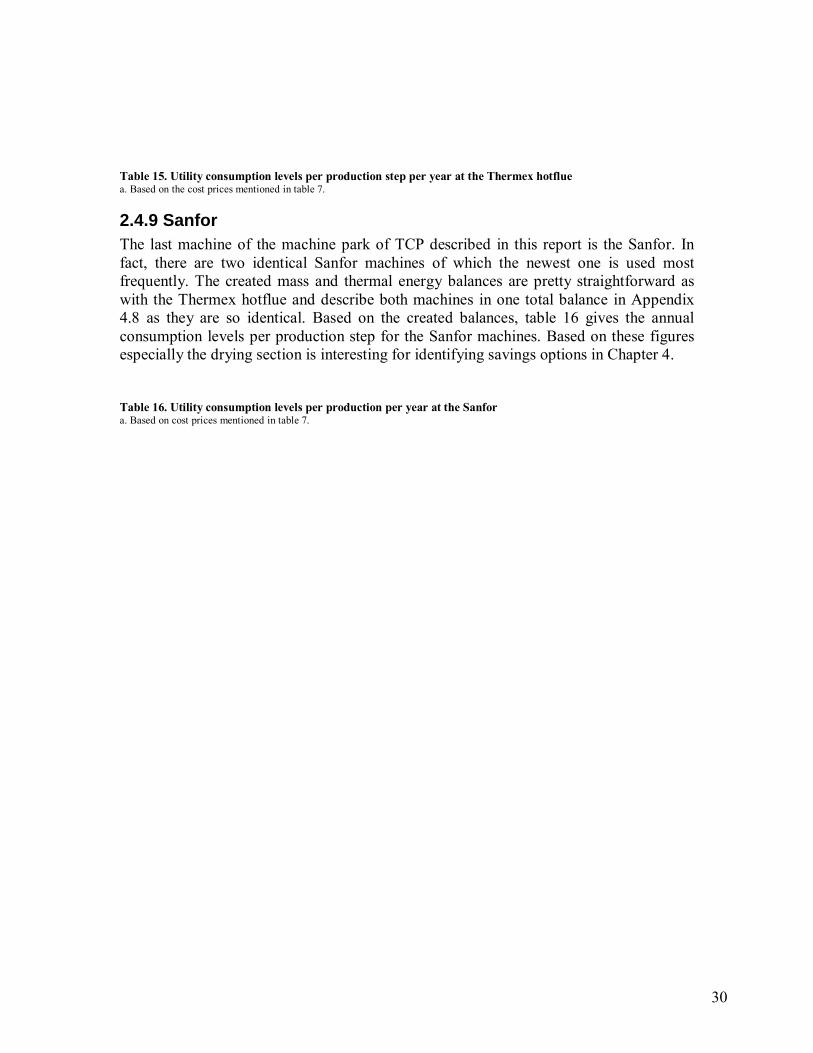
Table 15. Utility consumption levels per production step per year at the Thermex hotflue a. Based on the cost prices mentioned in table 7.
2.4.9 Sanfor The last machine of the machine park of TCP described in this report is the Sanfor. In fact, there are two identical Sanfor machines of which the newest one is used most frequently. The created mass and thermal energy balances are pretty straightforward as with the Thermex hotflue and describe both machines in one total balance in Appendix 4.8 as they are so identical. Based on the created balances, table 16 gives the annual consumption levels per production step for the Sanfor machines. Based on these figures especially the drying section is interesting for identifying savings options in Chapter 4. Table 16. Utility consumption levels per production per year at the Sanfor a. Based on cost prices mentioned in table 7.
31
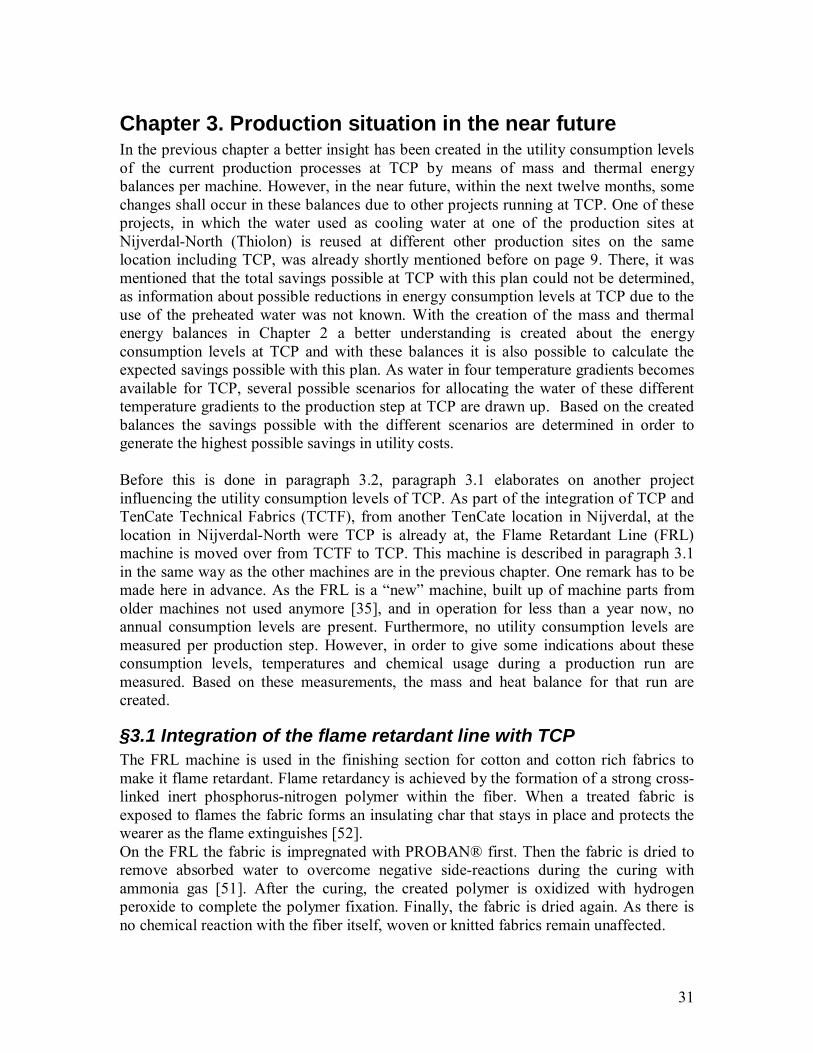
Chapter 3. Production situation in the near future In the previous chapter a better insight has been created in the utility consumption levels of the current production processes at TCP by means of mass and thermal energy balances per machine. However, in the near future, within the next twelve months, some changes shall occur in these balances due to other projects running at TCP. One of these projects, in which the water used as cooling water at one of the production sites at Nijverdal-North (Thiolon) is reused at different other production sites on the same location including TCP, was already shortly mentioned before on page 9. There, it was mentioned that the total savings possible at TCP with this plan could not be determined, as information about possible reductions in energy consumption levels at TCP due to the use of the preheated water was not known. With the creation of the mass and thermal energy balances in Chapter 2 a better understanding is created about the energy consumption levels at TCP and with these balances it is also possible to calculate the expected savings possible with this plan. As water in four temperature gradients becomes available for TCP, several possible scenarios for allocating the water of these different temperature gradients to the production step at TCP are drawn up. Based on the created balances the savings possible with the different scenarios are determined in order to generate the highest possible savings in utility costs. Before this is done in paragraph 3.2, paragraph 3.1 elaborates on another project influencing the utility consumption levels of TCP. As part of the integration of TCP and TenCate Technical Fabrics (TCTF), from another TenCate location in Nijverdal, at the location in Nijverdal-North were TCP is already at, the Flame Retardant Line (FRL) machine is moved over from TCTF to TCP. This machine is described in paragraph 3.1 in the same way as the other machines are in the previous chapter. One remark has to be made here in advance. As the FRL is a “new” machine, built up of machine parts from older machines not used anymore [35], and in operation for less than a year now, no annual consumption levels are present. Furthermore, no utility consumption levels are measured per production step. However, in order to give some indications about these consumption levels, temperatures and chemical usage during a production run are measured. Based on these measurements, the mass and heat balance for that run are created.
§3.1 Integration of the flame retardant line with TCP The FRL machine is used in the finishing section for cotton and cotton rich fabrics to make it flame retardant. Flame retardancy is achieved by the formation of a strong cross-linked inert phosphorus-nitrogen polymer within the fiber. When a treated fabric is exposed to flames the fabric forms an insulating char that stays in place and protects the wearer as the flame extinguishes [52]. On the FRL the fabric is impregnated with PROBAN® first. Then the fabric is dried to remove absorbed water to overcome negative side-reactions during the curing with ammonia gas [51]. After the curing, the created polymer is oxidized with hydrogen peroxide to complete the polymer fixation. Finally, the fabric is dried again. As there is no chemical reaction with the fiber itself, woven or knitted fabrics remain unaffected.
32
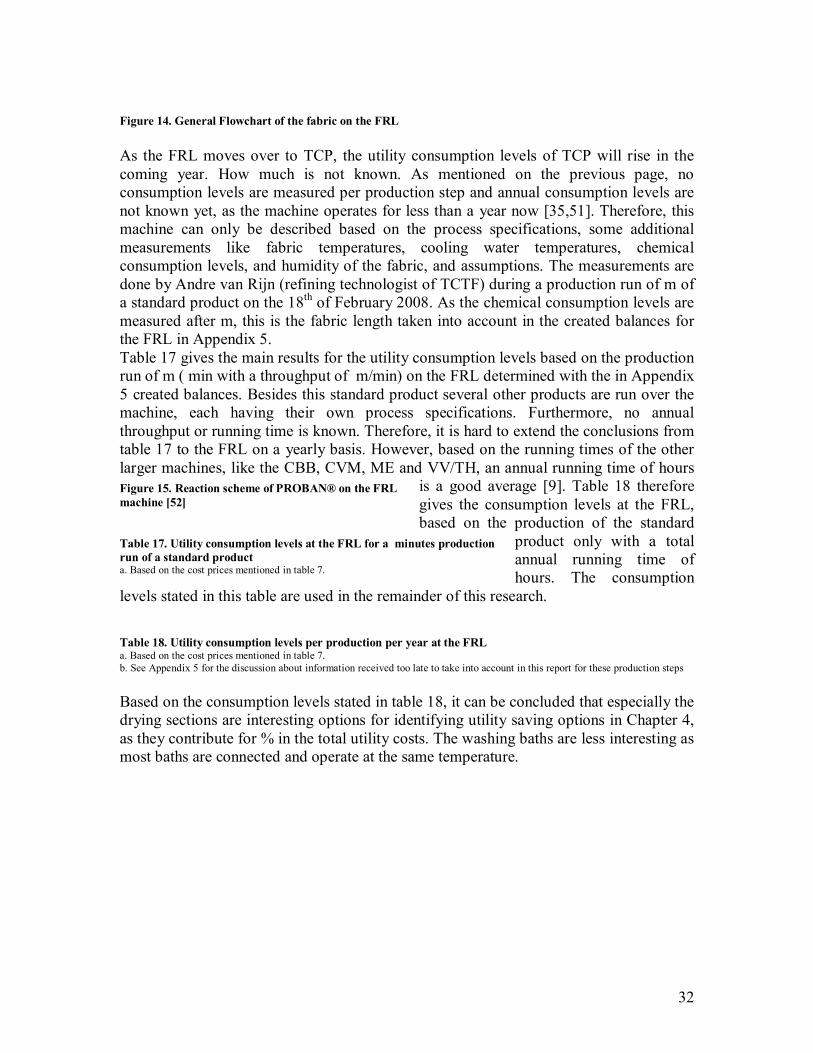
Figure 14. General Flowchart of the fabric on the FRL As the FRL moves over to TCP, the utility consumption levels of TCP will rise in the coming year. How much is not known. As mentioned on the previous page, no consumption levels are measured per production step and annual consumption levels are not known yet, as the machine operates for less than a year now [35,51]. Therefore, this machine can only be described based on the process specifications, some additional measurements like fabric temperatures, cooling water temperatures, chemical consumption levels, and humidity of the fabric, and assumptions. The measurements are done by Andre van Rijn (refining technologist of TCTF) during a production run of m of a standard product on the 18th of February 2008. As the chemical consumption levels are measured after m, this is the fabric length taken into account in the created balances for the FRL in Appendix 5. Table 17 gives the main results for the utility consumption levels based on the production run of m ( min with a throughput of m/min) on the FRL determined with the in Appendix 5 created balances. Besides this standard product several other products are run over the machine, each having their own process specifications. Furthermore, no annual throughput or running time is known. Therefore, it is hard to extend the conclusions from table 17 to the FRL on a yearly basis. However, based on the running times of the other larger machines, like the CBB, CVM, ME and VV/TH, an annual running time of hours
is a good average [9]. Table 18 therefore gives the consumption levels at the FRL, based on the production of the standard
product only with a total annual running time of hours. The consumption
levels stated in this table are used in the remainder of this research. Table 18. Utility consumption levels per production per year at the FRL a. Based on the cost prices mentioned in table 7. b. See Appendix 5 for the discussion about information received too late to take into account in this report for these production steps Based on the consumption levels stated in table 18, it can be concluded that especially the drying sections are interesting options for identifying utility saving options in Chapter 4, as they contribute for % in the total utility costs. The washing baths are less interesting as most baths are connected and operate at the same temperature.
Figure 15. Reaction scheme of PROBAN® on the FRL machine [52]
Table 17. Utility consumption levels at the FRL for a minutes production run of a standard product a. Based on the cost prices mentioned in table 7.
33
§3.2 Effects of the water recycling plan With the description of the FRL in the previous paragraph and Appendix 5 all the production machines of TCP in the coming year are mentioned and described with mass and thermal energy balances. Now, one more project will have its effects on the annual utility consumption levels of TCP in the coming year. This is the water recycling plan, already described on page 9 and 31. This paragraph elaborates on the effects this plan has on the consumption levels of TCP and the savings possible due to this plan. As was mentioned before on page 18, TCP uses fresh 13 °C spring water in general. Only the continuous bleaching machine makes already use of 40 °C Thiolon water due to a pilot of the water recycling plan at hand.
34
As these kinds of savings are possible by the use of the preheated water of Thiolon, the water recycling plan should be almost completely implemented within the next twelve months. Due to this plan the following water streams become available at TCP when the complete plan has been implemented based on information from September 2007 [3,61]:
• m3/yr at 60 °C • m3/yr at 40 °C • m3/yr at 25 °C • Fresh spring water of 13 °C
It is expected that the above mentioned amounts shall increase in the future, as the production throughput at Thiolon is still increasing [3]. Furthermore, the given amount of 40 °C water is much lower than the amount used currently at the CBB. This is due to the fact that the current 40 °C water will be used to create water with the 60 °C temperature gradient in the near future. As warmer water becomes available at TCP, the processes in which the water currently is heated with steam can now reach the right process temperature with less steam. As mentioned in Chapter 2, especially savings in the steam consumption are interesting, as steam contributes for about % in the total utility costs of TCP due to the relative high unit costs in comparison with the other utilities. As water becomes available in four temperature gradients with mostly limited amounts, these water streams need to be allocated to the production steps optimally. For this purpose, 21 scenarios are created in subparagraph 3.2.1. For each of these scenarios the savings are calculated with the in Chapter 2 created mass and thermal energy balances in paragraph 3.2.2. Finally, the conclusions from these calculations are given in paragraph 3.2.3. Before adjusting the balances, two remarks have to be made here. First, for the impregnation stages, only fresh spring water can be used. This, to overcome the negative effects possible impurities, which might occur in the Thiolon water, can have on the impregnation of the fabric [3]. Another remark has to be made here about the possible savings for TCP. Currently, the 40 °C water used at the CBB is free of charge. So, only Thiolon pays for that water when it is used as 13 °C at their production site. At this point in time, no payment agreement between TCP and Thiolon is confirmed [35]. Here, it is important to mention that both production sites are part of different subsidiaries of TenCate and also operate as such [3,11]. Therefore, it is likely that Thiolon would like to see some additional fee as TCP can save money by using their heated (waste) water. For now, it is assumed that a transfer price of € per m3 would be acceptable as this is the price Thiolon has to pay for the 13 °C water they use too. So basically then, Thiolon gets their water for free [36] and TCP can save on steam by using the warmer water.
35
§3.2.1 Water allocation scenarios Basically, there are four machines that determine the total savings possible with the water recycling plan. These are the ZE+CBB, ME, CVM, and FRL, as they consist of washing baths where steam is used to heat the water. The other machines do not directly benefit from the warmer Thiolon water. Now, one problem occurs; the capacity of especially the 40 °C and 60 °C water is restricted. Therefore, an analysis has to be made which water consumers benefit most, in terms of annual savings, from the use of water with warmer temperature gradients. As the capacity plays a large role here, it is decided to take into account the water savings possible on the ME when producing according to the specifications instead of with the current water consumption, as mentioned in paragraph 2.4.3 and Appendix 4.2. This already results in an annual saving in steam and water equal to € according to the created balances. Before the possible scenarios for the water recycling plan are created, a description is given about the temperature gradients possible at all the sections of the machines first. At the ZE+CBB, only steam can be saved when warmer water is used in the washing baths (B1-B3, B6, B7, B10, B12, and B13). For the cooling activities, water of 13 °C or 25 °C suffice, as this water is not re-used anymore. The impregnation sections require 13 °C as mentioned on the previous page. The same holds for the impregnation stage at the ME. Warmer water entering the baths via Bath 3, Cooling section, and Heat exchanger could reduce the steam consumption. One remark has to be made here about Bath 3. When warmer water is used, negative steam consumption does occur, resulting in an increase of the bath temperature. This temperature increase can only be dealt with if the incoming water temperature stays below 35 °C. Otherwise, the temperature of this bath would increase outside the allowable temperature range. At the CVM a same problem occurs with the water lock. However, here the problem already occurs when water of 15 °C is used. In the washing baths, only the cold water streams can be replaced with warmer water, as the warmer water used here from the heat exchangers of the CVM is already 60 °C. As certain recipes at the CVM require bath temperatures of 30 °C, only the 13 °C or 25 °C water can serve as cold water for the washing baths. As both, water from the cooling section and from the heat exchangers enter the washing baths as warm water, steam can be saved when their water temperatures increase. For the cooling section this increase is limited to the 40 °C water of Thiolon, as with 60 °C water too much of the cooling function is lost. When 60 °C water is used at the first heat exchanger, the second heat exchanger becomes redundant. At the FRL, the impregnation sections have to be fed with fresh 13 °C water for the same reason as mentioned above. The first two cooling sections also require fresh spring water as they would otherwise loose too much of their cooling function. The cooling water inside the curer and the water used inside the oxidizing section also need to remain fresh spring water as to coop with the heat resulting from the exothermic reactions taking place. The last cooling section can be fed with warmer water. However, as this cooling water is not re-used anymore in the washing baths, it is likely to expect that the warmer Thiolon water could better be used directly in the baths where for the FRL Bath 1 and 8 are the water entrance points.
36
For all the other machines, the use of 40 °C or 60 °C water does not save any steam. The cooling sections at the Discontinuous dyeing, Sanfor, and Thermex could well be fed with 25 °C water. They would keep their cooling function and less fresh spring water would be needed. The latter also holds for the shrinking section of the Sanfor. All the other water used, is used for impregnation sections. For this purpose still fresh spring water of 13 °C is needed as mentioned several times before. Currently, the CBB is already fed with 40 °C water of Thiolon. This water will partly become 60 °C water when the water recycling plan is implemented. However, when the three largest baths - measuring the amount of water entering the washing section at these baths - of the CBB (B1-B3, B7 and B13) are connected to the 60 °C water, the amount of 60 °C water used (m3) already exceeds the current capacity of this water type (m3). This small difference is likely to be overcome within one or two years as the production of Thiolon is still growing fast [3]. However, allocating all the 60 °C water to these three baths makes it impossible to use water of this temperature gradient at one of the other three machines. Therefore, several scenarios are created in which one of the three baths of the CBB is still fed with 40 °C, so the baths of at least one other machine can use 60 °C water. Creating scenarios in which two or more of the larger baths of the CBB are not fed with 60 °C water is useless. As the capacity of the 40 °C water is not high enough, one of these baths must be fed with 25 °C water. This would result in additional costs for implementing this plan, as colder water is used in the washing baths than currently is the case. The scenarios in which only the baths of the CBB are fed with 60 °C water will always be more beneficial. Therefore, only the scenarios in which none or just one of the larger washing baths of the CBB is not fed with 60 °C water are taken into account. Scenario 1 till 4: For scenario 1 till 4 the three largest washing baths of the CBB (B1-B3, B7, and B13) are all fed with the warmest Thiolon water of 60 °C. This results in a 60 °C water consumption level of m3/year which exceeds the 60 °C water capacity with about m3/year, which is expected to be surmountable, as mentioned above. Next, the 40 °C water is allocated. If the heat exchanger of the ME is fed with 40 °C water, there is still enough 40 °C water left to also allocate this temperature gradient to the cooling section of the CVM. Even now, enough capacity of 40 °C water is left to either allocate to bath 1 and 8 of the FRL (scenario 1) or to B6, B10, and B12 of the CBB and bath 8 of the FRL (scenario 2). However, when the heat exchanger of the CVM is chosen first to be fed with 40 °C water, only bath 8 of the FRL (scenario 3) or the cooling section of the ME and B6, B10, and B12 of the CBB (scenario 4) can be fed with this water type too.
37
Scenario 5 till 7: If B1-B3 of the CBB is still fed with 40 °C water instead of 60 °C water, about m3/year of 60 °C water becomes available for other machines. This is not enough to feed 60 °C water to the heat exchanger of the CVM which uses m3/year. So, only a combination of the heat exchanger of the ME, B1 and B8 of the FRL, and B6, B10, and B12 of the CBB is possible. As the two largest water consumers amongst them (heat exchanger ME and B8 FRL) can both be fed with 60 °C water, this is the most optimal combination. Any other combination would result in decreased savings. As less 60 °C water is used in those other options, they would still require more steam to reach the right bath temperatures. Next, the remaining m3 of 40 °C water needs to be allocated. Again, this amount does not suffice for the heat exchanger of the CVM which is therefore fed with 25 °C water this time. Furthermore, a combination of the cooling section of the ME and the cooling section of the CVM is not possible. If the cooling section of the CVM is fed with 40 °C water, B6, B10, and B12 of the CBB (scenario 5) or B1 of the FRL (scenario 6) can also be fed with 40 °C water. If the cooling section of the ME is fed with 40 °C water, B6, B10, and B12 of the CBB and B1 of the FRL can all be fed with 40 °C water (scenario 7). Scenario 8 till 14: If B7 of the CBB is still fed with 40 °C water instead of 60 °C water, about m3/year of 60 °C water becomes available for the other machines. As 60 °C cannot be used for cooling activities, this amount is almost enough to serve all the other water entrance points for the washing baths. When the heat exchanger of the CVM is fed with 25 °C water, indeed the heat exchanger of the ME, bath 1 and 8 of the FRL, and B6, B10, and B12 of the CBB can be fed with 60 °C water. Furthermore, enough 40 °C water is left to allocate to the cooling section of the ME (scenario 8). However, if the heat exchanger of the CVM is fed with 60 °C, only enough 60 °C water is left for one of the three small baths of the CBB. The cooling section of the ME, together with the other two small baths of the CBB and bath 1 of the FRL, can be fed with 40 °C water (scenario 9 till 14). For the cooling section of the CVM, not enough 40 °C water is left after allocating 40 °C water to B7 of the CBB. Scenario 15 till 21: If B 13 of the CBB is still fed with 40 °C, basically the same 7 scenarios as the previous 7 are possible, only with B13 instead of B7 as the bath with 40 °C water on the CBB. In Appendix 6 the 21 different scenarios are given in more detail.
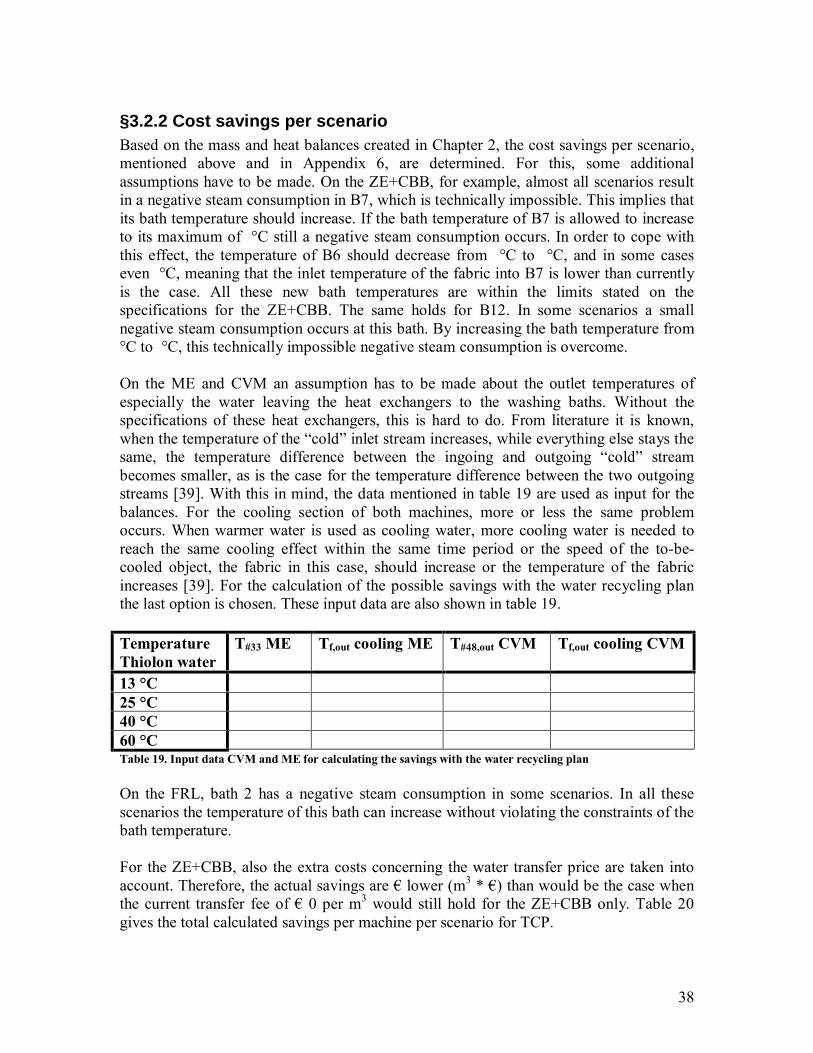
38
§3.2.2 Cost savings per scenario Based on the mass and heat balances created in Chapter 2, the cost savings per scenario, mentioned above and in Appendix 6, are determined. For this, some additional assumptions have to be made. On the ZE+CBB, for example, almost all scenarios result in a negative steam consumption in B7, which is technically impossible. This implies that its bath temperature should increase. If the bath temperature of B7 is allowed to increase to its maximum of °C still a negative steam consumption occurs. In order to cope with this effect, the temperature of B6 should decrease from °C to °C, and in some cases even °C, meaning that the inlet temperature of the fabric into B7 is lower than currently is the case. All these new bath temperatures are within the limits stated on the specifications for the ZE+CBB. The same holds for B12. In some scenarios a small negative steam consumption occurs at this bath. By increasing the bath temperature from °C to °C, this technically impossible negative steam consumption is overcome. On the ME and CVM an assumption has to be made about the outlet temperatures of especially the water leaving the heat exchangers to the washing baths. Without the specifications of these heat exchangers, this is hard to do. From literature it is known, when the temperature of the “cold” inlet stream increases, while everything else stays the same, the temperature difference between the ingoing and outgoing “cold” stream becomes smaller, as is the case for the temperature difference between the two outgoing streams [39]. With this in mind, the data mentioned in table 19 are used as input for the balances. For the cooling section of both machines, more or less the same problem occurs. When warmer water is used as cooling water, more cooling water is needed to reach the same cooling effect within the same time period or the speed of the to-be-cooled object, the fabric in this case, should increase or the temperature of the fabric increases [39]. For the calculation of the possible savings with the water recycling plan the last option is chosen. These input data are also shown in table 19.
On the FRL, bath 2 has a negative steam consumption in some scenarios. In all these scenarios the temperature of this bath can increase without violating the constraints of the bath temperature. For the ZE+CBB, also the extra costs concerning the water transfer price are taken into account. Therefore, the actual savings are € lower (m3 * €) than would be the case when the current transfer fee of € 0 per m3 would still hold for the ZE+CBB only. Table 20 gives the total calculated savings per machine per scenario for TCP.
Temperature Thiolon water
T#33 ME Tf,out cooling ME T#48,out CVM Tf,out cooling CVM
13 °C 25 °C 40 °C 60 °C Table 19. Input data CVM and ME for calculating the savings with the water recycling plan

39
Table 20. Savings per machine per scenario for TCP due to the water recycling plan a. Based on the created mass and thermal energy balances and the cost prices mentioned in table 7. Table 20 is only based on the savings possible with each scenario. Although, there are some investments needed to put the water recycling plan into action. Especially the piping system between Thiolon and Protect (external) needs to be installed, as are some parts of the piping system inside the production hall of Protect (internal). Investments in the internal piping system are already reduced as the piping system currently used for delivering fresh spring water to the machines, so before the water recycling plan is put into action, will be used for the 25 °C water when the plan is implemented [3]. The same holds for the current piping system used to deliver the 40 °C water to the CBB. When the water recycling is implemented this piping system is used for the 60 °C water [3]. Furthermore, between the 21 scenarios not that many differences occur. For example, the 13 °C piping system is almost the same for all scenarios. Therefore, it is expected that the decision for a certain scenario does not influence the costs of the internal piping system drastically. Especially, as all the water enters Protect at a central point. The external piping system is the same for all scenarios [3]. Therefore, the costs involved are expected to be negligible when selecting the best scenario.
§3.2.3 Conclusions drawn from the water recycling plan analysis Based on table 20 it can be concluded that the possible savings, based on the created mass and thermal energy balances and the capacity levels stated on page 34, for the 21 different scenarios do not differ that much. As the differences in costs are expected to also be relatively small it can be concluded that it does not really matter which of the given scenarios is chosen. Although, based on the possible savings, scenario 1 (see table 21) seems the most beneficial. Furthermore, it can be concluded based on the water recycling plan analysis above that especially the capacity of 40 °C and 60 °C water is crucial for the total savings possible. As the CBB is currently fed with 40 °C water, the three largest water entrance points of the CBB (B1-3, B7, and B13) should be fed with 60 °C water in order to reach the highest savings. If too little 60 °C water would be available to feed all three of them completely with the warmest water, one of them should (partially) be fed with 40 °C water to keep the savings high (e.g. scenario 5 till 21). B1-B3 is the best option for this based on table 20 (scenario 5 till 7). If, however, the capacity of 60 °C water would actually be so low that only one of the three baths could be fed with this water, the capacity of 40 °C water should increase a lot in order to still feed the other two baths with the 40 °C water instead, to keep the savings just near the amounts given in table 20.
40
However, if the capacity of both temperature gradients increases, the total savings shall do so too, as more baths can be supplied with warmer water which reduces the need for steam to heat these baths. It is expected by the founder of this plan that the amount of 40 °C water can double and the amount of 60 °C water can increase enough to feed all three baths of the CBB completely due to increased production at Thiolon [57]. With these capacities of warmer water all the other baths can be supplied with 40 °C water (the “cold” baths of the CVM and B3 of the ME remain fed with 25 °C water due to temperature constraints as mentioned in paragraph 3.2.1). The cooling section and heat exchanger of both the CVM and ME, that supply the baths of water as well, can also be fed with 40 °C water. The total savings of the water recycling plan would then rise to more than €, based on the created mass and thermal energy balances.
Table 21. Scenario 1: The best scenario for allocating the capacity levels mentioned on page 34
41
As a result of this capacity discussion the following can be recommended for the construction of the internal piping system to obtain the largest savings possible with the water recycling plan. For sure, the three largest baths of the CBB should be connected to the 60 °C water. However, a stand-by connection should be made to preferably the 40 °C water as well, in case the capacity of 60 °C water does not suffice. A stand-by connection to one of the other temperature gradients would result in much lower savings (varying between € and € per m3 for 25 °C water or 13 °C water respectively at B1-B3, based on the created balances). For the baths of the other machines (besides the ones that cannot be supplied with 40 °C water due to the temperature constraints) and the cooling section and heat exchanger of the CVM and ME a connection to the 40 °C water is recommended. As the exact capacity of 40 °C water is not known, again a stand-by connection is needed. Preferably this connection is made to the 25 °C water, as this water still results in some steam savings where the 13 °C water does not do so. When the capacity of 40 °C water would not suffice, it is recommended to allocate it evenly over the ME, CVM, and FRL, as was more or less done in scenario 1. In this way, savings are made on all three, instead of one or two, machines. All the other, none steam saving, production steps should be connected to the 25 °C water as much as possible, keeping in mind the temperature constraints of the production steps, as the 25 °C water saves in the amount of fresh spring needed for TenCate as a whole. For the remainder of the research at hand it is assumed that scenario 1 describes the production situation at TCP in the near future. Appendix 7 shows the utility costs per production step on the ZE+CBB, ME, CVM, and FRL in the near future.
42
Chapter 4. Additional savings in utility consumption In the previous chapters, the current and near future state of the production facility of TenCate Protect in Nijverdal-North are described based on the available information. For this purpose mass and thermal energy balances of the production machines were created in paragraphs 2.4 and 3.1. Based on these created balances also the effects of the near future plans of TCP (the start of the integration project and the implementation of the water recycling plan) on the utility consumption levels could be described in paragraph 3.2. During the creation of the mass and thermal energy balances for the different machines, production steps were identified for which additional savings in utility consumption levels, besides those resulting from the water recycling plan, seem interesting. In general, these production steps are the washing baths, drying sections, fixation sections, and steamers. This chapter elaborates on the potential savings for these production steps based on the created mass and thermal energy balances for the near future situation. However, as investments are needed for most of the proposed saving options mentioned in this chapter, not all of the proposed actions are beneficial for TCP. Therefore, a net present value calculation is done to determine the attractiveness of the potential savings [60]. However, not all investment costs are known with certainty at the moment of writing this report. Therefore, amongst others, sensitivity analyses are given too to give more certainty about the financial attractiveness of the proposed savings. In paragraph 4.1 the necessary financial information, used by TCP, for the net present value calculations is given. The potential savings for the mentioned production steps on the different machines are determined in paragraph 4.2 till 4.5 respectively by means of the created mass and thermal energy balances for the near future. In paragraph 4.6, the sensitivity analyses for the proposed options are given. This chapter results in an overview of the utility saving options interesting for TCP.
§4.1 Financial parameters used for investment decisions by TCP As mentioned above, for most of the potential utility saving options investments are needed. As these investments have to be made now in order to gain yearly savings in the years following, a net present value (NPV) calculation is used to take into account the time value of money. For this calculation a discount rate, also known as minimum required rate of return, is needed. The higher the risks of an investment, the higher this rate should be [60]. At TCP, a company-wide discount rate of % is common, meaning that investments made by TCP all share the same risk [63]. Although this statement can be disputed, it is used in this report to unite as much as possible to the daily operations of TCP. Furthermore, for a project related to environmental aspects, like it is the case with this research, a discounted pay-back period of years must be accepted by law [4]. However, investments with a longer pay-back period can be rejected. TCP has the policy to only accept the projects with a pay-back period up to years, as it rather invests in other projects with a shorter pay-back time [4]. So, the basic formula used for the determination of the net present value of a proposed saving option in this chapter is as follows:
43
When the NPV calculated with formula (1) has a positive outcome, the proposed saving option is said to be financially attractive.
§4.2 Savings at washing baths During the creation of the mass and thermal energy balances, it was notified that the washing baths contribute for a large amount in the total utility costs. Especially the steam consumption at the baths, used to mainly give the water the appropriate temperature, resulted in these large costs. This steam consumption can be reduced when less water needs to be heated or when the temperature difference between the incoming water and the required bath temperature is reduced. The latter can be accomplished by increasing the temperature of the incoming water, as was already the case with the water recycling plan in Chapter 3, or by lowering the required bath temperatures. Of the three options mentioned now, this report only looks at the option of increasing the temperature of the incoming water. For the other two options, reducing the amount of water or lowering the bath temperatures, a negative effect on the fabric could well occur, as these options are about changing the production specifications. As the author has no background in the textile industry, the effects of changing the production specifications on the fabric are hard to point out (note: with the reduction of the amount of water used at the ME on page 35 the production specification was not changed). Therefore, further research done by TCP into the options of reducing the amount of water in a bath or lowering the bath temperatures is recommended here. For the option to increase the temperature of the incoming water, three remarks have to be made here, before this option is elaborated on for the machines with washing baths. First, in order to heat the incoming water without using any steam or gas, the only option is to make use of the heat of other water streams leaving a machine (as waste). However, this water is too contaminated to directly reuse it in other washing baths [4]. Only by the use of a liquid-liquid heat exchanger the heat from the outgoing water streams can be used to heat the colder incoming streams. Second, the investment costs for a heat exchanger suitable for these contaminated outgoing streams are expected to be around € (additional piping and installment costs included) [57]. Third, before the possible savings at a machine by using heat exchangers can be determined with the mass and thermal energy balances now, the way the new incoming temperature is derived must be determined first. For this calculation, the “worst-case” of using a parallel instead of a countercurrent heat exchanger is assumed. The temperature (T) of the water entering the baths resulting, is derived by solving the following equation with an adjustment factor (αHEX) assumed to be 85%, taking into account the degree to which the approach temperature of a parallel heat exchanger is reached:
∑∑ −Φ=−Φi
HEXinhotiinhotii
incoldiincoldi TTTT α*)](*[)](*[ ,,,,,,,, (2)
In paragraph 4.6 the effect of changing the adjustment factor is amongst others discussed. The heat exchanger option is worked out below for the machines with washing baths, ZE+CBB, ME, CVM, and FRL, based on the created mass and thermal energy balances for the near future state of the production facility of TCP.
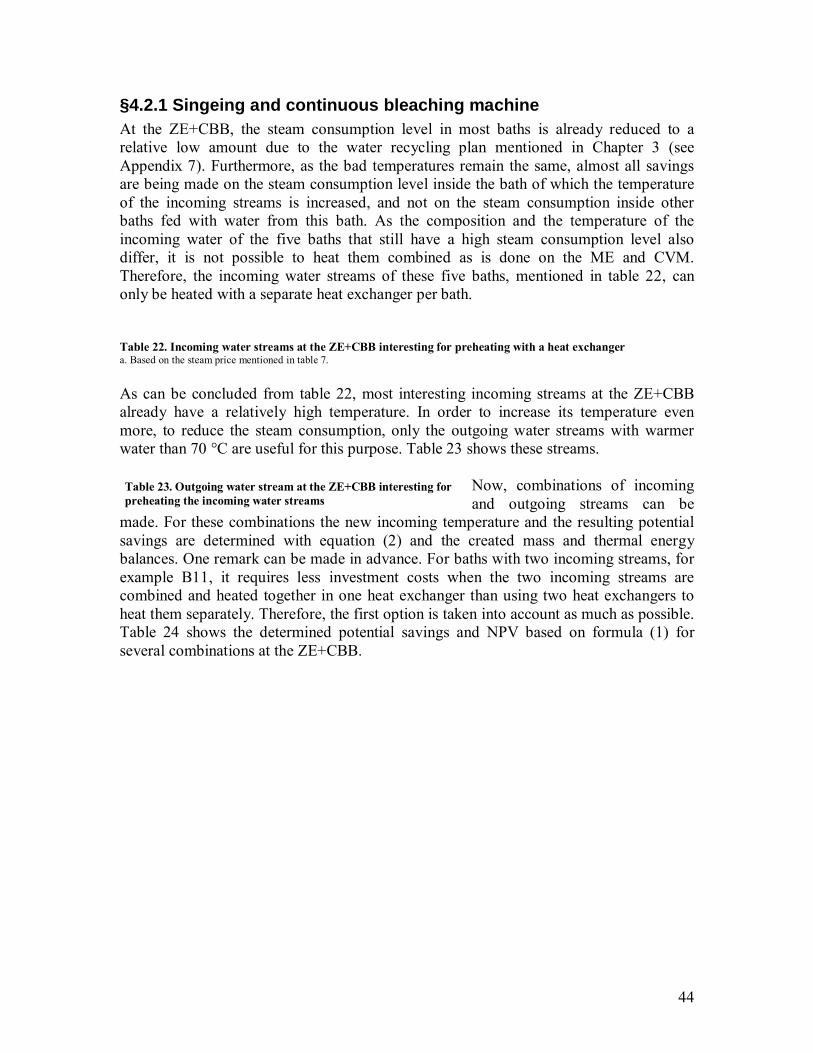
44
§4.2.1 Singeing and continuous bleaching machine At the ZE+CBB, the steam consumption level in most baths is already reduced to a relative low amount due to the water recycling plan mentioned in Chapter 3 (see Appendix 7). Furthermore, as the bad temperatures remain the same, almost all savings are being made on the steam consumption level inside the bath of which the temperature of the incoming streams is increased, and not on the steam consumption inside other baths fed with water from this bath. As the composition and the temperature of the incoming water of the five baths that still have a high steam consumption level also differ, it is not possible to heat them combined as is done on the ME and CVM. Therefore, the incoming water streams of these five baths, mentioned in table 22, can only be heated with a separate heat exchanger per bath. Table 22. Incoming water streams at the ZE+CBB interesting for preheating with a heat exchanger a. Based on the steam price mentioned in table 7. As can be concluded from table 22, most interesting incoming streams at the ZE+CBB already have a relatively high temperature. In order to increase its temperature even more, to reduce the steam consumption, only the outgoing water streams with warmer water than 70 °C are useful for this purpose. Table 23 shows these streams.
Now, combinations of incoming and outgoing streams can be
made. For these combinations the new incoming temperature and the resulting potential savings are determined with equation (2) and the created mass and thermal energy balances. One remark can be made in advance. For baths with two incoming streams, for example B11, it requires less investment costs when the two incoming streams are combined and heated together in one heat exchanger than using two heat exchangers to heat them separately. Therefore, the first option is taken into account as much as possible. Table 24 shows the determined potential savings and NPV based on formula (1) for several combinations at the ZE+CBB.
Table 23. Outgoing water stream at the ZE+CBB interesting for preheating the incoming water streams
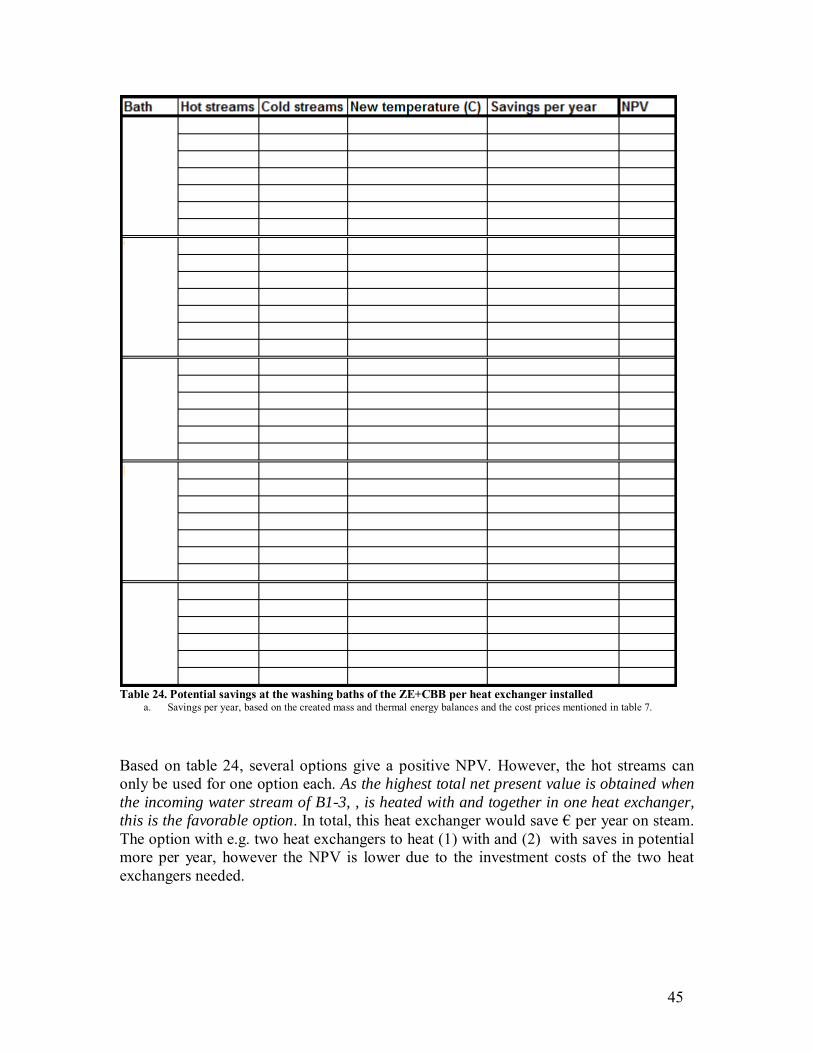
45
Table 24. Potential savings at the washing baths of the ZE+CBB per heat exchanger installed
a. Savings per year, based on the created mass and thermal energy balances and the cost prices mentioned in table 7.
Based on table 24, several options give a positive NPV. However, the hot streams can only be used for one option each. As the highest total net present value is obtained when the incoming water stream of B1-3, , is heated with and together in one heat exchanger, this is the favorable option. In total, this heat exchanger would save € per year on steam. The option with e.g. two heat exchangers to heat (1) with and (2) with saves in potential more per year, however the NPV is lower due to the investment costs of the two heat exchangers needed.
46
§4.2.2 Mercerizing machine At the ME, all the outgoing streams are already used to heat a part of the incoming water of bath 4 by means of a heat exchanger. However, the water leaving the ME as waste from this heat exchanger still has a temperature of °C, while the water entering bath 4 has a temperature of only °C. When a new heat exchanger would be used of which the temperature could be again estimated with equation (2), the new temperature of the water entering bath 4 could be °C. This could potentially save an additional € per year, resulting in a net present value of € negative. So, a new and better heat exchanger would not be beneficial to TCP within the given financial parameters. An additional heat exchanger used to heat the incoming water of one of the other baths with the outgoing water from the current heat exchanger is certainly not an option. Only bath 1 uses enough steam to be economically feasible in potential. However, as the coldest incoming water stream of bath 1 is already °C, it saves almost no steam when this water is heated with the water from the current heat exchanger having a temperature of °C. So, it can be concluded that no additional savings, possible with an additional heat exchanger at the washing baths, are beneficial at the ME.
§4.2.3 Continuous dyeing machine At the CVM, the incoming water for the warmer baths is already heated to 60 °C, by means of two heat exchangers. At the first heat exchanger the incoming 25 °C water is preheated by warm waste water leaving the CVM washing baths. The temperature of the 25 °C water increases to °C, while the temperature of the waste water decreases from °C to °C. After this first heat exchanger, a second heat exchanger increases the temperature of the °C water to 60 °C with indirect steam. This steam consumption is about ton per year (see Appendix 7). When the first heat exchanger would function more efficiently, less steam is potentially needed in that second heat exchanger. If the first heat exchanger would be replaced by one, for which the temperature of the water for the washing baths could be determined with equation (2), the water entering heat exchanger II would have a temperature of already °C. With this new heat exchanger ton steam per year – equal to the value of € - would be saved, resulting in a NPV of € according to formula (1). So, it is in potential financially attractive for TCP to replace the first heat exchanger of the CVM with a more efficient one. As mentioned above, the incoming 25 °C water for the warm washing baths is heated to 60 °C partially with waste water of the CVM washing baths. Heating the 25 °C water to 60 °C with the current two heat exchangers, can only be done for those recipes that require higher bath temperatures. Otherwise, the bad temperature increases undesirably due to the warmer water. Therefore, also cold water is used in these washing baths for certain “cold” recipes. However, in bath 7-8, the average bath temperature of the “cold” recipes is higher than the 60 °C of the warm water. Therefore, it seems reasonable to advice some research into this; to check whether or not it would be possible to use 60 °C water in recipes currently referred to as “cold”. However, based on the created mass and thermal energy balances, this would only save about ton steam per year. Therefore, it does not seem beneficial for TCP to prioritize this research.
47
§4.2.4 Flame retardant line Table 25. Incoming water streams at the FRL interesting for preheating with a heat exchanger a. Based on the created mass and thermal energy balances and the steam prices mentioned in table 7. At the FRL, the amount of steam used at the washing baths is relatively low. Only use steam. All the other baths do not, as their temperatures are equal to those from which they receive their water. Bath mainly (98%) uses steam for increasing the temperature of the fabric and already absorbed water and chemicals. Therefore, only baths and are interesting for possible saving options, as here not absorbed water is heated also. Table 25 shows the incoming streams of these baths and their temperatures. As both streams, and , have the same temperature and composition, they can be heated together with the warm waste water from the FRL in a heat exchanger, as is currently done at the ME and CVM. This would save in the investment costs, as then only one heat exchanger has to be put in place. Table 26 shows the outgoing streams with which the two ingoing streams can be heated. However, as can be seen in table 27, none of the possible heat exchanger combinations makes a positive net present value. Therefore, it can be concluded that it seems not beneficial for TCP to install a heat exchanger at the washing section of the FRL. Table 27. Potential savings at the washing baths of the FRL per heat exchanger installed a. Based on the created mass and thermal energy balances and the steam prices in table 7. b. Calculated with formula (1). Red values are negative.
§4.3 Savings at drying sections The second category of production steps for which additional saving options seem interesting based on the created mass and thermal energy balances is the drying section. At the different machines of TCP three different drying methods are used, namely: drying cylinders, IR-dryers, and hotflue + drums. For all three methods it is basically the amount of absorbed water that needs to be evaporated that determines the amount of steam or gas needed in this section. So, the costs of the drying sections can be reduced when less water needs to be evaporated. In general, this can be achieved by allowing less water to be absorbed by the fabric in the impregnation and washing sections or by increasing the humidity of the fabric after the drying section. As both options have an impact on the production specifications and end-quality of the fabric and as the author himself has no background in the textile industry as mentioned before, further research done by TCP into both options is recommended here. However, besides the general options mentioned above to reduce the steam or gas consumption, each of the drying methods also has method specific options to reduce the steam or gas consumption. The following three subparagraphs elaborate on these saving options possible for the three drying methods separately.
Table 26. Outgoing water streams at the FRL interesting for heating the incoming streams
48
§4.3.1 Drying cylinders The drying cylinder method is used at the ZE+CBB, ME, CVM, FRL, and SA. Besides at the SA and the first one at the FRL, all drying cylinders consist of a mechanical drying part preceding the steam-heated cylinders. It is this mechanical part in which savings in the steam consumption can be made. When more than the current % of the absorbed water is removed from the fabric by mechanical means, less water has to be evaporated by means of the steam-heated cylinders, which saves steam. However, it is questionable how much more water can be removed from the fabric by mechanical means without affecting the quality of fabric. As the total steam savings - based on the created mass and thermal energy balances for all four machines together - could be € per year, when the percentage of water removed from the fabric by mechanical means would increase to %, further research done into this option by TCP seems worthwhile.
§4.3.2 IR-dryers IR-dryers are used at both the FRL and the VV/TH. However, the two IR-dryers used are not identical. The IR-dryer of the FRL makes use of a shelter case consisting of reflecting sheets to overcome a large loss of radiation efficiency to open-air around the machine. The IR-dryer of the VV/TH is lacking this casing. This basically results in the large difference in radiation efficiency of the IR-dryers of the FRL (%) and of the VV/TH ( %). In literature it is stated that a radiation efficiency of roughly 50 to 60% should be possible when reflecting sheets are used [64]. So, the radiation efficiency of the IR-dryer of the FRL seems acceptable. However, at the IR-dryer of the VV/TH it would be possible to save considerably on gas when such reflecting sheets were put in place. If the radiation efficiency would increase to the lower literature value of 50%, this could save € per year on gas needed to pre-dry the fabric (m3 instead of the current m3), based on the created mass and thermal energy balances for the VV/TH. However, the investment costs needed to acquire and install these sheets is not known at the moment of writing this report. Based on the NPV formula (1), a maximum allowable investment cost can be determined. As long as the total investment costs for the reflecting sheets stay below € it is beneficial for TCP to acquire and install those reflecting sheets at the IR-dryer of the VV/TH.
§4.3.3 Hotflue + drums Only the hotflue + drums at the VV/TH are used for drying the fabric. At TCP there is one other hotflue used: the Thermex hotflue. However, here, water-repellent chemicals are fixated onto the fabric. At the Thermex hotflue the internal air is heated by means of direct flame and ventilated into the chambers where the fabric is, while at the hotflue at the VV/TH, the internal air is heated by means of a steam-based heat exchanger. At the
49
hotflue + drums of the VV/TH possible savings can be made if the steam-based heat exchanger can be replaced by a gas burner like the one used at the Thermex hotflue. In order to reach the same TJ/yr needed to heat the air for drying the fabric (see page 102), m3 of gas is needed instead of the current ton steam. This amount of gas could save € per year based on the cost prices mentioned in table 7. However, the investment costs for the replacement of the current steam-based heat exchanger by a gas burner are not known at the moment of writing this report. Based on the NPV formula (1), a maximum replacement cost can be determined. As long as the total investment costs for the replacement of the current steam-based heat exchanger by a gas burner at the hotflue + drums at the VV/TH stay below € it is beneficial for TCP to replace this heat exchanger.
§4.4 Savings at steamers Steamers are used at the ZE+CBB and CVM. Inside the steamers the chemicals are given the time to work in onto the fabric at appropriate high temperatures. However, how much steam is needed for which purpose (heating the fabric, endothermic reactions, et cetera) is not known by TCP. This was already notified during the creation of the mass and thermal energy balances. Therefore, it is hard to pinpoint the possible saving options at the steamers. As mentioned already in paragraph 2.4.5, further research done by TCP at the steamers is recommended.
§4.5 Savings at fixation sections The four stenter frames, Thermex, VV/TH, and SA, all have fixation sections. Besides the SA, that uses the heat from indirect steam, all the other machines use pre-heated air in the actual fixation sections. At these sections, possible savings can be made when less heat is needed. In the in Chapter 2 created mass and thermal energy balances, an efficiency of 85% was assumed. Furthermore, the heat needed for heating and drying the fabric could be determined. The remaining heat was appointed to the actual fixation. Whether or not the amount of this calculated fixation heat is actually used and needed or that less heat would suffice too is hard to say based on the available information. Therefore, TCP is recommended to do further research in the required and used fixation heats.
However, without changing anything in the calculated fixation heats, another possible
saving option exists. The machines that use pre-heated air could save on gas when warmer air than the current 25 °C air is led into the gas burner for the pre-heating, as less gas is needed to heat this air to the required temperature. The warmer air could be obtained by using an air-air heat exchanger to heat the fresh air with the air leaving the fixation section. For the determination of the new temperature of the air entering the gas burner again equation (2) is used. As the investment costs of an air-air heat exchanger are not known at the moment of writing this report, the NPV formula (1) is used to determine the maximum allowable investment costs. Table 28 shows the incoming air streams that are interesting for this additional pre-heating.
Table 28. Incoming air streams different gas burners of fixation sections
50
The warm air streams that can be used to pre-heat these incoming streams are given in table 29. By making combinations of the incoming and outgoing air streams potential savings can be calculated. As the four stenter frames are placed close to each other, one heat exchanger for all four machines is the only one of these combinations in which multiple machines are combined. The maximum investment costs for an air-air heat exchanger per combination to be beneficial to TCP are represented in table 30. As air-air heat exchangers are usually more expensive than a liquid-liquid heat exchanger [57], only the option in which the four ingoing air streams of the four stenter frames are pre-heated with the outgoing four air streams of these stenter frames could be beneficial to TCP. Table 30. Potential savings at the fixation sections per air-air heat exchanger installed
a. Based on the created mass and thermal energy balances and the cost prices mentioned in table 7.
§4.6 Feasibility study of the proposed saving options In the four preceding paragraphs utility saving options for TCP are proposed. However, if further research is needed before possible saving options can be proposed, this was mentioned too. The potential savings proposed are derived from the created mass and thermal energy balances and based on the cost prices mentioned in table 7. Together with specific financial data from TCP, like the discount factor and expected pay-back time, the maximum allowable investment costs could be determined. However, when an indication about the investment costs was already given, the net present value of the proposed saving option could be determined by formula (1). When the net present value turned out positive, the proposed saving option is said to be beneficial to TCP.
Table 29. Outgoing air streams interesting for heating the incoming streams
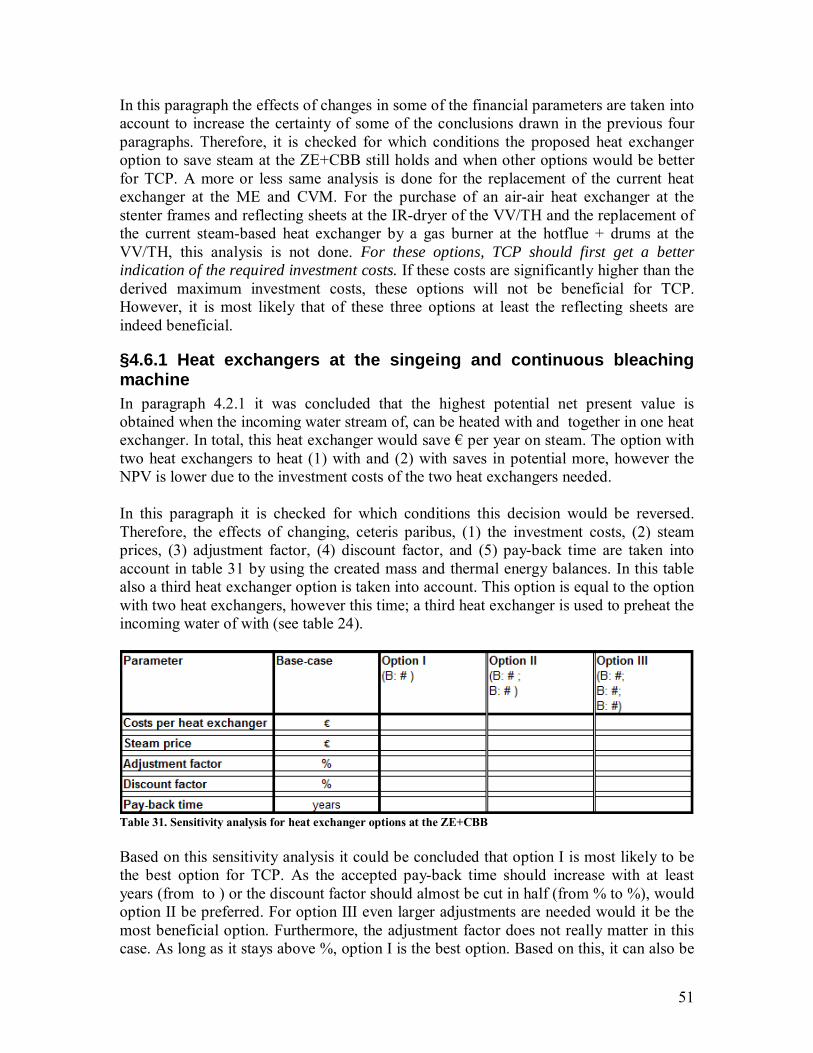
51
In this paragraph the effects of changes in some of the financial parameters are taken into account to increase the certainty of some of the conclusions drawn in the previous four paragraphs. Therefore, it is checked for which conditions the proposed heat exchanger option to save steam at the ZE+CBB still holds and when other options would be better for TCP. A more or less same analysis is done for the replacement of the current heat exchanger at the ME and CVM. For the purchase of an air-air heat exchanger at the stenter frames and reflecting sheets at the IR-dryer of the VV/TH and the replacement of the current steam-based heat exchanger by a gas burner at the hotflue + drums at the VV/TH, this analysis is not done. For these options, TCP should first get a better indication of the required investment costs. If these costs are significantly higher than the derived maximum investment costs, these options will not be beneficial for TCP. However, it is most likely that of these three options at least the reflecting sheets are indeed beneficial.
§4.6.1 Heat exchangers at the singeing and continuous bleaching machine In paragraph 4.2.1 it was concluded that the highest potential net present value is obtained when the incoming water stream of, can be heated with and together in one heat exchanger. In total, this heat exchanger would save € per year on steam. The option with two heat exchangers to heat (1) with and (2) with saves in potential more, however the NPV is lower due to the investment costs of the two heat exchangers needed. In this paragraph it is checked for which conditions this decision would be reversed. Therefore, the effects of changing, ceteris paribus, (1) the investment costs, (2) steam prices, (3) adjustment factor, (4) discount factor, and (5) pay-back time are taken into account in table 31 by using the created mass and thermal energy balances. In this table also a third heat exchanger option is taken into account. This option is equal to the option with two heat exchangers, however this time; a third heat exchanger is used to preheat the incoming water of with (see table 24).
Table 31. Sensitivity analysis for heat exchanger options at the ZE+CBB Based on this sensitivity analysis it could be concluded that option I is most likely to be the best option for TCP. As the accepted pay-back time should increase with at least years (from to ) or the discount factor should almost be cut in half (from % to %), would option II be preferred. For option III even larger adjustments are needed would it be the most beneficial option. Furthermore, the adjustment factor does not really matter in this case. As long as it stays above %, option I is the best option. Based on this, it can also be
52
concluded that option I is preferred when a countercurrent heat exchanger, where even a temperature cross over can occur, is used [65]. However, there are two parameters that cause doubts: the investment costs and steam price. As the gas price is increasing (see Appendix 3), it is not unreasonable to expect the average gas price over the coming years to be near € - € per m3. These average gas prices result in steam prices overlapping option I and option II as most beneficial option (see page 21 for the calculation of the steam price). Furthermore, the exact investment costs for the heat exchangers are not known yet; the € was an indication. If the investment costs would be somewhat lower, say €, already a lower average steam price would make option II more beneficial for TCP than option I. However, somewhat higher investment costs would have the reverse effect and result in option I to be more beneficial at a higher gas price. Therefore, TCP is recommended here to ask prospects for both heat exchanger options I and II. Based on the resulting actual investment costs and the expected average gas price, TCP should make their decision between option I and II.
§4.6.2 Replacement of the current heat exchanger at the mercerizing machine For the mercerizing machine, it was proposed in paragraph 4.2.2 to replace the current heat exchanger with a new and more efficient one. Based on formula (1) and equation (2), it was concluded that this option is not beneficial for TCP, as its NPV is a little more than € negative, given the investment costs of € for a heat exchanger. As the € is relatively small compared to the investment costs, sensitivity analyses are done to determine for which changes in financial parameters a new heat exchanger at the ME would be beneficial for TCP. The effects of changing, ceteris paribus, (1) the investment costs, (2) steam prices, (3) adjustment factor, (4) discount factor, and (5) pay-back time are taken into account in table 32 by using the created mass and thermal energy balances.
Based on the sensitivity analyses it can be concluded that it does not take large adjustments in some financial parameters to make a new heat exchanger at the ME beneficial for TCP. For example, an increase of the pay-back time with one year would already do the trick as would a reduction of a little more than € in investment costs, which could already be obtained by selling the current heat exchanger. Also the steam price of € (equal to a gas price of approximately €) does not seem insurmountable, as the gas price is likely to increase even more, as mentioned in the previous paragraph. Combining especially the investment costs and expected steam price, it can be concluded that a new and more efficient heat exchanger at the ME would be more beneficial for TCP than keeping the current one in place.
§4.6.3 Replacement of the current heat exchanger at the continuous dyeing machine For the continuous dyeing machine, it was proposed in paragraph 4.2.3 to replace the current first heat exchanger with a new and more efficient one. Based on formula (1) and equation (2), it was concluded that this option is beneficial for TCP, as its NPV is a higher than € positive, given the investment costs of € for a heat exchanger. However, for
Table 32. Sensitivity analysis for a new heat exchanger at the ME
53
this option too, sensitivity analyses are done. Here, especially to determine how rock solid the decision would be to replace the current heat exchanger by a new and more efficient one at the CVM. The effects of changing, ceteris paribus, (1) the investment costs, (2) steam prices, (3) adjustment factor, (4) discount factor, and (5) pay-back time are taken into account in table 33 by using the created mass and thermal energy balances.
Based on the sensitivity analyses it can be concluded that the replacement of the current first heat exchanger is a good decision, as could be expected with a NPV of more than €. Especially the steam price required to withdraw this conclusion is distinctively low, while the investment costs required are very high, that it seems unrealistic to do so. Therefore, TCP is recommended to replace the current first heat exchanger of the CVM with a more efficient one.
§4.7 Summary of the potential utility saving options In this chapter, possible additional utility saving options are proposed based on the created mass and thermal energy balances for the near future when the existing plan for reusing the cooling water of Thiolon at TCP is implemented. Furthermore, additional research options are recommended. This further research can be divided into two categories. One, for some proposed saving options the investment costs need to be determined before it can be concluded whether or not these options are beneficial for TCP. Two, general research is needed to determine if other proposed saving options are technically feasible and to what extend utilities can be saved by these options. Below, the main conclusions and potential savings are enumerated in table 34.
Table 33. Sensitivity analysis for a new first heat exchanger at the CVM

54
Table 34. Main conclusion of Chapter 4 a. Savings based on the created mass and thermal energy balances and the cost prices mentioned in table 7.
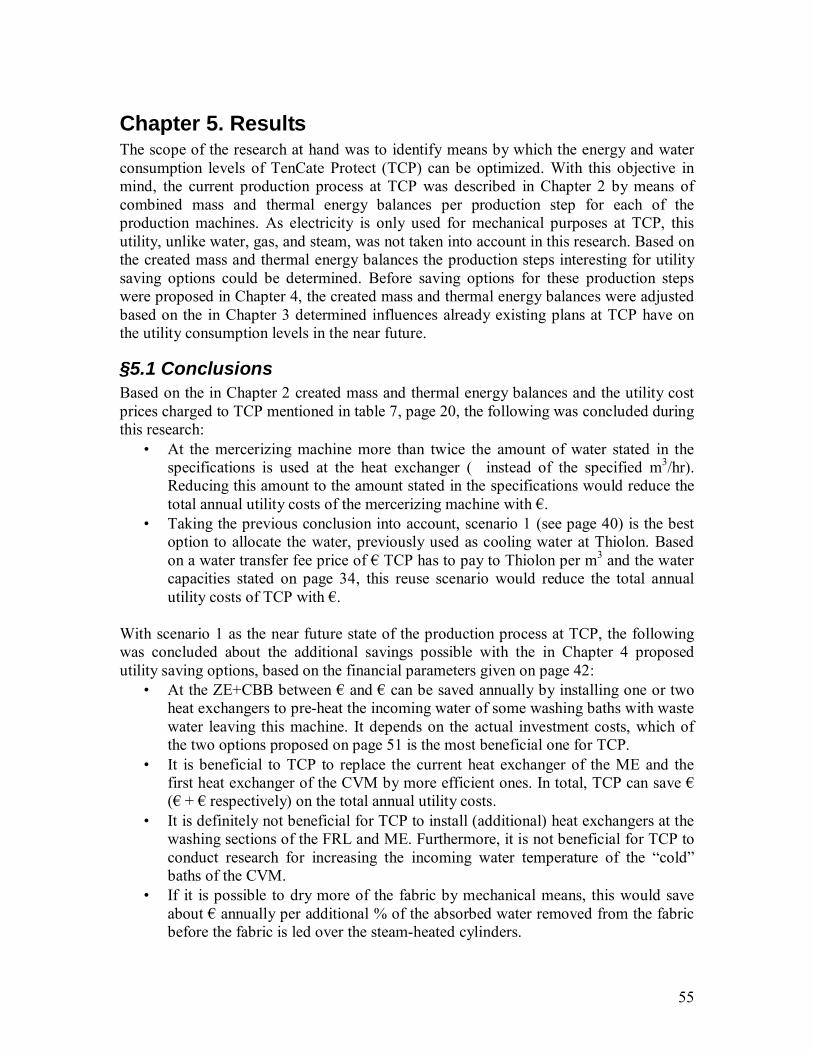
55
Chapter 5. Results The scope of the research at hand was to identify means by which the energy and water consumption levels of TenCate Protect (TCP) can be optimized. With this objective in mind, the current production process at TCP was described in Chapter 2 by means of combined mass and thermal energy balances per production step for each of the production machines. As electricity is only used for mechanical purposes at TCP, this utility, unlike water, gas, and steam, was not taken into account in this research. Based on the created mass and thermal energy balances the production steps interesting for utility saving options could be determined. Before saving options for these production steps were proposed in Chapter 4, the created mass and thermal energy balances were adjusted based on the in Chapter 3 determined influences already existing plans at TCP have on the utility consumption levels in the near future.
§5.1 Conclusions Based on the in Chapter 2 created mass and thermal energy balances and the utility cost prices charged to TCP mentioned in table 7, page 20, the following was concluded during this research:
• At the mercerizing machine more than twice the amount of water stated in the specifications is used at the heat exchanger ( instead of the specified m3/hr). Reducing this amount to the amount stated in the specifications would reduce the total annual utility costs of the mercerizing machine with €.
• Taking the previous conclusion into account, scenario 1 (see page 40) is the best option to allocate the water, previously used as cooling water at Thiolon. Based on a water transfer fee price of € TCP has to pay to Thiolon per m3 and the water capacities stated on page 34, this reuse scenario would reduce the total annual utility costs of TCP with €.
With scenario 1 as the near future state of the production process at TCP, the following was concluded about the additional savings possible with the in Chapter 4 proposed utility saving options, based on the financial parameters given on page 42:
• At the ZE+CBB between € and € can be saved annually by installing one or two heat exchangers to pre-heat the incoming water of some washing baths with waste water leaving this machine. It depends on the actual investment costs, which of the two options proposed on page 51 is the most beneficial one for TCP.
• It is beneficial to TCP to replace the current heat exchanger of the ME and the first heat exchanger of the CVM by more efficient ones. In total, TCP can save € (€ + € respectively) on the total annual utility costs.
• It is definitely not beneficial for TCP to install (additional) heat exchangers at the washing sections of the FRL and ME. Furthermore, it is not beneficial for TCP to conduct research for increasing the incoming water temperature of the “cold” baths of the CVM.
• If it is possible to dry more of the fabric by mechanical means, this would save about € annually per additional % of the absorbed water removed from the fabric before the fabric is led over the steam-heated cylinders.
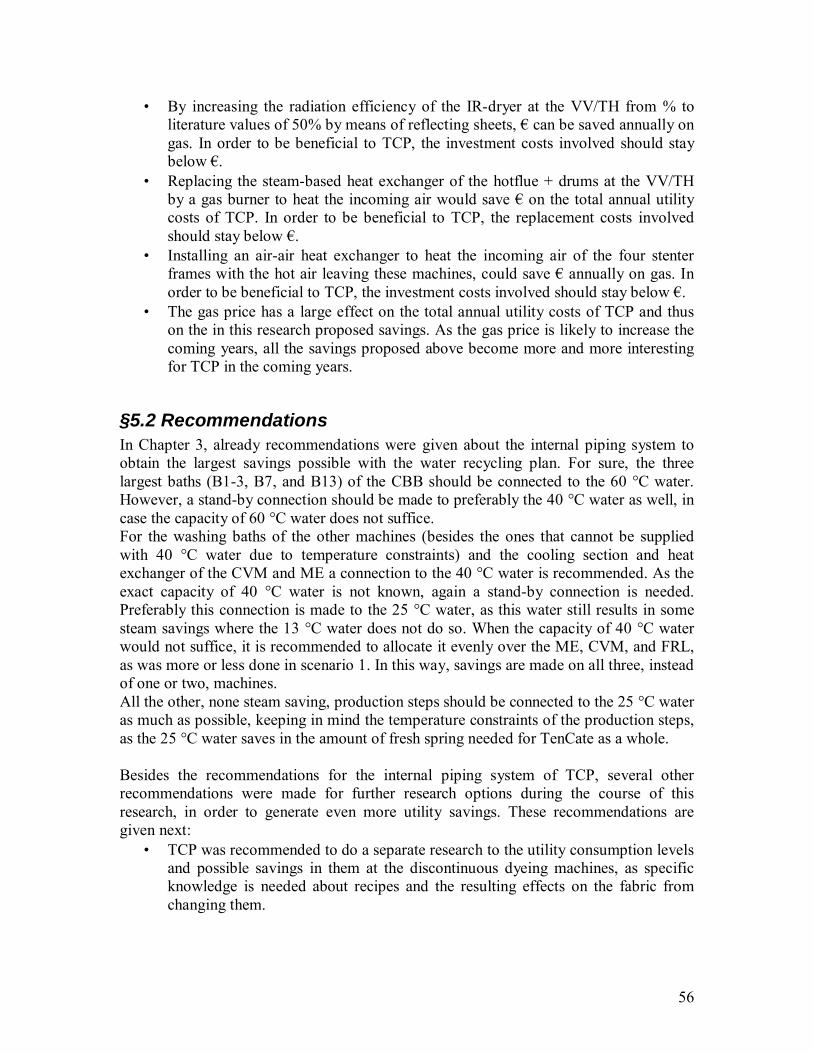
56
• By increasing the radiation efficiency of the IR-dryer at the VV/TH from % to literature values of 50% by means of reflecting sheets, € can be saved annually on gas. In order to be beneficial to TCP, the investment costs involved should stay below €.
• Replacing the steam-based heat exchanger of the hotflue + drums at the VV/TH by a gas burner to heat the incoming air would save € on the total annual utility costs of TCP. In order to be beneficial to TCP, the replacement costs involved should stay below €.
• Installing an air-air heat exchanger to heat the incoming air of the four stenter frames with the hot air leaving these machines, could save € annually on gas. In order to be beneficial to TCP, the investment costs involved should stay below €.
• The gas price has a large effect on the total annual utility costs of TCP and thus on the in this research proposed savings. As the gas price is likely to increase the coming years, all the savings proposed above become more and more interesting for TCP in the coming years.
§5.2 Recommendations In Chapter 3, already recommendations were given about the internal piping system to obtain the largest savings possible with the water recycling plan. For sure, the three largest baths (B1-3, B7, and B13) of the CBB should be connected to the 60 °C water. However, a stand-by connection should be made to preferably the 40 °C water as well, in case the capacity of 60 °C water does not suffice. For the washing baths of the other machines (besides the ones that cannot be supplied with 40 °C water due to temperature constraints) and the cooling section and heat exchanger of the CVM and ME a connection to the 40 °C water is recommended. As the exact capacity of 40 °C water is not known, again a stand-by connection is needed. Preferably this connection is made to the 25 °C water, as this water still results in some steam savings where the 13 °C water does not do so. When the capacity of 40 °C water would not suffice, it is recommended to allocate it evenly over the ME, CVM, and FRL, as was more or less done in scenario 1. In this way, savings are made on all three, instead of one or two, machines. All the other, none steam saving, production steps should be connected to the 25 °C water as much as possible, keeping in mind the temperature constraints of the production steps, as the 25 °C water saves in the amount of fresh spring needed for TenCate as a whole. Besides the recommendations for the internal piping system of TCP, several other recommendations were made for further research options during the course of this research, in order to generate even more utility savings. These recommendations are given next:
• TCP was recommended to do a separate research to the utility consumption levels and possible savings in them at the discontinuous dyeing machines, as specific knowledge is needed about recipes and the resulting effects on the fabric from changing them.
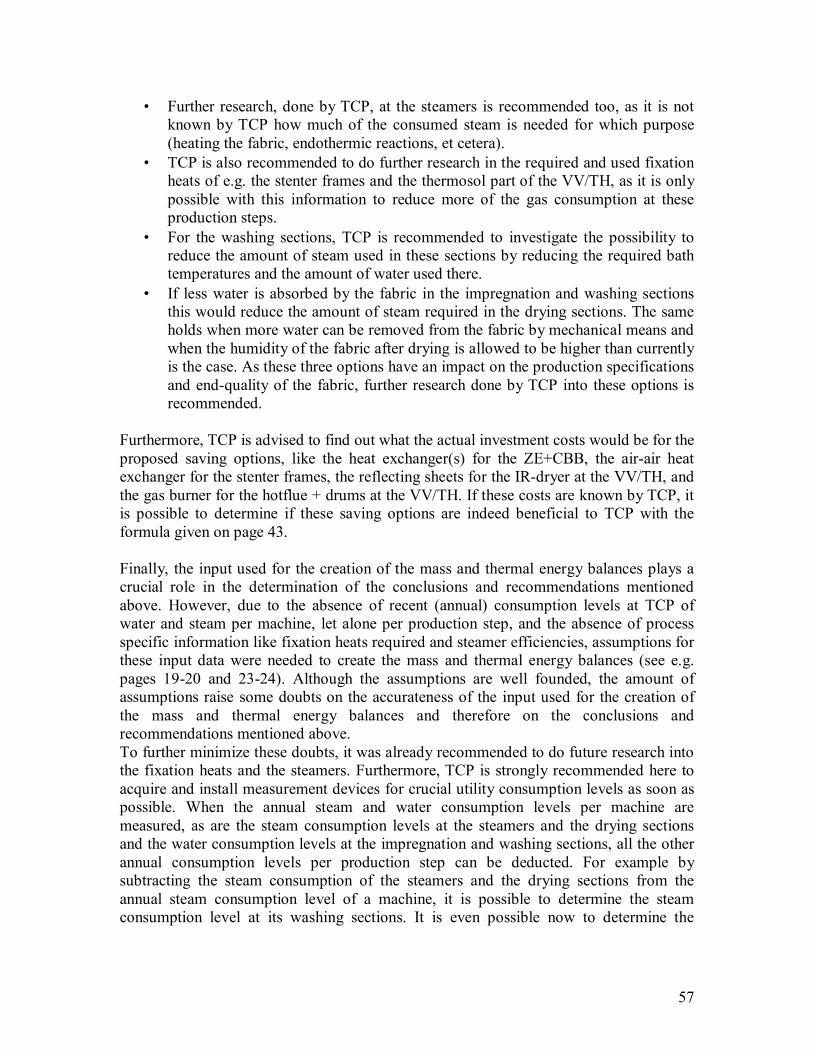
57
• Further research, done by TCP, at the steamers is recommended too, as it is not known by TCP how much of the consumed steam is needed for which purpose (heating the fabric, endothermic reactions, et cetera).
• TCP is also recommended to do further research in the required and used fixation heats of e.g. the stenter frames and the thermosol part of the VV/TH, as it is only possible with this information to reduce more of the gas consumption at these production steps.
• For the washing sections, TCP is recommended to investigate the possibility to reduce the amount of steam used in these sections by reducing the required bath temperatures and the amount of water used there.
• If less water is absorbed by the fabric in the impregnation and washing sections this would reduce the amount of steam required in the drying sections. The same holds when more water can be removed from the fabric by mechanical means and when the humidity of the fabric after drying is allowed to be higher than currently is the case. As these three options have an impact on the production specifications and end-quality of the fabric, further research done by TCP into these options is recommended.
Furthermore, TCP is advised to find out what the actual investment costs would be for the proposed saving options, like the heat exchanger(s) for the ZE+CBB, the air-air heat exchanger for the stenter frames, the reflecting sheets for the IR-dryer at the VV/TH, and the gas burner for the hotflue + drums at the VV/TH. If these costs are known by TCP, it is possible to determine if these saving options are indeed beneficial to TCP with the formula given on page 43. Finally, the input used for the creation of the mass and thermal energy balances plays a crucial role in the determination of the conclusions and recommendations mentioned above. However, due to the absence of recent (annual) consumption levels at TCP of water and steam per machine, let alone per production step, and the absence of process specific information like fixation heats required and steamer efficiencies, assumptions for these input data were needed to create the mass and thermal energy balances (see e.g. pages 19-20 and 23-24). Although the assumptions are well founded, the amount of assumptions raise some doubts on the accurateness of the input used for the creation of the mass and thermal energy balances and therefore on the conclusions and recommendations mentioned above. To further minimize these doubts, it was already recommended to do future research into the fixation heats and the steamers. Furthermore, TCP is strongly recommended here to acquire and install measurement devices for crucial utility consumption levels as soon as possible. When the annual steam and water consumption levels per machine are measured, as are the steam consumption levels at the steamers and the drying sections and the water consumption levels at the impregnation and washing sections, all the other annual consumption levels per production step can be deducted. For example by subtracting the steam consumption of the steamers and the drying sections from the annual steam consumption level of a machine, it is possible to determine the steam consumption level at its washing sections. It is even possible now to determine the
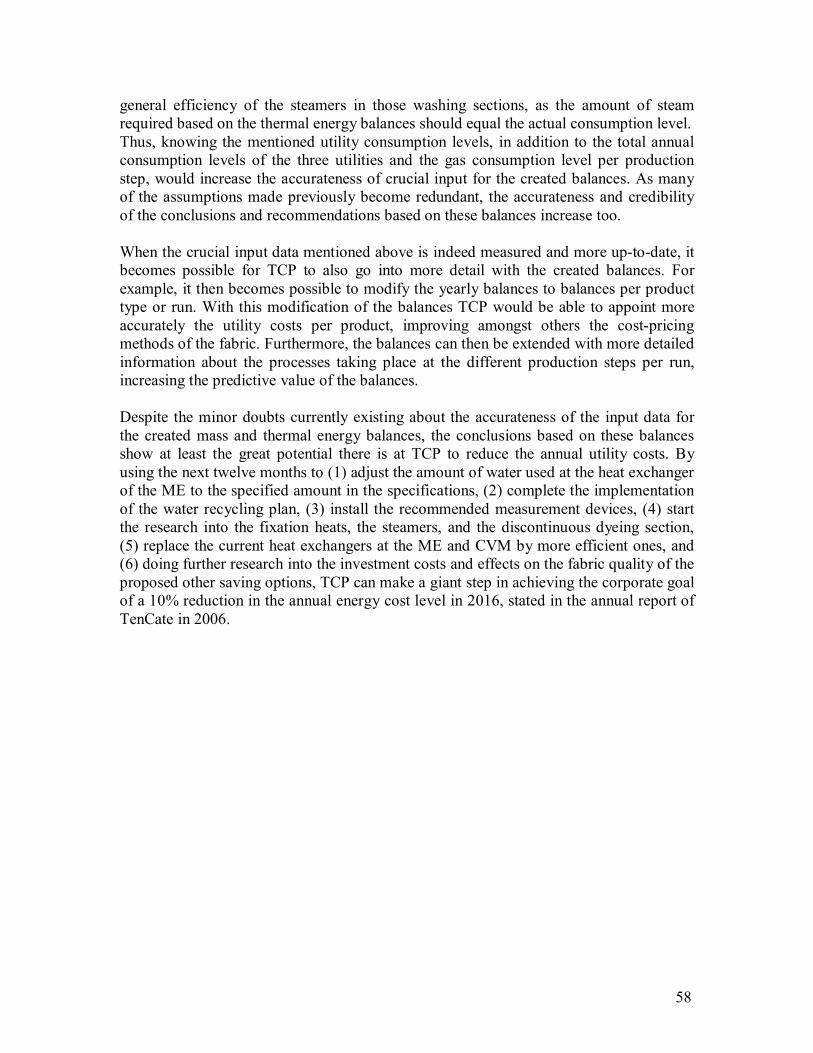
58
general efficiency of the steamers in those washing sections, as the amount of steam required based on the thermal energy balances should equal the actual consumption level. Thus, knowing the mentioned utility consumption levels, in addition to the total annual consumption levels of the three utilities and the gas consumption level per production step, would increase the accurateness of crucial input for the created balances. As many of the assumptions made previously become redundant, the accurateness and credibility of the conclusions and recommendations based on these balances increase too. When the crucial input data mentioned above is indeed measured and more up-to-date, it becomes possible for TCP to also go into more detail with the created balances. For example, it then becomes possible to modify the yearly balances to balances per product type or run. With this modification of the balances TCP would be able to appoint more accurately the utility costs per product, improving amongst others the cost-pricing methods of the fabric. Furthermore, the balances can then be extended with more detailed information about the processes taking place at the different production steps per run, increasing the predictive value of the balances. Despite the minor doubts currently existing about the accurateness of the input data for the created mass and thermal energy balances, the conclusions based on these balances show at least the great potential there is at TCP to reduce the annual utility costs. By using the next twelve months to (1) adjust the amount of water used at the heat exchanger of the ME to the specified amount in the specifications, (2) complete the implementation of the water recycling plan, (3) install the recommended measurement devices, (4) start the research into the fixation heats, the steamers, and the discontinuous dyeing section, (5) replace the current heat exchangers at the ME and CVM by more efficient ones, and (6) doing further research into the investment costs and effects on the fabric quality of the proposed other saving options, TCP can make a giant step in achieving the corporate goal of a 10% reduction in the annual energy cost level in 2016, stated in the annual report of TenCate in 2006.
59
References [1]: Royal Ten Cate (2006). Annual Report 2006. Almelo: Royal Ten Cate. [2]: Arends, E. (2002). Watermanagementplan Ten Cate bedrijven en Bieze Stork.
Enschede: Royal Haskoning (Internal report). [3]: Rosman, D. (manager technical service of TCAT). Interview on 7/11/2007. [4]: Scheffer, G.J. (milieu coordinator of TCAT). Interview on 2/11/2007. [5]: Lift group (2002). Op weg naar procesgericht denken, Part 2. Zaltbommel: LIFT
group (Internal documentation). Chapter 3 till 8. [6]: Integrated Pollution Prevention and Control (2003). Reference document on best
available techniques for the textile industry. Brussels: European Integrated Pollution Prevention and Control Bureau.
[7]: Lift group (2002). Op weg naar procesgericht denken, Part 2. Zaltbommel: LIFT group (Internal documentation). Chapter 12 till 15.
[8]: Rosman, D. (2007). verbruiken TCP.xls (Internal documentation). [9]: Stooker, J. (2000). energieverdeling TCP2000.xsl (Internal documentation). [10]: Rosman, D. (2007). ratio bepaling.xsl (Internal documentation). [11]: Heesink, A.B.M. (R&D manager of TCAT). Interview on 12/11/2007. [12]: Verslag 1-1 2008a.doc (Internal documentation). [13]: Rientjes, R.J.M. (pretreatment technologist of TCP). Interview on 28/11/2007. [14]: Veldhuis, C.A. (dyeing technologist of TCP). Interview on 20/11/2007. [15]: Vruggink, H.J. (finishing technologist of TCP). Interview on 21/11/2007. [16]: Rosman, D. (2007). Cost overview.doc (Internal documentation). [17]: Stroomberg, D. (dyeing technologist of TCP). Interview on 28/11/2007. [18]: Scheffer, G.J. (milieu coordinator of TCAT). Interview on 3/12/2007. [19]: Kuiper, H. (head technical service of TCAT). Interview and measurements on
17/12/2007. [20]: Rosman, D. (manager technical service of TCAT). Interview on 6/12/2007. [21]: Lift group (2002). Op weg naar procesgericht denken, Part 2. Zaltbommel: LIFT
group (Internal documentation). Chapter 11, pp. 57. [22]: OGDEN Manufacturing company (2006). Physical properties of material.
http://www.ogdenmfg.com/pdf/tech9.pdf (4 Dec. 2007). [23]: Asselt, W.A. van & Klein Wolterink, J.W (1994). Superkritisch CO2-verven,
inventarisatie en mogelijkheden voor het verven van textiel. Hengelo: Tebodin. [24]: Bootsveld, A.J.J.M. (2008). rtm0153.xsl (Internal documentation). [25]: Rientjes, R.J.M. (pretreatment technologist of TCP). Interview on 7/2/2008. [26]: Technology department. (2006). BR1001CBB2.doc till BR3007CBB2.doc
(Internal documentation). [27]: Aal, H. (2005). CBB-Processchema.ppt (Internal presentation). [28]: The Engineering toolbox (2005). Properties of Saturated Steam – SI Units.
http://www.engineeringtoolbox.com/saturated-steam-properties-d_101.html (5 Dec. 2007).
[29]: De Kleijn Energy Consulting (2006). Verbrandingsgegevens aardgas http://www.energyconsulting.nl/Tabellen/Verbrandingsgegevens%20aardgas.pdf (5 Dec. 2007).
[30]: Chemical data found on http://en.wikipedia.org (Dec. 2007 – Jan. 2008).
60
[31]: Whitaker Oil Company (2004). Acetic Acid. http://www.whitakeroil.com/MSDS/0900a85b800e0442.pdf (15 Jan. 2008).
[32]: US Peroxide. H2O2 Physical Properties. http://www.h2o2.com/intro/properties/physical.html#20 (25 Jan. 2008).
[33]: Lift group (2002). Op weg naar procesgericht denken, Part 2. Zaltbommel: LIFT group (Internal documentation). Chapter 4, pp. 6.
[34]: Karkdijk, S.C.F. (head product development). Interview on 13/02/2008. [35]: Rosman, D. (manager technical service of TCAT). Interview on 15/02/2008. [36]: Scheffer, G.J. (milieu coordinator of TCAT). Interview on 15/02/2008 [37]: BASF (2006). Density/alkalis. http://www.performancechemicals.basf.com/ev-
wcms-in/internet/en_GB/function/conversions:/publish/upload/EV/EV9/ documents/pocket_book/en_density03_02_03.pdf (14 Jan. 2008).
[38]: Rientjes, R.J.M. (2002). B-076.doc (Internal documentation). [39]: Kakaç S. & Liu H. (2002). Heat exchangers: Selection, Rating, and Thermal
Design, 2nd edition, Boca Raton: CRC Press, Chapter 2. [40]: Technology department (2004). V-323.doc till V-324.doc (Internal
documentation). [41]: Lift group (2002). Op weg naar procesgericht denken, Part 2. Zaltbommel: LIFT
group (Internal documentation). Chapter 14, pp. 60 [42]: Technology department (2005). IB-307.doc (Internal documentation). [43]: Technology department (1999). V-701.doc till V-748.doc (Internal
documentation). [44]: General Chemical (2007). Soda ash.
http://www.genchem.com/pdf/SodaAshTech.pdf (14 Jan. 2008). [45]: Rosman, D. (manager technical service of TCAT). Interview on 05/03/2008. [46]: Oelen, G. (2006). indeling snipperadv 2007 2.pdf (Internal documentation). [47]: Machine operators at the discontinuous dyeing section. Interview on 08/01/2008. [48]: Vruggink, H.J. (finishing technologist of TCP). Interview on 21/01/2008. [49]: Technology department (2002). F-260-1.doc till F-271-3.doc (Internal
documentation). [50]: Machine operators at the Sanfor. Interview on 08/01/2008. [51]: Rijn, A.A.L. van (refining technologist of TCTF). Interview on 13/02/2008. [52]: Aal, H. (1991). Ontwerp doseer-installatie PROBAN® CC. Enschede: TCTF. [53]: Rijn, A.A.L. van (refining technologist of TCTF). Measurements on 18/02/2008. [54]: Technology department. Instruktie BG9500 Proban CC.doc (Internal
documentation). [55]: Veen, J. van der (2007). Gasverbruik FR-lijn.xsl (Internal documentation). [56]: MSDS PROBAN® CC of Rhodia [57]: Rosman, D. (manager technical service of TCAT). Interview on 03/05/2008. [58]: VEMW (2008). De Stemming Gas 2008.pdf (Internal report). [59]: Ham, A.G.J. van der, Haan, A.B. de, Versteeg, G.F. & Vrijland, M.S.A. (2004).
Procestechnologie. Enschede: University Twente. Chapter 6, pp. 7 [60]: Drury, C. (2000). Management & Cost Accounting, 5th edition. London:
Thomson. pp. 457-462 [61]: Rosman, D. (2007). schema waterdistributie.xsl (Internal documentation). [62]: Rijn, A.A.L. van (refining technologist of TCTF). Interview on 09/04/2008.
61
[63]: Hummelink, J.H. (2008). CAPEX.doc (Internal documentation). [64]: Senternovem (2006). Infrarood drogen in de Nederlandse textiel- en
tapijtindustrie. http://www.senternovem.nl/mmfiles/2MJAF0636%20Brochure%20infrarood%20drogen_tcm24-197733.pdf (12 Nov. 2007).
[65]: Ham, A.G.J. van der, Haan, A.B. de, Versteeg, G.F. & Vrijland, M.S.A. (2004). Procestechnologie. Enschede: University Twente. Chapter 6, pp. 16-18.
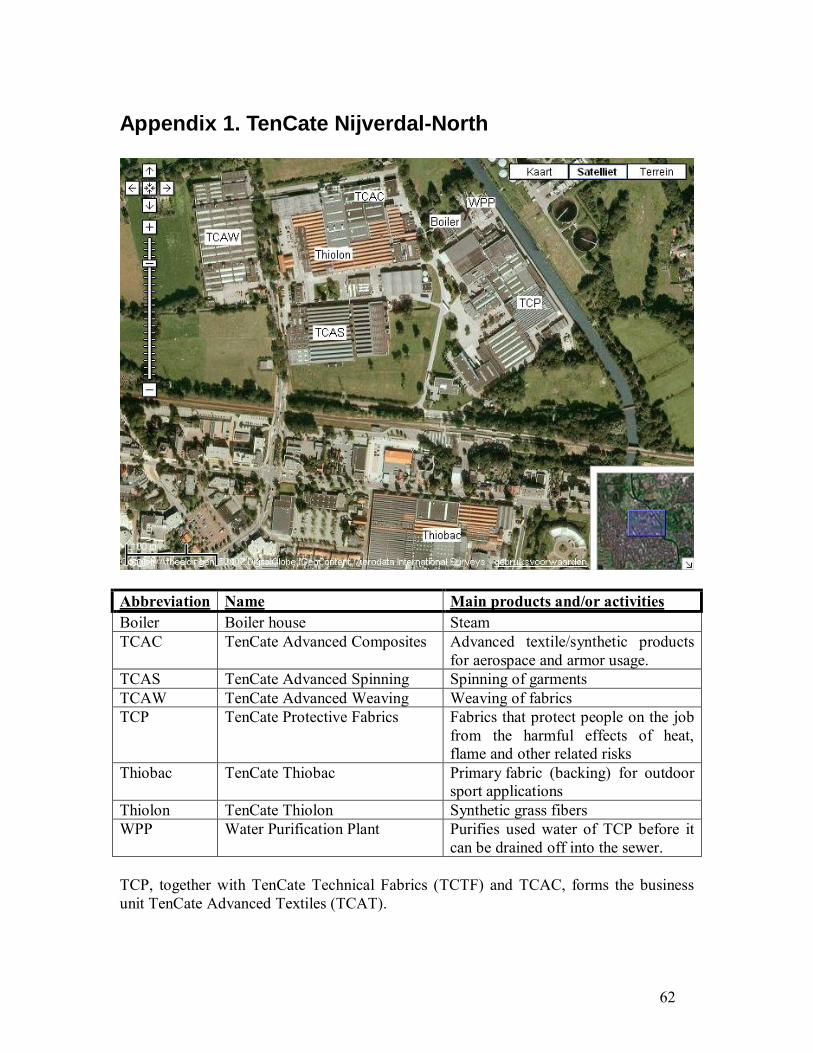
62
Appendix 1. TenCate Nijverdal-North
Abbreviation Name Main products and/or activities Boiler Boiler house Steam TCAC TenCate Advanced Composites Advanced textile/synthetic products
for aerospace and armor usage. TCAS TenCate Advanced Spinning Spinning of garments TCAW TenCate Advanced Weaving Weaving of fabrics TCP TenCate Protective Fabrics Fabrics that protect people on the job
from the harmful effects of heat, flame and other related risks
Thiobac TenCate Thiobac Primary fabric (backing) for outdoor sport applications
Thiolon TenCate Thiolon Synthetic grass fibers WPP Water Purification Plant Purifies used water of TCP before it
can be drained off into the sewer. TCP, together with TenCate Technical Fabrics (TCTF) and TCAC, forms the business unit TenCate Advanced Textiles (TCAT).
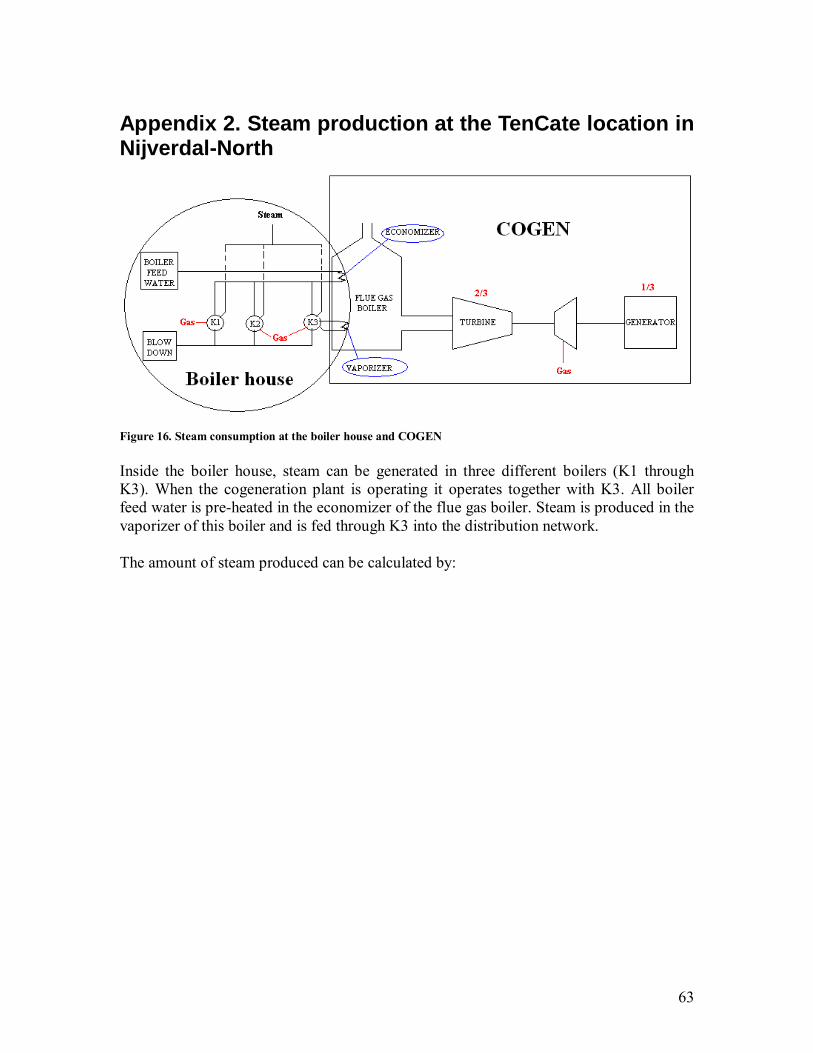
63
Appendix 2. Steam production at the TenCate location in Nijverdal-North
Figure 16. Steam consumption at the boiler house and COGEN Inside the boiler house, steam can be generated in three different boilers (K1 through K3). When the cogeneration plant is operating it operates together with K3. All boiler feed water is pre-heated in the economizer of the flue gas boiler. Steam is produced in the vaporizer of this boiler and is fed through K3 into the distribution network. The amount of steam produced can be calculated by:
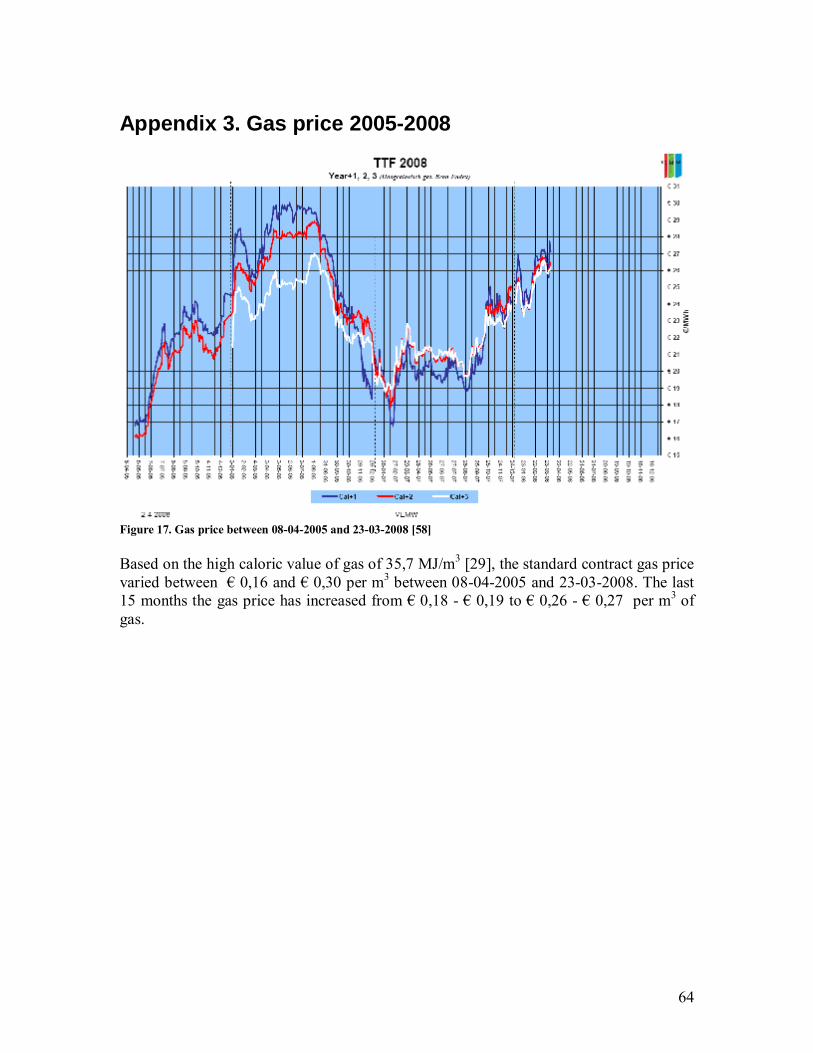
64
Appendix 3. Gas price 2005-2008
Figure 17. Gas price between 08-04-2005 and 23-03-2008 [58] Based on the high caloric value of gas of 35,7 MJ/m3 [29], the standard contract gas price varied between € 0,16 and € 0,30 per m3 between 08-04-2005 and 23-03-2008. The last 15 months the gas price has increased from € 0,18 - € 0,19 to € 0,26 - € 0,27 per m3 of gas.
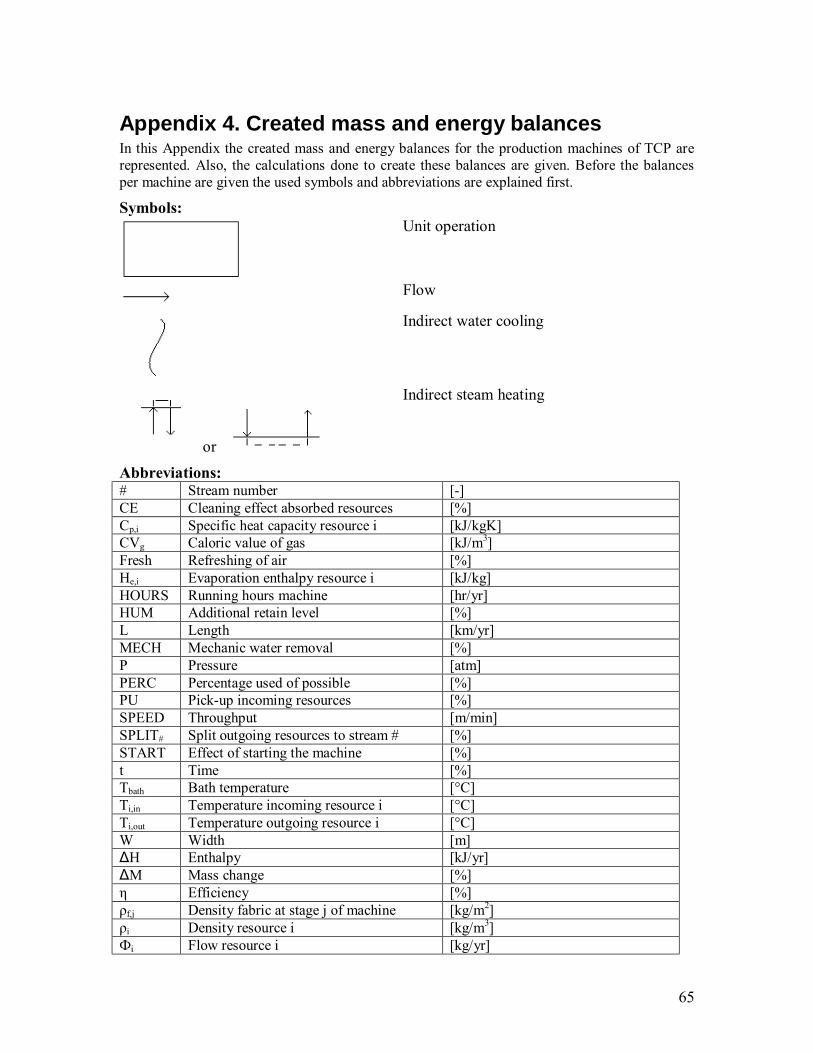
65
Appendix 4. Created mass and energy balances In this Appendix the created mass and energy balances for the production machines of TCP are represented. Also, the calculations done to create these balances are given. Before the balances per machine are given the used symbols and abbreviations are explained first.
Symbols:
Unit operation
Flow
Indirect water cooling
or
Indirect steam heating
Abbreviations: # Stream number [-] CE Cleaning effect absorbed resources [%] Cp,i Specific heat capacity resource i [kJ/kgK] CVg Caloric value of gas [kJ/m3] Fresh Refreshing of air [%] He,i Evaporation enthalpy resource i [kJ/kg] HOURS Running hours machine [hr/yr] HUM Additional retain level [%] L Length [km/yr] MECH Mechanic water removal [%] P Pressure [atm] PERC Percentage used of possible [%] PU Pick-up incoming resources [%] SPEED Throughput [m/min] SPLIT# Split outgoing resources to stream # [%] START Effect of starting the machine [%] t Time [%] Tbath Bath temperature [°C] Ti,in Temperature incoming resource i [°C] Ti,out Temperature outgoing resource i [°C] W Width [m] ΔH Enthalpy [kJ/yr] ΔM Mass change [%] η Efficiency [%] ρf,j Density fabric at stage j of machine [kg/m2] ρi Density resource i [kg/m3] Фi Flow resource i [kg/yr]
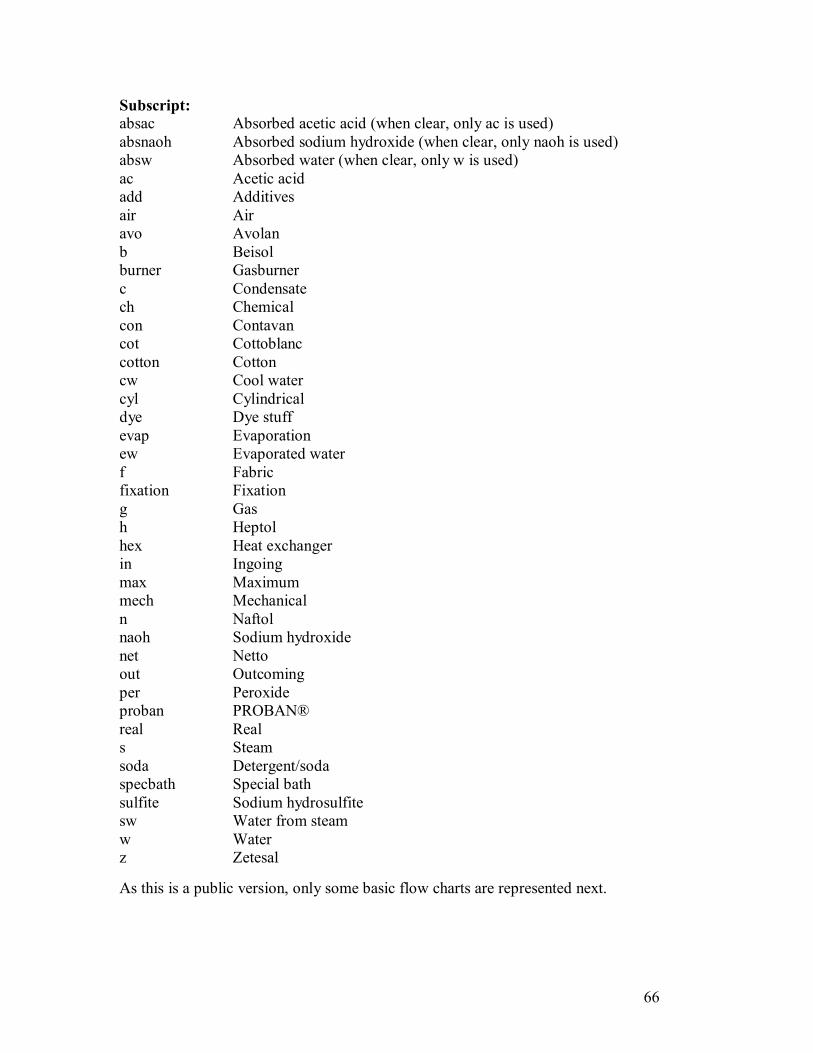
66
Subscript: absac Absorbed acetic acid (when clear, only ac is used) absnaoh Absorbed sodium hydroxide (when clear, only naoh is used) absw Absorbed water (when clear, only w is used) ac Acetic acid add Additives air Air avo Avolan b Beisol burner Gasburner c Condensate ch Chemical con Contavan cot Cottoblanc cotton Cotton cw Cool water cyl Cylindrical dye Dye stuff evap Evaporation ew Evaporated water f Fabric fixation Fixation g Gas h Heptol hex Heat exchanger in Ingoing max Maximum mech Mechanical n Naftol naoh Sodium hydroxide net Netto out Outcoming per Peroxide proban PROBAN® real Real s Steam soda Detergent/soda specbath Special bath sulfite Sodium hydrosulfite sw Water from steam w Water z Zetesal As this is a public version, only some basic flow charts are represented next.
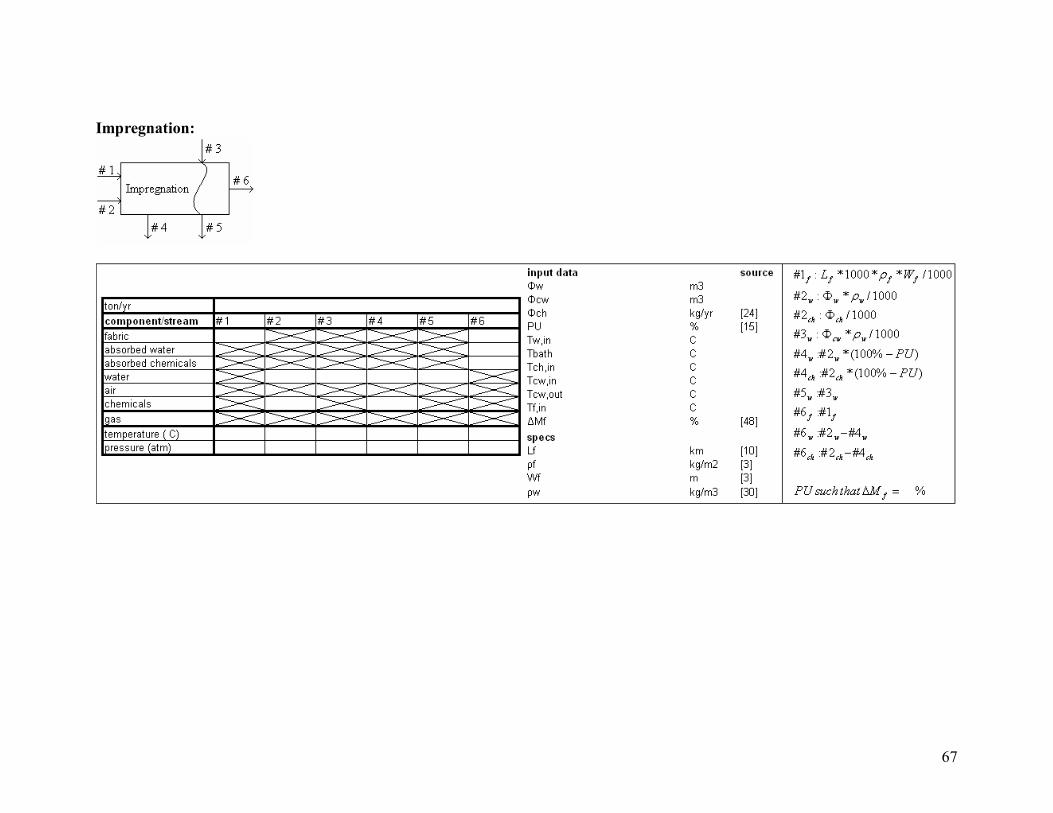
67
Impregnation:
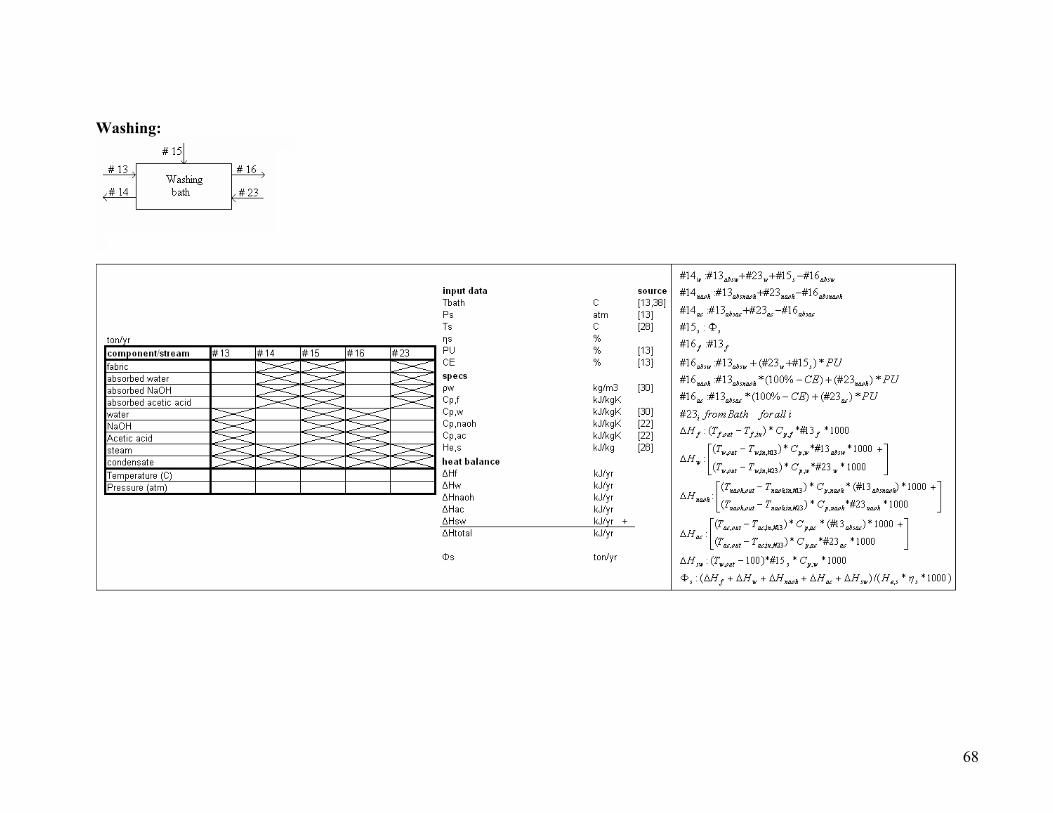
68
Washing:
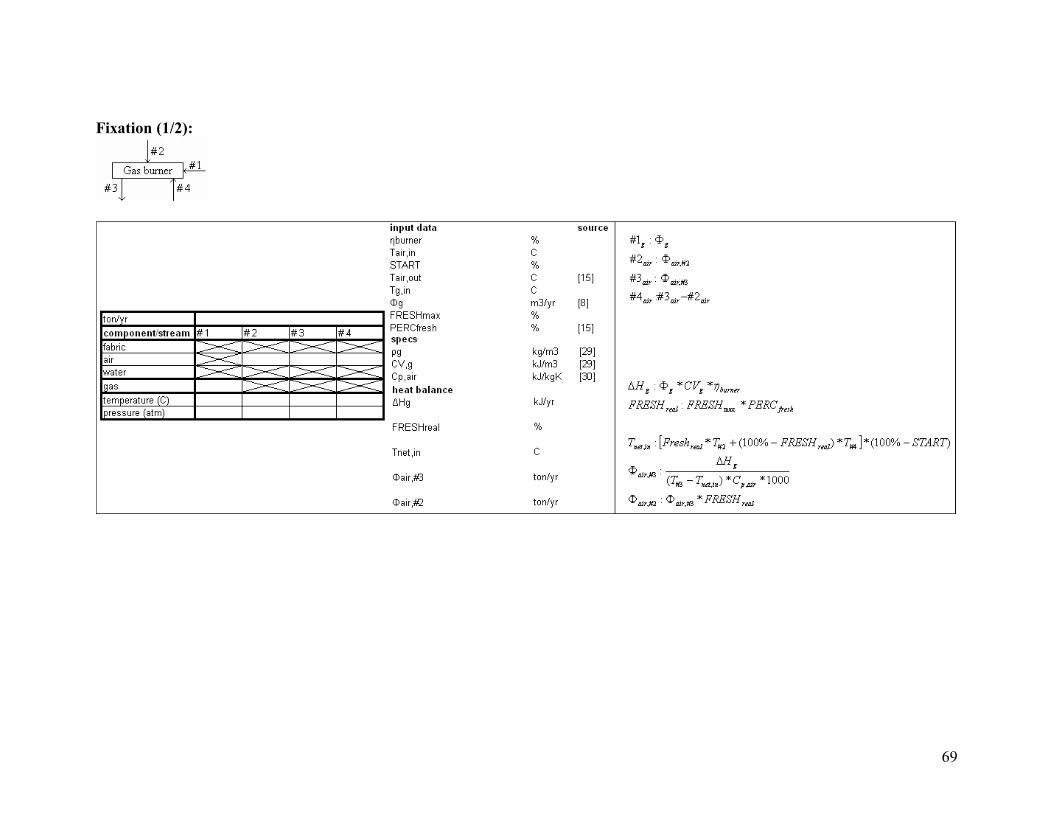
69
Fixation (1/2):

70
Fixation (2/2):
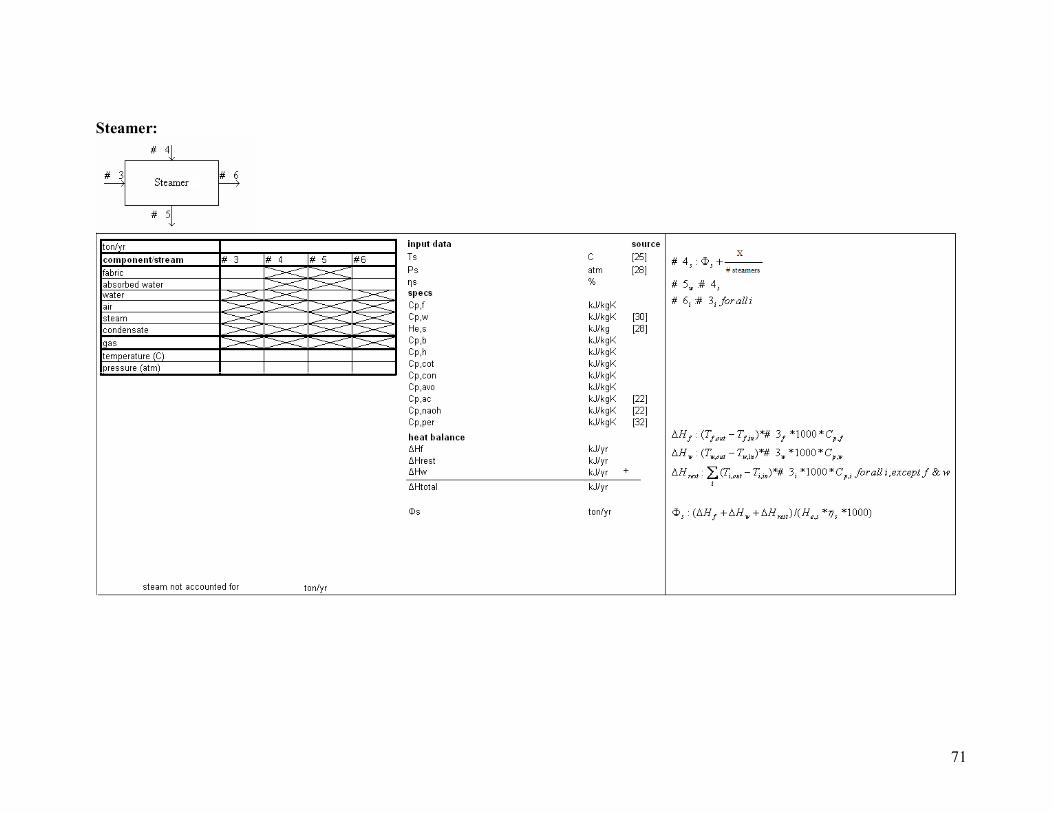
71
Steamer:
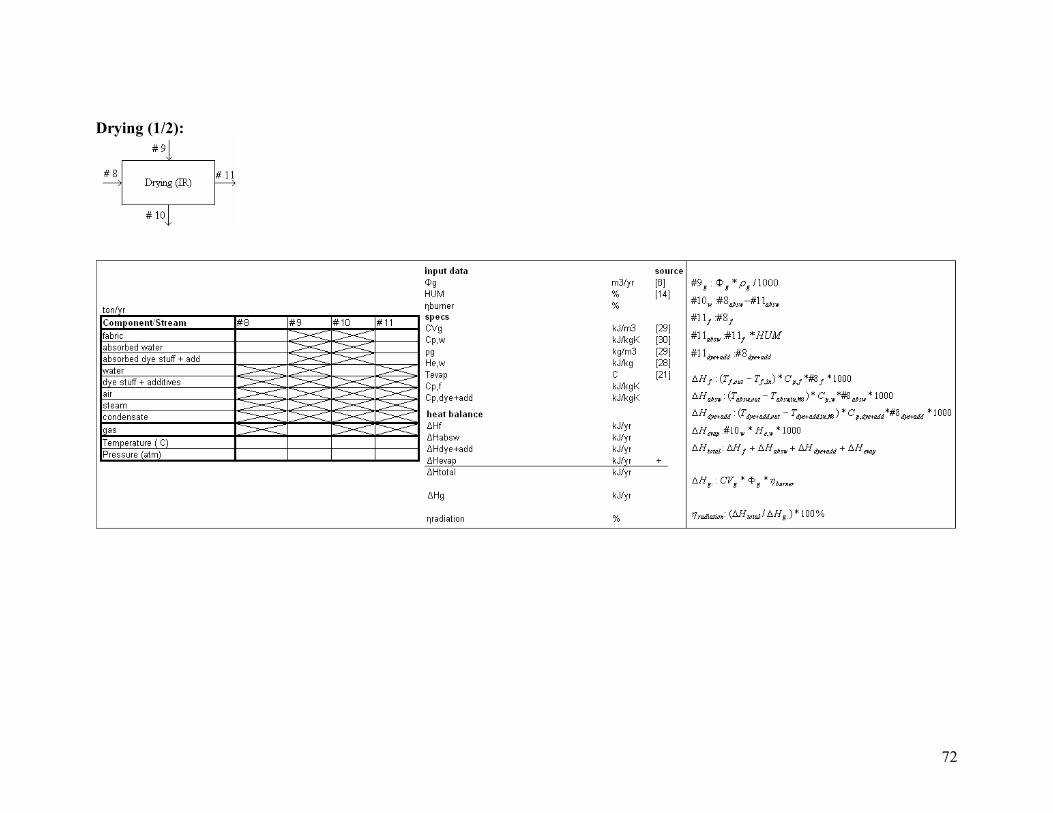
72
Drying (1/2):
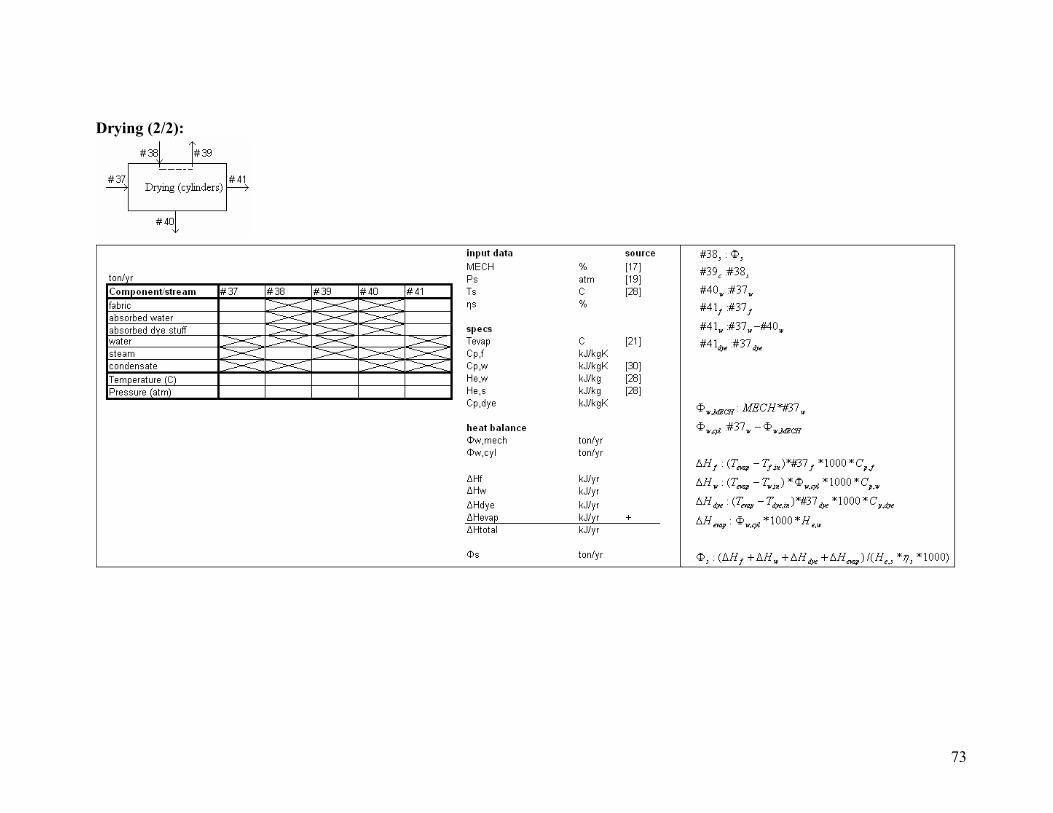
73
Drying (2/2):
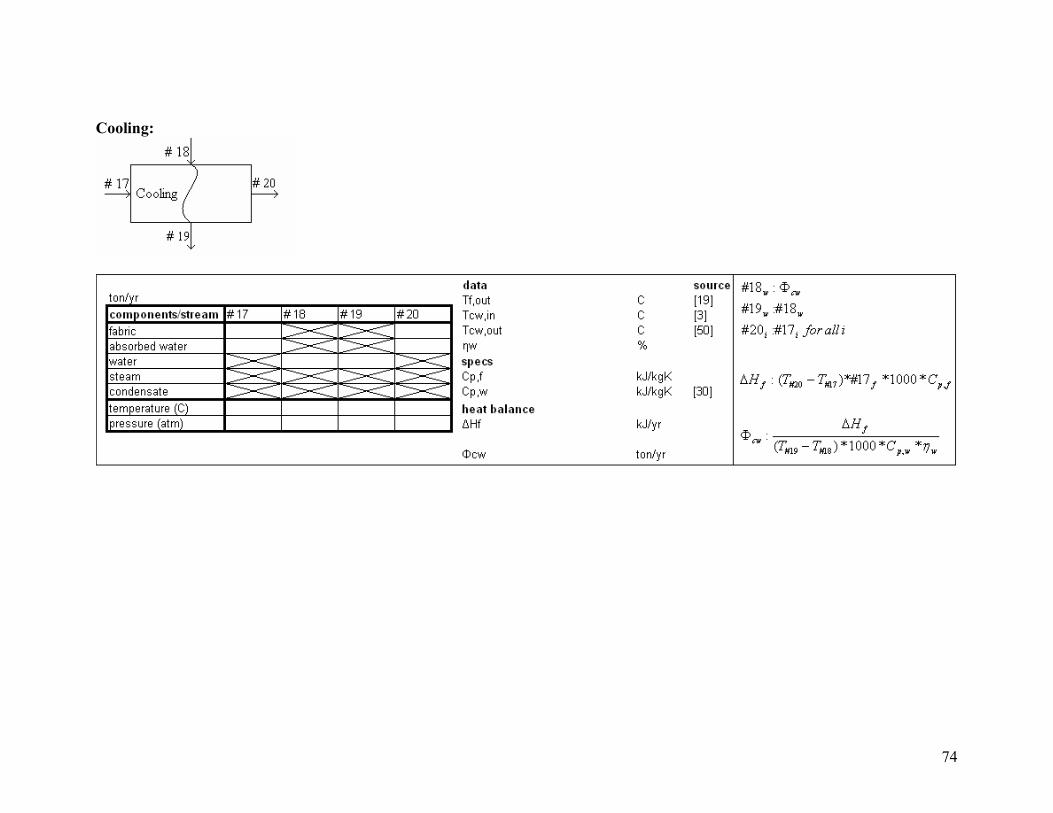
74
Cooling:

75
All other appendices are confidential and therefore excluded from this public version.