Embed Size (px)
Citation preview
Final Report
Appendix
APPENDIX
C
REGIONAL AIRPORTS CASE STUDIES

EX POST EVALUATION OFCOHESION POLICYPROGRAMMES 2000-2006 CO-FINANCED BY THE EUROPEANFUND FOR REGIONALDEVELOPMENT (OBJECTIVES 1AND 2) - WORK PACKAGE 5A:TRANSPORT
Regional Airport Case Study
Bari
November 2009
Prepared for: Prepared by:
European CommissionDirectorate General for Regional PolicyEvaluation unit
Steer Davies Gleave28-32 Upper GroundLondonSE1 9PD
+44 (0)20 7919 8500www.steerdaviesgleave.com
Bari Airport
2
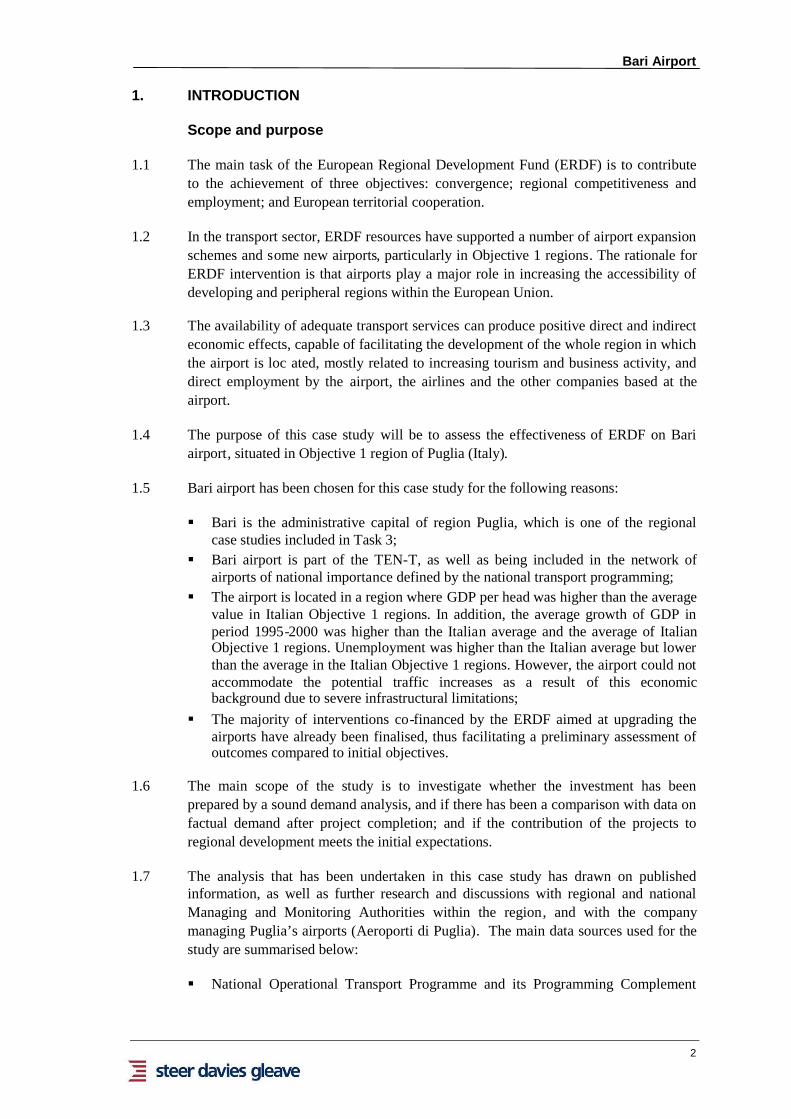
1. INTRODUCTION
Scope and purpose
1.1 The main task of the European Regional Development Fund (ERDF) is to contributeto the achievement of three objectives: convergence; regional competitiveness andemployment; and European territorial cooperation.
1.2 In the transport sector, ERDF resources have supported a number of airport expansionschemes and some new airports, particularly in Objective 1 regions. The rationale forERDF intervention is that airports play a major role in increasing the accessibility ofdeveloping and peripheral regions within the European Union.
1.3 The availability of adequate transport services can produce positive direct and indirecteconomic effects, capable of facilitating the development of the whole region in whichthe airport is loc ated, mostly related to increasing tourism and business activity, anddirect employment by the airport, the airlines and the other companies based at theairport.
1.4 The purpose of this case study will be to assess the effectiveness of ERDF on Bariairport, situated in Objective 1 region of Puglia (Italy).
1.5 Bari airport has been chosen for this case study for the following reasons:
Bari is the administrative capital of region Puglia, which is one of the regionalcase studies included in Task 3;
Bari airport is part of the TEN-T, as well as being included in the network ofairports of national importance defined by the national transport programming;
The airport is located in a region where GDP per head was higher than the averagevalue in Italian Objective 1 regions. In addition, the average growth of GDP inperiod 1995-2000 was higher than the Italian average and the average of ItalianObjective 1 regions. Unemployment was higher than the Italian average but lowerthan the average in the Italian Objective 1 regions. However, the airport could notaccommodate the potential traffic increases as a result of this economicbackground due to severe infrastructural limitations;
The majority of interventions co-financed by the ERDF aimed at upgrading theairports have already been finalised, thus facilitating a preliminary assessment ofoutcomes compared to initial objectives.
1.6 The main scope of the study is to investigate whether the investment has beenprepared by a sound demand analysis, and if there has been a comparison with data onfactual demand after project completion; and if the contribution of the projects toregional development meets the initial expectations.
1.7 The analysis that has been undertaken in this case study has drawn on publishedinformation, as well as further research and discussions with regional and nationalManaging and Monitoring Authorities within the region, and with the companymanaging Puglia’s airports (Aeroporti di Puglia). The main data sources used for thestudy are summarised below:
National Operational Transport Programme and its Programming Complement
Bari Airport
3
(NOP-T); The Annual Reports on Implementation of the NOP-T, issued annually by the
Managing Authority of the this operational programme; Additional information provided by the Managing Authority of the NOP-T; Regional Operational Programme of Puglia and its Programming Complement
(ROP); Master Plan of Bari airport before and after the upgrading, provided by Aeroporti
di Puglia (2002 and 2007 respectively); Other documents, e.g. Accordo di Programma Quadro and Protocollo d’Intesa,
made available by Aeroporti di Puglia.
1.8 This was supplemented by 3 interviews aimed at getting further information and alsobetter understanding the issues faced by the airport. These interviews were with themanaging authorities of the NOP-T and of the ROP-Puglia, as well as the companymanaging Puglia’s airports. During these interviews, we obtained quantitative andqualitative information, which allowed us to investigate the rational for ERDFintervention on Bari airport.
1.9 Chapter 2 focuses on the background of the airport system in Puglia, and particularlyof Bari airport, at the start of the 2000-2006 programming period, the upgrading ofBari airport and the role of the ERDF. Chapter 3 concludes by presenting the resultsobtained in respect to the two evaluation questions mentioned above.
Bari Airport
4
2. THE UPGRADING OF BARI AIRPORT
Background
Economic and demographic overview of Puglia and its provinces
2.1 Puglia is one of the 21 NUTS 2 territories of Italy; according to the Italianadministrative division, Puglia is a Region composed (as per 2000) by five Provinces,named after their respective capital city: Bari (administrative capital of the Region),Brindisi, Foggia, Lecce and Taranto1.The Puglia region has a surface of 19,372 km2and a population, in 2000, of just over 4 million.
The airport system in the region
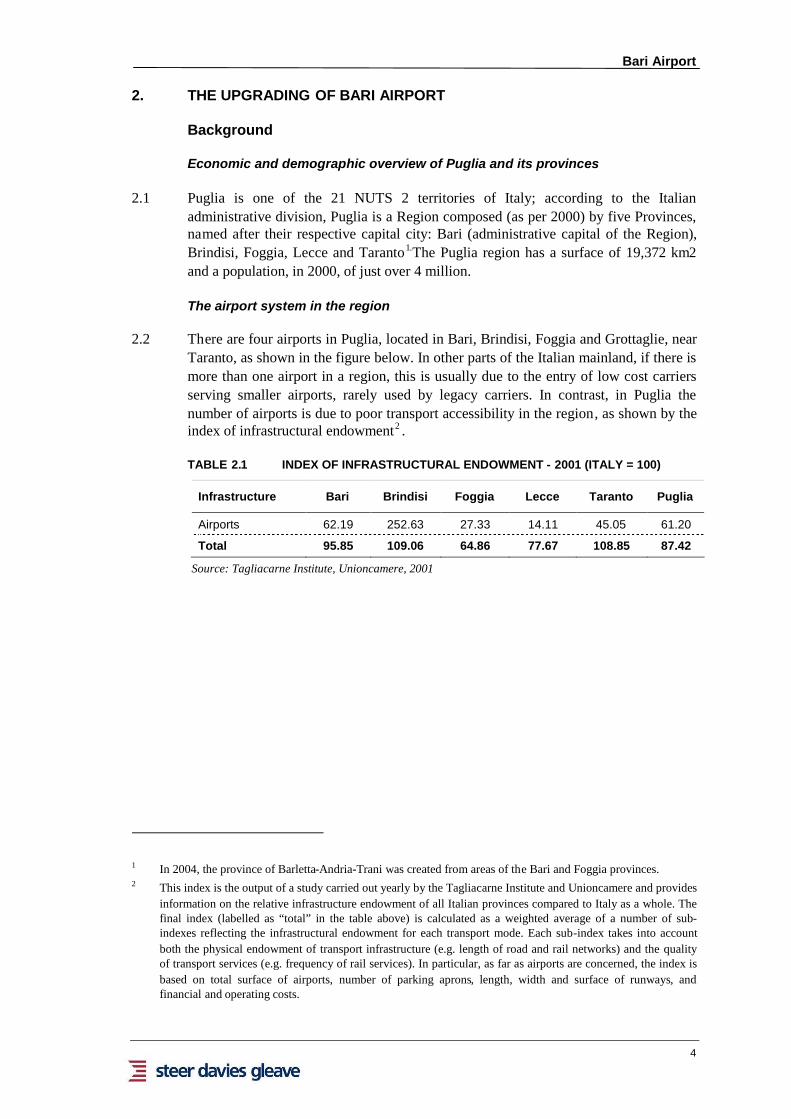
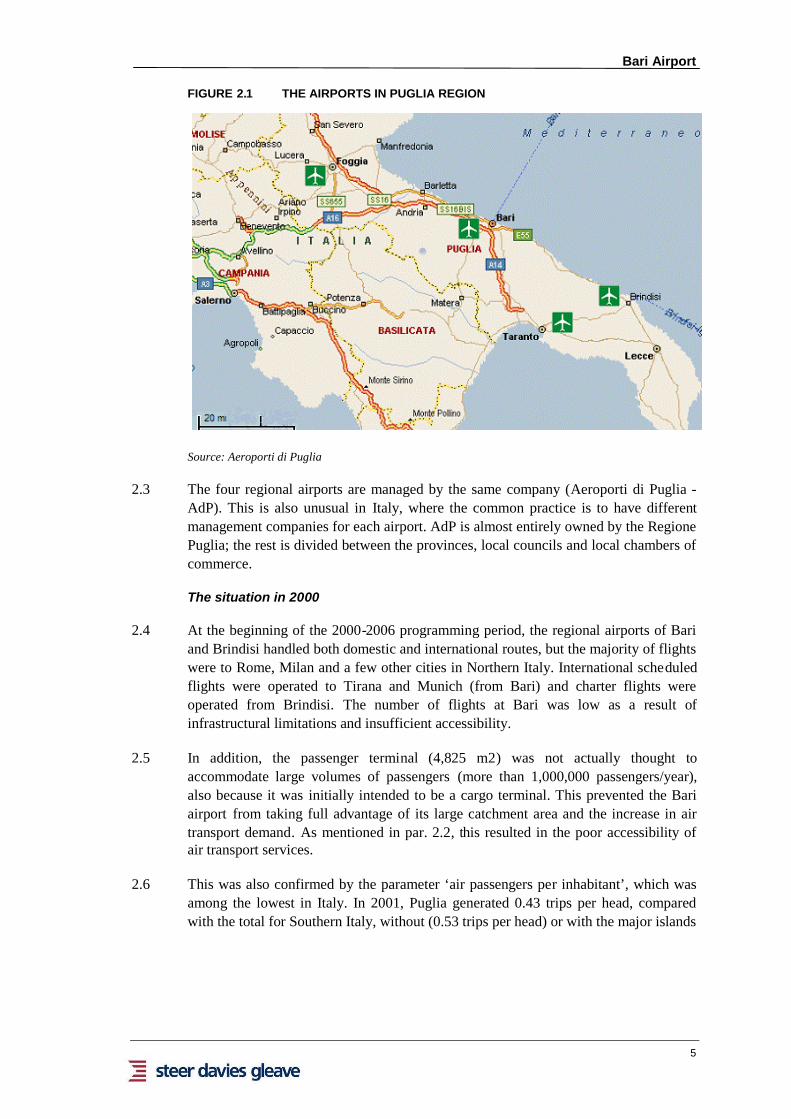
2.2 There are four airports in Puglia, located in Bari, Brindisi, Foggia and Grottaglie, nearTaranto, as shown in the figure below. In other parts of the Italian mainland, if there ismore than one airport in a region, this is usually due to the entry of low cost carriersserving smaller airports, rarely used by legacy carriers. In contrast, in Puglia thenumber of airports is due to poor transport accessibility in the region, as shown by theindex of infrastructural endowment2 .
TABLE 2.1 INDEX OF INFRASTRUCTURAL ENDOWMENT - 2001 (ITALY = 100)
Infrastructure Bari Brindisi Foggia Lecce Taranto Puglia
Airports 62.19 252.63 27.33 14.11 45.05 61.20
Total 95.85 109.06 64.86 77.67 108.85 87.42
Source: Tagliacarne Institute, Unioncamere, 2001
1 In 2004, the province of Barletta-Andria-Trani was created from areas of the Bari and Foggia provinces.2 This index is the output of a study carried out yearly by the Tagliacarne Institute and Unioncamere and provides
information on the relative infrastructure endowment of all Italian provinces compared to Italy as a whole. Thefinal index (labelled as “total” in the table above) is calculated as a weighted average of a number of sub-indexes reflecting the infrastructural endowment for each transport mode. Each sub-index takes into accountboth the physical endowment of transport infrastructure (e.g. length of road and rail networks) and the qualityof transport services (e.g. frequency of rail services). In particular, as far as airports are concerned, the index isbased on total surface of airports, number of parking aprons, length, width and surface of runways, andfinancial and operating costs.
Bari Airport
5
FIGURE 2.1 THE AIRPORTS IN PUGLIA REGION
Source: Aeroporti di Puglia
2.3 The four regional airports are managed by the same company (Aeroporti di Puglia -AdP). This is also unusual in Italy, where the common practice is to have differentmanagement companies for each airport. AdP is almost entirely owned by the RegionePuglia; the rest is divided between the provinces, local councils and local chambers ofcommerce.
The situation in 2000
2.4 At the beginning of the 2000-2006 programming period, the regional airports of Bariand Brindisi handled both domestic and international routes, but the majority of flightswere to Rome, Milan and a few other cities in Northern Italy. International scheduledflights were operated to Tirana and Munich (from Bari) and charter flights wereoperated from Brindisi. The number of flights at Bari was low as a result ofinfrastructural limitations and insufficient accessibility.
2.5 In addition, the passenger terminal (4,825 m2) was not actually thought toaccommodate large volumes of passengers (more than 1,000,000 passengers/year),also because it was initially intended to be a cargo terminal. This prevented the Bariairport from taking full advantage of its large catchment area and the increase in airtransport demand. As mentioned in par. 2.2, this resulted in the poor accessibility ofair transport services.
2.6 This was also confirmed by the parameter ‘air passengers per inhabitant’, which wasamong the lowest in Italy. In 2001, Puglia generated 0.43 trips per head, comparedwith the total for Southern Italy, without (0.53 trips per head) or with the major islands

Bari Airport
6
(0.89)3 .Furthermore, Bari had just over 1.2 million passengers and 4,700 tonnestransiting through its airport in 2000, ranking it 14th and 16th respectively amongItalian airports.
Bari airport prior to ERDF co-financed improvements
Bari airport: history and characteristics
2.7 The international airport of Bari Karol Woytila is located approximately 8 km north-west from the city centre. The figure below shows the position of the airport in respectto the city.
FIGURE 2.2 BARI AIRPORT
2.8 Bari airport was originally a military airport, converted to civil aviation in the 1960sand handled mainly Alitalia’s domestic flights that connected Bari with Rome,Catania, Palermo, Ancona and Venice. In 1979, a new runway was built toaccommodate new aircraft and was lengthened further in 1990; the configurationremained the same until the interventions financed by ERDF.
2.9 The old military terminal was used as a passenger terminal until 1981, when a newstructure was built, initially intended to be a cargo terminal, but used as a passengerterminal. This structure, partially upgraded in 1990 and refurbished in 2000, was useduntil 2005, when the new passenger terminal, co-financed by ERDF, was opened tothe public.
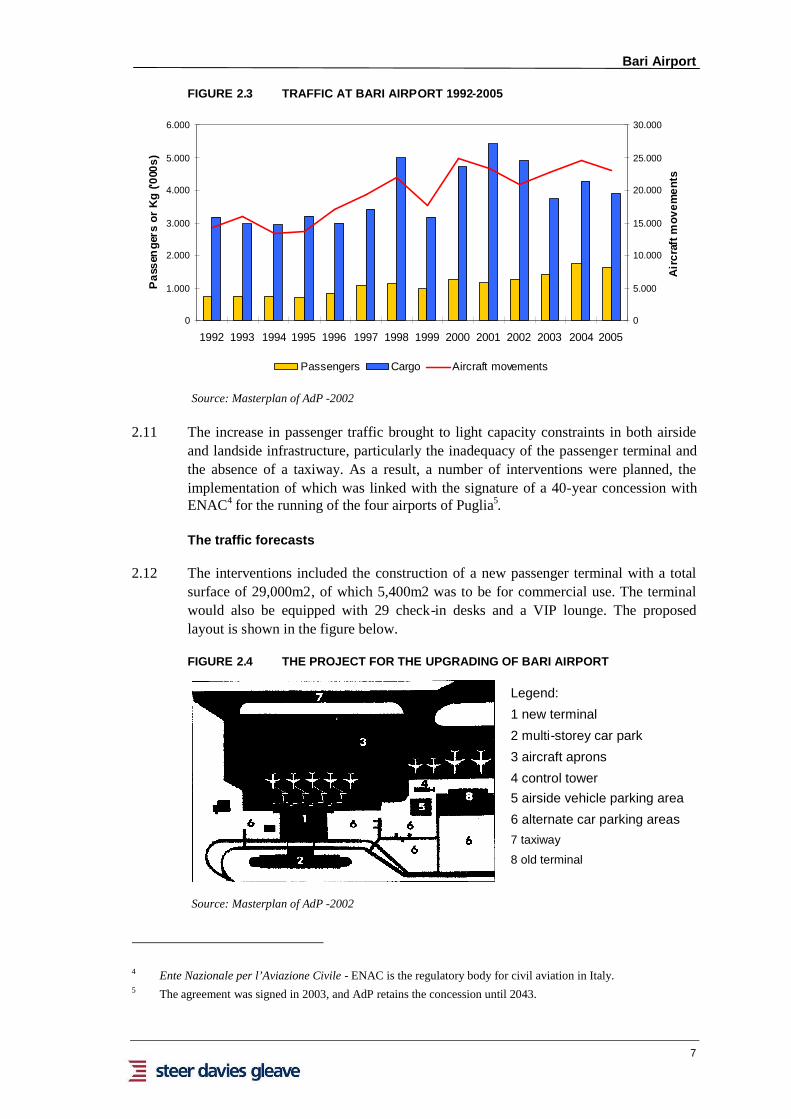
2.10 Figure 2.3 below shows the evolution of passenger and freight traffic, as well as airtransport movements, from 1992 to 2005. Passenger traffic increased each year, exceptin 1999 and 2001, due respectively to the war in Kosovo (which led to the closure ofthe airport for a number of weeks) and to the industry wide effects of September 11th.Bari airport did not have a freight terminal; the handling of cargo was carried out inother areas within the airport rented by AdP to mail and logistics operators.
3 Source: Masterplan for the development of airport system of Puglia. SEAP, 2002.
Bari Airport
7
FIGURE 2.3 TRAFFIC AT BARI AIRPORT 1992-2005
0
1.000
2.000
3.000
4.000
5.000
6.000
1992 1993 1994 1995 1996 1997 1998 1999 2000 2001 2002 2003 2004 2005
Pas
sen
gers
orK
g('0
00s)
0
5.000
10.000
15.000
20.000
25.000
30.000
Air
craf
tmov
emen
ts
Passengers Cargo Aircraft movements
Source: Masterplan of AdP -2002
2.11 The increase in passenger traffic brought to light capacity constraints in both airsideand landside infrastructure, particularly the inadequacy of the passenger terminal andthe absence of a taxiway. As a result, a number of interventions were planned, theimplementation of which was linked with the signature of a 40-year concession withENAC4 for the running of the four airports of Puglia5.
The traffic forecasts
2.12 The interventions included the construction of a new passenger terminal with a totalsurface of 29,000m2, of which 5,400m2 was to be for commercial use. The terminalwould also be equipped with 29 check-in desks and a VIP lounge. The proposedlayout is shown in the figure below.
FIGURE 2.4 THE PROJECT FOR THE UPGRADING OF BARI AIRPORT
Legend:
1 new terminal
2 multi-storey car park
3 aircraft aprons
4 control tower5 airside vehicle parking area
6 alternate car parking areas7 taxiway
8 old terminal
Source: Masterplan of AdP -2002
4 Ente Nazionale per l’Aviazione Civile - ENAC is the regulatory body for civil aviation in Italy.5 The agreement was signed in 2003, and AdP retains the concession until 2043.
Bari Airport
8
2.13 In addition, the number of aircraft stands would be doubled from 9 to 18, and aparallel taxiway would be built, thus removing one of the most severe capacityconstraints. Following these investments, the airport capacity was planned to increaseto over 2 million passengers a year.
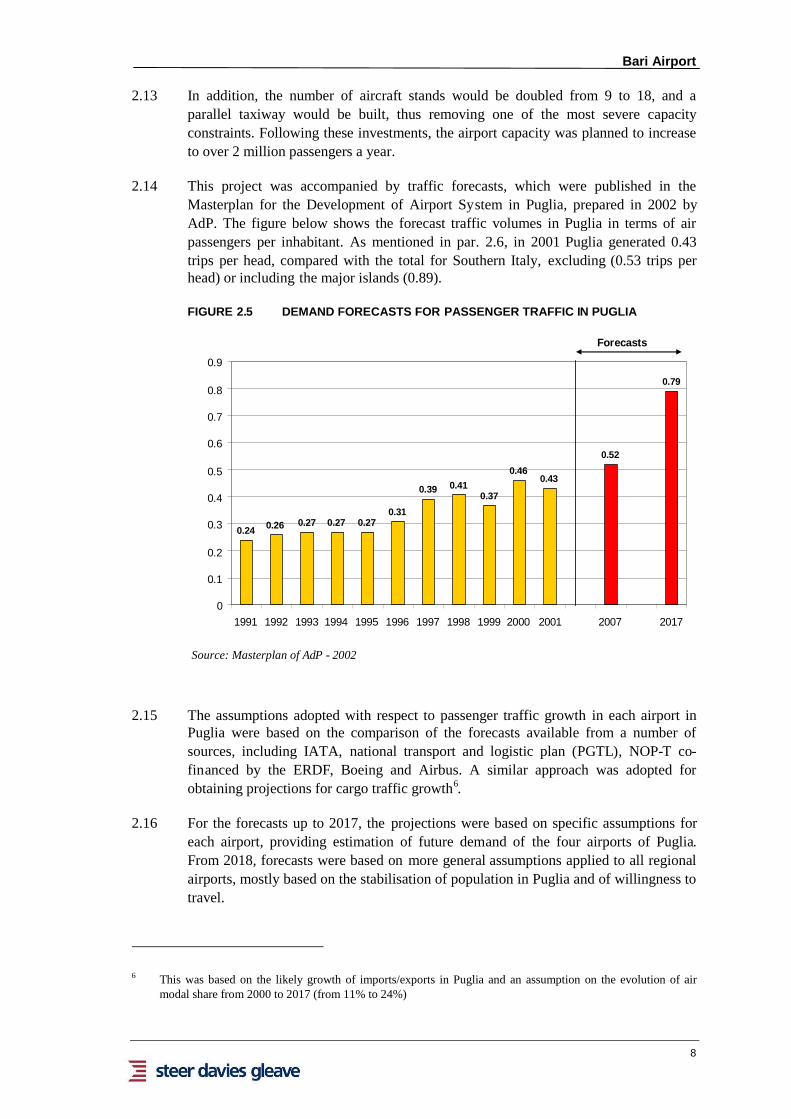
2.14 This project was accompanied by traffic forecasts, which were published in theMasterplan for the Development of Airport System in Puglia, prepared in 2002 byAdP. The figure below shows the forecast traffic volumes in Puglia in terms of airpassengers per inhabitant. As mentioned in par. 2.6, in 2001 Puglia generated 0.43trips per head, compared with the total for Southern Italy, excluding (0.53 trips perhead) or including the major islands (0.89).
FIGURE 2.5 DEMAND FORECASTS FOR PASSENGER TRAFFIC IN PUGLIA
0.24 0.26 0.27 0.27 0.270.31
0.39 0.410.37
0.460.43
0.52
0.79
0
0.1
0.2
0.3
0.4
0.5
0.6
0.7
0.8
0.9
1991 1992 1993 1994 1995 1996 1997 1998 1999 2000 2001 2007 2017
Forecasts
Source: Masterplan of AdP - 2002
2.15 The assumptions adopted with respect to passenger traffic growth in each airport inPuglia were based on the comparison of the forecasts available from a number ofsources, including IATA, national transport and logistic plan (PGTL), NOP-T co-financed by the ERDF, Boeing and Airbus. A similar approach was adopted forobtaining projections for cargo traffic growth6.
2.16 For the forecasts up to 2017, the projections were based on specific assumptions foreach airport, providing estimation of future demand of the four airports of Puglia.From 2018, forecasts were based on more general assumptions applied to all regionalairports, mostly based on the stabilisation of population in Puglia and of willingness totravel.
6 This was based on the likely growth of imports/exports in Puglia and an assumption on the evolution of airmodal share from 2000 to 2017 (from 11% to 24%)
Bari Airport
9
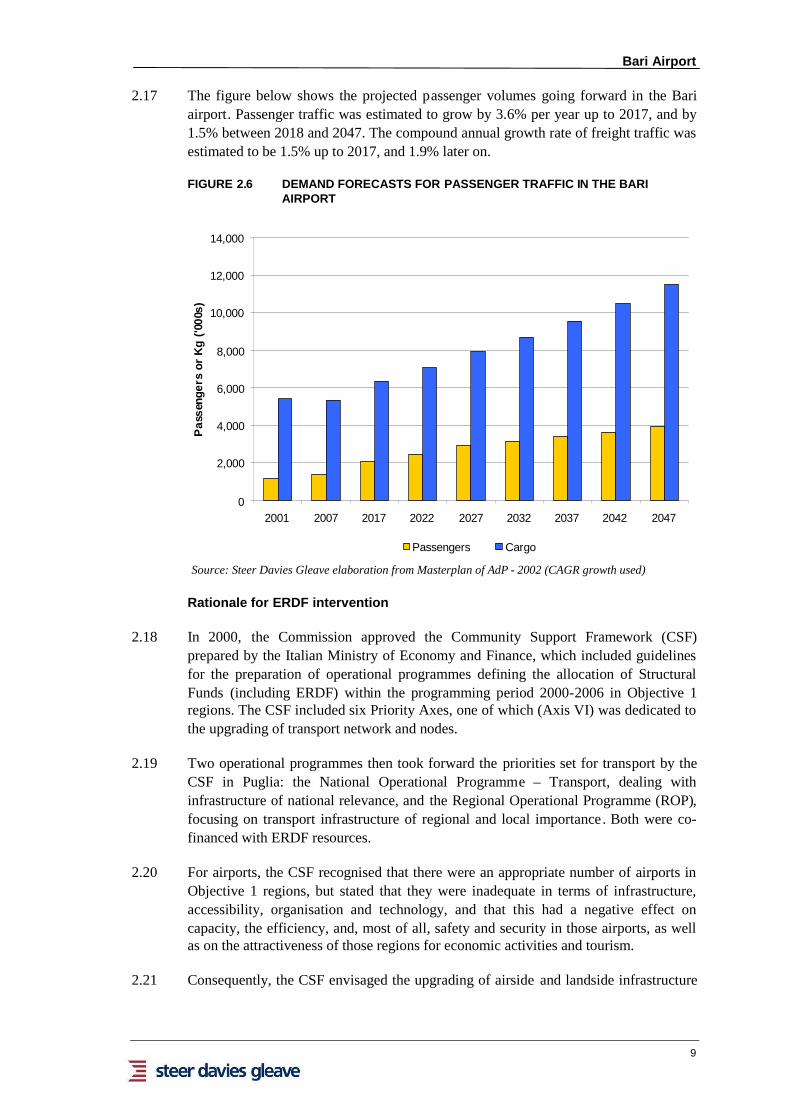
2.17 The figure below shows the projected passenger volumes going forward in the Bariairport. Passenger traffic was estimated to grow by 3.6% per year up to 2017, and by1.5% between 2018 and 2047. The compound annual growth rate of freight traffic wasestimated to be 1.5% up to 2017, and 1.9% later on.
FIGURE 2.6 DEMAND FORECASTS FOR PASSENGER TRAFFIC IN THE BARIAIRPORT
0
2,000
4,000
6,000
8,000
10,000
12,000
14,000
2001 2007 2017 2022 2027 2032 2037 2042 2047
Pas
seng
ers
orK
g('0
00s)
Passengers Cargo
Source: Steer Davies Gleave elaboration from Masterplan of AdP - 2002 (CAGR growth used)
Rationale for ERDF intervention
2.18 In 2000, the Commission approved the Community Support Framework (CSF)prepared by the Italian Ministry of Economy and Finance, which included guidelinesfor the preparation of operational programmes defining the allocation of StructuralFunds (including ERDF) within the programming period 2000-2006 in Objective 1regions. The CSF included six Priority Axes, one of which (Axis VI) was dedicated tothe upgrading of transport network and nodes.
2.19 Two operational programmes then took forward the priorities set for transport by theCSF in Puglia: the National Operational Programme – Transport, dealing withinfrastructure of national relevance, and the Regional Operational Programme (ROP),focusing on transport infrastructure of regional and local importance. Both were co-financed with ERDF resources.
2.20 For airports, the CSF recognised that there were an appropriate number of airports inObjective 1 regions, but stated that they were inadequate in terms of infrastructure,accessibility, organisation and technology, and that this had a negative effect oncapacity, the efficiency, and, most of all, safety and security in those airports, as wellas on the attractiveness of those regions for economic activities and tourism.
2.21 Consequently, the CSF envisaged the upgrading of airside and landside infrastructure
Bari Airport
10
in airports in Objective 1 regions, the improvement of their connection to the road andrail network, the integration of regional hubs with the main national and internationaltraffic routes and the adoption of advanced traffic, safety and security managementsystems.
2.22 Following the guidelines included in the CSF for Axis VI, the NOP-T focused on thedevelopment of the airports included in the SNIT7 , a national planning documentidentifying the transport infrastructure of national and international importance, whichare the responsibility of the Italian State. The infrastructure not included in the SNITis the competence of Regions8.
2.23 In Puglia, the network of SNIT airports includes Bari and Brindisi. Plans to developFoggia and Taranto, the first as a passenger airport for religious tourism9 and the latteras a cargo airport, were hindered by short runways, suboptimal accessibility and acatchment area largely overlapping with Bari and Brindisi.
2.24 The inclusion of Brindisi and Bari airports within the SNIT meant that, in principle,the strategy for ERDF intervention in these airports had to be set exclusively atnational level by the NOP-T. Nevertheless, the first version of the ROP included €59million of funding focused on the development of regional airports, which amountedto 26% of total ROP funding, and included €29 million of ERDF funding. The mid-term review of the programming documents, undertaken in 2004-5, appropriatelypointed out that the resources targeted at airports through the ROP overlapped withthose assigned through the NOP. Consequently, airport investment was removed fromthe ROP in the last version of the programme.
2.25 The strategy proposed by the NOP-T for the development of SNIT airports inObjective 1 regions was based on two pillars:
The promotion of regional airport systems, including airports in the samecatchment area, valorising of each airports’ specificities and vocations (passengertraffic, cargo, charter etc);
The setting up of new routes to the other national airports and particularly the hubof Rome Fiumicino.
2.26 The NOP-T was divided into three Priority Axes:
Axis I: Development of the main connections of the transport network; Axis II: Upgrading of the connections between local areas and main links; Axis III: Development of nodes
2.27 All three axes touched the development of airports in the SNIT network, and in
7 Sistema Nazionale Integrato dei Trasporti, Integrated National Transport System.8 The SNIT was introduced in 2001 by the Masterplan of Transport and Logistics, Piano Generale dei Trasporti
e della Logistica (henceforth PGTL), which included the main elements of the national transport planningstrategy
9 Near Foggia, in the Gargano peninsula, there are a lot of sanctuaries and famous churches which attractthousands of visitors every year.
Bari Airport
11
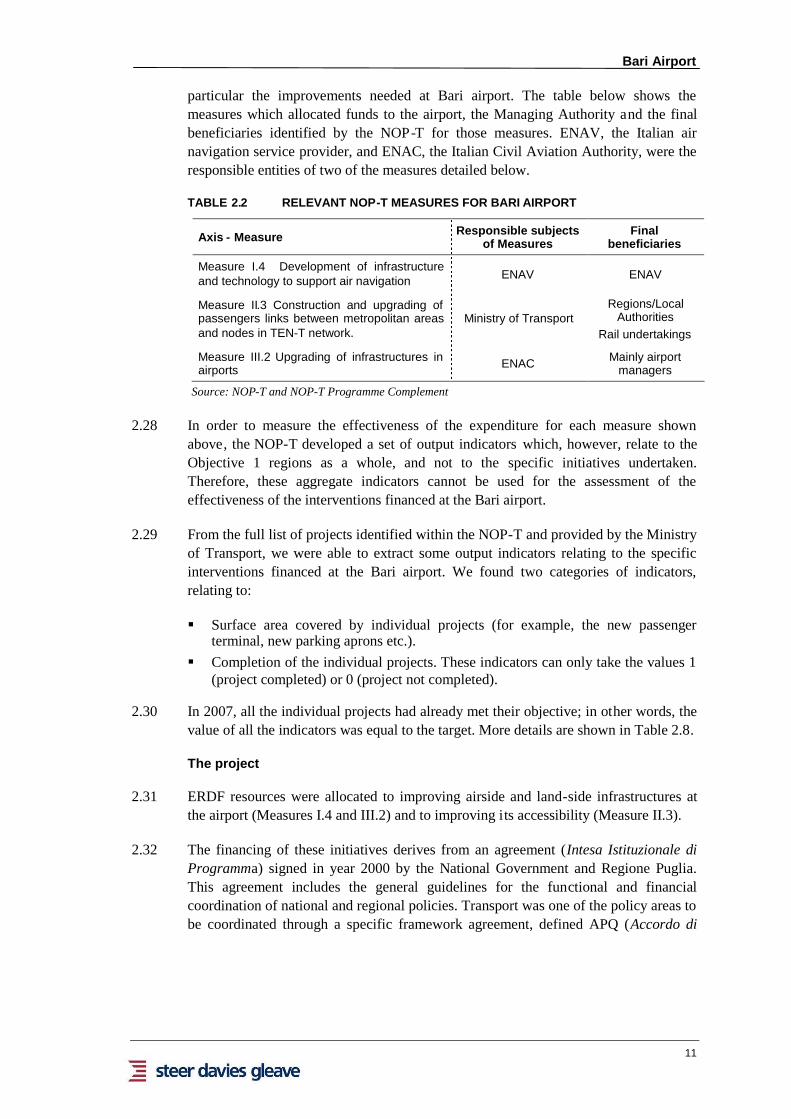
particular the improvements needed at Bari airport. The table below shows themeasures which allocated funds to the airport, the Managing Authority and the finalbeneficiaries identified by the NOP-T for those measures. ENAV, the Italian airnavigation service provider, and ENAC, the Italian Civil Aviation Authority, were theresponsible entities of two of the measures detailed below.
TABLE 2.2 RELEVANT NOP-T MEASURES FOR BARI AIRPORT
Axis - Measure Responsible subjectsof Measures
Finalbeneficiaries
Measure I.4 Development of infrastructureand technology to support air navigation ENAV ENAV
Measure II.3 Construction and upgrading ofpassengers links between metropolitan areasand nodes in TEN-T network.
Ministry of TransportRegions/Local
AuthoritiesRail undertakings
Measure III.2 Upgrading of infrastructures inairports ENAC Mainly airport
managers
Source: NOP-T and NOP-T Programme Complement
2.28 In order to measure the effectiveness of the expenditure for each measure shownabove, the NOP-T developed a set of output indicators which, however, relate to theObjective 1 regions as a whole, and not to the specific initiatives undertaken.Therefore, these aggregate indicators cannot be used for the assessment of theeffectiveness of the interventions financed at the Bari airport.
2.29 From the full list of projects identified within the NOP-T and provided by the Ministryof Transport, we were able to extract some output indicators relating to the specificinterventions financed at the Bari airport. We found two categories of indicators,relating to:
Surface area covered by individual projects (for example, the new passengerterminal, new parking aprons etc.).
Completion of the individual projects. These indicators can only take the values 1(project completed) or 0 (project not completed).
2.30 In 2007, all the individual projects had already met their objective; in other words, thevalue of all the indicators was equal to the target. More details are shown in Table 2.8.
The project
2.31 ERDF resources were allocated to improving airside and land-side infrastructures atthe airport (Measures I.4 and III.2) and to improving its accessibility (Measure II.3).
2.32 The financing of these initiatives derives from an agreement (Intesa Istituzionale diProgramma) signed in year 2000 by the National Government and Regione Puglia.This agreement includes the general guidelines for the functional and financialcoordination of national and regional policies. Transport was one of the policy areas tobe coordinated through a specific framework agreement, defined APQ (Accordo di
Bari Airport
12
Programma Quadro) 10.
2.33 In March 2003, the Ministry of Economy and Finance, the Ministry of Infrastructureand Transport, the Regione Puglia, ENAC, ENAV and ANAS signed the APQ“Transport: Airports and Mobility”. This APQ included a programme of investmentsin regional airports and the road network aimed at improving the overall levels ofaccessibility of the region, to be financed through private funds, national funds and theNOP-T. The list of projects was extended in 2004 and subsequently amended on anumber of occasions.
2.34 The projects in regional airports identified in the APQ and the related financialresources were allocated either to ENAC or ENAV according to the relevant measureincluded in the NOP-T.
The initiatives carried out by ENAV
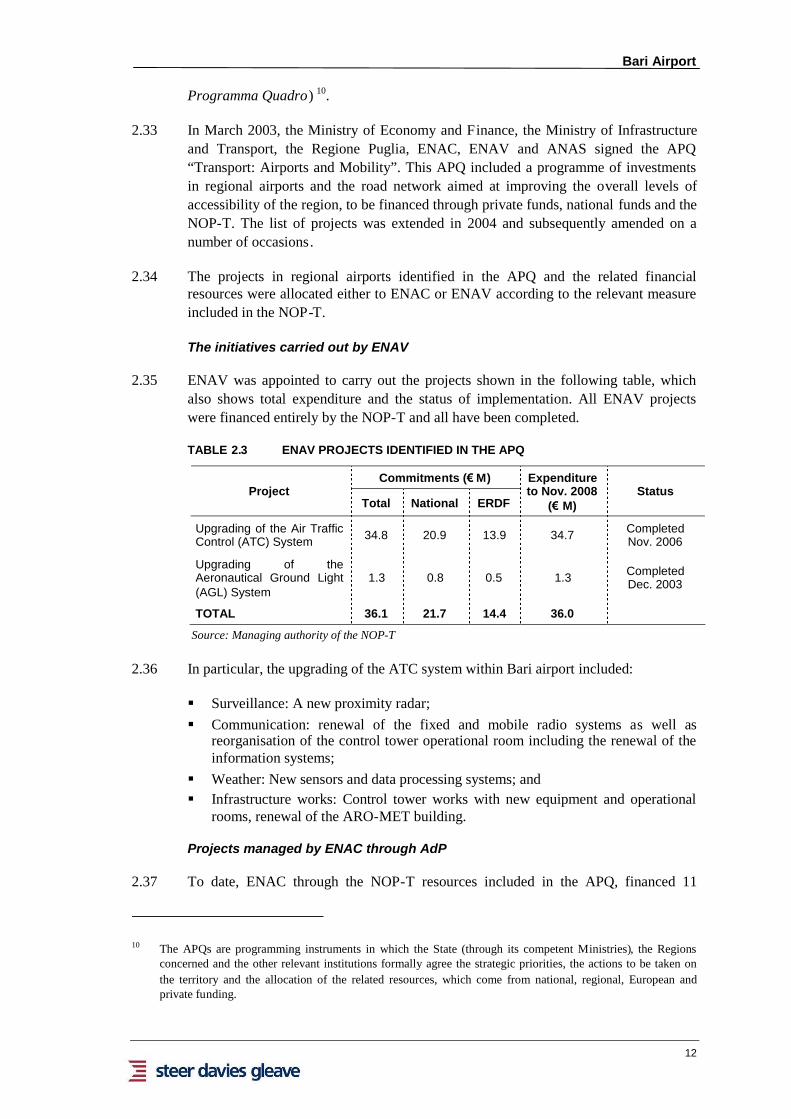
2.35 ENAV was appointed to carry out the projects shown in the following table, whichalso shows total expenditure and the status of implementation. All ENAV projectswere financed entirely by the NOP-T and all have been completed.
TABLE 2.3 ENAV PROJECTS IDENTIFIED IN THE APQ
Commitments (€M)Project
Total National ERDF
Expenditureto Nov. 2008
(€M)Status
Upgrading of the Air TrafficControl (ATC) System 34.8 20.9 13.9 34.7 Completed
Nov. 2006
Upgrading of theAeronautical Ground Light(AGL) System
1.3 0.8 0.5 1.3 CompletedDec. 2003
TOTAL 36.1 21.7 14.4 36.0
Source: Managing authority of the NOP-T
2.36 In particular, the upgrading of the ATC system within Bari airport included:
Surveillance: A new proximity radar; Communication: renewal of the fixed and mobile radio systems as well as
reorganisation of the control tower operational room including the renewal of theinformation systems;
Weather: New sensors and data processing systems; and Infrastructure works: Control tower works with new equipment and operational
rooms, renewal of the ARO-MET building.
Projects managed by ENAC through AdP
2.37 To date, ENAC through the NOP-T resources included in the APQ, financed 11
10 The APQs are programming instruments in which the State (through its competent Ministries), the Regionsconcerned and the other relevant institutions formally agree the strategic priorities, the actions to be taken onthe territory and the allocation of the related resources, which come from national, regional, European andprivate funding.
Bari Airport
13
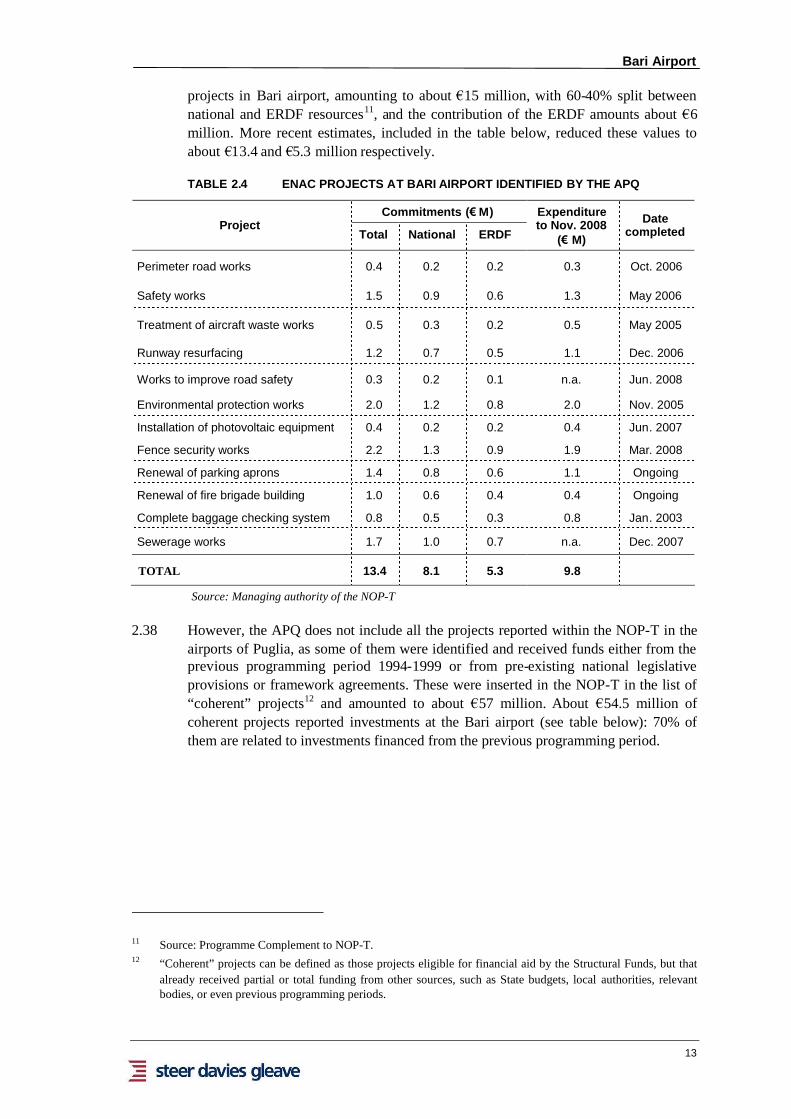
projects in Bari airport, amounting to about €15 million, with 60-40% split betweennational and ERDF resources11, and the contribution of the ERDF amounts about €6million. More recent estimates, included in the table below, reduced these values toabout €13.4 and €5.3 million respectively.
TABLE 2.4 ENAC PROJECTS AT BARI AIRPORT IDENTIFIED BY THE APQ
Commitments (€M)Project
Total National ERDF
Expenditureto Nov. 2008
(€M)
Datecompleted
Perimeter road works 0.4 0.2 0.2 0.3 Oct. 2006
Safety works 1.5 0.9 0.6 1.3 May 2006
Treatment of aircraft waste works 0.5 0.3 0.2 0.5 May 2005
Runway resurfacing 1.2 0.7 0.5 1.1 Dec. 2006
Works to improve road safety 0.3 0.2 0.1 n.a. Jun. 2008
Environmental protection works 2.0 1.2 0.8 2.0 Nov. 2005
Installation of photovoltaic equipment 0.4 0.2 0.2 0.4 Jun. 2007
Fence security works 2.2 1.3 0.9 1.9 Mar. 2008
Renewal of parking aprons 1.4 0.8 0.6 1.1 Ongoing
Renewal of fire brigade building 1.0 0.6 0.4 0.4 Ongoing
Complete baggage checking system 0.8 0.5 0.3 0.8 Jan. 2003
Sewerage works 1.7 1.0 0.7 n.a. Dec. 2007
TOTAL 13.4 8.1 5.3 9.8
Source: Managing authority of the NOP-T
2.38 However, the APQ does not include all the projects reported within the NOP-T in theairports of Puglia, as some of them were identified and received funds either from theprevious programming period 1994-1999 or from pre-existing national legislativeprovisions or framework agreements. These were inserted in the NOP-T in the list of“coherent” projects12 and amounted to about €57 million. About €54.5 million ofcoherent projects reported investments at the Bari airport (see table below): 70% ofthem are related to investments financed from the previous programming period.
11 Source: Programme Complement to NOP-T.12 “Coherent” projects can be defined as those projects eligible for financial aid by the Structural Funds, but that
already received partial or total funding from other sources, such as State budgets, local authorities, relevantbodies, or even previous programming periods.

Bari Airport
14
TABLE 2.5 NOP-T COHERENT PROJECTS IN BARI AIRPORT
Commitments (€M)Project
Total National ERDF
Expenditure toNov. 2008 (€M)
Datecompleted
Expanded parking area** 8.1 4.9 3.2 8.1 Mar. 2005
New terminal, Lot 2** 30.3 18.3 12.0 30.3 Mar. 2005
Electrical substation 0.1 0.1 0.0 n.a. Completed *
Water treatment plant 0.7 0.4 0.3 n.a. Completed *
Sewer pipes 0.1 0.1 0.1 0.1 Feb. 2004
Repaving of the head of the runway 0.3 0.2 0.1 0.3 Dec. 2004
New terminal, Lot 1 6.3 3.8 2.5 6.3 Mar. 2005
Ancillary works for the new terminal 7.3 4.4 2.9 1.8 Jun. 2005
Parking area with no CCTV 0.2 0.1 0.1 0.1 May 2003
Air side directional lighting 0.4 0.2 0.1 0.3 Jan. 2004
Perimeter road 0.2 0.1 0.1 0.2 Aug. 2006
Safety markings (RESA 25) 0.6 0.4 0.2 0.5 May 2004
TOTAL 54.5 32.9 21.6 48.0
Source: Managing authority of the NOP-T Note: there is an element of rounding in the figures above. **Projects identified in the 1994-1999 programming period. * indicates no date provided.
2.39 It is important to note that the CSF states that any national funding that is ‘crowded-out’ by the allocation of ERDF resources to coherent projects must then be reinvestedin other transport projects within the same Priority Axis. Additional resources freed upby coherent projects have then been actually made available to Bari airport, asmentioned in par. 2.46 in relation to the rail link between Bari and the airport.
Summary of ENAV and ENAC projects
2.40 The total financial commitment reported from the NOP-T to the upgrading of the Bariairport amounts to about €104 million (ENAV + ENAC projects), of which about €41million was from the ERDF. However, only about 50% belong to the projectsidentified by the NOP-T; 50% came from “coherent projects”, and mainly frominterventions financed through the previous programming period.
2.41 As far as total expenditure is concerned, this amounts to about €94 million, of which50% related to coherent projects. This figure is lower than the total commitments dueto:
the small savings experienced (about 8%) in projects in which the expenditure wascertified;
three completed projects the related expenditure of which had not been certifiedyet as per November 2008;
2.42 The large presence of coherent projects might raise concerns on the effectiveness ofprogramme planning in Italy, which has been discussed in detail in the Puglia casestudy. However, it does not question the role of the ERDF in contributing to thedevelopment of Bari airport, as it is discussed in par. 3.16.
Bari Airport
15
2.43 Nevertheless, the recourse to coherent projects implies that a complete assessment ofthe contribution given by the ERDF to the development of the airport in the 2000-2006 programming period would be possible only after resources freed up by coherentprojects are spent.
Rail link between the airport and Bari
2.44 Bari airport is not currently served by a rail link, although it can be reached by bus andtaxi. Following the significant increase in passenger volumes at the airport in the1990s, both national and regional authorities expressed their interest in theconstruction of a rail link, based on the diversion (by 7.7 km) of the existing rail linkbetween Bari and Barletta via Bitonto, managed by Ferrotramviaria, one of the railcompanies operating in Puglia.
2.45 The original project was rejected in 1999 by the Municipality of Bari13 and a newproject was inserted in the NOP-T in 2001. The project was however further delayedby modifications requested by the local authorities and the bankruptcy of the firmselected by Ferrotramviaria to carry out the construction, leading to it being removedfrom the list of major projects within the NOP-T.
2.46 However, in 2006 it was selected as one of the initiatives to be financed with theresources freed up by coherent projects. The resources allocated amounted to €77.5million, of which about €14 million from the ERDF and rest from national funds.Ferrotramviaria arranged a new tender in 2006 for the construction of the new raillink; this was awarded in June 2008. Works started in the first months of 2009, and areexpected to last two years.
The actual outcomes (results)
The upgraded airport
2.47 Construction works at the new passenger terminal of the airport finished in March2005 and it was opened to the public in December 2005. The following table showsthe comparison between the availability of airside and land-side infrastructure at theairport before and after the upgrading.
13 Mainly because the new line was to be single-tracked, and this was considered insufficient to accommodate theexpected traffic flows given the increase in passenger traffic.

Bari Airport
16
TABLE 2.6 MAIN CHARACTERISTICS OF BARI AIRPORT
Parameter Before After
Surface area 212 ha 240 ha
Aircraft parking ramp 9 spaces 18 spaces
Size 75,000 m2 150,000 m2
Terminal surface area 4,825 m2 28,832 m2 14
Check-in desks 10+3 tour operator 29
Average check-in time 1.5 min 1.5 min
Length of baggage reclaim belts 55 m 280 m
Parking spaces 2,300 3,050
Source: Masterplan of AdP - 2002 and 2007
2.48 Following the completion of the project, the total capacity of the airport was raised to2.8 million passengers a year. The surface area of the new passenger terminal is sixtimes larger than the old one and the number of check-in desks more than doubled. Inaddition, the number of aircraft parking spaces has also doubled. The table belowshows the theoretical capacity that can be handled by the airport following theupgrading.
TABLE 2.7 MAIN OPERATING PARAMETERS OF BARI AIRPORT
Parameter Unit Value
Expected demand in 2015 Passengers 3.600.000
Expected aircraft movements in 2015 Movements 32,000
Passengers in peak hours Passengers 1.400
Capacity Passengers 840
Arrivals and departures (peak) Passengers per hour 1000
Arrivals/Departures from EU countries (peak) Passengers per hour 600
Arrivals/Departures from non-EU countries (peak) Passengers per hour 533
Source: AdP
2.49 However, a further expansion of the passenger terminal is envisaged by AdP to copewith the increases in demand expected by 2015. This is dealt with in more detail in thefollowing paragraphs.
Traffic volumes following the upgrading
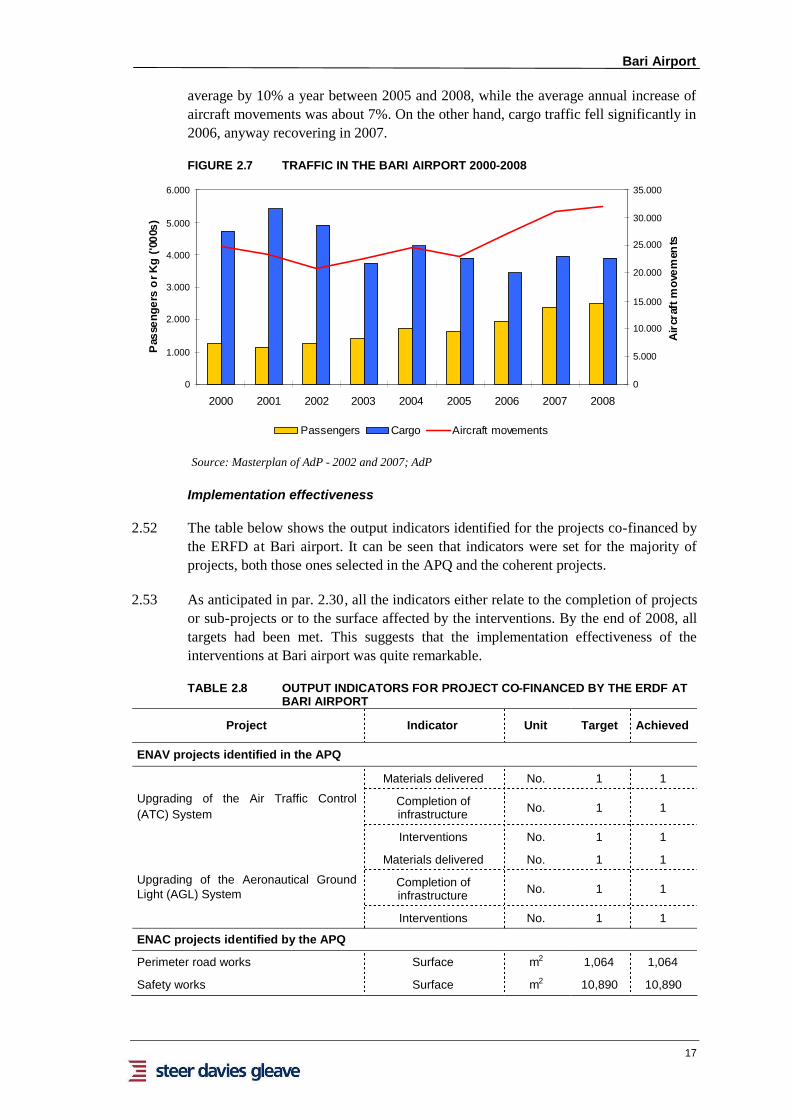
2.50 The figure below shows the evolution of passenger and freight traffic, as well as airmovements, from 2000 to 2008. The statistics show in 2006 an increase in passengertraffic and aircraft movements of respectively 20.4% and 17.6% compared with 2005.
2.51 This trend was maintained in the following years, so that passenger traffic grew on
14 Of which 5,400 m2 of commercial spaces, 4,050 m2 of offices and 4,050 m2 of technical spaces.
Bari Airport
17
average by 10% a year between 2005 and 2008, while the average annual increase ofaircraft movements was about 7%. On the other hand, cargo traffic fell significantly in2006, anyway recovering in 2007.
FIGURE 2.7 TRAFFIC IN THE BARI AIRPORT 2000-2008
0
1.000
2.000
3.000
4.000
5.000
6.000
2000 2001 2002 2003 2004 2005 2006 2007 2008
Pas
seng
ers
orK
g('0
00s)
0
5.000
10.000
15.000
20.000
25.000
30.000
35.000
Air
craf
tmov
emen
ts
Passengers Cargo Aircraft movements
Source: Masterplan of AdP - 2002 and 2007; AdP
Implementation effectiveness
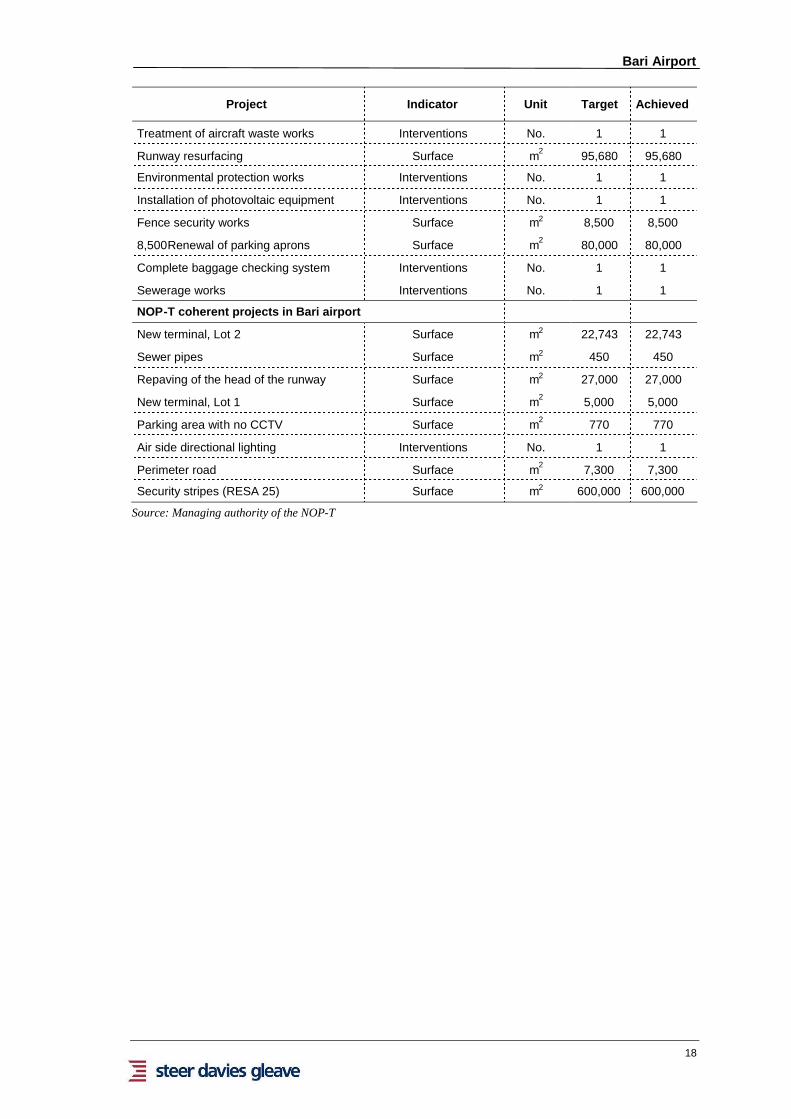
2.52 The table below shows the output indicators identified for the projects co-financed bythe ERFD at Bari airport. It can be seen that indicators were set for the majority ofprojects, both those ones selected in the APQ and the coherent projects.
2.53 As anticipated in par. 2.30, all the indicators either relate to the completion of projectsor sub-projects or to the surface affected by the interventions. By the end of 2008, alltargets had been met. This suggests that the implementation effectiveness of theinterventions at Bari airport was quite remarkable.
TABLE 2.8 OUTPUT INDICATORS FOR PROJECT CO-FINANCED BY THE ERDF ATBARI AIRPORT
Project Indicator Unit Target Achieved
ENAV projects identified in the APQ
Materials delivered No. 1 1
Completion ofinfrastructure No. 1 1
Upgrading of the Air Traffic Control(ATC) System
Interventions No. 1 1
Materials delivered No. 1 1
Completion ofinfrastructure No. 1 1
Upgrading of the Aeronautical GroundLight (AGL) System
Interventions No. 1 1
ENAC projects identified by the APQ
Perimeter road works Surface m2 1,064 1,064
Safety works Surface m2 10,890 10,890
Bari Airport
18
Project Indicator Unit Target Achieved
Treatment of aircraft waste works Interventions No. 1 1
Runway resurfacing Surface m2 95,680 95,680
Environmental protection works Interventions No. 1 1
Installation of photovoltaic equipment Interventions No. 1 1
Fence security works Surface m2 8,500 8,500
8,500Renewal of parking aprons Surface m2 80,000 80,000
Complete baggage checking system Interventions No. 1 1
Sewerage works Interventions No. 1 1
NOP-T coherent projects in Bari airport
New terminal, Lot 2 Surface m2 22,743 22,743
Sewer pipes Surface m2 450 450
Repaving of the head of the runway Surface m2 27,000 27,000
New terminal, Lot 1 Surface m2 5,000 5,000
Parking area with no CCTV Surface m2 770 770
Air side directional lighting Interventions No. 1 1
Perimeter road Surface m2 7,300 7,300
Security stripes (RESA 25) Surface m2 600,000 600,000
Source: Managing authority of the NOP-T

Bari Airport
19
3. CONCLUSIONS
Key evaluation questions
Has the investment been prepared by a sound demand analysis? Has therebeen a comparison with data on factual demand after project completion?
3.1 As discussed in Chapter 2, this project was accompanied by traffic forecasts, whichwere published in 2002 in the Masterplan for the Development of Airport System inPuglia, prepared by AdP, to justify the need for upgrading.
3.2 At that time passenger traffic at Bari airport was estimated to grow by 3.6% per yearup to 2017, and by 1.5% between 2018 and 2047. The compound annual growth rateof freight traffic was estimated to be 1.5% up to 2017, and 1.9% later on.
3.3 The need for airport expansion was later confirmed also by outturn volumes, whichproved to be significantly higher than the forecasts (Figure 3.1). The difference in2008 exceeded 70%. As a result, by 2008, the number of aircraft movements exceededthat projected for 2015, making a further upgrade to the terminal necessary.
FIGURE 3.1 PASSENGER TRAFFIC: FORECAST VS. ACTUAL VOLUMES (2001-2008)
0
500
1,000
1,500
2,000
2,500
3,000
2001 2002 2003 2004 2005 2006 2007 2008
Pas
sen
ger
s('0
00s
)
Forecasts Real
Source: Masterplan of AdP - 2002 and AdP
3.4 This difference between forecasts and actual demand may be explained by a numberof factors:
The forecasts were elaborated using 2001 as the base-year, which was not arepresentative year for the aviation industry, due to 9/11;
The recovery after 9/11 was more rapid than expected. Passenger volumes inItalian airports increased by 50% (CAGR 7%) between 2001 and 2007, andaircraft movements increased by 23% (CAGR 3.6%);

Bari Airport
20
The launch of new lost cost services to the Italian regional airports, which haveexpanded rapidly in Italy since 2001;
Individual incentives offered by AdP to encourage other operators to use theairports through subsidies for marketing and related costs;
The forecasts did not take into sufficient consideration the capacity constraintsthat previously were suppressing demand, something that was reduced with theopening of the new terminal. Appendix B shows the number of active routes fromthe airports of Puglia in 2001 and 2007.
The launch of a number of domestic and international routes was subsidised withregional funds, in compliance with the Community guidelines on financing ofairports and start-up aid15, which clearly had a positive impact on routes.
The 2002 Masterplan assumed the development of Foggia airport as an alternativeto Bari and, partly, Brindisi. As this objective was not accomplished, the expectedtransport demand on Foggia shifted on Bari.
3.5 It can be said that overall the forecasts that were elaborated at the time wereacceptable and the occurrence and the impact of some of the factors explaining the gapidentified above were not known when the projections were elaborated. For example,the abrupt expansion of low cost carriers, or the failed development of the Foggiaairport. Although it is clear that some of the assumptions that underpinned theforecasts were too prudent, for example those concerning the set up of new routes inperiod 2001 to 2007.
Does the contribution of the projects to regional development meet the initialexpectations?
Impact on airport traffic
3.6 The upgrading of Bari airport contributed to attract new passengers and toaccommodate the demand growth experienced. As shown above, passenger numbersdoubled between 2002 and 2008, almost reaching 2.5 million passengers in 2008,despite the fact that there were three other airports in the region.
3.7 The upgrading resulted in an improvement of air accessibility in Bari and in the wholeregion, as shown by the variation of the index of infrastructural endowment forairports for the five provinces of Puglia. Following the completion of the project at theBari airport, the index increased by 7 percentage points for Bari and by 2-2.5 points inthe other provinces and in the region as a whole.
TABLE 3.1 INDEX OF INFRASTRUCTURAL ENDOWMENT - 2007 (ITALY = 100)
Infrastructure Bari Brindisi Foggia Lecce Taranto Puglia
Airports 2001 62.19 252.63 27.33 14.11 45.05 61.20
Airports 2007 70.84 254.98 25.59 16.54 43.02 63.50
Total 2001 95.85 109.06 64.86 77.67 108.85 87.42
Total 2007 106,62 118,35 67,44 75,51 103,83 91,54
Source: Tagliacarne Institute, Unioncamere, 2007
15 The European Commission in 2007 declared that this measure is compatible with the European CommonMarket. Decision C(2007) 1404.
Bari Airport
21
3.8 The value of the index is always set to 100 for Italy as a whole, therefore, the indexdoes not reflect any improvement in the infrastructure endowment at national level - itcan only be used for comparisons between regions. Despite this, the variation in theindex occurred between 2001 and 2007 reveals that the project improved the positionof Puglia, and particularly the province of Bari, towards that of the rest of Italy.
3.9 This, combined with the increase in passenger demand in the Bari airport, supports theconclusion that air mobility in the region was constrained by inadequate transportinfrastructure.
Wider impact of the project: focus on tourism
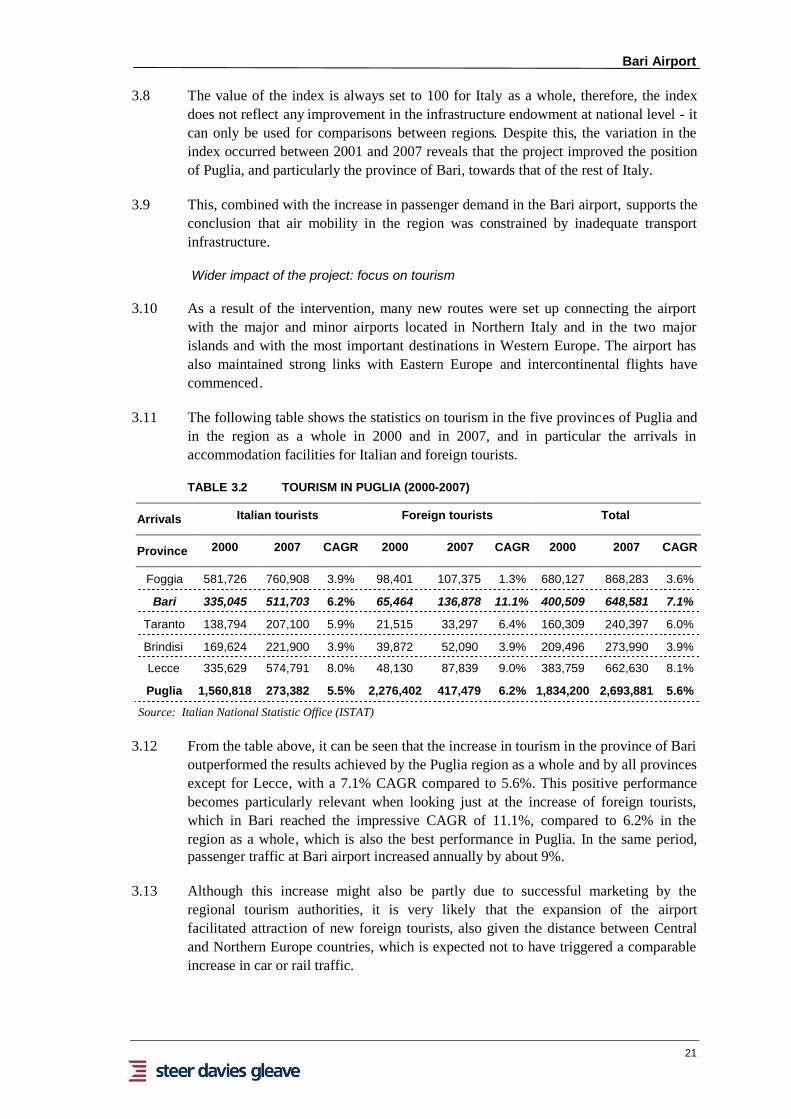
3.10 As a result of the intervention, many new routes were set up connecting the airportwith the major and minor airports located in Northern Italy and in the two majorislands and with the most important destinations in Western Europe. The airport hasalso maintained strong links with Eastern Europe and intercontinental flights havecommenced.
3.11 The following table shows the statistics on tourism in the five provinces of Puglia andin the region as a whole in 2000 and in 2007, and in particular the arrivals inaccommodation facilities for Italian and foreign tourists.
TABLE 3.2 TOURISM IN PUGLIA (2000-2007)
Arrivals Italian tourists Foreign tourists Total
Province 2000 2007 CAGR 2000 2007 CAGR 2000 2007 CAGR
Foggia 581,726 760,908 3.9% 98,401 107,375 1.3% 680,127 868,283 3.6%
Bari 335,045 511,703 6.2% 65,464 136,878 11.1% 400,509 648,581 7.1%
Taranto 138,794 207,100 5.9% 21,515 33,297 6.4% 160,309 240,397 6.0%
Brindisi 169,624 221,900 3.9% 39,872 52,090 3.9% 209,496 273,990 3.9%
Lecce 335,629 574,791 8.0% 48,130 87,839 9.0% 383,759 662,630 8.1%
Puglia 1,560,818 273,382 5.5% 2,276,402 417,479 6.2% 1,834,200 2,693,881 5.6%
Source: Italian National Statistic Office (ISTAT)
3.12 From the table above, it can be seen that the increase in tourism in the province of Barioutperformed the results achieved by the Puglia region as a whole and by all provincesexcept for Lecce, with a 7.1% CAGR compared to 5.6%. This positive performancebecomes particularly relevant when looking just at the increase of foreign tourists,which in Bari reached the impressive CAGR of 11.1%, compared to 6.2% in theregion as a whole, which is also the best performance in Puglia. In the same period,passenger traffic at Bari airport increased annually by about 9%.
3.13 Although this increase might also be partly due to successful marketing by theregional tourism authorities, it is very likely that the expansion of the airportfacilitated attraction of new foreign tourists, also given the distance between Centraland Northern Europe countries, which is expected not to have triggered a comparableincrease in car or rail traffic.
Bari Airport
22
3.14 We are aware that the increase in tourism is just a proxy of the successfulness of theupgrading project; however the relationship between the number of foreign touristsand the setup of new international routes at the Bari airport is undeniable. During ourinterviews with the airport manager, we also asked for more information aboutemployment and commercial activities at the airport before and after the upgrading.Unfortunately, this information was not made available to us.
Lessons learnt and going forward
Contribution of ERDF
3.15 From the point of view of the use of ERDF resources as well as from the point of viewof Italian authorities, the upgrade of Bari airport has been successful. All theinterventions financed, other than the rail link and two minor projects16, werecompleted by 2008, with no significant discrepancies between the commitmentsinitially identified and final expenditure, but with some savings. In addition, as shownin Table 2.8, all the individual projects identified in the NOP-T met the targets set bythe respective output indicators.
3.16 As far as the coherent projects are concerned, the two projects identified in the 1994-1999 programming period and the other ones were respectively completed by 2005and 200617.
3.17 In regard to the final outcome, the expansion of the airport led to significant trafficgrowth, which may have been suppressed previously due to the inadequacy oftransport infrastructure, and this has facilitated a significant increase in tourism to theregion. The growth in traffic was significantly greater than projected.
3.18 Finally, the new investments planned will benefit from national resources freed up bycoherent projects reported under NOP-T airport interventions, crowded out by ERDFresources. As mentioned in par. 2.39, the 2000-2006 Italian CSF requires that anynational funding ‘crowded-out’ by the allocation of ERDF resources must bereinvested in other transport projects.
3.19 Yet, these resources do not necessarily have to be spent on the same mode or territory.This flexibility is certainly important, not least to be able to accommodate newtransport needs. However, the fact that Puglia, and particularly Bari airport, got backsome of the available funding to cope with the increased demand experienced, iscertainly a positive outcome.
Further upgrade project
3.20 The discrepancy between forecast and actual passenger volumes has led AdP to planfurther expansion of the airport. In its investment programme for the period 2009-12,AdP now predicts that by the year 2012, traffic will exceed 3 million passengers/yearand 40,000 movements/year. On the basis of these forecasts, the airport manager plans
16 See Table 2.4.17 See par. 2.38 and Table 2.5.
Bari Airport
23
to:
expand the new terminal and reuse existing spaces, such as the old terminal,increasing total surface area from 28,000m2 to 48,000m2 and commercial spacesfrom 5,400m2 to 7,200m2;
extend the runway; increase the number of aircraft stands from 18 to 37; double the number of air bridges (from 4 to 8); and upgrade the AGL system.
3.21 These new investments, which amount to €135.3 million, have been planned within aprotocol agreement (Protocollo di Intesa) signed by Regione Puglia, ENAC andAeroporti di Puglia on 3rd April 2009. According to the protocol agreement, the newinvestments will be funded by:
ENAC, through: national resources crowded out by ERDF allocation in the NOP-T 2000-06 (€
16.8 million);
the new National Operational Programme for Networks and Mobility 2007-13, including ERDF resources (about €16.7 million); and
Regione Puglia, through other national sources (€90 million); Aeroporti di Puglia (€11.8 million).
3.22 The resources will be actually allocated within the framework of a new APQ, to besigned by the competent authorities.

Bari Airport
APPENDIX A
ADDITIONAL FIGURES

Bari Airport
1
APPENDIX FIGURE 1: DOMESTIC AND INTERNATIONAL ROUTES TO/FROM THE AIRPORTS OF PUGLIA (2001-2008)
Domestic routes International routes
EX POST EVALUATION OFCOHESION POLICYPROGRAMMES 2000-2006 CO-FINANCED BY THE EUROPEANFUND FOR REGIONALDEVELOPMENT (OBJECTIVES 1AND 2) - WORK PACKAGE 5A:TRANSPORT
Regional Airport Case Study
Liverpool John Lennon Airport
November 2009
Prepared for: Prepared by:
European CommissionDirectorate General for Regional PolicyEvaluation unit
Steer Davies Gleave28-32 Upper GroundLondonSE1 9PD
+44 (0)20 7919 8500www.steerdaviesgleave.com

Liverpool John Lennon Airport
2
1. INTRODUCTION
Scope and purpose
1.1 The purpose of this case study is to assess the effectiveness of the ERDF in relation toinvestments in Liverpool John Lennon airport (henceforth LJLA), situated inObjective 1 region of Merseyside (United Kingdom). Investment has been undertakento Improve transport services that can produce positive direct and indirect economiceffects, capable of facilitating the development of the whole region in which theairport is located, mostly related to increasing tourism and business activity, and directemployment by the airport, the airlines and the other companies based at the airport
1.2 LJLA has been chosen for this case study for the following reasons:
Liverpool is one of the largest cities in the United Kingdom and represents asignificant potential air traffic attractor;
LJLA has been one of the fastest growing airports in the UK over the past tenyears, notably in the low-cost passenger sector; and
The airport is located in Merseyside, which in 2000 had the fourth lowest GrossValue Added (GVA) per capita out of the UK’s 37 NUTS2 regions, and was thepoorest urban area of the UK. The positive outcomes of the investments made bythe ERDF in the airport since the 1994-1999 programming period contributed tothe improvement of the economic situation within the region.
1.3 The main aim of the study is to investigate:
whether the investments funded by the ERDF were underpinned by a sounddemand analysis;
whether there has been a comparison with data on factual demand after projectcompletion; and
whether the contribution of the projects to regional development met the initialexpectations.
1.4 This initial chapter briefly outlines the history and the key facts of the airport at thestart of the 2000-2006 programming period. Chapter 2 focuses on the upgrading ofLiverpool airport and the role of the ERDF. Chapter 3 concludes by presenting theresults obtained in respect to the two evaluation questions mentioned above.
Data sources
1.5 The analysis that has been undertaken in this case study has drawn on publishedinformation as well as discussions with the airport authority. The main data sourcesused for the study are summarised below:
Single Programming Document 2000-2006, United Kingdom - Merseyside andProgramme Complement;
The Annual Reports on Implementation of the SPD, issued annually by theManaging Authority of the this operational programme, which is the GovernmentOffice North West (GONW);
Airport Master Plan to 2030, made available by Liverpool John Lennon Airport; Surface Access Strategy, May 2006, issued by Liverpool Airport Plc; White Paper “The Future of Air Transport”, 2003, issued by the Department for
Liverpool John Lennon Airport
3
Transport; Information from NWDP’s Internet site1; information from LJLA’s Internet site; Statistics provided by the Civil Aviation Authority;
Background
Economic and demographic overview of Merseyside
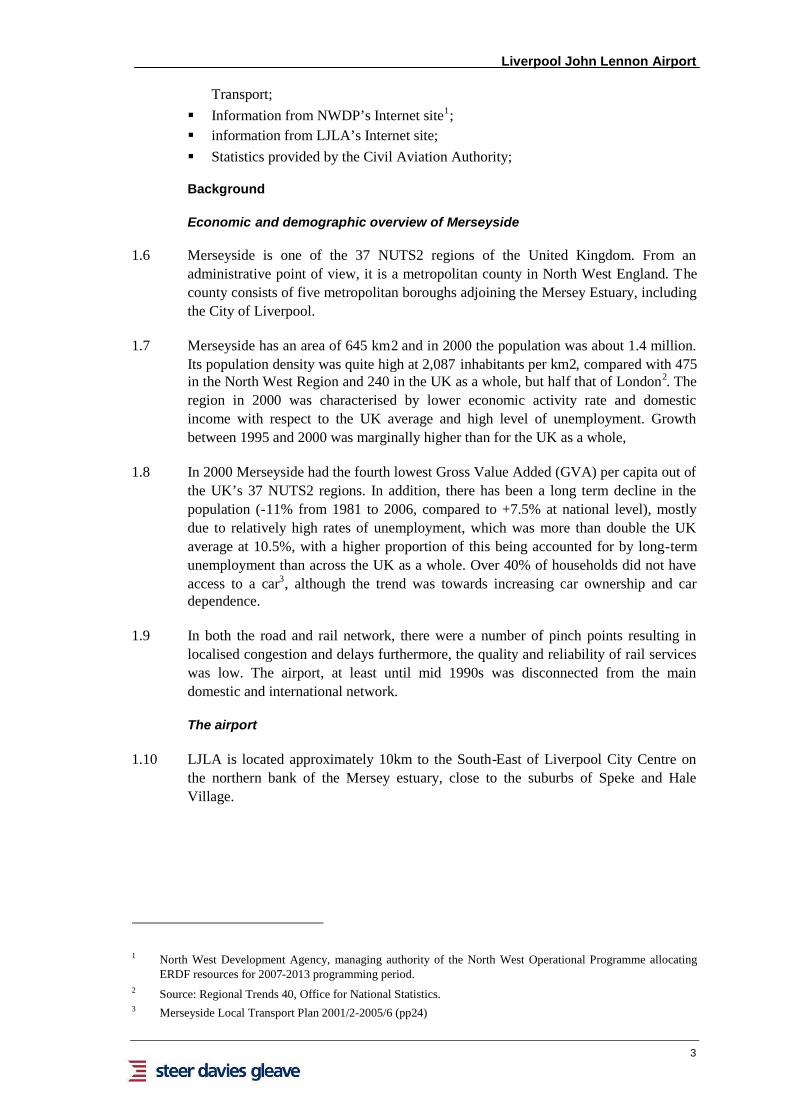
1.6 Merseyside is one of the 37 NUTS2 regions of the United Kingdom. From anadministrative point of view, it is a metropolitan county in North West England. Thecounty consists of five metropolitan boroughs adjoining the Mersey Estuary, includingthe City of Liverpool.
1.7 Merseyside has an area of 645 km2 and in 2000 the population was about 1.4 million.Its population density was quite high at 2,087 inhabitants per km2, compared with 475in the North West Region and 240 in the UK as a whole, but half that of London2. Theregion in 2000 was characterised by lower economic activity rate and domesticincome with respect to the UK average and high level of unemployment. Growthbetween 1995 and 2000 was marginally higher than for the UK as a whole,
1.8 In 2000 Merseyside had the fourth lowest Gross Value Added (GVA) per capita out ofthe UK’s 37 NUTS2 regions. In addition, there has been a long term decline in thepopulation (-11% from 1981 to 2006, compared to +7.5% at national level), mostlydue to relatively high rates of unemployment, which was more than double the UKaverage at 10.5%, with a higher proportion of this being accounted for by long-termunemployment than across the UK as a whole. Over 40% of households did not haveaccess to a car3, although the trend was towards increasing car ownership and cardependence.
1.9 In both the road and rail network, there were a number of pinch points resulting inlocalised congestion and delays furthermore, the quality and reliability of rail serviceswas low. The airport, at least until mid 1990s was disconnected from the maindomestic and international network.
The airport
1.10 LJLA is located approximately 10km to the South-East of Liverpool City Centre onthe northern bank of the Mersey estuary, close to the suburbs of Speke and HaleVillage.
1 North West Development Agency, managing authority of the North West Operational Programme allocatingERDF resources for 2007-2013 programming period.
2 Source: Regional Trends 40, Office for National Statistics.3 Merseyside Local Transport Plan 2001/2-2005/6 (pp24)
Liverpool John Lennon Airport
4
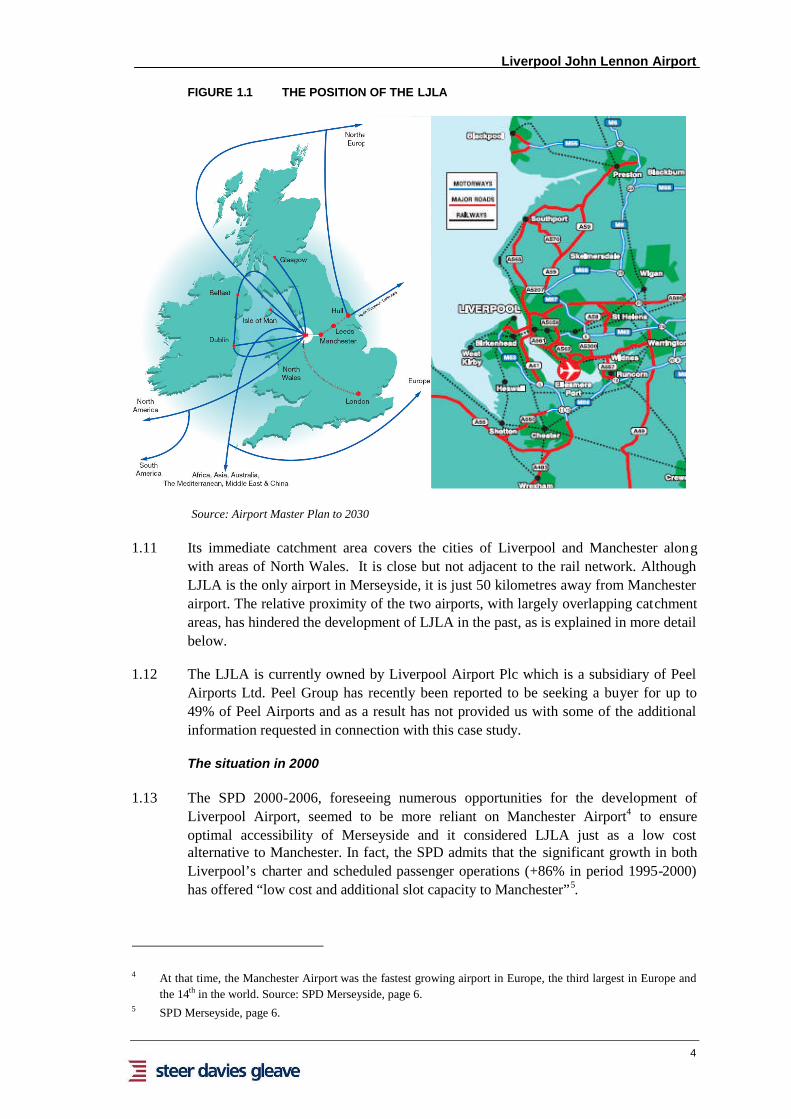
FIGURE 1.1 THE POSITION OF THE LJLA
Source: Airport Master Plan to 2030
1.11 Its immediate catchment area covers the cities of Liverpool and Manchester alongwith areas of North Wales. It is close but not adjacent to the rail network. AlthoughLJLA is the only airport in Merseyside, it is just 50 kilometres away from Manchesterairport. The relative proximity of the two airports, with largely overlapping catchmentareas, has hindered the development of LJLA in the past, as is explained in more detailbelow.
1.12 The LJLA is currently owned by Liverpool Airport Plc which is a subsidiary of PeelAirports Ltd. Peel Group has recently been reported to be seeking a buyer for up to49% of Peel Airports and as a result has not provided us with some of the additionalinformation requested in connection with this case study.
The situation in 2000
1.13 The SPD 2000-2006, foreseeing numerous opportunities for the development ofLiverpool Airport, seemed to be more reliant on Manchester Airport4 to ensureoptimal accessibility of Merseyside and it considered LJLA just as a low costalternative to Manchester. In fact, the SPD admits that the significant growth in bothLiverpool’s charter and scheduled passenger operations (+86% in period 1995-2000)has offered “low cost and additional slot capacity to Manchester”5.
4 At that time, the Manchester Airport was the fastest growing airport in Europe, the third largest in Europe andthe 14th in the world. Source: SPD Merseyside, page 6.
5 SPD Merseyside, page 6.
Liverpool John Lennon Airport
5
1.14 The main role for Liverpool airport was seen to be in relation to the cargo sector. Infact, the SPD emphasises that in 2000 LJLA was the third largest mail airport in theUnited Kingdom.
1.15 However, the expansion of the airport carried out during the previous programmingperiod, and the decision by important low cost carriers to base their aircraft in LJLA,led to an abrupt increase in air traffic. The increased volumes highlighted thelimitations the airport suffered of in terms of the inadequacy of passenger and freighthandling facilities and in terms of accessibility by car and public transport.
Liverpool John Lennon Airport
6
2. THE PROJECT
John Lennon airport prior to ERDF co-financed improvements
Liverpool airport: background and characteristics
2.1 Liverpool airport is one of the oldest operational airports in the UK, the first scheduledflights started in 1930, even though operations were located at a different site, which iscurrently being redeveloped as a high quality business park (Estuary Commerce Park).Before World War II, Liverpool airport was the second busiest airport in the UK.
2.2 After the war, its role gradually fell away in favour of Manchester. In 1966, the airportmoved to its existing site where a 2.3km runway and taxiway were built. However, inthat year Manchester was handling 1.4 million passengers per annum (henceforthmppa), three times as many as Liverpool (0.45 mppa). Passenger traffic was limiteduntil mid 1990s, varying between 0.25 and 0.6 mppa.
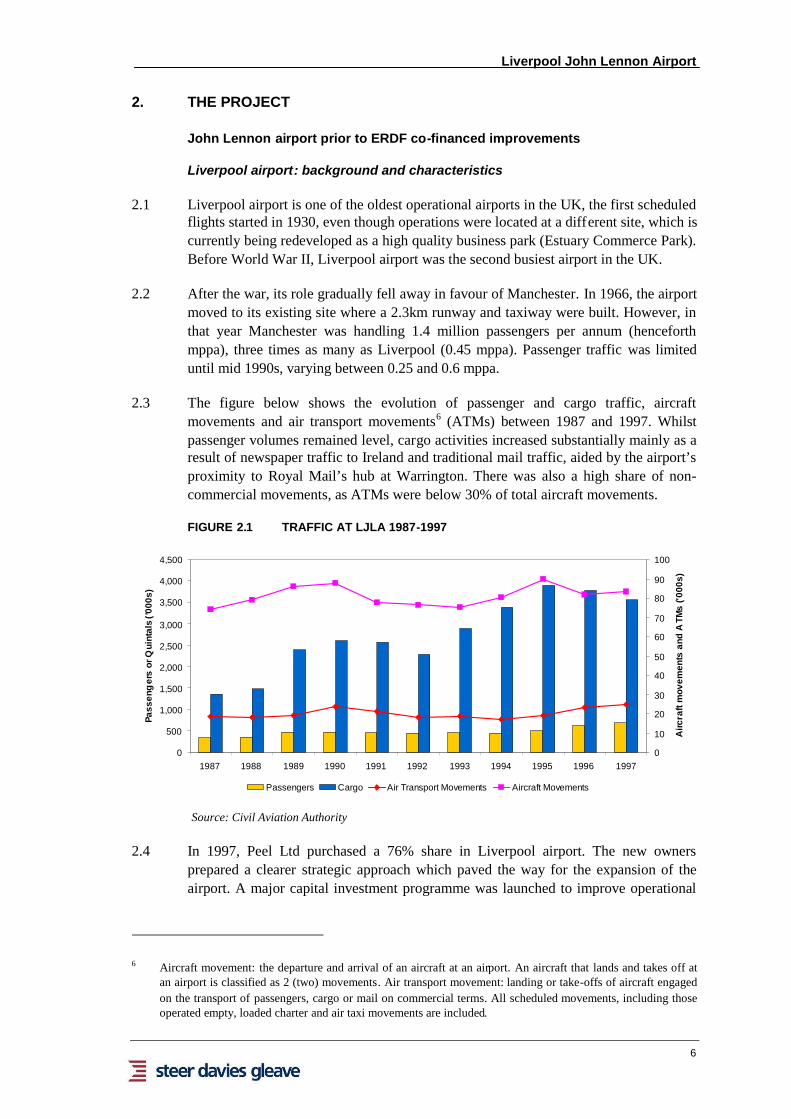
2.3 The figure below shows the evolution of passenger and cargo traffic, aircraftmovements and air transport movements6 (ATMs) between 1987 and 1997. Whilstpassenger volumes remained level, cargo activities increased substantially mainly as aresult of newspaper traffic to Ireland and traditional mail traffic, aided by the airport’sproximity to Royal Mail’s hub at Warrington. There was also a high share of non-commercial movements, as ATMs were below 30% of total aircraft movements.
FIGURE 2.1 TRAFFIC AT LJLA 1987-1997
0
500
1,000
1,500
2,000
2,500
3,000
3,500
4,000
4,500
1987 1988 1989 1990 1991 1992 1993 1994 1995 1996 1997
Pass
eng
ers
orQ
uint
als
('000
s)
0
10
20
30
40
50
60
70
80
90
100
Airc
raft
mov
emen
tsan
dA
TMs
('000
s)
Passengers Cargo Air Transport Movements Aircraft Movements
Source: Civil Aviation Authority
2.4 In 1997, Peel Ltd purchased a 76% share in Liverpool airport. The new ownersprepared a clearer strategic approach which paved the way for the expansion of theairport. A major capital investment programme was launched to improve operational
6 Aircraft movement: the departure and arrival of an aircraft at an airport. An aircraft that lands and takes off atan airport is classified as 2 (two) movements. Air transport movement: landing or take-offs of aircraft engagedon the transport of passengers, cargo or mail on commercial terms. All scheduled movements, including thoseoperated empty, loaded charter and air taxi movements are included.
Liverpool John Lennon Airport
7
facilities and airline services, which has been supported by the ERDF since the 1994-1999 programming period, “in recognition of the need to tackle deprivations and topromote economic growth and regeneration within South Liverpool”7. In 2001, PeelLtd purchased the remaining shares and in 2002 the airport was re-named as LiverpoolJohn Lennon Airport.
2.5 During the 1994 – 1999 funding period, new hangars, a general aviation centre,aircraft aprons and control tower were constructed along with a major redevelopmentof the terminal. The original terminal, built in 1986, was extended and surrounded bya new one, opened in 2002. We have requested from the airport manager details of theprecise works undertaken at this time in order to clarify the starting position for the2000 – 2006 period funding but this information has not been made available.
2.6 These initiatives proved timely and combined with the emergence of new airlines,especially in the low cost sector. In 1997, easyJet decided to locate at LJLA and otherairlines soon followed. The significant increase in passenger traffic achieved in arelatively short period of time lead the airport manager to consider a further upgradeof the airport and to improve the worsening problem of accessibility, particularly bypublic transport. In fact, the LJLA was and still is not served by rail services. Thesetwo priorities were taken forward by the SPD 2000-2006, as discussed in more detailbelow.
The traffic forecasts
Passenger traffic
2.7 At present, we do not possess any formal traffic forecasts made before the start of2000-06 programming period. At the time of interview of the airport manager thisinformation was not readily available and we have not yet received it in response toour request. This calls into question the validity of the investment. However, the SPDstates that “by the year 2002 it is forecast that over 2 million passengers will passthrough the (Liverpool) airport”. In actual fact, passenger throughput in 2002exceeded 2.5 million passengers.
2.8 However, the Master Plan developed by the airport manager includes a baselinescenario traffic forecasts starting from 2004, developed by independent consultants.These forecasts are driven by:
Growing underlying traffic demand for LJLA’s catchment from a base of 2003; Estimating the market share that LJLA captures of the traffic from the catchment
area.
2.9 The exception to this is domestic traffic, where the transfer of traffic from land basedtransport modes is significant8.
2.10 The growth rates used to predict the underlying demand were generally extracted bythe forecasts developed by the Department of Transport (DfT) for both the UK and its
7 Source: Airport Master Plan to 2030, page 20.8 Source: Airport Master Plan to 2030, page 55.
Liverpool John Lennon Airport
8
regions, in the White Paper “The Future of Air Transport Progress Report”, issued in2003. Then, a traffic allocation model developed by consultants allowed for theestimation of traffic served by LJLA on a route by route basis.
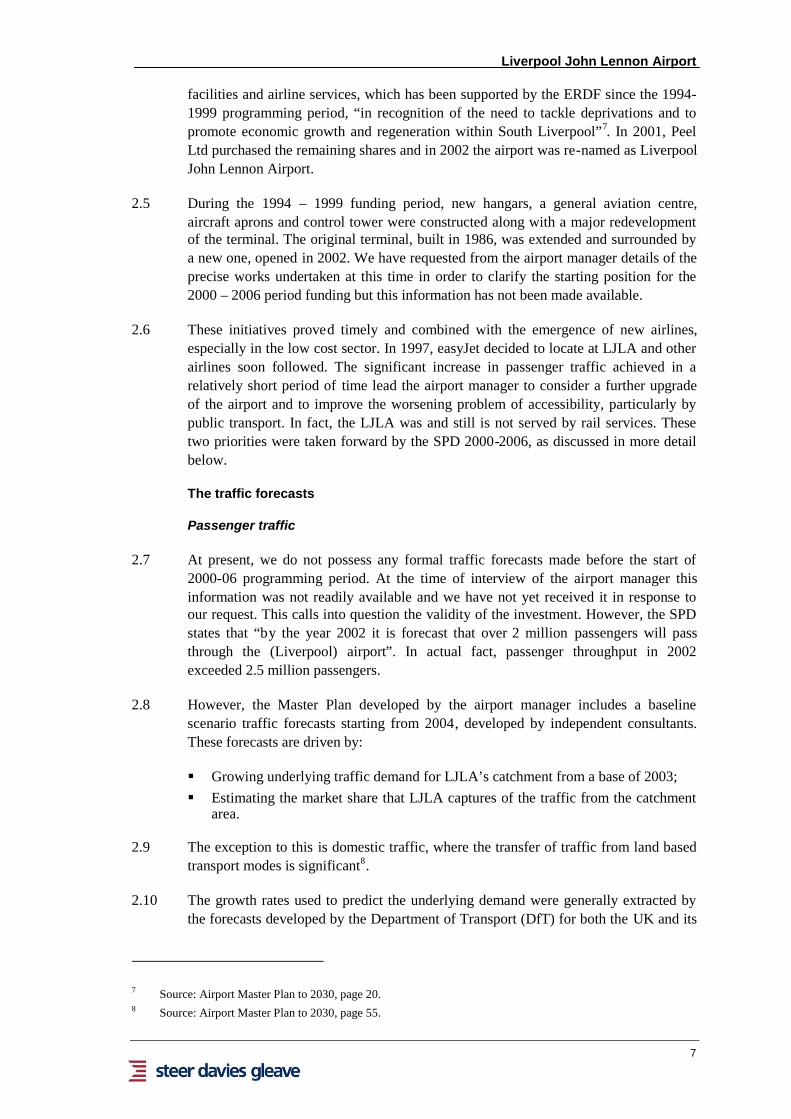
2.11 Total annual throughput is forecast to reach 8.3 million passengers in 2015 and 12.3 in2030, with a notable contribution by European scheduled services and, at a lesserextent, domestic scheduled services. Charter and long haul services are insteadexpected to remain minor contributors of traffic and to be concentrated in otherairports, such as Manchester.
FIGURE 2.2 PASSENGER TRAFFIC FORECASTS - 2004-2030
Source: Airport Master Plan to 2030, page 57
Cargo traffic
2.12 Before commenting on the traffic forecasts developed with respect to freight and mailtraffic, it should be noted that, following the issue of the SPD, cargo traffic at LJLA(both freight and mail) fell rapidly, attributed by the airport manager to suddenchanges in the logistics structure of the airport’s traditional customers.
2.13 In particular, according to the airport manager, the reduction was due to changes in theordering and supply procedures in the car industry and the movement of printing forthe Irish editions of national newspapers to Belfast. In addition, it is worth noting thatlow cost carriers do not take freight, so belly hold traffic was minimal.
2.14 As far as mail traffic is concerned, the Master Plan reports that, as the distribution
Liverpool John Lennon Airport
9
mode became increasingly road based, the possible connection of LJLA with theWarrington mail delivery hub was no longer important. It is suggested that this is thereason why Royal Mail relocated its air network hub to East Midlands airport9.
2.15 Whatever the reasons, cargo traffic handled at the LJLA decreased by about 60% from2000 to 2004. Nevertheless, in 2004 the airport manager was confident that by 2015LJLA could partially recover its position in freight traffic, and keep its market sharewith respect to mail traffic. Transported tonnes should then come back to the levels of1995, which were actually more than twice the 2004 value.
TABLE 2-1 CARGO TRAFFIC FORECASTS - 2004 TO 2015
YearUK regional(thousandtonnes)
Liverpool(thousandtonnes)
Liverpool share CAGR Liverpool
1995 422 38.9 9.2% -
2004 701 16.5 2.3% -9.1%
2015 1,201 39.9 3.3% 7.6%
Source: Airport Master Plan to 2030, page 59
2.16 These forecasts were based on projections developed by Boeing (Cargo MarketForecast 2004) and Airbus (Airbus Market Forecast), which suggested an averageannual increase in volumes of about 5% for intra-European traffic, slightly higher on aglobal basis, resulting in an assumption of 5.5% CAGR from 2004 to 2015. As far asmail traffic is concerned, the CAGR identified for the same period is 2.2%.
2.17 However, as also stated by the airport manager, the scenario identified by theseforecasts did not necessarily represent what would happen, but set out a reasonableassessment of what could be achieved if the Airport is successful in its objectives forits cargo business.
2.18 In practice, freight traffic peaked in 2000 and has declined continuously since, asshown in Table 2-2. At the interview with the airport manager it transpired that thecurrent situation for freight is disastrous. Having set up a hub at Liverpool, DHL havenow stopped all flight operations there. This is in part attributed to the lack of anytraffic associated with the current state of the automotive industry but it is also due tolow road haulage rates causing traffic to be road hauled to other airports.
TABLE 2-2 TOTAL CARGO TRAFFIC CARRIED AT LJLA
Year Freight Mail
1997 24,790 10,740
1998 24,568 11,869
1999 24,767 12,911
2000 28,628 13,239
2001 22,821 14,010
9 Airport Master Plan to 2030, page 53.
Liverpool John Lennon Airport
10
Year Freight Mail
2002 13,589 13,825
2003 11,580 12,673
2004 9,243 7,258
2005 8,521 6,272
2006 5,724 4,133
2007 3,709 0
2008 3,740 3
Source: Civil Aviation Authority
2.19 Whilst it might not have been possible to foresee it, much of the investment in freightfacilities is currently under-employed. An upturn in the economy might reverse this.
Aircraft movements
2.20 Other forecasts were produced in 2004 in relation to general aviation (air taxi and noncommercial services). The table below summarises these forecasts in relation toaircraft movements. Most non-commercial movements (about 70%) are made up ofaero club, test and training flights.
TABLE 2-3 AIRCRAFT MOVEMENTS FORECASTS - 2006-2030
YearPassenger
ATMs Cargo ATMsNon-
CommercialMovements
Total
2006 45,610 3,028 42,386 91,474
2015 104,000 5,800 52,900 162,700
2030 151,200 8,800 71,100 231,100
Source: Airport Master Plan to 2030, page 60
Rationale for ERDF intervention
Analysis of the Single Programming Document
2.21 Transport interventions were not separated from other areas of intervention in theSPD, such as jobs creation. Rather the strategy focussed on a number of ‘Priorities’ ofwhich two included transport interventions. The relevant priorities were:
Priority Three – Developing locations Priority Four – Developing Pathways Communities
2.22 Priority 3 of the SPD included a section on Transport (and Communications) andspecific references to the alignment of the transport strategy that was included in theSPD and broader European transport policy.
2.23 With respect to Pathways Communities, mentioned within Priority 4, these werecommunities identified as being subject to particular social exclusion, reduced access
Liverpool John Lennon Airport
11
to transport, and therefore without the access to jobs. It was therefore intended that theTransport programme would act as cross-cutting support for other parts of theObjective 1 programme10.
2.24 The SPD notes that “the port and airport have grown substantially in passenger andfreight handling with particular prospects in niche freight market and linkages with thelarger North West Region”. Therefore the SPD considers the LJLA a key element indeveloping export linkages and tourism and to assist in promoting and developingMerseyside’s business image 11. In addition, the Programme SWOT analysis includedin the SPD mentions a “successful and expanding airport” as a key strength of theregion.
2.25 Therefore, the SPD recognised the need to support the continued growth of LJLA byimproving passenger handling and maintenance facilities, and developing increasedstorage and freight handling capacity to meet the identified needs of local businesses.It also identified major interventions to improve airport connections with differentforms of public transport. Finally, the Programme Complement also envisages anintegration of activity between Liverpool and Manchester.
2.26 In addition, the SPD identified a problem with accessibility to the airport, it is within400m from a bus stop but it’s not within 800m from a rail station. In addition, theexpansion of the airport induced increased road traffic, generating emissions andcongestion. This is the reason why the SPD has committed itself to improving thepublic transport links to/from the airport. In particular, the SPD explicitly states that “amajor interchange facility is required at Allerton to link Liverpool Airport to the widertransport network”. This project, which became known as Liverpool South Parkwayhas now been completed.
Measures and projects
2.27 Each Priority included in the SPD includes a set of Measures; the relevant ones forthis study, respectively identified under Priority 3 and 4, are:
Measure 19: Strategic Spatial Development (SSD) Measure 24: Improving Communication
2.28 Measure 19 intends to achieve a sustainable increase in economic activity in the SSDmeasure, by encouraging actions to improve the competitiveness of Merseyside,develop economic and employment opportunities, attract new investments and supportinvestment in existing business. The primary aims are: the creation of new jobs, theimprovement of access, communication and transport links, the renewal of land andthe provision of floor-space.
2.29 Other relevant elements of this measure are the involvement of the private sector, thesearch for synergies between SSD areas and Pathways areas, and the emphasis on
10 This assertion is supported by the SPD stated objectives for improving transport for those excluded from jobs.“There is ample local evidence that reliance on public transport can constrain job or training opportunities,which is particularly relevant to residents of Pathways areas.”
11 Source: SPD Merseyside, page 45.

Liverpool John Lennon Airport
12
meeting the new employers’ business support and training needs.
2.30 Measure 24, aimed at contributing to the social and economic regeneration ofMerseyside, addresses bottlenecks and “pinch points” in the transport network, toimprove the overall competitiveness of Merseyside an increase in capacity to attractgreater visitor numbers. This measure is particularly focused on developing aneffective sustainable public transport network, improving transport routes andinterchange facilities and easing the access to regional and national networks.
2.31 As far as LJLA is concerned, the funded projects of the two measures respectivelyaimed at upgrading the infrastructures and facilities of the airport and improving theaccessibility of the site are described in detail in the next paragraph.
The future of air transport
2.32 The expansion of the LJLA is also addressed within the White Paper “The Future ofAir Transport”, issued in 2003 by the DfT. In this document, the Governmentrecognised the substantial increase in traffic that occurred between 1998 and 2003 andstated that the airport’s capacity should continue to grow to accommodate increaseddemand. It argued that this would need the expansion of terminal capacity, but that theexisting site still has land available for this. It also assumed that in future the existingrunway could be extended to 2,700 metres (from the current 2,300 metres), but thatshould not encroach on environmentally sensitive sites. The increase in noise levels isnot seen as a major problem, as the number of people affected is, and should remain infuture, very low.
2.33 As far as accessibility is concerned, the document stated that the airport needed towork with regional and local partners and surface transport providers to bring forwardsurface access enhancements, including improved public transport links.
2.34 From the analysis above, the SPD and the White Paper “The Future of Air Transport”identified the same priorities for the development of LJLA and did not show anycontradictions, except for the White Paper’s focus on passenger transport, due to thereduction in cargo volumes discussed above.
The projects
2.35 The paragraphs below describe the projects co-financed by the ERDF directly orindirectly related to the Liverpool airport. Each project has its own output and resultindicators, which will be addressed in detail below. As mentioned above, theseprojects can be split in two categories: those aimed at upgrading the infrastructuresand facilities of the airport and those targeted at improving the accessibility of the site.
Upgrading the airport
2.36 The enhancements at the LJLA supported by the ERDF in the 2000-06 programmingperiod were grouped in two projects, referred to as Airport Development Phase III andPhase IV Development. Phases I and II were addressed in the previous programmingperiod, along with other initiatives, with a total commitment of £50.1 million, ofwhich £15.7 million from the ERDF. We have requested from the airport manager abreakdown of what enhancements were included within each of the phases so that wecan better assess the particular enhancements for the 2000-2006 period, particularly
Liverpool John Lennon Airport
13
for the terminal, which has been expanded incrementally. This information was notavailable.
2.37 As shown in the table below, the projects co-financed by the ERDF in period 1994-1999 included a major expansion of the terminal, new hangars and a new controltower. This first phase of development was already extensively documented andsubject to investigation by the European Court of Auditors. It was generally said thatthese projects met the regional expectations, as the airport has witnessed anexponential growth in passenger numbers and also fit within a wider strategy forfreight transport. More recent developments in traffic should lead to freight strategybeing reconsidered.
TABLE 2-4 PROJECTS AT LJLA IN THE 1994-199 PROGRAMMING PERIOD (£)
Applicant Project Title Total Cost Public Private ERDF
MPTA12 Liverpool Airport Study 50,000 25,000 - 25,000
LiverpoolAirport Plc
Expansion of Liverpool Airport 775,286 - 387,643 387,643
LiverpoolAirport Plc
Aircraft Hangar andMaintenance Facility 4,500,000 - 2,500,000 2,000,000
LiverpoolAirport Plc
Airport Development Phase 1 10,800,000 - 6,022,756 4,777,244
LiverpoolAirport Plc
Airport Development Phase II 31,500,000 - 23,500,000 8,000,000
LiverpoolAirport Plc
New Control Tower 2,500,000 2,000,000 - 500,000
TOTAL 50,125,286 2,025,000 32,410,399 15,689,887
Source: Government Office North West
2.38 As mentioned above, the ERDF in the 2000-06 programming period supported afurther phase of development of the airport, financing projects for a total commitmentof about £34.5 million, of which £12.2 million from ERDF, as shown in the tablebelow. Works commenced in April 2004 and ended at the end of 2007.
TABLE 2-5 PROJECTS AT LJLA IN THE 2000-2006 PROGRAMMING PERIOD (£)
Applicant Project Title Total Cost Public Private ERDF
Airport Development Phase III 21,525,375 - 14,365,375 7,160,000LiverpoolAirport Plc
Phase IV Development 12,929,565 - 7,929,565 5,000,000
TOTAL 34,454,940 - 22,294,940 12,160,000
Source: Government Office North West
2.39 These projects have increased the terminal capacity of the airport from 3million to6million passengers per year, provided additional retail spaces, expanded publictransport facilities and parking provision and provided additional apron space foraircraft parking. Whilst the current facilities (44 check-in desks, 14 gates, 21
12 Merseyside Passenger Transport Authority.
Liverpool John Lennon Airport
14
passenger stands) are quantified in the Masterplan, we have been unable to obtainfrom the airport manager a similar set of metrics for the situation prior to Phase III.
The accessibility improvements
2.40 The accessibility of the airport by public transport has significantly improvedfollowing the completion of Liverpool South Parkway rail station in June 2006. Thisnew interchange, located 5km from LJLA, has a gradually-increasing pattern of extra-urban, suburban and urban services to enable passengers from various origins in theregion and outside to connect onto local bus services to LJLA. This project was co-financed by the ERDF within Measure 24; the applicant was MPTA. The total costidentified in the SPD was £36.5 million, of which £10.8 million from ERDF.
2.41 The ERDF under the same Measure also supported the setup and operation of new busroutes serving the airport. A Joblink minibus service connects the LJLA to the town ofHuyton13. The Joblink project had a total cost of £ 5 million, partially funded by theERDF (£1 million). Most routes were set up in 2006, three years after the start date ofthe project.
2.42 In addition, the ERDF co-financed the setup and operation of a high quality shuttleservice linking LJLA and the rail station of Liverpool South Parkway with the Speke /Halewood manufacturing and redevelopment sites and the Estuary Business Park. Thisinitiative had a total cost of £0.8 million, of which about £0.4 from ERDF. The routewas set up in March 2008, four years after the start date of the project.
2.43 Both the initiatives described above were managed by Merseyside PassengerTransport Authority which provides for the balance of funding resulting from theoperation of these services.
The actual outcomes (results)
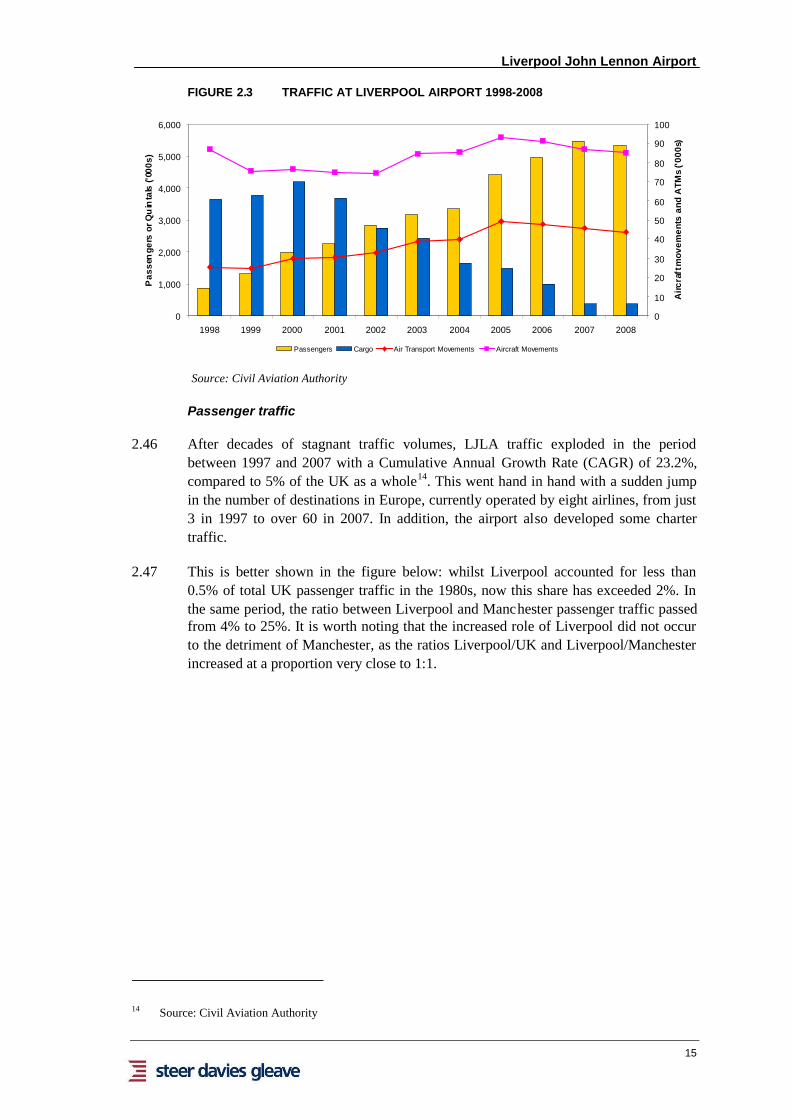
2.44 The initiatives describe above made LJLA one of the fastest growing airports in theUK over the past ten years, at least for passenger movements. The figure below showspassenger and cargo traffic, as well as aircraft movement and ATMs from 1998 to2008.
2.45 From a preliminary analysis, it is evident that the airport completely reversed itsmarket profile, abandoning the traditional role in freight and mail traffic anddeveloping enormously the new opportunities brought by the low cost carriers’ entryinto the market. In addition, the share of non-commercial movements significantlydecreased, as ATMs were in 2008 more than 50% of total movements, compared to30% in 1997.
13 For a description of Joblink, please see the Merseyside regional case study
Liverpool John Lennon Airport
15
FIGURE 2.3 TRAFFIC AT LIVERPOOL AIRPORT 1998-2008
0
1,000
2,000
3,000
4,000
5,000
6,000
1998 1999 2000 2001 2002 2003 2004 2005 2006 2007 2008
Pas
sen
gers
orQ
uin
tals
('000
s)
0
10
20
30
40
50
60
70
80
90
100
Airc
raft
mov
emen
tsan
dA
TMs
('000
s)
Passengers Cargo Air Transport Movements Aircraft Movements
Source: Civil Aviation Authority
Passenger traffic
2.46 After decades of stagnant traffic volumes, LJLA traffic exploded in the periodbetween 1997 and 2007 with a Cumulative Annual Growth Rate (CAGR) of 23.2%,compared to 5% of the UK as a whole14. This went hand in hand with a sudden jumpin the number of destinations in Europe, currently operated by eight airlines, from just3 in 1997 to over 60 in 2007. In addition, the airport also developed some chartertraffic.
2.47 This is better shown in the figure below: whilst Liverpool accounted for less than0.5% of total UK passenger traffic in the 1980s, now this share has exceeded 2%. Inthe same period, the ratio between Liverpool and Manchester passenger traffic passedfrom 4% to 25%. It is worth noting that the increased role of Liverpool did not occurto the detriment of Manchester, as the ratios Liverpool/UK and Liverpool/Manchesterincreased at a proportion very close to 1:1.
14 Source: Civil Aviation Authority
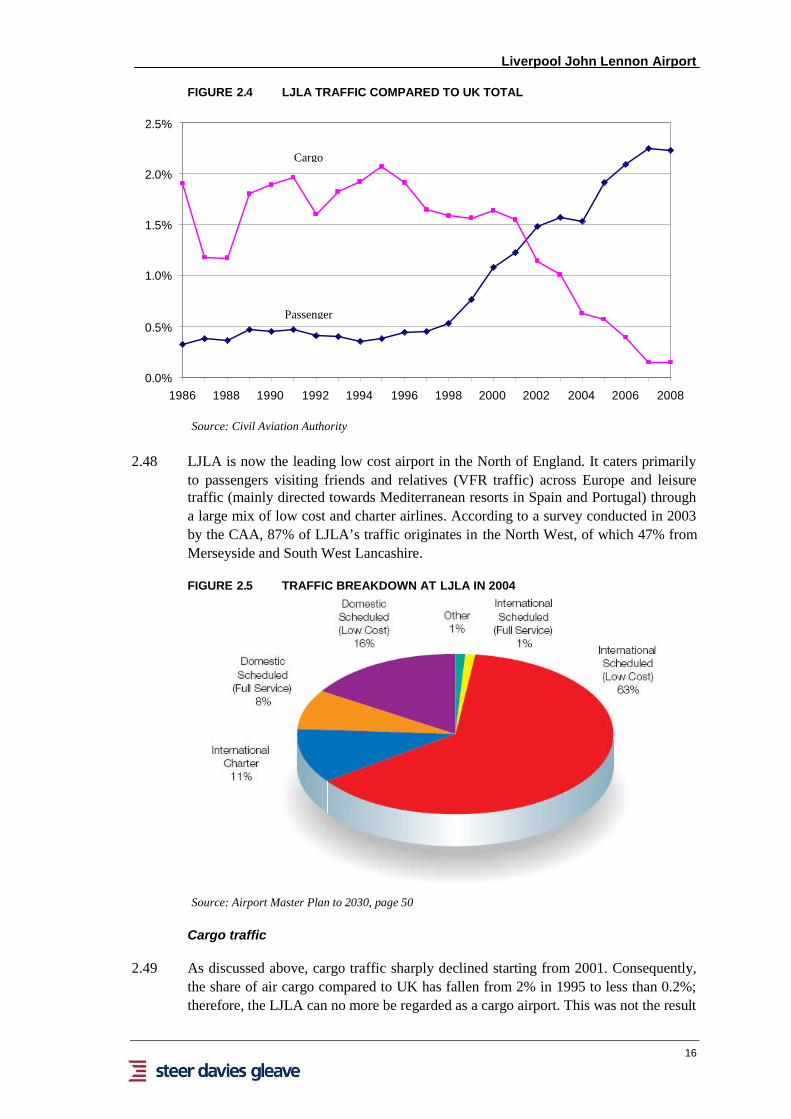
Liverpool John Lennon Airport
16
FIGURE 2.4 LJLA TRAFFIC COMPARED TO UK TOTAL
0.0%
0.5%
1.0%
1.5%
2.0%
2.5%
1986 1988 1990 1992 1994 1996 1998 2000 2002 2004 2006 2008
Source: Civil Aviation Authority
2.48 LJLA is now the leading low cost airport in the North of England. It caters primarilyto passengers visiting friends and relatives (VFR traffic) across Europe and leisuretraffic (mainly directed towards Mediterranean resorts in Spain and Portugal) througha large mix of low cost and charter airlines. According to a survey conducted in 2003by the CAA, 87% of LJLA’s traffic originates in the North West, of which 47% fromMerseyside and South West Lancashire.
FIGURE 2.5 TRAFFIC BREAKDOWN AT LJLA IN 2004
Source: Airport Master Plan to 2030, page 50
Cargo traffic
2.49 As discussed above, cargo traffic sharply declined starting from 2001. Consequently,the share of air cargo compared to UK has fallen from 2% in 1995 to less than 0.2%;therefore, the LJLA can no more be regarded as a cargo airport. This was not the result
Passenger
Cargo

Liverpool John Lennon Airport
17
of a change of strategy but rather a failure to meet the requirements of freightcustomers or to attract significant new custom.
2.50 After an abrupt fall in volumes in 2004 (-43% compared to the previous year), RoyalMail finally decided in 2006 to withdraw operations at LJLA, and so did thenewspaper traffic to Ireland. However, another courier company, which was alreadypresent in the airport, moved into the depot formerly used by Royal Mail, takingadvantage of the new handling facility for mail and express parcels to the east of theterminal. In 2008 parcels / mail traffic at about 2,500 tonnes was at 60% of the levelseen in 2006. As was noted above, our interview with the airport manager revealedthat in the face of the recession this traffic has been lost again. Total freight in 2008was at an all-time low of 3,700 tonnes.
2.51 The airport manager has stated an intention to remove some infrastructural limitations,such as the insufficient runway length, that limits the use of large air freighters. Thereare also long term plans to build a new freight terminal south of the main runway, onwhat is currently agricultural land.
Accessibility
2.52 Since 2000 LJLA has sought to improve accessibility to the airport, a task madedifficult by the fact that the airport has not, and it is unlikely to gain, direct rail access.It is also unlikely that it will have any in the future, given the geographical, land andbuilding constraints between the Airport and existing rail connections and the veryhigh cost associated with such schemes.
2.53 However, the airport has developed a number of partnerships with Merseytravel andthe local bus operators to provide a wide range of bus alternatives, also takingadvantage of the new opportunities following the opening of the new Liverpool SouthParkway rail station, and equipped the terminal with appropriate infrastructures andfacilities (stands, lay-bys, information desk and display area).
2.54 The table below shows that the share of passengers using public transport doubledbetween 1999 and 2003 and then remained stable to 2005 at 10%, but the higher shareused primarily market share taken from taxis and minicabs rather than from privatecars.
2.55 As for the employees of the airport, we have been unable to obtain the 1999 datumfrom the airport manager but the market share of the private car increased rather thandecreased between 2003 and 2005. This generates some doubts about the mediumterm effectiveness of the Joblink initiative co-financed by the ERDF, which arediscussed in the following chapter, although this phenomenon can also be put down tothe increase in terminal size and services that lead to an increase in the catchment areanot only of passengers, but also of staff.
2.56 In more general terms, the accessibility to LJLA still remains an open issue. The LJLAhas been dealing with it within a comprehensive Surface Access Strategy, but this willneed further actions and public support.
2.57 In actual fact, within the programming period 2007-13 the ERDF will finance thefurther development of bus corridors and interchange facilities in order to improve thetransport links between LJLA and the Liverpool South Parkway station (see below).
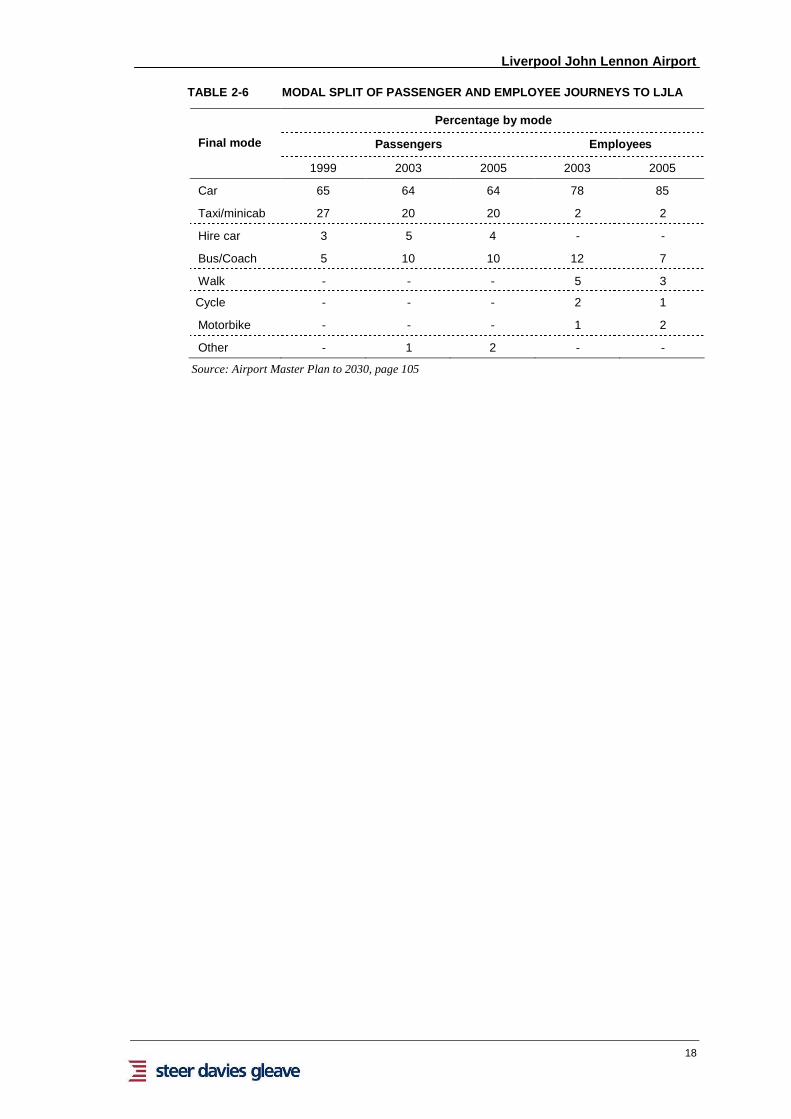
Liverpool John Lennon Airport
18
TABLE 2-6 MODAL SPLIT OF PASSENGER AND EMPLOYEE JOURNEYS TO LJLA
Percentage by mode
Passengers EmployeesFinal mode
1999 2003 2005 2003 2005
Car 65 64 64 78 85
Taxi/minicab 27 20 20 2 2
Hire car 3 5 4 - -
Bus/Coach 5 10 10 12 7
Walk - - - 5 3
Cycle - - - 2 1
Motorbike - - - 1 2
Other - 1 2 - -
Source: Airport Master Plan to 2030, page 105
Liverpool John Lennon Airport
19
3. CONCLUSIONS
Key evaluation questions
Has the investment been prepared by a sound demand analysis? Has therebeen a comparison with data on factual demand after project completion?
3.1 We did not find evidence of demand forecasts explicitly prepared in view of theinvestments financed by the ERDF and the airport manager has been unable to providethis. However, it must be said that the projects financed during the 2000-06programming period were actually the continuation of a wider initiative started in theprevious period.
3.2 In addition, as discussed in Chapter 2, the Master Plan drafted by the airport managerincludes very detailed forecasts, prepared in 2004, and also includes a generaldescription of methods and techniques used for the analysis.
3.3 As far as passenger traffic is concerned, in the absence of the current economic crisis,actual values would have probably been underestimated in the 2004 projections, as thethreshold of 5.5 mppa was almost reached in 2007, against a forecast of 6 mppa in2010.
3.4 However, passenger traffic slightly declined in 2008 by 2.5% and in the first quarter of2009 volumes actually decreased by 20% compared to 2008. If this trend will bemaintained for the rest of the year, passenger figures in 2009 may not reach 4.5 mppa.LJLA proved to be relatively more vulnerable to the current economic climate, as thedecrease was higher than UK as a whole and the nearby Manchester Airport, probablybecause its business heavily relies on low cost carriers and VFR (visiting friends andrelatives) flights which are reduced in difficult times.
3.5 With respect to cargo traffic, the optimistic forecasts prepared in 2004 and discussedin Chapter 2 are unlikely to be achieved, unless LJLA is able to identify newopportunities and new customers and some infrastructural limitations are removed.
3.6 Notwithstanding this, it is undeniable that the completion of infrastructure projects co-financed by the ERDF coincided with an exponential growth in passenger traffic andin the substantial increase of available destinations, both for scheduled and chartertraffic. In fact, the airport manager in 2007 had already planned a further expansion ofthe terminal and passenger facilities, in order to bring the maximum capacity up to 8.3mppa.
3.7 By contrast there are serious questions over whether the investments in freightfacilities have been value for money and have made any contribution to regionaldevelopment in Merseyside.
Does the contribution of the projects to regional development meet the initialexpectations?
3.8 As mentioned above, every project financed by the ERDF was accompanied by anumber of output indicators, setting a relevant target. The table below shows theoutput indicators relating to the specific interventions financed at the LJLA, the targets
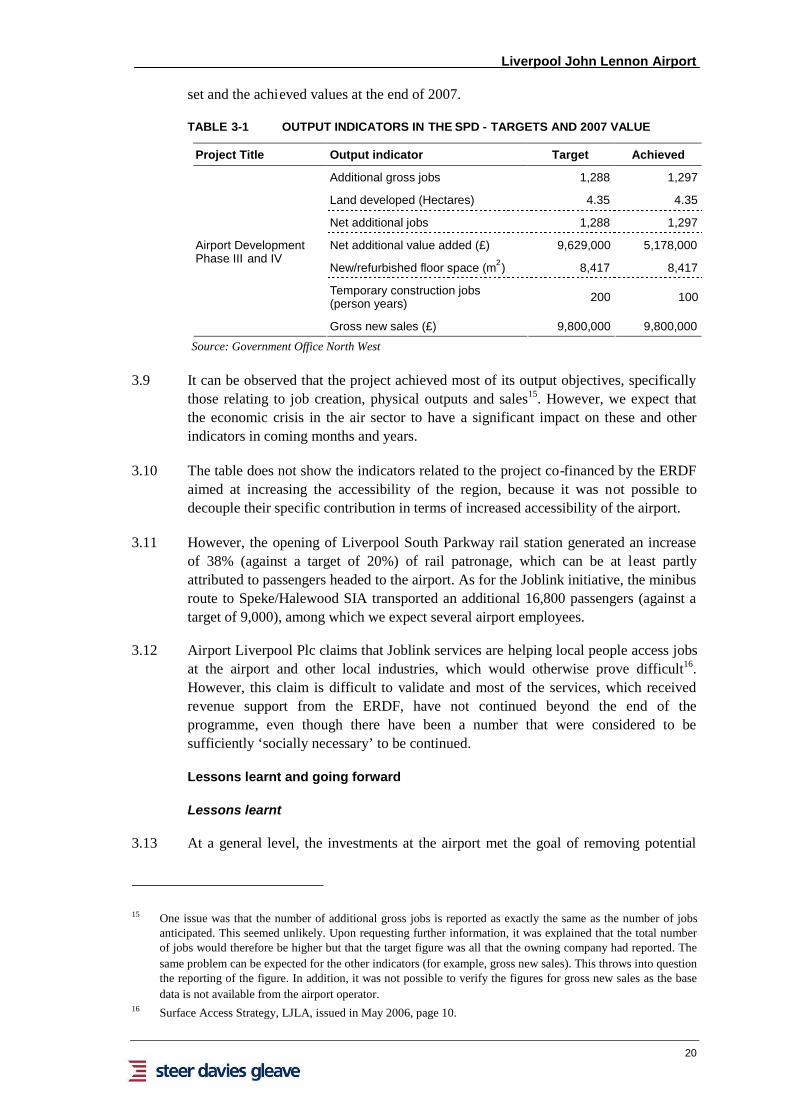
Liverpool John Lennon Airport
20
set and the achieved values at the end of 2007.
TABLE 3-1 OUTPUT INDICATORS IN THE SPD - TARGETS AND 2007 VALUE
Project Title Output indicator Target Achieved
Additional gross jobs 1,288 1,297
Land developed (Hectares) 4.35 4.35
Net additional jobs 1,288 1,297
Net additional value added (£) 9,629,000 5,178,000
New/refurbished floor space (m2) 8,417 8,417
Temporary construction jobs(person years) 200 100
Airport DevelopmentPhase III and IV
Gross new sales (£) 9,800,000 9,800,000
Source: Government Office North West
3.9 It can be observed that the project achieved most of its output objectives, specificallythose relating to job creation, physical outputs and sales15. However, we expect thatthe economic crisis in the air sector to have a significant impact on these and otherindicators in coming months and years.
3.10 The table does not show the indicators related to the project co-financed by the ERDFaimed at increasing the accessibility of the region, because it was not possible todecouple their specific contribution in terms of increased accessibility of the airport.
3.11 However, the opening of Liverpool South Parkway rail station generated an increaseof 38% (against a target of 20%) of rail patronage, which can be at least partlyattributed to passengers headed to the airport. As for the Joblink initiative, the minibusroute to Speke/Halewood SIA transported an additional 16,800 passengers (against atarget of 9,000), among which we expect several airport employees.
3.12 Airport Liverpool Plc claims that Joblink services are helping local people access jobsat the airport and other local industries, which would otherwise prove difficult16.However, this claim is difficult to validate and most of the services, which receivedrevenue support from the ERDF, have not continued beyond the end of theprogramme, even though there have been a number that were considered to besufficiently ‘socially necessary’ to be continued.
Lessons learnt and going forward
Lessons learnt
3.13 At a general level, the investments at the airport met the goal of removing potential
15 One issue was that the number of additional gross jobs is reported as exactly the same as the number of jobsanticipated. This seemed unlikely. Upon requesting further information, it was explained that the total numberof jobs would therefore be higher but that the target figure was all that the owning company had reported. Thesame problem can be expected for the other indicators (for example, gross new sales). This throws into questionthe reporting of the figure. In addition, it was not possible to verify the figures for gross new sales as the basedata is not available from the airport operator.
16 Surface Access Strategy, LJLA, issued in May 2006, page 10.
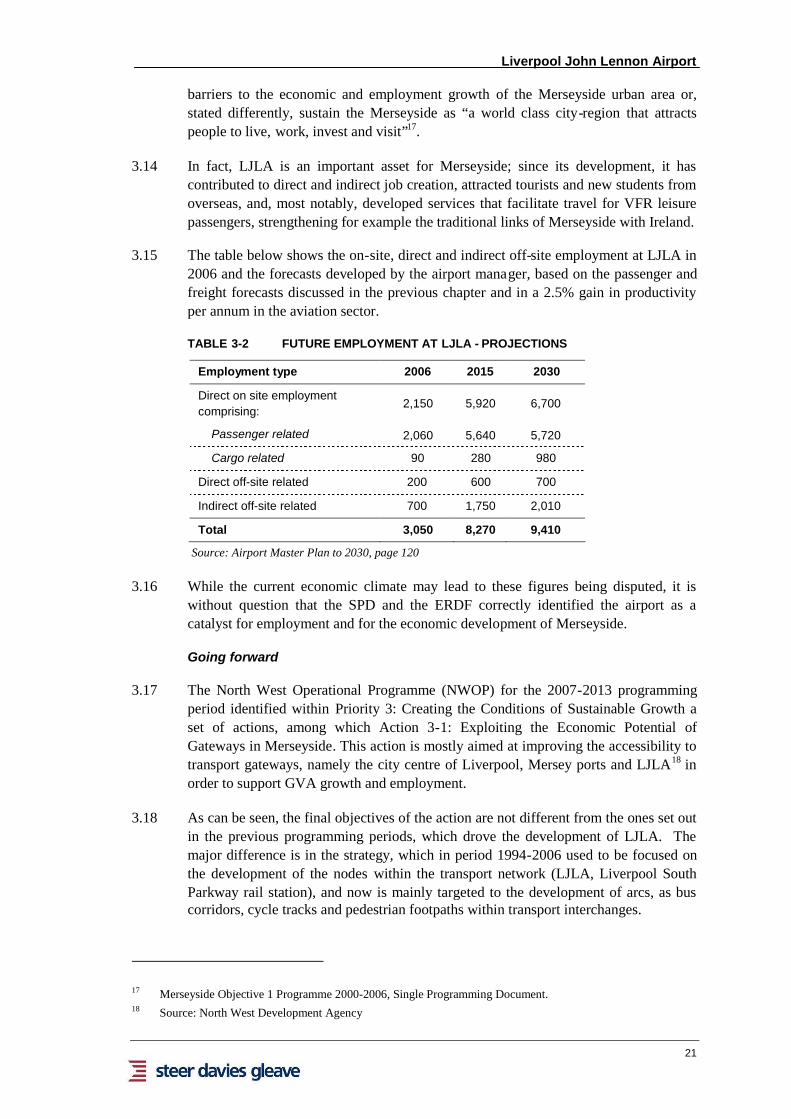
Liverpool John Lennon Airport
21
barriers to the economic and employment growth of the Merseyside urban area or,stated differently, sustain the Merseyside as “a world class city-region that attractspeople to live, work, invest and visit”17.
3.14 In fact, LJLA is an important asset for Merseyside; since its development, it hascontributed to direct and indirect job creation, attracted tourists and new students fromoverseas, and, most notably, developed services that facilitate travel for VFR leisurepassengers, strengthening for example the traditional links of Merseyside with Ireland.
3.15 The table below shows the on-site, direct and indirect off-site employment at LJLA in2006 and the forecasts developed by the airport manager, based on the passenger andfreight forecasts discussed in the previous chapter and in a 2.5% gain in productivityper annum in the aviation sector.
TABLE 3-2 FUTURE EMPLOYMENT AT LJLA - PROJECTIONS
Employment type 2006 2015 2030
Direct on site employmentcomprising:
2,150 5,920 6,700
Passenger related 2,060 5,640 5,720
Cargo related 90 280 980
Direct off-site related 200 600 700
Indirect off-site related 700 1,750 2,010
Total 3,050 8,270 9,410
Source: Airport Master Plan to 2030, page 120
3.16 While the current economic climate may lead to these figures being disputed, it iswithout question that the SPD and the ERDF correctly identified the airport as acatalyst for employment and for the economic development of Merseyside.
Going forward
3.17 The North West Operational Programme (NWOP) for the 2007-2013 programmingperiod identified within Priority 3: Creating the Conditions of Sustainable Growth aset of actions, among which Action 3-1: Exploiting the Economic Potential ofGateways in Merseyside. This action is mostly aimed at improving the accessibility totransport gateways, namely the city centre of Liverpool, Mersey ports and LJLA18 inorder to support GVA growth and employment.
3.18 As can be seen, the final objectives of the action are not different from the ones set outin the previous programming periods, which drove the development of LJLA. Themajor difference is in the strategy, which in period 1994-2006 used to be focused onthe development of the nodes within the transport network (LJLA, Liverpool SouthParkway rail station), and now is mainly targeted to the development of arcs, as buscorridors, cycle tracks and pedestrian footpaths within transport interchanges.
17 Merseyside Objective 1 Programme 2000-2006, Single Programming Document.18 Source: North West Development Agency
Liverpool John Lennon Airport
22
3.19 As far as LJLA is concerned, the NWOP allocated £4 million of ERDF co-financingto further enhance the public transport links to the airport and to upgrade transportinterchange facilities at Liverpool South Parkway rail station. Work includesimproving bus stops, creating new and upgraded bus lanes, upgrading traffic signals toenhance bus movements and upgrading pedestrian crossings.
3.20 The projects aim to reduce the variability of bus journey times, make it easier for thelocal community to access public transport and ensure that Liverpool’s bus serviceprovides a real alternative to car use19. This is essential in order to deal with theincreased car traffic generated by LJLA and to ensure that congestion does not impedeeconomic growth and the creation of job opportunities for Merseyside’s residents.
3.21 The Master Plan drafted by the airport manager still identifies some potential forERDF co-financing for infrastructure enhancements and marketing but this is notcontemplated by the new NWOP.
19 Source: North West Development Agency.

Liverpool John Lennon Airport
APPENDIX A
SCHEDULED DESTINATIONS FROM LJLA
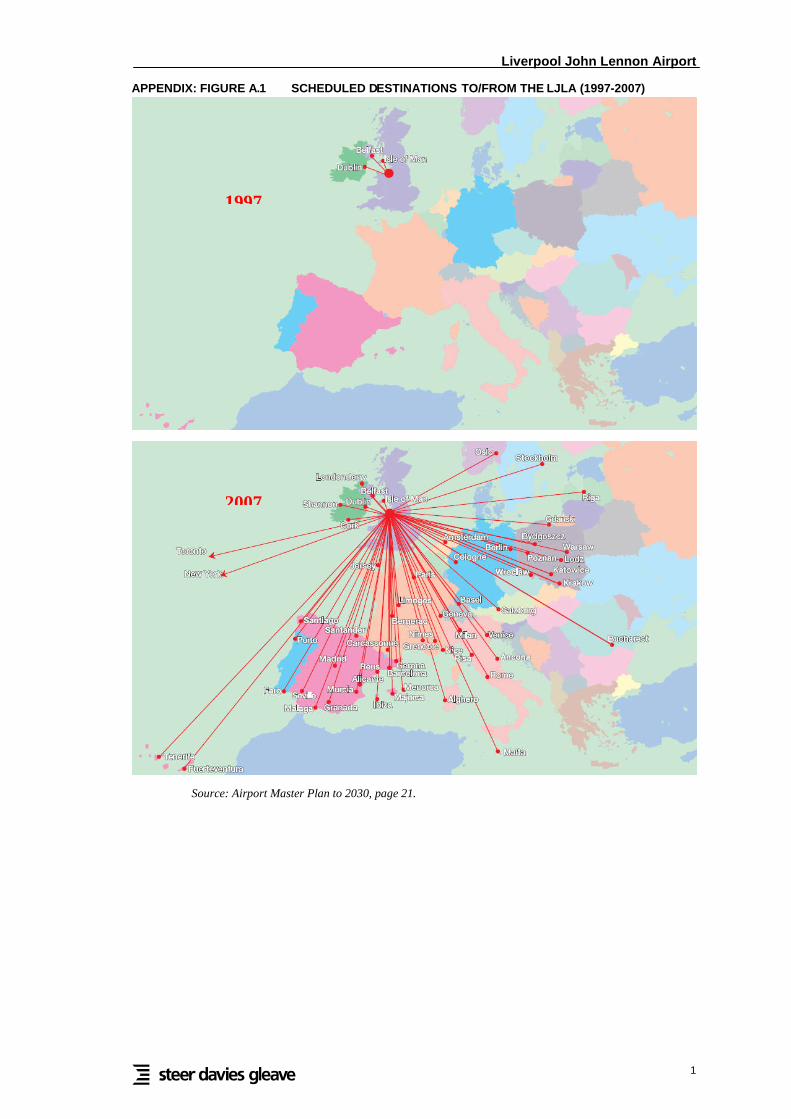
Liverpool John Lennon Airport
1
APPENDIX: FIGURE A.1 SCHEDULED DESTINATIONS TO/FROM THE LJLA (1997-2007)
Source: Airport Master Plan to 2030, page 21.
1997
2007