Embed Size (px)
Citation preview

APPENDIX B: INTEGRATED WATER AND WASTE
MANAGEMENT PLAN
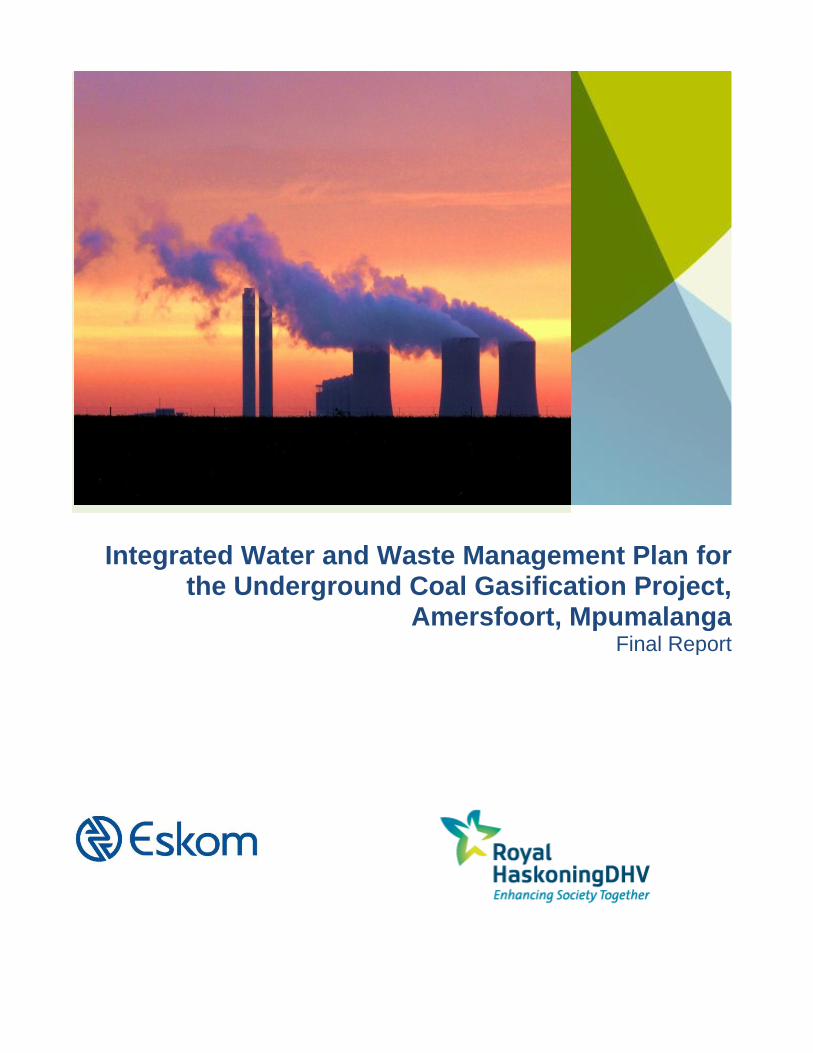
Integrated Water and Waste Management Plan for the Underground Coal Gasification Project,
Amersfoort, Mpumalanga Final Report
DOCUMENT DESCRIPTION Client:
Eskom Holdings SOC Ltd Project Name:
Integrated Water and Waste Management Plan for the Underground Coal Gasification Project, Amersfoort, Mpumalanga
Royal HaskoningDHV Reference Number:
E02.JNB.000308
Authority Reference:
DEA Ref: 14/12/16/3/3/3/61
DMR Ref: 30/5/1/1/2/10031 MR
Compiled by:
Didimalang Masoabi
Date:
29 October 2013
Location:
Johannesburg
Review & Approval: Ashwin Seetal
_____________________________
Signature
© Royal HaskoningDHV
All rights reserved.
No part of this publication may be reproduced or transmitted in any form or by any means, electronic or mechanical, without the written permission from Royal HaskoningDHV
TABLE OF CONTENTS
1 INTRODUCTION 1 1.1 ACTIVITY BACKGROUND 1 1.2 CONTACT DETAILS 1 1.3 REGIONAL SETTING AND LOCATION OF ACTIVITY 1 1.4 PROPERTY DESCRIPTION 3 1.5 PURPOSE OF IWWMP 5
2 CONTEXUTALISATION OF ACTIVITY 5 2.1 DESCRIPTION OF ACTIVITY 5 2.2 EXTENT OF THE ACTIVITY 9 2.3 KEY RELATED PROCESSES AND PRODUCTS 9 2.3.1 CONSTRUCTION PHASE 9 2.3.2 OPERATIONAL PHASE 10 2.3.3 DECOMMISSIONING PHASE 10 2.4 ACTIVITY LIFE DESCRIPTION 10 2.5 ACTIVITY INFRASTRUCTURE DESCRIPTION 11 2.6 KEY WATER USES AND WASTE STREAMS 11 2.6.1 WATER USES 11 2.6.2 WASTE STREAMS 12 2.7 ORGANISATIONAL STRUCTURE OF ACTIVITY/COMPANY 12 2.8 BUSINESS AND CORPORATE POLICIES RELATED TO THE ENVIRONMENT 12
3 REGULATORY WATER AND WASTE MANAGEMENT FRAMEWORK 14 3.1 SUMMARY OF ALL WATER USES 14 3.2 EXISTING LAWFUL WATER USES 14 3.3 RELEVANT EXEMPTIONS 14 3.4 GENERALLY AUTHORISED WATER USES 14 3.5 NEW WATER USES TO BE LICENSED 15 3.6 WASTE MANAGEMENT ACTIVITIES (NEMWA) 19 3.7 WASTE RELATED AUTHORISATIONS 19 3.8 OTHER AUTHORISATIONS AND REGULATIONS (EIAS, EMPS, RODS) 19
4 PRESENT ENVIRONMENTAL SITUATION 20 4.1 CLIMATE 20 4.1.1 REGIONAL CLIMATE 20 4.1.2 WIND 20 4.1.3 RAINFALL AND EVAPORATION 21 4.2 SURFACE WATER 22 4.2.1 WATER MANAGEMENT AREA 22 4.2.2 SURFACE WATER HYDROLOGY 24 4.2.3 SURFACE WATER QUALITY 26 4.2.4 RESOURCE CLASS AND RIVER HEALTH 28 4.2.5 RECEIVING WATER QUALITY OBJECTIVES AND RESERVE 28
4.2.6 SURFACE WATER SURVEY 28 4.2.7 SENSITIVE AREA SURVEY 28 4.3 GROUNDWATER 31 4.3.1 AQUIFER CHARACTERISATION 31 4.3.2 GROUNDWATER QUALITY 31 4.3.3 HYDRO-CENSUS 31 4.3.4 POTENTIAL POLLUTION SOURCE IDENTIFICATION 31 4.3.5 GROUNDWATER MODEL 32
5 ANALYSES AND CHARACTERISATION OF ACTIVITIES 33 5.1 SITE DELINEATION FOR CHARACTERIZATION 33 5.2 WATER AND WASTE MANAGEMENT 34 5.2.1 PROCESS WATER 34 5.2.2 WATER BALANCE 34 5.2.3 STORM WATER (CLEAN AND DIRTY WATER MANAGEMENT) 35 5.2.4 WASTE 37 5.3 OPERATIONAL MANAGEMENT 37 5.3.1 ORGANISATIONAL STRUCTURE 37 5.3.2 RESOURCES AND COMPETENCIES 37 5.3.3 INTERNAL AND EXTERNAL COMMUNICATIONS 37 5.3.4 AWARENESS TRAINING 37 5.4 MONITORING AND CONTROL 37 5.4.1 SURFACE WATER MONITORING 37 5.4.2 GROUNDWATER MONITORING 38 5.4.3 BIO MONITORING 38 5.4.4 WASTE MONITORING 38 5.5 RISK ASSESSMENT / BEST PRACTICE ASSESSMENT 38 5.6 ISSUES AND RESPONSES FROM PUBLIC PARTICIPATION 40 5.7 MATTERS REQUIRING ATTENTION / PROBLEM STATEMENT 40 5.8 ASSESSMENT OF LEVEL OF CONFIDENCE OF INFORMATION 41
6 WATER AND WASTE MANAGEMENT PLAN 41 6.1 WATER AND WASTE MANAGEMENT PHILOSOPHY 41 6.2 STRATEGIES 41 6.3 PERFORMANCE OBJECTIVES / GOALS 42 6.4 MEASURES TO ACHIEVE AND SUSTAIN PERFORMANCE OBJECTIVES 42 6.5 OPTIONS ANALYSIS AND MOTIVATION FOR IMPLEMENTATION OF PREFERRED OPTIONS 43 6.5.1 NO-OPTION PROJECT 43 6.5.2 GASIFIED ALTERNATIVES 44 6.6 IWWMP ACTION PLAN 44 6.7 CONTROL AND MONITORING 45 6.7.1 MONITORING OF CHANGE IN BASELINE (ENVIRONMENT) INFORMATION 45 6.7.2 AUDIT AND REPORT ON PERFORMANCE OF MEASURES 45 6.7.3 AUDIT AND REPORT ON RELEVANCE OF ACTION PLAN 45
7 CONCLUSIONS 46 7.1 REGULATORY STATUS OF ACTIVITY 46 7.2 STATEMENT ON WATER USES REQUIRING AUTHORISATIONS 46 7.3 MOTIVATION IN TERMS OF SECTION 27 (1) OF THE NWA 46 7.4 KEY COMMITMENTS 50
8 REFERENCES 50
Table of Figures
FIGURE 1: LOCALITY MAP 2 FIGURE 2: FARMS ASSOCIATED WITH THE UCG PROJECT 4 FIGURE 3: DIFFERENT PHASES OF THE UCG PROGRAMME 6 FIGURE 4: PROCESS FLOW FOR THE UCG 8 FIGURE 5: PRELIMENARY DESIGNS FOR THE GASIFIER 9 FIGURE 6: SCHEMATIC REPRESENTATION OF THE UCG PROCESS 11 FIGURE 7: ORGANISATIONAL STRUCTURE 13 FIGURE 8: MAP OF WATER USES ASSOCIATED WITH UCG PROJECT 18 FIGURE 9: AVERAGE MONTHLY MAXIMUM AND MINIMUM TEMPERATURE RECORDED IN THE
MAJUBA AREA (WEATHER SERVICES STATION, 2007) 20 FIGURE 10: PERIOD WIND ROSE DERIVED FROM MONITORED DATA FROM THE UCG PILOT
PLANT (2006-2007) 21 FIGURE 11: PERIOD WIND ROSE DERIVED FROM MODELED DATE SOURCED FROM THE SOUTH
AFRICAN WEATHER SERVICES (2006 – 2007) 21 FIGURE 12 MONTHLY RAINFALL FIGURES FOR MAJUBA AREA (WEATHER SERVICES STATION,
2007) 22 FIGURE 13: MAP SHOWING QUATERNARY AND SUB-CATCHMENTS (GOLDER, 2013) 23 FIGURE 14: THE 1:50 AND 1:100 YR. FLOOD LINES FOR UCG AREA (GOLDER 2013) 25 FIGURE 15: SURFACE WATER MONITORING POINTS (GOLDER, 2013) 27 FIGURE 16: TYPES OF WETLANDS WITHIN THE UCG AREA 30 FIGURE 17: WATER BALANCE 35 FIGURE 18: PROPOSED STORM WATER MANAGEMENT SYSTEM LAYOUT 36 FIGURE 19: IMPACT ASSESSMENT FOR DIFFERENT PROJECT PHASES 38 FIGURE 20: PERFORMANCE OBJECTIVES RELEVANT TO ESKOM UCG 42
List of Tables
TABLE 1: CONTACT DETAILS 1 TABLE 2: PROPERTIES ASSOCIATED WITH ESKOM UCG SITE 3 TABLE 3: POLICIES RELATED TO THE ENVIRONMENT 12 TABLE 4: ESKOM UCG WATER USES TO BE LICENCED 16 TABLE 5: SURFACE WATER MONITORING POINTS 26 TABLE 6: RESOURCE WATER QUALITY OBJECTIVES FOR GROOTDRAAI CATCHMENT 28 TABLE 7: POTENTIAL GROUNDWATER AND SURFACE WATER POLLUTION POINTS AND
MITIGATION MEASURES 32 TABLE 8: MODEL LAYERS IN RELATION TO GEOLOGY 32 TABLE 9: INDICATING VOLUMES ASSOCIATED WITH UCG 34 TABLE 10: SURFACE WATER MONITORING POINTS IN THE ESKOM UCG AREA 38 TABLE 11: MATTERS REQUIRING ATTENTION WITH RESPECT TO WATER AND WASTE
MANAGEMENT 40 TABLE 12: UCG IWWMP ACTION PLAN 44 TABLE 13: SECTION 27 MOTIVATION 46
Appendices
APPENDIX A – TITLE DEEDS
APPENDIX B – POLICIES
APPENDIX C – WASTE AGREEMENTS AND CERTIFICATES
APPENDIX D - FINAL SCOPING REPORT
APPENDIX E – FLOOD LINE REPORT
APPENDIX F – SURFACE WATER IMPACT ASSESSMENT
APPENDIX G – WETLAND STUDY
APPENDIX H – GROUNDWATER MONITORING
APPENDIX I – MAJUBA HYDROCENSUS
APPENDIX J – GROUNDWATER MODEL
APPENDIX K – STORM WATER MANAGEMENT PLAN
APPENDIX L - PP ISSUES AND COMMENTS
Page 1 RHDHV
1 INTRODUCTION
1.1 Activity Background Eskom Holdings Limited (Eskom) is mandated by the South African Government to ensure the provision of reliable and affordable power to South Africa. Eskom currently generates approximately 95% of the electricity used in South Africa. Electricity cannot be stored in large quantities and must be used as it is generated. Therefore, electricity must be generated in accordance with supply-demand requirements. In addition, increasing economic growth and social development within Southern Africa is placing a growing demand on energy supply. Underground Coal Gasification (UCG) is a process whereby coal is converted in situ to combustible gas that can be used for power generation. It is one of the cleaner coal technologies being developed for implementation by Eskom. To guarantee medium to long term energy supply, Eskom has over the past 11 years explored the concept of Underground Coal Gasification (UCG) and undertaken considerable research into UCG technology.
1.2 Contact details
TABLE 1: CONTACT DETAILS
Area of responsibility Contact details
Name of company Eskom Holdings SOC Ltd
Address
Underground Coal Gasification
Group Technology Division
Research, Test & Development
Roscherville
Telephone number 011 629 5155
Fax number 086 664 1155
General Manager
Name Barry MacColl
Telephone number 011 629 5585
Fax number 086 664 1155
1.3 Regional Setting and Location of Activity The Majuba UCG site is located about 10 km south-west of Amersfoort town and 35 km north-west of Volksrust town in Mpumalanga. The site is also located 5 km north-east of Eskom’s Majuba Power Station. The area falls within the local administrative boundaries of Pixley ka Seme Local Municipality and the Gert Sibande District Municipality.
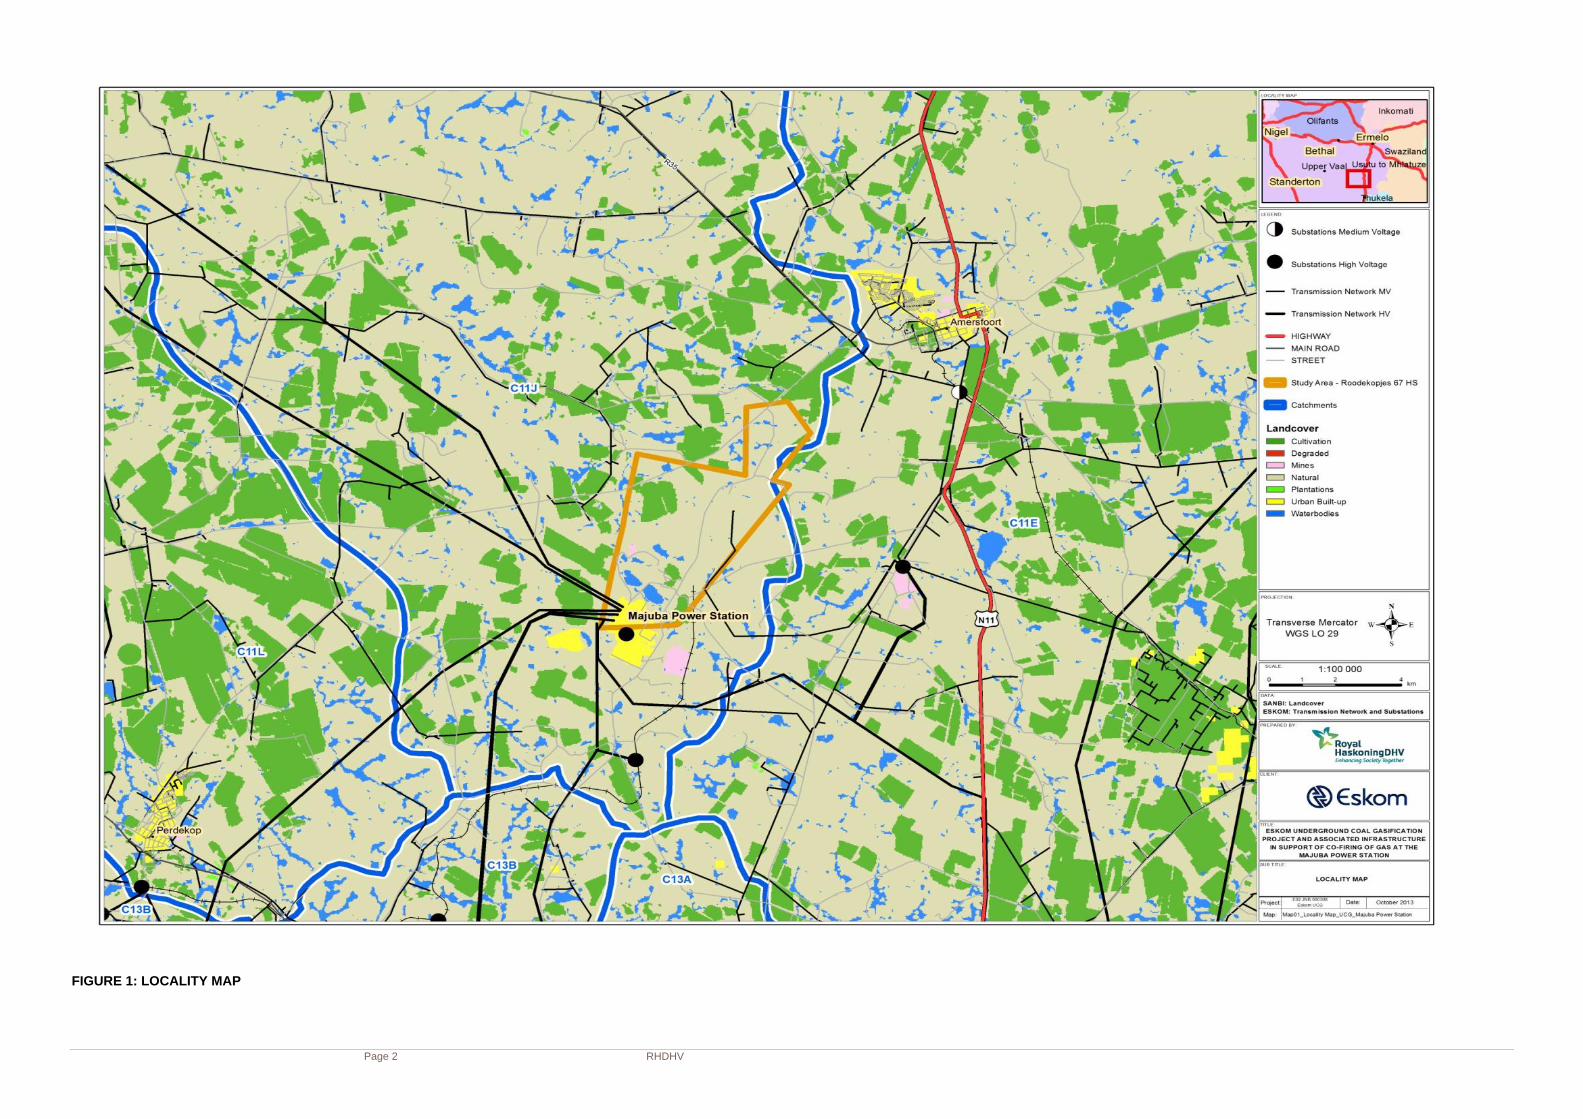
Page 2 RHDHV
FIGURE 1: LOCALITY MAP
Page 3 RHDHV
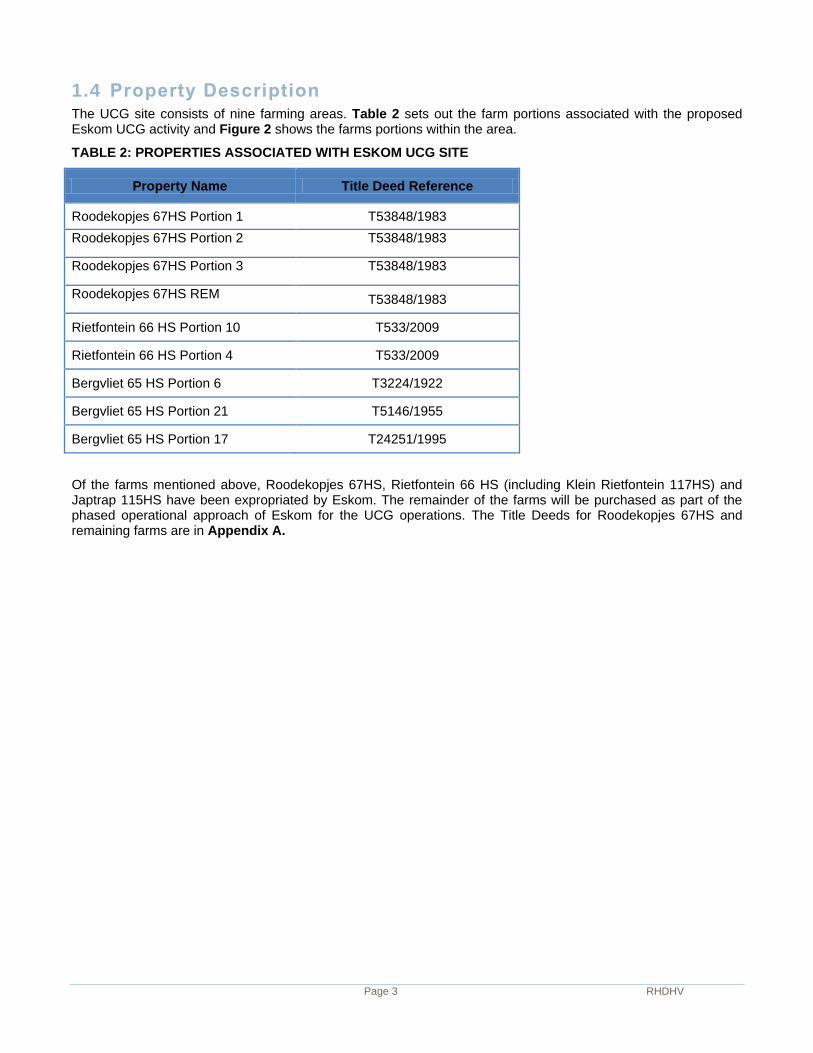
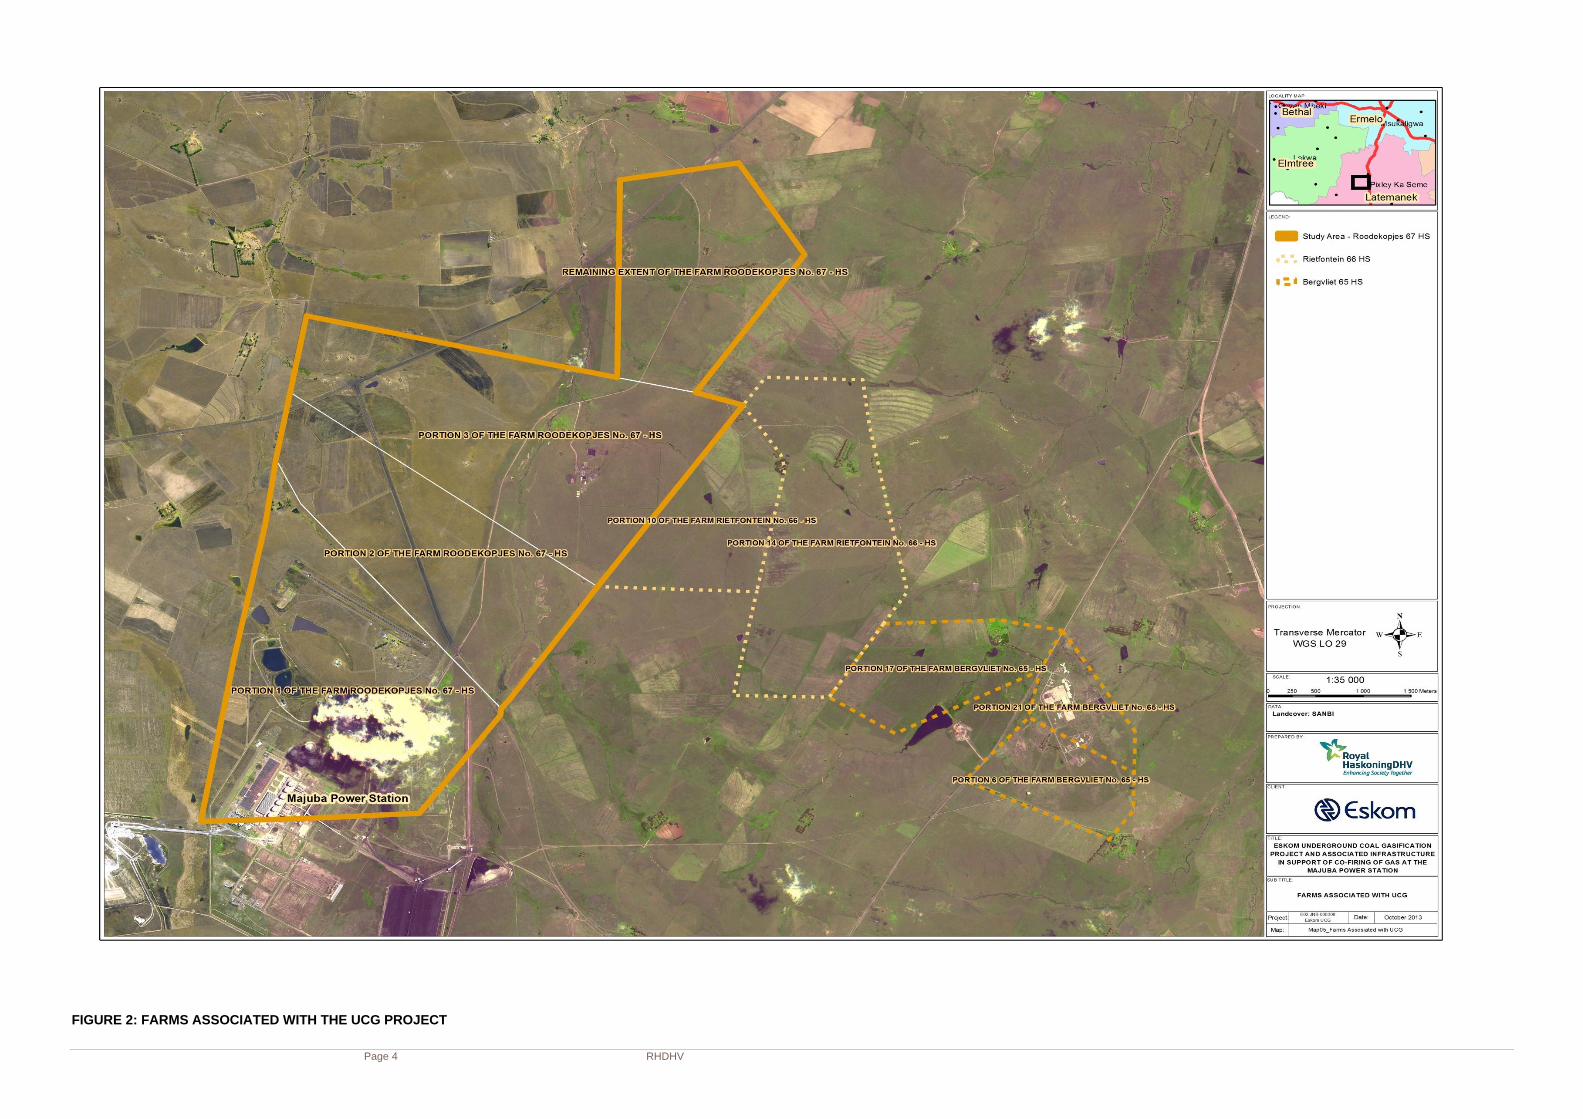
1.4 Property Description The UCG site consists of nine farming areas. Table 2 sets out the farm portions associated with the proposed Eskom UCG activity and Figure 2 shows the farms portions within the area.
TABLE 2: PROPERTIES ASSOCIATED WITH ESKOM UCG SITE
Property Name Title Deed Reference
Roodekopjes 67HS Portion 1 T53848/1983
Roodekopjes 67HS Portion 2 T53848/1983
Roodekopjes 67HS Portion 3 T53848/1983
Roodekopjes 67HS REM T53848/1983
Rietfontein 66 HS Portion 10 T533/2009
Rietfontein 66 HS Portion 4 T533/2009
Bergvliet 65 HS Portion 6 T3224/1922
Bergvliet 65 HS Portion 21 T5146/1955
Bergvliet 65 HS Portion 17 T24251/1995
Of the farms mentioned above, Roodekopjes 67HS, Rietfontein 66 HS (including Klein Rietfontein 117HS) and Japtrap 115HS have been expropriated by Eskom. The remainder of the farms will be purchased as part of the phased operational approach of Eskom for the UCG operations. The Title Deeds for Roodekopjes 67HS and remaining farms are in Appendix A.
Page 4 RHDHV
FIGURE 2: FARMS ASSOCIATED WITH THE UCG PROJECT
Page 5 RHDHV
1.5 Purpose of IWWMP An IWWMP considers the principles of integrated water resources management (IWRM) and is linked to the catchment management strategy or integrated water resources management strategy for the catchment under consideration. An IWWMP is therefore a simple, feasible, implementable plan for the envisaged activity; taking into account the National Water Resource Strategy (NWRS), the applicable Catchment Management Strategy (CMS) for the catchment in question, any established resource quality objectives (RQOs) and the sensitivity of the receiving water resource. It also considers up- and downstream cumulative impacts of the water use activities.
The plan is based on site specific actions that will be implemented over time, and is a living document that should be updated as the activities change.
The objectives of the IWWMP are therefore to:
Manage the water and waste on site in support of integrated water resources management (IWRM) by:
identifying the potential pollution sources, and
setting appropriate and effective action plans for the control of these activities and associated
impacts.
This IWWMP in summary presents:
Water uses (existing lawful, previous, exemptions and general authorisations);
Policies (safety, health, environment, water and waste);
The environmental context (surface water, ground water, soil and land capability, climate and socio-
economic environment);
A characterisation of activities (operations and methods; and waste management);
Site characterisation at facility level. The site was delineated into individual facilities for appropriate
resolution on water and waste related management as well as for improved allocation of responsibility
for the management of these aspects;
Impact assessments (methodology, potential impacts and significance, risk to the environment);
Matters requiring attention in respect of water and waste management in relation to surface water,
process water, storm water, groundwater and waste;
Performance objectives and associated measures (surface water, process water, storm water,
groundwater and waste) for the attainment of the stated performance objectives;
Environmental monitoring systems addressing process water, ground water, surface water, aquatic
health, surface rehabilitation and waste, supported by data management and reporting;
Continual improvement in terms of the above key themes forming the core of the IWWMP; and
Operational management addressing the organisational structure, awareness training and
communication on waste and water matters.
2 CONTEXUTALISATION OF ACTIVITY
2.1 Description of Activity Underground Coal Gasification (UCG) is a process whereby coal is converted in situ to combustible gas that can be used for power generation. A matrix of wells is drilled into the coal bed, the coal is ignited and air/oxygen and water is pumped into the injection wells. The underground cavity is created as the coal burns, and the boundaries of the cavern form the walls of an underground gasification reactor. The ideal requirements for UCG are generally the opposite of the requirements for conventional underground mining, and hence UCG offers opportunity for expanding South Africa’s mineable coal reserve base by extracting coal
Page 6 RHDHV
previously disregarded as being unminable. Fire is essentially used to “mine” the coal and produce syngas (a mixture of CO2, H2, CH4 and CO), which can be used directly as a fuel for either boilers or gas turbines.
As described in the Scoping Report (Eskom, 2013) in the context of a primary energy supply option for utility scale power generation, the following characteristics of UCG technology are attractive from Eskom’s perspective:
UCG mining, in conjunction with a combined cycle gas turbine power station, is potentially a cleaner
method of coal-based power generation. Once Eskom has proven the commercial feasibility, the exact
technology footprint will be compared to traditional coal power generation technologies;
The UCG process at commercial scale would likely create a large underground gas and heat storage
inventory, making the gas supply very stable and consistent;
Depending on the area and coal resource, the cavity created by UCG could provide a suitable CO2
sequestration option. This consideration is however still in an early phase and will be explored by
Eskom during further research;
A commercial scale UCG production plant is essentially made up of a number of modular underground
reactors with largely independent outputs. The coal extraction and overall gas output from the
gasification process may therefore be optimised by varying and then mixing the outputs of the
individual modules;
No ash or slag removal and handling are necessary as there is minimal particulate carry over in the
gas, and most of the solids remain underground;
The operating pressure of the underground gasifier is such that it maintains a negative hydraulic
gradient into the cavity, preventing contamination of surrounding aquifers in the underground
environment; and
Ground water influx into the gasifier creates an effective “steam jacket” around the reactor making the
heat loss in situ tolerably small.
UCG has the potential to extract coal resources previously regarded as either uneconomic or inaccessible due to depth, seam thickness, seam slope, seam fracturing and displacement, or other mining and safety considerations.
The gasification programme is to be undertaken in three phases: as indicated in Figure 3 below:
FIGURE 3: DIFFERENT PHASES OF THE UCG PROGRAMME
Ph
as
e 1
A -
Ex
plo
rati
on
fo
r c
oa
l re
se
rve
s
Exploration work carried out to determine the size
and nature of the coal reserve, located at the proposed UCG project
area.
Ph
as
e 1
B -
Te
sti
ng
ac
tivit
ies
to
d
ete
rmin
e t
he
co
al g
as
qu
ality
a
nd
co
mb
us
tio
n p
rop
ert
ies
Gas production to start from 3000 and increased
to 15000 Nm3/hr. An Eskom commissioned gas production pilot plant that
flared the first UCG gas on 20 January 2007 &
generated the first UCG electricity on 31 May 2007
with a 100 kWe reciprocating engine. Gas is initially being flared &
will eventually be co-fired in the Majuba Power
Station boilers as the work progresses.
Ph
as
e 1
C -
In
cre
as
ed
p
rod
uc
tio
n, c
o-f
irin
g t
es
tin
g
an
d e
ng
ine
eri
ng
de
sig
n
Gas production to be increased to 70000 Nm3/hr. Gas will be
produced and transported to Majuba Power Station for co-firing and further
test work will be conducted to confirm the
viability of UCG at a commercial scale.

Page 7 RHDHV
The UCG pilot plant will provide for an initial generating capacity of approximately 6 MWe, which is sufficient to co-fire a single burner at the Majuba Power Station. Pending the success of Phase 1B, gas production will be scaled up to 70000 Nm
3/hr to eventually produce 28 MWe.
The UCG process remains primarily a mining operation and the key components of the mining operation include the drilling, exploration and monitoring wells – also referred to as the gasfield. The gasfield contains two major components namely the gasifier units and ancillary infrastructure such as access roads, pipelines, manifolds etc. The continuous linkage of wells in the gasifier enables the process to access virgin coal and the monitoring and modelling of the geohydrological, rock mechanics and geological characteristics of the targeted coal seam.
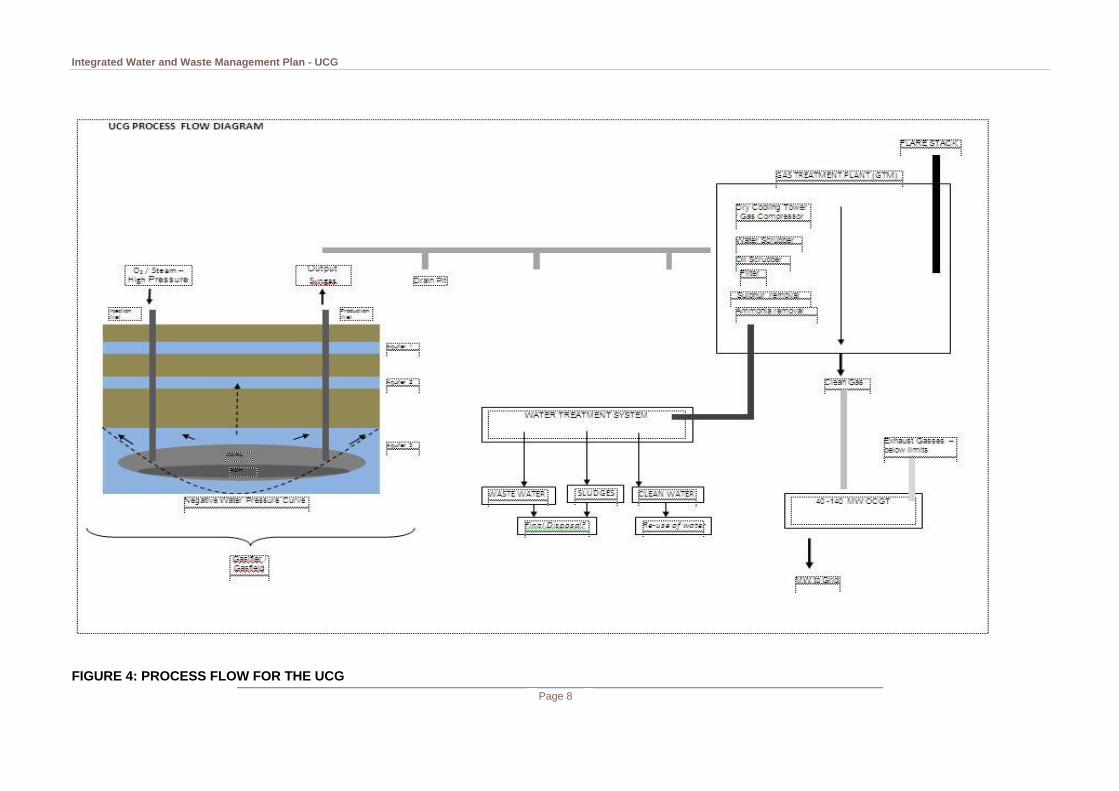
Due to the nature of the technology, the Underground Coal Gasification pilot plant will comprise a vast number of activities. A basic flow diagram for the entire process is presented in Figure 4.
Integrated Water and Waste Management Plan - UCG
Page 8
FIGURE 4: PROCESS FLOW FOR THE UCG
Integrated Water and Waste Management Plan - UCG
Page 9
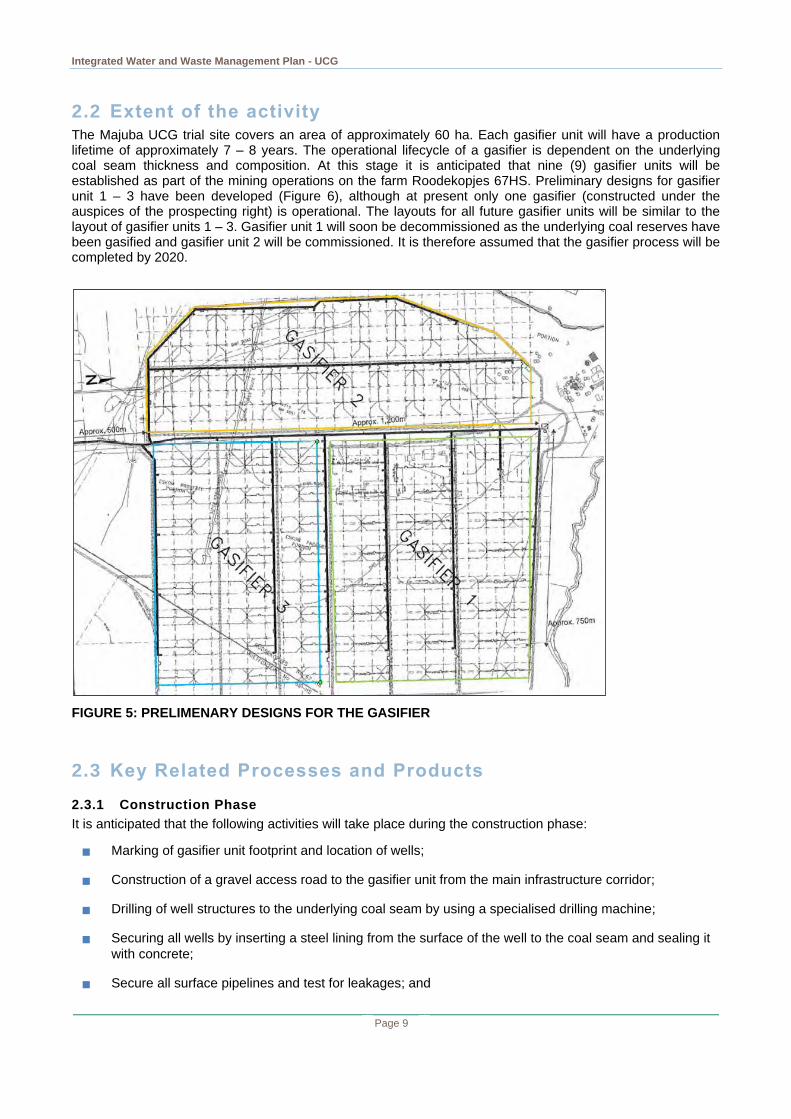
2.2 Extent of the activity The Majuba UCG trial site covers an area of approximately 60 ha. Each gasifier unit will have a production lifetime of approximately 7 – 8 years. The operational lifecycle of a gasifier is dependent on the underlying coal seam thickness and composition. At this stage it is anticipated that nine (9) gasifier units will be established as part of the mining operations on the farm Roodekopjes 67HS. Preliminary designs for gasifier unit 1 – 3 have been developed (Figure 6), although at present only one gasifier (constructed under the auspices of the prospecting right) is operational. The layouts for all future gasifier units will be similar to the layout of gasifier units 1 – 3. Gasifier unit 1 will soon be decommissioned as the underlying coal reserves have been gasified and gasifier unit 2 will be commissioned. It is therefore assumed that the gasifier process will be completed by 2020.
FIGURE 5: PRELIMENARY DESIGNS FOR THE GASIFIER
2.3 Key Related Processes and Products
2.3.1 Construction Phase
It is anticipated that the following activities will take place during the construction phase:
Marking of gasifier unit footprint and location of wells;
Construction of a gravel access road to the gasifier unit from the main infrastructure corridor;
Drilling of well structures to the underlying coal seam by using a specialised drilling machine;
Securing all wells by inserting a steel lining from the surface of the well to the coal seam and sealing it
with concrete;
Secure all surface pipelines and test for leakages; and
Integrated Water and Waste Management Plan - UCG
Page 10
Secure all additional infrastructure including the air compressor and water monitoring borehole.
2.3.2 Operational Phase
It is anticipated that the following activities will take place during the operational phase:
Commission the gasifier by commencing the sub-surface gasification reaction through high pressure air
injection;
Operate gasifier through a series of pipelines and pressure units;
Syngas to be transported via primary, secondary, and tertiary gas pipelines to the Gas Treatment Plant;
and
On-going surface and groundwater monitoring.
2.3.3 Decommissioning Phase
It is anticipated that the following activities will take place during the decommissioning phase:
Depleted underlying coal reserves will give effect to the decommissioning of a gasifier unit and the
commissioning of another gasifier unit;
Decommission the gasifier and gasification process by closing all injection wells;
Seal wells with concrete mixture;
Remove all surface infrastructure;
Rehabilitate and re-vegetate all disturbed areas; and
On-going surface and groundwater monitoring.
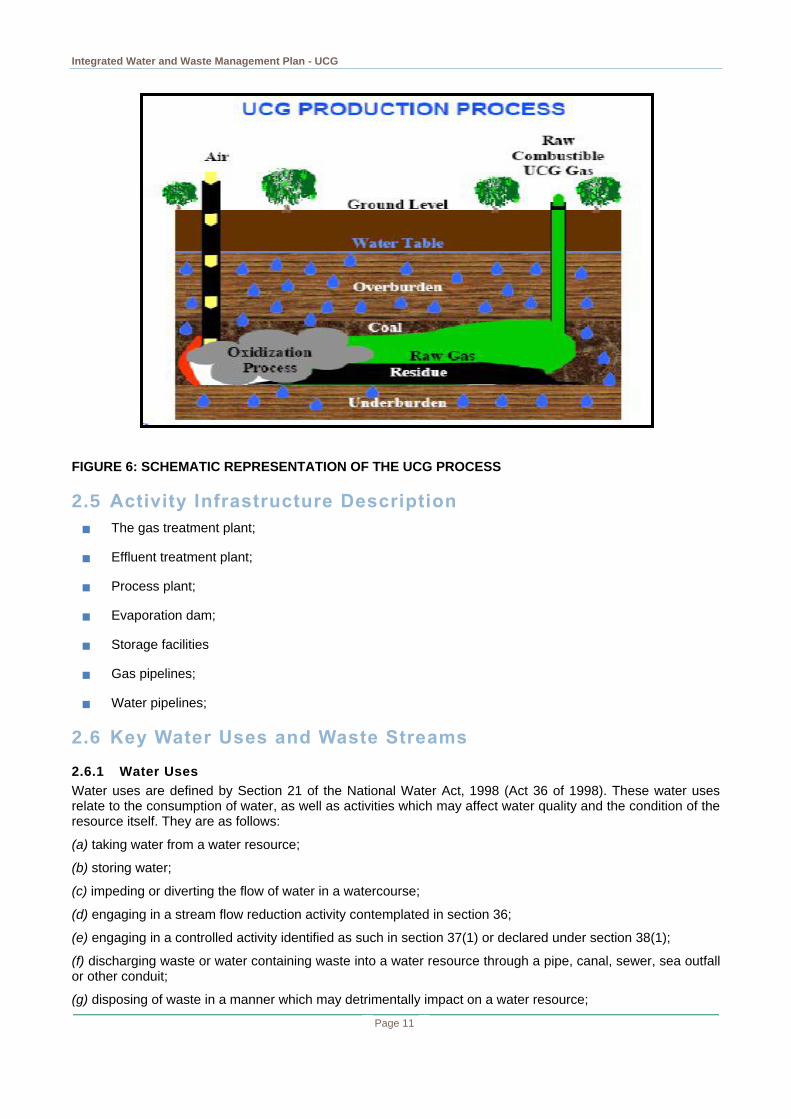
2.4 Activity Life Description The gas field will be mined for a period 7 - 8 years or until such time that the useful syngas has been exhausted by the UCG operation. This will be informed by the quality of the gas and the progress on the UCG operation. The infrastructure related to the gas extraction system (network of gas pipes will be maintained and monitored). The deep monitoring wells will be used to monitor the seepage of groundwater into the combustion void. This water will be pumped out, sampled and sent to the process effluent treatment plant. Pump out will continue at the rate of ingress. The pump out rate must also ensure there is no net outflow of the contaminated water into the regional groundwater system. The quality of this effluent has to be regularly monitored and reported on.
The gas treatment, power generation and effluent treatment plant including the evaporation dam and storage facilities will be a common feature in the overall UCG programme. There will be no mining of the underground coal reserves in the vicinity of these facilities. The process plant and associated infrastructure will be upgraded and maintained for the useful life of the mining operation which is predicted to be in the order of 40 years.
Integrated Water and Waste Management Plan - UCG
Page 11
FIGURE 6: SCHEMATIC REPRESENTATION OF THE UCG PROCESS
2.5 Activity Infrastructure Description
The gas treatment plant;
Effluent treatment plant;
Process plant;
Evaporation dam;
Storage facilities
Gas pipelines;
Water pipelines;
2.6 Key Water Uses and Waste Streams
2.6.1 Water Uses
Water uses are defined by Section 21 of the National Water Act, 1998 (Act 36 of 1998). These water uses relate to the consumption of water, as well as activities which may affect water quality and the condition of the resource itself. They are as follows:
(a) taking water from a water resource;
(b) storing water;
(c) impeding or diverting the flow of water in a watercourse;
(d) engaging in a stream flow reduction activity contemplated in section 36;
(e) engaging in a controlled activity identified as such in section 37(1) or declared under section 38(1);
(f) discharging waste or water containing waste into a water resource through a pipe, canal, sewer, sea outfall or other conduit;
(g) disposing of waste in a manner which may detrimentally impact on a water resource;
Integrated Water and Waste Management Plan - UCG
Page 12
(h) disposing in any manner of water which contains waste from, or which has been heated in any industrial or power generation process;
(i) altering the bed, banks, course or characteristics of a watercourse;
(j) removing, discharging or disposing of water found underground if it is necessary for the efficient continuation of an activity or for the safety of people; and
(k) using water for recreational purposes.
2.6.2 Waste Streams
The only production waste stream is condensate water produced during the combustion and gasification process. All condensate water will be collected in the waste-water dam for further treatment and disposal.
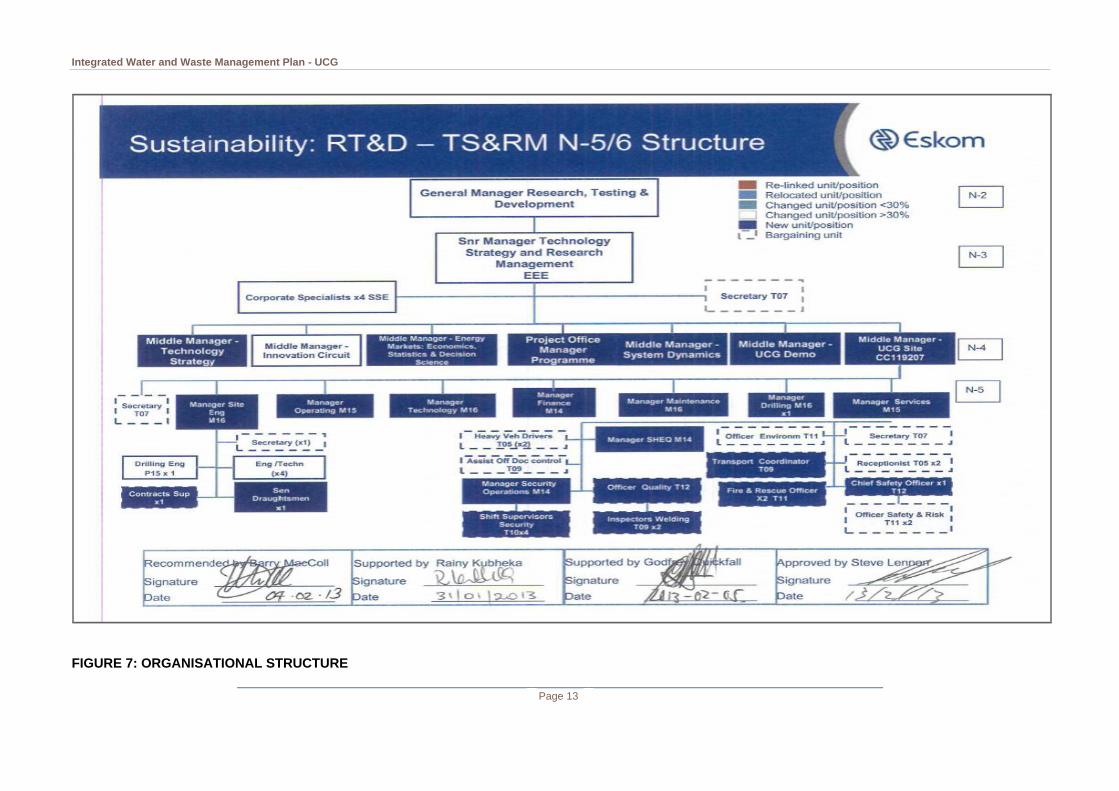
2.7 Organisational Structure of Activity/Company The roles, responsibilities and authority of personnel at Eskom UCG will be assigned to facilitate effective environmental management. Figure 7 provides an overview of the Organisational structure that is in place for Eskom UCG.
2.8 Business and Corporate Policies Related to the Environment
Eskom is committed to a corporate policy and documented approach to SHERQ as outlined in Appendix B.
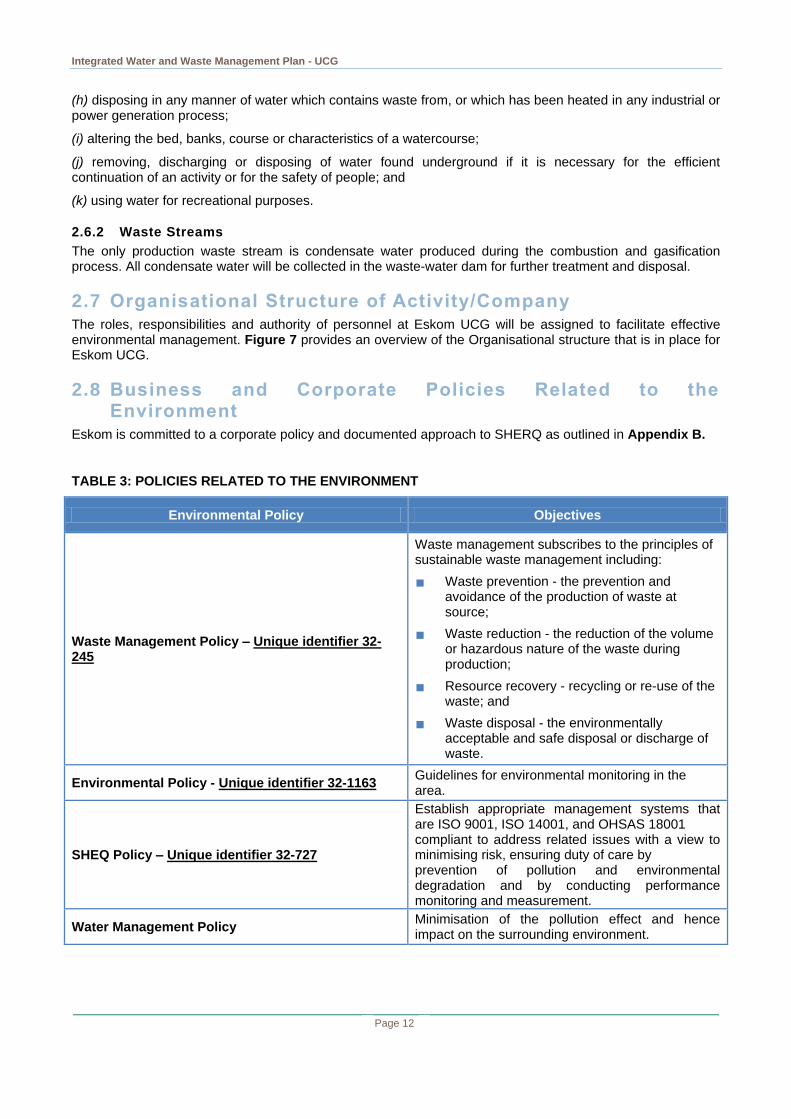
TABLE 3: POLICIES RELATED TO THE ENVIRONMENT
Environmental Policy Objectives
Waste Management Policy – Unique identifier 32-245
Waste management subscribes to the principles of sustainable waste management including:
Waste prevention - the prevention and avoidance of the production of waste at source;
Waste reduction - the reduction of the volume or hazardous nature of the waste during production;
Resource recovery - recycling or re-use of the waste; and
Waste disposal - the environmentally acceptable and safe disposal or discharge of waste.
Environmental Policy - Unique identifier 32-1163 Guidelines for environmental monitoring in the area.
SHEQ Policy – Unique identifier 32-727
Establish appropriate management systems that are ISO 9001, ISO 14001, and OHSAS 18001 compliant to address related issues with a view to minimising risk, ensuring duty of care by prevention of pollution and environmental degradation and by conducting performance monitoring and measurement.
Water Management Policy Minimisation of the pollution effect and hence impact on the surrounding environment.
Integrated Water and Waste Management Plan - UCG
Page 13
FIGURE 7: ORGANISATIONAL STRUCTURE
Integrated Water and Waste Management Plan - UCG
Page 14
3 REGULATORY WATER AND WASTE MANAGEMENT FRAMEWORK
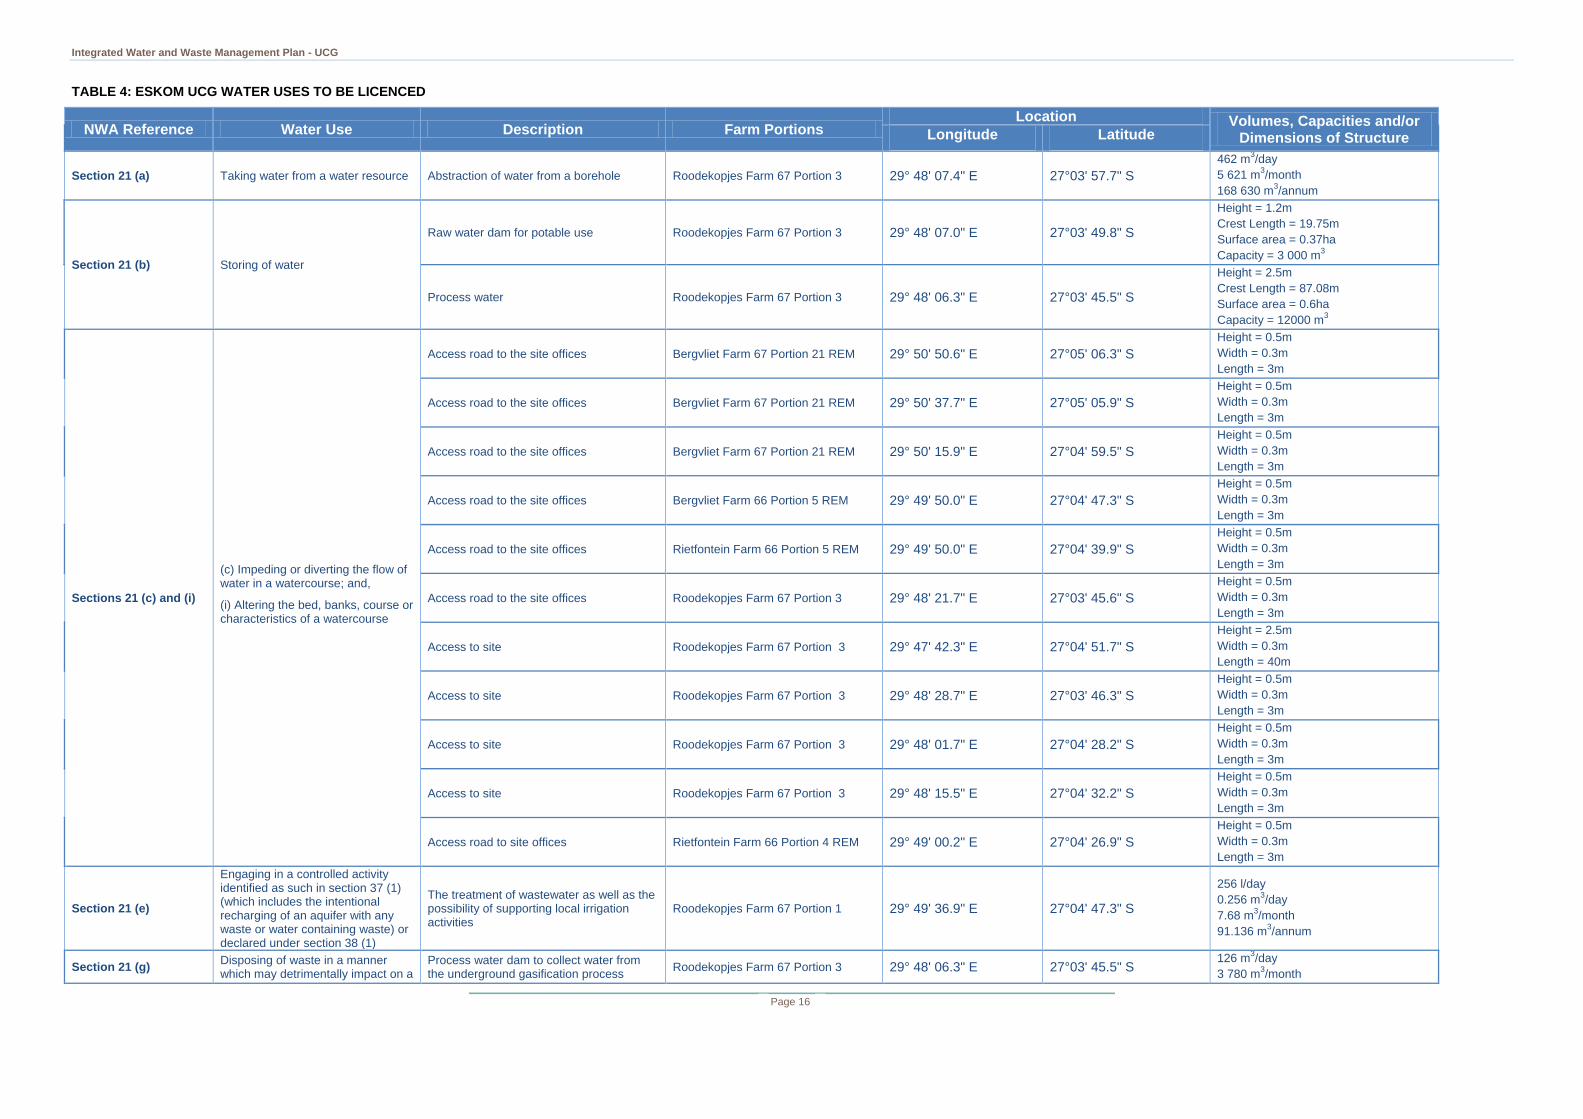
3.1 Summary of all Water Uses Based on information that is currently available, the water uses associated with Eskom UCG have been identified, and are set out Table 4 below.
3.2 Existing Lawful Water Uses In terms of Section 32 of the Act, existing lawful water use (ELU) is defined as follows:
Water use which has taken place at any time during a period of two years immediately before the date of commencement of the Act (1 October 1996 to 30 September 1998) and which was authorised by or under any law which was in force immediately before the date of commencement of this Act, or which has been declared an existing lawful water use in terms of Section 33 of the Act. Eskom UCG is a new planned operation therefore no existing lawful uses are applicable.
3.3 Relevant Exemptions In terms of Section 22(1) of the NWA a person may only use water:
(a) without a licence -
i. if that water use is permissible under Schedule 1 of the NWA;
ii. if that water use is permissible as a continuation of an existing lawful use; or
iii. if that water use is permissible in terms of a general authorisation issued under Section 39.
(b) if the water use is authorised by a licence under the NWA; or
(c) if the responsible authority, namely the Chief Director: Regulation in DWA, has dispensed with a licence
requirement.
As Eskom UCG is a new planned activity, there are no existing relevant exemptions applicable to it.
3.4 Generally Authorised Water Uses In terms of Section 22(1) of the NWA a person may use water without a licence if that water use is permissible in terms of a General Authorisation (GA) issued under Section 39 of the Act.
An assessment was done of the General Authorisations under the NWA, namely:
General Authorisation No. 399, dated 26 March 2004 in terms of Sections 21 (a), (b), (e), (f) (g) and (h)
water uses;
General Authorisation No. 398, dated 26 March 2004 in terms of Section 21 (j) water use;
General Authorisation No. 1199, dated 18 December 2009 in terms of Sections 21 (c) and (i) water
uses; and
General Authorisation No. 1198, dated 18 December 2009 in terms of Sections 21(c) and (i) for the
purpose of rehabilitating a wetland for conservation purposes.
The conclusion was that there is no water uses associated with Eskom UCG that could be considered as
General Authorisations.
Integrated Water and Waste Management Plan - UCG
Page 15
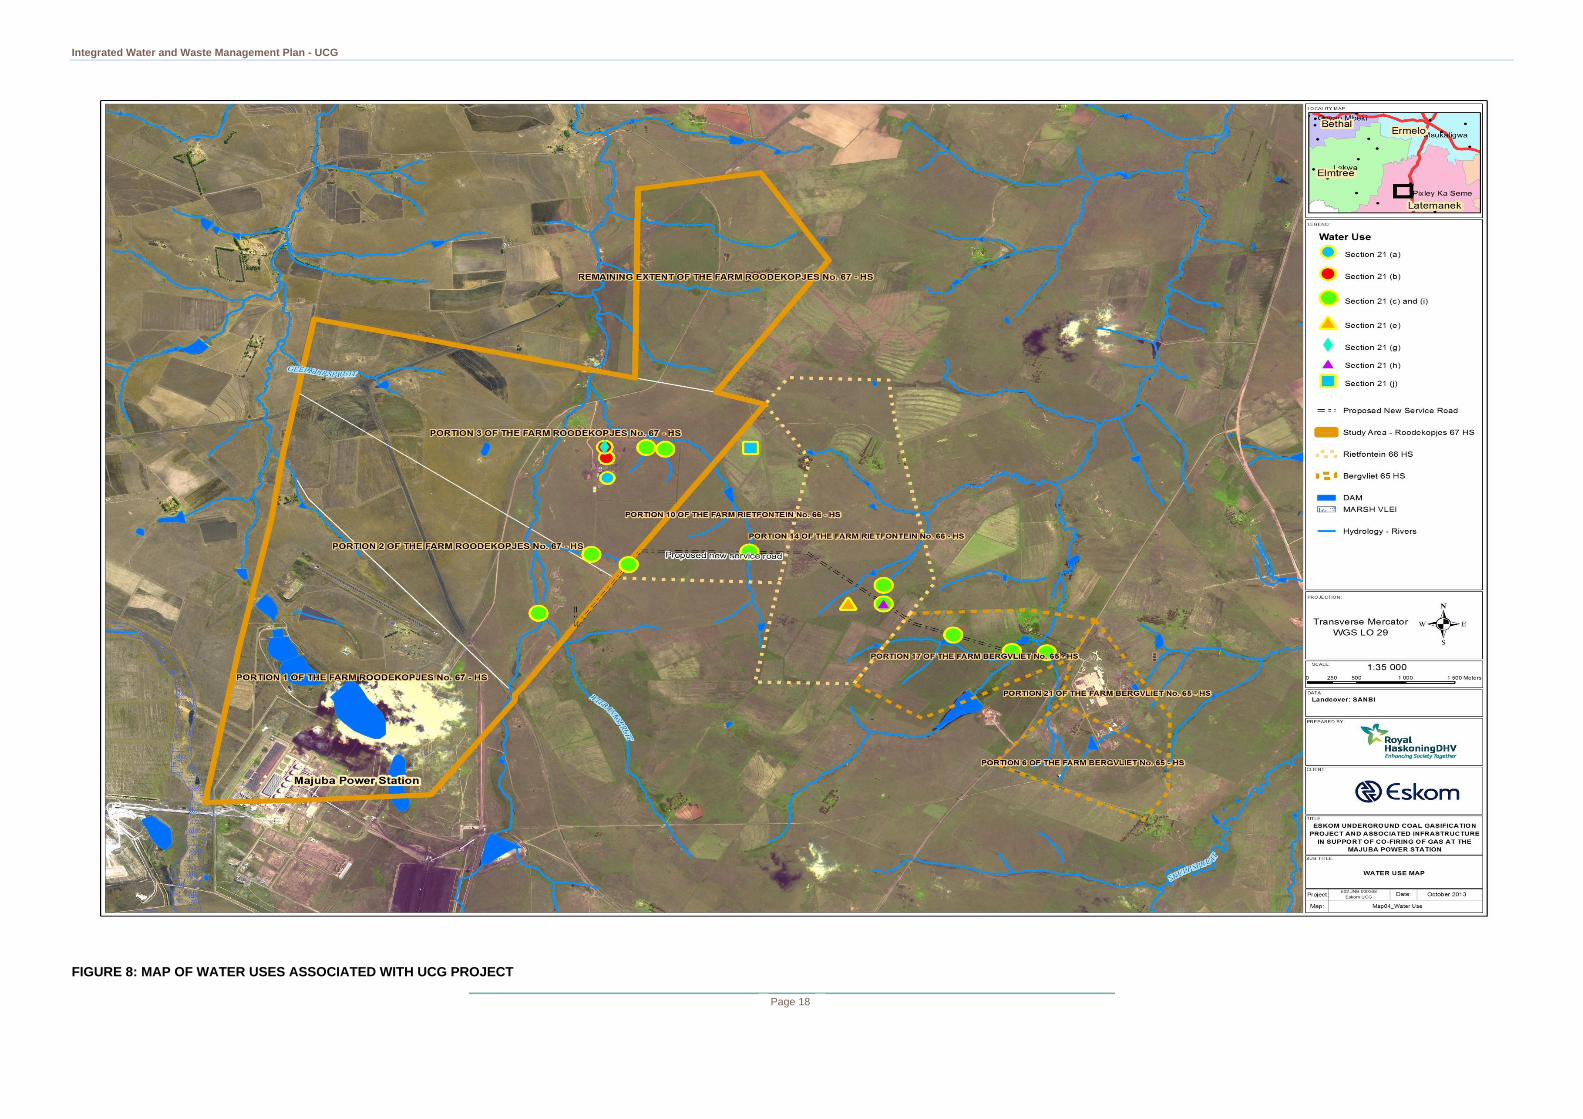
3.5 New Water Uses to be Licensed All the water uses associated with Eskom UCG are new water uses, and will therefore form part of the IWUL application submitted with this IWWMP. The water uses are set out in Table 4 and indicated in Figure 8.
Integrated Water and Waste Management Plan - UCG
Page 16
TABLE 4: ESKOM UCG WATER USES TO BE LICENCED
NWA Reference Water Use Description Farm Portions Location Volumes, Capacities and/or
Dimensions of Structure Longitude Latitude
Section 21 (a) Taking water from a water resource Abstraction of water from a borehole Roodekopjes Farm 67 Portion 3 29° 48' 07.4" E 27°03' 57.7" S
462 m3/day
5 621 m3/month
168 630 m3/annum
Section 21 (b) Storing of water
Raw water dam for potable use Roodekopjes Farm 67 Portion 3 29° 48' 07.0" E 27°03' 49.8" S
Height = 1.2m
Crest Length = 19.75m
Surface area = 0.37ha
Capacity = 3 000 m3
Process water Roodekopjes Farm 67 Portion 3 29° 48' 06.3" E 27°03' 45.5" S
Height = 2.5m
Crest Length = 87.08m
Surface area = 0.6ha
Capacity = 12000 m3
Sections 21 (c) and (i)
(c) Impeding or diverting the flow of water in a watercourse; and,
(i) Altering the bed, banks, course or characteristics of a watercourse
Access road to the site offices Bergvliet Farm 67 Portion 21 REM 29° 50' 50.6" E 27°05' 06.3" S
Height = 0.5m
Width = 0.3m
Length = 3m
Access road to the site offices Bergvliet Farm 67 Portion 21 REM 29° 50' 37.7" E 27°05' 05.9" S
Height = 0.5m
Width = 0.3m
Length = 3m
Access road to the site offices Bergvliet Farm 67 Portion 21 REM 29° 50' 15.9" E 27°04' 59.5" S
Height = 0.5m
Width = 0.3m
Length = 3m
Access road to the site offices Bergvliet Farm 66 Portion 5 REM 29° 49' 50.0" E 27°04' 47.3" S
Height = 0.5m
Width = 0.3m
Length = 3m
Access road to the site offices Rietfontein Farm 66 Portion 5 REM 29° 49' 50.0" E 27°04' 39.9" S
Height = 0.5m
Width = 0.3m
Length = 3m
Access road to the site offices Roodekopjes Farm 67 Portion 3 29° 48' 21.7" E 27°03' 45.6" S
Height = 0.5m
Width = 0.3m
Length = 3m
Access to site Roodekopjes Farm 67 Portion 3 29° 47' 42.3" E 27°04' 51.7" S
Height = 2.5m
Width = 0.3m
Length = 40m
Access to site Roodekopjes Farm 67 Portion 3 29° 48' 28.7" E 27°03' 46.3" S
Height = 0.5m
Width = 0.3m
Length = 3m
Access to site Roodekopjes Farm 67 Portion 3 29° 48' 01.7" E 27°04' 28.2" S
Height = 0.5m
Width = 0.3m
Length = 3m
Access to site Roodekopjes Farm 67 Portion 3 29° 48' 15.5" E 27°04' 32.2" S
Height = 0.5m
Width = 0.3m
Length = 3m
Access road to site offices Rietfontein Farm 66 Portion 4 REM 29° 49' 00.2" E 27°04' 26.9" S
Height = 0.5m
Width = 0.3m
Length = 3m
Section 21 (e)
Engaging in a controlled activity identified as such in section 37 (1) (which includes the intentional recharging of an aquifer with any waste or water containing waste) or declared under section 38 (1)
The treatment of wastewater as well as the possibility of supporting local irrigation activities
Roodekopjes Farm 67 Portion 1 29° 49' 36.9" E 27°04' 47.3" S
256 l/day
0.256 m3/day
7.68 m3/month
91.136 m3/annum
Section 21 (g) Disposing of waste in a manner which may detrimentally impact on a
Process water dam to collect water from the underground gasification process
Roodekopjes Farm 67 Portion 3 29° 48' 06.3" E 27°03' 45.5" S 126 m
3/day
3 780 m3/month
Integrated Water and Waste Management Plan - UCG
Page 17
NWA Reference Water Use Description Farm Portions Location Volumes, Capacities and/or Dimensions of Structure water resource 45 990 m
3/annum
Section 21 (h)
Disposing in any manner of water which contains waste from, or which has been heated in, any industrial or power generation process
Linked to the gasification process Roodekopjes Farm 67 Portion 3 29° 49' 50.0" E 27°04' 47.3" S
126 m3/day
3 780 m3/month
45 990 m3/annum
Section 21 (j)
Removing, discharging or disposing of water found underground if it is necessary for the efficient continuation of an activity or for the safety of people
Removal of water from underground during the gasification process
Roodekopjes Farm 67 Portion 3 29° 48' 60.3" E 27°03' 45.5" S
130 m3/day
3 900 m3/month
47 450 m3/annum
Integrated Water and Waste Management Plan - UCG
Page 18
FIGURE 8: MAP OF WATER USES ASSOCIATED WITH UCG PROJECT
Integrated Water and Waste Management Plan - UCG
Page 19
3.6 Waste Management Activities (NEMWA) Waste is regulated under the National Environmental Management Waste Act, Act No. 59 of 2008 (NEMWA).
NEMWA defines "waste" as the following: “any substance, whether or not that substance can be reduced, re-used, recycled and recovered:
(a) That is surplus, unwanted, rejected, discarded, abandoned or disposed of;
(b) Which the generator has no further use of for (the purposes of production);
(c) That must be treated or disposed of; or
(d) That is identified as a waste by the Minister by notice in the Gazette, and includes waste generated by
the mining, medical or other sector, but
(i) A by-product is not considered waste; and
(ii) Any portion of waste, once re-used, recycled and recovered, ceases to be waste;”
However, NEMWA does not apply to the following:
Radioactive waste that is regulated by the Hazardous Substances Act. 1973 (Act No. 15 of 1973), the
National Nuclear Regulatory Act, 1999 (Act No. 47 of 1999), and the Nuclear Energy Act, 1999 (Act No.
46 of 1999);
Residue deposits and residue stockpiles that are regulated under the Mineral and Petroleum
Resources Development Act, 2002 (Act No. 28 of 2002). Therefore the Waste Act is not applicable to
the stockpiles;
The disposal of explosives that is regulated by the Explosives Act, 2003 (Act No. 15 of 2003); or
The disposal of animal carcasses that is regulated by the Animal Health Act, 2002 (Act No. 7 of 2002).
It is anticipated that the NEMWA waste that will be generated during the planned life of the mine will include both domestic and hazardous waste.
All general household waste, garden / organic waste and salvageable items will be regarded as general waste.
All hydrocarbons (e.g. used oil, diesel spillage), empty chemical containers, and oil-contaminated soil will be regarded as hazardous waste and will be recycled, reused, treated or disposed.
3.7 Waste Related Authorisations Based on the currently available information, RHDHV is in the process of applying for an Integrated Waste License on behalf of Eskom UCG. Domestic waste generated on-site is transported to Majuba Power Station for disposal at their registered disposal site. Hazardous waste is taken to Holfontein for safe disposal. EnviroServe is the service provider for disposing off the hazardous waste. See Appendix C for agreements and waste permits.
3.8 Other Authorisations and Regulations (EIAs, EMPs, RODs)
A New Order Prospecting right was granted in 2005 (F/2005/03/11/0001) by Department of Minerals
and Energy (DME). An extension application was lodged in November 2008.
Environmental Authorisation in terms of the Environmental Conservation Act (Act 73 of 1989) was
granted by the Mpumalanga Department of Agriculture and Land Administration in 2005, for the
construction of a 7 km gas pipeline between the Majuba Coalfields and Majuba Power Station - (Ref
17.2.1EV1).
Exemption from conducting an EIA, in terms of section 22 of the Environmental Conservation Act (Act
73 of 1989) was granted by the Mpumalanga Department of Agriculture and Land Administration in
2005, for the construction of a 7 km gas pipeline between the Majuba Coalfields and Majuba Power
Station (Ref 17.2.1EV1).
Integrated Water and Waste Management Plan - UCG
Page 20
Exemption from the requirements of sections 9 and 12 of the Atmospheric Pollution Prevention Act (Act
45 of 1965) granted by the Department of Environmental Affairs and Tourism in 2005 (Ref 23/4/2/1448).
However, this exemption lapsed when the National Environmental Management: Air Quality Act (No 39
of 2004) came into effect.
Renewal of the prospecting rights on 24 February 2009 (MP30/5/1/1/2/1144 PR) issued by the DME –
now Department of Mineral Resources (DMR).
Final Environmental Scoping Report for the 40 – 140MW Open Cycle Gas Turbine (OCGT) power plant
was accepted by the Department of Environmental Affairs (DEA) in March 2010. See Appendix D for
the report. The EIA process initiated under the EIA Regulations (2006) has subsequently lapsed, hence
the new integrated application for authorisation lodged in terms of the EIA Regulations (2010) and the
NEM: Waste Act (No 59 of 2008).
A new mining right application has been lodged and accepted by the DMR for the farm Roodekopjes
67HS (Portions 1, 2, 3 and the remaining extent) – Ref 30/5/1/1/2/10031.
4 PRESENT ENVIRONMENTAL SITUATION
4.1 Climate
4.1.1 Regional Climate
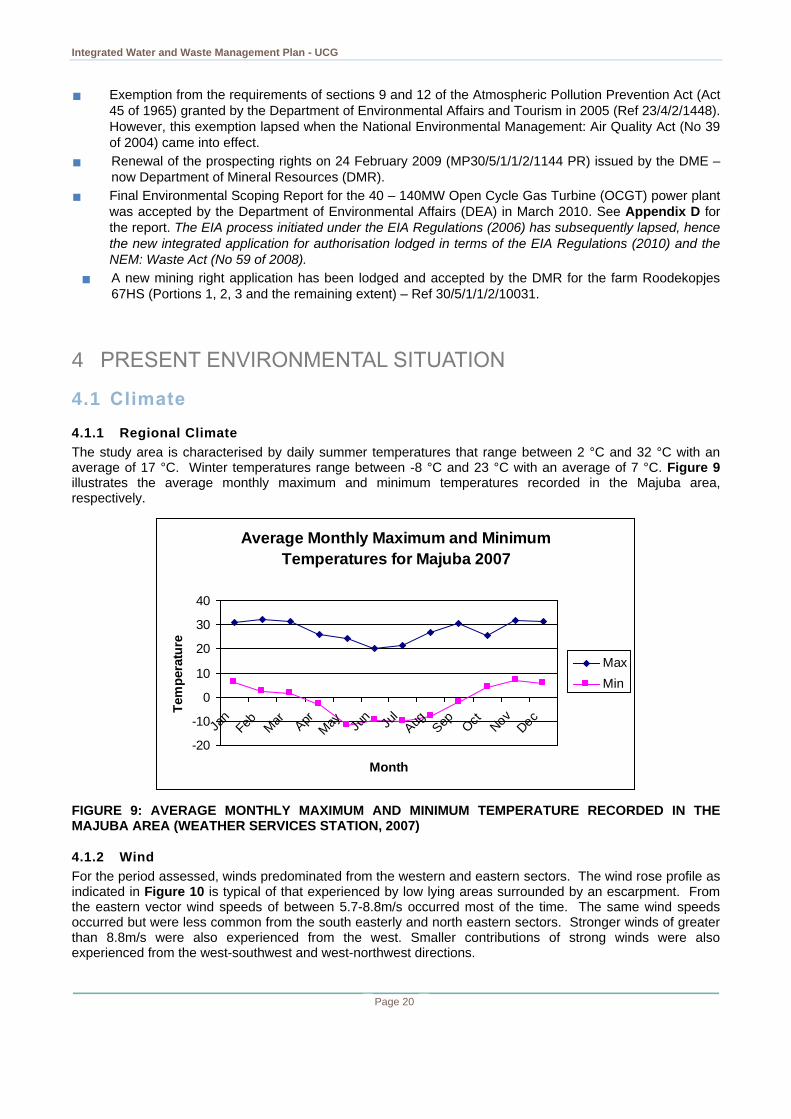
The study area is characterised by daily summer temperatures that range between 2 °C and 32 °C with an average of 17 °C. Winter temperatures range between -8 °C and 23 °C with an average of 7 °C. Figure 9 illustrates the average monthly maximum and minimum temperatures recorded in the Majuba area, respectively.
FIGURE 9: AVERAGE MONTHLY MAXIMUM AND MINIMUM TEMPERATURE RECORDED IN THE MAJUBA AREA (WEATHER SERVICES STATION, 2007)
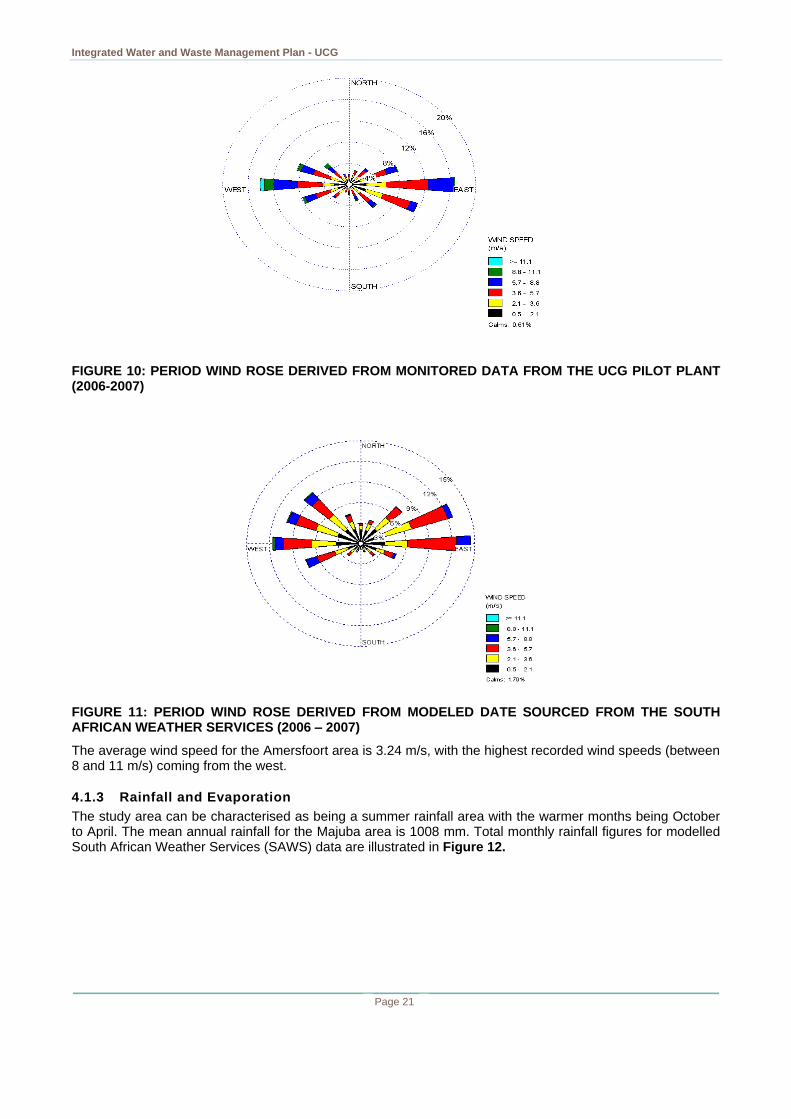
4.1.2 Wind
For the period assessed, winds predominated from the western and eastern sectors. The wind rose profile as indicated in Figure 10 is typical of that experienced by low lying areas surrounded by an escarpment. From the eastern vector wind speeds of between 5.7-8.8m/s occurred most of the time. The same wind speeds occurred but were less common from the south easterly and north eastern sectors. Stronger winds of greater than 8.8m/s were also experienced from the west. Smaller contributions of strong winds were also experienced from the west-southwest and west-northwest directions.
Average Monthly Maximum and Minimum
Temperatures for Majuba 2007
-20
-10
0
10
20
30
40
Jan
Feb Mar A
pr
May Ju
nJu
lAug
Sep O
ctNov
Dec
Month
Tem
pera
ture
Max
Min
Integrated Water and Waste Management Plan - UCG
Page 21
FIGURE 10: PERIOD WIND ROSE DERIVED FROM MONITORED DATA FROM THE UCG PILOT PLANT (2006-2007)
FIGURE 11: PERIOD WIND ROSE DERIVED FROM MODELED DATE SOURCED FROM THE SOUTH AFRICAN WEATHER SERVICES (2006 – 2007)
The average wind speed for the Amersfoort area is 3.24 m/s, with the highest recorded wind speeds (between 8 and 11 m/s) coming from the west.
4.1.3 Rainfall and Evaporation
The study area can be characterised as being a summer rainfall area with the warmer months being October to April. The mean annual rainfall for the Majuba area is 1008 mm. Total monthly rainfall figures for modelled South African Weather Services (SAWS) data are illustrated in Figure 12.
Integrated Water and Waste Management Plan - UCG
Page 22
FIGURE 12 MONTHLY RAINFALL FIGURES FOR MAJUBA AREA (WEATHER SERVICES STATION, 2007)
The catchment within which this UCG operation falls is one where the rate of evaporation is in excess of precipitation.
4.2 Surface Water
4.2.1 Water Management Area
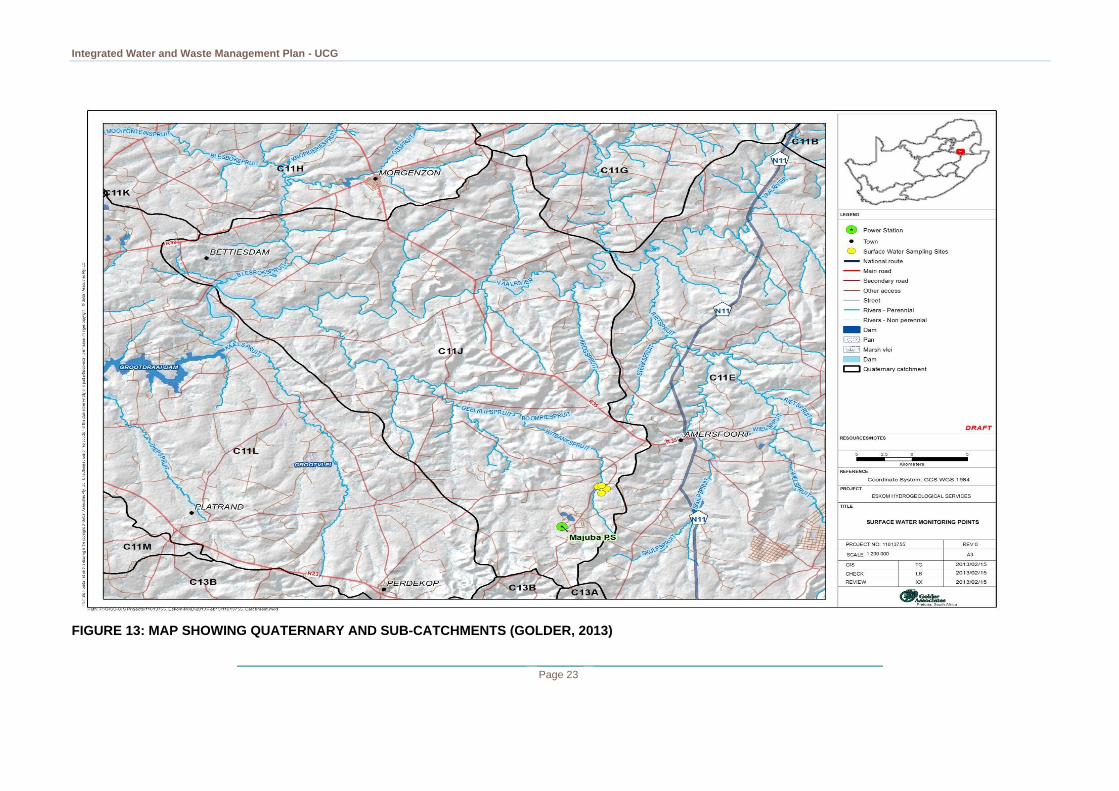
The study area is situated within the Upper Vaal Water Management Area. The Upper Vaal WMA covers an
area of 55 565km2 and includes the Wilge, Vaal, Klip, Liebenbergsvlei and Mooi River which extends to the
confluence of the Vaal River and the Mooi River. The Vaal Dam, Sterkfontein Dam and the Grootdraai Dam
are the main dams found in this WMA. The study area straddles two quaternary catchments. The western part
of the site falls within the quaternary catchment C11J, which is drained by the Witbankspruit, a tributary to the
Vaal River. The eastern part of the site falls within the quaternary catchment C11E, that of the Skulpspruit
which is secondary tributary of the Vaal River.
Monthly Rainfall Figures for Majuba 2007
0
50
100
150
200
250
300
Jan Feb Mar Apr May Jun Jul Aug Sep Oct Nov Dec
Month
Rain
fall
(m
m)
Integrated Water and Waste Management Plan - UCG
Page 23
FIGURE 13: MAP SHOWING QUATERNARY AND SUB-CATCHMENTS (GOLDER, 2013)
Integrated Water and Waste Management Plan - UCG
Page 24
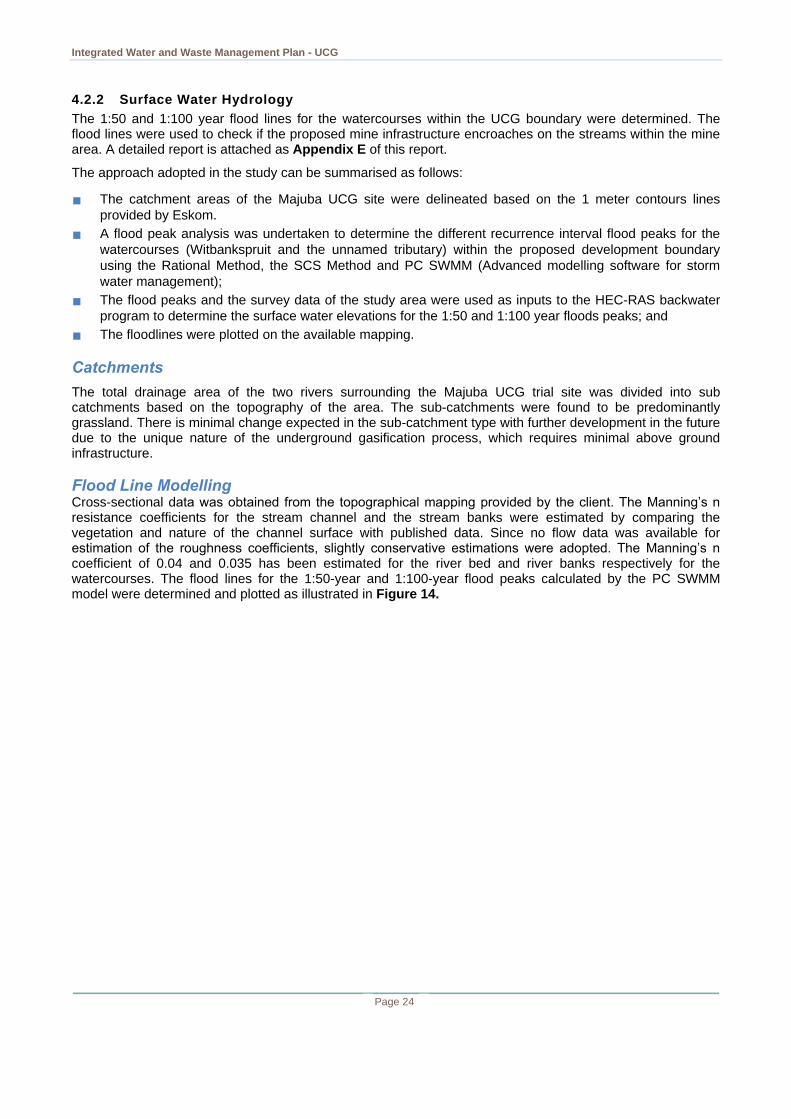
4.2.2 Surface Water Hydrology
The 1:50 and 1:100 year flood lines for the watercourses within the UCG boundary were determined. The flood lines were used to check if the proposed mine infrastructure encroaches on the streams within the mine area. A detailed report is attached as Appendix E of this report.
The approach adopted in the study can be summarised as follows:
The catchment areas of the Majuba UCG site were delineated based on the 1 meter contours lines
provided by Eskom.
A flood peak analysis was undertaken to determine the different recurrence interval flood peaks for the
watercourses (Witbankspruit and the unnamed tributary) within the proposed development boundary
using the Rational Method, the SCS Method and PC SWMM (Advanced modelling software for storm
water management);
The flood peaks and the survey data of the study area were used as inputs to the HEC-RAS backwater
program to determine the surface water elevations for the 1:50 and 1:100 year floods peaks; and
The floodlines were plotted on the available mapping.
Catchments
The total drainage area of the two rivers surrounding the Majuba UCG trial site was divided into sub catchments based on the topography of the area. The sub-catchments were found to be predominantly grassland. There is minimal change expected in the sub-catchment type with further development in the future due to the unique nature of the underground gasification process, which requires minimal above ground infrastructure.
Flood Line Modelling Cross-sectional data was obtained from the topographical mapping provided by the client. The Manning’s n resistance coefficients for the stream channel and the stream banks were estimated by comparing the vegetation and nature of the channel surface with published data. Since no flow data was available for estimation of the roughness coefficients, slightly conservative estimations were adopted. The Manning’s n coefficient of 0.04 and 0.035 has been estimated for the river bed and river banks respectively for the watercourses. The flood lines for the 1:50-year and 1:100-year flood peaks calculated by the PC SWMM model were determined and plotted as illustrated in Figure 14.
Integrated Water and Waste Management Plan - UCG
Page 25
FIGURE 14: THE 1:50 AND 1:100 YR. FLOOD LINES FOR UCG AREA (GOLDER 2013)
Integrated Water and Waste Management Plan - UCG
Page 26
4.2.3 Surface Water Quality
Golder Associates undertook the surface water quality assessment study for the area and this is included in the report “Surface water quality impact for Majuba Underground Coal Gasification Project (2013)”. See Appendix F for a detailed report.
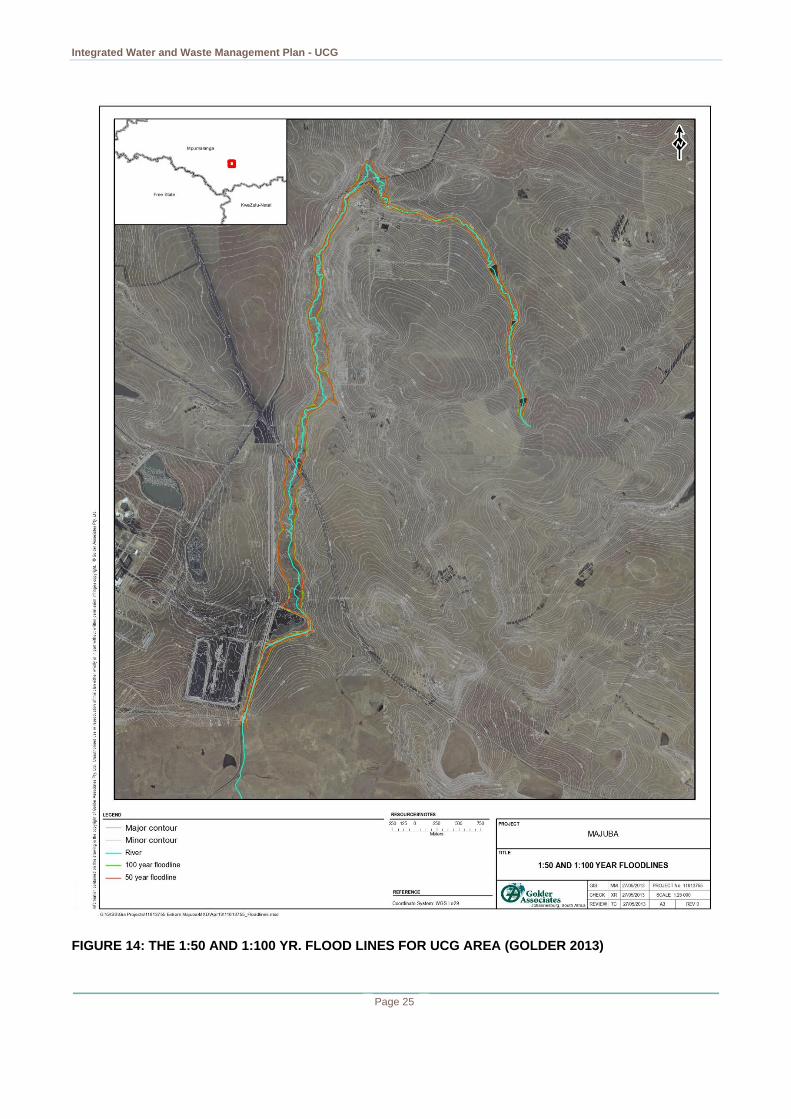
Monitoring Points
There are four surface water monitoring points as indicated in Table 5 that will indicate potential pollution from the site. The surface water was sampled consistently throughout the monitoring period from four points shown in Figure 15.
The Witbankspruit (2010 data only);
Upstream at a non-perennial stream;
Downstream at a non-perennial stream; and
The cooling water dam.
The samples were collected by Eskom personnel and chemical analysis was done by the UIS laboratory. The analytical results from the surface water samples are compared against the RWQOs set out in Section 4.2.5.
TABLE 5: SURFACE WATER MONITORING POINTS
Sample Point Location
Latitude Longitude
Witbankspruit -27.05878328100 29.79855009400
Upstream -27.06117004900 29.80556199900
Downstream -27.05776316500 29.80159599300
Cooling Water Dam -27.06560543100 29.80135761800
The key finding is that the impact assessment has indicated that if mitigation and comprehensive rehabilitation plans are put in place the impacts on surface water will be low. The main impact during construction and decommissioning is likely to be the run-off from the construction area to the Geelklipspruit. This can be mitigated by staying out of the 1:50 year flood lines.
The impact during operation will potentially be medium to high:
Run-off from dirty areas;
Discharge of treated effluent from the wastewater treatment work;
Irrigation of condensate;
Overflow from contaminated storage dams;
Leaks from pipelines; and
Undermining.
The highest impact being that of irrigation of treated condensate where extremely high levels of sulphate, fluoride and chloride, well above the RWQOs were noted (Golder 2013). The proposed irrigation plan should be followed to mitigate the potential impacts to the Geelklipspruit.
Integrated Water and Waste Management Plan - UCG
Page 27
FIGURE 15: SURFACE WATER MONITORING POINTS (GOLDER, 2013)
Integrated Water and Waste Management Plan - UCG
Page 28
4.2.4 Resource Class and River Health
The Resources class and river health has been determined by DWA and is laid presented in “Classification study for the Upper, Middle and Lower Vaal WMA – management Classes of the Vaal River Catchment Report (2012) Report No: RDM/WMA 8,9,10/00/CON/CLA/0212.
4.2.5 Receiving Water Quality Objectives and Reserve
Interim Receiving Water Quality Objectives (RWQO) were determined for the Upper Vaal WMA as part of the Integrated Water Quality Management Plan for the Upper Vaal WMA developed in 1999. The RWQO were based on the water quality requirements of the users in the catchments, but the ecological requirements were not specifically considered. Table 6 outlines the receiving water quality objectives for the area. The classification study for the Upper Vaal WMA was completed at the end of 2012 and the Resource Quality Objectives (RQO) process should be completed by the end of 2014.
TABLE 6: RESOURCE WATER QUALITY OBJECTIVES FOR GROOTDRAAI CATCHMENT
Parameter Unit Ideal Acceptable Tolerable Unacceptable
Conductivity mS/m <10 10 – 15 15 – 25 >25
Alkalinity (CaCO3) mg/l <20 20 – 45 45 – 75 >75
pH pH units <6.4 >8.5
Phospahte (PO4) mg/l <0.05 0.05 – 0.08 0.08 – 1 >1
Sulphate (SO4) mg/l <10 10 – 20 20 – 30 >30
Nitrate (NO3) mg/l <0.05 0.05 – 0.25 0.25 – 0.5 >0.5
Ammonia (NH4) mg/l <0.02 0.02 – 0.5 0.5 – 1 >1
SAR <4 4 – 8 8 – 12 >12
Chloride (Cl) mg/l <10 10 – 15 15 – 20 >20
Chemical Oxygen Demand (COD)
mg/l <10 10 – 15 15 – 20 >25
4.2.6 Surface Water Survey
The land-use in the area is primarily rural agricultural based, with an urban setting in the nearby town of Amersfoort (Golder, 2013):
Agriculture (covering the majority of the proposed development route);
Mix urban use (in town approximately 7km from proposed development area); and
Energy production (at Majuba opposite the proposed project area).
Amersfoort Town Area consists of Amersfoort, Perdekop, Daggakraal, Siyasenzele and Ezamokuhle settlements and falls under the management of the Pixley ka Seme Local Municipality in Gert Sibande District Municipality. The Pixley ka Seme Municipality serves as a Water Services Authority and Water Services Provider for the area. The Water Services Development Plan (WSDP, 2009) indicates that Amersfoort Town Area’s main water source is the local dam (Amersfoort Dam) from where water is abstracted, purified and distributed. Amersfoort Dam is located on the Schulpspruit with a storage capacity 0.992 million m3
and a yield of 1.33 million m3/annum. All water is abstracted from local resources. The main water users in the area are therefore:
Urban related water users in the Pixley ka Seme Local Municipal area; and
Irrigation.
4.2.7 Sensitive Area Survey
It should be noted that any wetland occurring within the boundaries of the study area is a sensitive feature of the natural environment. This sensitivity must be equally applied to all wetlands, irrespective of their state or functionality. This ‘blanket’ sensitivity rating applied to all wetlands is based on a number of factors:
Integrated Water and Waste Management Plan - UCG
Page 29
The National Water Act (No 36 of 1998) affords protection to all types of surface water resources,
including wetlands. The Act does not discriminate between different types of wetlands or between
wetlands in a differing state of degradation.
In the context of the biological (especially vegetative) assemblages within the study area, wetlands are
typically characterised by relatively high levels of biodiversity.
Watercourses and wetlands are often utilised as movement corridors for biota and as such are very
important for the maintenance of ecosystem processes and functioning.
A Wetland Study was undertaken by RHDHV in 2013 and the results of the study are discussed below. A detailed report is included as Appendix G.
The wetlands within the study area are predominately classified as channelled and unchannelled valley-bottom wetlands, floodplains, hillslope seeps, valleyhead seeps, depression (pan) and flat. A total of 48 wetland reaches were assessed within the study area.
The wetland reaches in the Study Area have been subjected to a prioritisation exercise in order to assign a level of sensitivity to respective wetland reaches. However, it should be noted that all wetlands should be regarded as being sensitive areas / components of the Study Area. The classification of wetland reaches into differing classes of sensitivity has been undertaken in order to indicate those wetlands that should be offered maximum protection, and which should be avoided when aligning linear infrastructure such as powerlines, roads and pipelines.
Integrated Water and Waste Management Plan - UCG
Page 30
FIGURE 16: TYPES OF WETLANDS WITHIN THE UCG AREA
Integrated Water and Waste Management Plan - UCG
Page 31
4.3 Groundwater
4.3.1 Aquifer Characterisation
A specialist Groundwater Modelling study was undertaken by Golder Associates Africa (Pty) Ltd in 2013. The hydrogeological investigation established that there are 4 separate aquifer systems:
Shallow aquifer in the surface dolerite and sandstone;
Intermediate aquifer in the dolerite, “sugary” dolerite and underlying sandstones and shales;
Coal seam aquifer;
Lower aquifer below the targeted coal seam.
4.3.2 Groundwater Quality
Golder Associates undertook groundwater monitoring for Eskom between 2010 and 2012. The main purpose of the study was to:
Understand the groundwater quality fluctuations with time and establish the influences of the UCG site
activities on water quality;
Provide an early warning signs regarding the site contamination and to allow the remediation strategies
to be formulated and implemented; and
Expand the baseline understanding of the hydrological site conditions against which changes to the
hydrogeology resulting from UCG process can be assessed.
The water samples were analysed for major ions and hydrocarbon composition. Analytical results were compared to the South African drinking water standards, SANS 241 of 2011.
Two known incidents occurred during the monitoring, and they had an impact on the groundwater quality. The following was noted:
Surface diesel spillage in early 2008 near the shallow monitoring borehole WMS4; and
Production borehole P5 gas leak that took place during May to September.
The water quality indicated that the leakage at P5 may have resulted in the contamination of the shallow
aquifer prior to the leak detection in May 2011.
The key findings were that the shallow aquifer water quality was fairly acceptable with TDS, Mg and Ca
levels exceeding the drinking water quality guidelines most of the time, for boreholes WMS1, WMS7 and
WMS11.Other shallow aquifers show good quality with determinants below the drinking water guidelines
levels.
The deep aquifer displayed poor quality with high levels of TDS, Na and Cl exceeding the drinking water
quality guidelines. See Appendix H for a detailed report.
4.3.3 Hydro-census
A hydrocensus was conducted by GHT Consulting Scientists in 2009. The purpose of this census was toidentify the water users and usage within the possible impact zone of the Power Station. It is indicated that groundwater is used for domestic and agricultural (livestock) purposes. A total of 6 boreholes are used for agriculture and 1 borehole is used for domestic water production. A detailed report is attached as Appendix I.
4.3.4 Potential Pollution Source Identification
The potential for groundwater and surface water pollution has been delineated in the table below with corresponding mitigation measures.
Integrated Water and Waste Management Plan - UCG
Page 32
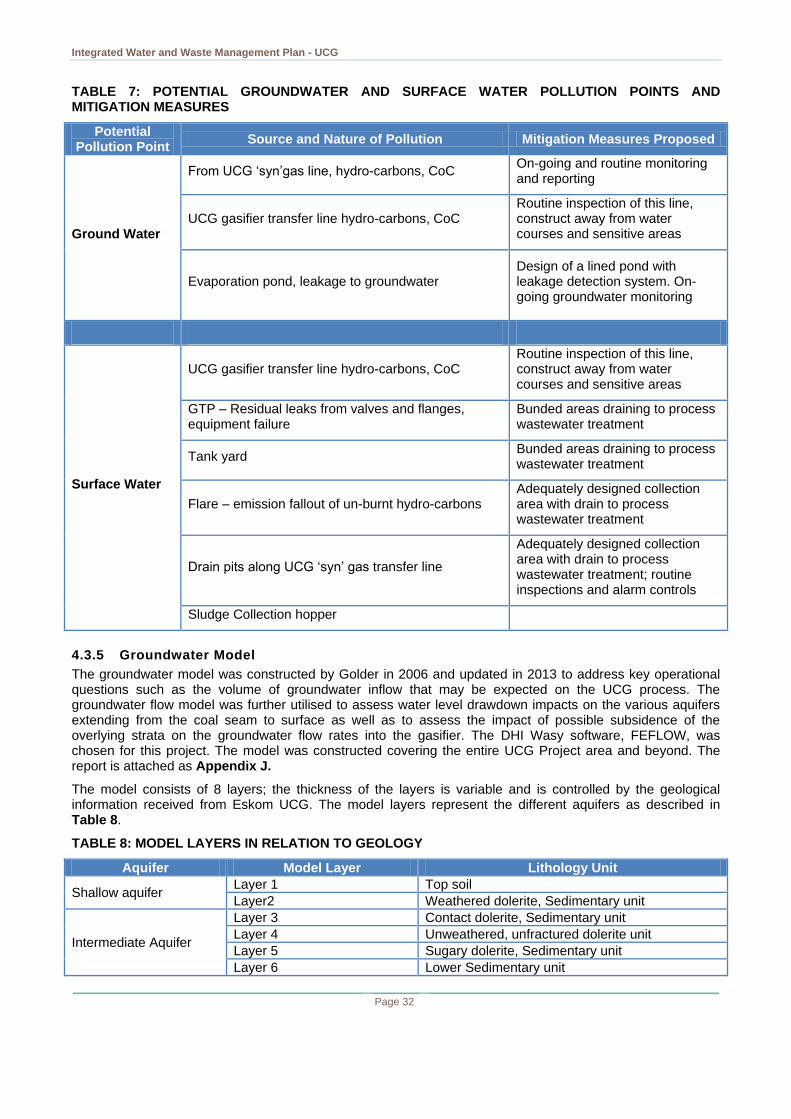
TABLE 7: POTENTIAL GROUNDWATER AND SURFACE WATER POLLUTION POINTS AND MITIGATION MEASURES
Potential Pollution Point
Source and Nature of Pollution Mitigation Measures Proposed
Ground Water
From UCG ‘syn’gas line, hydro-carbons, CoC On-going and routine monitoring and reporting
UCG gasifier transfer line hydro-carbons, CoC Routine inspection of this line, construct away from water courses and sensitive areas
Evaporation pond, leakage to groundwater Design of a lined pond with leakage detection system. On-going groundwater monitoring
Surface Water
UCG gasifier transfer line hydro-carbons, CoC Routine inspection of this line, construct away from water courses and sensitive areas
GTP – Residual leaks from valves and flanges, equipment failure
Bunded areas draining to process wastewater treatment
Tank yard Bunded areas draining to process wastewater treatment
Flare – emission fallout of un-burnt hydro-carbons Adequately designed collection area with drain to process wastewater treatment
Drain pits along UCG ‘syn’ gas transfer line
Adequately designed collection area with drain to process wastewater treatment; routine inspections and alarm controls
Sludge Collection hopper
4.3.5 Groundwater Model
The groundwater model was constructed by Golder in 2006 and updated in 2013 to address key operational questions such as the volume of groundwater inflow that may be expected on the UCG process. The groundwater flow model was further utilised to assess water level drawdown impacts on the various aquifers extending from the coal seam to surface as well as to assess the impact of possible subsidence of the overlying strata on the groundwater flow rates into the gasifier. The DHI Wasy software, FEFLOW, was chosen for this project. The model was constructed covering the entire UCG Project area and beyond. The report is attached as Appendix J.
The model consists of 8 layers; the thickness of the layers is variable and is controlled by the geological information received from Eskom UCG. The model layers represent the different aquifers as described in Table 8.
TABLE 8: MODEL LAYERS IN RELATION TO GEOLOGY
Aquifer Model Layer Lithology Unit
Shallow aquifer Layer 1 Top soil
Layer2 Weathered dolerite, Sedimentary unit
Intermediate Aquifer
Layer 3 Contact dolerite, Sedimentary unit
Layer 4 Unweathered, unfractured dolerite unit
Layer 5 Sugary dolerite, Sedimentary unit
Layer 6 Lower Sedimentary unit
Integrated Water and Waste Management Plan - UCG
Page 33
Coal seam Layer 7 Coal seam layer
Lower Aquifer Layer 8 Base sedimentary unit
Impacts on the groundwater flow were determined. The impacts include changes in the natural groundwater levels and gradients, drawdown and inflow rates to the gasifier. The impacts were simulated using the assumed gasification plan provided by Eskom.
Four scenarios were modelled:
Operational Phase Scenario 1: This is a scenario where there is no goafing and subsidence. The model
was run using the calibrated steady state water levels with the hydraulic parameters determined during
the steady and transient state calibration.
Operational Phase Scenario 2: Represents a case if goafing and subsidence occurs after mining. A
higher vertical hydraulic conductivity values were assigned to the model.
Long-term Closure Scenario 1: where long-term impacts on water levels were simulated 20 years after
completion of mining of gasifier 1 and 2;
Long-term Closure: Scenario 2: where the long-term impacts on water levels was simulated 20 years
after the operational phase
The main conclusions drawn from the modelling are:
If goafing and subsidence occur more than 50m impact on the shallow groundwater is expected;
If the lower B5 dolerite sill stays intact, very limited impact on the shallow groundwater is expected;
Scenario 1: No subsidence:
After 2700days, the maximum distance of the 1m drawdown cone is seen a distance of 1423m to the
southeast of the UCG mine workings
After 5400 days, the maximum distance of the 1m drawdown cone has is seen a distance of 1317m
to the southwest from the UCG mine workings
The maximum inflow of 252m3/d occurs after 2640 days (7.5 years) while the average water inflow
into UCG mine is 211m3/d over the mining period.
Scenario 2: Subsidence occur
After 2700 days, the maximum distance of the 1m drawdown cone is seen a distance of 670m of the
UCG mine workings in the shallow aquifer
After 5400 days, the maximum distance of the 1m drawdown cone has is seen a distance of 180m to
the south from the UCG mine workings in the shallow aquifer.
The maximum inflow of 423m3/d occurs after 2700 days (7.5 years) while the average water inflow
into UCG mine is 268m3/d.
5 ANALYSES AND CHARACTERISATION OF ACTIVITIES
5.1 Site Delineation for Characterization The UCG area has been delineated into the following main areas:
Gas Treatment and Surface Plant Infrastructure;
Network of gas and air pipelines;
Integrated Water and Waste Management Plan - UCG
Page 34
UCG infrastructure area; and
Remainder of the area
5.2 Water and Waste Management
5.2.1 Process water
The condensate recovered from the gas treatment plant and gas pipeline is pumped into a process water dam (12000 m
3 in size). The dam is lined and has monitoring wells in place to provide an early warning system.
This dam is within the gasifier unit 1 footprint. UCG condensate from gasifier unit 1 is currently piped to this dam. Once gasifier unit 2 is in operation, the condensate will also be routed to this dam. At the 70000 Nm
3/hr gas
production scale, the expected quantity of condensate produced is 46000 m3 per annum.
The condensate will be treated to a quality suitable to either:
Support local irrigation activities
Re-inject the water into the coal seam aquifer
Purify to Majuba Raw water quality requirements
As a safety precaution, a dam with sufficient capacity will be constructed in order to cater for down-time of the water treatment plant. Dependant on the final destination for the wastewater, the treatment of the condensate will have various levels of unit operations. It is envisaged that for the option of supplying the water for irrigation purposes, the plant will consist of solid sludge filtration, followed by the removal of organic compounds with the use of activated carbon. The resulting largely organic free condensate will pass through a micro-filtration unit after which it will be made available for irrigation purposes.
5.2.2 Water balance
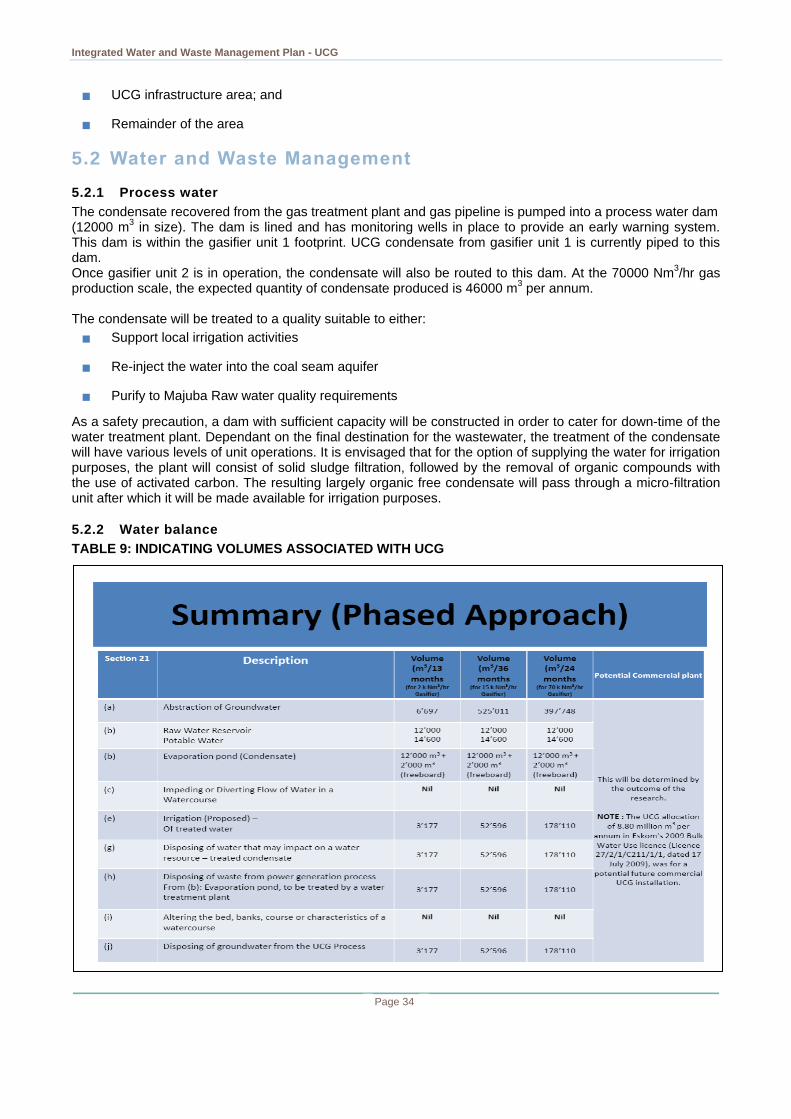
TABLE 9: INDICATING VOLUMES ASSOCIATED WITH UCG
Integrated Water and Waste Management Plan - UCG
Page 35
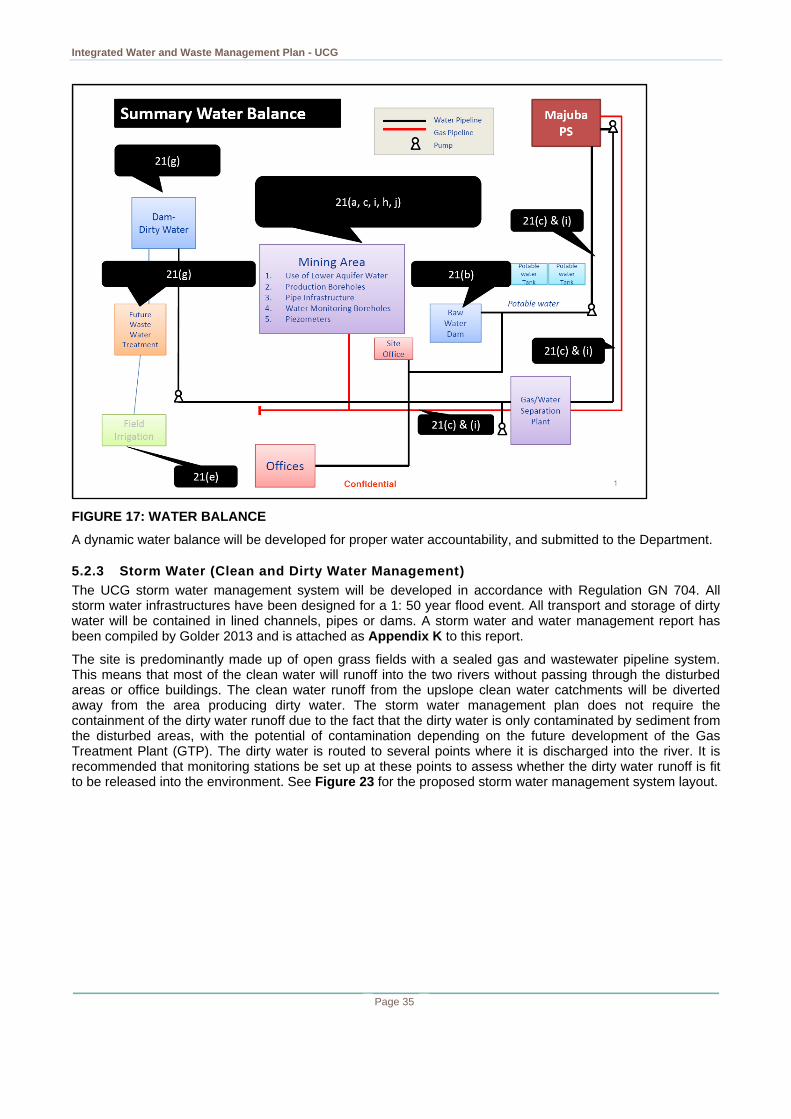
FIGURE 17: WATER BALANCE
A dynamic water balance will be developed for proper water accountability, and submitted to the Department.
5.2.3 Storm Water (Clean and Dirty Water Management)
The UCG storm water management system will be developed in accordance with Regulation GN 704. All storm water infrastructures have been designed for a 1: 50 year flood event. All transport and storage of dirty water will be contained in lined channels, pipes or dams. A storm water and water management report has been compiled by Golder 2013 and is attached as Appendix K to this report.
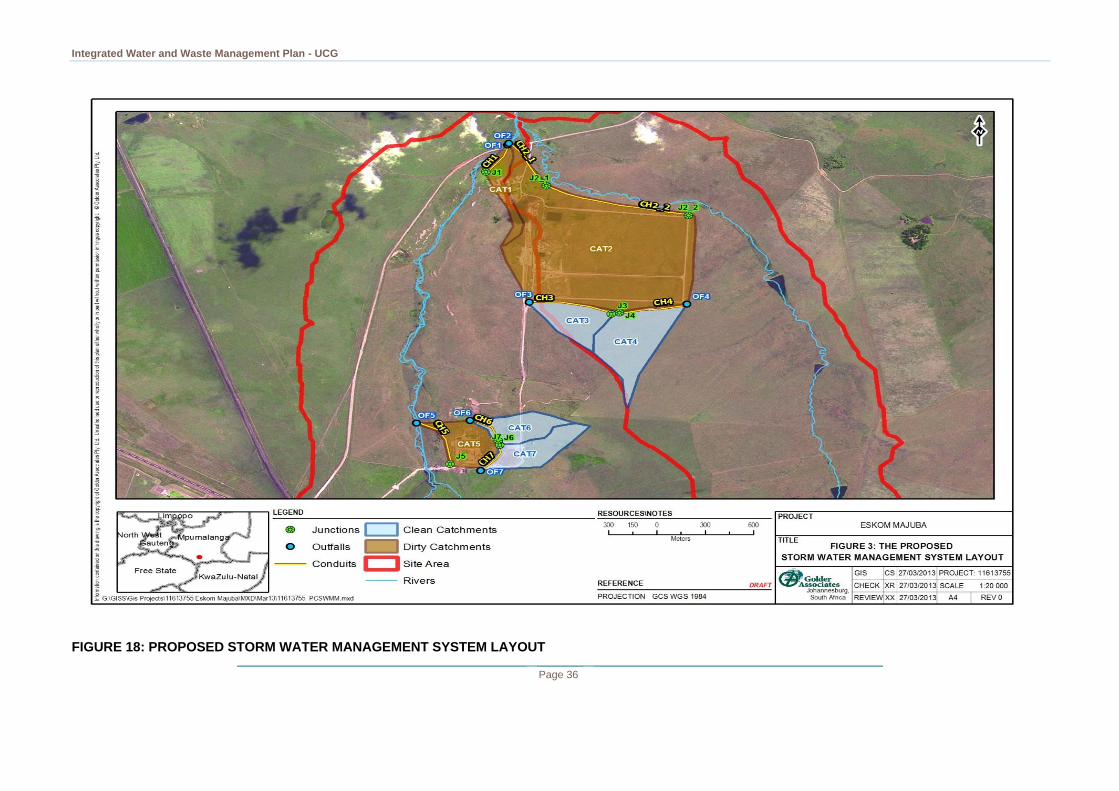
The site is predominantly made up of open grass fields with a sealed gas and wastewater pipeline system. This means that most of the clean water will runoff into the two rivers without passing through the disturbed areas or office buildings. The clean water runoff from the upslope clean water catchments will be diverted away from the area producing dirty water. The storm water management plan does not require the containment of the dirty water runoff due to the fact that the dirty water is only contaminated by sediment from the disturbed areas, with the potential of contamination depending on the future development of the Gas Treatment Plant (GTP). The dirty water is routed to several points where it is discharged into the river. It is recommended that monitoring stations be set up at these points to assess whether the dirty water runoff is fit to be released into the environment. See Figure 23 for the proposed storm water management system layout.
Integrated Water and Waste Management Plan - UCG
Page 36
FIGURE 18: PROPOSED STORM WATER MANAGEMENT SYSTEM LAYOUT
Integrated Water and Waste Management Plan - UCG
Page 37
5.2.4 Waste
Waste management at UCG subscribes to the principles of sustainable waste management. This includes:
Waste prevention - the prevention and avoidance of the production of waste at source;
Waste reduction - the reduction of the volume or hazardous nature of the waste during production;
Resource recovery - recycling or re-use of the waste;
Waste treatment - the treatment of waste to reduce volume or risk to human and environmental safety
and health to reduce the degree of hazard when waste is disposed of in a landfill or discharged into a
water source; and
Waste disposal - the environmentally acceptable and safe disposal or discharge of waste, (e.g.
encapsulation, incineration, landfill or discharge to a water source).
Domestic waste
Domestic waste will include general office waste such as paper and other degradable materials. Waste will be removed from the UCG site and disposed of at the Majuba Power Station disposal site.
Hazardous waste
Hazardous waste to be managed on the site will include oil and other lubricants, diesel, solvents and other hazardous waste will be removed by EnviroServe to be disposed of at Holfontein. The condensate stored in the condensate dam will be trucked off to the Old Oil Man cc, which is a registered waste treatment facility.
5.3 Operational Management
5.3.1 Organisational structure
The organisational structure for UCG is set out in Figure 7.
5.3.2 Resources and competencies
UCG has competent Environmental Management Co-ordinator who will be responsible for the environmental management on site at UCG.
5.3.3 Internal and external communications
Eskom initiates numerous activities to engage stakeholders at a national level, including the following:
A stakeholder day for external stakeholders;
One-on-one meetings with specific stakeholders on pertinent issues; and
Eskom annual report is made available to the public and covers progress in all areas of sustainability for
the preceding year.
5.3.4 Awareness training
All employees of UCG have to undergo environmental awareness and training as set out in terms of the Safety, Health, Environment and Quality Policy.
5.4 Monitoring and Control
5.4.1 Surface Water Monitoring
The objective of surface water monitoring is to assess the impact that the activity may have on the surface water resources and to implement mitigation measures as necessary. UCG maintains four surface water monitoring points. In future the monitoring results will be reported as per the requirements of the IWUL.
Integrated Water and Waste Management Plan - UCG
Page 38
TABLE 10: SURFACE WATER MONITORING POINTS IN THE ESKOM UCG AREA
Sample Point Location
Latitude Longitude
Witbankspruit -27.05878328100 29.79855009400
Upstream -27.06117004900 29.80556199900
Downstream -27.05776316500 29.80159599300
Cooling Water Dam -27.06560543100 29.80135761800
The analysis results are included in the Surface Water Impact Assessment report attached as Appendix F of this report.
5.4.2 Groundwater Monitoring
The general objectives for groundwater monitoring are as follows:
Assessment of the background, source, pathway and receptor water quality in the groundwater system in
order to identify possible trends and/or changes with regard to groundwater quality by tracking
contaminants of concern for boreholes as indicators of pollution;
To monitor the water quality of the boreholes, in order to gather more data to inform the calibration and
updating of the numerical groundwater model; and
To investigate the possible contamination of groundwater resulting from mining processes and seepage
to the environment.
A groundwater monitoring plan will be developed and implemented and monitoring results will be reported as
per the requirements of the IWUL.
5.4.3 Bio Monitoring
A bio-monitoring program will be set up as required by the IWUL.
5.4.4 Waste Monitoring
Waste will be monitored in accordance with the Eskom Waste Policy (Unique Identifier no: 32-245). Waste streams identified will be separated so as to monitor the quantities of different waste streams that are generated and disposed off.
5.5 Risk Assessment / Best Practice Assessment
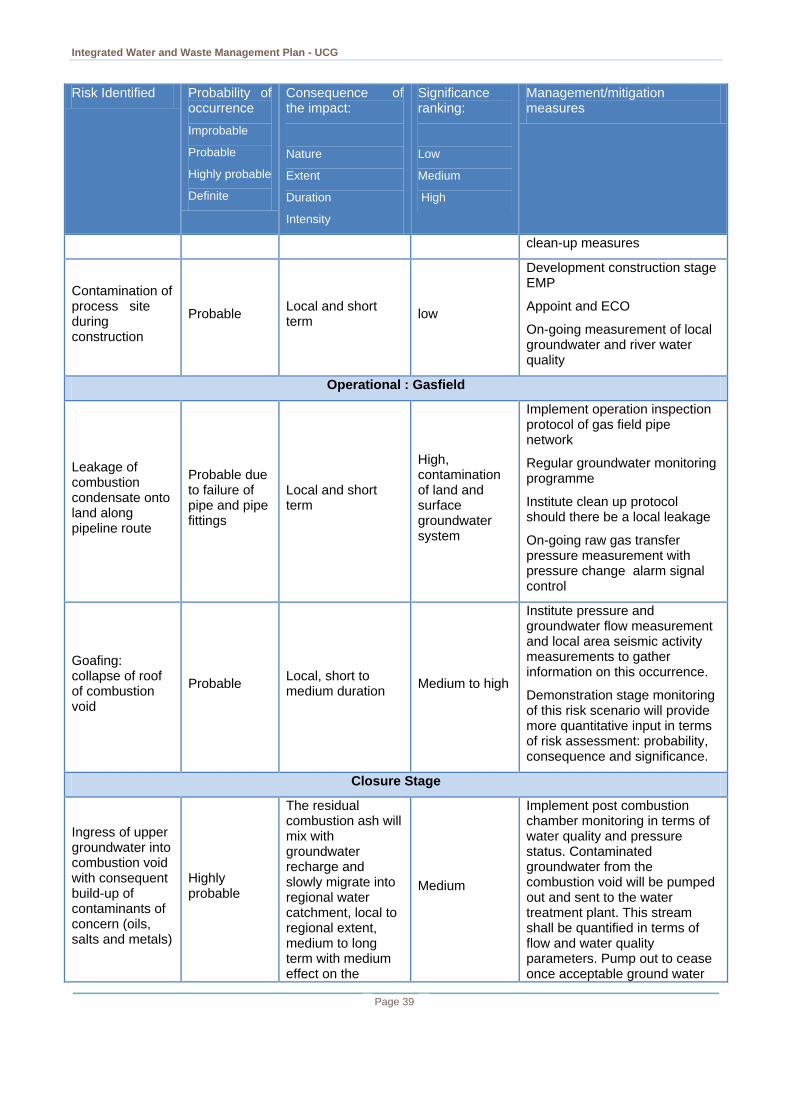
FIGURE 19: IMPACT ASSESSMENT FOR DIFFERENT PROJECT PHASES
Risk Identified Probability of occurrence
Improbable
Probable
Highly probable
Definite
Consequence of the impact:
Nature
Extent
Duration
Intensity
Significance ranking:
Low
Medium
High
Management/mitigation measures
Construction Stage
Contamination of surface during drilling with machine oils
Probable
Local short term contamination of soils and groundwater;
Low
Avoid drilling in riverine areas, Follow drilling establishment and operational protocol, Training of all staff in spill prevention and
Integrated Water and Waste Management Plan - UCG
Page 39
Risk Identified Probability of occurrence
Improbable
Probable
Highly probable
Definite
Consequence of the impact:
Nature
Extent
Duration
Intensity
Significance ranking:
Low
Medium
High
Management/mitigation measures
clean-up measures
Contamination of process site during construction
Probable Local and short term
low
Development construction stage EMP
Appoint and ECO
On-going measurement of local groundwater and river water quality
Operational : Gasfield
Leakage of combustion condensate onto land along pipeline route
Probable due to failure of pipe and pipe fittings
Local and short term
High, contamination of land and surface groundwater system
Implement operation inspection protocol of gas field pipe network
Regular groundwater monitoring programme
Institute clean up protocol should there be a local leakage
On-going raw gas transfer pressure measurement with pressure change alarm signal control
Goafing: collapse of roof of combustion void
Probable Local, short to medium duration
Medium to high
Institute pressure and groundwater flow measurement and local area seismic activity measurements to gather information on this occurrence.
Demonstration stage monitoring of this risk scenario will provide more quantitative input in terms of risk assessment: probability, consequence and significance.
Closure Stage
Ingress of upper groundwater into combustion void with consequent build-up of contaminants of concern (oils, salts and metals)
Highly probable
The residual combustion ash will mix with groundwater recharge and slowly migrate into regional water catchment, local to regional extent, medium to long term with medium effect on the
Medium
Implement post combustion chamber monitoring in terms of water quality and pressure status. Contaminated groundwater from the combustion void will be pumped out and sent to the water treatment plant. This stream shall be quantified in terms of flow and water quality parameters. Pump out to cease once acceptable ground water
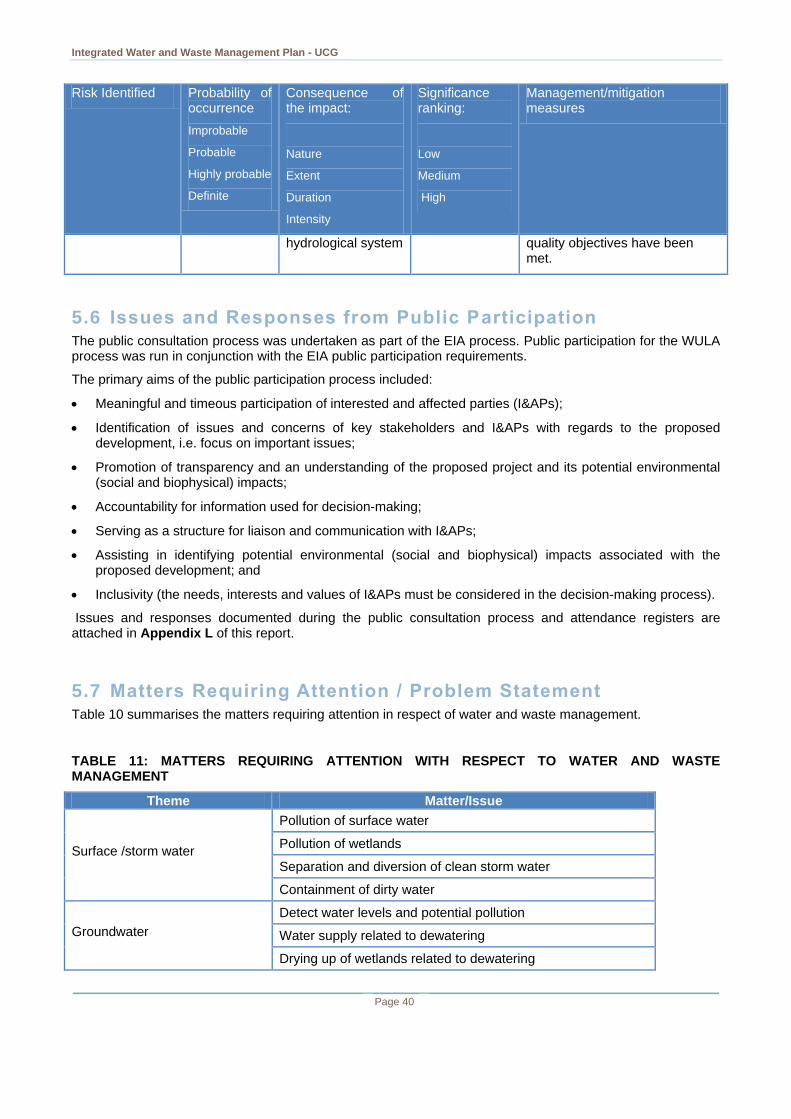
Integrated Water and Waste Management Plan - UCG
Page 40
Risk Identified Probability of occurrence
Improbable
Probable
Highly probable
Definite
Consequence of the impact:
Nature
Extent
Duration
Intensity
Significance ranking:
Low
Medium
High
Management/mitigation measures
hydrological system quality objectives have been met.
5.6 Issues and Responses from Public Participation The public consultation process was undertaken as part of the EIA process. Public participation for the WULA process was run in conjunction with the EIA public participation requirements.
The primary aims of the public participation process included:
Meaningful and timeous participation of interested and affected parties (I&APs);
Identification of issues and concerns of key stakeholders and I&APs with regards to the proposed development, i.e. focus on important issues;
Promotion of transparency and an understanding of the proposed project and its potential environmental (social and biophysical) impacts;
Accountability for information used for decision-making;
Serving as a structure for liaison and communication with I&APs;
Assisting in identifying potential environmental (social and biophysical) impacts associated with the proposed development; and
Inclusivity (the needs, interests and values of I&APs must be considered in the decision-making process).
Issues and responses documented during the public consultation process and attendance registers are attached in Appendix L of this report.
5.7 Matters Requiring Attention / Problem Statement Table 10 summarises the matters requiring attention in respect of water and waste management.
TABLE 11: MATTERS REQUIRING ATTENTION WITH RESPECT TO WATER AND WASTE MANAGEMENT
Theme Matter/Issue
Surface /storm water
Pollution of surface water
Pollution of wetlands
Separation and diversion of clean storm water
Containment of dirty water
Groundwater
Detect water levels and potential pollution
Water supply related to dewatering
Drying up of wetlands related to dewatering
Integrated Water and Waste Management Plan - UCG
Page 41
Process water Adequate reuse of stored water from the process dam
Water balance Implement a dynamic water balance for proper water audit
Waste Contamination of soils due to incorrect disposal of hazardous waste including hydrocarbon contaminated wastes
5.8 Assessment of Level of Confidence of Information In general it can be stated that the extent and level of information available is adequate to support the development of the IWWMP for UCG.
6 WATER AND WASTE MANAGEMENT PLAN
6.1 Water and Waste Management Philosophy UCG is committed to the following:
To plan, design, construct, operate, decommission and close the proposed new UCG project in a
responsible manner, in accordance with the Eskom policies and strategies and all applicable legislative
requirements;
To minimise the impact on the receiving environment by limiting the extent of the footprint of the
operation and through the implementation of properly engineered barriers prevent seepage of
contaminated water to the receiving environment from all impoundments;
To the implementation of long term water management measures and will conduct the required
monitoring during the operation phase to support the initial water drainage quality and quantity
predictions, which will inform long term water management; and
To implement technically proven and acceptable rehabilitation measures during the operational,
decommissioning and closure phases to ensure that at closure the project area will be free draining.
6.2 Strategies In order to give effect to the water and waste management philosophy for UCG, the following strategies will be implemented:
Surface water
Construct and maintain adequate storm water control measures to keep clean and dirty water separate;
and
Monitor water quality at the monitoring positions identified.
Groundwater
Minimise the impact on groundwater resource through the design and construction of engineered barriers
for potential pollution sources;
Implement ongoing monitoring of groundwater quality and levels to inform the detailed geochemical
impact predictions and to validate groundwater models; and
Implement long term water management by managing groundwater levels and through the
implementation of an onsite water treatment facility.
Integrated Water and Waste Management Plan - UCG
Page 42
Storm water
Separation of clean and dirty water in accordance with the requirements of GN 704;
Collection, containment and conveyance of both clean and dirty water in adequately sized water
management infrastructure as stipulated in GN 704; and
On-going monitoring and measurement of water quantity and quality to support the wide water balance
and water management.
Waste
Implement waste separation at source;
Maximise recycling and reuse of waste streams;
Dispose of waste on authorised waste disposal facilities in accordance with legal requirements;
Implement on-going waste monitoring to inform waste management; and
Identification and rehabilitate contaminated land.
6.3 Performance Objectives / Goals The following key performance objectives have been identified for UCG
Develop and update the water balance annually or as will be required by the IWUL;
Contain dirty storm water;
Prevent erosion;
Monitor and record ambient water quality in the receiving surface water and various points on site to
confirm/ assess the effectiveness of the implemented water pollution control measures;
Assess the impact/s that project is having on local groundwater and surface water resources;
Monitor groundwater levels; and
Monitor the wetlands the areas.
6.4 Measures to Achieve and Sustain Performance Objectives Management activities and mitigation measures will be implemented during construction, operation and closure phases at UCG in order to achieve the required performance objectives.The following measures have been identified to achieve the set performance objectives for UCG.
FIGURE 20: PERFORMANCE OBJECTIVES RELEVANT TO ESKOM UCG
Performance Objectives Management Measures
Process Water
Updated water and salt balance Update water balance annually or implement a water balance model that can be updated as needed
Surface Water
Contain dirty storm water
Construct and maintain adequate storm water control measures to keep clean and dirty water separate
Maintain pollution control dams and re-use stored water on site where possible
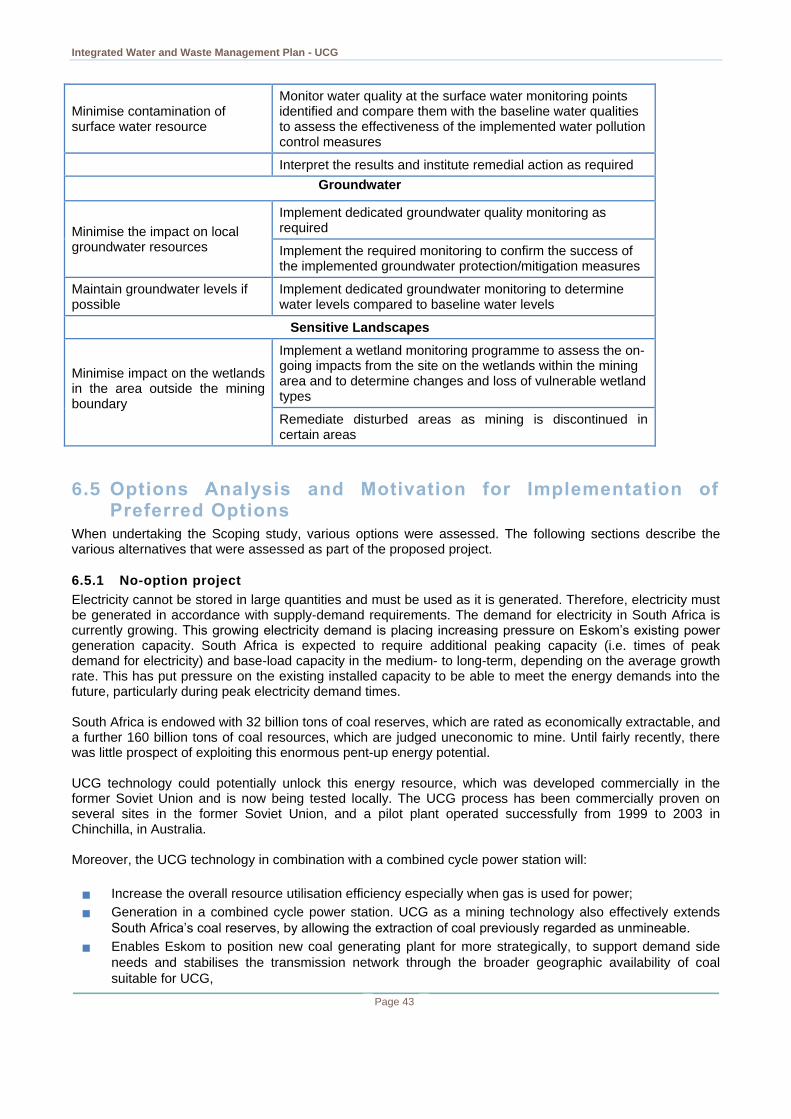
Integrated Water and Waste Management Plan - UCG
Page 43
Minimise contamination of surface water resource
Monitor water quality at the surface water monitoring points identified and compare them with the baseline water qualities to assess the effectiveness of the implemented water pollution control measures
Interpret the results and institute remedial action as required
Groundwater
Minimise the impact on local groundwater resources
Implement dedicated groundwater quality monitoring as required
Implement the required monitoring to confirm the success of the implemented groundwater protection/mitigation measures
Maintain groundwater levels if possible
Implement dedicated groundwater monitoring to determine water levels compared to baseline water levels
Sensitive Landscapes
Minimise impact on the wetlands in the area outside the mining boundary
Implement a wetland monitoring programme to assess the on-going impacts from the site on the wetlands within the mining area and to determine changes and loss of vulnerable wetland types
Remediate disturbed areas as mining is discontinued in certain areas
6.5 Options Analysis and Motivation for Implementation of Preferred Options
When undertaking the Scoping study, various options were assessed. The following sections describe the various alternatives that were assessed as part of the proposed project.
6.5.1 No-option project
Electricity cannot be stored in large quantities and must be used as it is generated. Therefore, electricity must be generated in accordance with supply-demand requirements. The demand for electricity in South Africa is currently growing. This growing electricity demand is placing increasing pressure on Eskom’s existing power generation capacity. South Africa is expected to require additional peaking capacity (i.e. times of peak demand for electricity) and base-load capacity in the medium- to long-term, depending on the average growth rate. This has put pressure on the existing installed capacity to be able to meet the energy demands into the future, particularly during peak electricity demand times. South Africa is endowed with 32 billion tons of coal reserves, which are rated as economically extractable, and a further 160 billion tons of coal resources, which are judged uneconomic to mine. Until fairly recently, there was little prospect of exploiting this enormous pent-up energy potential. UCG technology could potentially unlock this energy resource, which was developed commercially in the former Soviet Union and is now being tested locally. The UCG process has been commercially proven on several sites in the former Soviet Union, and a pilot plant operated successfully from 1999 to 2003 in Chinchilla, in Australia. Moreover, the UCG technology in combination with a combined cycle power station will:
Increase the overall resource utilisation efficiency especially when gas is used for power;
Generation in a combined cycle power station. UCG as a mining technology also effectively extends
South Africa’s coal reserves, by allowing the extraction of coal previously regarded as unmineable.
Enables Eskom to position new coal generating plant for more strategically, to support demand side
needs and stabilises the transmission network through the broader geographic availability of coal
suitable for UCG,
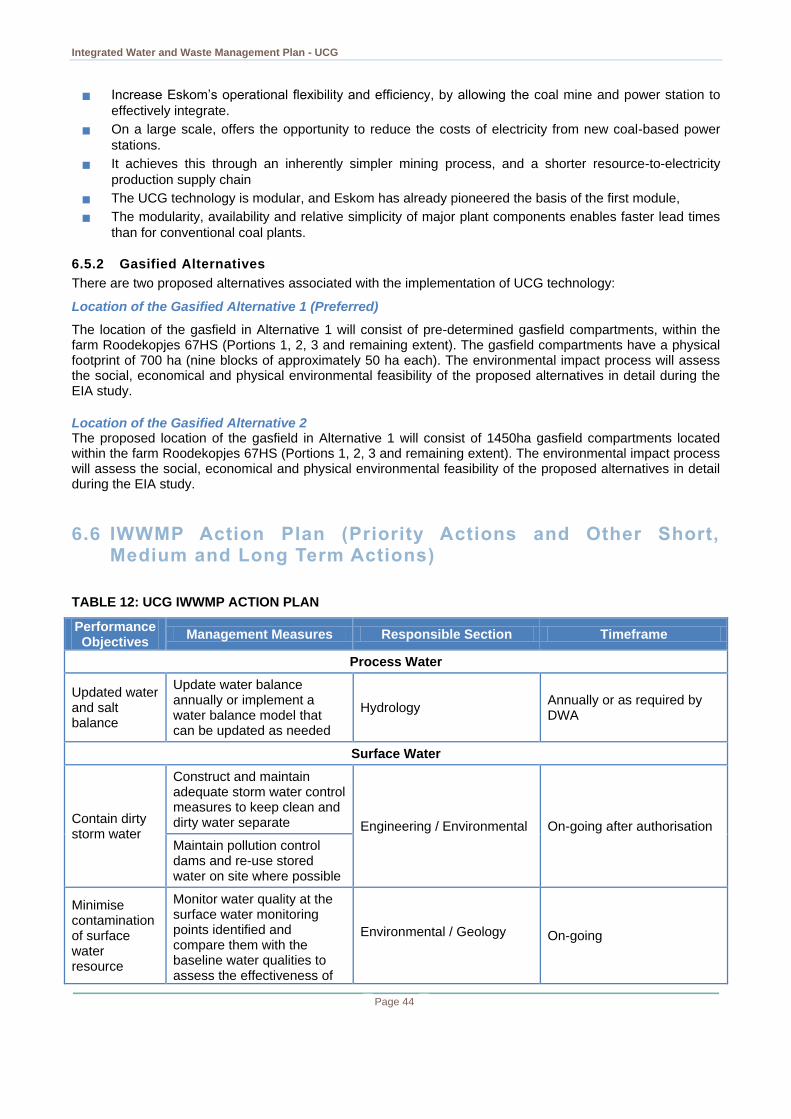
Integrated Water and Waste Management Plan - UCG
Page 44
Increase Eskom’s operational flexibility and efficiency, by allowing the coal mine and power station to
effectively integrate.
On a large scale, offers the opportunity to reduce the costs of electricity from new coal-based power
stations.
It achieves this through an inherently simpler mining process, and a shorter resource-to-electricity
production supply chain
The UCG technology is modular, and Eskom has already pioneered the basis of the first module,
The modularity, availability and relative simplicity of major plant components enables faster lead times
than for conventional coal plants.
6.5.2 Gasified Alternatives
There are two proposed alternatives associated with the implementation of UCG technology:
Location of the Gasified Alternative 1 (Preferred)
The location of the gasfield in Alternative 1 will consist of pre-determined gasfield compartments, within the farm Roodekopjes 67HS (Portions 1, 2, 3 and remaining extent). The gasfield compartments have a physical footprint of 700 ha (nine blocks of approximately 50 ha each). The environmental impact process will assess the social, economical and physical environmental feasibility of the proposed alternatives in detail during the EIA study.
Location of the Gasified Alternative 2 The proposed location of the gasfield in Alternative 1 will consist of 1450ha gasfield compartments located within the farm Roodekopjes 67HS (Portions 1, 2, 3 and remaining extent). The environmental impact process will assess the social, economical and physical environmental feasibility of the proposed alternatives in detail during the EIA study.
6.6 IWWMP Action Plan (Priority Actions and Other Short, Medium and Long Term Actions)
TABLE 12: UCG IWWMP ACTION PLAN
Performance Objectives
Management Measures Responsible Section Timeframe
Process Water
Updated water and salt balance
Update water balance annually or implement a water balance model that can be updated as needed
Hydrology Annually or as required by DWA
Surface Water
Contain dirty storm water
Construct and maintain adequate storm water control measures to keep clean and dirty water separate Engineering / Environmental On-going after authorisation
Maintain pollution control dams and re-use stored water on site where possible
Minimise contamination of surface water resource
Monitor water quality at the surface water monitoring points identified and compare them with the baseline water qualities to assess the effectiveness of
Environmental / Geology On-going
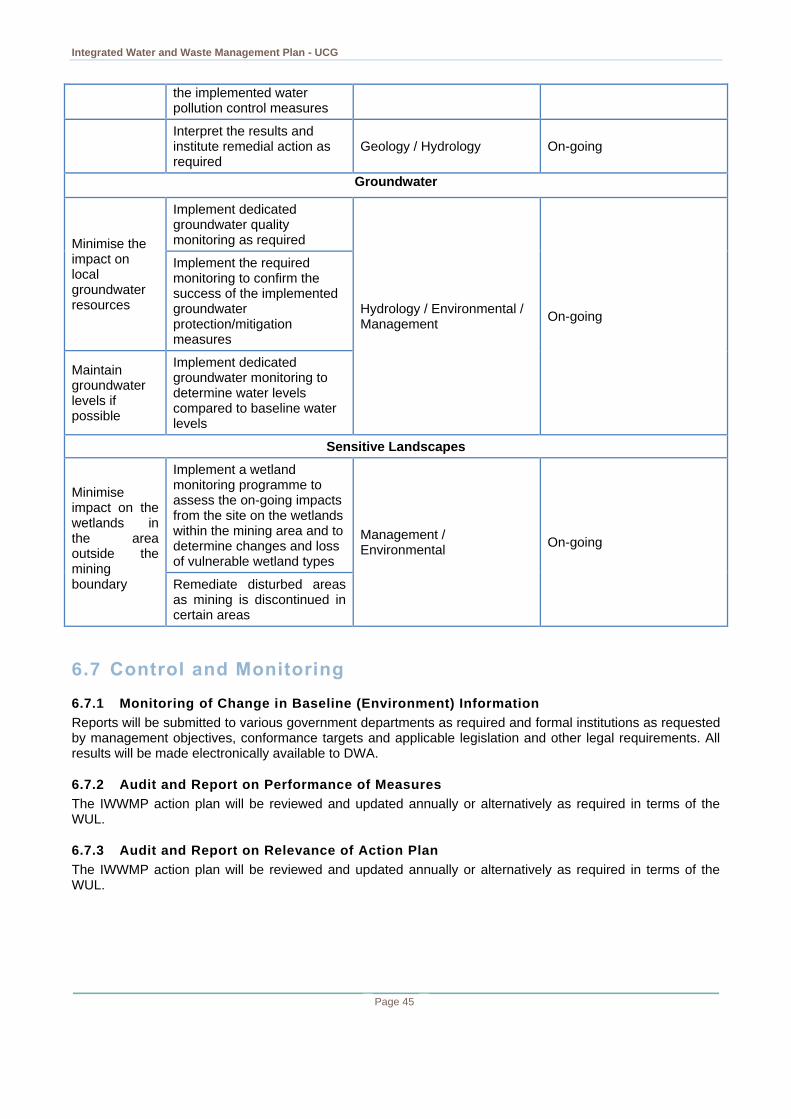
Integrated Water and Waste Management Plan - UCG
Page 45
the implemented water pollution control measures
Interpret the results and institute remedial action as required
Geology / Hydrology On-going
Groundwater
Minimise the impact on local groundwater resources
Implement dedicated groundwater quality monitoring as required
Hydrology / Environmental / Management
On-going
Implement the required monitoring to confirm the success of the implemented groundwater protection/mitigation measures
Maintain groundwater levels if possible
Implement dedicated groundwater monitoring to determine water levels compared to baseline water levels
Sensitive Landscapes
Minimise impact on the wetlands in the area outside the mining boundary
Implement a wetland monitoring programme to assess the on-going impacts from the site on the wetlands within the mining area and to determine changes and loss of vulnerable wetland types
Management / Environmental
On-going
Remediate disturbed areas as mining is discontinued in certain areas
6.7 Control and Monitoring
6.7.1 Monitoring of Change in Baseline (Environment) Information
Reports will be submitted to various government departments as required and formal institutions as requested by management objectives, conformance targets and applicable legislation and other legal requirements. All results will be made electronically available to DWA.
6.7.2 Audit and Report on Performance of Measures
The IWWMP action plan will be reviewed and updated annually or alternatively as required in terms of the WUL.
6.7.3 Audit and Report on Relevance of Action Plan
The IWWMP action plan will be reviewed and updated annually or alternatively as required in terms of the WUL.
Integrated Water and Waste Management Plan - UCG
Page 46
7 CONCLUSIONS
7.1 Regulatory Status of Activity The water uses associated with UCG are new water uses and require authorisation. The water uses are set out in Table 4.
7.2 Statement on water uses requiring authorisations, dispensing with the requirement for a license and possible exemption from Regulations
In terms of Section 22(1) of the NWA UCG may only use water without a licence if the responsible authority, namely the Chief Director: Regulation in DWA has dispensed with a licence requirement.
Water use licence forms for those water uses described in Table 4 are included in the Integrated Water Use Licence Summary report.
7.3 Motivation in terms of Section 27 (1) of the NWA Section 27 of the NWA specifies the following factors regarding water use authorisation that must be taken into consideration:
The efficient and beneficial use of water in the public interest;
The socio-economic impact of the decision whether or not to issue a licence;
Alignment with the catchment management strategy;
The impact of the water use, resource directed measures; and
Investments made by the applicant in respect of the water use in question.
The motivation in terms of section 2.7 for the planned water uses is listed in Section 7.3.1 below.
TABLE 13: SECTION 27 MOTIVATION
Section Content Description of issues
27(1)(a) Existing lawful water use
A section 21(a) bulk water use
licence (Reference No.
27/2/1/C211/1/1) was issued on
17 July 2009 and includes the
UCG operations of Eskom.
Section 21(b) - a raw water dam
(water stored for domestic water
use), which also does not qualify
as a dam safety risk; and,
Section 21(c) and (i) - several
river crossings (road bridge and
pipeline) on the project site.
New use
The new water uses are described in Table 4 above and include water uses:
21 (a), (b), (c), (e), (g), (h), (i) and (j)
27(1)(b) Need to redress the results of past racial and gender discrimination
Eskom’s activities directly benefit all
sectors of society and all aspects of life
in South Africa; hence, its redress
impact is national and universal in
Integrated Water and Waste Management Plan - UCG
Page 47
accordance with South Africa’s
transformation and Constitutional
redress imperatives.
Furthermore, as a parastatal institution,
Eskom is bound by governments
Employment Equity policies and
procedures. This applies, across the
board, to all facets of its operations and
includes projects of this nature.
Accordingly, the appointment of staff
and contractors to the project are
subject to the policy and procedural
rigours applied by Eskom.
27(1) Efficient and beneficial use of water in public interest
Surface water resources in most areas have been over utilised, the use of groundwater reserves provides an opportunity to relieve some pressure on the existing resources and provides an alternative and feasible option for areas that are located away from surface reserves. This resource must also be used in a sustainable way to ensure surface water resources are not depleted and the quality of groundwater is maintained as well as the groundwater reserve.
Eskom is a state-owned company with the mandate to generate, transmit, distribute and trade with electricity in South Africa and parts of Southern Africa. As part of their duty, Eskom is required to maintain the quality of their operations in a sustainable and equitable manner.
27(1)(d)(i) Socio-economic impact of the water use applied for
The UCG project is located in this economically important region and additional power generated through the UCG process feeds directly into the national electricity grid; hence the footprint and direct socio-economic impact of this project, and its associated water uses, is national.
27(1)(e) Alignment with catchment management strategy
The Upper Vaal and the Overarching Vaal ISP’s and the recent Vaal Reconciliation Scenarios provide strategies that are relevant for the WMA and the vision for water resources in this area. According to the Upper Vaal ISP the vision for this WMA is to facilitate water conservation and demand management, as a primary point of focus to which Eskom is committed.
27(1)(f) Likely effect of the water use to be authorised on the water resource and
The demands on surface and groundwater water resources regarding
Integrated Water and Waste Management Plan - UCG
Page 48
other water users (quality and quantity)
consumptive water uses (abstraction) are minimal, since the UCG process does not have any direct water requirement.
Wastewater, in the form of the condensate generated from the UCG process, will be collected and treated on site to the appropriate standards and specifications, either for its re-use (at the Majuba plant) or disposal to the receiving environment (underground re-injection or surface irrigation). Hence, the philosophies of waste minimisation and water re-use will be followed.
All working areas on the UCG site will be contained to minimise the impact of any event that may cause pollution and, because of the small and highly localised nature of the individual operations, incidents can be more easily controlled and managed.
27(1)(g) Likely effect of the water use on the class and resource quality objectives
Various studies in the Vaal River system show that it can be considered to be under water quality and water quantity stress as it is unable to adequately meet the needs of the users in respect of their quality and quantity requirements.
From a water quality perspective, the current state of the system shows unacceptably high nutrient and salt concentrations which are indicative of an unsustainable system. At present an imbalance exists between sustainable and optimal water use and protection of the water resource.
Surface Water
The major surface contributor is the Vaal River upstream of the Vaal Dam and the Klip River, the Wilge and the Liebensbergvlei Rivers are the second largest contributor with tributaries downstream of the Vaal Dam being the remaining contributors. There are increased surface run off due to the impermeable surfaces, but there is reduced inflow to the Vaal Dam due to the numerous farm dams in the area. The water quality of the surface water is good but contributions from urban and industrial activities especially in the north-western part reduce quality in the respective tributaries.
Transfers
The Upper Vaal WMA is estimated to have 120 million m
3/yr yield transferred
Integrated Water and Waste Management Plan - UCG
Page 49
into the system to supplement the local supply and equal amount is transferred out of the WMA. The transfers in are contributed by the Usutu to Mhlatuze and the Thukela Water Management Areas and the Senqu (Orange) River in Lesotho. The Upper Vaal WMA, due to its location, has an impact on the surrounding WMA’s and Lesotho.
27(1)(i) Strategic importance of the water use to be authorised
This IWULA supports Eskom’s further quest in seeking alternative cleaner technologies for power generation, that are also more efficient in utilising available natural resources including lower quality coal resources that are not easily or productively mined. The potential of this form of power generation, whether stand-alone or supplemental to other conventional methods, remains to be established and the successful execution of this project will confirm the power generation or supplementation potential of the UCG process.
Accordingly, the authorisation of water uses in this project is a key requirement for its successful implementation; and, should it be successful, would support the full-scale implementation of this alternative, or supplemental, form of power generation to further ensure the security of South Africa’s continued and future power needs.
27(1)(j) Quality and quantity of the water in the water resource which may be required for the reserve
There are minimal impacts on the water resources, both water quality and quantity, beyond the boundaries of the UCG site. As indicated above, the process generates rather than consumes water. However, there is contamination of the water that is generated during the gas production process. This wastewater has been analysed and appropriate treatment and disposal options are currently under investigation. All treatment and disposal options will take into consideration water quality considerations relating to the Reserve and international obligations, recognising that the Vaal River system is an international watercourse, as well as already being in a highly impacted state.
At present, waste-water generation from the process during the concept and pilot phases of the project have been stored in a waste-water holding dam and trucked away for disposal at an approved site. This is a very expensive,
Integrated Water and Waste Management Plan - UCG
Page 50
though short-term, option but is the only one currently available. Future options potentially include: the reuse of treated effluent at the Majuba Plant, re-injection into the production wells or the irrigation of cattle grazing pastures.
27(1)(k)
The probable duration of any undertaking for which a water use is to be authorised
Given the evolving status of the project and the successes already achieved during the trial and testing phases, there are indications that the UCG process will be a successful one. On this basis, it may be prudent to seek a thirty-year water use authorisation; however, it will require initial revisions and amendment on a least a six-monthly basis over the first two- to five-years as the project and production processes are up-scaled and consolidated.
7.4 Key Commitments Eskom UCG is committed to the implementation of the IWWMP action plan contained in this document and water use licence conditions that will be stipulated in the WUL once issued.
8 REFERENCES
Boyd, L and Moodley, P. February 2013. Surface water impact assessment for Majuba Underground Coal
Gasification Project. Report No: 11613755 – 11905 – 3.
Da Cruz, P. February 2013. Underground Coal Gasification project and Associated Infrustructure in support of co-firing of gas at the Majuba Power Station, Amersfoort, Mpumalanga – Wetland Assessment Study. Project No: E02.JNB.000308. Department of Water Affairs, Operational Guideline: Integrated Water and Waste Management Plan, February 2010, 1st Edition
Muresam, M. February 2013. Hydrogeological background information and existing modelling results at
Majuba UCG – Technical Memorandum. Reference No: 11613755_Mem_006.
Pretorius, J and van de Linde, G. February 2013. Majuba Underground Coal Gasification: Groundwater
Monitoring Report – 2010 to 2012. Report No: 11613755 – 11623 – 1.
Reddy, P and Roods, M. January 2013. Environmental Scoping Report for the Underground Coal Gasification Project and Associated Infrastructure in support of co-firing of gas at the Majuba Power Station, Amersfoort, Mpumalanga. Reference No: E02.JNB.000308.
Roux, X and Coleman, T. April 2013. Majuba Underground Coal Gasification: Floodline Analysis. Report No:
11613755-11998 – 5.
Roux, X and Coleman, T. March 2013. Majuba Underground Coal Gasification: Storm Water Management
Plan. Report No: 11613755-11980-4.
Van Niekerk L. J et al. May 2009. Hydrocensus for Majuba Power Station. Report No: RVN 522.1/958.
Integrated Water and Waste Management Plan - UCG
Page 51
9 APPENDICES: SPECIALIST STUDIES
Appendix A – Title Deeds
Appendix B – Policies
Appendix C – Waste agreements and Certificates
Appendix D = Final Scoping Report
Appendix E – Flood line Report
Appendix F – Surface Water impact assessment
Appendix G – Wetland Study
Appendix H – Groundwater monitoring
Appendix I – Majuba Hydrocensus
Appendix J – Groundwater model
Appendix K – Storm Water Management Plan
Appendix L - PP Issues and Comments