Embed Size (px)
Citation preview

Edward Mac Gillavry
KOLEREKAARTKOLEREKAART28 september – Amersfoort28 september – Amersfoort

Amsterdam Geografische web applicaties Web cartografie
Open geo data: OpenStreetMap, SRTM Open source geo software: Leaflet, PostGIS Open geo standards: OGC én neogeografie!
WEBMAPPER: what the map can beWEBMAPPER: what the map can be
WEBMAPPER: what the map can beWEBMAPPER: what the map can be
Edward Mac Gillavry
@emacgillavry
Baukje Rienks
@sabeare
Hans Fast
@hpfast

ERFGOED APPS : DROOMBEEKERFGOED APPS : DROOMBEEK

NATIONAAL ARCHIEF – MAPIT1418NATIONAAL ARCHIEF – MAPIT1418

DRENTS ARCHIEF – ANNODRENTEDRENTS ARCHIEF – ANNODRENTE
http://www.annodrenthe.nu/kaart
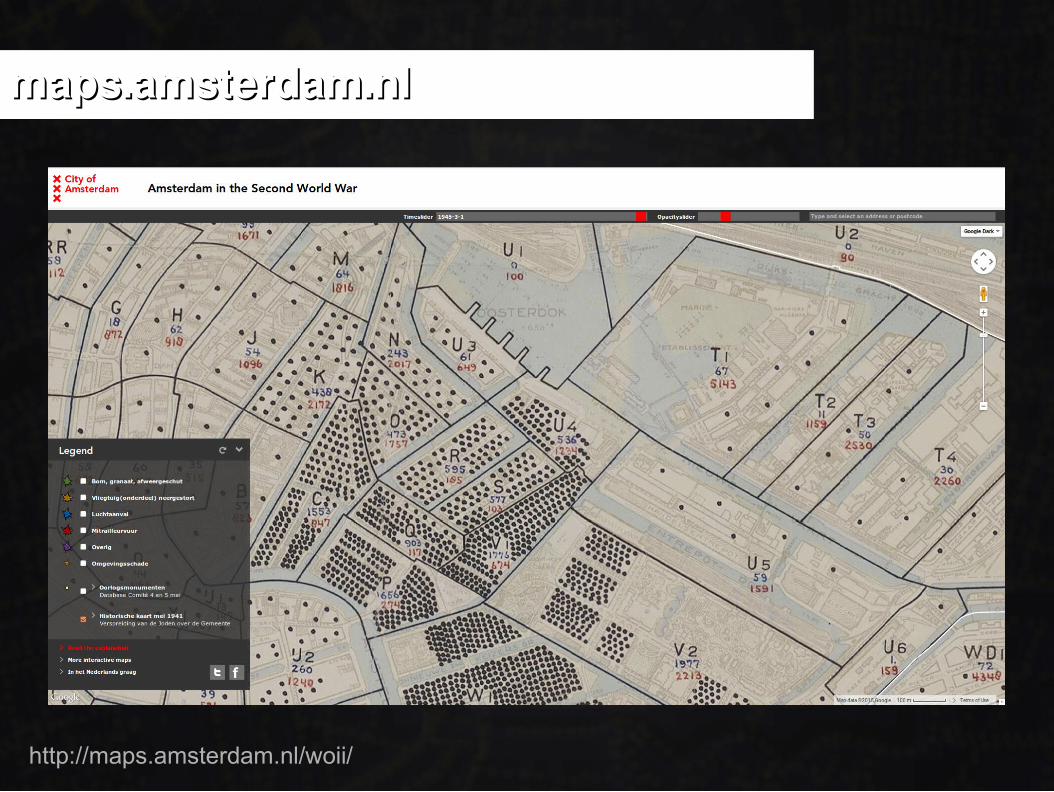
maps.amsterdam.nlmaps.amsterdam.nl
http://maps.amsterdam.nl/woii/
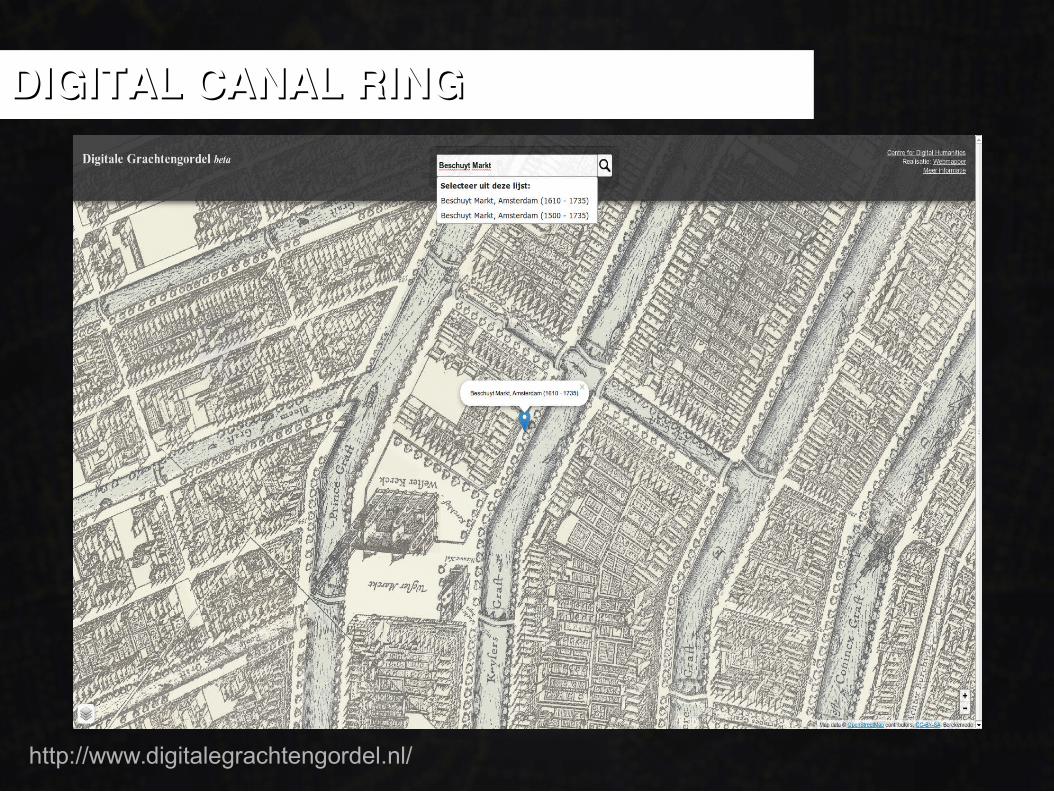
DIGITAL CANAL RINGDIGITAL CANAL RING
http://www.digitalegrachtengordel.nl/
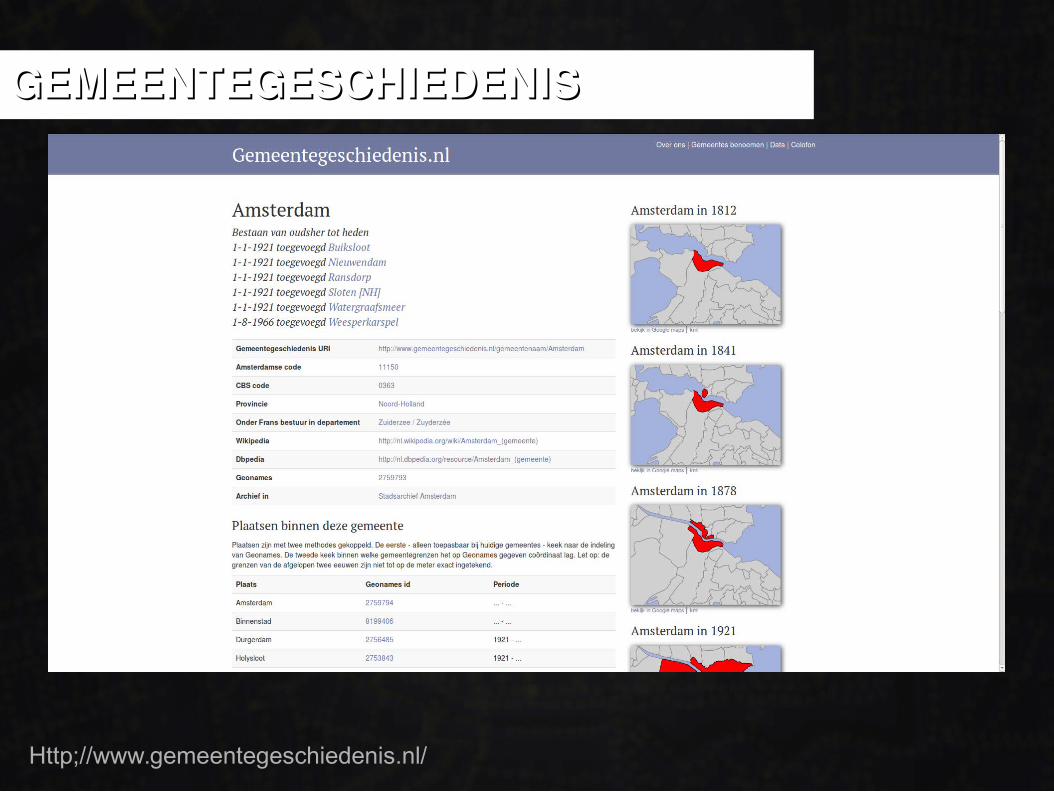
GEMEENTEGESCHIEDENISGEMEENTEGESCHIEDENIS
Http;//www.gemeentegeschiedenis.nl/

HISTOGRAPH VOOR CLIO-INFRAHISTOGRAPH VOOR CLIO-INFRA
https://www.clio-infra.eu/visualize

ERFGOED-TOEPASSINGEN?ERFGOED-TOEPASSINGEN?
https://twitter.com/ErfGeo/status/644522266122940416

KOLEREKAARTKOLEREKAART

JOHN SNOWJOHN SNOW: CHARLES CHEFFINS: CHARLES CHEFFINS

NIEUWE VISUALISATIESNIEUWE VISUALISATIES
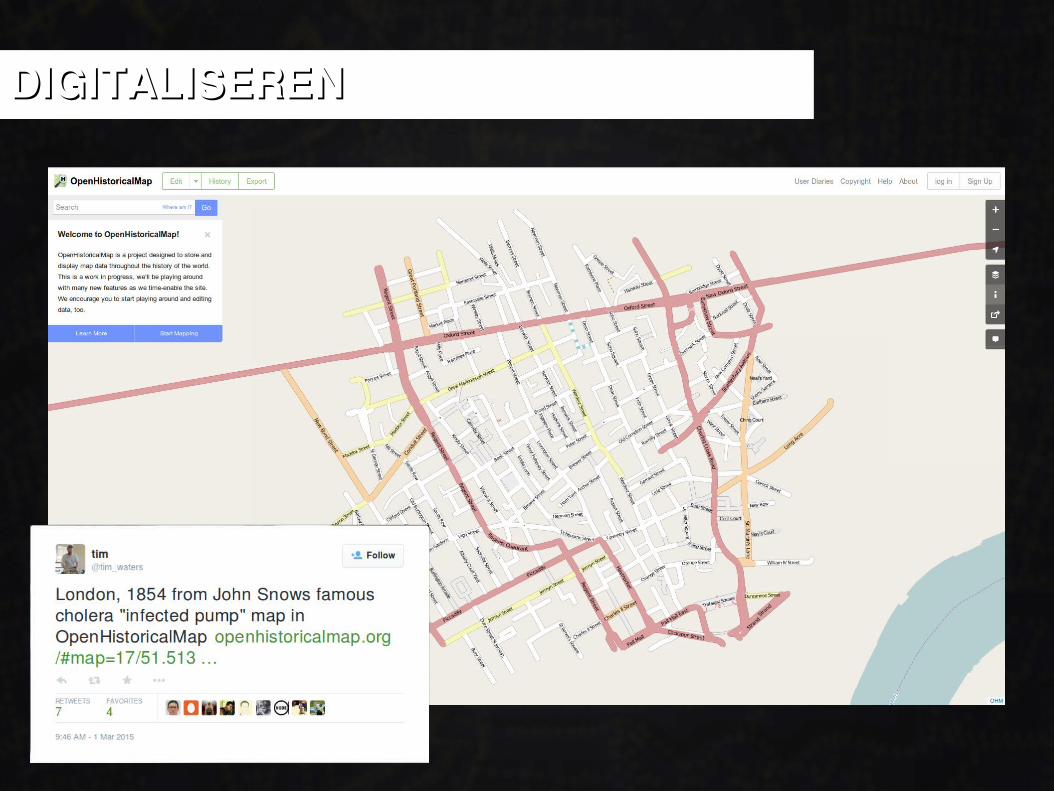
DIGITALISERENDIGITALISEREN

AMSTERDAM: 1866AMSTERDAM: 1866
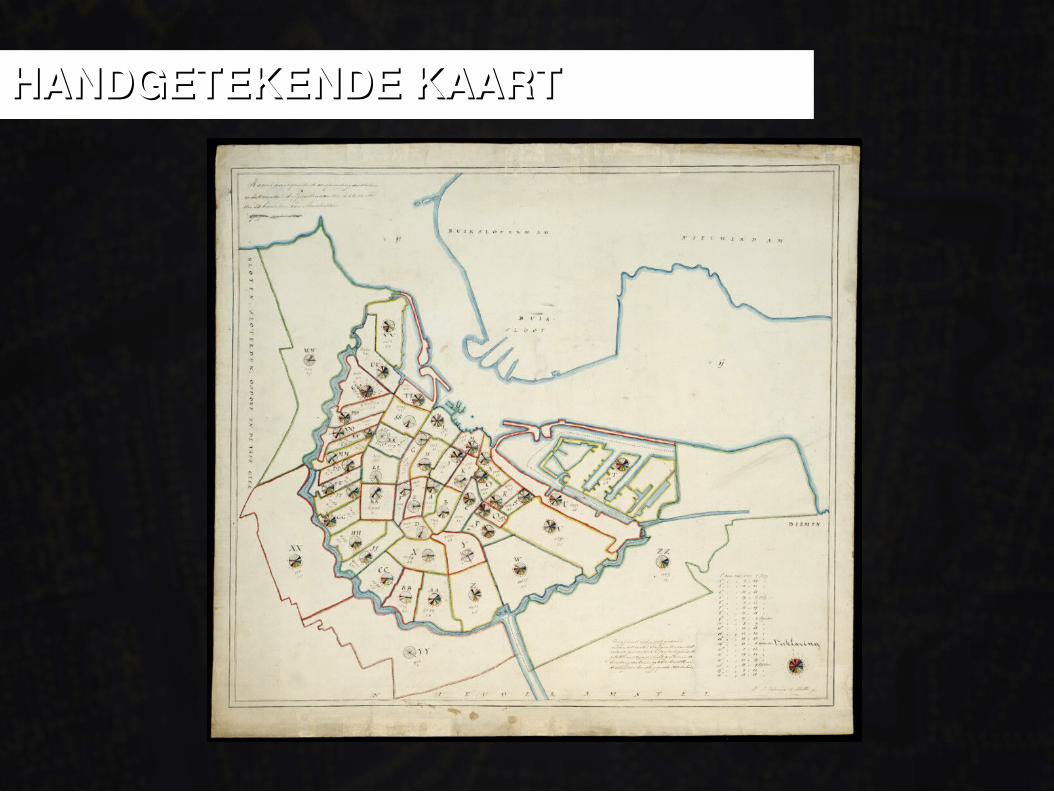
HANDGETEKENDE KAARTHANDGETEKENDE KAART

RAPPORT CHOLERACOMMISSIERAPPORT CHOLERACOMMISSIE
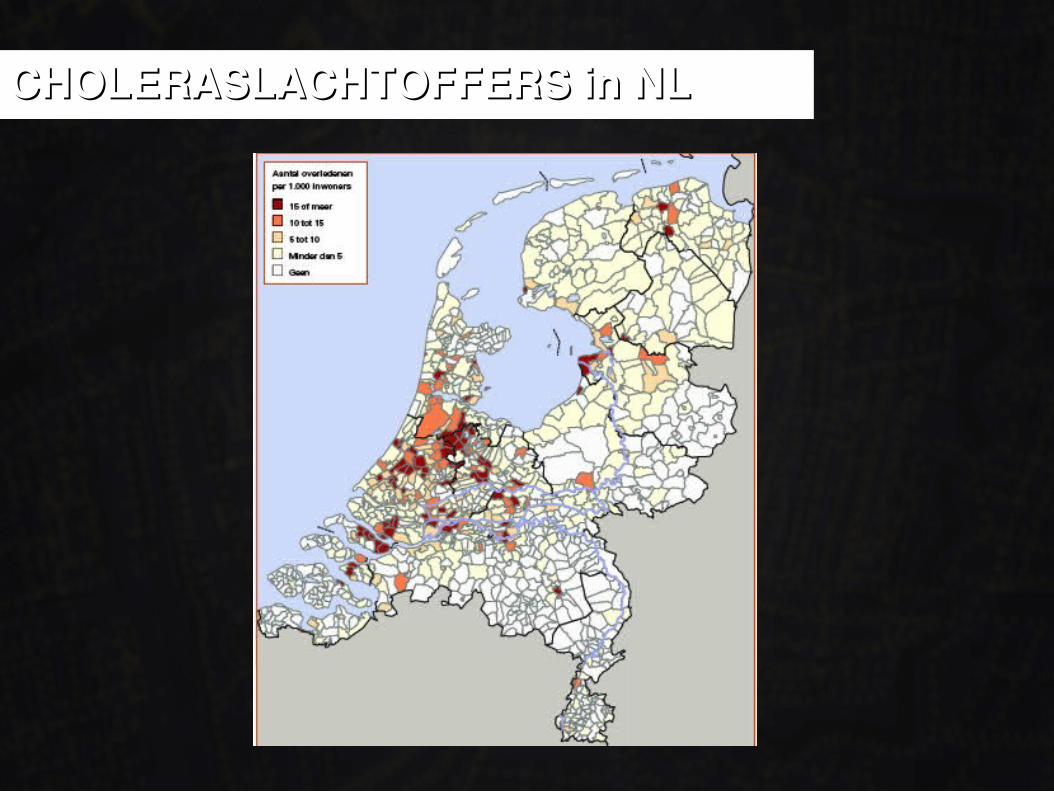
CHOLERASLACHTOFFERS in NLCHOLERASLACHTOFFERS in NL

WATERLEIDINGWATERLEIDING
Amsterdamsche Duinwater-Maatschappij 1851 Eerste waterpomp Haarlemmerpoort in 1853 In 1866:
56 openbare waterpompen 8505 abonnees

PROJECTAANPAKPROJECTAANPAK

GEOREFERERENGEOREFEREREN
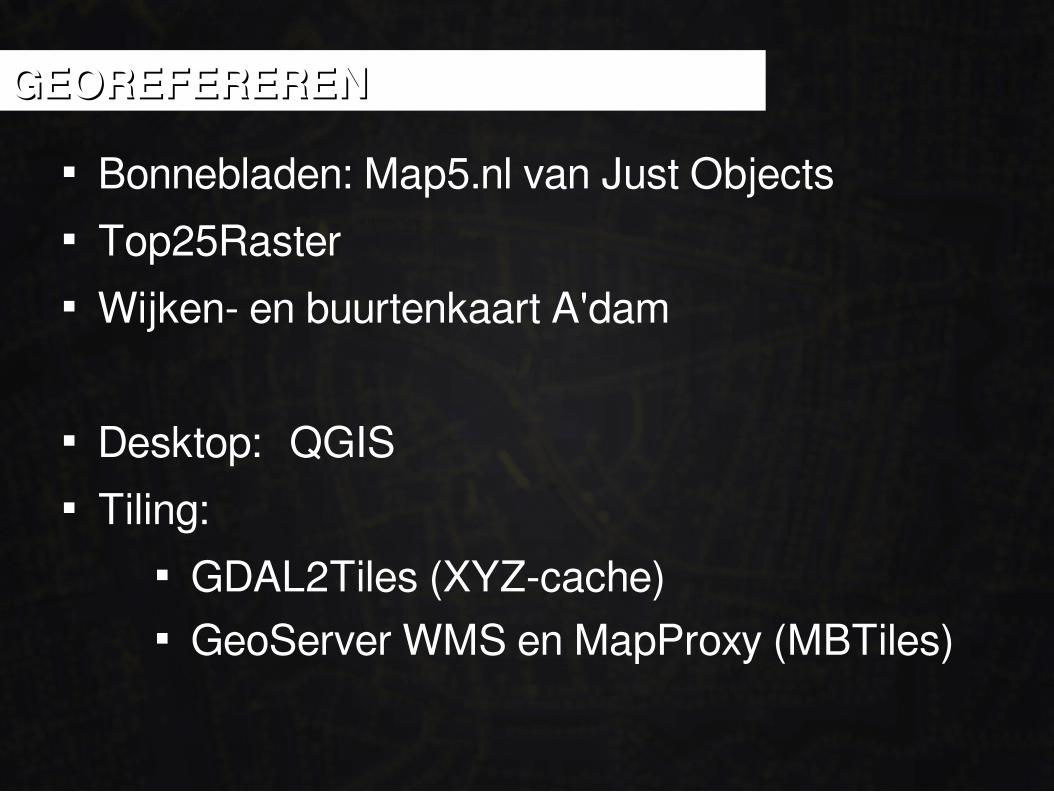
Bonnebladen: Map5.nl van Just Objects Top25Raster Wijken- en buurtenkaart A'dam
Desktop: QGIS Tiling:
GDAL2Tiles (XYZ-cache) GeoServer WMS en MapProxy (MBTiles)
GEOREFERERENGEOREFEREREN


WMS Kaarttegels
Elk schaalniveaus Vaste schaalniveaus
Op afroep Voorgebakken
Dynamische gegevens Statische gegevens
Herprojecteren Vaste projectie
Enkele gebruikers Heel veel gebruikers
Een plaatje per gebruiker Opslagcapaciteit: 1 + 4 + 16 + 64 + …
Gemakkelijk in te bedden in HTML Vereist meestal een JavaScript bibliotheek
Langzaam Snel, snel, snel, snel, snel
Afbreukrisico!
WAAROM KAARTTEGELSWAAROM KAARTTEGELS

Zoom level 0 Zoom level 1 Zoom level 2
Zoomniveau Kaartgrootte (pixels) Aantal tiles Resolutie (meters/pixel) Schaalgetal (bij 96 dpi)
0 256 x 256 1 x 1 = 1 156.543,034 591.658.711
1 512 x 512 2 x 2 = 4 78.271,517 295.829.355
2 1.024 x 1.024 4 x 4 = 16 39.135,758 147.914.678
3 2.048 x 2.048 8 x 8 = 64 19.567,879 73.957.339
4 4.096 x 4.096 16 x 16 = 256 9.783,940 36.978.669
5 8.192 x 8.192 32 x 32 = 1.024 4.891,970 18.489.335
6 16.384 x 16.384 64 x 64 = 4.096 2.445,985 9.244.667
7 32.768 x 32.768 128 x 128 = 16.384 1.222,992 4.622.334
8 65.536 * 65.536 256 x 256 = 65.536 611,496 2.311.167
9 131.072 x 131.072 512 x 512 = 262.144 305,748 1.155.583
10 262.144 x 262.144 1.024 x 1.024 = 1.048.576 152,874 577.792
SPHERICAL MERCATOR TEGELSSPHERICAL MERCATOR TEGELS

RESULTAATRESULTAAT

DIGITALISERENDIGITALISEREN

Buurtgrenzen digitaliseren in QGIS Bewerken met GRASS Bewaren als TopoJSON
DIGITALISERENDIGITALISEREN
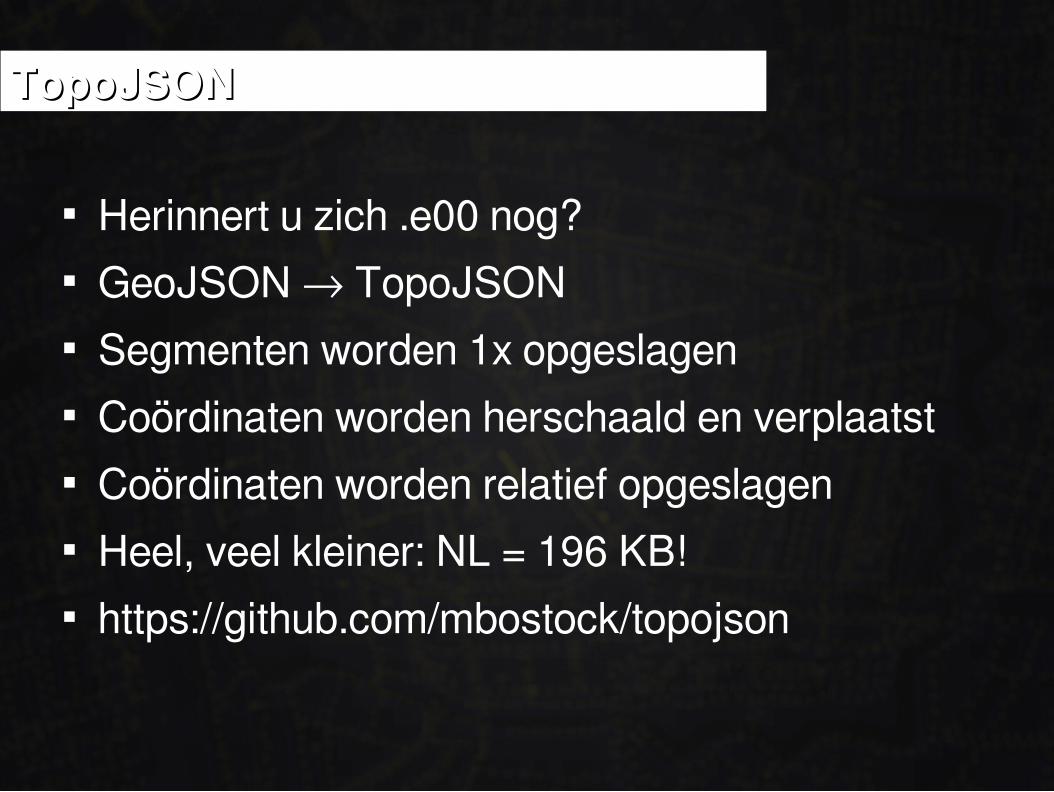
Herinnert u zich .e00 nog? GeoJSON → TopoJSON Segmenten worden 1x opgeslagen Coördinaten worden herschaald en verplaatst Coördinaten worden relatief opgeslagen Heel, veel kleiner: NL = 196 KB! https://github.com/mbostock/topojson
TopoJSONTopoJSON

http://bl.ocks.org/webmappergists/43202cab650806a04c46

NIEUWE VISUALISATIES: D3.jsNIEUWE VISUALISATIES: D3.js

D3 = DATA DRIVEN DOCUMENTSD3 = DATA DRIVEN DOCUMENTS

Mike Bostock: http://bost.ocks.org/mike/ New York Times, maar nu freelance Datajournalisme TopoJSON JavaScript-bibliotheek Scalable Vector Graphics (Illustrator, InkScape)
ACHTERGRONDACHTERGROND

Architectuur: D3.js doet alles (bijvoorbeeld o.b.v. d3.carto) D3.js samen met Leaflet.js
Fantastisch voor thematische cartografie Eigenschappen uit aparte .csv-bestanden D3.js heeft veel statistische mogelijkheden
Scalable Vector Graphics biedt veel interactie! Let's make a map: http://bost.ocks.org/mike/map/
D3.js GEBRUIKEND3.js GEBRUIKEN

D3.js: KAART EN GRAFIEK SAMEN!D3.js: KAART EN GRAFIEK SAMEN!

HISTORISERENDE CARTOGRAFIEHISTORISERENDE CARTOGRAFIE

HUIDIGE VISUALISATIONSHUIDIGE VISUALISATIONS

Reproductierechtvergoeding (UvA): Privé-gebruik: gratis Web-gebruik per beeld: € 200,00
Publication in any form is only possible after obtaining the written permission of the VU Amsterdam Uninversity Library, department of Special Collections/HDC
OPEN DATA IN DE ERFGOEDSECTOROPEN DATA IN DE ERFGOEDSECTOR
Edward Mac Gillavry
www.webmapper.net
HARTELIJK DANK!HARTELIJK DANK!