Embed Size (px)
Citation preview
B-1
Appendix B:Analysis of Faunal Materials fromFeature 8, Prince Henry Avenue Lot
Susan Trevarthen Andrews

B-2
B-3
INTRODUCTION
In October of 2002, the Center for ArchaeologicalResearch at the College of William and Mary sub-mitted for analysis faunal remains excavated fromFeature 8, a Civil War feature excavated at City Point.(Feature 8 is described above with the results fromthe Prince Henry Avenue study area.) An initial in-spection of the bones revealed that they were verywell preserved and largely intact. Based on the overallpreservation, the lack of major recovery bias, andthe large percentage of identifiable bones, both par-ties agreed that all the bones would be analyzed. Intotal, after the bones were mended within their owncontexts, 826 bones were sorted, identified, and ana-lyzed to provide some insights into the foodway pat-terns of the Union Army while located at City Point(Table B-1).
Faunal remains from Civil War sites not only re-veal what species were present in the soldier’s diet,they also provide critical information on butcherypatterns, available cuts of meat, and animal hus-bandry practices. Bone studies from Union andConfederate sites can also be used to confirm orquestion what has traditionally been written aboutrations and the relative importance of certain typesof meat. For example, historical documentation onthe Civil War suggests salt pork was the principalration issued to troops on both sides of the war,while faunal analysis, at least from Union sites, hasindicated beef was the main meat in the diet. Dis-crepancies in the two sources of data indicate thatthere are still many questions that need to be an-swered about military rations. Only by closely ex-amining the historical accounts along with thearchaeological evidence, can a more complete pic-ture be drawn on military provisioning during theCivil War.
City Point is one site that will provide some in-teresting insights into the provisioning patterns ofthe Union Army. Located in Hopewell, Virginia,along the James River, City Point’s strategic posi-tion served as the headquarters for Grant and theUnion Army from 1864 to 1865. More importantthan being the headquarters for the Union Army,City Point was also the supply base for the Uniontroops fighting at Petersburg and the surroundingarea. Rations were not only stored there, but largeherds of cattle were maintained to supply the Unionforces with fresh beef. For this reason, the faunalassemblage from City Point will provide a uniqueopportunity to examine the foodway patterns of anarmy that had a direct link to the source of rations.
The goal of this report is to first examine thefaunal remains from Feature 8 to determine whatthe archaeological record discloses about subsistencepatterns of the Union Army headquarters duringthe last year of the Civil War. Secondly, historicalaccounts will be investigated to reveal what has beenwritten about the type of rations supplied to theUnion army, how they were provided, the role ofrations in the soldier’s diet, and specific referencesto food being supplied and prepared at City Point.Thirdly, any differences between the faunal andwritten record will be compared and discussed inan attempt to reveal biases that may be present ineach source of data. Finally, another objective of thisreport is to provide a detailed faunal analysis of theCity Point pit that can be easily added and com-pared to the growing database of faunal assemblagesfrom other Civil War sites. As this database contin-ues to grow and further research is done on the his-torical documents, Union camp life during the CivilWar can be better understood.
B-4
The first section of this report will discuss thespecific laboratory and analytical techniques usedto examine the faunal remains from the Union en-campment site. The second section of the reportwill separately examine the faunal remains excavatedfrom the Upper Fill of the pit and those remainsfrom the Lower Fill of the pit. Historical texts willbe used to look at the role of rations in the UnionArmy and finally, whenever possible, the faunal datawill be compared to faunal assemblages from otherCivil War sites.
RECOVERY METHODS
The first, most basic step in zooarchaeological analy-sis is to evaluate the methods used to recover thefaunal material. The bones from the City Point pitwere from soil that had either been excavated orscreened through quarter-inch mesh. Quarter-inchscreening is a standard technique used on historic-period sites, although there are some sites that arenot screened at all. As early as 1969, David Tho-mas demonstrated in his article on quantitativemethods for faunal analysis that screening has anenormous positive influence on the recovery of bone,particularly the recovery of smaller or more fragileelements. The smaller the screen size, the better therecovery rate, but the amount of time required toscreen through one-eighth-inch screen must beweighed against the gains in recovery rates. Thecombination of quarter-inch screening and flotationsampling is a responsible compromise that allowscomparison with a large number of sites that havebeen excavated similarly.
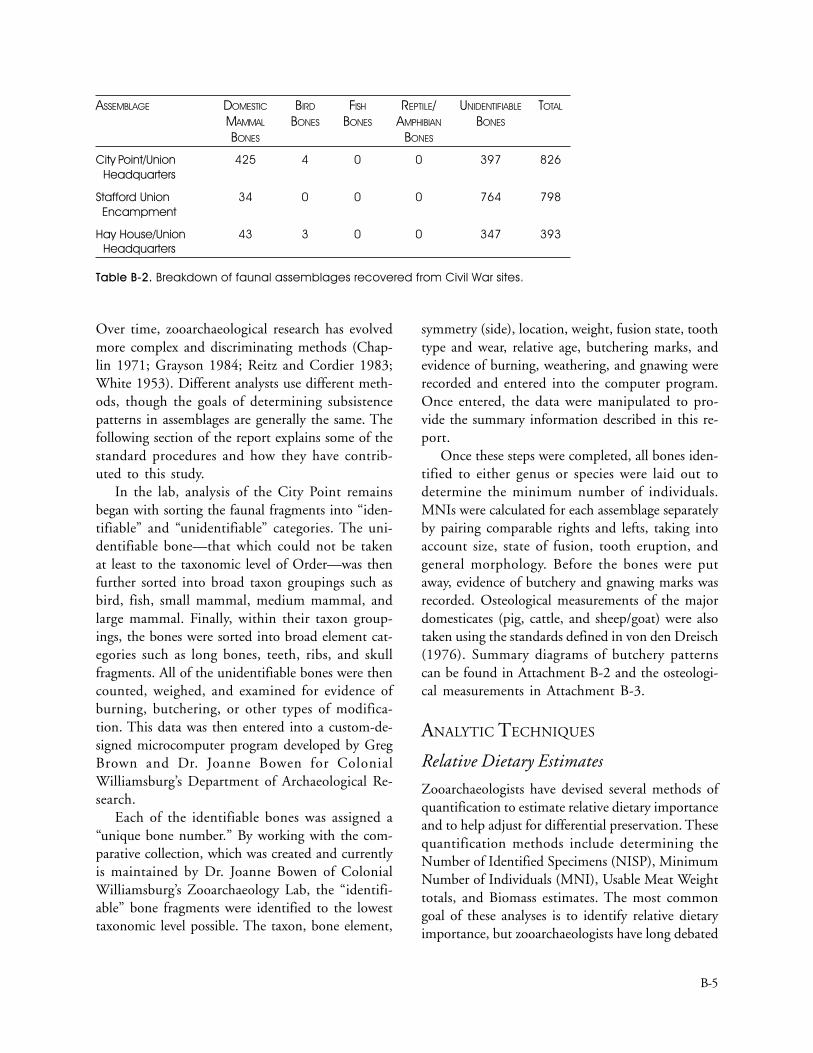
Most of the identified bones in the assemblagesincluded the more durable elements such as mam-malian long bones and teeth. Only four chickenbones were recovered and no fish, turtle, or smallmammal elements were identified in any of the as-semblages. Normally, the overwhelming presenceof large mammal bones in faunal assemblages wouldsuggest either biases in recovery techniques or a re-flection of taphonomic influences on the bones.However, as with what has been seen in other CivilWar assemblages, the lack of bird, fish and smallmammal bones in Feature 8 appears typical of fau-nal assemblages from other Civil War sites (TableB-2). For example, the breakdowns of bones exca-vated from both a Union encampment site locatedin Stafford, Virginia and from a Union headquar-ters located in New Bern, North Carolina, also dem-onstrate a lack of fish, amphibian/reptile, and birdbones (Andrews 2000, 2002).
Both of these assemblages also have a high per-centage of unidentifiable bones, suggesting thatthere was a considerable amount of bone fragmen-tation occurring on the sites which may account forthe lack of the more fragile, smaller bones. How-ever, all of the unidentifiable bones from these siteswere recorded as either being from large or mediumsized mammals. The well-preserved City Point as-semblage does not have the high degree of fragmen-tation and still it lacks the smaller, more fragile bones.All of these Union sites suggest that the dominat-ing presence of the domestic mammal bones is areflection of dietary choices rather than recoverybiases.
LAB TECHNIQUES
The study of animal bones from archaeological sitesis a burgeoning field that is still developing newanalytical techniques that influence how faunal as-semblages are interpreted. Early on, until the 1960s,the pioneers of zooarchaeology concentrated on pro-ducing “species lists,” simply naming the variousspecies that were represented on an archaeologicalsite. By counting the bone fragments from eachspecific species, zooarchaeologists attempted to es-timate the importance of some animals over others.
ASSEMBLAGE IDENTIFIABLE UNIDENTIFIABLE TOTAL
BONE BONE BONE
Upper Fill 52 98 150(I, II, and IIA in East Half)Lower Fill 377 299 676(III and IV in East Half)
Overall Totals 429 397 826
Table B-1. Assemblages analyzed.
B-5
Over time, zooarchaeological research has evolvedmore complex and discriminating methods (Chap-lin 1971; Grayson 1984; Reitz and Cordier 1983;White 1953). Different analysts use different meth-ods, though the goals of determining subsistencepatterns in assemblages are generally the same. Thefollowing section of the report explains some of thestandard procedures and how they have contrib-uted to this study.
In the lab, analysis of the City Point remainsbegan with sorting the faunal fragments into “iden-tifiable” and “unidentifiable” categories. The uni-dentifiable bone—that which could not be takenat least to the taxonomic level of Order—was thenfurther sorted into broad taxon groupings such asbird, fish, small mammal, medium mammal, andlarge mammal. Finally, within their taxon group-ings, the bones were sorted into broad element cat-egories such as long bones, teeth, ribs, and skullfragments. All of the unidentifiable bones were thencounted, weighed, and examined for evidence ofburning, butchering, or other types of modifica-tion. This data was then entered into a custom-de-signed microcomputer program developed by GregBrown and Dr. Joanne Bowen for ColonialWilliamsburg’s Department of Archaeological Re-search.
Each of the identifiable bones was assigned a“unique bone number.” By working with the com-parative collection, which was created and currentlyis maintained by Dr. Joanne Bowen of ColonialWilliamsburg’s Zooarchaeology Lab, the “identifi-able” bone fragments were identified to the lowesttaxonomic level possible. The taxon, bone element,
symmetry (side), location, weight, fusion state, toothtype and wear, relative age, butchering marks, andevidence of burning, weathering, and gnawing wererecorded and entered into the computer program.Once entered, the data were manipulated to pro-vide the summary information described in this re-port.
Once these steps were completed, all bones iden-tified to either genus or species were laid out todetermine the minimum number of individuals.MNIs were calculated for each assemblage separatelyby pairing comparable rights and lefts, taking intoaccount size, state of fusion, tooth eruption, andgeneral morphology. Before the bones were putaway, evidence of butchery and gnawing marks wasrecorded. Osteological measurements of the majordomesticates (pig, cattle, and sheep/goat) were alsotaken using the standards defined in von den Dreisch(1976). Summary diagrams of butchery patternscan be found in Attachment B-2 and the osteologi-cal measurements in Attachment B-3.
ANALYTIC TECHNIQUES
Relative Dietary Estimates
Zooarchaeologists have devised several methods ofquantification to estimate relative dietary importanceand to help adjust for differential preservation. Thesequantification methods include determining theNumber of Identified Specimens (NISP), MinimumNumber of Individuals (MNI), Usable Meat Weighttotals, and Biomass estimates. The most commongoal of these analyses is to identify relative dietaryimportance, but zooarchaeologists have long debated
ASSEMBLAGE DOMESTIC BIRD FISH REPTILE/ UNIDENTIFIABLE TOTAL
MAMMAL BONES BONES AMPHIBIAN BONES
BONES BONES
City Point/Union 425 4 0 0 397 826 Headquarters
Stafford Union 34 0 0 0 764 798 Encampment
Hay House/Union 43 3 0 0 347 393 Headquarters
Table B-2. Breakdown of faunal assemblages recovered from Civil War sites.
B-6
their relative strengths and weaknesses (Grayson1984; Reitz and Cordier 1983; Wing and Brown1979). In our view, each measure provides a differ-ent measure of relative importance, and thereforewe regularly compute all four estimates, a step thatallows us to take advantage of the strengths of each,as well as to make the broadest possible compari-sons of our data with the work of others.
NISP
At the simplest level, the Number of IdentifiedSpecimens (NISP) is used to calculate the relativeabundance of any species within a faunal assem-blage. After identification, all the bones within eachspecies are added together to determine the fre-quency of fragments for each animal. Though stillperhaps the most frequently used measure of abun-dance, this method has several shortcomings, mostnotably its assumption that the bones beingcounted are representative of the sampled popula-tion, and that each item is independent of everyother item. There is no way, however, to demon-strate which bone fragments came from differentindividuals across an entire faunal sample. Otherproblems with this method include the unequalnumbers of bones in different classes, differentialpreservation rates, uneven fragmentation rates thatoccur with different classes and sizes of animals, andmisrepresentation of complete skeletons that are of-ten intermixed with fragmented pieces from an in-determinate number of individuals (Grayson 1984).
From an interpretive standpoint, NISP repre-sents only the number of fragments identified totaxon. It does not directly consider the differencesin size and meat weight between various classes ofanimals. For this reason, as well as the potential bi-ases described above, many zooarchaeologists havecome to the conclusion that this technique alonecannot provide an accurate assessment of the rela-tive dietary importance of various species.
MNI
One popular method for estimating species abun-dance is the method called Minimum Number ofIndividuals (MNI). While NISP attempts to calcu-late the maximum number of individuals on a site,
MNI most often establishes the minimum numberof animals by examining the most common elementfor each taxon. Taking into consideration differencesin age, sex, and size for each taxon, the rights andlefts of each of the main elements are carefullymatched. Once comparisons are completed, theindividual MNI for each element is considered, andby taking into consideration gross size and age dif-ferences, a figure representing the entire animal isderived.
The MNI effectively corrects for the differentialnumber of bones found in bird, mammal, and fishskeletons, as it also corrects for the presence of com-plete skeletons. But the thoroughness of the ana-lyst, the units of aggregation, and the sample sizeall affect the interpretation of an MNI figure. Ac-curate estimations of dietary importance based onMNI require a large number of bones, since in smallassemblages infrequently occurring animals are over-represented. As Grayson (1984) pointed out, MNIvalues are intimately tied to units of aggregation,and therefore, in small samples the least commonspecies on a site will be overemphasized. While thisproblem is greatly diminished in larger samples, theMNIs, no matter how well executed, do not pro-vide a true dietary estimate. Since large and smalltaxa are given equal weight, this method produces askewed picture of the relative dietary importance.For example, one pig and one cow are presented asequally important in dietary terms, despite the dif-ferences in pounds of meat (Grayson 1984).
Usable Meat Weight
In the 1950s Theodore White introduced to thefield a method that would translate MNIs into di-etary estimates. To obtain a rough estimate of therelative importance of different taxa, the MNI for agiven taxon was multiplied by the average amountof usable meat derived from an estimate of meatyield. Average values used in this study are basedon the average weight of modern wild birds, mam-mals, turtles, and rough estimates for the more vari-able fish. Domestic livestock weights are based oncolonial figures from historic records and from “his-toric breeds” research, making them far more real-istic than modern livestock weights. Averages used
B-7
for this study are largely those developed by HenryMiller (1984) in his dissertation.
Since this method relies on MNI directly, us-able meat weight estimates suffer from the sameproblems inherent in the MNI method. In smallassemblages, particularly those where even the morefrequently occurring taxa are represented by onlyone or two MNI, the least frequently occurring taxaare grossly inflated.
Biomass
The fourth technique that is quickly becoming astandard procedure in zooarchaeological analysis isknown as the “biomass” or “skeletal mass allom-etry” method. Unlike other methods, this methodis based on the biological premise that the weightof bone is related to the amount of flesh it sup-ports. Since two dimensions of an animal grow in arelatively predictable exponential curve, an equa-tion relating the two can be derived. Developed forzooarchaeology by Elizabeth Reitz and other schol-ars, this method is based on firm biological ground.Body size and body weight can then be determinedfrom the size of a bone element, since a specificquantity of bone represents a predictable amountof tissue (Reitz and Cordier 1983; Reitz and Scarry1985). This estimate, therefore, provides a balanceto the NISP and MNI methods. It successfullycounters the problem of interdependence, since itaccounts for the presence/absence of partial andcomplete skeletons. It does not rely on thorough-ness or assemblage composition, and fragmentationis not a problem. It does, however, require that eachbone (or set of bones) be weighed individually.
In a later section, where relative dietary estimatesare used to show trends over time, biomass esti-mates have been used, despite the fact that all ofthe early analyses by Miller, Bowen, and others arebased on usable meat weight. However, recent re-search by Bowen and others have shown biomassestimates to be far more consistent than meat weightestimates (Bowen in Walsh et al. 1997). In general,it allows the weight of the fragments identified onlyto class to become part of the dietary estimates, itavoids the idiosyncrasies of the MNI method, and
it circumvents the “averaging” problem that plaguesany assemblage containing a large proportion of fish.
Taphonomy
There are many physical, chemical, and biologicalprocesses that modify the appearance of bones andaffect the interpretations of faunal assemblages fromarchaeological sites. The study of these mechanismsis known as “taphonomy,” or the study of environ-mental phenomena and processes that affect organicremains after death (Efremov 1940). The determi-nation of which cuts of meat are represented in afaunal assemblage begins with the careful analysisof taphonomic modifications. Identifying alterationsresulting from natural processes such as tempera-ture variation that can dry out, split, or otherwisedegrade bone, carnivores and rodents that gnawbone, and human feet that can further fragmentbone, is the important first step. Equally impor-tant is identifying modifications resulting from cul-tural activities such as butchering with an ax, cleaver,or saw. Modifications resulting from percussiontools look to the unschooled and unwary much likestress fractures resulting from temperature variation(Bonnichsen and Sorg 1989; Gifford 1981; Johnson1985; Lyman 1987).
During the identification phase of this project,burn marks, evidence of gnawing, weathered ap-pearance, and butchering evidence were recorded(Tables B-3–B-5). In these assemblages, bones wererecorded as “burned” only if they exhibited distinc-tive charring or scorch marks. Experiments on cook-ing bones, by either roasting or boiling, has shownthat it often takes extreme temperatures to produceburn marks on a bone. The size and density of thebone, combined with the temperature and type ofcooking, influences the appearance of burn markson bones (Pearce and Luff 1994). For this reason,there may have been other bones in the assemblagesthat had been burned and cooked but not recordedas having been burned. Evidence of the bones be-ing gnawed was apparent from puncture holes madeby canine teeth or by specific gnawing patterns lefton the surface of the bone. Carnivores such as dogswill typically gnaw on the soft ends of long bones
B-8
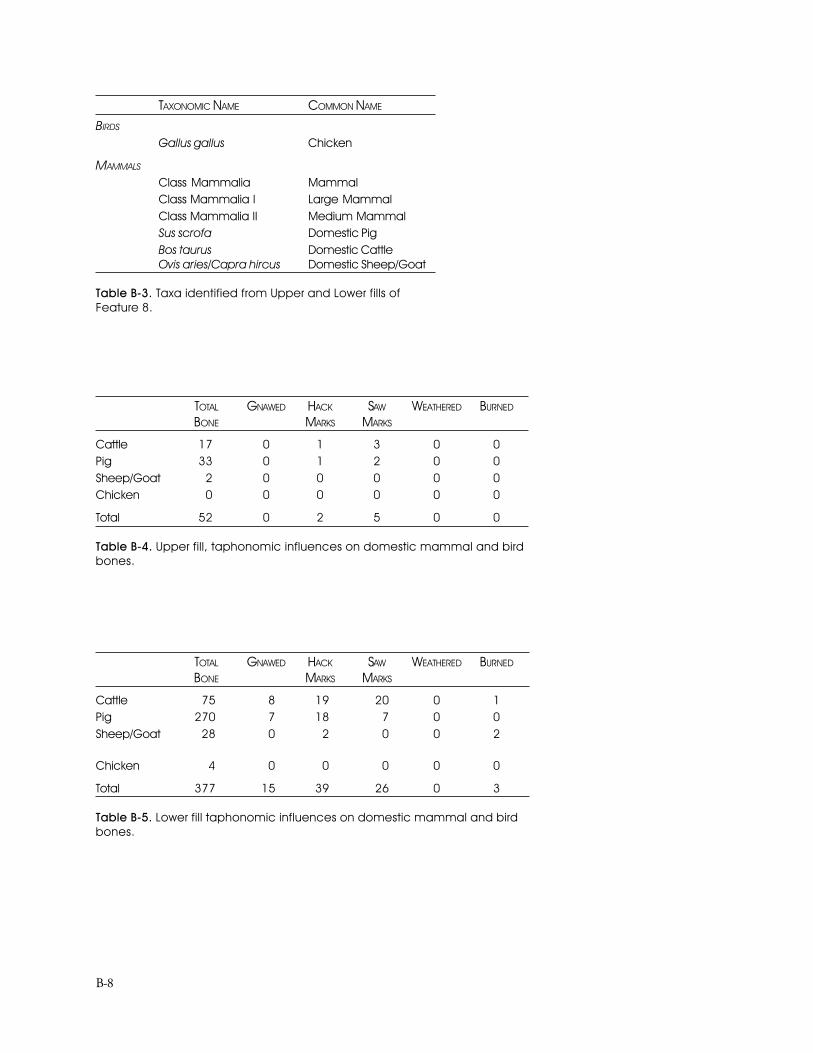
TAXONOMIC NAME COMMON NAME
BIRDS
Gallus gallus Chicken
MAMMALS
Class Mammalia MammalClass Mammalia I Large MammalClass Mammalia II Medium MammalSus scrofa Domestic PigBos taurus Domestic CattleOvis aries/Capra hircus Domestic Sheep/Goat
Table B-3. Taxa identified from Upper and Lower fills ofFeature 8.
TOTAL GNAWED HACK SAW WEATHERED BURNED
BONE MARKS MARKS
Cattle 17 0 1 3 0 0Pig 33 0 1 2 0 0Sheep/Goat 2 0 0 0 0 0Chicken 0 0 0 0 0 0
Total 52 0 2 5 0 0
Table B-4. Upper fill, taphonomic influences on domestic mammal and birdbones.
TOTAL GNAWED HACK SAW WEATHERED BURNED
BONE MARKS MARKS
Cattle 75 8 19 20 0 1Pig 270 7 18 7 0 0Sheep/Goat 28 0 2 0 0 2
Chicken 4 0 0 0 0 0
Total 377 15 39 26 0 3
Table B-5. Lower fill taphonomic influences on domestic mammal and birdbones.
B-9
to create channels that allow them to get at themarrow. Smaller bones belonging to fish, birds, andsmall mammals are easily broken and digested bycarnivores, so there is rarely any evidence of carni-vore gnawing on these bones. Gnaw marks left byrodents are distinguished by a characteristic pat-tern made by incisor teeth and therefore were re-corded separately from carnivore marks.
Bones were recorded as having a weathered ap-pearance if the surface of the bone was cracked orflaking. A weathered appearance on the surface of abone can occur if bones are left in the open, wherethey can be exposed to extreme temperatures andthe changing elements. Usually if bones are left ex-posed for a period of time, they are also susceptibleto gnawing by animals and fragmentation due tothe trampling of feet. Weathering can also occurwhen the chemistry of the soil has a direct influ-ence on bone preservation. Generally speaking, ifthe soil environment is acidic, then the mineral con-tent of the bone will be removed. According to Car-bone and Keel (1985), bones will not survive verywell under conditions where the pH is lower than6.3.
Finally, butchering leaves obvious taphonomicsigns on the bone. Although most of the faunal ma-terial from the Upper and Lower Fills from Feature8 had probably been butchered, almost half of thefaunal remains were highly fragmented, resultingin bones too small to identify to species or to ele-ment. Those butchered bones that could be identi-fied to element and species were recorded ondrawings in Attachment B-2. All of the butcheredidentifiable elements from the City Point assem-blage were primarily long bones that had either beenhacked by an ax or cleaver or had been sawn. Wher-ever the cut was placed, the resulting piece of meatwould probably have been substantial since it gen-erally would have included almost half the element.
Age Data
Another form of faunal analysis, the determinationof the age at which an animal was slaughtered, isimportant because it provides data critical to thestudy of animal husbandry and agricultural econo-mies. In general terms, “kill-off ” patterns are deter-
mined by several aging techniques, including evalu-ating the relative size and characteristics of the bone,tooth wear, and the degree of fusion of the longbone epiphyses.
Essential for any study of animal husbandry, evi-dence for the age of slaughter is based on individualbone that can be “aged,” i.e., a long bone that hasone or more epiphyseal ends or a mandible havingeither the fourth premolar and one or more molars.Once the “age” has been determined for each indi-vidual bone, then they are aggregated to form thedemographic structure of the dead herd, known as“kill-off,” or slaughter patterns. As with so manyother techniques in zooarchaeology, these methodsrequire assemblages with large numbers of ageablebones and/or teeth.
Briefly, the process of epiphyseal fusion is basedon general developmental morphology. There arethree growth areas in a typical mammalian longbone: the shaft or diaphysis and epiphyses on ei-ther end, separated by cartilage that is progressivelyossified as the epiphyses “fuse” to the shaft. Therate at which these epiphyses fuse varies, on eitherend of the same bone and among different elements.By noting which epiphyses are fused and which arenot in animals of known age, the sequence of bonefusion can be determined. This sequence appears tobe fairly consistent for a species, but can vary withindifferent breeds of the same species. The age at whichepiphysial fusion occurs can also be influenced bydiet and environmental factors.
Even though the exact age at which long bonesfuse can vary, the process and sequence of bone fu-sion remains the same and thus can serve as a guideto relative age. Following the outlines on epiphy-seal fusion from Raymond Chaplin (1969) and J.Watson (1987), the fused or unfused condition ofthe epiphyses of the limb bones from the City Pointpit were recorded whenever possible for cattle,caprines (sheep and goat), and swine.
Unfortunately, neither of the assemblages con-tained sufficient numbers to reconstruct kill-off pat-terns from mandibular tooth wear for any of thedomesticates. Neither was long bone data from cattleand sheep/goat strong enough to be able to makeinterpretation of animal husbandry practices. Even
B-10
if the two assemblages are combined together intoone assemblage, there are only seven cattle bonesand 15 sheep/goat bones that could be used for cal-culating age distribution patterns. However, thepresence of at least 112 pig bones with epiphysealends has allowed for some basic interpretations andinsights into the kill-off patterns for pigs. Age dis-tribution tables for all of the domesticates are in-cluded in Attachment B-1.
RESULTS OF THE FAUNAL ANALYSIS
FROM THE CITY POINT SITE
Taxa Identified
There were a total of 826 bones analyzed from theCity Point pit, with at least 52% of bones identi-fied to genus or species. A total of four differentspecies were identified including three domesticmammal and one domestic bird species. A list ofeach species by their taxonomic and common namescan be found in Table B-3.
Before relative dietary importance, meat cuts,taphonomic processes, and husbandry patterns fromthe Union site are discussed in detail, it is necessaryto briefly describe the habitat, availability, and eco-nomic importance of each animal. Although the fol-lowing paragraphs provide brief summaries on eachidentified species, more in-depth information canbe obtained from the field guides, traveler’s ac-counts, and wild game and livestock managementtexts listed in the references.
BIRDS
Chicken. All of the four domestic chicken (Gallusgallus) bones came from the Lower Fill of the CityPoint Pit. Chickens were probably found on mostrural and some urban properties throughout theeighteenth and nineteenth centuries. They were easyto raise and, though often kept in hen houses, theywere also allowed to roam free. Chickens provided ayear-round source of meat and their eggs were pre-pared in a number of ways: roasted, boiled, fried,broiled, and minced (Noël Hume 1978). Althougheggs and poultry were not included in the day today rations issued by the government, Union sol-
diers found other ways to acquire them. They couldpurchase them from sutlers, who made a businessof supplying food and other items to troops, or theycould have acquired them by foraging throughnearby farms and houses (Billings1993). Althoughonly four chicken bones were found in the assem-blage, chickens and other poultry were considereda precious commodity during the Civil War when-ever the soldiers had access to them.
DOMESTIC MAMMALS
Pig. The most frequently identified species wasdomestic pig (Sus scrofa) including 33 elements fromthe Upper Fill and 270 elements from the LowerFill. Although the ranking of pork among early di-ets may be argued by some, it is clear the domesticpig was an important food source from the initialyears of settlement on through the twentieth cen-tury. Pigs were and still are an efficient, inexpensiveanimal for farmers to raise, and their meat, beingeasily salted, was the best choice for use as a year-round source of preserved meat (Bowen 1990a).Allowed to roam in the woodlands, it fed on mast,roots, and whatever else was available. They requiredlittle care, were prolific breeders, and rapidly grewto slaughter weight. In addition, pigs provided 65–80% of dressed meat per individual after slaughter,in comparison to cattle, which provided only about50–60% (Reitz et al. 1985). According to docu-mentary sources salt pork became a principal meatration for both the Union and Confederate armies.It was appreciated not only because it could be pre-served and easily sent as rations to the troops, but italso provided an excellent source of energy for sol-diers on the march.
Cattle. There were 17 bones from the UpperFill and 75 bones from the Lower Fill identified asdomestic cattle (Bos taurus). Cattle arrived with theearly colonists, quickly flourishing in the woodlandenvironment. As early as the 1620s, herds had be-come so large that beef became the mainstay of boththe northern and southern diet, a pattern that stoodfirm throughout the colonial period (Miller 1984,Bowen 1990a, 1990b). Cattle were almost univer-sally raised on farms to provide their owners notonly meat, but also milk and dairy products. Un-
B-11
like pork, beef did not preserve particularly well,and salt beef was never as important as salt pork(Bowen 1992; Price and Schweigert 1971). Thus,cattle were killed and the meat distributed duringthe slaughtering season, usually fall or winter.Around 50–60% of a cow’s body weight could beused for edible meat which, loosely translated,means typically 400 pounds of meat could have beenused from a mature cow in the eighteenth-century(Miller 1984).
During the Civil War, beef was provided as aration to the soldiers both as preserved meat andfresh meat. When preserved, it was thoroughly pen-etrated with salt and commonly referred to as “salthorse” by the troops. Much more appreciated bythe men was the fresh beef that came freshly slaugh-tered from government herds that were kept nearcamp.
Sheep/Goat. Two bones from the Upper Fill and28 bones from the Lower Fill were identified as ei-ther sheep (Ovis aries) or goat (Capra hircus). De-spite their outward appearance, these species areusually grouped together by faunal analysts becausethey are almost skeletally indistinguishable. Thecaprine remains that were identified, however, werenot suitable for such differentiation, and it is notclear which species was represented. Although, con-sidering the time period and what has been foundin other urban assemblages the remains are prob-ably from sheep.
Goats were introduced to the New World, pos-sibly with the first arrivals, but certainly with thefirst supplies. Goats were hardy, they browsed onundergrowth, and they were better able to protectthemselves from predators than sheep (Dandoy1997; Walsh et al. 1997). With the first years ofcolonization, they supplied both milk and meat,but as fields were established and predators broughtunder better control, sheep were introduced in in-creasingly large numbers (Walsh et. al. 1997). Whilepigs and cows were allowed to roam free, sheep neverbecame really profitable since they were unable todefend themselves from predators and would notfreely reproduce (Reitz 1979; Walsh et al. 1997).By the 1690s, however, when the wolf populationdeclined and more pasture land became available,
sheep were raised in increasingly more numbers(Walsh et al. 1997). While sheep were raised pri-marily for their wool, the byproduct, mutton, re-mained a relatively small but important meat sourceof meat (Noël Hume 1978: Walsh et al. 1997).Although there are only a few sheep/goat bones ex-cavated from the City Point pit, mutton was in-cluded as an ingredient in several recipes given inthe Military Handbook for Soldiers in 1861 (BeadlePublishers 1861).
Taphonomic Influences
The following paragraphs briefly describe each ofthe taphonomic influences and how they influencedthe bones from both the Upper and Lower Fills ofthe City Point pit (see Tables B-4 and B-5).
UPPER FILL
After the bones from the pit were separated intothe two assemblages, a total of 52 domestic mam-mal bones from the Upper Fill were analyzed fortaphonomic influences (see Table B-4). While noneof the bones appear to have been burned, weath-ered, or gnawed, there are seven bones that appearto have been butchered using either a saw, ax, orcleaver. Elements that had been butchered using asaw include a femur, rib, and innominate from acow, as well as an innominate and humerus from apig. Bones that had been hacked using an ax or acleaver include a pig scapula and a cow vertebra. Asmentioned earlier, only bones that were identifiedto species and element were examined for evidenceof butchering. For this reason, there may have beenunidentifiable bones that had also been hacked orsawn but were not recorded as butchered or includedin the description of taphonomic influences.
LOWER FILL
A total of 377 domestic mammal and domestic birdbones from the Lower Fill were analyzed for tapho-nomic influences (see Table B-5). While there wereno bones with a weathered appearance, there wereat least one cattle and two sheep/goat bones thatappeared to have been burned. As mentioned inthe “Analytic Techniques” section of this report, it
B-12
often takes extreme temperatures to produce burnmarks on a bone so there may be other bones inthis assemblage that had been burned but do notexhibit a charred appearance.
In addition to the burned bones, there were also15 cattle and pig bones that have gnaw marks con-sistent of a carnivore. As mentioned earlier, evidenceof carnivore gnawing is apparent from punctureholes left by canine teeth or by specific gnawingpatterns left on the surface of the bone. Carnivoressuch as dogs will typically gnaw on the soft ends oflong bones to create channels that allow them toget at the marrow. Smaller bones belonging to fish,birds, and small mammals are easily broken anddigested by larger carnivores, so usually there isminimal evidence of carnivore gnawing on thesebones.
Marks left by butchering was noted on a total of65 bones including 19 cattle bones, 18 pig bones,and 2 sheep/goat bones that had been hacked witheither an ax or a cleaver. Both the cattle and pigbones that had been hacked include vertebrae,sacrums, innominates, scapulas, and ribs. In addi-tion to these elements, hacked pig and sheep/goatbones also include several long bones and a calca-neous bone. There are also 20 cattle bones and 7pig bones that had been butchered using a saw. Themajority of these elements include innominates,ribs, long bones, and vertebrae. Like the Upper Fillassemblage, only bones from the Lower Fill thatwere identified to species and element were exam-ined for evidence of butchering. For this reason,there may have been unidentifiable bones that hadalso been hacked or sawn but were not recorded asbutchered or included in the description of tapho-nomic influences.
Relative Dietary Importance
The following section discusses the relative dietaryimportance of each taxon based on each of the fourmain quantification methods mentioned earlier inthe “Analytic Techniques” section of this report. Itmust be realized that these are relative measures andthey do not reflect anything absolute about theamount of meat provided.
UPPER FILL
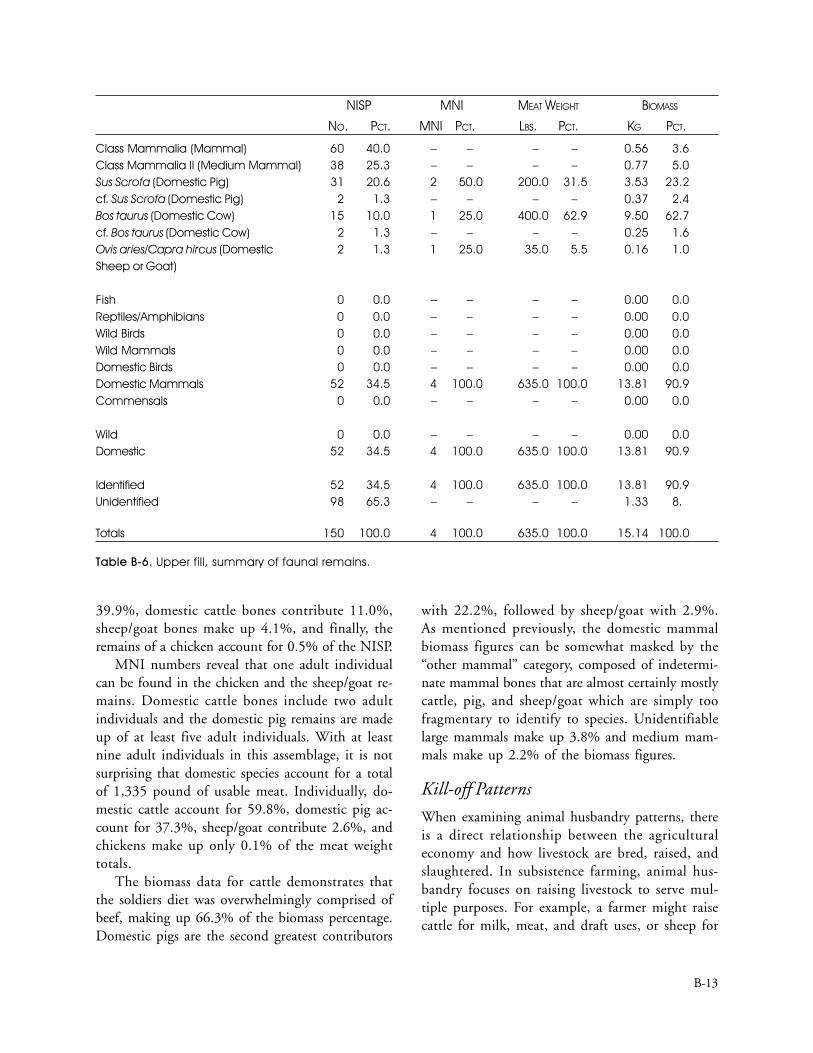
When the bones from the City Point pit were sortedinto the two assemblages, the Upper Fill produceda total of 150 bones, of which 34.5% are identifi-able to at least three species (Table B-6). As theNISP numbers reveal, unidentifiable mammal re-mains make up the largest percentage, totaling65.3%. In terms of identifiable bones, domestic pigare the highest contributors to the NISP at 21.9%,followed by domestic cattle at 11.3%, and finallysheep/goat at 1.3%.
When looking at the MNI values, domestic cattleand sheep/goat each contribute one adult individual,while two adult individuals represent domestic pig.In terms of meat weight, the domestic mammalsmake up a total of 635 pounds of meat. When look-ing at the species individually, domestic cattle havethe greatest amount of usable meat weight (62.9%),followed by pig (31.5%), and sheep/goat (5.5%).
When the bone weight is taken into account,domestic cattle also contribute the greatest amountto the biomass percentages accounting for 64.3%of the total diet. Domestic pigs make up 25.6% ofthe biomass totals and sheep/goat only contributes1.0% to the overall diet. It must also be kept inmind that the domestic mammal figures can besomewhat masked by the “other mammal” category,composed of indeterminate mammal bones that arealmost certainly cattle, pig, and sheep/goat whichare simply too fragmented to identify to species.Unidentifiable mammal bones make up 3.6% andmedium mammals make up 5.0% of the biomassfigures. It is interesting to note that no unidentifi-able large mammal remains were present in the as-semblage.
LOWER FILL
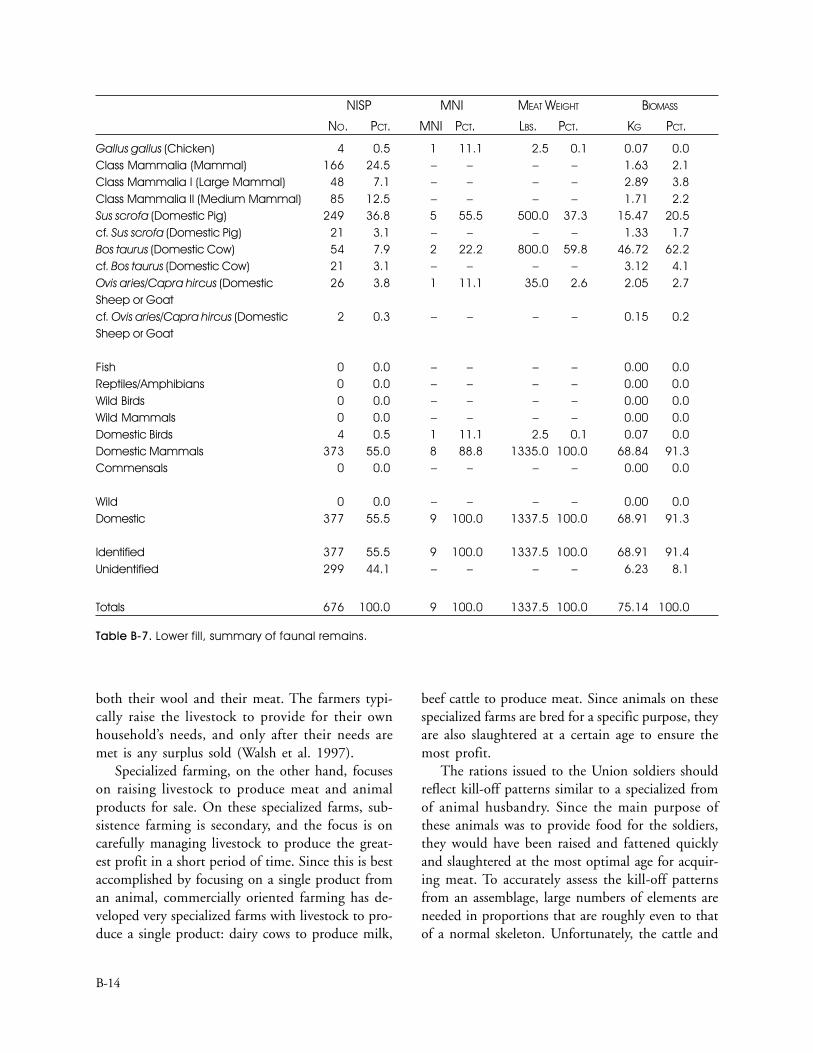
As the larger of the two assemblages, the Lower Fillproduced a total of 676 bones, of which 377 bonesare identifiable to four different species (Table B-7). Typically in faunal assemblages from historic sites,only 25–30% of the bones can be identified to spe-cies. The Lower Pit faunal assemblage is unique inthat 55.5% of the bones were identifiable. As theNISP figures show, domestic pig bones account for
B-13
NISP MNI MEAT WEIGHT BIOMASS
NO. PCT. MNI PCT. LBS. PCT. KG PCT.
Class Mammalia (Mammal) 60 40.0 – – – – 0.56 3.6Class Mammalia II (Medium Mammal) 38 25.3 – – – – 0.77 5.0Sus Scrofa (Domestic Pig) 31 20.6 2 50.0 200.0 31.5 3.53 23.2cf. Sus Scrofa (Domestic Pig) 2 1.3 – – – – 0.37 2.4Bos taurus (Domestic Cow) 15 10.0 1 25.0 400.0 62.9 9.50 62.7cf. Bos taurus (Domestic Cow) 2 1.3 – – – – 0.25 1.6Ovis aries/Capra hircus (Domestic 2 1.3 1 25.0 35.0 5.5 0.16 1.0Sheep or Goat)
Fish 0 0.0 – – – – 0.00 0.0Reptiles/Amphibians 0 0.0 – – – – 0.00 0.0Wild Birds 0 0.0 – – – – 0.00 0.0Wild Mammals 0 0.0 – – – – 0.00 0.0Domestic Birds 0 0.0 – – – – 0.00 0.0Domestic Mammals 52 34.5 4 100.0 635.0 100.0 13.81 90.9Commensals 0 0.0 – – – – 0.00 0.0
Wild 0 0.0 – – – – 0.00 0.0Domestic 52 34.5 4 100.0 635.0 100.0 13.81 90.9
Identified 52 34.5 4 100.0 635.0 100.0 13.81 90.9Unidentified 98 65.3 – – – – 1.33 8.
Totals 150 100.0 4 100.0 635.0 100.0 15.14 100.0
Table B-6. Upper fill, summary of faunal remains.
39.9%, domestic cattle bones contribute 11.0%,sheep/goat bones make up 4.1%, and finally, theremains of a chicken account for 0.5% of the NISP.
MNI numbers reveal that one adult individualcan be found in the chicken and the sheep/goat re-mains. Domestic cattle bones include two adultindividuals and the domestic pig remains are madeup of at least five adult individuals. With at leastnine adult individuals in this assemblage, it is notsurprising that domestic species account for a totalof 1,335 pound of usable meat. Individually, do-mestic cattle account for 59.8%, domestic pig ac-count for 37.3%, sheep/goat contribute 2.6%, andchickens make up only 0.1% of the meat weighttotals.
The biomass data for cattle demonstrates thatthe soldiers diet was overwhelmingly comprised ofbeef, making up 66.3% of the biomass percentage.Domestic pigs are the second greatest contributors
with 22.2%, followed by sheep/goat with 2.9%.As mentioned previously, the domestic mammalbiomass figures can be somewhat masked by the“other mammal” category, composed of indetermi-nate mammal bones that are almost certainly mostlycattle, pig, and sheep/goat which are simply toofragmentary to identify to species. Unidentifiablelarge mammals make up 3.8% and medium mam-mals make up 2.2% of the biomass figures.
Kill-off Patterns
When examining animal husbandry patterns, thereis a direct relationship between the agriculturaleconomy and how livestock are bred, raised, andslaughtered. In subsistence farming, animal hus-bandry focuses on raising livestock to serve mul-tiple purposes. For example, a farmer might raisecattle for milk, meat, and draft uses, or sheep for
B-14
both their wool and their meat. The farmers typi-cally raise the livestock to provide for their ownhousehold’s needs, and only after their needs aremet is any surplus sold (Walsh et al. 1997).
Specialized farming, on the other hand, focuseson raising livestock to produce meat and animalproducts for sale. On these specialized farms, sub-sistence farming is secondary, and the focus is oncarefully managing livestock to produce the great-est profit in a short period of time. Since this is bestaccomplished by focusing on a single product froman animal, commercially oriented farming has de-veloped very specialized farms with livestock to pro-duce a single product: dairy cows to produce milk,
beef cattle to produce meat. Since animals on thesespecialized farms are bred for a specific purpose, theyare also slaughtered at a certain age to ensure themost profit.
The rations issued to the Union soldiers shouldreflect kill-off patterns similar to a specialized fromof animal husbandry. Since the main purpose ofthese animals was to provide food for the soldiers,they would have been raised and fattened quicklyand slaughtered at the most optimal age for acquir-ing meat. To accurately assess the kill-off patternsfrom an assemblage, large numbers of elements areneeded in proportions that are roughly even to thatof a normal skeleton. Unfortunately, the cattle and
NISP MNI MEAT WEIGHT BIOMASS
NO. PCT. MNI PCT. LBS. PCT. KG PCT.
Gallus gallus (Chicken) 4 0.5 1 11.1 2.5 0.1 0.07 0.0Class Mammalia (Mammal) 166 24.5 – – – – 1.63 2.1Class Mammalia I (Large Mammal) 48 7.1 – – – – 2.89 3.8Class Mammalia II (Medium Mammal) 85 12.5 – – – – 1.71 2.2Sus scrofa (Domestic Pig) 249 36.8 5 55.5 500.0 37.3 15.47 20.5cf. Sus scrofa (Domestic Pig) 21 3.1 – – – – 1.33 1.7Bos taurus (Domestic Cow) 54 7.9 2 22.2 800.0 59.8 46.72 62.2cf. Bos taurus (Domestic Cow) 21 3.1 – – – – 3.12 4.1Ovis aries/Capra hircus (Domestic 26 3.8 1 11.1 35.0 2.6 2.05 2.7Sheep or Goatcf. Ovis aries/Capra hircus (Domestic 2 0.3 – – – – 0.15 0.2Sheep or Goat
Fish 0 0.0 – – – – 0.00 0.0Reptiles/Amphibians 0 0.0 – – – – 0.00 0.0Wild Birds 0 0.0 – – – – 0.00 0.0Wild Mammals 0 0.0 – – – – 0.00 0.0Domestic Birds 4 0.5 1 11.1 2.5 0.1 0.07 0.0Domestic Mammals 373 55.0 8 88.8 1335.0 100.0 68.84 91.3Commensals 0 0.0 – – – – 0.00 0.0
Wild 0 0.0 – – – – 0.00 0.0Domestic 377 55.5 9 100.0 1337.5 100.0 68.91 91.3
Identified 377 55.5 9 100.0 1337.5 100.0 68.91 91.4Unidentified 299 44.1 – – – – 6.23 8.1
Totals 676 100.0 9 100.0 1337.5 100.0 75.14 100.0
Table B-7. Lower fill, summary of faunal remains.
B-15
sheep/goat remains did not produce enough bonesto make any conclusive statements about their kill-off patterns. There were, however, at least 20 bonesfrom the Upper Fill and 92 bones from the LowerFill which are examined in the following paragraphsin an attempt to make some generalizations aboutthe kill-off patterns for pig. For the purpose of fu-ture comparative work, the epiphyseal fusion tablesfor all of the assemblages are included in Attach-ment B-1.
PIG KILL-OFF PATTERNS
Pigs were an adaptable livestock that were com-monly raised throughout the eighteenth and nine-teenth century. Pig husbandry techniques were verysimilar to cattle husbandry in that it developed fromsubsistence-oriented practices that combined the useof open woodlands and pens. With the increase ofcommercially oriented pig farming came the in-creased use of sties and fattening methods. Slaugh-ter ages have varied, but typically they were killedeither at 8-10 months or at 18–24 months of age.Historians and zooarchaeologists specializing inBritish agriculture have stated that pigs under 12months have been the target slaughter age for sub-sistence farming. Born in the spring, allowed tomature throughout the summer, the pigs would havebeen fattened during the fall and slaughtered as soonas temperature dropped. Pigs intended for sale weretypically slaughtered between 18–24 months of age(Walsh et al. 1997).
As Table B-8 demonstrates, all of the pig bonesfrom the Upper Fill and 75% of the pig bones fromthe Lower Fill were from individuals 24 months andyounger, the target age for commercial farming. Inaddition to the pigs slaughtered before two years ofage, the Lower Fill assemblage also contained a fewolder individuals. At least 14.5% of the pigs wereslaughtered between two and three years of age,6.5% were killed between three and four years ofage, and the remaining 4.0% were from individu-als older than 42 months when they were slaugh-tered. While the soldiers were probably also suppliedwith pork that occasionally came from pigs olderthan two years of age, the presence of the older in-dividuals may also represent animals that may havebeen acquired in raids of local farms.
Element Distribution and Cuts of Meat
Faunal research has demonstrated that the more aconsumer is removed from the production of foods,the more the procurement system determines theavailability of the types and cuts of meat that areavailable to them (Maltby 1979, 1982, 1985;Zeder 1988, 1991). Since most of the food thatthe Union army consumed was directly from theirdaily rations issued by the government, one wouldexpect to find an element distribution similar tothat of a nineteenth century urban site, whose fau-nal remains were regulated by a local market sys-tem. By examining the presence and absence ofcertain skeletal parts it is possible to determine whatparts of the carcass were disposed of, and which partswere available to the consumer, or soldier, to eat.The following section will examine the element dis-tribution patterns for each of the domesticates.
CATTLE ELEMENT DISTRIBUTION
As Table B-9 shows, a total of 17 cattle bones wereexcavated from the Upper Fill, while 75 were re-trieved from the Lower Fill. None of the cattle bonescame from the head or the foot region of the body.Although it is known that cattle were being raisedin the vicinity of City Point, the overwhelming pres-ence of bones from the body suggests that the Unionsoldiers were predominately being supplied withthe more meaty elements of the body.
Fresh beef was supplied to the Union Army fromcattle that were kept near camp, then slaughteredas needed for rations. The butchers, who typicallyhad first choice of the meat, favored certain por-tions of cattle, such as the liver, heart, and tongue(Billings 1993). The lack of cranial bones may be areflection of butchers taking the choice head ele-ments, while the lack of foot bones may also be anindication that waste elements were deposited awayfrom camp.
PIG ELEMENT DISTRIBUTION
Similar to the cattle element distribution patterns,there are very few domestic pig head elements ineither assemblage (Table B-10). Only a single pigtooth fragment from the Upper Fill was excavated,accounting for the only bone identified from the
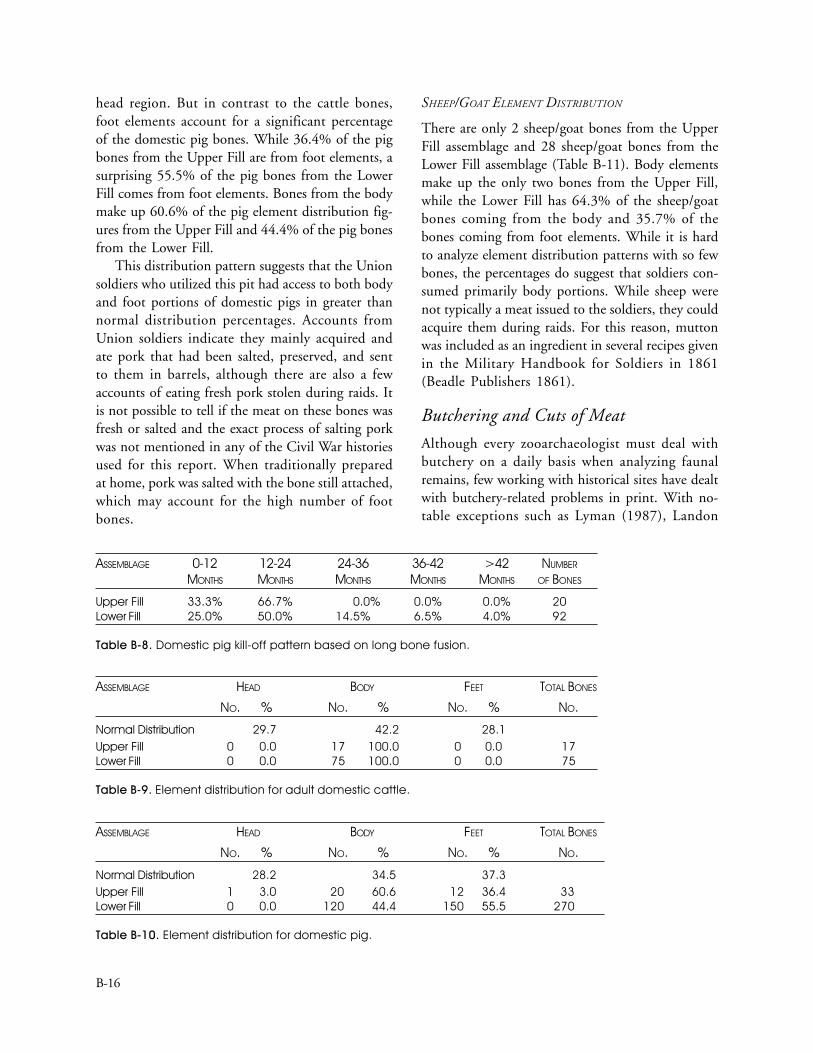
B-16
head region. But in contrast to the cattle bones,foot elements account for a significant percentageof the domestic pig bones. While 36.4% of the pigbones from the Upper Fill are from foot elements, asurprising 55.5% of the pig bones from the LowerFill comes from foot elements. Bones from the bodymake up 60.6% of the pig element distribution fig-ures from the Upper Fill and 44.4% of the pig bonesfrom the Lower Fill.
This distribution pattern suggests that the Unionsoldiers who utilized this pit had access to both bodyand foot portions of domestic pigs in greater thannormal distribution percentages. Accounts fromUnion soldiers indicate they mainly acquired andate pork that had been salted, preserved, and sentto them in barrels, although there are also a fewaccounts of eating fresh pork stolen during raids. Itis not possible to tell if the meat on these bones wasfresh or salted and the exact process of salting porkwas not mentioned in any of the Civil War historiesused for this report. When traditionally preparedat home, pork was salted with the bone still attached,which may account for the high number of footbones.
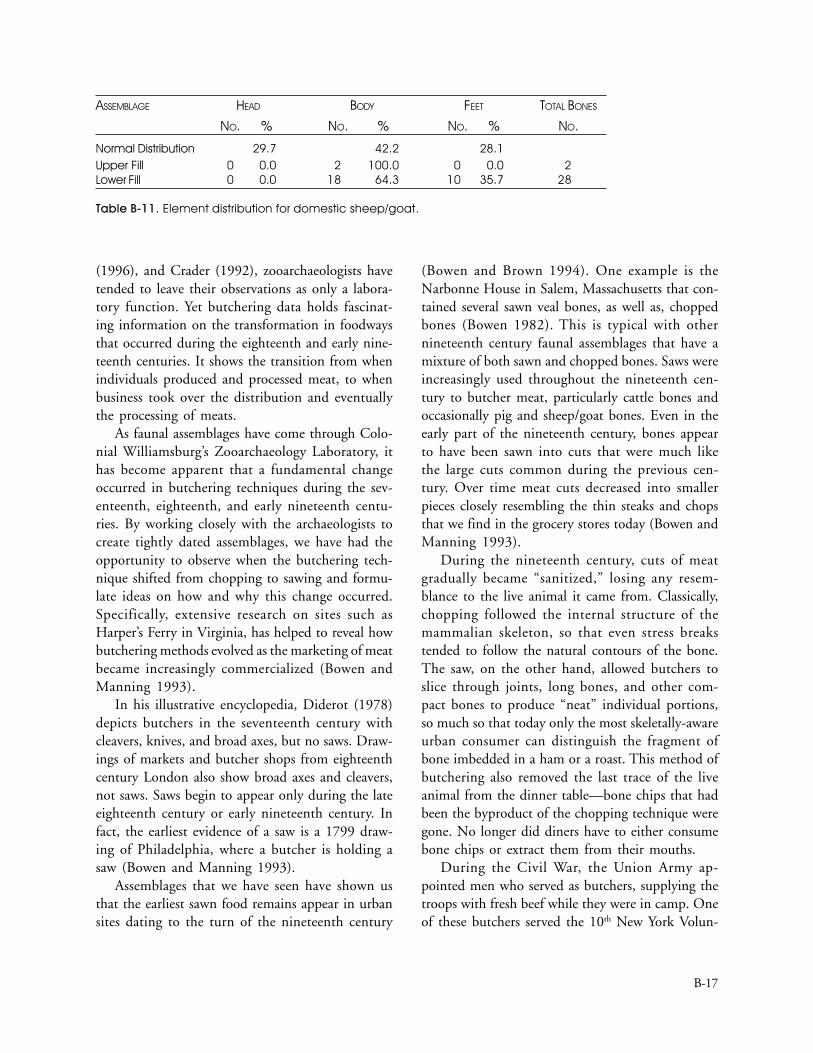
SHEEP/GOAT ELEMENT DISTRIBUTION
There are only 2 sheep/goat bones from the UpperFill assemblage and 28 sheep/goat bones from theLower Fill assemblage (Table B-11). Body elementsmake up the only two bones from the Upper Fill,while the Lower Fill has 64.3% of the sheep/goatbones coming from the body and 35.7% of thebones coming from foot elements. While it is hardto analyze element distribution patterns with so fewbones, the percentages do suggest that soldiers con-sumed primarily body portions. While sheep werenot typically a meat issued to the soldiers, they couldacquire them during raids. For this reason, muttonwas included as an ingredient in several recipes givenin the Military Handbook for Soldiers in 1861(Beadle Publishers 1861).
Butchering and Cuts of Meat
Although every zooarchaeologist must deal withbutchery on a daily basis when analyzing faunalremains, few working with historical sites have dealtwith butchery-related problems in print. With no-table exceptions such as Lyman (1987), Landon
ASSEMBLAGE 0-12 12-24 24-36 36-42 >42 NUMBER
MONTHS MONTHS MONTHS MONTHS MONTHS OF BONES
Upper Fill 33.3% 66.7% 0.0% 0.0% 0.0% 20Lower Fill 25.0% 50.0% 14.5% 6.5% 4.0% 92
Table B-8. Domestic pig kill-off pattern based on long bone fusion.
ASSEMBLAGE HEAD BODY FEET TOTAL BONES
NO. % NO. % NO. % NO.
Normal Distribution 29.7 42.2 28.1Upper Fill 0 0.0 17 100.0 0 0.0 17Lower Fill 0 0.0 75 100.0 0 0.0 75
Table B-9. Element distribution for adult domestic cattle.
ASSEMBLAGE HEAD BODY FEET TOTAL BONES
NO. % NO. % NO. % NO.
Normal Distribution 28.2 34.5 37.3Upper Fill 1 3.0 20 60.6 12 36.4 33Lower Fill 0 0.0 120 44.4 150 55.5 270
Table B-10. Element distribution for domestic pig.
B-17
(1996), and Crader (1992), zooarchaeologists havetended to leave their observations as only a labora-tory function. Yet butchering data holds fascinat-ing information on the transformation in foodwaysthat occurred during the eighteenth and early nine-teenth centuries. It shows the transition from whenindividuals produced and processed meat, to whenbusiness took over the distribution and eventuallythe processing of meats.
As faunal assemblages have come through Colo-nial Williamsburg’s Zooarchaeology Laboratory, ithas become apparent that a fundamental changeoccurred in butchering techniques during the sev-enteenth, eighteenth, and early nineteenth centu-ries. By working closely with the archaeologists tocreate tightly dated assemblages, we have had theopportunity to observe when the butchering tech-nique shifted from chopping to sawing and formu-late ideas on how and why this change occurred.Specifically, extensive research on sites such asHarper’s Ferry in Virginia, has helped to reveal howbutchering methods evolved as the marketing of meatbecame increasingly commercialized (Bowen andManning 1993).
In his illustrative encyclopedia, Diderot (1978)depicts butchers in the seventeenth century withcleavers, knives, and broad axes, but no saws. Draw-ings of markets and butcher shops from eighteenthcentury London also show broad axes and cleavers,not saws. Saws begin to appear only during the lateeighteenth century or early nineteenth century. Infact, the earliest evidence of a saw is a 1799 draw-ing of Philadelphia, where a butcher is holding asaw (Bowen and Manning 1993).
Assemblages that we have seen have shown usthat the earliest sawn food remains appear in urbansites dating to the turn of the nineteenth century
(Bowen and Brown 1994). One example is theNarbonne House in Salem, Massachusetts that con-tained several sawn veal bones, as well as, choppedbones (Bowen 1982). This is typical with othernineteenth century faunal assemblages that have amixture of both sawn and chopped bones. Saws wereincreasingly used throughout the nineteenth cen-tury to butcher meat, particularly cattle bones andoccasionally pig and sheep/goat bones. Even in theearly part of the nineteenth century, bones appearto have been sawn into cuts that were much likethe large cuts common during the previous cen-tury. Over time meat cuts decreased into smallerpieces closely resembling the thin steaks and chopsthat we find in the grocery stores today (Bowen andManning 1993).
During the nineteenth century, cuts of meatgradually became “sanitized,” losing any resem-blance to the live animal it came from. Classically,chopping followed the internal structure of themammalian skeleton, so that even stress breakstended to follow the natural contours of the bone.The saw, on the other hand, allowed butchers toslice through joints, long bones, and other com-pact bones to produce “neat” individual portions,so much so that today only the most skeletally-awareurban consumer can distinguish the fragment ofbone imbedded in a ham or a roast. This method ofbutchering also removed the last trace of the liveanimal from the dinner table—bone chips that hadbeen the byproduct of the chopping technique weregone. No longer did diners have to either consumebone chips or extract them from their mouths.
During the Civil War, the Union Army ap-pointed men who served as butchers, supplying thetroops with fresh beef while they were in camp. Oneof these butchers served the 10th New York Volun-
ASSEMBLAGE HEAD BODY FEET TOTAL BONES
NO. % NO. % NO. % NO.
Normal Distribution 29.7 42.2 28.1Upper Fill 0 0.0 2 100.0 0 0.0 2Lower Fill 0 0.0 18 64.3 10 35.7 28
Table B-11. Element distribution for domestic sheep/goat.
B-18
teers who were also known as the National Zouaves,a regiment that was at the siege of Petersburg andprobably spent some time at City Point. Their regi-mental butcher, Fred Dauenhauer, was describedas a “strong, burly fellow, unmistakably ‘Dutch,’filled with good humor, though noisy and demon-strative at times…he filled his rather onerous posi-tion with considerable tack.” Although his actualbutchering techniques were not described in de-tail, Fred was known to have had “a good eye, and ahead for quantities” (Cowtan 1882).
As the bones from the pit were identified, anyevidence of butchering was recorded, includingwhether the bones had been chopped or sawn.Bones that had been sawn were closely examined todetermine whether they had been sawn by hand orby mechanical means. All of the sawn bones fromthe two assemblages had either hinge scars, irregu-lar/uneven saw scars on the sawn surface, or both.The presence of these characteristics indicates thatthe bones were being butchered with handsaws(Kenyon 1992). Drawings showing the butcheringcuts for each domestic mammal bone were madefor each assemblage indicating the relative abun-dance of different portions of the carcass (see At-tachment B-2). As the butchering drawingsdemonstrate, most of the cattle and pig bones weresawn, although there were also a few bones that hadbeen hacked and several that had been both hackedand sawn.
The following paragraphs will examine each as-semblage and discuss evidence of butchering on thecattle, pig, and sheep/goat elements. As mentionedearlier in the “Analytic Techniques” section of thisreport, a lot of the faunal remains from the pit hadbeen butchered, resulting in many highly frag-mented bones that were simply too small to iden-tify to species or to element. Only those butcheredbones that could be identified to element and spe-cies were recorded on drawings in Attachment B-2and are discussed in the following paragraphs. Inaddition to examining how the bones were butch-ered, some general interpretations will also be madeabout the cuts of meat represented by the butch-ered elements. Using late nineteenth century dia-grams and retail information, the cuts of meat from
beef will be ranked according to their retail valueduring the late nineteenth century. The cuts of porkwill also be examined but in more general termssince twentieth century standards and diagrams willbe referenced.
UPPER FILL
Cattle. In total, there are four butchered adult cattlebones from the Upper Fill, including one thoracicvertebra that had been hacked longitudinally alongthe axis with either an ax or a cleaver and one ribthat had been sawn by hand, leaving the centralportion of the bone. Thoracic vertebrae would havebeen included in either a chuck or a rib cut of beef,while the center portion of ribs could be found incross rib and short rib cuts. An innominate, sawnin two sections of the ilium, would have resulted ina sirloin cut of meat, while a sawn section from afemur would have come from a round cut of beef.Both the sirloin and round cut would have beenconsidered choice pieces of meat using late nine-teenth-century values (Schulz and Gust 1983).
Pig. Butchered pig remains from the Upper Fillinclude a humerus bone sawn through the shaft be-low the proximal epiphyses and just above the dis-tal epiphyses, resulting in a cut of meat from theshoulder section called the picnic shoulder. Also froma picnic shoulder cut of meat is a butchered scapulabone hacked through the neck with either an ax ora cleaver. Finally, there is a sawn innominate bonefrom the leg, butt portion of a pig considered partof a ham cut of meat.
LOWER FILL
Cattle. Butchered adult cattle bones from the LowerFill assemblage include at least eight thoracic verte-brae and nine lumbar vertebrae. The majority ofthese appear to have been hacked longitudinallyalong the axis using either an ax or a cleaver. Whilethe thoracic vertebrae could have been part of ei-ther a chuck or a rib cut of meat, the lumbar verte-brae were probably part of a short loin, consideredto be the most prime cut of beef in the late nine-teenth century (Schulz and Gust 1983). Sirloin wasanother choice cut of beef, which can be found inthree butchered sacrum bones and two of the butch-
B-19
ered innominates. Both of these innominates hadbeen sawn through the ilium, one of the sacrumbones had been sawn along the axis, and the re-maining two sacrum bones had been hacked witheither an ax or a cleaver. There were also three moreinnominates sawn through the ischium, whichwould have been part of a rump cut of beef. All butone of the seven butchered ribs included the headof the rib. These had been sawn about midwaythrough the shaft, suggesting they were part of arib cut of beef. One rib, probably from a short ribcut, had been hacked to include only the bottomsection of the shaft.
Other butchered elements include three sawnfemurs, three sawn scapulas, and one hacked scapula.Two of the femurs were cut just below the proximalepiphyses and just above the midway point of theshaft. The other femur had been sawn just abovethe distal end and just below the midway point ofthe shaft. Using Schulz and Gust’s (1983) late nine-teenth century ranking of cuts of beef, these boneswould have come from a round cut of beef, consid-ered a middle to high quality piece of meat. Finally,all of the scapulas were from large sections of beef,probably from a chuck cut of meat, one of the middleto lower end quality cuts of beef.
Pig. The 24 butchered pig elements from theLower Fill include three cervical vertebrae and threethoracic vertebrae, all hacked with either an ax or acleaver along the axis. The cervical vertebrae wouldhave come from one of the shoulder cuts of pork,while the thoracic vertebrae could have come fromone of the loin cuts of pork. In addition to the butch-ered vertebrae, there is one hacked sacrum, four sawninnominates, and one hacked innominate. Whilethe sacrum would have been from a tenderloin cut,the innominates all suggest a cut of pork from theham portion, specifically the leg, butt area.
Butchered long bones include three femurs thathad all been hacked through the shaft below theproximal epiphyses or just above the distal epiphy-ses. Like the butchered innominate bones, all of thefemurs would have also come from the ham sectionof the pig, making up the center leg cut of the ani-mal. The shank portion of the ham is also repre-sented by the presence of seven tibia bones
predominately hacked with either an ax or a cleaver.Six of the tibias had been cut just below the proxi-mal epiphyses and midway through the shaft, andone tibia had been cut just above the distal end andmidway through the shaft. Finally, there was onecalcaneous bone hacked through the shaft makingup an additional cut of pork from the shank.
RATIONS AND THE STRATEGIC
ROLE OF CITY POINT INFEEDING THE UNION ARMY
Napoleon once said that an army marches on itsstomach. For a soldier in any war, food is of theutmost importance since it can offset extreme fa-tigue, boost morale, and carry a soldier throughmany demanding trials. The Civil War was no ex-ception to this as soldiers in both the Union andConfederate armies depended upon their daily ra-tions or “grub” for their everyday existence. In or-der to understand the role food played in the Unionarmy while in camp and on the march, the follow-ing section will look at the historical written ac-counts for discussions on rations, how soldierssupplemented their diet, and the role City Pointplayed in providing subsistence.
A “ration” was defined as the amount of foodauthorized for one man for one day. In the Unionarmy, a typical camp ration included “twelve ouncesof pork or bacon, or one pound four ounces of saltor fresh beef; one pound six ounces of soft bread orflour, or one pound of hard bread, or one poundfour ounces of corn meal” (Billings 1993:111).While this provided the main allotment for theirmeal, soldiers were also provided with various otheritems such as beans, peas, coffee, rice, sugar, salt,pepper, potatoes, and the occasional vegetable ormolasses to supplement their rations. Rations formarching or campaigning included one pound ofhard bread, three-quarters pound of salt pork or oneand one-fourth pounds of fresh meat plus sugar,coffee, and salt (Billing 1993).
Transporting and supplying food to the UnionArmy fell under the responsibility of the Quarter-master Department and the Commissary of Subsis-tence. The Quartermaster was mainly responsible
B-20
for transporting all goods, including food supplies,to the various Union troops. The Chief Quarter-master for the Army of the Potomac was GeneralRufus Ingalls, who was appointed by General Grantto supply all Union armies operating against Pe-tersburg and Richmond (Quartermaster Museum2002a). Anticipating the importance of the supplydepot at City Point, Ingalls oversaw the construc-tion of many storage areas, train depots, and docksto unload and house all the supplies needed to sup-port 125,000 men and 65,000 animals. During itsoperation, City Point not only became the secondlargest city in Virginia but also played a critical rolein the victory of the Union army. General Grantbestowed his highest praise for Ingalls and his staffwhen he stated, ”There has been no army in theUnited States where the duties of the Quartermas-ter have been so well preformed” (Zinnen 1991).
While the Quartermaster Department was incharge of supplying the food, it was the role of theCommissary Department to receive, store, and is-sue all rations. The Commissary Department wasalso in charge of the feeding, care, and slaughteringof cattle (Quartermaster Museum 2002b). At thebeginning of the war only twelve Commissary Of-ficers were appointed, but this number eventuallyincreased to 29 as the Subsistence Department ex-panded to supply the troops. These SubsistenceOfficers often faced extreme difficulty in feeding thetroops, but without their services the battles thatbrought fame to many a victorious general couldnot have been fought. For the Army of the Poto-mac, Colonel H. F. Clark was appointed as the ChiefCommissary Officer in 1861 (Lord 1960). He over-saw the work of all of the Commissary Officers, in-cluding Captain Benedict, who ran the CommissaryDepartment at City Point (Zinnen 1991).
One officer who first worked for Colonel Clarkwrote of his experiences establishing a subsistenceoffice when he became a Commissary Officer forthe Union troops in Kentucky. In his report, MajorH. C. Symonds commented that from his first ar-rival, his work increased from 3,000 rations a dayto 300,000 rations a day by 1864. Not only was heresponsible for purchasing, receiving, and forward-ing rations to the troops, he also ran a cracker bak-
ery, a bread bakery, three pork packing houses, apickle factory and provided food to 21 hospitals andtheir patients (Symonds 1888).
The job of the Commissary Officer at City Pointwas even more daunting since the standard operat-ing procedure required that they have 30 days ofrations on hand for all personnel, as well as 20 daysof rations for the animals. This meant, that at anytime, City Point housed over 16,000 tons of foodthat could be used to serve 10,800,000 meals. Sinceanimals received a daily ration of 26 pounds of food,there was also an additional 33,800,000 pounds ornearly 17,000 tons of rations for animals. The Com-missary Department organized and stored all of theseitems in the nearly 27,000 square feet of storagespace they had available to them in the warehouseslocated on the wharf (Zinnen 1991). In anotherarea located in the eastern section of City Point, theCommissary also oversaw the bakery, consisting ofseven buildings that daily produced over 100,000loaves of bread. Often, the bread was loaded di-rectly onto the trains and reached the troops whilestill hot (Petersburg National Battlefield 2002).
Although bread often reached the troops beforeit had spoiled, it was one of the job descriptions ofthe Commissary Officer to also ensure that thesalted meats reached the troops before they hadspoiled. Barrels of salted meat were to be rolled overmonthly, inspected frequently to ensure undissolvedsalt still existed, and they were to be kept out of thesun (Quartermaster Museum 2002b). This was of-ten a problem since much of the pork would arrivefrozen from the pork packing houses. When the porkwas sent directly to the front, it often sat in theSouthern sun for hours, eventually rotting as themeat thawed. When faced with this problem, theCommissary Department’s Major H. C. Symondswas able to salvage meat by repacking it after thefrost was removed (Symonds 1888).
In an attempt to free the government from theseextra expenses and from the high costs of meat pack-ing houses they had contracts with, Symonds sug-gested the government get involved in curing andpacking their own pork meat. He demonstrated howthey could save money and also make a profit onitems such as feet, lard, and bristles that could be
B-21
sold to other manufacturers. After much discussion,Symonds was allowed to establish governmentowned pork packing houses. These houses suppos-edly supplied the Union army with some of the besttasting hams (Symonds 1888).
Fresh beef was also supplied to the Union troopsand the Commissary Department at City Pointmaintained on a daily basis 2,500 head of cattlewithin City Point and another similar sized herdacross the James River (Zinnen 1991). Once thecattle was sent to the camps they would have beenput in corrals until the army was on the move. Atthat time, men who acted both as butchers anddrovers were excused from all of their other dutiesso they could herd the cattle to their next destina-tion. When a halt was made for the night, some ofthe steers would then be killed with a rifle, slaugh-tered, and the meat distributed by the Commis-sary Officer (Billings 1993).
Within the Army of the Potomac, the Washing-ton government organized a separate departmentin 1861 to supply the troops with fresh beef. Thisresponsibility fell to Captain John H. Woodwardwho was determined to furnish the army with afresh ration of beef two days of every week. To dothis he first erected a small building, at the presentsite of the Washington Monument, called Head-quarters of the Fresh Beef Department where he kepta supply of beef to supply the army for a week. Laterthe Headquarters were moved to White House, Vir-ginia to better supply the Army of the Potomac asthey were on the move (Volo and Volo 1998).
Woodward kept his main herd of wild steers justoff the western ranges where they often caused con-siderable damage to farms, fences, and growingcrops. When cattle needed to be moved, Woodwardwas considered by his superiors to be one of thebest drovers in the business. For example, in 1864,he was faced with the challenge of crossing the JamesRiver near Petersburg with 3,000 head of wildcattle. Due to the width and depth of the water, itwas not possible for the cattle to swim across theriver. Instead, they had to travel across a pontoonbridge that did not have any side rails and was onlywide enough for two cattle at a time. Woodwardcame up with a plan of having two soldiers on the
bridge followed by two cattle; then two more menfollowed by two more cattle; and so on. This al-lowed the cattle to calmly cross the bridge withoutcrowding and falling into the river. Woodward latercommented it must have been “an inspiring sight,to see more than 3,000 head of wild cattle movingin close order over a bridge nearly a mile long andtwelve feet wide, without a rail on eitherside…steadily and easily and without confusion”(Volo and Volo 1998:125).
Although getting the cattle to their destinationand maintaining such large herds was an impres-sive endeavor for the City Point Commissary De-partment, they were not free from problems. Oneof the ongoing problems Captain Benedict facedwas the constant threat of raids by the Confeder-ates. In an incident known as the “Great BeefsteakRaid,” about 4,000 Confederate soldiers surprisedUnion troops located at Coggin’s Point, a few mileseast of City Point. Along with 300 prisoners, theRebels were able to gather 2,486 head of cattle anddrive them back to their own commissary. Whileone Confederate soldier wrote home “ we are nowhaving Yankee beef every day,” Union soldiers wrotethat they now had to face the taunting commentsof the Rebels who would yell across the lines, “Hey,Yanks, want any fresh beef?” (West 2001).
In addition to fresh beef, other rations were sentfrom the office of the Chief Commissary by rail-road, boat, and wagon to the troops in their campsor on the march. Once the rations arrived, they weredistributed by one of a variety of methods. For ex-ample, one method used when they were on activeduty involved spreading a blanket on the groundand on it the orderly-sergeant piled mounds of cof-fee, salt, sugar, or salt meat in equal portions. Oncethe mounds were evenly distributed the orderly-sergeant would turn his back to the blanket andtake out his roll of the company. Then someoneelse would point to one of the piles and ask, “Whoshall have this?” Next the sergeant would randomlycall a name from the roll for a man to his share ofthe rations (Billings 1993; Coco 1996).
When fresh meat was distributed to the soldiers,equal and fair rations were not always possible.Butchers often took some of the choice meats in-
B-22
cluding the liver, heart, and tongue for themselves,and soldiers often complained the cooks kept thelargest or the choicest portion for themselves andthe company officers. The remaining portions ofmeat were given out by the quartermaster, who indrawing his own ration of meat from the commis-sary had to be governed by his last selection. Tohelp ensure fairness, if he chose a hindquarter, thenhe must chose a forequarter the next time (Billings1993).
At the beginning of the war, company cooks of-ten prepared the rations and distributed the cookedmeals when the army was in a settled camp. Oncethe cooks had prepared the food, a bugle signalwould sound and to receive their rations the sol-diers would form a single line at the cook-housedoor or the cook’s open fire. However, during thecourse of the war the role of the company cookgradually deteriorated. One reason for their disap-pearance was the apparent lack of culinary skill ofsome cooks. Company cooks were generally ap-pointed. While some of them were chosen for theirculinary knowledge or experience, others were cho-sen because they could not learn drills or they wereunable to pass inspections and needed to get out ofthe ranks (Lord 1960). As one Pennsylvanian sol-dier remarked, “the company-cook system intro-duced was found to be a total failure, principallybecause of the selection for the trying position ofthe most uncouth and disqualified men in the com-panies. As a result of dissatisfaction, company cookswere discontinued, and each mess of three or fourcomrades accepted the raw rations distributed tothe companies and did their own cooking in messes”(Robertson 1989:65).
Other reasons for the decreasing role of com-pany cooks may be associated with their lack of de-pendability, along with the disappearance of thecompany cookware. Each cook was issued a set ofthe company cookware or camp chest filled withitems such as knives, forks, butcher knives, teacups,plates, bowls, spices, glasses, a sifter, rolling pin,coffee tin, frying pan, coffee pot, teapot, and breadoven. At the beginning of the war cooks continuedto do their job as long as the wagons and the mulescarried all of the necessary cooking equipment. Sol-
diers soon realized empty stomachs often followedbeing dependent upon the cooks. Many times thecook’s wagons did not arrive at the camps or themules, not carefully watched, had disappeared withthe whole cooking kit. As the war progressed, regu-lations were also passed that limited the amount ofbaggage an infantry regiment was allowed to car-ried. For this reason, items from the company cookchest were the first things to be abandoned (Coco1996).
While at City Point, most of the Union soldiersprobably ate food that had been prepared by them-selves or their company cooks. However, they mayhave also come in contact with some of the otherindividuals who served as cooks at City Point on apermanent basis. For example, the United StatesSanitary Commission, a forerunner of the Ameri-can Red Cross, set up a station at City Point towork in the hospitals, manage the kitchens, andmaintain dockside feeding for wounded soldiers.Many of the workers of the Sanitary Commissionwere women who would often work a fifteen-hourday when the wounded soldiers arrived at City Point.Typically, they would meet wounded soldiers alongthe shore closest to a battle, tend to their medicalneeds, give them food and drink, and transport themto one of the seven hospitals at City Point. Alongthe docks at City Point, women from the SanitaryCommission also set up feeding stations where sol-diers coming in from the field or being sent outcould find soup, coffee, bread, and other food items(Christie 1997).
The United States Christian Commission, acharitable organization that dealt with the spiritualneeds of the soldiers, also set up a base at City Point.Women in this organization worked in the kitchensas cooks and served food to wounded soldiers. Onewoman, Annie Wittenmyer, believed that woundedsoldiers should have “delicate food in homelikepreparation,” to ensure a quick recovery. She wassuccessful in establishing the Christian Commis-sion Special Diet Kitchens at City Point (Christie1997). In addition to the women who had comedown from the North, there were also African Ameri-can women working at City Point. Many of thesewomen were hired as cooks for the ships, for the
B-23
hospitals, for the Union Officers and their families,and for the Northern women in residence at CityPoint. With all of their domestic skills, freed slavescould easily find jobs at City Point and earn moneyfor their families (Christie 1997).
When soldiers were away from City Point andon the march they were typically in charge of pre-paring their own rations with their own issued cook-ware. If cookware was limited they often improvisedby making makeshift utensils. For example, onecommon cookware solution was to unsolder the seambetween the two halves of an extra canteen. Eachhalf could serve as a lightweight frying pan or plateeasily carried by strapping it to their existing can-teen. Also, tin cans with wire handles doubled ascoffee boilers and soldiers often shared larger fryingpans taken from the company camp chest (Volo andVolo 1998).
In terms of the actual preparation of the foodmost soldiers lacked any cooking skills, simply learn-ing on the job. When soldiers were first enlistedthey were often given the Soldiers’ Health Compan-ion, a booklet that warned the soldiers of too muchstrong coffee and outlined recipes for 37 nutritiousdishes such as Turkish Falaff stew, semi-citric lem-onade, and macaroni pudding (Lord 1960). In ac-tuality, soldiers rarely had the ingredients to makemany of the suggested dishes but instead, made dowith what was available to them. For this reason,sickness due to improper nutrition was prevalent inmany of the army camps. Diarrhea, dysentery, andmalnutrition were often attributed to the steady dietof fried meat, hard bread, strong coffee, unripe fruits,and rotten vegetables the soldiers ate (Robertson1988).
If fresh beef was the ration of the day, it couldhave been prepared in a number of ways. In thecase of the company cooks, fresh beef was typicallyboiled and sometimes used in a soup or stew. If themeat was of good quality, a cook might try to broilsteaks or even prepare a roast beef for the troops.When the raw meat ration was served individuallyto the men to prepare as they wished, the cuisineusually depended on the quality of meat they re-ceived. Stringy and flabby portions of beef wereusually combined with available vegetables to make
a thick stew. Solid pieces of beef were cooked as abeefsteak either fried in pork fat or impaled on astick and broiled in the flames (Billings 1993).
The least appreciated of rations was salted orpickled beef, usually so foul-smelling the soldiersdid not have the appetite to cook it. If properlypreserved the beef was too salty to eat, but it wasnot adequately preserved then it probably smelledand was too spoiled to eat. Some of the troops re-ferred to it as “salt horse” because they said ironhorse shoes and mule shoes were found in the bar-rels of meat, but never an ox shoe (Robertson 1988).Other troops would poke fun of the ration by hold-ing a mock funeral for the meat, complete with bear-ers, music, a mournful procession, a service, andcoffin with scraps of old horse harnesses to indicatethe origin of the remains (Billings 1993).
Salt pork was a preferred meat ration for boththe Union and Confederate armies. If properly pre-pared in sealed barrels it could last, unspoiled forlong periods of time. However, once the barrels wereopened the meat had to be used quickly before itrotted. To help remove some of the salt it was some-times boiled but more often it was fried. On themarch it could have been eaten raw in between twopieces of hard bread or used to flavor beans in astew (Billings 1993). Bacon also was a common ra-tion. Prepared by soaking the pieces in brine andthen smoked, this process helped to slow down thegrowth of bacteria. This allowed the pieces to bekept for several days wrapped in an oilcloth andcarried in a haversack (Volo and Volo 1998).
Besides their daily rations, a second source offood for the Union troops came from the army sut-lers, who were civilian vendors and storekeepers whoset up their business within the army camp andoccasionally traveled with the army on campaign.Their prices were supposed to have been set by aboard of officers, but with no competition or su-pervision, sutlers typically raised their prices untilthey were making a large profit. They sold a varietyof dry good items to the soldiers as well as fooditems such as fruits, vegetables, dairy products,canned meats, condiments, pickles, codfish, oysters,eggs, flour, spices, and poultry (Lord 1969).
B-24
The condemnation of sutlers by the Union troopsseems to have been universal. As one soldier de-scribed, “Sutlers would skin a louse for its hide andtallow.” Another soldier wrote in a letter to his fa-ther that the prices sutlers charged were so outra-geous, a common sized chicken would often cost asoldier as much as $6.00. Many sutlers were so in-tent on making a quick profit they sold question-able products that not only made some men sickbut also caused several deaths. For example, one sutlersold small pies to men in the 1st Iowa Infantry short-ened with grease obtained from diseased pork. An-other sutler in Halltown, Virginia was charged withselling small meat pies that had been filled with catand dog meat (Lord 1969).
Many soldiers sought revenge on the sutlers andtheir high prices by “cleaning out” the sutler’s shop.This usually involved cutting the ropes of the sutler’stent, causing it to collapse and then, in the confu-sion, helping themselves to the goods. Other times,troops would charge a sutler’s wagon causing it tooverturn, stealing items they could quickly pick up.Either method proved to be an effective warning tothose sutlers that took advantage of the soldiers (Lord1969).
One of the best sources for supplementing theirdiet with extra food, was through “foraging.” Trans-lated, it meant stealing from farms in the neighbor-hood of an army’s march or camp. Although thegovernment and most of the commanding officersforbade this behavior, their orders had little effect.As one soldier from Maine confessed, “Despite moststringent orders against foraging, every morning, theground between the different encampments of theregiments was covered with sheep skins and feath-ers from turkeys, geese and hens that had given theirlives, during the preceding night, for the relief ofthe hungry soldiers” (Robertson 1988:73).
Union soldiers had a reputation of being able tocompletely strip a Southern farmstead clean in sev-eral minutes. One Southern housewife who had themisfortune of this experience recalled, “To my smoke-house, my dairy, pantry, kitchen, and cellar, likefamished wolves they came…breaking locks andwhatever is in their way…in a twinkling my flour,my meat, my lard, butter, eggs, pickles of variouskinds, wine, and jugs were all gone. My eighteen
fat turkeys, my hens, chickens, and fowls, my youngpigs, are shot down in my yard and hunted as ifthey were rebels themselves.” When the womanpleaded to one of the men to leave her somethinghe only replied, “I cannot help you, Madam; it isorders” (Volo and Volo1998:174).
One final source for food was special packagesfrom family and friends sent to the troops whilethey were in camp. For those soldiers fortunateenough to receive one, the contents typically in-cluded not only personal items and dry goods, butalso various types of food such as boiled ham, tur-key, chicken, cheese, vegetables, cake, butter, con-densed milk, sugar, spices, and other appreciateditems. Soldiers would often write home with a listof needed items, only to be ordered to move outbefore the box of goods arrived. Usually, by the timethey got back to camp any perishable items in thebox had gone bad (Billings 1993).
In spite of the rations, hunger, indigestion, oc-casional food poisoning, and regular bouts of diar-rhea as a result of tainted food, most Union soldiersadapted to that which they could not change. Withrespect to food, the men tolerated it, made use ofthe available resources, swallowed it, and hoped forthe best.
CONCLUDING REMARKS
Faunal remains uncovered in the archaeologicalrecord can provide critical information on the rela-tive dietary importance of each species, butcheringpractices, animal husbandry techniques, and thespecific cuts of meat that were eaten. They are lim-ited, however, in interpretations of social, economic,and cultural patterns of a site. Specifically, the bonesdo not always provide data on the subsistencesystem’s social and economic relationships or ahousehold’s status or ethnic origin. Documentarysources are needed along with the archaeologicalbones to analyze how the production, distribution,and consumption of food is directly related to thecultural, social, and economic conditions of the site(Bowen 1990b).
The City Point site is no exception since boththe archaeological bones and historical documentsare needed in the interpretation of the Union sub-
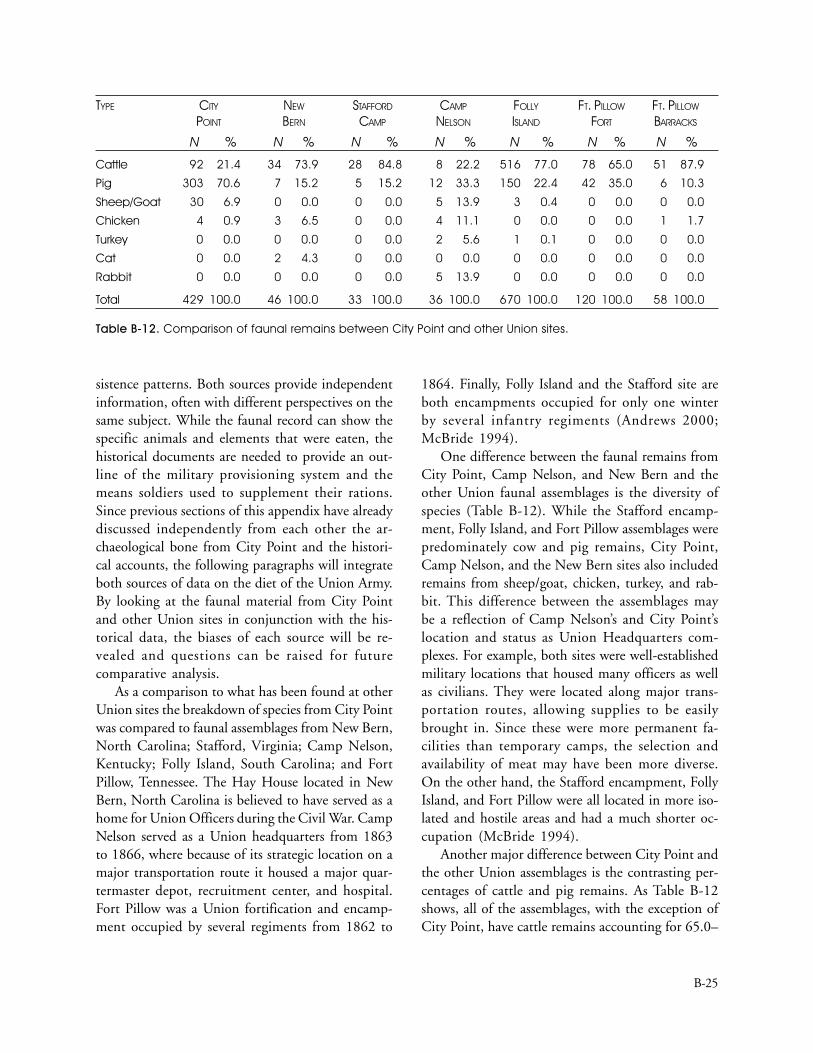
B-25
sistence patterns. Both sources provide independentinformation, often with different perspectives on thesame subject. While the faunal record can show thespecific animals and elements that were eaten, thehistorical documents are needed to provide an out-line of the military provisioning system and themeans soldiers used to supplement their rations.Since previous sections of this appendix have alreadydiscussed independently from each other the ar-chaeological bone from City Point and the histori-cal accounts, the following paragraphs will integrateboth sources of data on the diet of the Union Army.By looking at the faunal material from City Pointand other Union sites in conjunction with the his-torical data, the biases of each source will be re-vealed and questions can be raised for futurecomparative analysis.
As a comparison to what has been found at otherUnion sites the breakdown of species from City Pointwas compared to faunal assemblages from New Bern,North Carolina; Stafford, Virginia; Camp Nelson,Kentucky; Folly Island, South Carolina; and FortPillow, Tennessee. The Hay House located in NewBern, North Carolina is believed to have served as ahome for Union Officers during the Civil War. CampNelson served as a Union headquarters from 1863to 1866, where because of its strategic location on amajor transportation route it housed a major quar-termaster depot, recruitment center, and hospital.Fort Pillow was a Union fortification and encamp-ment occupied by several regiments from 1862 to
1864. Finally, Folly Island and the Stafford site areboth encampments occupied for only one winterby several infantry regiments (Andrews 2000;McBride 1994).
One difference between the faunal remains fromCity Point, Camp Nelson, and New Bern and theother Union faunal assemblages is the diversity ofspecies (Table B-12). While the Stafford encamp-ment, Folly Island, and Fort Pillow assemblages werepredominately cow and pig remains, City Point,Camp Nelson, and the New Bern sites also includedremains from sheep/goat, chicken, turkey, and rab-bit. This difference between the assemblages maybe a reflection of Camp Nelson’s and City Point’slocation and status as Union Headquarters com-plexes. For example, both sites were well-establishedmilitary locations that housed many officers as wellas civilians. They were located along major trans-portation routes, allowing supplies to be easilybrought in. Since these were more permanent fa-cilities than temporary camps, the selection andavailability of meat may have been more diverse.On the other hand, the Stafford encampment, FollyIsland, and Fort Pillow were all located in more iso-lated and hostile areas and had a much shorter oc-cupation (McBride 1994).
Another major difference between City Point andthe other Union assemblages is the contrasting per-centages of cattle and pig remains. As Table B-12shows, all of the assemblages, with the exception ofCity Point, have cattle remains accounting for 65.0–
TYPE CITY NEW STAFFORD CAMP FOLLY FT. PILLOW FT. PILLOW
POINT BERN CAMP NELSON ISLAND FORT BARRACKS
N % N % N % N % N % N % N %
Cattle 92 21.4 34 73.9 28 84.8 8 22.2 516 77.0 78 65.0 51 87.9
Pig 303 70.6 7 15.2 5 15.2 12 33.3 150 22.4 42 35.0 6 10.3
Sheep/Goat 30 6.9 0 0.0 0 0.0 5 13.9 3 0.4 0 0.0 0 0.0
Chicken 4 0.9 3 6.5 0 0.0 4 11.1 0 0.0 0 0.0 1 1.7
Turkey 0 0.0 0 0.0 0 0.0 2 5.6 1 0.1 0 0.0 0 0.0
Cat 0 0.0 2 4.3 0 0.0 0 0.0 0 0.0 0 0.0 0 0.0
Rabbit 0 0.0 0 0.0 0 0.0 5 13.9 0 0.0 0 0.0 0 0.0
Total 429 100.0 46 100.0 33 100.0 36 100.0 670 100.0 120 100.0 58 100.0
Table B-12. Comparison of faunal remains between City Point and other Union sites.
B-26
87.9% of the identified food remains. City Point,on the other hand, has cattle bones only making up21.4% of the total identified remains. Unfortunatelythough, these percentages do not accurately accessthe role beef played in the diet of the Union troopssince the percentages only indicate the number ofcattle bones identified. Biomass calculations, how-ever, do represent the proportion of beef in the diet.Although biomass percentages were not availablefor Camp Nelson, Folly Island, or Ft. Pillow, theywere available for the other Union sites. The Staf-ford faunal assemblage had beef accounting for64.8% of the total diet, while the New Bern biom-ass calculations show cattle making up 72.4% ofthe diet (Andrews 2000, 2002). Although City Pointhad fewer cattle bones then the other Union assem-blages, the biomass percentages are similar show-ing that beef made up around 65% of the soldier’sdiet.
When the number of pig bones from the CityPoint assemblage is compared to the other Unionsites there is another obvious difference. While theother assemblages show pig bones making up 10–35% of the identified remains, at least 73% of theidentified remains from the City Point assemblagescome from pigs. This high percentage of identifi-able pig bones is partially due to the high numberof foot bones that were present in the assemblage.Foot bones, which are dense and durable, accountfor 53% of the identified pig remains from the CityPoint assemblages. Conceivably, the occupants whoutilized the City Point site were eating more pigfeet than their Union counterparts at other loca-tions. Pickled pigs feet and souse, which is madewith pig feet and pig ears, were common recipes inthe years leading up to and during the Civil War(Child 1844).
Another contributing factor for the high num-ber of identified pig remains in the City Point as-semblage may be related to the low percentages ofunidentifiable bones. In the New Bern material89% of the bones were unidentifiable, while in theStafford encampment 98% of the bones were uni-dentifiable. The City Point assemblages show only65% of the bone from the Upper Fill were uniden-tifiable and only 44% of the bones from the LowerFill were unidentifiable. The bones from City Point
were not as highly fragmented as the bones fromStafford and New Bern, suggesting that there mayhave been differences in butchering and cookingpractices that occurred at the sites. For example,when salt pork arrived in camp, it may have comebutchered in large sections, including pieces of bone,and packaged into barrels of salt. Before it was cookedor issued to the men, it would have been butcheredeven further to make smaller, equal rations for indi-vidual consumption. When the men received theirportion they typically fried the meat and brokenthe remaining bone into even smaller pieces. Thesefragments of bone, too small to identify to species,could have then be used in stews or to flavor theirbeans, particularly if rations were in short supply.Since rations were readily accessible at City Point,soldiers may not have had the need to butcher pigbones into small pieces for stew.
In addition to the differences in the number ofidentified pig bones and the number of unidentifi-able remains, it is not surprising that there are alsodifferences in the pig biomass percentages. For ex-ample, the biomass percentages from the Staffordand New Bern sites show pig contributing approxi-mately 1% to the overall diet, while in the CityPoint assemblages pigs make up approximately 25%of the diet. Again, the higher biomass percentagefor the City Point bones is in part due to the highnumber of pig foot bones present in the assemblageand the low percentages of unidentifiable remains.While the City Point assemblage suggests that porkplayed a greater role in the soldier’s diet there thancompared to other Union camps, it still does notreflect the historical accounts from the Civil Warthat imply salt pork was the main meat ration forthe troops. If this is the case then why does thearchaeological evidence indicate that beef at theUnion sites was more important in the soldier’s diet?
The lack of pig bones in the archaeological recordof military sites is not limited to those dating onlyto the Civil War. In his examination of faunal mate-rial from Fort Ligonier, a British Army relay stationduring the French and Indian War, John Guildayalso encountered a small percentage of pig bones inthe archaeological record although the historicaldocuments suggested salt pork was the principalration of the British troops. He concluded the salt
B-27
pork was probably butchered, boned, salted else-where and carried to the fort in this prepared form,leaving little or no archaeologically recoverable trace.The small amount of pig bones identified from FortLigonier were interpreted as the remains of freshpork since the historical records suggested it wasoccasionally provided to the troops (Guilday 1970).
The exact process of salting pork was not men-tioned in any of the Civil War histories used for thisreport, but traditionally pork prepared at home wassalted with the bone still attached. Although it is apossibility that pork was salted and barreled with-out the bone, this would have been a time consum-ing and expensive procedure. As mentioned earlier,a more convincing explanation for the lack of iden-tifiable pig bones is probably the result of butcher-ing and culinary practices that left the bones toofragmented to identify to species.
Cattle would have also been butchered but dueto the large size of the bones, the remains wouldhave to have been butchered into very small frag-ments to make them unidentifiable. In the CityPoint assemblage there are only 48 unidentifiablelarge mammal bones from the Lower Fill and nonefrom the Upper Fill. Also, since the historical docu-ments have indicated cattle was often slaughteredin or near the camps to provide fresh beef, there aremore chances of finding cattle remains, both waste
and meaty elements, in the areas of the camp sinceit would have served as the primary butchering area.Pork, on the other hand, would have typically beenslaughtered elsewhere leaving the camps as the sec-ondary butchering site.
One final observation of the cattle remains fromCity Point is the size of the butchered bones. Manyof the butchered bones are very large suggesting thatthe cuts of meat were quite substantial. In an at-tempt to determine the quality of these cuts, thebutchered cattle bones from City Point were firstcompared to the butchered remains of cattle fromthe Stafford and New Bern assemblages. Then us-ing retail values of beef from the late nineteenthcentury, the cuts of meat were ranked from the mostcostly to the least costly (Schulz and Gust 1983).The only bones not included in this analysis werebutchered thoracic bones since, depending on theirlocation, these vertebrae could be part of either achuck or a rib cut. The City Point cattle remainsincluded nine butchered thoracic bones, while theNew Bern assemblage had two.
As Table B-13 shows when late nineteenth-cen-tury retail values are examined at least 87% of thebutchered cattle bones from City Point were fromthe top six cuts of beef. In comparison, 55% of thebutchered cattle bones from New Bern and only41% from Stafford were from the top six cuts of
MEAT CUT CITY POINT STAFFORD NEW BERN
NO. % NO. % NO. %
Short Loin 9 27.2 5 41.6 4 22.2Rib 6 18.1 0 0.0 1 5.5Sirloin 5 15.1 0 0.0 2 11.1Round 4 12.1 0 0.0 0 0.0Rump 3 9.0 0 0.0 3 16.6Short Rib 2 6.0 0 0.0 0 0.0Arm 0 0.0 2 16.6 4 22.2Chuck 4 12.1 0 0.0 0 0.0Plate 0 0.0 0 0.0 0 0.0Foreshank 0 0.0 0 0.0 0 0.0Neck 0 0.0 0 0.0 4 22.2Hindshank 0 0.0 5 41.6 0 0.0
Total 33 100.0 12 100.0 18 100.0
Table B-13. Comparison of butchered adult cattle bone, by meat cut ranked fromthe most costly to the least costly.
B-28
beef. The type of cuts and the size of the butcheredcattle bones suggests that the occupants who uti-lized the pit at City Point were eating high qualitycuts of beef. Perhaps they were officers were giventhe better cuts of beef or even enlisted men whohad connections with a butcher. In either case, sincelarge herds of cattle were being maintained in thearea, the occupants at City Point would have hadaccess to fresh beef probably on a daily basis.
As this report indicates, accurately accessing therations issued to the Union Army while located atCity Point is difficult to determine using only thearchaeological record. Historical accounts are neededin conjunction with the archaeological bone to helpreconstruct subsistence patterns. This report has be-gun this process by looking together at the twosources of information in an attempt to better un-derstand the economic, social, and cultural impli-cations that affected military rations and howsoldiers supplemented their diet. As some questionswere answered, many more questions were raisedand further research is needed both in the histori-cal record and the archaeological record. Specifically,analysis of more faunal assemblages excavated fromCity Point would help to further reconstruct thedietary patterns of soldiers who readily had accessto rations, both preserved and fresh. Future analy-sis of City Point faunal assemblages might also re-veal potential differences in the diets of officers versusenlisted soldiers. Finally, more comparisons to thecomplete faunal data from other Union sites includ-ing Camp Nelson, Folly Island, and Fort Pillow, isneeded to better determine the role of beef versuspork in the diet of the Union soldier.
REFERENCES
Andrews, Susan Trevarthen2000 Faunal Analysis of 44ST59, Union Encamp-
ment Site, Stafford, Virginia. Report on Filein Colonial Williamsburg’s Department ofArchaeological Research.
2002 Faunal Analysis of Hay House Trash Pit, NewBern, North Carolina. Report on File inColonial Williamsburg’s Department ofArchaeological Research.
Beadle Publishers1861 The Military Handbook and Soldiers Manualof Information. New York, New York.Billings, John D.
1993 Hardtack and Coffee. Reprinted. Universityof Nebraska Press, Lincoln, Nebraska.Originally published 1887, George M.Smith & Co., Boston.
Bonnichsen, Robson, and Marcella Sorg1989 Bone Modification. Orono, Maine, Center
for the Study of the First Americans, Insti-tute for Quaternary Studies, University ofMaine.
Bowen, Joanne1982 Faunal Analysis of Two Trash Pits. In Ar-
chaeological Investigations at the NarbonneHouse, by Geoffrey P. Morgan, EdwardZimmer, and Anne Yentsch. Cultural Re-sources Management Study No. 6. SalemMaritime National Historic Site, Massa-chusetts. National Park Service.
1990 Discovering Colonial Butchering Tech-niques. Paper presented to the ALHFAMConference, Providence, Rhode Island.
1992 Faunal Remains and Urban Household Sub-sistence in New England. In The Art andMystery of Historical Archaeology, edited byAnne Elizabeth Yentsch and Mary C. Beau-dry. Department of Archaeology, BostonUniversity, Boston, Massachusetts.
Bowen, Joanne, and Greg Brown1994 Faunal Remains from the Paddy’s Alley, Cross
Street Back Lot, and Mill Pond Sites, BostonMassachusetts. Report on file, Departmentof Archaeological Research, Colonial Wil-liamsburg Foundation.
Bowen, Joanne, and Elise Manning1993 Harpers Ferry and Bones that Talk: Acquiring
Meat in a Changing World. Report on file,Harpers Ferry National Park, HarpersFerry, West Virginia.
Carbone, V., and C. Keel1985 Preservation of Plant and Animal Remains.
In The Analysis of Prehistoric Diets, editedby Robert Gilbert and James Mielke, pp.1-19. Academic Press, New York.
B-29
Chaplin, R. E.1971 The Study of Animal Bones from Archaeo-
logical Sites. Seminar Press, New York.
Child, Lydia Maria1844 The American Frugal Housewife. Samuel S.
& William Wood, New York.
Christie, Jeanne Marie1997 “’Performing My Plain Duty’ Women of the
North at City Point, 1864-1865.” VirginiaCavalcade, Summer. <http:www.geocities.com/plankmaker_1999/PerformingMyPlainDuty.html>
Coco, Gregory A.1996 The Civil War Infantryman: In Camp, On
the March, and in Battle. Thomas Publica-tion, Gettysburg, Pennsylvania.
Cowtan, Charles W.1882 Services of the Tenth New York Volunteers
(National Zouves) in the War of the Rebel-lion. Charles II Ludwig, Publisher, NewYork.
Crader, Diana1984 The Zooarchaeology of the Storehouse and
the Dry Well at Monticello. American An-tiquity 49(3):542–558.
1992 The Slave Diet at Monticello. AmericanAntiquity 55(4):690–717.
Dandoy, Jeremiah1997 Goats in the 17th Century Chesapeake. Ms.
on file, Department of Archaeological Re-search, Colonial Williamsburg Foundation.
Davis, Simon J. M.1987 The Archaeology of Animals. Yale University
Press, New Haven.
Diderot, Dennis1978 Diderot Encyclopedia: The Complete Illustra-
tion. Abrams, New York.
Efremov, J. A.1940 Taphonomy: New Branch of Paleontology.
Pan-American Geologist 74:81–93.
Gifford, Diana1981 Taphonomy and Paleoecology: A Critical
Review of Archaeology’s Sister Disciplines.In Advances in Archaeological Method andTheory, Vol. 4, pp. 365–438, edited byMichael B. Shiffer. The University of Ari-zona Press, Tucson.
Grayson, Donald K.1984 Quantitative Zooarchaeology: Topics in the
Analysis of Archaeological Faunas. AcademicPress, Orlando.
Guilday, John E.1970 Archaeological Investigation of Ligonier,
1960-1965, by J. L. Grimn, appendix by J.E. Guilday. In Annals of Carnegie Museum42:177–186.
Johnson, Eileen1985 Current Developments in Bone Technology.
In Advances in Archaeological Method andTheory, edited by Michael B. Schiffer, Vol.8, pp. 157-235. Academic Press, Inc., NewYork.
Kenyon, Dienge1992 Systematic Slaughter: The Butcher’s or the
Client’s Prerogative. Paper Presented at theSociety for Historical Archaeology Meet-ing, Kingston, Jamaica.
Kirkland, Frazar1895 Reminiscences of the Blue and Gray ’61–’65.
The Preston Publishing Co., Chicago.
Lord, Francis A.1960 They Fought for the Union. The Stackpole
Company, Harrisburg, Pennsylvania.
1969 Civil War Sutlers and Their Wares. ThomasYoseloff, New York.
Lyman, R. Lee1987a On Zooarchaeological Measures of Socio-
economic Position and Cost-Efficient MeatPurchases. Historical Archaeology 21(1):58–66.
1987b Archaeofaunas and Butchery Studies: ATaphonomic Perspective. In Advances inArchaeological Method and Theory, edited byMichael B. Schiffer, Vol. 10, pp. 249–337.Academic Press, New York.
B-30
McBride, W. Stephen1994 Civil War Material Culture and Camp Life
in Central Kentucky. In Look to the Earth,edited by Clarence R. Geier, Jr., and SusanE. Winter. The University of TennesseePress, Knoxville.
Maltby, Mark1979 Faunal Studies on Urban Sites: The Animal
Bones from Exeter, 1971–1975. Exeter Ar-chaeological Reports, Volume 2. Depart-ment of Prehistory and Archaeology, Uni-versity of Sheffield.
1982 The Variability of Faunal Samples and TheirEffects on Ageing Data. In Ageing and Sex-ing Animal Bones from Archaeological Sites,edited by Bob Wilson, Caroline Grigson,and Sebastian Payne. British Archaeologi-cal Reports, British Series 109, Oxford,England.
1985 Patterns in Faunal Assemblage Variability.In Beyond Domestication in Prehistoric Eu-rope, edited by G. Barker and C. Gamble,pp. 33–74. Academic Press, London.
Miller, Francis Trevelyan, editor1957 The Photographic History of the Civil War,
Volume 8. Thomas Yoseloff, New York.
Miller, Henry M.1984 Colonization and Subsistence Change on the
17th Century Chesapeake Frontier. Ph.D. dis-sertation, Michigan State University, Lan-sing. University Microfilms, Ann Arbor.
Noël Hume, Audrey1978 Food. Colonial Williamsburg Archaeologi-
cal Series No. 9. The Colonial Williams-burg Foundation, Williamsburg, Virginia.
Pearce, John, and Rosemary Luff1994 The Taphonomy of Cooked Bone. In
Whither Environmental Archaeology?, OxbowBooks, Exeter.
Petersburg National Battlefield (webpage)2002 City Point. <http: www.nps.gov/pete/
mahan/eduhistcp.html>
Price, J. F., and B. S. Schweigert1971 The Science of Meat and Meat Products. 2d
ed. W.H. Freeman and Company, San Fran-cisco.
Quarter Master Museum (webpage)2002a Brigadier General Rufus Ingalls.
<http:www.qmfound.com/BG_Rufus_Ingalls.htm>
2002b The Quartermaster Department.< h t t p : w w w. s f a s u . e d u / a a s / s o c w k /quartercommis.html>.
Reitz, Elizabeth J.1979 Spanish and British Subsistence Strategies at
St. Augustine, Florida and Frederica, Geor-gia Between 1565 and 1783. Ph.D. disser-tation, University of Florida, Gainesville.University Microfilms, Ann Arbor.
1987 Vertebrate Fauna and Socioeconomic Sta-tus. In Consumer Choice in Historical Ar-chaeology, edited by Suzanne Spencer-Wood,pp. 101–119. Plenum Press, New York.
Reitz, Elizabeth J., and Dan Cordier1983 Use of Allometry in Zooarchaeological
Analysis. In Animals and Archaeology: 2.Shell Middens, Fishes and Birds, edited byCaroline Grigson and Julia Clutton-Brock,pp. 237–252. B.A.R. International Series183, London.
Reitz, Elizabeth J., and C. Margaret Scarry1985 Reconstructing Historic Subsistence with an
Example from Sixteenth-Century SpanishFlorida. Special Publication Series No. 3.Society for Historical Archaeology, AnnArbor.
Reitz, Elizabeth J., Tyson Gibbs, and Ted A. Rathbun1985 Archaeological Evidence for Subsistence on
Coastal Plantations. In The Archaeology ofSlavery and Plantation Life, edited byTheresa Singleton, pp. 163–191. AcademicPress, New York.
Robertson, James I.1988 Soldiers Blue and Gray. University of South
Carolina Press, Columbia, South Carolina.
Silver, I. A.1969 The Aging of Domestic Animals. In Sci-
ence in Archaeology, edited by DonaldBrothwell and Eric Higgs, pp. 250–267.Thames and Hudson, London.
B-31
Schulz, Peter and Sherri Gust1983 Faunal Remains and Social Status in 19th
Century Sacramento. Historical Archaeology17(1):44–53.
Symond, H. C.1888 Report of a Commissary of Subsistence
1861–1865. Press of J. J. Little and Company, NewYork.Thomas, David Hurst
1969 Great Basin Hunting Patterns: A Quantita-tive Method for Treating Faunal Remains.American Antiquity 34(4):393–401.
West, Neal2001 Wade Hampton and the Great Beefsteak
Raid. The Unknown Civil War. <http://www.unknowncivilwar.com/beefsteak%20raid.htm>
Volo, Dorothy Denneen, and James M. Volo1949 Daily Life in Civil War America. Greenwood
Press, Wesport, Connecticut.
von den Driesch, Angela1976 A Guide to the Measurement of Animal Bones
from Archaeological Sites. Peabody MuseumBulletin 1. Harvard University, Cambridge.
Walsh, Lorena S., Ann Smart Martin, and JoanneBowen
1997 Provisioning Early American Towns. TheChesapeake: A Multidisciplinary Case Study.Report prepared for the National Endow-ment for the Humanities. Copy on file,Department of Archaeological Research,Colonial Williamsburg Foundation.
Watson, J. N. P.1987 The Interpretation of Epiphyseal Fusion
Data. In Research Problems in Zooarchae-ology, edited by Don Brothwell et al., 97–102. Institute of Archaeology OccasionalPublication 3. University of London Insti-tute of Archaeology.
White, T. E.1953 A Method of Calculating the Dietary Per-
centages of Various Food Animals Utilizedby Aboriginal Peoples. American Antiquity18:396–398.
Wing, Elizabeth, and Antoinette Brown1979 Paleonutrition: Method and Theory in Pre-
historic Foodways. Academic Press, NewYork.
Zeder, Melinda1988 Understanding Urban Process through the
Study of Specialized Subsistence Economyin the Near East. Journal of AnthropologicalArchaeology 7:1–55.
1991 Feeding Cities: Specialized Animal Economyin the Ancient Near East. Smithsonian In-stitution Press, Washington, D.C.
Zinnen, Captain Robert O.1991 City Point: The Tool That Gave General
Grant Victory. Quartermaster ProfessionalBulletin, Spring. Quartermaster MuseumSite <http:www.qmfound.com/citypt.htm>.
B-32
AGE OF FUSION - 0 TO 12 MONTHS
BONE AND EPIPHYSIS FUSED NOT FUSED
Scapula 1 0Innominate 1 0Humerus - distal 0 0Radius - proximal 0 0Second phalange - proximal 2 2
4 2Percent of Age Range 66.7% 33.3%
AGE OF FUSION - 12 TO 24 MONTHS
BONE AND EPIPHYSIS FUSED NOT FUSED
Metacarpal 0 2First phalange - proximal 0 0Tibia - distal 0 2
0 4Percent of Age Range 0.0% 100.0%
AGE OF FUSION - 24 TO 36 MONTHS
BONE AND EPIPHYSIS FUSED NOT FUSED
Calcaneus 0 1Metatarsal 0 0Fibula - distal 0 0
0 1Percent of Age Range 0.0% 100.0%
AGE OF FUSION - 36 TO 42 MONTHS
BONE AND EPIPHYSIS FUSED NOT FUSED
Humerus - proximal 0 0Radius - distal 0 0Ulna - proximal 0 0Ulna - distal 0 0Femur - proximal 0 1Femur - distal 1 1Tibia - proximal 1 4Fibula - proximal 0 1
2 7Percent of Age Range 22.2% 77.8%
Source of Fusion Ages: Silver 1969; Chaplin 1970; Maltby 1979.
Table B-14. Feature 8, Upper Fill, age distribution based on epiphysealfusion for Sus scrofa (domestic pig) (n=20).
ATTACHMENT B-1. AGE DISTRIBUTION DATA
B-33
AGE OF FUSION - 6 TO 10 MONTHS
BONE AND EPIPHYSIS FUSED NOT FUSED
Scapula 0 0Innominate 2 0Humerus - distal 0 0Radius - proximal 0 0
0 0Percent of Age Range 100.0% 0.0%
AGE OF FUSION - 12 TO 36 MONTHS
BONE AND EPIPHYSIS FUSED NOT FUSED
Ulna - proximal 0 0Ulna - distal 0 0Metacarpal 0 0Femur - proximal 0 0Tibia - distal 0 0Metatarsal 0 0Metapodial 0 0Calcaneus 0 0First Phalange - proximal 0 0Second Phalange - proximal 0 0
0 0Percent of Age Range 0.0% 0.0%
AGE OF FUSION - 36 TO 42 MONTHS
BONE AND EPIPHYSIS FUSED NOT FUSED
Humerus - proximal 0 0Radius - distal 0 0Femur - distal 0 0Tibia - proximal 0 0
0 0Percent of Age Range 0.0% 0.0%
Source of Fusion Ages: Silver 1969; Chaplin 1970; Maltby 1979.
Table B-15. Feature 8, Upper Fill, age distribution based on epiphysealfusion for Ovis aries/Capra hircus (domestic sheep or goat) (n=2).
ATTACHMENT B-1 (CONT.). AGE DISTRIBUTION DATA
B-34
ATTACHMENT B-1 (CONT.). AGE DISTRIBUTION DATA
AGE OF FUSION - 0 TO 12 MONTHS
BONE AND EPIPHYSIS FUSED NOT FUSED
Scapula 0 1Innominate 5 1Humerus - distal 0 0Radius - proximal 0 0Second phalange - proximal 22 7
27 9Percent of Age Range 75.0% 25.0%
AGE OF FUSION - 12 TO 24 MONTHS
BONE AND EPIPHYSIS FUSED NOT FUSED
Metacarpal 2 5First phalange - proximal 0 0Tibia - distal 1 4
3 9Percent of Age Range 25.0% 75.0%
AGE OF FUSION - 24 TO 36 MONTHS
BONE AND EPIPHYSIS FUSED NOT FUSED
Calcaneus 0 5Metatarsal 2 12Fibula - distal 0 0
2 17Percent of Age Range 10.5% 89.5%
AGE OF FUSION - 36 TO 42 MONTHS
BONE AND EPIPHYSIS FUSED NOT FUSED
Humerus - proximal 0 1Radius - distal 0 1Ulna - proximal 0 1Ulna - distal 0 0Femur - proximal 0 5Femur - distal 1 7Tibia - proximal 0 6Fibula - proximal 0 3
1 24Percent of Age Range 4.0% 96.0%
Source of Fusion Ages: Silver 1969; Chaplin 1970; Maltby 1979.
Table B-16. Feature 8, Lower Fill, age distribution based on epiphysealfusion for Sus scrofa (domestic pig) (n=92).=
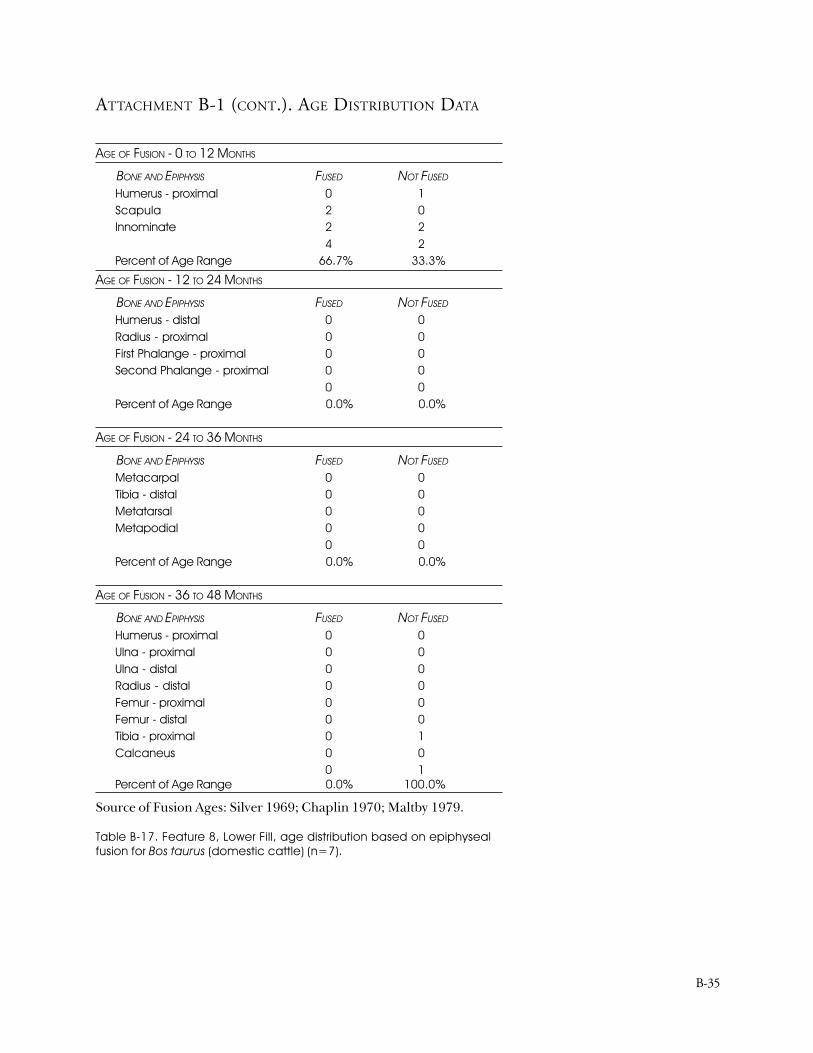
B-35
ATTACHMENT B-1 (CONT.). AGE DISTRIBUTION DATA
AGE OF FUSION - 0 TO 12 MONTHS
BONE AND EPIPHYSIS FUSED NOT FUSED
Humerus - proximal 0 1Scapula 2 0Innominate 2 2
4 2Percent of Age Range 66.7% 33.3%
AGE OF FUSION - 12 TO 24 MONTHS
BONE AND EPIPHYSIS FUSED NOT FUSED
Humerus - distal 0 0Radius - proximal 0 0First Phalange - proximal 0 0Second Phalange - proximal 0 0
0 0Percent of Age Range 0.0% 0.0%
AGE OF FUSION - 24 TO 36 MONTHS
BONE AND EPIPHYSIS FUSED NOT FUSED
Metacarpal 0 0Tibia - distal 0 0Metatarsal 0 0Metapodial 0 0
0 0Percent of Age Range 0.0% 0.0%
AGE OF FUSION - 36 TO 48 MONTHS
BONE AND EPIPHYSIS FUSED NOT FUSED
Humerus - proximal 0 0Ulna - proximal 0 0Ulna - distal 0 0Radius - distal 0 0Femur - proximal 0 0Femur - distal 0 0Tibia - proximal 0 1Calcaneus 0 0
0 1Percent of Age Range 0.0% 100.0%
Source of Fusion Ages: Silver 1969; Chaplin 1970; Maltby 1979.
Table B-17. Feature 8, Lower Fill, age distribution based on epiphysealfusion for Bos taurus (domestic cattle) (n=7).
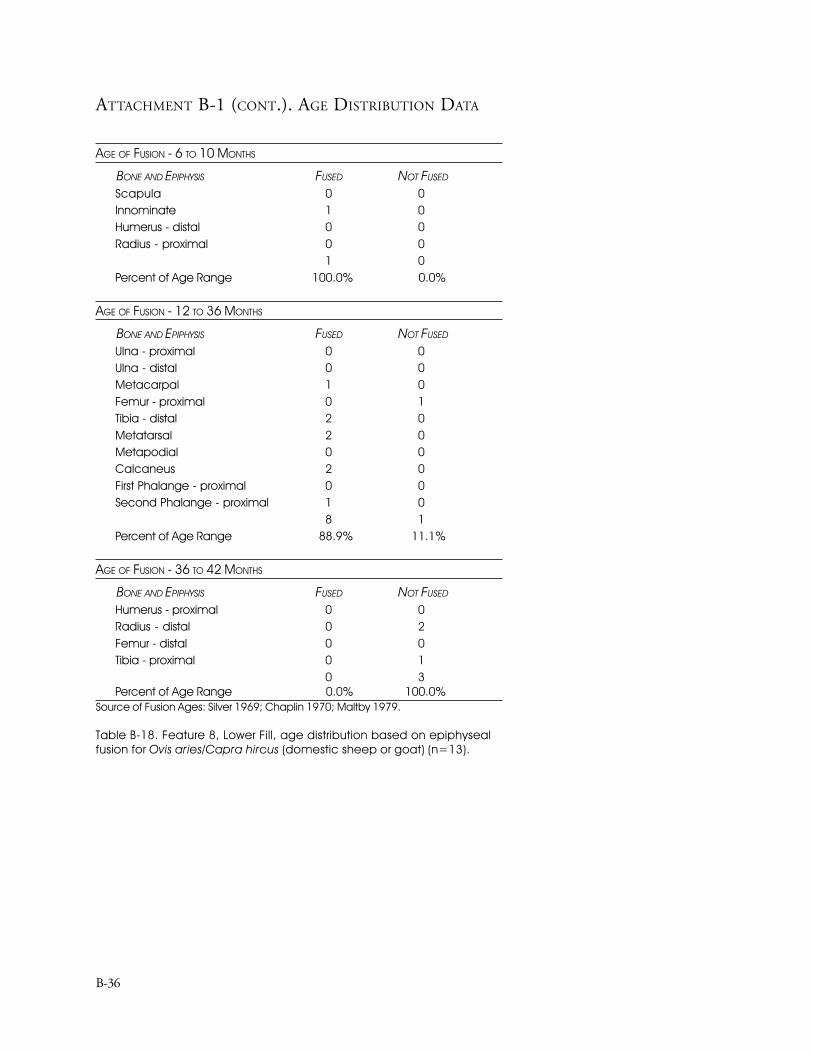
B-36
ATTACHMENT B-1 (CONT.). AGE DISTRIBUTION DATA
AGE OF FUSION - 6 TO 10 MONTHS
BONE AND EPIPHYSIS FUSED NOT FUSED
Scapula 0 0Innominate 1 0Humerus - distal 0 0Radius - proximal 0 0
1 0Percent of Age Range 100.0% 0.0%
AGE OF FUSION - 12 TO 36 MONTHS
BONE AND EPIPHYSIS FUSED NOT FUSED
Ulna - proximal 0 0Ulna - distal 0 0Metacarpal 1 0Femur - proximal 0 1Tibia - distal 2 0Metatarsal 2 0Metapodial 0 0Calcaneus 2 0First Phalange - proximal 0 0Second Phalange - proximal 1 0
8 1Percent of Age Range 88.9% 11.1%
AGE OF FUSION - 36 TO 42 MONTHS
BONE AND EPIPHYSIS FUSED NOT FUSED
Humerus - proximal 0 0Radius - distal 0 2Femur - distal 0 0Tibia - proximal 0 1
0 3Percent of Age Range 0.0% 100.0%
Source of Fusion Ages: Silver 1969; Chaplin 1970; Maltby 1979.
Table B-18. Feature 8, Lower Fill, age distribution based on epiphysealfusion for Ovis aries/Capra hircus (domestic sheep or goat) (n=13).
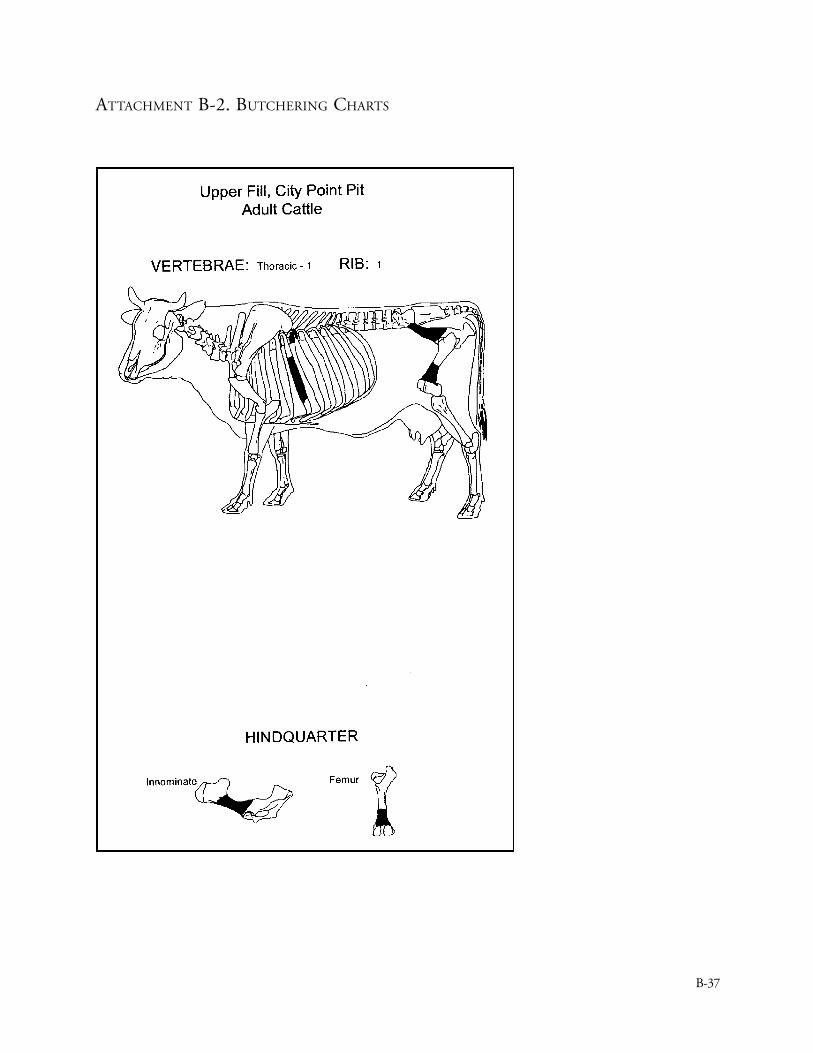
B-37
ATTACHMENT B-2. BUTCHERING CHARTS
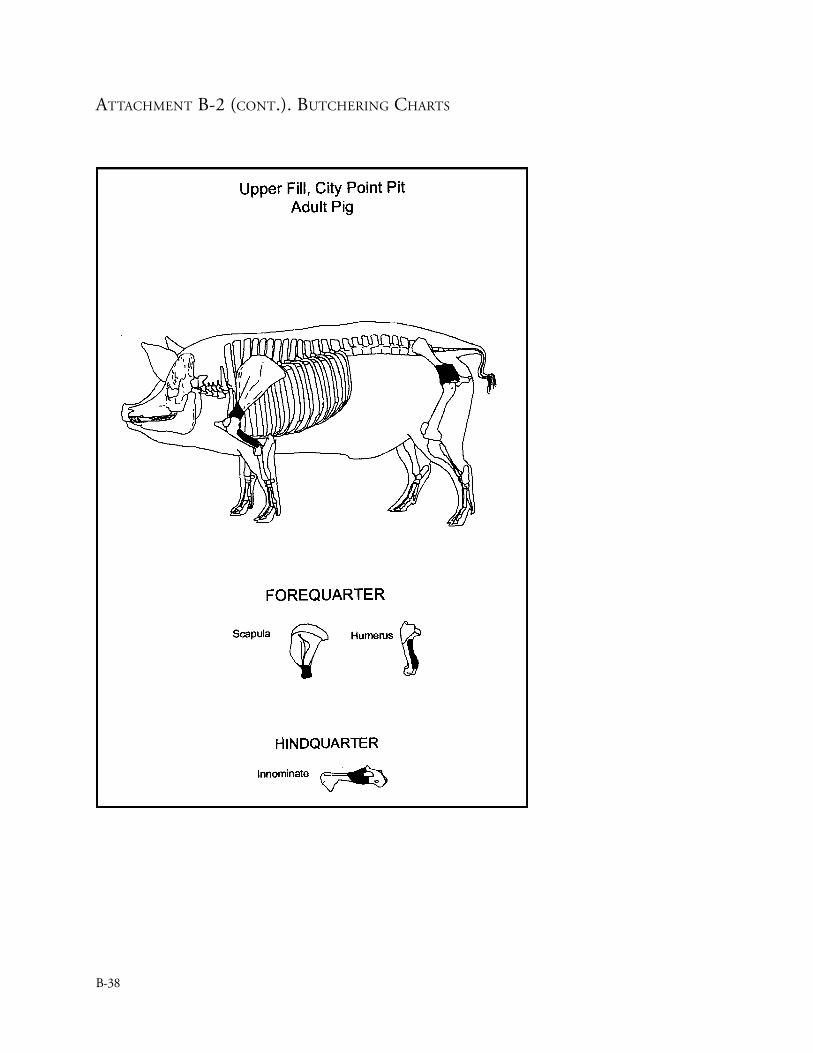
B-38
ATTACHMENT B-2 (CONT.). BUTCHERING CHARTS
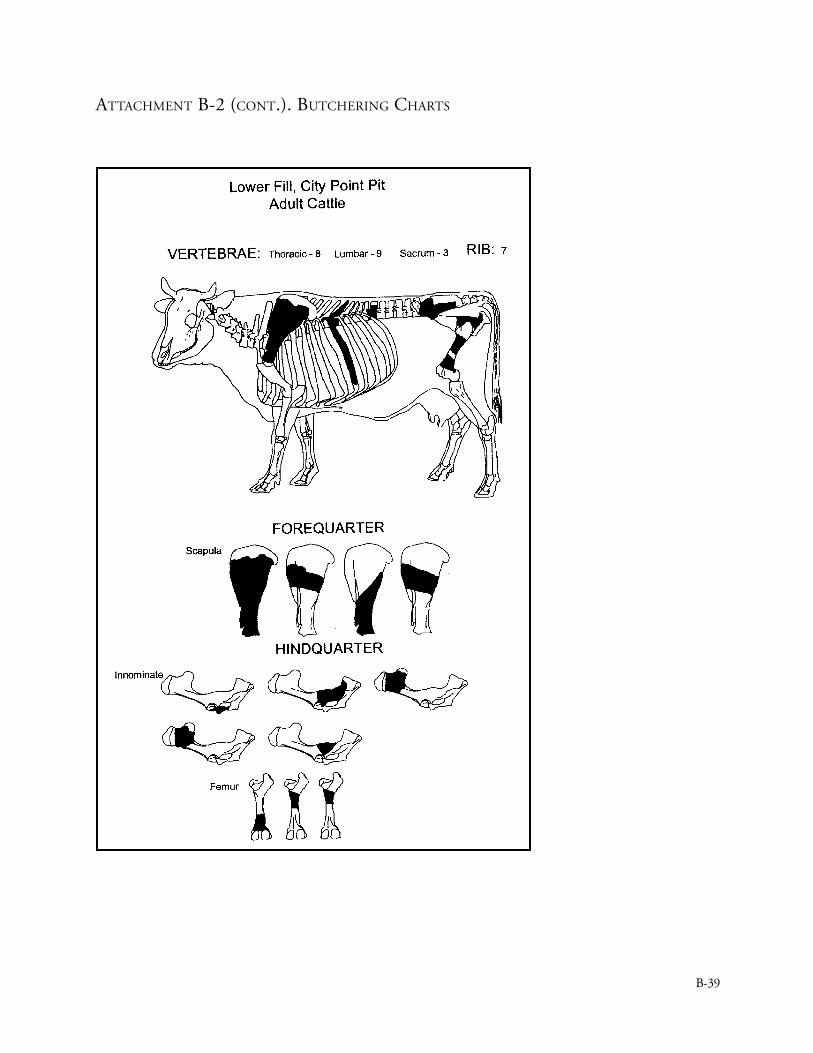
B-39
ATTACHMENT B-2 (CONT.). BUTCHERING CHARTS
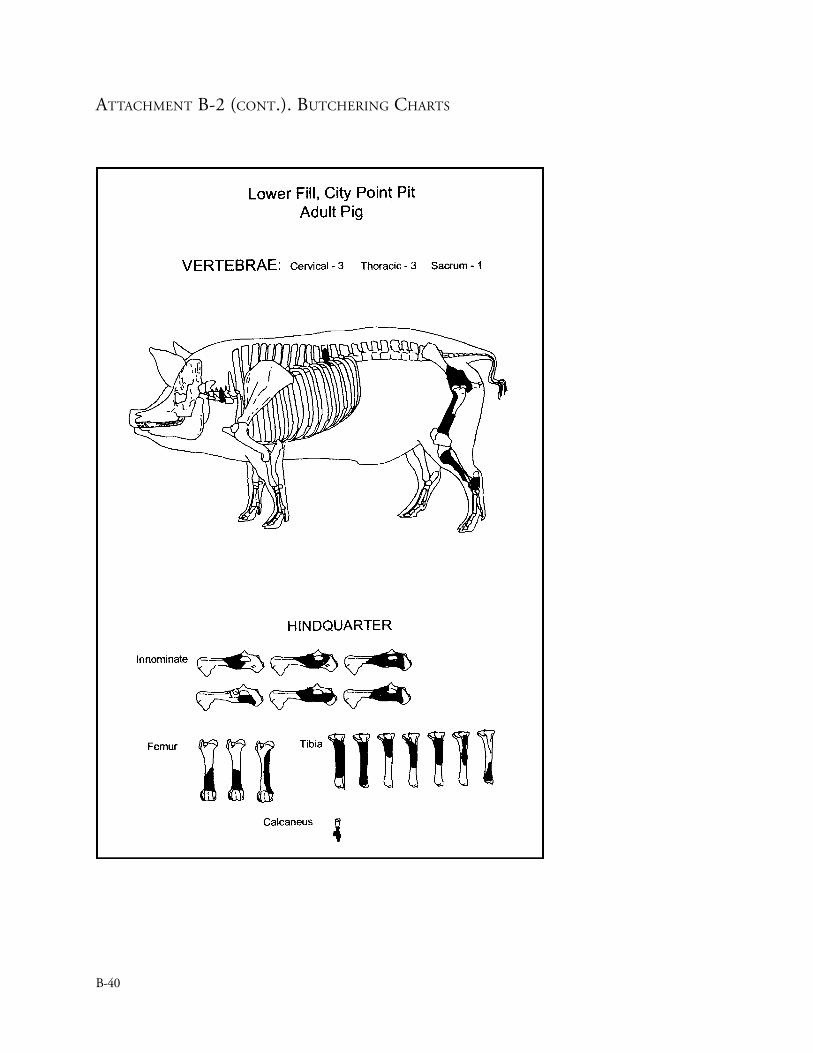
B-40
ATTACHMENT B-2 (CONT.). BUTCHERING CHARTS
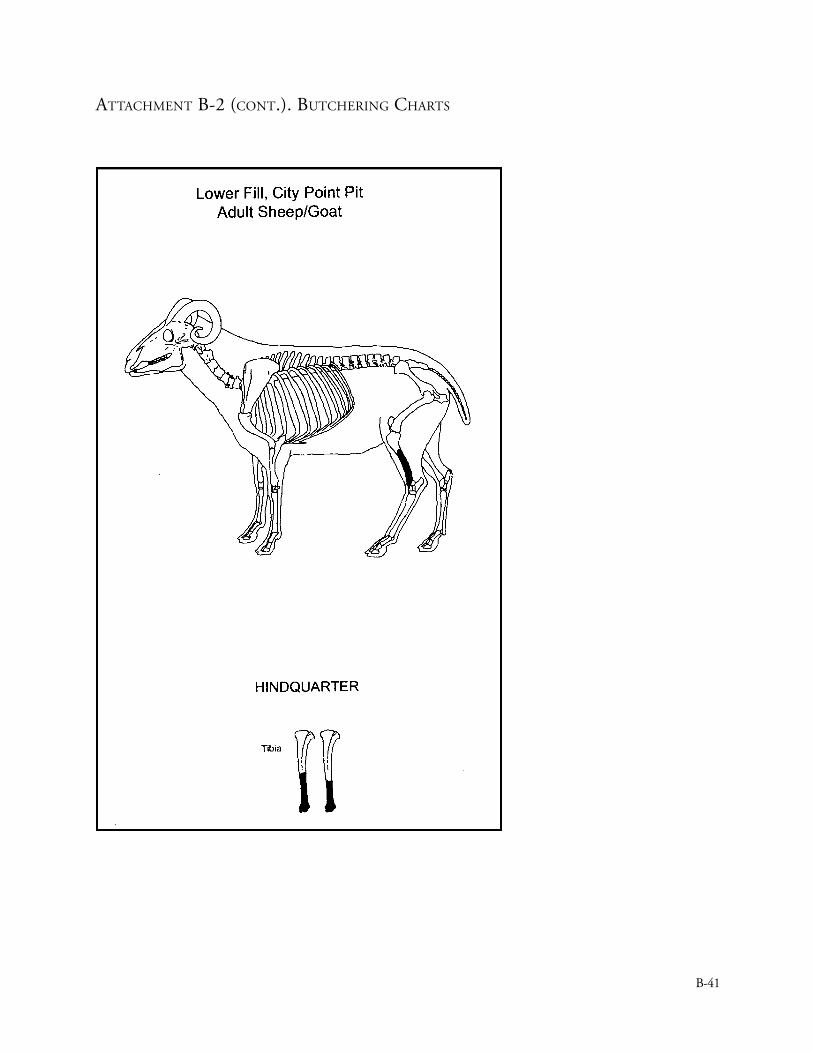
B-41
ATTACHMENT B-2 (CONT.). BUTCHERING CHARTS
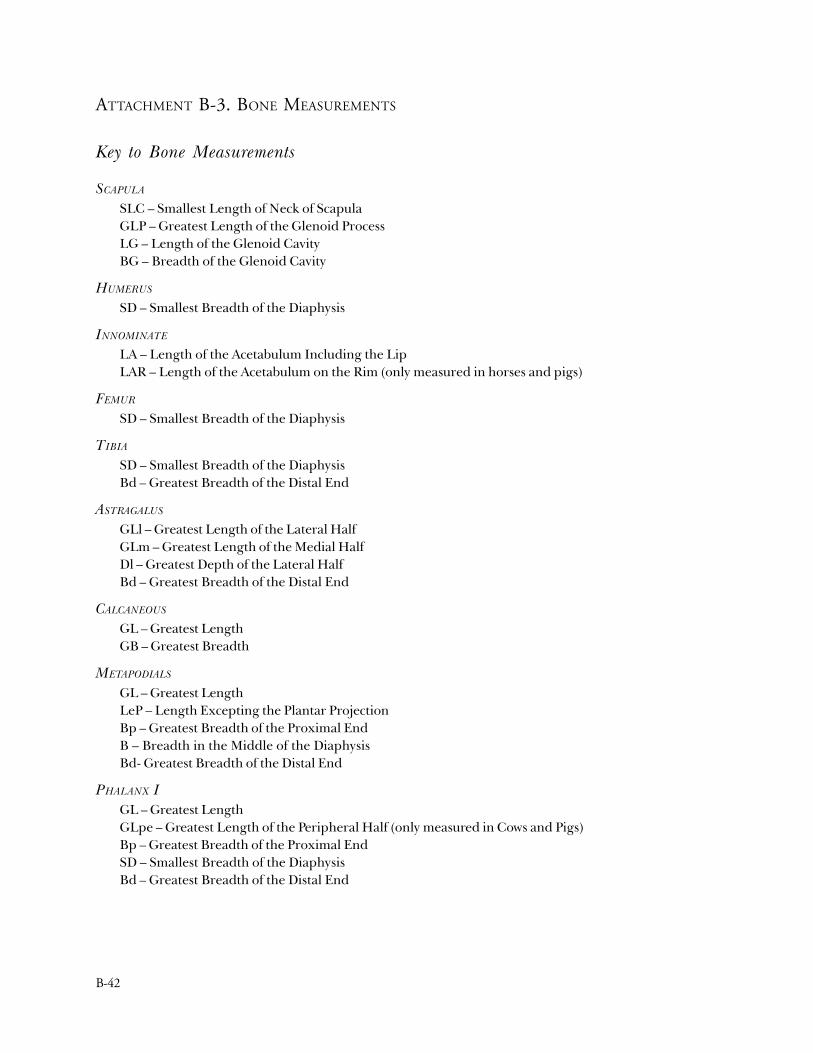
B-42
ATTACHMENT B-3. BONE MEASUREMENTS
Key to Bone Measurements
SCAPULA
SLC – Smallest Length of Neck of ScapulaGLP – Greatest Length of the Glenoid ProcessLG – Length of the Glenoid CavityBG – Breadth of the Glenoid Cavity
HUMERUS
SD – Smallest Breadth of the Diaphysis
INNOMINATE
LA – Length of the Acetabulum Including the LipLAR – Length of the Acetabulum on the Rim (only measured in horses and pigs)
FEMUR
SD – Smallest Breadth of the Diaphysis
TIBIA
SD – Smallest Breadth of the DiaphysisBd – Greatest Breadth of the Distal End
ASTRAGALUS
GLl – Greatest Length of the Lateral HalfGLm – Greatest Length of the Medial HalfDl – Greatest Depth of the Lateral HalfBd – Greatest Breadth of the Distal End
CALCANEOUS
GL – Greatest LengthGB – Greatest Breadth
METAPODIALS
GL – Greatest LengthLeP – Length Excepting the Plantar ProjectionBp – Greatest Breadth of the Proximal EndB – Breadth in the Middle of the DiaphysisBd- Greatest Breadth of the Distal End
PHALANX IGL – Greatest LengthGLpe – Greatest Length of the Peripheral Half (only measured in Cows and Pigs)Bp – Greatest Breadth of the Proximal EndSD – Smallest Breadth of the DiaphysisBd – Greatest Breadth of the Distal End
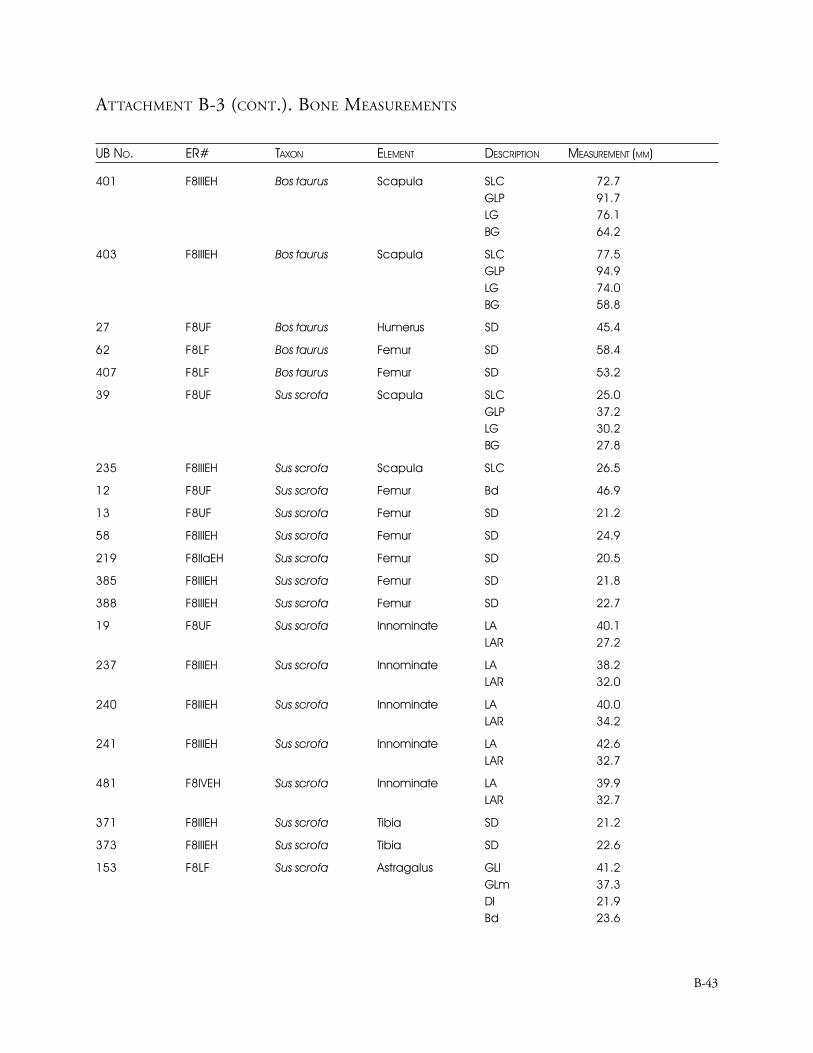
B-43
ATTACHMENT B-3 (CONT.). BONE MEASUREMENTS
UB NO. ER# TAXON ELEMENT DESCRIPTION MEASUREMENT (MM)
401 F8IIIEH Bos taurus Scapula SLC 72.7GLP 91.7LG 76.1BG 64.2
403 F8IIIEH Bos taurus Scapula SLC 77.5GLP 94.9LG 74.0BG 58.8
27 F8UF Bos taurus Humerus SD 45.4
62 F8LF Bos taurus Femur SD 58.4
407 F8LF Bos taurus Femur SD 53.2
39 F8UF Sus scrofa Scapula SLC 25.0GLP 37.2LG 30.2BG 27.8
235 F8IIIEH Sus scrofa Scapula SLC 26.5
12 F8UF Sus scrofa Femur Bd 46.9
13 F8UF Sus scrofa Femur SD 21.2
58 F8IIIEH Sus scrofa Femur SD 24.9
219 F8IIaEH Sus scrofa Femur SD 20.5
385 F8IIIEH Sus scrofa Femur SD 21.8
388 F8IIIEH Sus scrofa Femur SD 22.7
19 F8UF Sus scrofa Innominate LA 40.1LAR 27.2
237 F8IIIEH Sus scrofa Innominate LA 38.2LAR 32.0
240 F8IIIEH Sus scrofa Innominate LA 40.0LAR 34.2
241 F8IIIEH Sus scrofa Innominate LA 42.6LAR 32.7
481 F8IVEH Sus scrofa Innominate LA 39.9LAR 32.7
371 F8IIIEH Sus scrofa Tibia SD 21.2
373 F8IIIEH Sus scrofa Tibia SD 22.6
153 F8LF Sus scrofa Astragalus GLl 41.2GLm 37.3Dl 21.9Bd 23.6
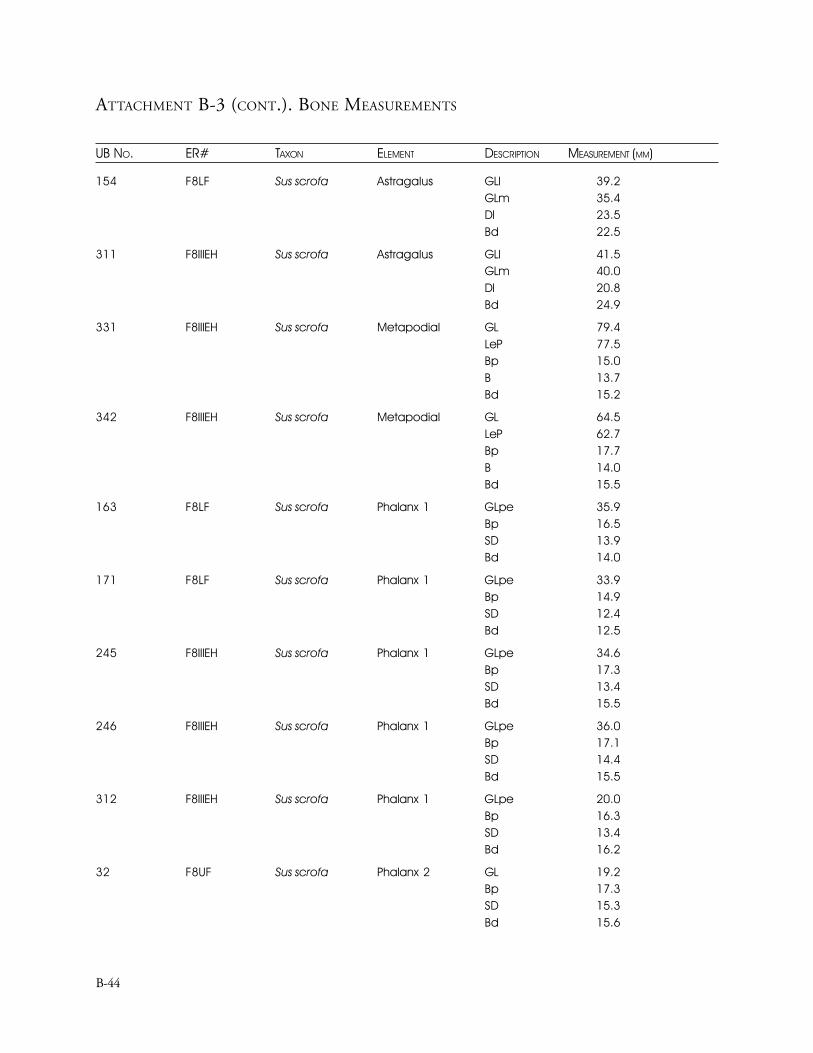
B-44
ATTACHMENT B-3 (CONT.). BONE MEASUREMENTS
UB NO. ER# TAXON ELEMENT DESCRIPTION MEASUREMENT (MM)
154 F8LF Sus scrofa Astragalus GLl 39.2GLm 35.4Dl 23.5Bd 22.5
311 F8IIIEH Sus scrofa Astragalus GLl 41.5GLm 40.0Dl 20.8Bd 24.9
331 F8IIIEH Sus scrofa Metapodial GL 79.4LeP 77.5Bp 15.0B 13.7Bd 15.2
342 F8IIIEH Sus scrofa Metapodial GL 64.5LeP 62.7Bp 17.7B 14.0Bd 15.5
163 F8LF Sus scrofa Phalanx 1 GLpe 35.9Bp 16.5SD 13.9Bd 14.0
171 F8LF Sus scrofa Phalanx 1 GLpe 33.9Bp 14.9SD 12.4Bd 12.5
245 F8IIIEH Sus scrofa Phalanx 1 GLpe 34.6Bp 17.3SD 13.4Bd 15.5
246 F8IIIEH Sus scrofa Phalanx 1 GLpe 36.0Bp 17.1SD 14.4Bd 15.5
312 F8IIIEH Sus scrofa Phalanx 1 GLpe 20.0Bp 16.3SD 13.4Bd 16.2
32 F8UF Sus scrofa Phalanx 2 GL 19.2Bp 17.3SD 15.3Bd 15.6
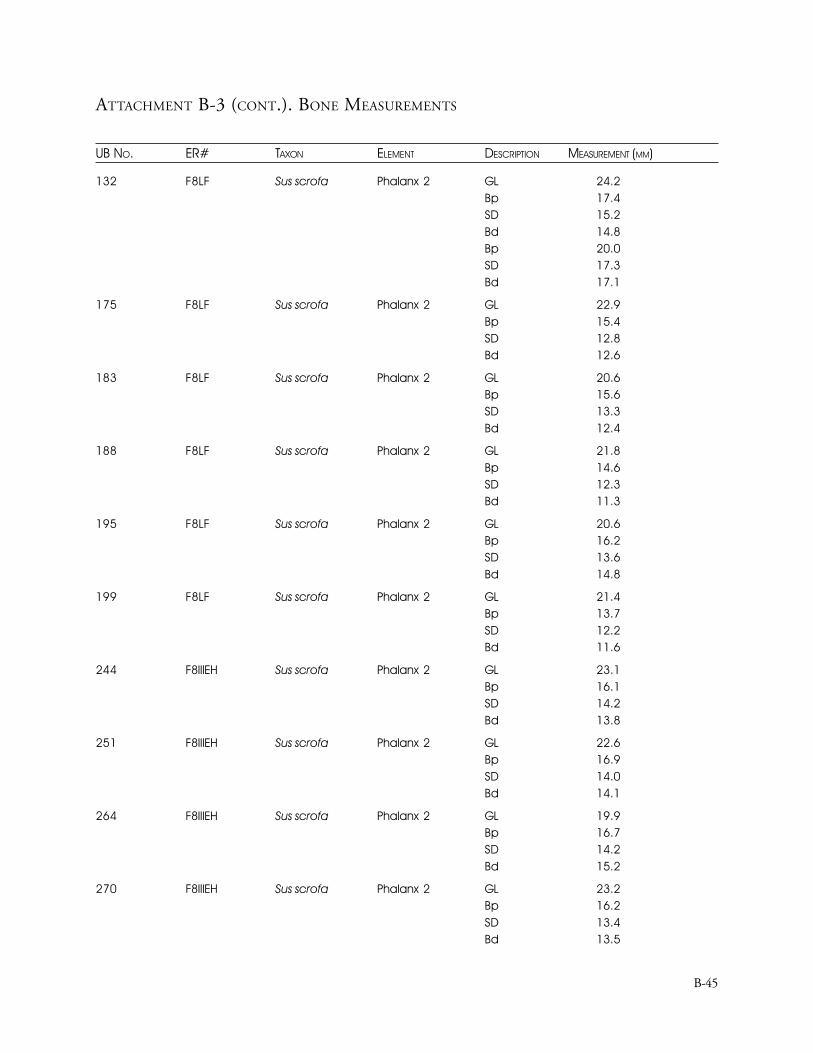
B-45
ATTACHMENT B-3 (CONT.). BONE MEASUREMENTS
UB NO. ER# TAXON ELEMENT DESCRIPTION MEASUREMENT (MM)
132 F8LF Sus scrofa Phalanx 2 GL 24.2Bp 17.4SD 15.2Bd 14.8Bp 20.0SD 17.3Bd 17.1
175 F8LF Sus scrofa Phalanx 2 GL 22.9Bp 15.4SD 12.8Bd 12.6
183 F8LF Sus scrofa Phalanx 2 GL 20.6Bp 15.6SD 13.3Bd 12.4
188 F8LF Sus scrofa Phalanx 2 GL 21.8Bp 14.6SD 12.3Bd 11.3
195 F8LF Sus scrofa Phalanx 2 GL 20.6Bp 16.2SD 13.6Bd 14.8
199 F8LF Sus scrofa Phalanx 2 GL 21.4Bp 13.7SD 12.2Bd 11.6
244 F8IIIEH Sus scrofa Phalanx 2 GL 23.1Bp 16.1SD 14.2Bd 13.8
251 F8IIIEH Sus scrofa Phalanx 2 GL 22.6Bp 16.9SD 14.0Bd 14.1
264 F8IIIEH Sus scrofa Phalanx 2 GL 19.9Bp 16.7SD 14.2Bd 15.2
270 F8IIIEH Sus scrofa Phalanx 2 GL 23.2Bp 16.2SD 13.4Bd 13.5
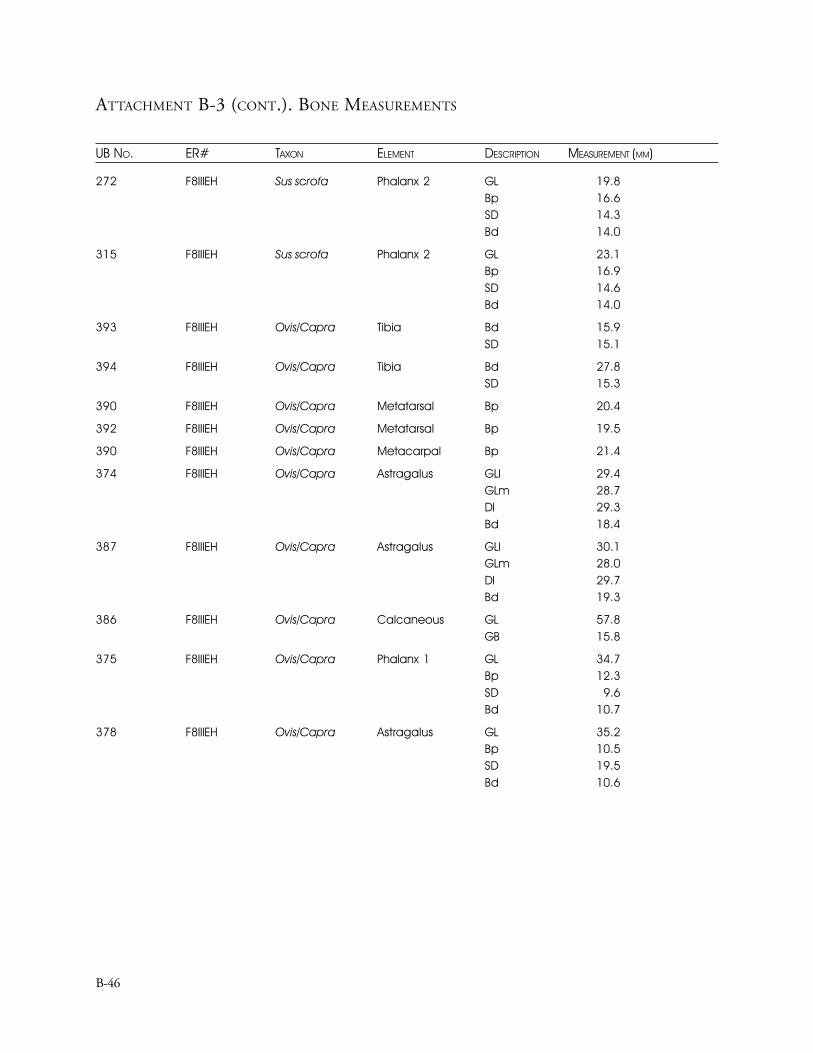
B-46
ATTACHMENT B-3 (CONT.). BONE MEASUREMENTS
UB NO. ER# TAXON ELEMENT DESCRIPTION MEASUREMENT (MM)
272 F8IIIEH Sus scrofa Phalanx 2 GL 19.8Bp 16.6SD 14.3Bd 14.0
315 F8IIIEH Sus scrofa Phalanx 2 GL 23.1Bp 16.9SD 14.6Bd 14.0
393 F8IIIEH Ovis/Capra Tibia Bd 15.9SD 15.1
394 F8IIIEH Ovis/Capra Tibia Bd 27.8SD 15.3
390 F8IIIEH Ovis/Capra Metatarsal Bp 20.4
392 F8IIIEH Ovis/Capra Metatarsal Bp 19.5
390 F8IIIEH Ovis/Capra Metacarpal Bp 21.4
374 F8IIIEH Ovis/Capra Astragalus GLl 29.4GLm 28.7Dl 29.3Bd 18.4
387 F8IIIEH Ovis/Capra Astragalus GLl 30.1GLm 28.0Dl 29.7Bd 19.3
386 F8IIIEH Ovis/Capra Calcaneous GL 57.8GB 15.8
375 F8IIIEH Ovis/Capra Phalanx 1 GL 34.7Bp 12.3SD 9.6Bd 10.7
378 F8IIIEH Ovis/Capra Astragalus GL 35.2Bp 10.5SD 19.5Bd 10.6
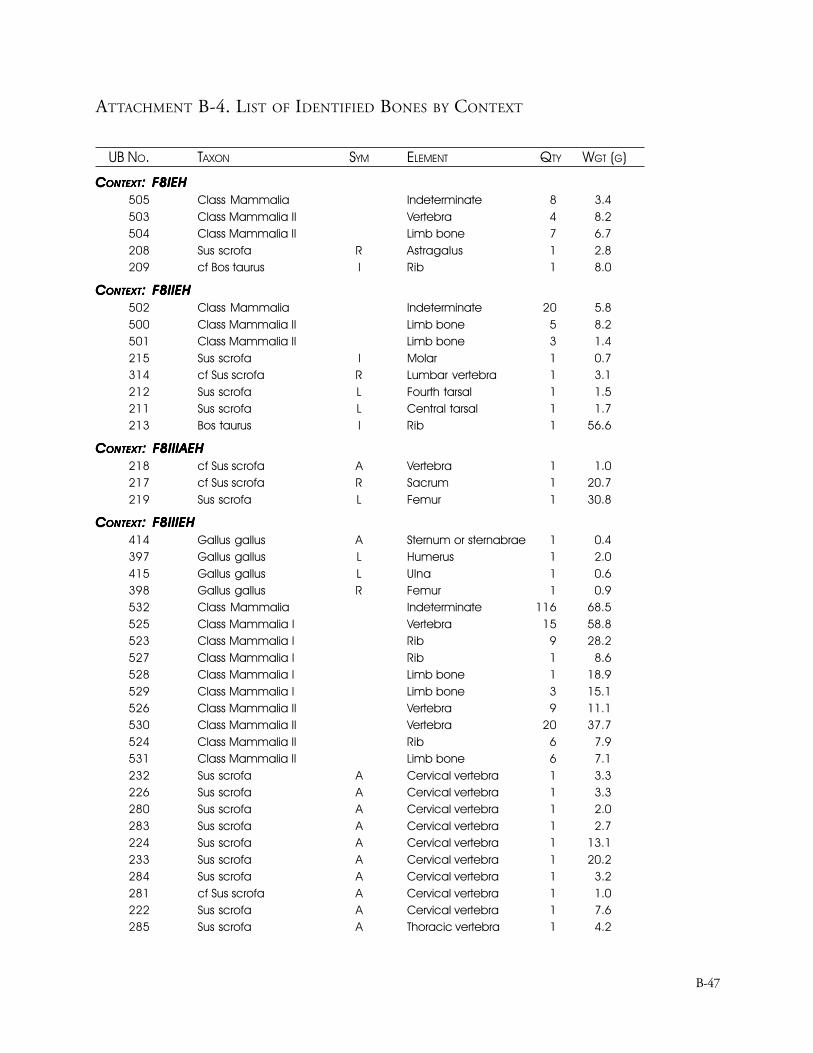
B-47
ATTACHMENT B-4. LIST OF IDENTIFIED BONES BY CONTEXT
UB NO. TAXON SYM ELEMENT QTY WGT (G)
CCCCCONTEXTONTEXTONTEXTONTEXTONTEXT: F8IEH: F8IEH: F8IEH: F8IEH: F8IEH505 Class Mammalia Indeterminate 8 3.4503 Class Mammalia II Vertebra 4 8.2504 Class Mammalia II Limb bone 7 6.7208 Sus scrofa R Astragalus 1 2.8209 cf Bos taurus I Rib 1 8.0
CCCCCONTEXTONTEXTONTEXTONTEXTONTEXT: F8IIEH: F8IIEH: F8IIEH: F8IIEH: F8IIEH502 Class Mammalia Indeterminate 20 5.8500 Class Mammalia II Limb bone 5 8.2501 Class Mammalia II Limb bone 3 1.4215 Sus scrofa I Molar 1 0.7314 cf Sus scrofa R Lumbar vertebra 1 3.1212 Sus scrofa L Fourth tarsal 1 1.5211 Sus scrofa L Central tarsal 1 1.7213 Bos taurus I Rib 1 56.6
CCCCCONTEXTONTEXTONTEXTONTEXTONTEXT: F8IIIAEH: F8IIIAEH: F8IIIAEH: F8IIIAEH: F8IIIAEH218 cf Sus scrofa A Vertebra 1 1.0217 cf Sus scrofa R Sacrum 1 20.7219 Sus scrofa L Femur 1 30.8
CCCCCONTEXTONTEXTONTEXTONTEXTONTEXT: F8IIIEH: F8IIIEH: F8IIIEH: F8IIIEH: F8IIIEH414 Gallus gallus A Sternum or sternabrae 1 0.4397 Gallus gallus L Humerus 1 2.0415 Gallus gallus L Ulna 1 0.6398 Gallus gallus R Femur 1 0.9532 Class Mammalia Indeterminate 116 68.5525 Class Mammalia I Vertebra 15 58.8523 Class Mammalia I Rib 9 28.2527 Class Mammalia I Rib 1 8.6528 Class Mammalia I Limb bone 1 18.9529 Class Mammalia I Limb bone 3 15.1526 Class Mammalia II Vertebra 9 11.1530 Class Mammalia II Vertebra 20 37.7524 Class Mammalia II Rib 6 7.9531 Class Mammalia II Limb bone 6 7.1232 Sus scrofa A Cervical vertebra 1 3.3226 Sus scrofa A Cervical vertebra 1 3.3280 Sus scrofa A Cervical vertebra 1 2.0283 Sus scrofa A Cervical vertebra 1 2.7224 Sus scrofa A Cervical vertebra 1 13.1233 Sus scrofa A Cervical vertebra 1 20.2284 Sus scrofa A Cervical vertebra 1 3.2281 cf Sus scrofa A Cervical vertebra 1 1.0222 Sus scrofa A Cervical vertebra 1 7.6285 Sus scrofa A Thoracic vertebra 1 4.2
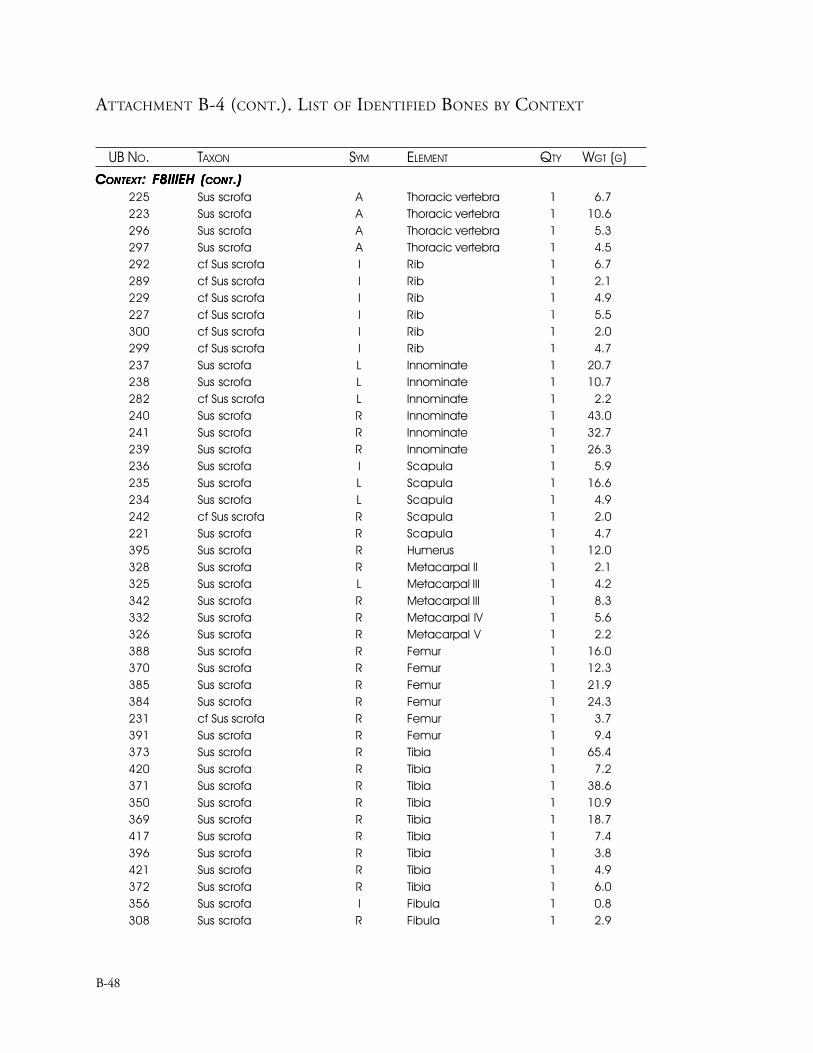
ATTACHMENT B-4 (CONT.). LIST OF IDENTIFIED BONES BY CONTEXT
UB NO. TAXON SYM ELEMENT QTY WGT (G)
B-48
CCCCCONTEXTONTEXTONTEXTONTEXTONTEXT: F8IIIEH (: F8IIIEH (: F8IIIEH (: F8IIIEH (: F8IIIEH (CONTCONTCONTCONTCONT.).).).).)225 Sus scrofa A Thoracic vertebra 1 6.7223 Sus scrofa A Thoracic vertebra 1 10.6296 Sus scrofa A Thoracic vertebra 1 5.3297 Sus scrofa A Thoracic vertebra 1 4.5292 cf Sus scrofa I Rib 1 6.7289 cf Sus scrofa I Rib 1 2.1229 cf Sus scrofa I Rib 1 4.9227 cf Sus scrofa I Rib 1 5.5300 cf Sus scrofa I Rib 1 2.0299 cf Sus scrofa I Rib 1 4.7237 Sus scrofa L Innominate 1 20.7238 Sus scrofa L Innominate 1 10.7282 cf Sus scrofa L Innominate 1 2.2240 Sus scrofa R Innominate 1 43.0241 Sus scrofa R Innominate 1 32.7239 Sus scrofa R Innominate 1 26.3236 Sus scrofa I Scapula 1 5.9235 Sus scrofa L Scapula 1 16.6234 Sus scrofa L Scapula 1 4.9242 cf Sus scrofa R Scapula 1 2.0221 Sus scrofa R Scapula 1 4.7395 Sus scrofa R Humerus 1 12.0328 Sus scrofa R Metacarpal II 1 2.1325 Sus scrofa L Metacarpal III 1 4.2342 Sus scrofa R Metacarpal III 1 8.3332 Sus scrofa R Metacarpal IV 1 5.6326 Sus scrofa R Metacarpal V 1 2.2388 Sus scrofa R Femur 1 16.0370 Sus scrofa R Femur 1 12.3385 Sus scrofa R Femur 1 21.9384 Sus scrofa R Femur 1 24.3231 cf Sus scrofa R Femur 1 3.7391 Sus scrofa R Femur 1 9.4373 Sus scrofa R Tibia 1 65.4420 Sus scrofa R Tibia 1 7.2371 Sus scrofa R Tibia 1 38.6350 Sus scrofa R Tibia 1 10.9369 Sus scrofa R Tibia 1 18.7417 Sus scrofa R Tibia 1 7.4396 Sus scrofa R Tibia 1 3.8421 Sus scrofa R Tibia 1 4.9372 Sus scrofa R Tibia 1 6.0356 Sus scrofa I Fibula 1 0.8308 Sus scrofa R Fibula 1 2.9
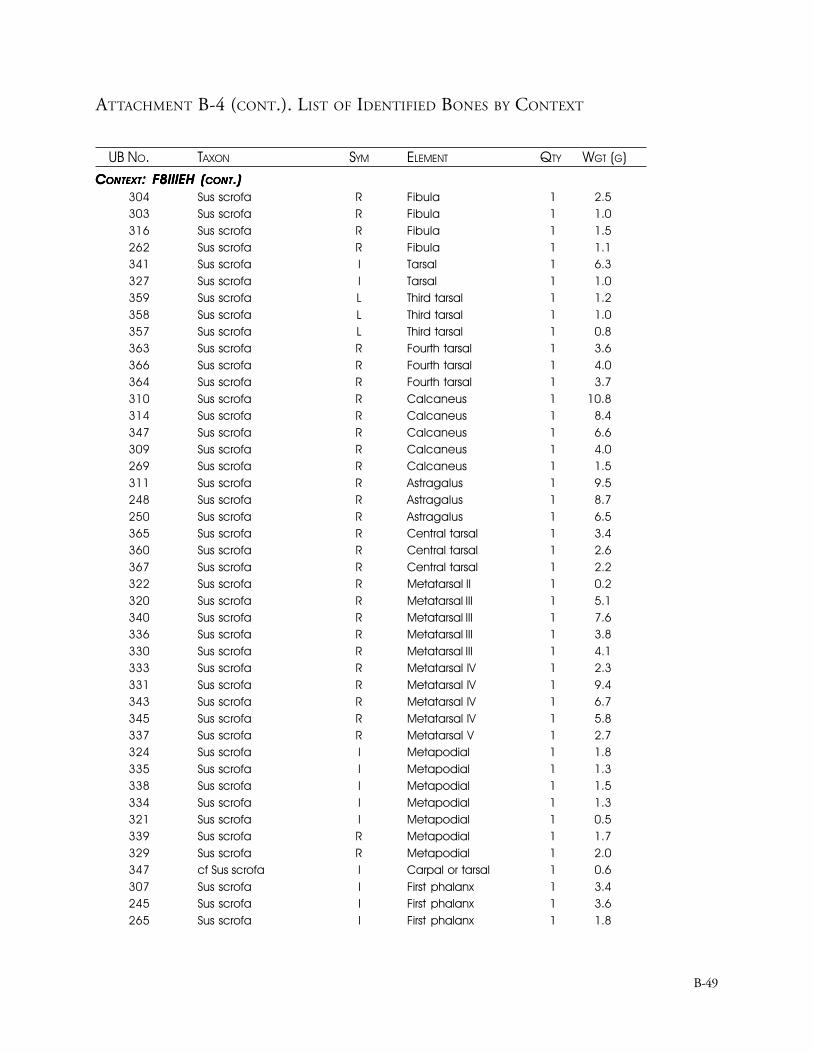
ATTACHMENT B-4 (CONT.). LIST OF IDENTIFIED BONES BY CONTEXT
UB NO. TAXON SYM ELEMENT QTY WGT (G)
B-49
CCCCCONTEXTONTEXTONTEXTONTEXTONTEXT: F8IIIEH (: F8IIIEH (: F8IIIEH (: F8IIIEH (: F8IIIEH (CONTCONTCONTCONTCONT.).).).).)304 Sus scrofa R Fibula 1 2.5303 Sus scrofa R Fibula 1 1.0316 Sus scrofa R Fibula 1 1.5262 Sus scrofa R Fibula 1 1.1341 Sus scrofa I Tarsal 1 6.3327 Sus scrofa I Tarsal 1 1.0359 Sus scrofa L Third tarsal 1 1.2358 Sus scrofa L Third tarsal 1 1.0357 Sus scrofa L Third tarsal 1 0.8363 Sus scrofa R Fourth tarsal 1 3.6366 Sus scrofa R Fourth tarsal 1 4.0364 Sus scrofa R Fourth tarsal 1 3.7310 Sus scrofa R Calcaneus 1 10.8314 Sus scrofa R Calcaneus 1 8.4347 Sus scrofa R Calcaneus 1 6.6309 Sus scrofa R Calcaneus 1 4.0269 Sus scrofa R Calcaneus 1 1.5311 Sus scrofa R Astragalus 1 9.5248 Sus scrofa R Astragalus 1 8.7250 Sus scrofa R Astragalus 1 6.5365 Sus scrofa R Central tarsal 1 3.4360 Sus scrofa R Central tarsal 1 2.6367 Sus scrofa R Central tarsal 1 2.2322 Sus scrofa R Metatarsal II 1 0.2320 Sus scrofa R Metatarsal III 1 5.1340 Sus scrofa R Metatarsal III 1 7.6336 Sus scrofa R Metatarsal III 1 3.8330 Sus scrofa R Metatarsal III 1 4.1333 Sus scrofa R Metatarsal IV 1 2.3331 Sus scrofa R Metatarsal IV 1 9.4343 Sus scrofa R Metatarsal IV 1 6.7345 Sus scrofa R Metatarsal IV 1 5.8337 Sus scrofa R Metatarsal V 1 2.7324 Sus scrofa I Metapodial 1 1.8335 Sus scrofa I Metapodial 1 1.3338 Sus scrofa I Metapodial 1 1.5334 Sus scrofa I Metapodial 1 1.3321 Sus scrofa I Metapodial 1 0.5339 Sus scrofa R Metapodial 1 1.7329 Sus scrofa R Metapodial 1 2.0347 cf Sus scrofa I Carpal or tarsal 1 0.6307 Sus scrofa I First phalanx 1 3.4245 Sus scrofa I First phalanx 1 3.6265 Sus scrofa I First phalanx 1 1.8
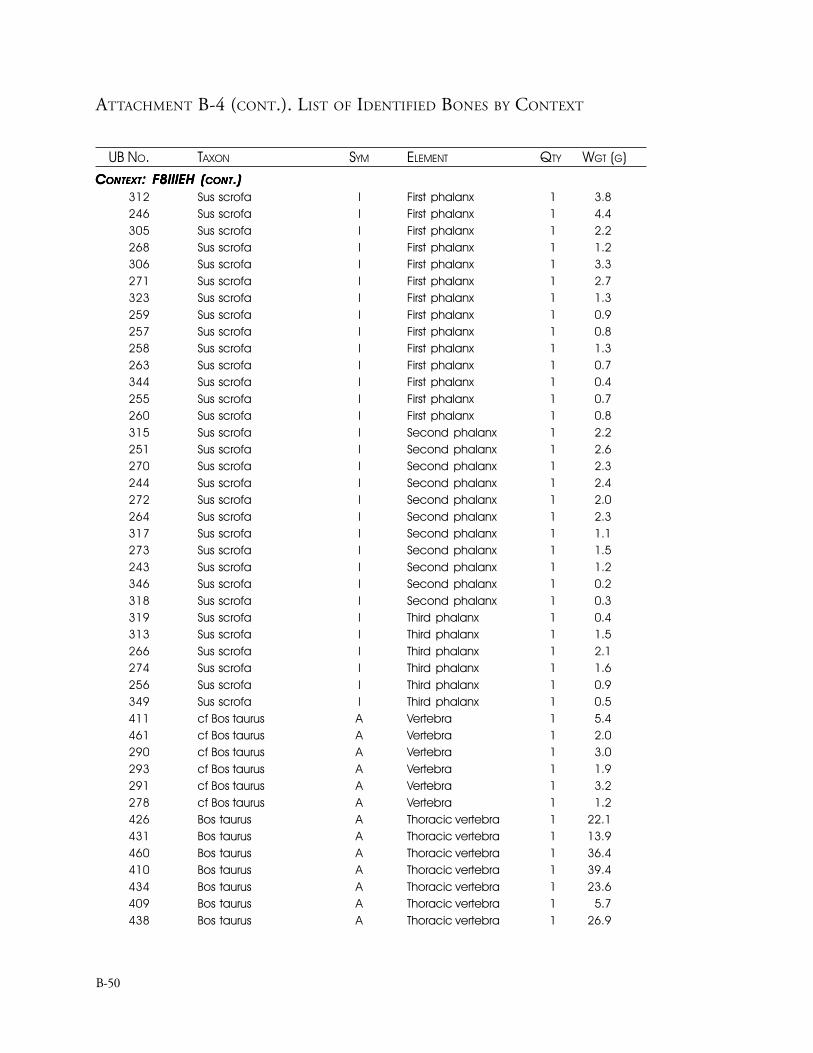
ATTACHMENT B-4 (CONT.). LIST OF IDENTIFIED BONES BY CONTEXT
UB NO. TAXON SYM ELEMENT QTY WGT (G)
B-50
CCCCCONTEXTONTEXTONTEXTONTEXTONTEXT: F8IIIEH (: F8IIIEH (: F8IIIEH (: F8IIIEH (: F8IIIEH (CONTCONTCONTCONTCONT.).).).).)312 Sus scrofa I First phalanx 1 3.8246 Sus scrofa I First phalanx 1 4.4305 Sus scrofa I First phalanx 1 2.2268 Sus scrofa I First phalanx 1 1.2306 Sus scrofa I First phalanx 1 3.3271 Sus scrofa I First phalanx 1 2.7323 Sus scrofa I First phalanx 1 1.3259 Sus scrofa I First phalanx 1 0.9257 Sus scrofa I First phalanx 1 0.8258 Sus scrofa I First phalanx 1 1.3263 Sus scrofa I First phalanx 1 0.7344 Sus scrofa I First phalanx 1 0.4255 Sus scrofa I First phalanx 1 0.7260 Sus scrofa I First phalanx 1 0.8315 Sus scrofa I Second phalanx 1 2.2251 Sus scrofa I Second phalanx 1 2.6270 Sus scrofa I Second phalanx 1 2.3244 Sus scrofa I Second phalanx 1 2.4272 Sus scrofa I Second phalanx 1 2.0264 Sus scrofa I Second phalanx 1 2.3317 Sus scrofa I Second phalanx 1 1.1273 Sus scrofa I Second phalanx 1 1.5243 Sus scrofa I Second phalanx 1 1.2346 Sus scrofa I Second phalanx 1 0.2318 Sus scrofa I Second phalanx 1 0.3319 Sus scrofa I Third phalanx 1 0.4313 Sus scrofa I Third phalanx 1 1.5266 Sus scrofa I Third phalanx 1 2.1274 Sus scrofa I Third phalanx 1 1.6256 Sus scrofa I Third phalanx 1 0.9349 Sus scrofa I Third phalanx 1 0.5411 cf Bos taurus A Vertebra 1 5.4461 cf Bos taurus A Vertebra 1 2.0290 cf Bos taurus A Vertebra 1 3.0293 cf Bos taurus A Vertebra 1 1.9291 cf Bos taurus A Vertebra 1 3.2278 cf Bos taurus A Vertebra 1 1.2426 Bos taurus A Thoracic vertebra 1 22.1431 Bos taurus A Thoracic vertebra 1 13.9460 Bos taurus A Thoracic vertebra 1 36.4410 Bos taurus A Thoracic vertebra 1 39.4434 Bos taurus A Thoracic vertebra 1 23.6409 Bos taurus A Thoracic vertebra 1 5.7438 Bos taurus A Thoracic vertebra 1 26.9
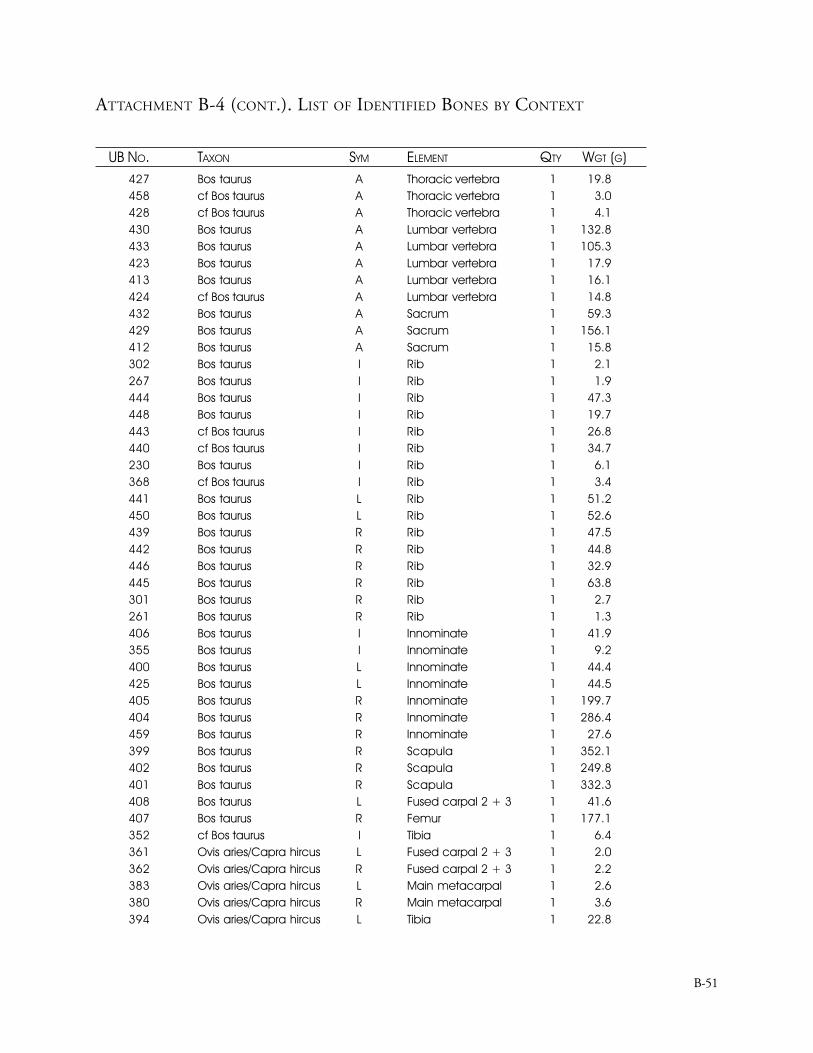
ATTACHMENT B-4 (CONT.). LIST OF IDENTIFIED BONES BY CONTEXT
UB NO. TAXON SYM ELEMENT QTY WGT (G)
B-51
427 Bos taurus A Thoracic vertebra 1 19.8458 cf Bos taurus A Thoracic vertebra 1 3.0428 cf Bos taurus A Thoracic vertebra 1 4.1430 Bos taurus A Lumbar vertebra 1 132.8433 Bos taurus A Lumbar vertebra 1 105.3423 Bos taurus A Lumbar vertebra 1 17.9413 Bos taurus A Lumbar vertebra 1 16.1424 cf Bos taurus A Lumbar vertebra 1 14.8432 Bos taurus A Sacrum 1 59.3429 Bos taurus A Sacrum 1 156.1412 Bos taurus A Sacrum 1 15.8302 Bos taurus I Rib 1 2.1267 Bos taurus I Rib 1 1.9444 Bos taurus I Rib 1 47.3448 Bos taurus I Rib 1 19.7443 cf Bos taurus I Rib 1 26.8440 cf Bos taurus I Rib 1 34.7230 Bos taurus I Rib 1 6.1368 cf Bos taurus I Rib 1 3.4441 Bos taurus L Rib 1 51.2450 Bos taurus L Rib 1 52.6439 Bos taurus R Rib 1 47.5442 Bos taurus R Rib 1 44.8446 Bos taurus R Rib 1 32.9445 Bos taurus R Rib 1 63.8301 Bos taurus R Rib 1 2.7261 Bos taurus R Rib 1 1.3406 Bos taurus I Innominate 1 41.9355 Bos taurus I Innominate 1 9.2400 Bos taurus L Innominate 1 44.4425 Bos taurus L Innominate 1 44.5405 Bos taurus R Innominate 1 199.7404 Bos taurus R Innominate 1 286.4459 Bos taurus R Innominate 1 27.6399 Bos taurus R Scapula 1 352.1402 Bos taurus R Scapula 1 249.8401 Bos taurus R Scapula 1 332.3408 Bos taurus L Fused carpal 2 + 3 1 41.6407 Bos taurus R Femur 1 177.1352 cf Bos taurus I Tibia 1 6.4361 Ovis aries/Capra hircus L Fused carpal 2 + 3 1 2.0362 Ovis aries/Capra hircus R Fused carpal 2 + 3 1 2.2383 Ovis aries/Capra hircus L Main metacarpal 1 2.6380 Ovis aries/Capra hircus R Main metacarpal 1 3.6394 Ovis aries/Capra hircus L Tibia 1 22.8
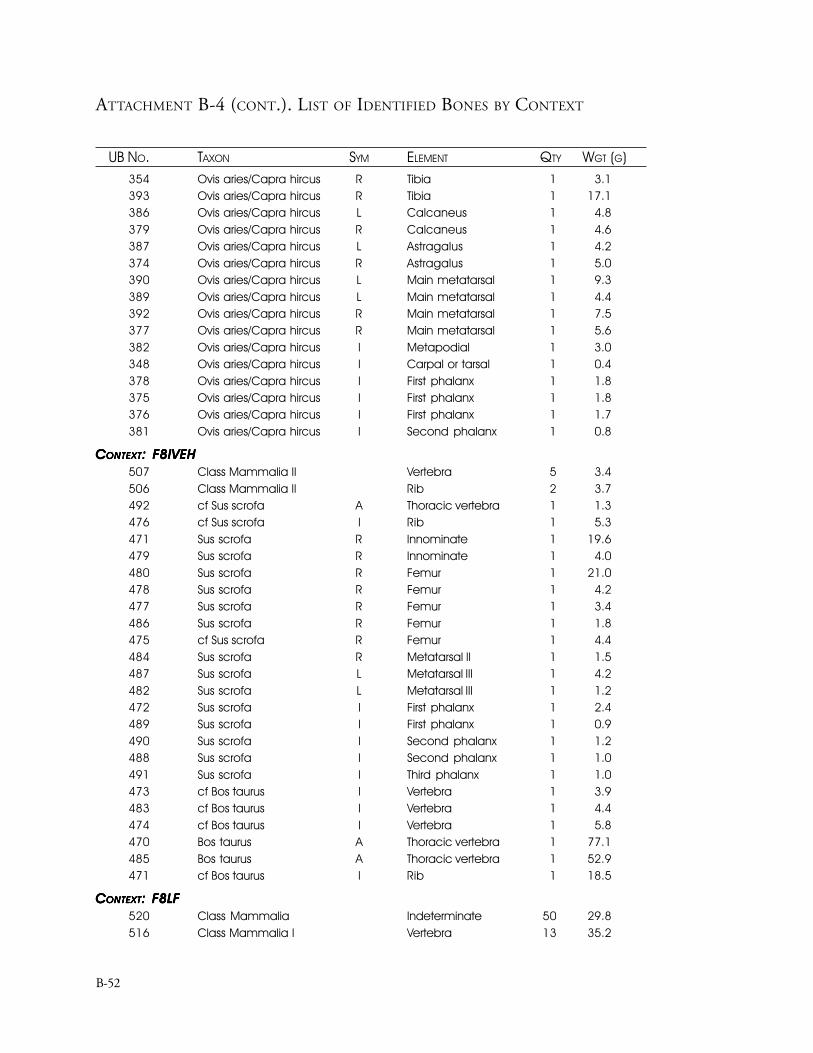
ATTACHMENT B-4 (CONT.). LIST OF IDENTIFIED BONES BY CONTEXT
UB NO. TAXON SYM ELEMENT QTY WGT (G)
B-52
354 Ovis aries/Capra hircus R Tibia 1 3.1393 Ovis aries/Capra hircus R Tibia 1 17.1386 Ovis aries/Capra hircus L Calcaneus 1 4.8379 Ovis aries/Capra hircus R Calcaneus 1 4.6387 Ovis aries/Capra hircus L Astragalus 1 4.2374 Ovis aries/Capra hircus R Astragalus 1 5.0390 Ovis aries/Capra hircus L Main metatarsal 1 9.3389 Ovis aries/Capra hircus L Main metatarsal 1 4.4392 Ovis aries/Capra hircus R Main metatarsal 1 7.5377 Ovis aries/Capra hircus R Main metatarsal 1 5.6382 Ovis aries/Capra hircus I Metapodial 1 3.0348 Ovis aries/Capra hircus I Carpal or tarsal 1 0.4378 Ovis aries/Capra hircus I First phalanx 1 1.8375 Ovis aries/Capra hircus I First phalanx 1 1.8376 Ovis aries/Capra hircus I First phalanx 1 1.7381 Ovis aries/Capra hircus I Second phalanx 1 0.8
CCCCCONTEXTONTEXTONTEXTONTEXTONTEXT: F8IVEH: F8IVEH: F8IVEH: F8IVEH: F8IVEH507 Class Mammalia II Vertebra 5 3.4506 Class Mammalia II Rib 2 3.7492 cf Sus scrofa A Thoracic vertebra 1 1.3476 cf Sus scrofa I Rib 1 5.3471 Sus scrofa R Innominate 1 19.6479 Sus scrofa R Innominate 1 4.0480 Sus scrofa R Femur 1 21.0478 Sus scrofa R Femur 1 4.2477 Sus scrofa R Femur 1 3.4486 Sus scrofa R Femur 1 1.8475 cf Sus scrofa R Femur 1 4.4484 Sus scrofa R Metatarsal II 1 1.5487 Sus scrofa L Metatarsal III 1 4.2482 Sus scrofa L Metatarsal III 1 1.2472 Sus scrofa I First phalanx 1 2.4489 Sus scrofa I First phalanx 1 0.9490 Sus scrofa I Second phalanx 1 1.2488 Sus scrofa I Second phalanx 1 1.0491 Sus scrofa I Third phalanx 1 1.0473 cf Bos taurus I Vertebra 1 3.9483 cf Bos taurus I Vertebra 1 4.4474 cf Bos taurus I Vertebra 1 5.8470 Bos taurus A Thoracic vertebra 1 77.1485 Bos taurus A Thoracic vertebra 1 52.9471 cf Bos taurus I Rib 1 18.5
CCCCCONTEXTONTEXTONTEXTONTEXTONTEXT: F8LF: F8LF: F8LF: F8LF: F8LF520 Class Mammalia Indeterminate 50 29.8516 Class Mammalia I Vertebra 13 35.2
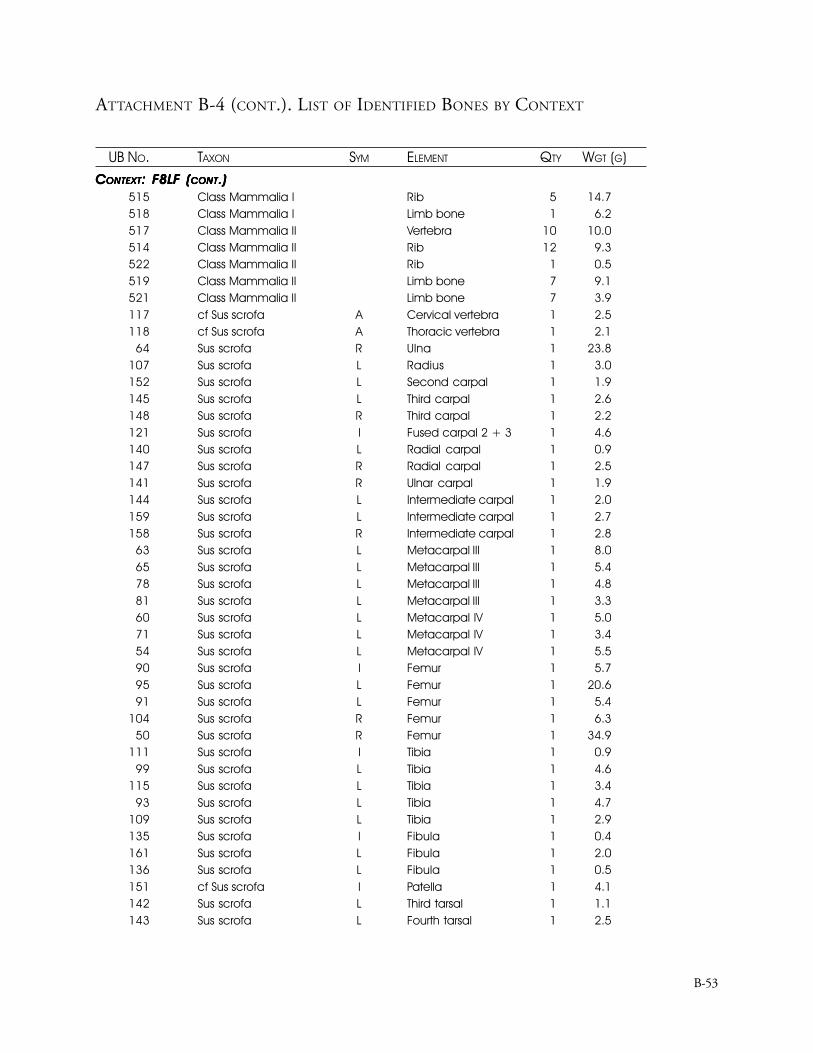
ATTACHMENT B-4 (CONT.). LIST OF IDENTIFIED BONES BY CONTEXT
UB NO. TAXON SYM ELEMENT QTY WGT (G)
B-53
CCCCCONTEXTONTEXTONTEXTONTEXTONTEXT: F8LF (: F8LF (: F8LF (: F8LF (: F8LF (CONTCONTCONTCONTCONT.).).).).)515 Class Mammalia I Rib 5 14.7518 Class Mammalia I Limb bone 1 6.2517 Class Mammalia II Vertebra 10 10.0514 Class Mammalia II Rib 12 9.3522 Class Mammalia II Rib 1 0.5519 Class Mammalia II Limb bone 7 9.1521 Class Mammalia II Limb bone 7 3.9117 cf Sus scrofa A Cervical vertebra 1 2.5118 cf Sus scrofa A Thoracic vertebra 1 2.1
64 Sus scrofa R Ulna 1 23.8107 Sus scrofa L Radius 1 3.0152 Sus scrofa L Second carpal 1 1.9145 Sus scrofa L Third carpal 1 2.6148 Sus scrofa R Third carpal 1 2.2121 Sus scrofa I Fused carpal 2 + 3 1 4.6140 Sus scrofa L Radial carpal 1 0.9147 Sus scrofa R Radial carpal 1 2.5141 Sus scrofa R Ulnar carpal 1 1.9144 Sus scrofa L Intermediate carpal 1 2.0159 Sus scrofa L Intermediate carpal 1 2.7158 Sus scrofa R Intermediate carpal 1 2.8
63 Sus scrofa L Metacarpal III 1 8.065 Sus scrofa L Metacarpal III 1 5.478 Sus scrofa L Metacarpal III 1 4.881 Sus scrofa L Metacarpal III 1 3.360 Sus scrofa L Metacarpal IV 1 5.071 Sus scrofa L Metacarpal IV 1 3.454 Sus scrofa L Metacarpal IV 1 5.590 Sus scrofa I Femur 1 5.795 Sus scrofa L Femur 1 20.691 Sus scrofa L Femur 1 5.4
104 Sus scrofa R Femur 1 6.350 Sus scrofa R Femur 1 34.9
111 Sus scrofa I Tibia 1 0.999 Sus scrofa L Tibia 1 4.6
115 Sus scrofa L Tibia 1 3.493 Sus scrofa L Tibia 1 4.7
109 Sus scrofa L Tibia 1 2.9135 Sus scrofa I Fibula 1 0.4161 Sus scrofa L Fibula 1 2.0136 Sus scrofa L Fibula 1 0.5151 cf Sus scrofa I Patella 1 4.1142 Sus scrofa L Third tarsal 1 1.1143 Sus scrofa L Fourth tarsal 1 2.5
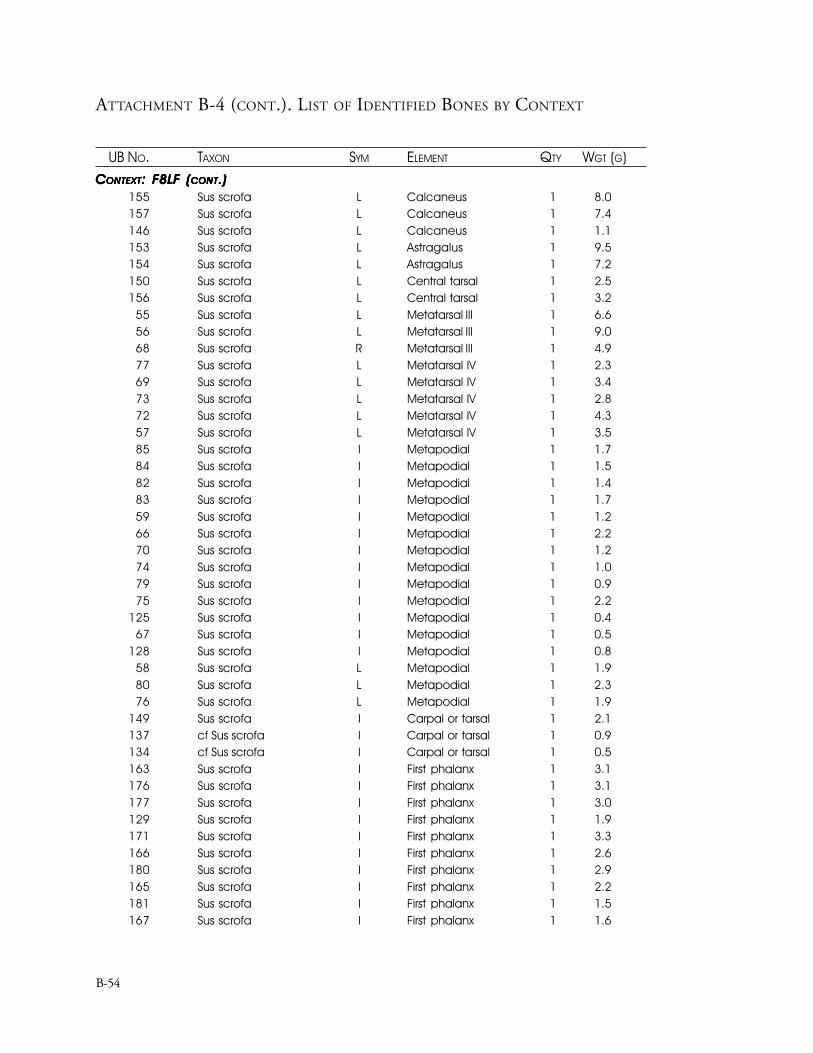
ATTACHMENT B-4 (CONT.). LIST OF IDENTIFIED BONES BY CONTEXT
UB NO. TAXON SYM ELEMENT QTY WGT (G)
B-54
CCCCCONTEXTONTEXTONTEXTONTEXTONTEXT: F8LF (: F8LF (: F8LF (: F8LF (: F8LF (CONTCONTCONTCONTCONT.).).).).)155 Sus scrofa L Calcaneus 1 8.0157 Sus scrofa L Calcaneus 1 7.4146 Sus scrofa L Calcaneus 1 1.1153 Sus scrofa L Astragalus 1 9.5154 Sus scrofa L Astragalus 1 7.2150 Sus scrofa L Central tarsal 1 2.5156 Sus scrofa L Central tarsal 1 3.2
55 Sus scrofa L Metatarsal III 1 6.656 Sus scrofa L Metatarsal III 1 9.068 Sus scrofa R Metatarsal III 1 4.977 Sus scrofa L Metatarsal IV 1 2.369 Sus scrofa L Metatarsal IV 1 3.473 Sus scrofa L Metatarsal IV 1 2.872 Sus scrofa L Metatarsal IV 1 4.357 Sus scrofa L Metatarsal IV 1 3.585 Sus scrofa I Metapodial 1 1.784 Sus scrofa I Metapodial 1 1.582 Sus scrofa I Metapodial 1 1.483 Sus scrofa I Metapodial 1 1.759 Sus scrofa I Metapodial 1 1.266 Sus scrofa I Metapodial 1 2.270 Sus scrofa I Metapodial 1 1.274 Sus scrofa I Metapodial 1 1.079 Sus scrofa I Metapodial 1 0.975 Sus scrofa I Metapodial 1 2.2
125 Sus scrofa I Metapodial 1 0.467 Sus scrofa I Metapodial 1 0.5
128 Sus scrofa I Metapodial 1 0.858 Sus scrofa L Metapodial 1 1.980 Sus scrofa L Metapodial 1 2.376 Sus scrofa L Metapodial 1 1.9
149 Sus scrofa I Carpal or tarsal 1 2.1137 cf Sus scrofa I Carpal or tarsal 1 0.9134 cf Sus scrofa I Carpal or tarsal 1 0.5163 Sus scrofa I First phalanx 1 3.1176 Sus scrofa I First phalanx 1 3.1177 Sus scrofa I First phalanx 1 3.0129 Sus scrofa I First phalanx 1 1.9171 Sus scrofa I First phalanx 1 3.3166 Sus scrofa I First phalanx 1 2.6180 Sus scrofa I First phalanx 1 2.9165 Sus scrofa I First phalanx 1 2.2181 Sus scrofa I First phalanx 1 1.5167 Sus scrofa I First phalanx 1 1.6
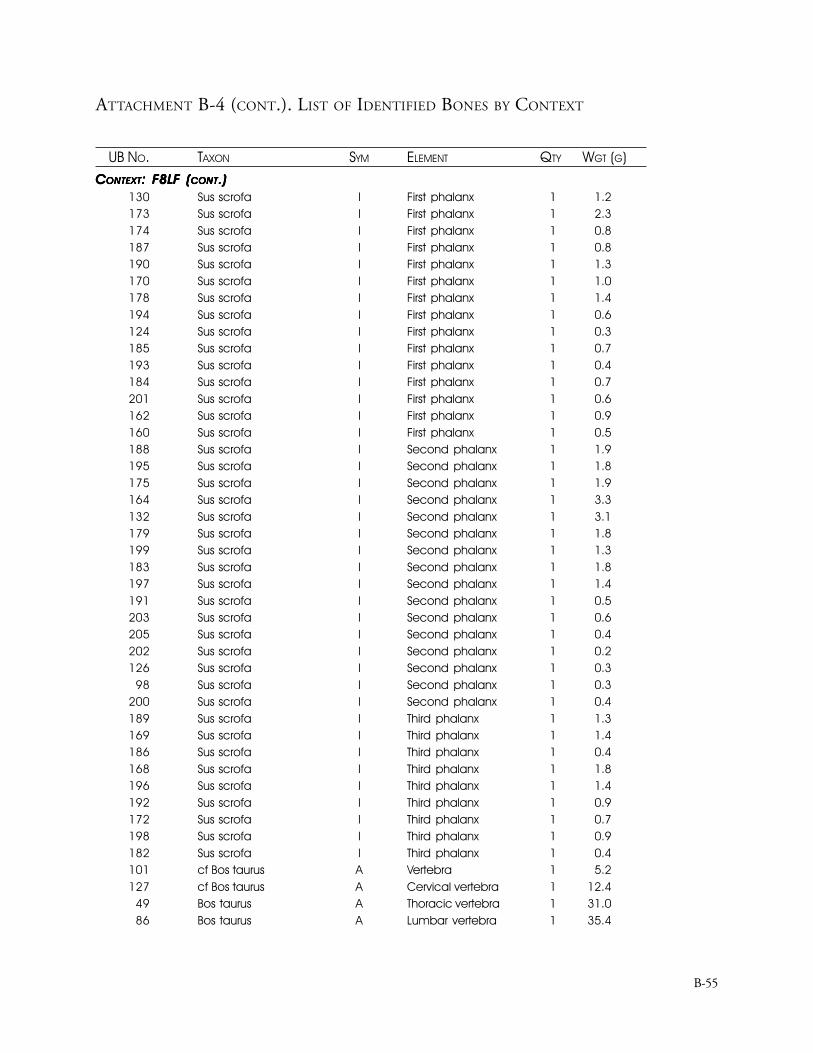
ATTACHMENT B-4 (CONT.). LIST OF IDENTIFIED BONES BY CONTEXT
UB NO. TAXON SYM ELEMENT QTY WGT (G)
B-55
CCCCCONTEXTONTEXTONTEXTONTEXTONTEXT: F8LF (: F8LF (: F8LF (: F8LF (: F8LF (CONTCONTCONTCONTCONT.).).).).)130 Sus scrofa I First phalanx 1 1.2173 Sus scrofa I First phalanx 1 2.3174 Sus scrofa I First phalanx 1 0.8187 Sus scrofa I First phalanx 1 0.8190 Sus scrofa I First phalanx 1 1.3170 Sus scrofa I First phalanx 1 1.0178 Sus scrofa I First phalanx 1 1.4194 Sus scrofa I First phalanx 1 0.6124 Sus scrofa I First phalanx 1 0.3185 Sus scrofa I First phalanx 1 0.7193 Sus scrofa I First phalanx 1 0.4184 Sus scrofa I First phalanx 1 0.7201 Sus scrofa I First phalanx 1 0.6162 Sus scrofa I First phalanx 1 0.9160 Sus scrofa I First phalanx 1 0.5188 Sus scrofa I Second phalanx 1 1.9195 Sus scrofa I Second phalanx 1 1.8175 Sus scrofa I Second phalanx 1 1.9164 Sus scrofa I Second phalanx 1 3.3132 Sus scrofa I Second phalanx 1 3.1179 Sus scrofa I Second phalanx 1 1.8199 Sus scrofa I Second phalanx 1 1.3183 Sus scrofa I Second phalanx 1 1.8197 Sus scrofa I Second phalanx 1 1.4191 Sus scrofa I Second phalanx 1 0.5203 Sus scrofa I Second phalanx 1 0.6205 Sus scrofa I Second phalanx 1 0.4202 Sus scrofa I Second phalanx 1 0.2126 Sus scrofa I Second phalanx 1 0.3
98 Sus scrofa I Second phalanx 1 0.3200 Sus scrofa I Second phalanx 1 0.4189 Sus scrofa I Third phalanx 1 1.3169 Sus scrofa I Third phalanx 1 1.4186 Sus scrofa I Third phalanx 1 0.4168 Sus scrofa I Third phalanx 1 1.8196 Sus scrofa I Third phalanx 1 1.4192 Sus scrofa I Third phalanx 1 0.9172 Sus scrofa I Third phalanx 1 0.7198 Sus scrofa I Third phalanx 1 0.9182 Sus scrofa I Third phalanx 1 0.4101 cf Bos taurus A Vertebra 1 5.2127 cf Bos taurus A Cervical vertebra 1 12.4
49 Bos taurus A Thoracic vertebra 1 31.086 Bos taurus A Lumbar vertebra 1 35.4
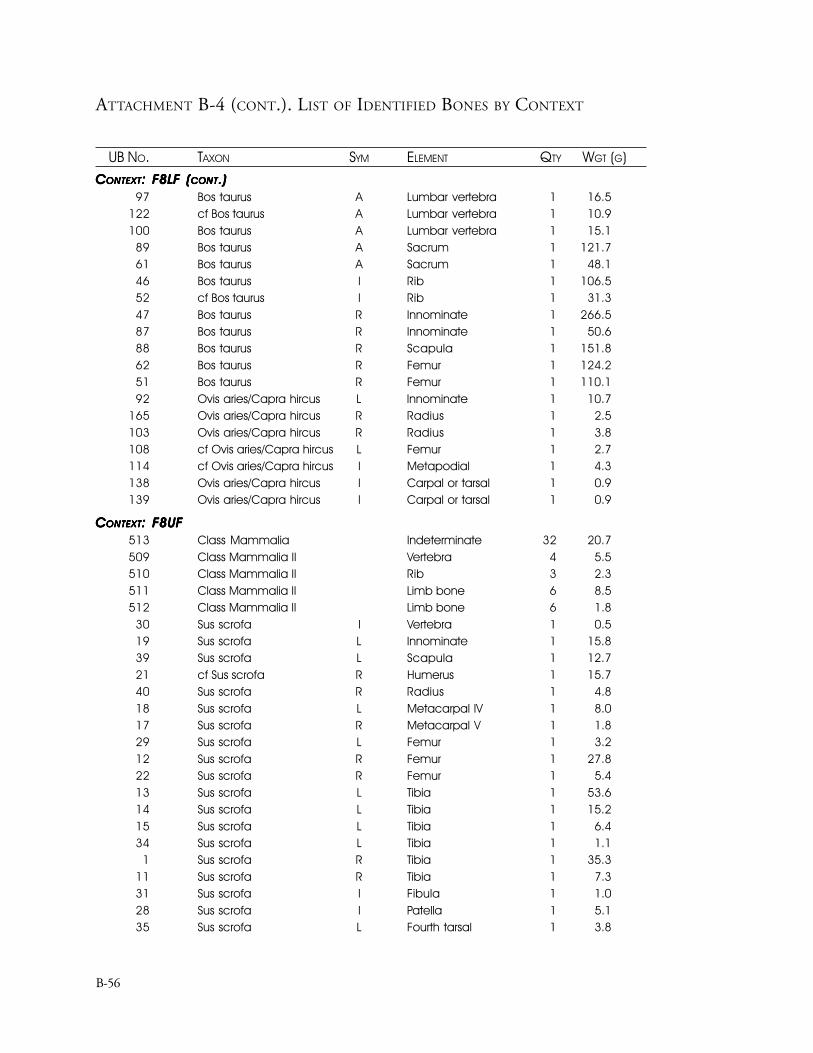
ATTACHMENT B-4 (CONT.). LIST OF IDENTIFIED BONES BY CONTEXT
UB NO. TAXON SYM ELEMENT QTY WGT (G)
B-56
CCCCCONTEXTONTEXTONTEXTONTEXTONTEXT: F8LF (: F8LF (: F8LF (: F8LF (: F8LF (CONTCONTCONTCONTCONT.).).).).)97 Bos taurus A Lumbar vertebra 1 16.5
122 cf Bos taurus A Lumbar vertebra 1 10.9100 Bos taurus A Lumbar vertebra 1 15.1
89 Bos taurus A Sacrum 1 121.761 Bos taurus A Sacrum 1 48.146 Bos taurus I Rib 1 106.552 cf Bos taurus I Rib 1 31.347 Bos taurus R Innominate 1 266.587 Bos taurus R Innominate 1 50.688 Bos taurus R Scapula 1 151.862 Bos taurus R Femur 1 124.251 Bos taurus R Femur 1 110.192 Ovis aries/Capra hircus L Innominate 1 10.7
165 Ovis aries/Capra hircus R Radius 1 2.5103 Ovis aries/Capra hircus R Radius 1 3.8108 cf Ovis aries/Capra hircus L Femur 1 2.7114 cf Ovis aries/Capra hircus I Metapodial 1 4.3138 Ovis aries/Capra hircus I Carpal or tarsal 1 0.9139 Ovis aries/Capra hircus I Carpal or tarsal 1 0.9
CCCCCONTEXTONTEXTONTEXTONTEXTONTEXT: F8UF: F8UF: F8UF: F8UF: F8UF513 Class Mammalia Indeterminate 32 20.7509 Class Mammalia II Vertebra 4 5.5510 Class Mammalia II Rib 3 2.3511 Class Mammalia II Limb bone 6 8.5512 Class Mammalia II Limb bone 6 1.8
30 Sus scrofa I Vertebra 1 0.519 Sus scrofa L Innominate 1 15.839 Sus scrofa L Scapula 1 12.721 cf Sus scrofa R Humerus 1 15.740 Sus scrofa R Radius 1 4.818 Sus scrofa L Metacarpal IV 1 8.017 Sus scrofa R Metacarpal V 1 1.829 Sus scrofa L Femur 1 3.212 Sus scrofa R Femur 1 27.822 Sus scrofa R Femur 1 5.413 Sus scrofa L Tibia 1 53.614 Sus scrofa L Tibia 1 15.215 Sus scrofa L Tibia 1 6.434 Sus scrofa L Tibia 1 1.1
1 Sus scrofa R Tibia 1 35.311 Sus scrofa R Tibia 1 7.331 Sus scrofa I Fibula 1 1.028 Sus scrofa I Patella 1 5.135 Sus scrofa L Fourth tarsal 1 3.8
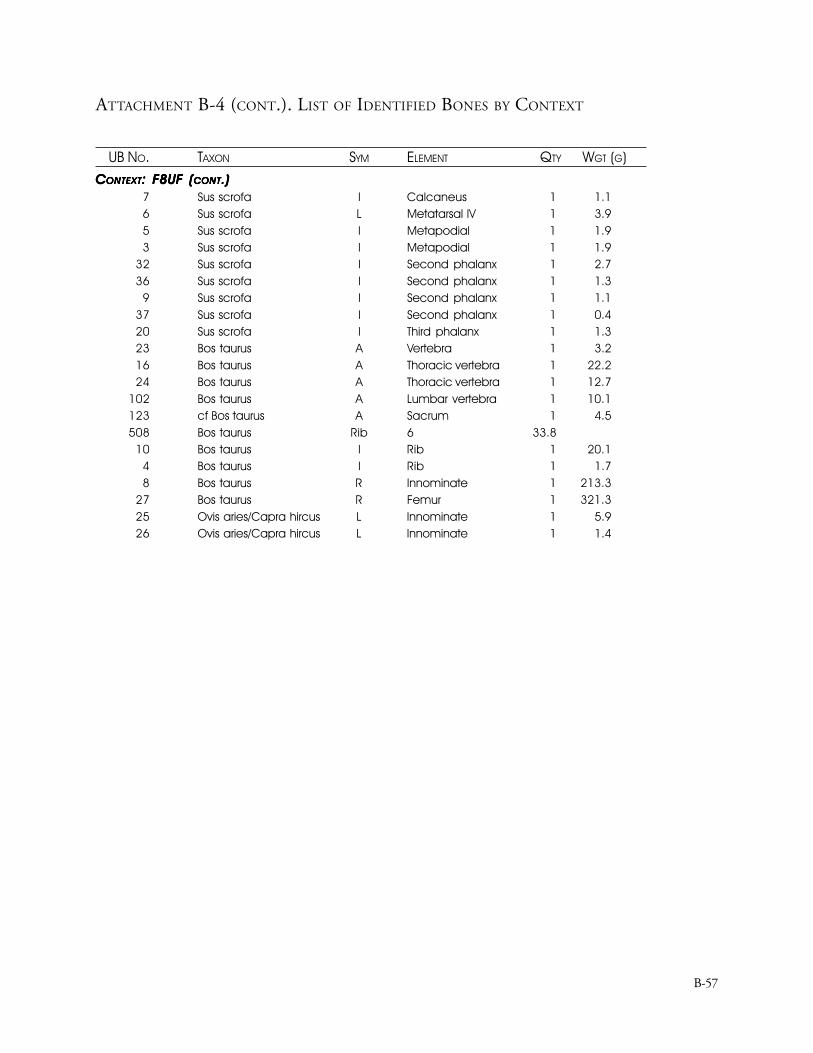
ATTACHMENT B-4 (CONT.). LIST OF IDENTIFIED BONES BY CONTEXT
UB NO. TAXON SYM ELEMENT QTY WGT (G)
B-57
CCCCCONTEXTONTEXTONTEXTONTEXTONTEXT: F8UF (: F8UF (: F8UF (: F8UF (: F8UF (CONTCONTCONTCONTCONT.).).).).)7 Sus scrofa I Calcaneus 1 1.16 Sus scrofa L Metatarsal IV 1 3.95 Sus scrofa I Metapodial 1 1.93 Sus scrofa I Metapodial 1 1.9
32 Sus scrofa I Second phalanx 1 2.736 Sus scrofa I Second phalanx 1 1.3
9 Sus scrofa I Second phalanx 1 1.137 Sus scrofa I Second phalanx 1 0.420 Sus scrofa I Third phalanx 1 1.323 Bos taurus A Vertebra 1 3.216 Bos taurus A Thoracic vertebra 1 22.224 Bos taurus A Thoracic vertebra 1 12.7
102 Bos taurus A Lumbar vertebra 1 10.1123 cf Bos taurus A Sacrum 1 4.5508 Bos taurus Rib 6 33.8
10 Bos taurus I Rib 1 20.14 Bos taurus I Rib 1 1.78 Bos taurus R Innominate 1 213.3
27 Bos taurus R Femur 1 321.325 Ovis aries/Capra hircus L Innominate 1 5.926 Ovis aries/Capra hircus L Innominate 1 1.4

B-58