Embed Size (px)
Citation preview
University of Wisconsin MilwaukeeUWM Digital Commons
Theses and Dissertations
May 2013
Faunal Subsistence Strategies Among Initial PeriodCoastal Fishers at the Gramalote Site in the MocheValley of PeruRachel Catherine McTavishUniversity of Wisconsin-Milwaukee
Follow this and additional works at: https://dc.uwm.edu/etdPart of the Archaeological Anthropology Commons
This Thesis is brought to you for free and open access by UWM Digital Commons. It has been accepted for inclusion in Theses and Dissertations by anauthorized administrator of UWM Digital Commons. For more information, please contact [email protected].
Recommended CitationMcTavish, Rachel Catherine, "Faunal Subsistence Strategies Among Initial Period Coastal Fishers at the Gramalote Site in the MocheValley of Peru" (2013). Theses and Dissertations. 320.https://dc.uwm.edu/etd/320
FAUNAL SUBSISTENCE STRATEGIES AMONG INITIAL PERIOD COASTAL FISHERS AT THE GRAMALOTE SITE IN THE MOCHE VALLEY OF PERU
by
Rachel C. McTavish
A Thesis Submitted in
Partial Fulfillment of the
Requirements for the Degree of
Master of Science
in Anthropology
at
The University of Wisconsin-Milwaukee
May 2013
ABSTRACT FAUNAL SUBSISTENCE STRATEGIES AMONG INITIAL PERIOD COASTAL
FISHERS AT THE GRAMALOTE SITE IN THE MOCHE VALLEY OF PERU
by
Rachel C. McTavish
The University of Wisconsin-Milwaukee, 2013 Under the Supervision of Professor Jean Hudson
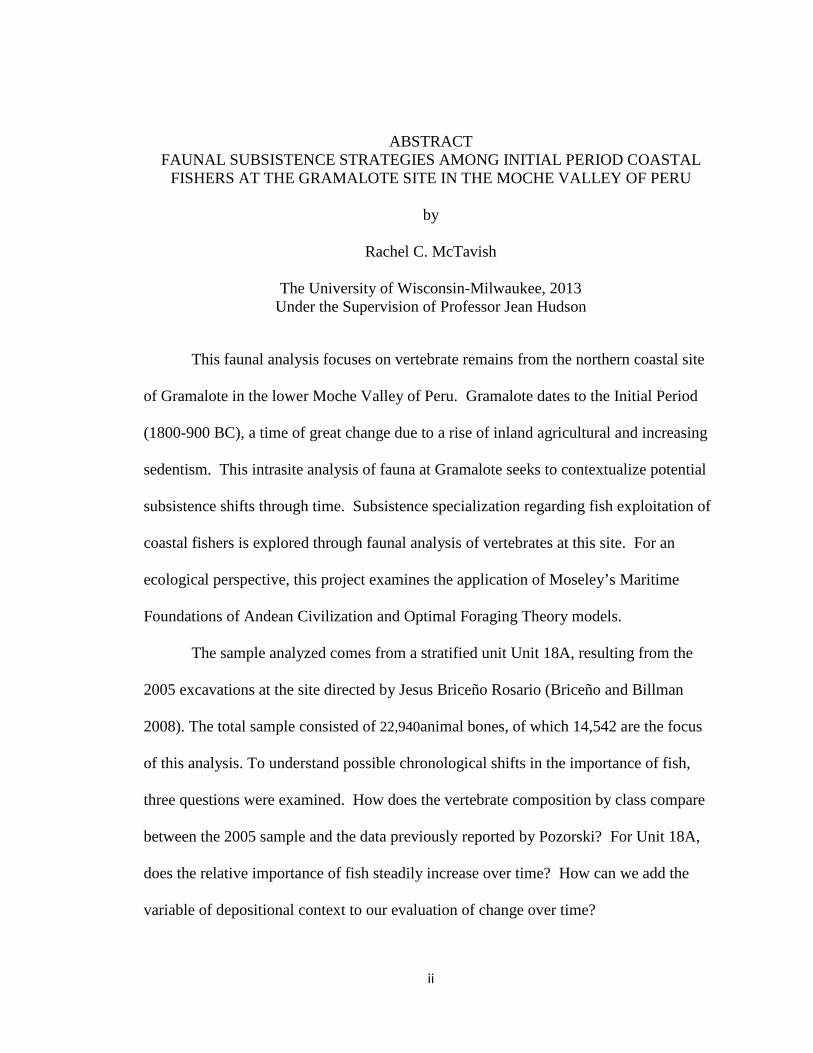
This faunal analysis focuses on vertebrate remains from the northern coastal site
of Gramalote in the lower Moche Valley of Peru. Gramalote dates to the Initial Period
(1800-900 BC), a time of great change due to a rise of inland agricultural and increasing
sedentism. This intrasite analysis of fauna at Gramalote seeks to contextualize potential
subsistence shifts through time. Subsistence specialization regarding fish exploitation of
coastal fishers is explored through faunal analysis of vertebrates at this site. For an
ecological perspective, this project examines the application of Moseley’s Maritime
Foundations of Andean Civilization and Optimal Foraging Theory models.
The sample analyzed comes from a stratified unit Unit 18A, resulting from the
2005 excavations at the site directed by Jesus Briceño Rosario (Briceño and Billman
2008). The total sample consisted of 22,940animal bones, of which 14,542 are the focus
of this analysis. To understand possible chronological shifts in the importance of fish,
three questions were examined. How does the vertebrate composition by class compare
between the 2005 sample and the data previously reported by Pozorski? For Unit 18A,
does the relative importance of fish steadily increase over time? How can we add the
variable of depositional context to our evaluation of change over time?
ii
© Copyright by Rachel McTavish, 2013 All Rights Reserved
iii
TABLE OF CONTENTS
Chapter One: Introduction--------------------------------------------------------------------------1
Moseley’s Maritime Foundations of Andean Civilization ----------------------------5
Optimal Foraging Theory -----------------------------------------------------------------6
Research Goals ------------------------------------------------------------------------------8
Thesis Organization-------------------------------------------------------------------------9
Chapter Two: Environmental Background -----------------------------------------------------10
Highlands ---------------------------------------------------------------------------------- 10
Coast ----------------------------------------------------------------------------------------13
El Niño -------------------------------------------------------------------------------------15
Moche Valley ------------------------------------------------------------------------------15
Summary -----------------------------------------------------------------------------------17
Chapter Three: Culture History and Site Background ---------------------------------------- 19
Late Preceramic Period -------------------------------------------------------------------19
Key Preceramic Sites ---------------------------------------------------------------------21
Initial Period -------------------------------------------------------------------------------23
Site Background ---------------------------------------------------------------------------28
Shelia Pozorski’s 1976 Excavations ----------------------------------------------------29
Briceño and Billman’s 2005 Excavations ----------------------------------------------33
Gabriel Prieto’s 2010 Excavations ------------------------------------------------------37
Summary -----------------------------------------------------------------------------------37
iv
Chapter Four: Methods ----------------------------------------------------------------------------39
Excavation Methods ----------------------------------------------------------------------39
Sample Size and Preservation -----------------------------------------------------------41
Laboratory Protocol -----------------------------------------------------------------------42
Identification -------------------------------------------------------------------------------43
Quantification -----------------------------------------------------------------------------45
Chapter Five: Results and Analysis -------------------------------------------------------------47
Results from 18A -------------------------------------------------------------------------47
Composition by Taxonomic Class ------------------------------------------------------51
Chronological Changes in the Relative Importance of Fish-------------------------53
The Role of Depositional Context ------------------------------------------------------57
Summary -----------------------------------------------------------------------------------63
Chapter Six: Conclusions -------------------------------------------------------------------------64
References Cited -----------------------------------------------------------------------------------68
Appendix A -----------------------------------------------------------------------------------------76
Appendix B -----------------------------------------------------------------------------------------81
Architecture --------------------------------------------------------------------------------81
Burials --------------------------------------------------------------------------------------81
v
LIST OF TABLES
Table 2.1: Moche Valley Environmental Zones -----------------------------------------------16
Table 3.1: Moche Valley Irrigation Agriculture Developments -----------------------------26
Table 3.2: 1976 Vertebrate Data from Gramalote ---------------------------------------------32
Table 3.3: Summary of Unit 18A Provenience and Artifacts --------------------------------35
Table 3.4: Summary of Unit 18A Structures and Features -----------------------------------36
Table 4.1: Class and NISP Weights -------------------------------------------------------------41
Table 4.2: Recorded Information ----------------------------------------------------------------43
Table 5.1: Mammal Identification Levels: NISP and Weight (g) ---------------------------49
Table 5.2: Bird Identification Levels: NISP and Weight (g) ---------------------------------50
Table 5.3: Taxonomic Class NISP by Capa ----------------------------------------------------50
Table 5.4: Taxonomic Class Weight (g) by Capa ---------------------------------------------51
Table 5.5: Taxonomic Class Weight (g) Comparison of Pozorski’s 1976 and Unit 18A Samples ----------------------------------------------------------------------------------------------52
Table 5.6: Taxonomic Class NISP by Capa ----------------------------------------------------59
vi
LIST OF FIGURES
Figure 1.1: Map of North Coast Peru -------------------------------------------------------------2
Figure 1.2: Generalized Chronology of Peruvian Coast ----------------------------------------4
Figure 2.1: Major Coastal Rivers of Peru with Elevation ------------------------------------12
Figure 2.2: Peruvian Coastal Zones and Ocean Current---------------------------------------13
Figure 3.1: Preceramic and Initial Period Coastal Sites---------------------------------------20
Figure 3.2: Environmental Zones in the Moche Valley ---------------------------------------27
Figure 3.3: Pozorski’s 1976 Excavation Area of Gramalote----------------------------------30
Figure 3.4: 2005 Excavation Map ---------------------------------------------------------------34
Figure 4.1: Gramalote Unit 18A North Profile -------------------------------------------------40
Figure 5.1: Unit 18A Specimen Identified ------------------------------------------------------48
Figure 5.2: 1976 and 2005 Gramalote Sample Weight (g) Comparions --------------------52
Figure 5.3: Fish and Non-Fish NISP Comparison by Capa ----------------------------------54
Figure 5.4: Fish and Non-Fish Weight Comparison by Capa--------------------------------55
Figure 5.5: Fish to Non-Fish by Capa (NISP>1,000) -----------------------------------------56
Figure 5.6: Fish to Non-Fish by Capa (NISP >1,000) ----------------------------------------56
Figure 5.7: Pachamanca Features ---------------------------------------------------------------58
Figure 5.8: Taxonomic Weight (g) by Capa ---------------------------------------------------60
Figure 5.9: Taxonomic Class by Midden Capa Weight (g) with NISP >1,000 -----------61
Figure 5.10: Taxonomic Class by Occupational Surface -------------------------------------62
vii
ACKNOWLEDGEMENTS
Thank you to my adviser, Dr. Jean Hudson, for allowing me to continue research
in South America, for teaching me the skills necessary for this research, and providing
support throughout this process. I would like to thank my committee members, Dr. Jason
Sherman and Dr. Laura Villamil for their patience and advice during this project. It has
made this thesis stronger as well as my resolve as an academic. The 2009 study abroad
students’ work provided a jumping-off point for this project and their hard work is
incorporated in the data used for interpreting the Gramalote strata column. I would like
to especially thank Roberta Boczkiewicz for her help in Peru and at UW-Milwaukee
throughout my thesis work; her friendship has helped me immensely. I am grateful to
Jesus Briceño Rosario and Brian Billman for providing access to the Gramalote
assemblage and provenience data to understand the contexts of the dataset.
Funding for travel was provided by the UW-Milwaukee Center for Latin
American and Caribbean Studies Graduate Student Travel Award. The UWM Graduate
School Research Committee Award 2010-2011 to Jean Hudson, “Transitions at
Gramalote” and MOCHE, Inc. provided infrastructure support for the project. The
Instituto Nacional de Cultura–La Libertad, Peru continues to provide curation and I thank
them for access to these collections for study.
Thanks to my family’s unending support, in particular my parents’ never-
wavering belief in my abilities helped me to continue to work towards this project, no
matter what hard life lessons rocked my confidence. My friends, as a second family,
were extremely helpful in keeping me on target by providing many opportunities for
caffeine, sweets, encouragement, and kicking me out of the archaeology lab by midnight.
viii
Dan Shea was easily been one of the most influential people in my life; his was a
close mentor to me and is an integral part of my academic career. His abilities to tell
vivid stories from field, lab, and teaching experiences guided and inspired me in pursuit
of archaeology. His continued guidance and encouragement throughout this process will
never be forgotten. This thesis is humbly dedicated to his memory.
ix
1
CHAPTER 1: INTRODUCTION
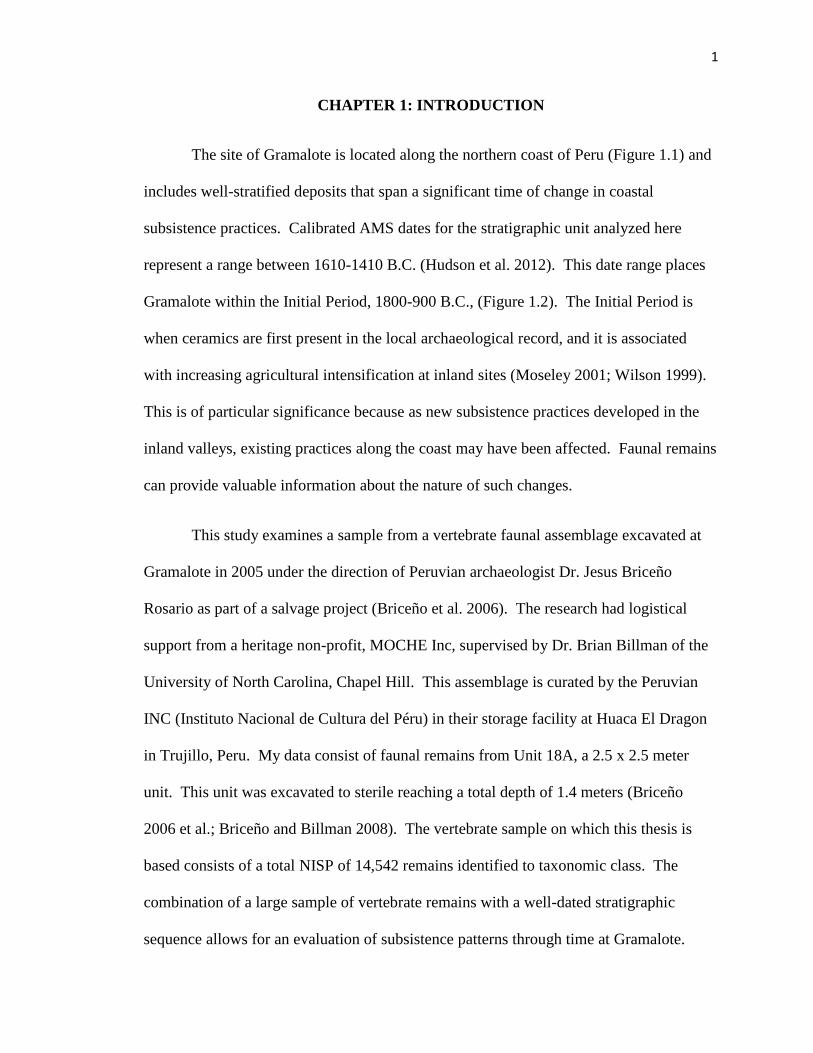
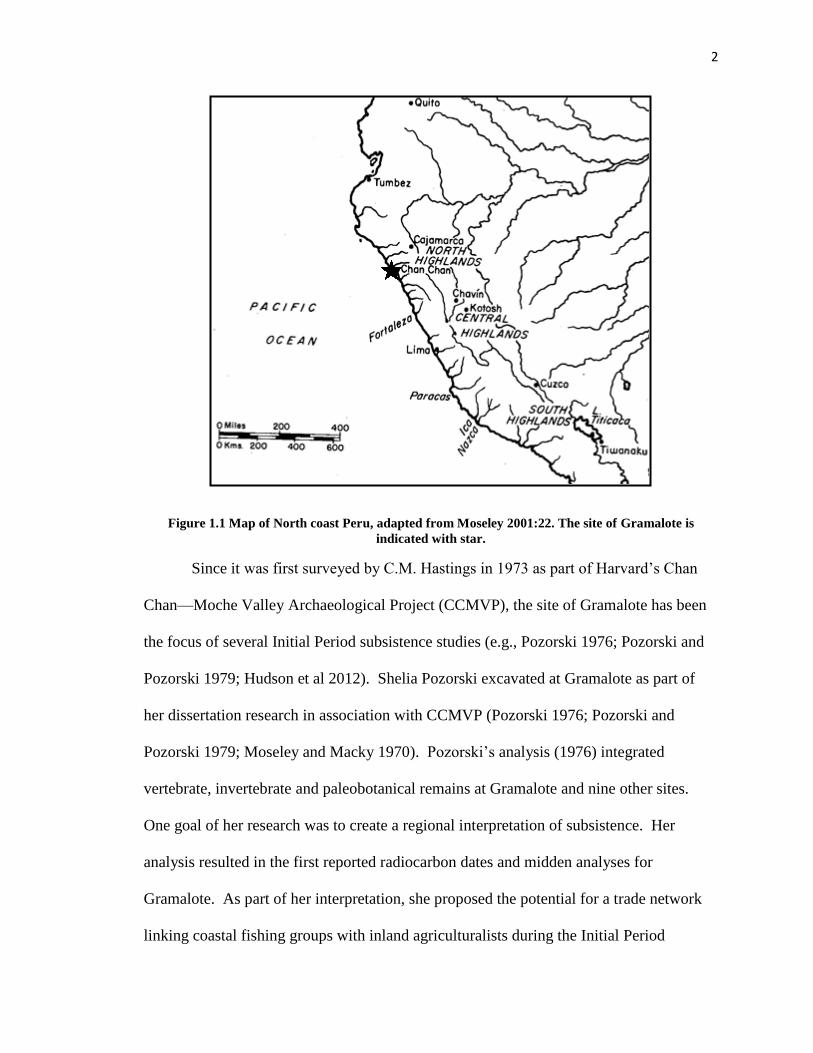
The site of Gramalote is located along the northern coast of Peru (Figure 1.1) and
includes well-stratified deposits that span a significant time of change in coastal
subsistence practices. Calibrated AMS dates for the stratigraphic unit analyzed here
represent a range between 1610-1410 B.C. (Hudson et al. 2012). This date range places
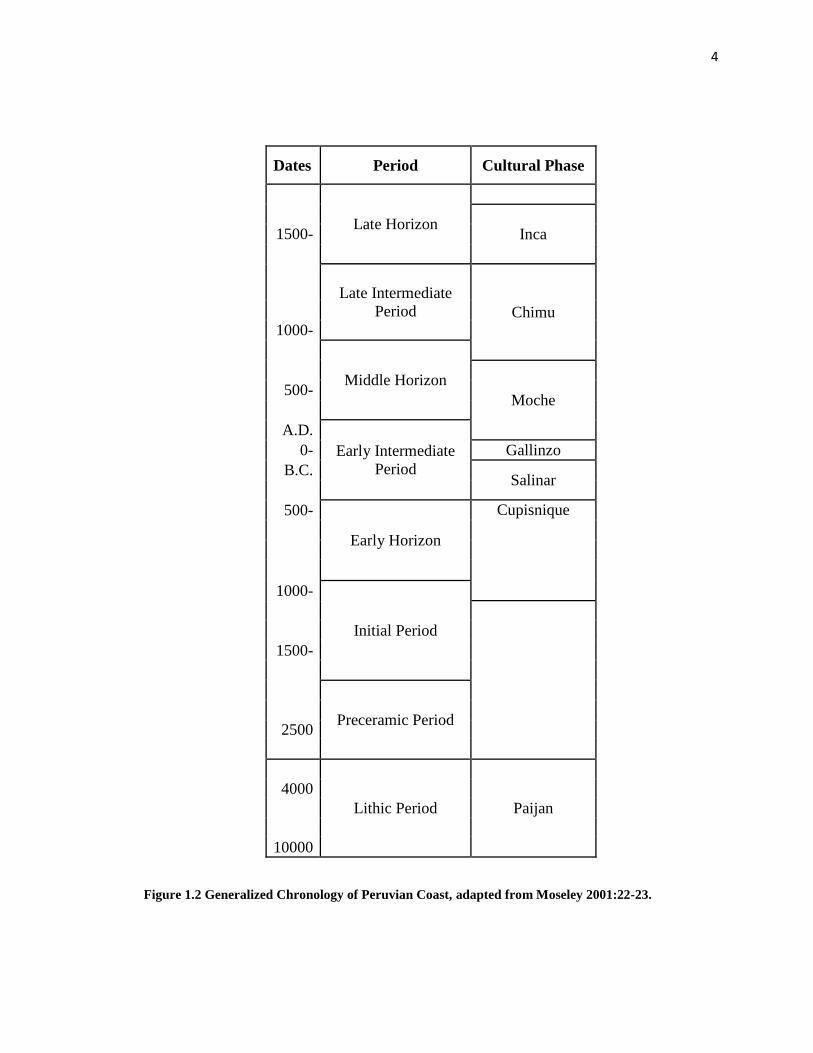
Gramalote within the Initial Period, 1800-900 B.C., (Figure 1.2). The Initial Period is
when ceramics are first present in the local archaeological record, and it is associated
with increasing agricultural intensification at inland sites (Moseley 2001; Wilson 1999).
This is of particular significance because as new subsistence practices developed in the
inland valleys, existing practices along the coast may have been affected. Faunal remains
can provide valuable information about the nature of such changes.
This study examines a sample from a vertebrate faunal assemblage excavated at
Gramalote in 2005 under the direction of Peruvian archaeologist Dr. Jesus Briceño
Rosario as part of a salvage project (Briceño et al. 2006). The research had logistical
support from a heritage non-profit, MOCHE Inc, supervised by Dr. Brian Billman of the
University of North Carolina, Chapel Hill. This assemblage is curated by the Peruvian
INC (Instituto Nacional de Cultura del Péru) in their storage facility at Huaca El Dragon
in Trujillo, Peru. My data consist of faunal remains from Unit 18A, a 2.5 x 2.5 meter
unit. This unit was excavated to sterile reaching a total depth of 1.4 meters (Briceño
2006 et al.; Briceño and Billman 2008). The vertebrate sample on which this thesis is
based consists of a total NISP of 14,542 remains identified to taxonomic class. The
combination of a large sample of vertebrate remains with a well-dated stratigraphic
sequence allows for an evaluation of subsistence patterns through time at Gramalote.
2
Figure 1.1 Map of North coast Peru, adapted from Moseley 2001:22. The site of Gramalote is
indicated with star.
Since it was first surveyed by C.M. Hastings in 1973 as part of Harvard’s Chan
Chan—Moche Valley Archaeological Project (CCMVP), the site of Gramalote has been
the focus of several Initial Period subsistence studies (e.g., Pozorski 1976; Pozorski and
Pozorski 1979; Hudson et al 2012). Shelia Pozorski excavated at Gramalote as part of
her dissertation research in association with CCMVP (Pozorski 1976; Pozorski and
Pozorski 1979; Moseley and Macky 1970). Pozorski’s analysis (1976) integrated
vertebrate, invertebrate and paleobotanical remains at Gramalote and nine other sites.
One goal of her research was to create a regional interpretation of subsistence. Her
analysis resulted in the first reported radiocarbon dates and midden analyses for
Gramalote. As part of her interpretation, she proposed the potential for a trade network
linking coastal fishing groups with inland agriculturalists during the Initial Period
3
(Pozorski 1976). Her analysis incorporated invertebrate and vertebrate remains to gain
insight to overall site subsistence strategies. During her analysis, shellfish was a higher-
ranked resource than fish. Pozorski noted the presence of fish, birds, and marine
mammals, and the quantification of their use through time is the focus of this analysis.
Pozorski’s analysis is reviewed in more detail in Chapter 3 and compared to the Unit 18A
sample in Chapter 4.
4
Dates Period Cultural Phase
Late Horizon Inca 1500-
Late Intermediate
Period Chimu 1000-
Middle Horizon
Moche 500-
A.D.
Early Intermediate
Period
0- Gallinzo
B.C. Salinar
500-
Early Horizon
Cupisnique
1000-
Initial Period
1500-
Preceramic Period 2500
Lithic Period Paijan
4000
10000
Figure 1.2 Generalized Chronology of Peruvian Coast, adapted from Moseley 2001:22-23.
5
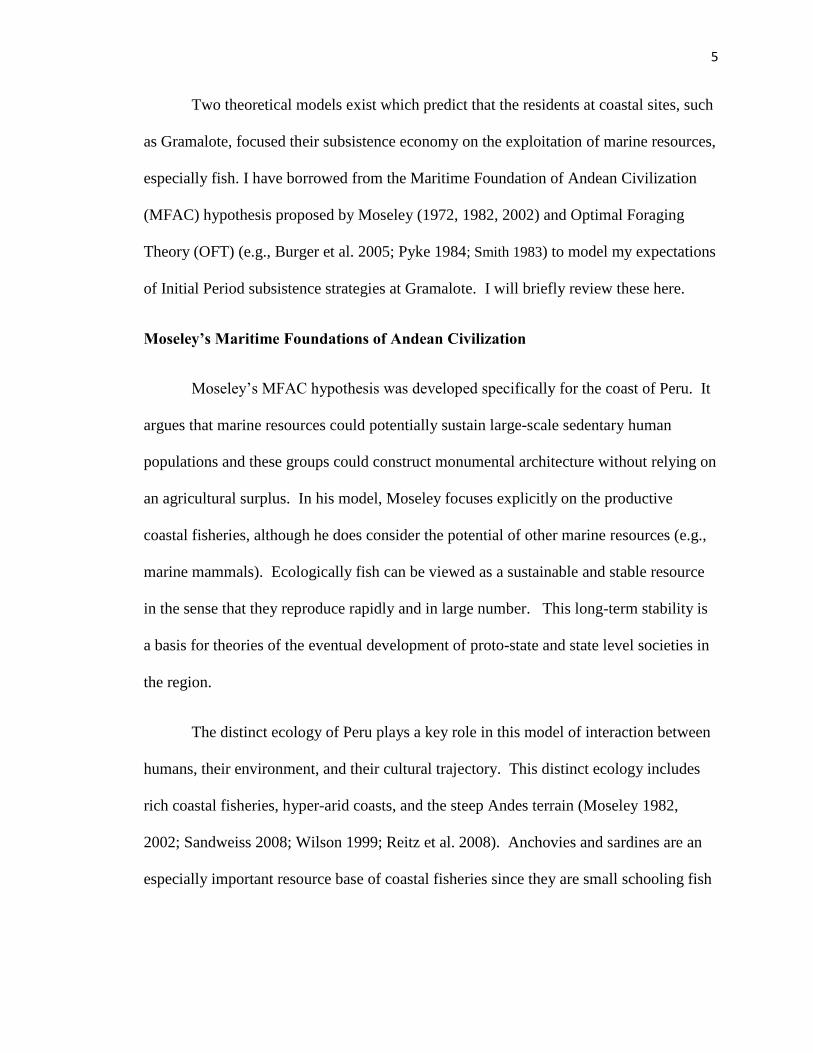
Two theoretical models exist which predict that the residents at coastal sites, such
as Gramalote, focused their subsistence economy on the exploitation of marine resources,
especially fish. I have borrowed from the Maritime Foundation of Andean Civilization
(MFAC) hypothesis proposed by Moseley (1972, 1982, 2002) and Optimal Foraging
Theory (OFT) (e.g., Burger et al. 2005; Pyke 1984; Smith 1983) to model my expectations
of Initial Period subsistence strategies at Gramalote. I will briefly review these here.
Moseley’s Maritime Foundations of Andean Civilization
Moseley’s MFAC hypothesis was developed specifically for the coast of Peru. It
argues that marine resources could potentially sustain large-scale sedentary human
populations and these groups could construct monumental architecture without relying on
an agricultural surplus. In his model, Moseley focuses explicitly on the productive
coastal fisheries, although he does consider the potential of other marine resources (e.g.,
marine mammals). Ecologically fish can be viewed as a sustainable and stable resource
in the sense that they reproduce rapidly and in large number. This long-term stability is
a basis for theories of the eventual development of proto-state and state level societies in
the region.
The distinct ecology of Peru plays a key role in this model of interaction between
humans, their environment, and their cultural trajectory. This distinct ecology includes
rich coastal fisheries, hyper-arid coasts, and the steep Andes terrain (Moseley 1982,
2002; Sandweiss 2008; Wilson 1999; Reitz et al. 2008). Anchovies and sardines are an
especially important resource base of coastal fisheries since they are small schooling fish
6
and occupy a lower trophic level. The use of boats and nets allowed prehistoric and
historic groups the ability to obtain large quantities in a short amount of time.
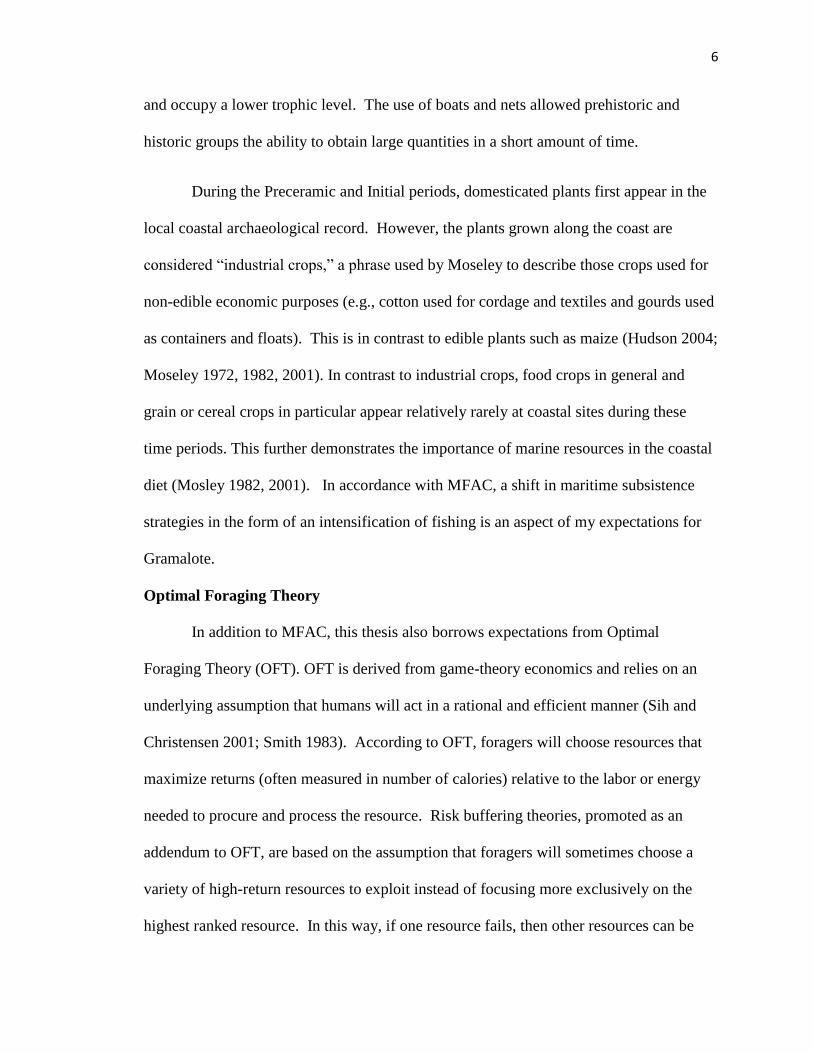
During the Preceramic and Initial periods, domesticated plants first appear in the
local coastal archaeological record. However, the plants grown along the coast are
considered “industrial crops,” a phrase used by Moseley to describe those crops used for
non-edible economic purposes (e.g., cotton used for cordage and textiles and gourds used
as containers and floats). This is in contrast to edible plants such as maize (Hudson 2004;
Moseley 1972, 1982, 2001). In contrast to industrial crops, food crops in general and
grain or cereal crops in particular appear relatively rarely at coastal sites during these
time periods. This further demonstrates the importance of marine resources in the coastal
diet (Mosley 1982, 2001). In accordance with MFAC, a shift in maritime subsistence
strategies in the form of an intensification of fishing is an aspect of my expectations for
Gramalote.
Optimal Foraging Theory
In addition to MFAC, this thesis also borrows expectations from Optimal
Foraging Theory (OFT). OFT is derived from game-theory economics and relies on an
underlying assumption that humans will act in a rational and efficient manner (Sih and
Christensen 2001; Smith 1983). According to OFT, foragers will choose resources that
maximize returns (often measured in number of calories) relative to the labor or energy
needed to procure and process the resource. Risk buffering theories, promoted as an
addendum to OFT, are based on the assumption that foragers will sometimes choose a
variety of high-return resources to exploit instead of focusing more exclusively on the
highest ranked resource. In this way, if one resource fails, then other resources can be
7
exploited more intensely to supplement the decreased caloric intake from the depleted
resource (Smith 1983:267).
Although OFT and dietary buffering models can be expanded to include
invertebrates and ethnobotanical specimens, this study focuses solely on vertebrate
taxonomic classes. I use it in this thesis because it provides an ecologically grounded
heuristic device against which to evaluate the data.
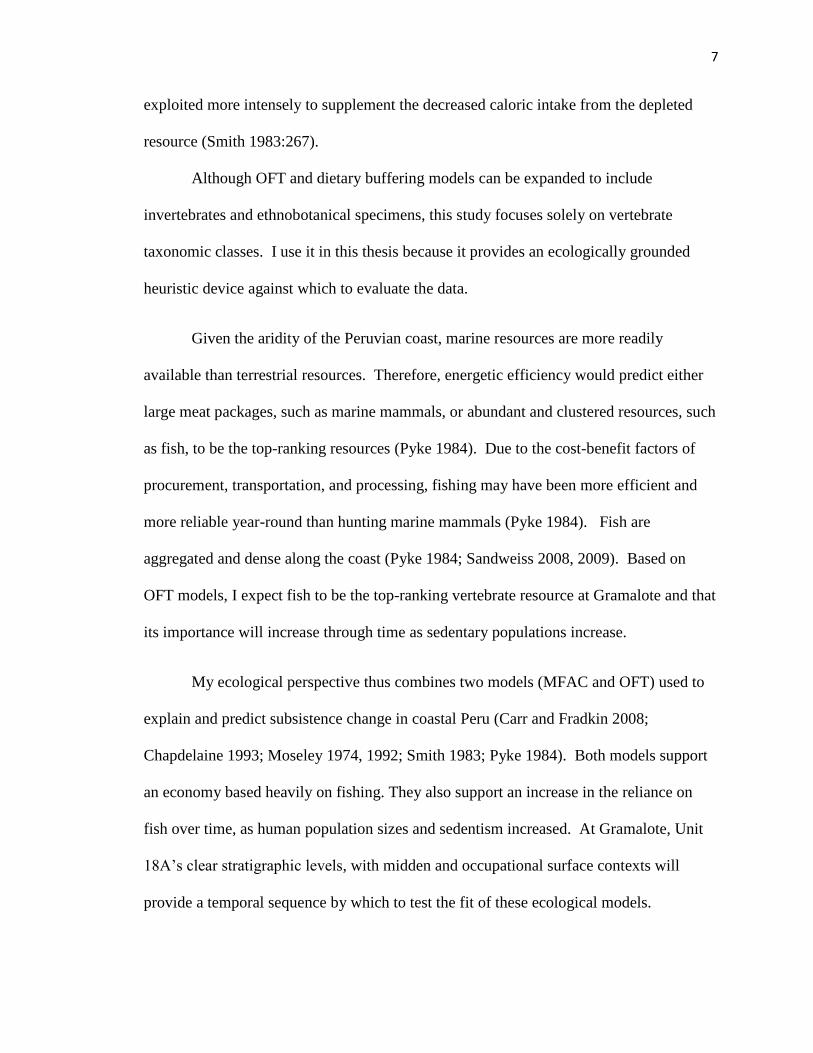
Given the aridity of the Peruvian coast, marine resources are more readily
available than terrestrial resources. Therefore, energetic efficiency would predict either
large meat packages, such as marine mammals, or abundant and clustered resources, such
as fish, to be the top-ranking resources (Pyke 1984). Due to the cost-benefit factors of
procurement, transportation, and processing, fishing may have been more efficient and
more reliable year-round than hunting marine mammals (Pyke 1984). Fish are
aggregated and dense along the coast (Pyke 1984; Sandweiss 2008, 2009). Based on
OFT models, I expect fish to be the top-ranking vertebrate resource at Gramalote and that
its importance will increase through time as sedentary populations increase.
My ecological perspective thus combines two models (MFAC and OFT) used to
explain and predict subsistence change in coastal Peru (Carr and Fradkin 2008;
Chapdelaine 1993; Moseley 1974, 1992; Smith 1983; Pyke 1984). Both models support
an economy based heavily on fishing. They also support an increase in the reliance on
fish over time, as human population sizes and sedentism increased. At Gramalote, Unit
18A’s clear stratigraphic levels, with midden and occupational surface contexts will
provide a temporal sequence by which to test the fit of these ecological models.
8
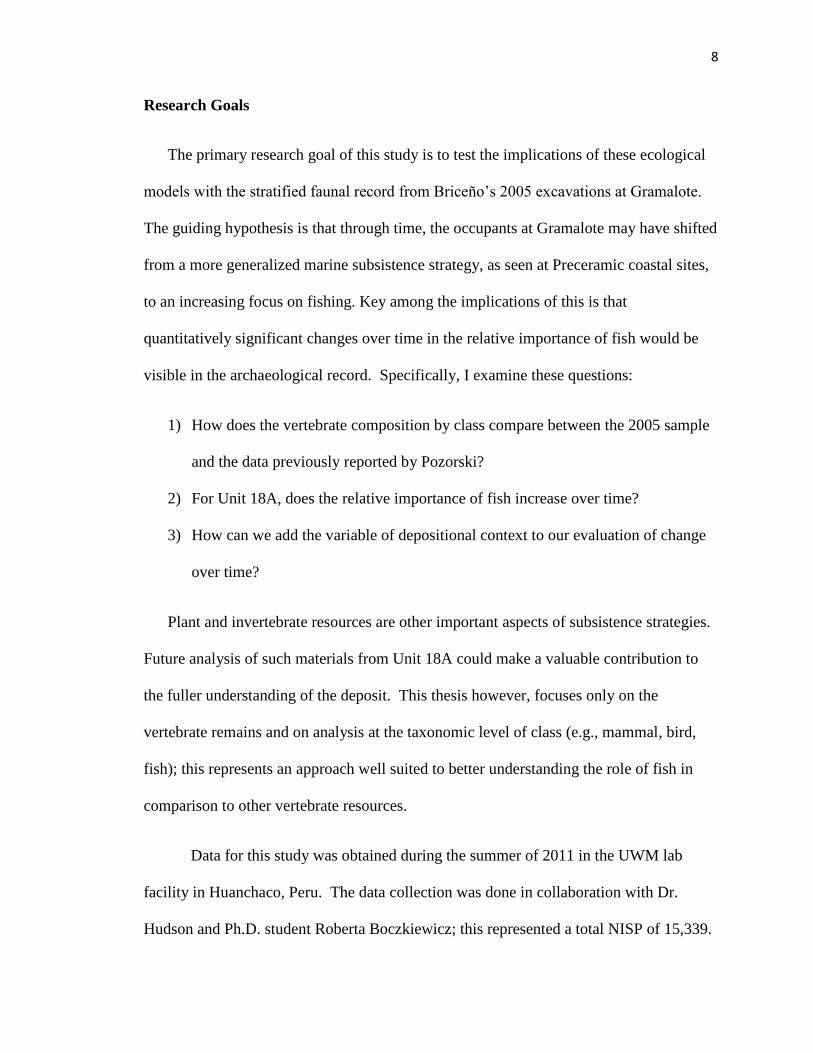
Research Goals
The primary research goal of this study is to test the implications of these ecological
models with the stratified faunal record from Briceño’s 2005 excavations at Gramalote.
The guiding hypothesis is that through time, the occupants at Gramalote may have shifted
from a more generalized marine subsistence strategy, as seen at Preceramic coastal sites,
to an increasing focus on fishing. Key among the implications of this is that
quantitatively significant changes over time in the relative importance of fish would be
visible in the archaeological record. Specifically, I examine these questions:
1) How does the vertebrate composition by class compare between the 2005 sample
and the data previously reported by Pozorski?
2) For Unit 18A, does the relative importance of fish increase over time?
3) How can we add the variable of depositional context to our evaluation of change
over time?
Plant and invertebrate resources are other important aspects of subsistence strategies.
Future analysis of such materials from Unit 18A could make a valuable contribution to
the fuller understanding of the deposit. This thesis however, focuses only on the
vertebrate remains and on analysis at the taxonomic level of class (e.g., mammal, bird,
fish); this represents an approach well suited to better understanding the role of fish in
comparison to other vertebrate resources.
Data for this study was obtained during the summer of 2011 in the UWM lab
facility in Huanchaco, Peru. The data collection was done in collaboration with Dr.
Hudson and Ph.D. student Roberta Boczkiewicz; this represented a total NISP of 15,339.
9
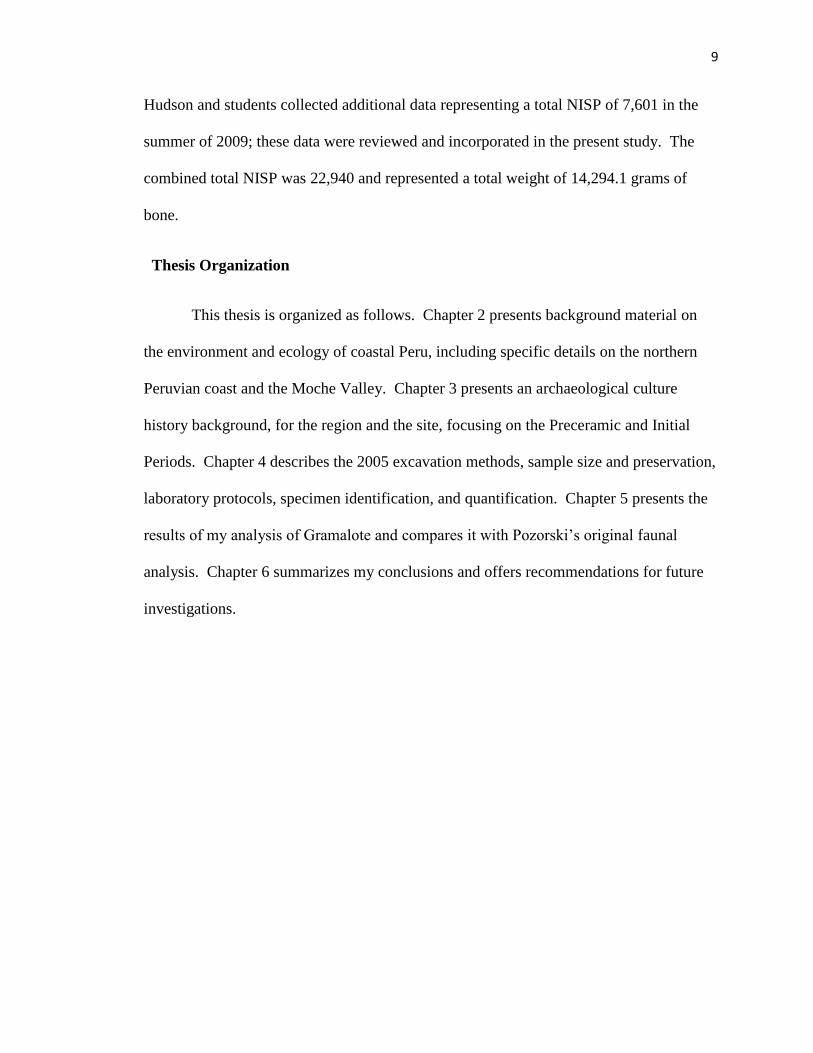
Hudson and students collected additional data representing a total NISP of 7,601 in the
summer of 2009; these data were reviewed and incorporated in the present study. The
combined total NISP was 22,940 and represented a total weight of 14,294.1 grams of
bone.
Thesis Organization
This thesis is organized as follows. Chapter 2 presents background material on
the environment and ecology of coastal Peru, including specific details on the northern
Peruvian coast and the Moche Valley. Chapter 3 presents an archaeological culture
history background, for the region and the site, focusing on the Preceramic and Initial
Periods. Chapter 4 describes the 2005 excavation methods, sample size and preservation,
laboratory protocols, specimen identification, and quantification. Chapter 5 presents the
results of my analysis of Gramalote and compares it with Pozorski’s original faunal
analysis. Chapter 6 summarizes my conclusions and offers recommendations for future
investigations.
10
CHAPTER 2: ENVIRONMENTAL BACKGROUND
The study area is situated in the north-central Andean region of Peru. This broad
region contains deserts, mountains, and a cold-current upwelling along the coast. The
current provides one of the richest fisheries in the world (Sandweiss 2008, 2009). While
this area is productive, the environmental extremes can also put constraints on inhabitants
and require local adaptations. Such environmental adaptations have been the focus of
archaeological research (e.g., Moseley 1974, 2002; S. Pozorski 1976; Pozorski and
Pozorski 1979; Rietz 1988; Wing 1984). This chapter describes the juxtaposition of the
highlands and the coast, the role of El Niño, and then focuses on the environmental
diversity of the Moche Valley.
Highlands
The Andean highlands run through Peru from north to south. They contribute to
environmental effects felt along the coast. The overall temperature and rainfall is more
consistent in the highlands than in lowland and coastal regions (Burger 1982, 1989).
There is heavy rainfall on the eastern slopes since moist air moves west across the
Amazon from the Atlantic Ocean. Elevation differences also play an important role in
temperatures, local flora and fauna, and agricultural potential.
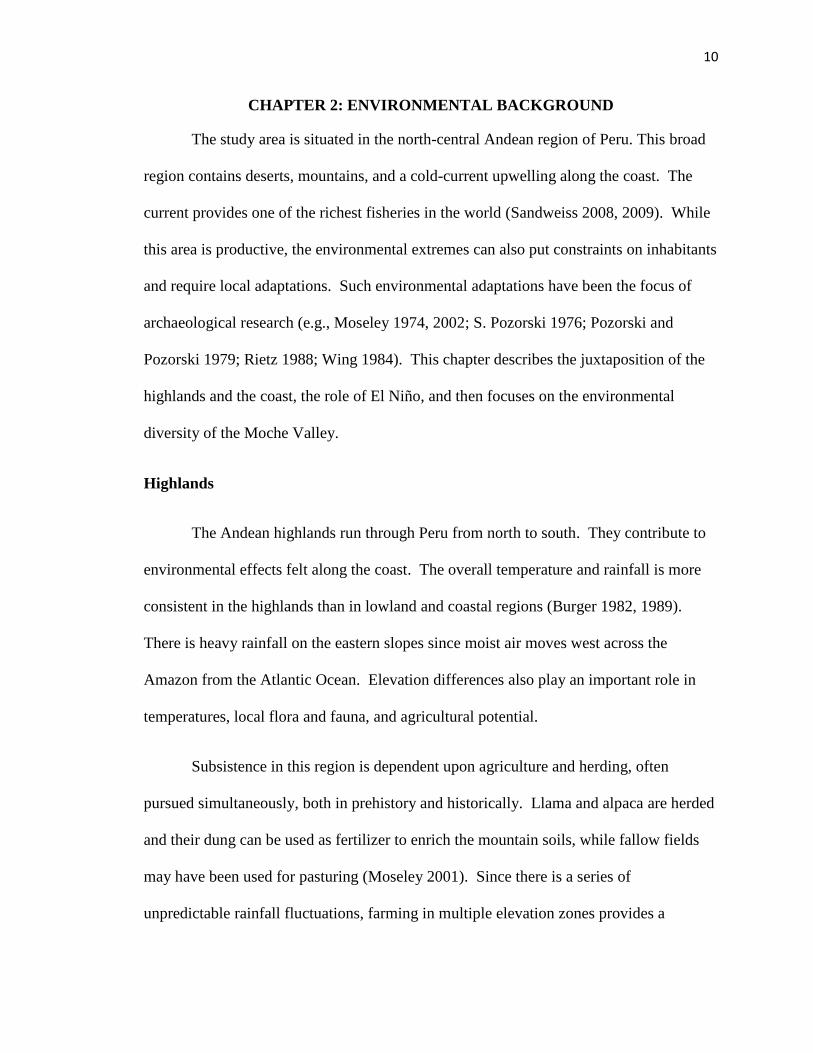
Subsistence in this region is dependent upon agriculture and herding, often
pursued simultaneously, both in prehistory and historically. Llama and alpaca are herded
and their dung can be used as fertilizer to enrich the mountain soils, while fallow fields
may have been used for pasturing (Moseley 2001). Since there is a series of
unpredictable rainfall fluctuations, farming in multiple elevation zones provides a
11
buffering strategy referred to as vertical agriculture. This “verticality” allows for
diversity in diet (Moseley 2001:45).
The highlands are often divided into three elevation zones based on the types of
agricultural plants that grow most efficiently. The higher suni zone (located at 3200-
4000masl elevation) consists of a series of ridged cliffs with land productive for
domesticates adapted to high altitude farming (e.g., tubers, chenopodium). The quechua
zone is at the foot of the mountains and mountain valleys (2500-3200masl elevation),
where crops such as maize, squash, and various vegetables thrive (Burger 1989). The
lower chaupiyunga zone, located on the west side of mountains (1000-2500masl) is
warmer than the upper highland zones, and therefore is more productive for agriculture
for crops such as, chili, avocado, and fruit trees (Billman 1996; Burger 1989). For a
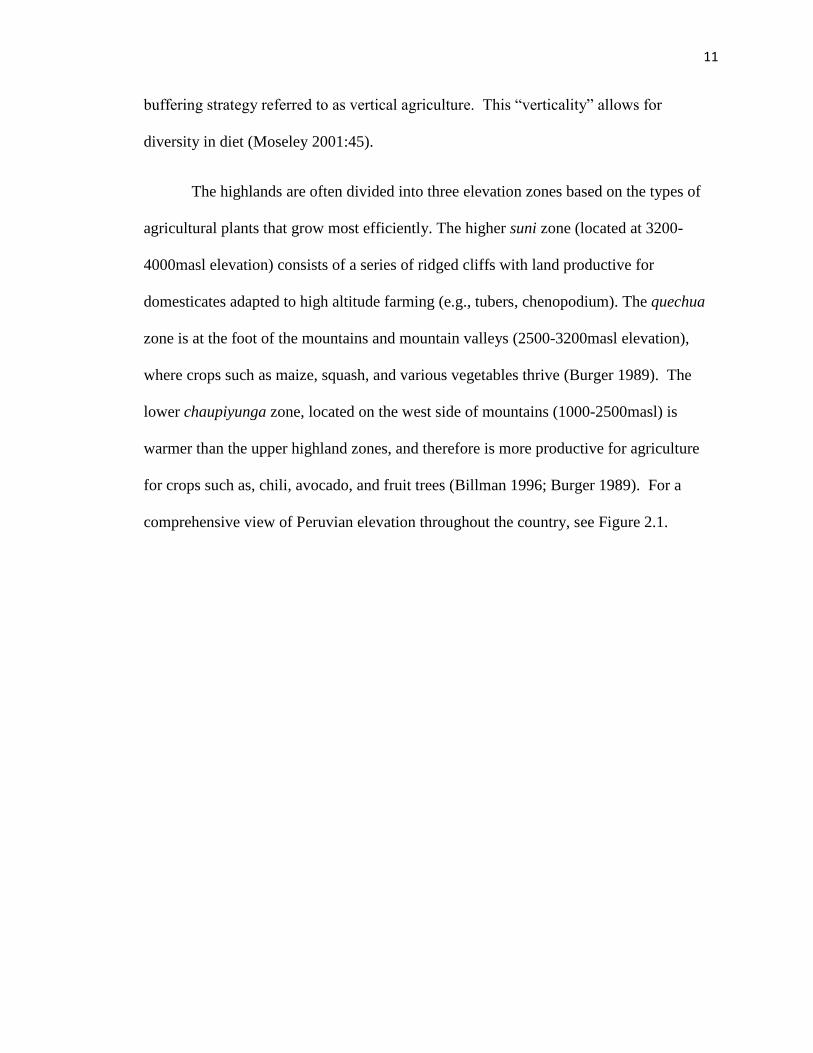
comprehensive view of Peruvian elevation throughout the country, see Figure 2.1.
12
Figure 2.1 Major Coastal Rivers of Peru
13
Coast
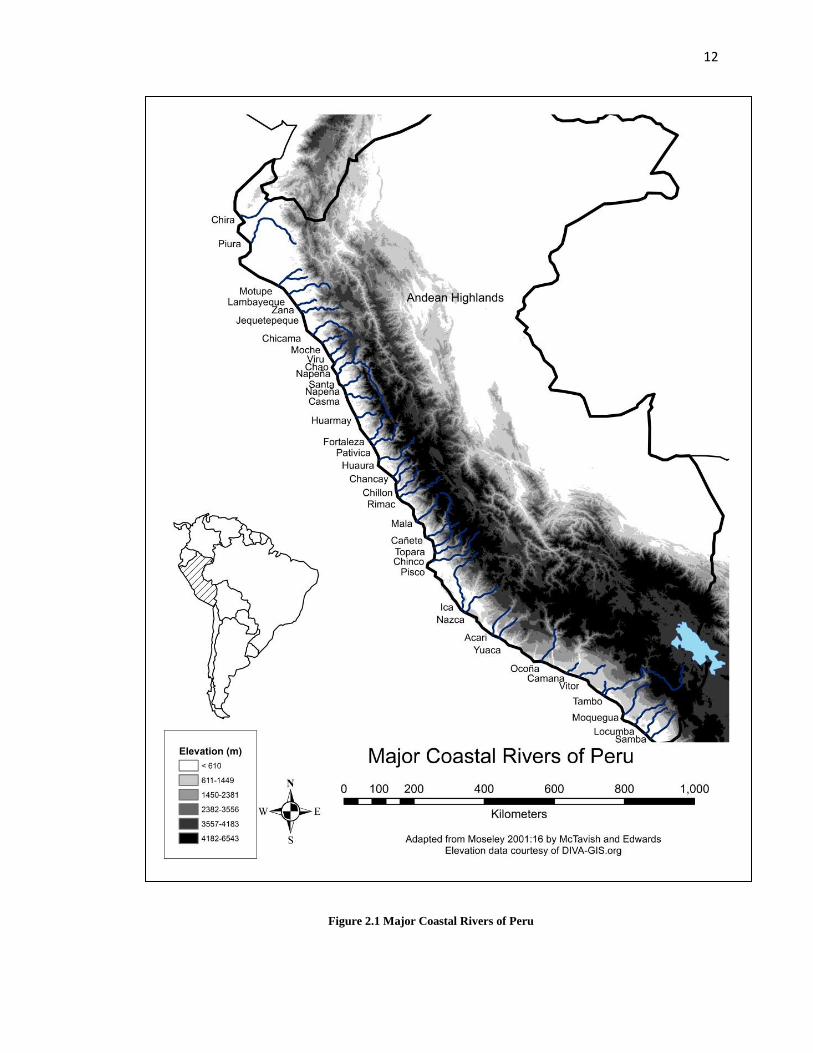
The coast of Peru is often divided into three broad coastal regions of Peru, north,
central, and south. The trajectory of the Humboldt Current and the El Nino counter
current play a role in the ecological variations represented by this division. The
environments vary due in part to ocean temperatures at the varying latitudes, which has
impacts on the associated fisheries, and in part to river flow from the Andes (Alheit and
Niquen 2004; Billman and Huckleberry 2008; Maliuf and Reyes 1989). Vegetation
patterns vary as does agricultural potential (Billman 2002).
Figure 2.2 Peruvian Coastal Zones and Ocean Currents. Adapted from Parsons (1970:293) and
Fagan (1999:291). Approximate location of Gramalote indicated
Gramalote
14
In general, the coast of Peru is characterized by hyper-aridity. River valleys,
which provide a semi-reliable fresh water resource, are described by Moseley as oases in
the sense that they are separated from each other by long distances of arid semi-desert
(Moseley 2001). These valley “oases” supported both the pre-agricultural hunter-
gatherer populations and the subsequent agricultural populations. These river valleys
also serve as a reference when discussing different archaeological sites. Given the desert-
and-oasis nature of the Peruvian coast, the location of a site in terms of proximity to the
desert coastline and regions of inland fog-fed vegetation (lomas) is significant, as is its
location relative to neighboring sites within the same valley. Archaeological evidence
indicates that in the North and Central coasts regional groups utilized irrigation canals
and inland sites to exploit agricultural resources (Billman 2002; Haas 1985; Moseley
2001).
The Peruvian coastal current also known as the Humboldt Current, plays a critical
role in coastal ecology. It flows counter-clockwise to collide with the western coast of
South America at approximately 38º South latitude. Where the current hits the northwest
coast of Peru, a bordering marine shelf protrudes and brings displaced water to the ocean
surface, causing an upwelling of colder water to replace the surface water. This creates
surface water of approximately 20° Celsius. When air masses from the southwest hit the
cold waters, they trap cold air below a warm air layer. As a result, from May to October
a thick cloud of fog moves along the coastal shore (about 500 km) but never condenses to
produce any significant amount of precipitation (Bohle-Carbonell 1989; Cavez et al.
1989; Marzloff et al. 2009).
15
El Niño
El Niño is a cyclical climatic shift, which has unpredictable timing and varying
degrees of ecological impact. The El Niño counter-current hits the northern Peruvian
coast as western winds bring warmer water from the West Pacific, causing a disruption in
fish patterns. During El Niño episodes, the fauna most affected in the Peruvian coastal
ecosystem are the marine mammals and sea birds that depend primarily on particular
species of fish or shellfish that are temporarily decimated because of significant shifts in
ocean temperatures (Rogers et al. 2004; Placzek et al. 2009; Zavalaga et al. 2002).
Ecologists Andrew Bakun and Kenneth Broad posit that El Niño may be partially
responsible for the lucrative fishing economies of coastal Peru (Bakun and Broad 2003:
460). El Niño events significantly affect anchovies and sardines. Anchovy populations
in particular become drastically reduced while sardine populations intensify. Sardines are
evolutionarily adapted to oceanic shifts and thrive when El Ninos create a decline of
predatory and competitive species (Bakun and Broad 2003; Alheit and Niquen 2004).
Therefore, even during El Niño events, Peruvian fisheries are able to sustain their
economic output by shifting from one species of fish to another. During prehistory this
could have been fundamental for human population stability once nets and boats made
the capture of small schooling fish efficient. Archaeological evidence makes it clear that
these technologies were in place by the Late Preceramic if not before.
Moche Valley
Gramalote is located in the Moche Valley. The Moche River runs from the Andes
to the Pacific and is approximately 102 km long, with only six tributaries (Billman 1996).
16
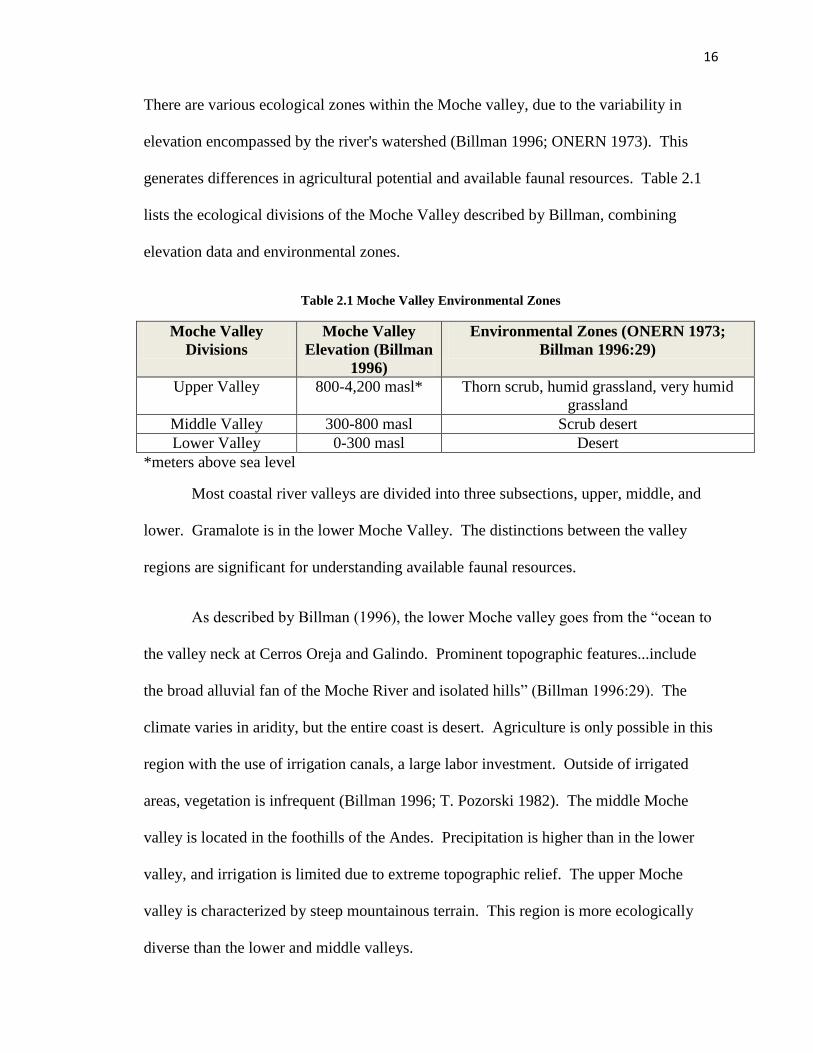
There are various ecological zones within the Moche valley, due to the variability in
elevation encompassed by the river's watershed (Billman 1996; ONERN 1973). This
generates differences in agricultural potential and available faunal resources. Table 2.1
lists the ecological divisions of the Moche Valley described by Billman, combining
elevation data and environmental zones.
Table 2.1 Moche Valley Environmental Zones
Moche Valley
Divisions
Moche Valley
Elevation (Billman
1996)
Environmental Zones (ONERN 1973;
Billman 1996:29)
Upper Valley 800-4,200 masl* Thorn scrub, humid grassland, very humid
grassland
Middle Valley 300-800 masl Scrub desert
Lower Valley 0-300 masl Desert
*meters above sea level
Most coastal river valleys are divided into three subsections, upper, middle, and
lower. Gramalote is in the lower Moche Valley. The distinctions between the valley
regions are significant for understanding available faunal resources.
As described by Billman (1996), the lower Moche valley goes from the “ocean to
the valley neck at Cerros Oreja and Galindo. Prominent topographic features...include
the broad alluvial fan of the Moche River and isolated hills” (Billman 1996:29). The
climate varies in aridity, but the entire coast is desert. Agriculture is only possible in this
region with the use of irrigation canals, a large labor investment. Outside of irrigated
areas, vegetation is infrequent (Billman 1996; T. Pozorski 1982). The middle Moche
valley is located in the foothills of the Andes. Precipitation is higher than in the lower
valley, and irrigation is limited due to extreme topographic relief. The upper Moche
valley is characterized by steep mountainous terrain. This region is more ecologically
diverse than the lower and middle valleys.
17
“Below 1,600 m elevation, agriculture is only possible with water control
techniques because of arid and semi-arid conditions, however year-round warm weather
allows the cultivation of two crops and a wide variety of cultigens. Above 1,600 m
elevation rainfall agriculture is possible, but the extent of cultivation and the types of
crops that can be grown are limited by severe topography and cold temperatures.
(Billman 1996:27)”
The geomorphology of the coastline is variable producing different habitats for
marine resources: rocky, sandy, mixed rocky, and sandy littoral habitats (Billman 1996:
35; T. Pozorski 1982; Pozorski and Pozorski 1979). Different fishing technologies are
used to obtain resources in each type of habitat, such as haul nets, gill nets, and line
fishing (S. Pozorski 1982; Billman 1996). Fishermen in the Moche Valley in the bay of
Huanchaco can still be seen using gill nets while in caballitos de torora, small one-man
reed boats (Hudson 2009; Billman 1996). The continental shelf and Humboldt Current
allow for conditions favorable to high densities of phytoplankton. This supports the large
schooling fish, which in turn are the primary food sources for larger marine resources
(e.g., sea lions and sea birds) that are harvested by human populations on the Moche
Valley coast.
Summary
The study area is bounded by the Andes Mountains to the east, and the Pacific
Ocean to the west. While agricultural potential along the coast is limited because it is
dominated by desert, the ocean provides an abundance of marine resources that permitted
relatively large, stable populations of prehistoric foragers to survive. El Niño events
influence the composition of marine resources, but do not appear to affect significantly
the productivity of the fisheries (Reitz et al. 1988; Sandweiss 2009). Inland precipitation
and temperature fluctuates based on elevation. Rivers, which run from the mountains to
18
the coast, are an important source of fresh water. When land was irrigated via river water,
prehistoric groups were able to practice agriculture; however, it is important to note that
different domesticates were cultivated at varying elevations within the river valleys. The
Moche River is one such valley in northern Peru. Irrigation is possible inland, though
elevation, temperature, and levels of precipitation affect agricultural productivity. The
coastal portion of the Moche Valley is desert, in prehistory the inhabitants of this region
relied primarily on marine resources. To this day, some traditional fishing technologies
are still employed by fishermen of this region.
19
CHAPTER 3: CULTURE HISTORY AND SITE BACKGROUND
The Peruvian coast has a long history of prehistoric occupation, the Paijan hunter-
gatherer-fishing groups (10,000-3000 B.C.) through the Late Horizon and the Incan
empire (A.D.1450-1550) (see Figure 1.2). This chapter focuses on the time around the
occupation of Gramalote, including the Late Preceramic Period (3050-1800 B.C.) which
immediately precedes the main occupation at Gramalote during the Initial Period (1800-
900 B.C.). This chapter concludes with a discussion of the site background of Gramalote,
focusing on Pozorski’s 1976 and the 2005 salvage excavations. The approximate
locations of sites mentioned in the text are indicated on Figure 3.1.
Late Preceramic Period
The Late Preceramic Period (3050-1800B.C.) is also known as the Cotton
Preceramic Period. It is defined by an increase in site settlement planning, the
continuation of plant cultivation, and a continued reliance on marine resources along the
coast (Burger 1989; Keatinge 1988; Pozorski and Pozorski 1990; Moseley 2001; Quilter
1991; Wilson 1999). During this period, sites with U-shaped architectural complexes
emerged along the coast and continued into the Initial Period as larger ceremonial centers
continued to be constructed (Burger 1989; Moseley 2001; Keatinge 1988). There is some
debate as to the temporal parameters of the Preceramic (see Quilter 1991 and Burger
1989), and to the timing of coastal and inland monument building (Haas and Creamer
2006; Pozorski and Pozorski 2005). Thus, the Late Preceramic is significant to
understanding developments on the north coast prior to the occupation of Gramalote.
While plant domestication and agriculture developed earlier in the highlands than
along the coast, during the Late Preceramic Period (3050-1800 B.C.), coastal groups were
20
farming cotton (Moseley 2001:99). This industrial crop was used for textile manufacture
as well as for manufacturing fishing nets (Hudson 2009; Keatinge 1988; Moseley 2001).
Evidence of cotton in the form of net fragments as well as remains of food plant cultigens
such as chilies and avocado have been recovered at coastal Preceramic sites such as
Paloma and Huaca Prieta.
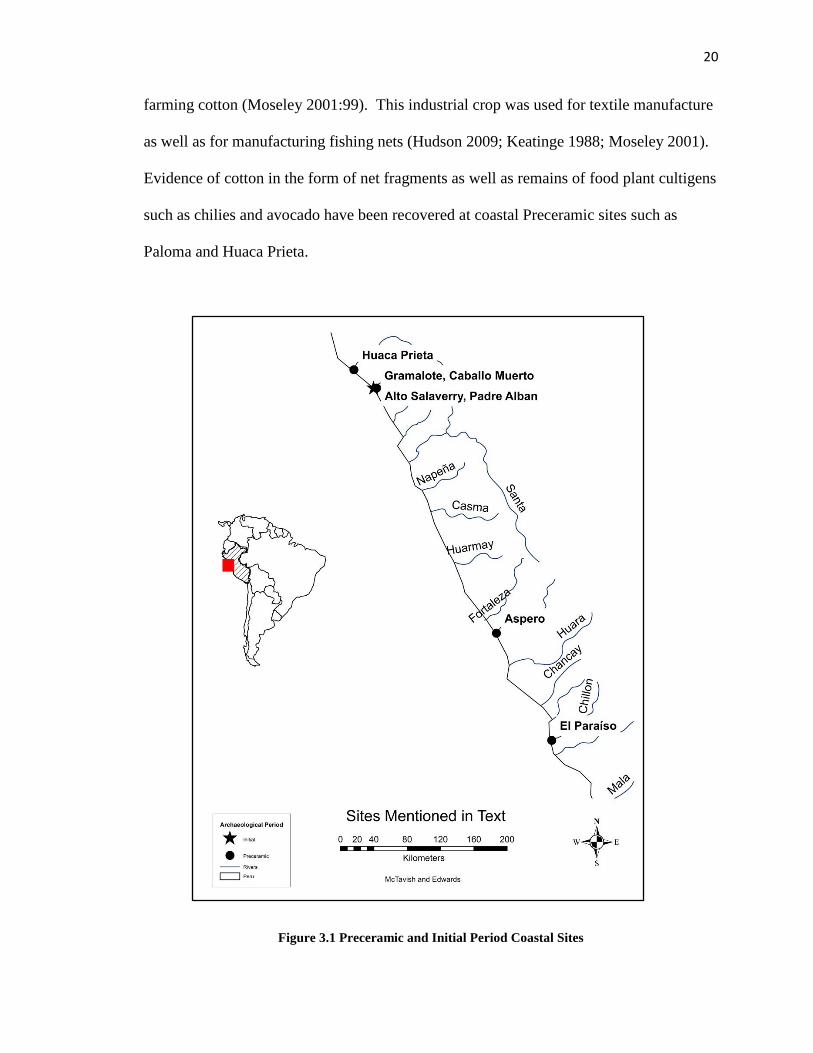
Figure 3.1 Preceramic and Initial Period Coastal Sites
21
Key Preceramic Sites
El Paraíso is a significant Preceramic site and was used to connect coastal fishing
sites to monumental architecture in support of MFAC. The site (2000 to 1400 B.C.) is
located near the mouth of the Chillón River. It is a mound complex encompassing
approximately 60 hectares and is an early example of monumental stone architecture El
Paraíso was excavated by the Proyecto Bajo Valle del Chillón in the early 1980s (Quilter
1985:279). This site is a possible example of early U-shaped architectural designs. El
Paraíso shows evidence of a sedentary fishing community with a mixed reliance on
cultigens, such as squash, beans, peppers, guava, and lucuma (Quilter et al. 1991).
Cotton has been recovered in the form of fishing net fragments and textiles.
Áspero is a site located at the mouth of the Supe Valley where early monumental
construction coinciding with site habitation during the Preceramic has been recovered.
An early reexamination of the site by Moseley and Willey describes the site (Moseley
and Willey 1973:458); Feldman (1980) later excavated the site. There are multiple types
of architecture present, including sunken architecture, sunken plazas, mounds, and small
habitation dwellings (Feldman 1980, 1985). There were also 17 elevated structures found
at Áspero, six of which were classified as “corporate labor platforms” or “corporate labor
constructions in the form of artificial platform mounds” (Moseley and Willey 1973:459).
Two of the oldest and largest pyramidal mounds at the site are Huaca de los Sacrificos
(4260±150 to 3950±150 B. P.) and Huaca de los Idolos (4900±160 to 1970 ±145 B. P.),
dating their construction as early in the site development (Feldman 1985:71). The basic
subsistence strategy of the site inhabitants at Aspero consisted of fishing and hunting
marine mammals, as attested by faunal remains recovered at the site in addition to the
22
recovery of fishhooks and cotton net fragments. There is evidence of plant cultigens such
as achira, beans, squash, avocado, and peanuts (Moseley and Wiley 1973:457-458).
Áspero, as an early site with monumental architecture and evidence of habitation around
these structures, has been used in debates regarding the nature of socio-political
complexity for the development of the larger Andean region (e.g., Haas and Creamer
2006; Feldman 1980, 1985; Fung 1988; Moseley 2001; Pozorski and Pozorski 2005;
Quilter 1991
Huaca Prieta is an important Preceramic site in the Chicama Valley. First
excavated by Junius Bird in 1946, it has been dated to approximately 2500 B.C. (Bird
1985). Excavations have continued under the supervision of Thomas Dillehay from
2006-2011 (Dillehay et al. 2012). A stone and earth platform mound was present and
measures approximately 138m x 62m and about 32m high. Sedentary group occupations
have been recovered near the mound engaging in largely maritime subsistence strategies.
Industrial crops such as gourds and cotton were used for textiles, fishing nets, bowls,
storage jars, and net floats. Cotton textiles show marine iconography, such as fish and
shellfish designs, which has been interpreted as a reflection of the significance of marine
resources (Bird and Hyslop 1985, Whitaker and Bird 1949). While evidence of food
cultigens such as squash, avocado, and chilies, have been recovered at the site there
remained a strong marine emphasis (e.g. shellfish, fish, sea mammals, guano birds).
In the Moche Valley, Padre Alban and Alto Salaverry are coastal Preceramic
sites near Gramalote. Shelia Pozorski test excavated and analyzed these sites and
explored the idea of transitions between Preceramic and Initial Period subsistence
strategies (Pozorski 1976). She developed these issues further in subsequent publications
23
(Pozorski 1982; Pozorski and Pozorski 1979, 2005, 2006). Padre Alban is a site located
near the Huanchaco Bay along the Pacific coast (Pozorski 1979: 173). It is a small area,
which Pozorski interprets as a seasonal or temporary occupation after excavations
uncovered cotton cords and nets but no textiles or permanent architecture (Pozorski
1979). Alto Salaverry (1480±110 B.C.) located along the south of the Moche River
mouth covers approximately 1.8 hectares (Pozorski and Pozorski 1990:483-484). It is
considered a permanent settlement as evidenced by domestic structures, dense refuse
middens and public or ceremonial architecture (S. Pozorski 1976). There is also evidence
of a strong reliance on marine resources, such as shellfish, fish, and marine mammals.
However, gourd, cotton and squash are present, along with pepper, beans, lucuma,
avocado, guaynabo (Pozorski 1976).
In sum, the Late Preceramic Period along the north coast is a time of increasing
sedentism and the beginnings of public architecture. A variety of plant domesticates are
increasingly used, although there is no evidence of reliance on maize in particular or
plant domesticates in general. Marine resources remain a consistently important food
source.
Initial Period
The Initial Period (1800-900 B.C.) marks the introduction of ceramics along the
Peruvian coast, an increase in socio-political complexity, and increasing use of irrigation
in floodplain agriculture (Billman 1996, 2002; Stanish 2001; Moseley 2001). There is
considerable debate about socio-politics in the Initial Period. In his review of emerging
Andean states, Stanish highlights several of these debates (Stanish 2001:50-51). He
reviews Pozorski and Pozorski's work at Pampa de las Llamas-Moxeke, and their
24
arguments for the use of elite objects in relation to emerging polities. They suggest the
development of “a number of polities in the Moche, Casma, Supe, and Chillon valleys in
the north and central Peruvian coast” (Stanish 2001:50; Pozorski and Pozorski 1987:45).
On the other hand, Burger (1989) and Schreiber (2001) focusing on the broader Andean
world, argue that the Initial Period is, “a time of simple chiefdom development” (Stanish
2001:51). Overall, the degree to which socio-political complexity manifested along the
coast is under debate, further highlighting the significance of investigating of Initial
Period sites from multiple localities.
Within this debate about socio-political complexity, the role of landscape
modification is critical. In addition to monumental architecture, site inhabitants
manipulated the landscape to irrigate agricultural fields. Prior to canal irrigation, the
coastal practice is argued to have involved less labor-intensive methods of taping into the
water table where it was close to the surface. While this was not practiced at sites
directly adjacent to the coast, inland sites within 20 km of coastal sites appear to have
engaged in this form of agricultural intensification (Billman 2002).
An example of agricultural intensification during the Initial Period in the Moche
Valley is the Caballo Muerto site complex (Pozorski and Pozorski 1979, 2005). It is a
late Initial Period mound complex with various domestic structures excavated within and
adjacent to mounds. Caballo Muerto is located in the Rio Seco gorge, approximately 17
km from the Pacific coast. This site complex has a U-shaped architectural layout with the
positioning of ceremonial mounds. Huaca de Los Reyes (1300-1100 B.C.) is a mound
within Group II which contains ceremonial architecture (Keatinge 1988:90). This
pyramid contains structures with red, yellow, and white painted relief friezes.
25
Excavations of the mounds revealed evidence for “differences in layout, ceramics, and
radiocarbon dates from the Initial Period into the Early Horizon” (Pozorski and Pozorski
2008:616). This site illustrates the elaboration of architectural designs and the increase in
agricultural intensification that was occurring during the span of the time represented by
the Late Preceramic through the Early Horizon. Shelia Pozorski’s dissertation work
(1976) suggests a possible connection of this inland site with coastal sites since the faunal
materials recovered at Caballo Muerto include fish and shellfish.
Agricultural developments during this period have been of particular interest to
archaeologists and investigated in several valleys along the north coast of Peru. Pozorski
has indicated that in the north coast, there was a shift from water table farming to
irrigation agriculture after about 900 B.C. (Pozorski 1979). Park (1983) and Billman
(1996, 2002) have traced the development of irrigation and agriculture potential for the
north coast of Peru, specifically focusing on the Moche Valley (Table 3.1). According to
Billman, one difficulty with this research is a lack of radiocarbon dates from a variety of
sites. However, his work has indicated that the easiest part of the Moche Valley to
irrigate would have been the Middle Valley (Figure 3.1), shown by a “dramatic shift in
population” from this section of the valley to the coast (Billman 2002:379). During the
Preceramic Period, plant cultivation was limited to the easily irrigable regions of the
Middle and Lower Moche Valley (Billman 2002:379).
26
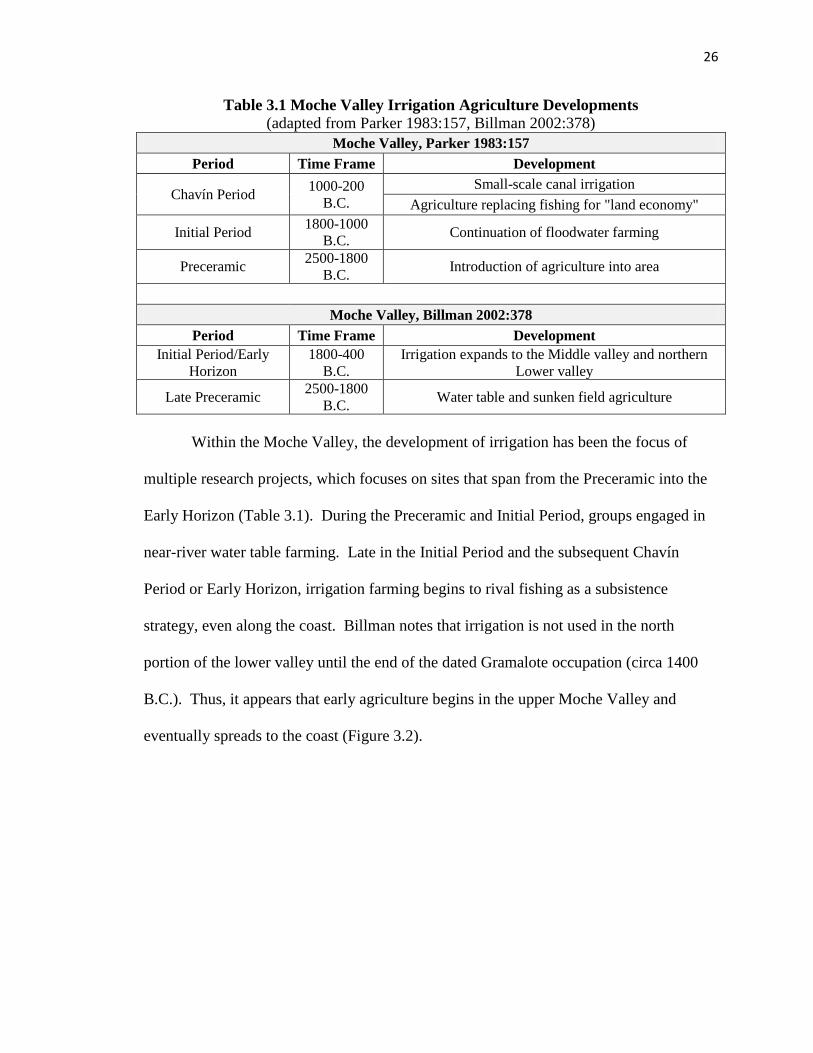
Table 3.1 Moche Valley Irrigation Agriculture Developments
(adapted from Parker 1983:157, Billman 2002:378)
Moche Valley, Parker 1983:157
Period Time Frame Development
Chavín Period 1000-200
B.C.
Small-scale canal irrigation
Agriculture replacing fishing for "land economy"
Initial Period 1800-1000
B.C. Continuation of floodwater farming
Preceramic 2500-1800
B.C. Introduction of agriculture into area
Moche Valley, Billman 2002:378
Period Time Frame Development
Initial Period/Early
Horizon
1800-400
B.C.
Irrigation expands to the Middle valley and northern
Lower valley
Late Preceramic 2500-1800
B.C. Water table and sunken field agriculture
Within the Moche Valley, the development of irrigation has been the focus of
multiple research projects, which focuses on sites that span from the Preceramic into the
Early Horizon (Table 3.1). During the Preceramic and Initial Period, groups engaged in
near-river water table farming. Late in the Initial Period and the subsequent Chavín
Period or Early Horizon, irrigation farming begins to rival fishing as a subsistence
strategy, even along the coast. Billman notes that irrigation is not used in the north
portion of the lower valley until the end of the dated Gramalote occupation (circa 1400
B.C.). Thus, it appears that early agriculture begins in the upper Moche Valley and
eventually spreads to the coast (Figure 3.2).
27
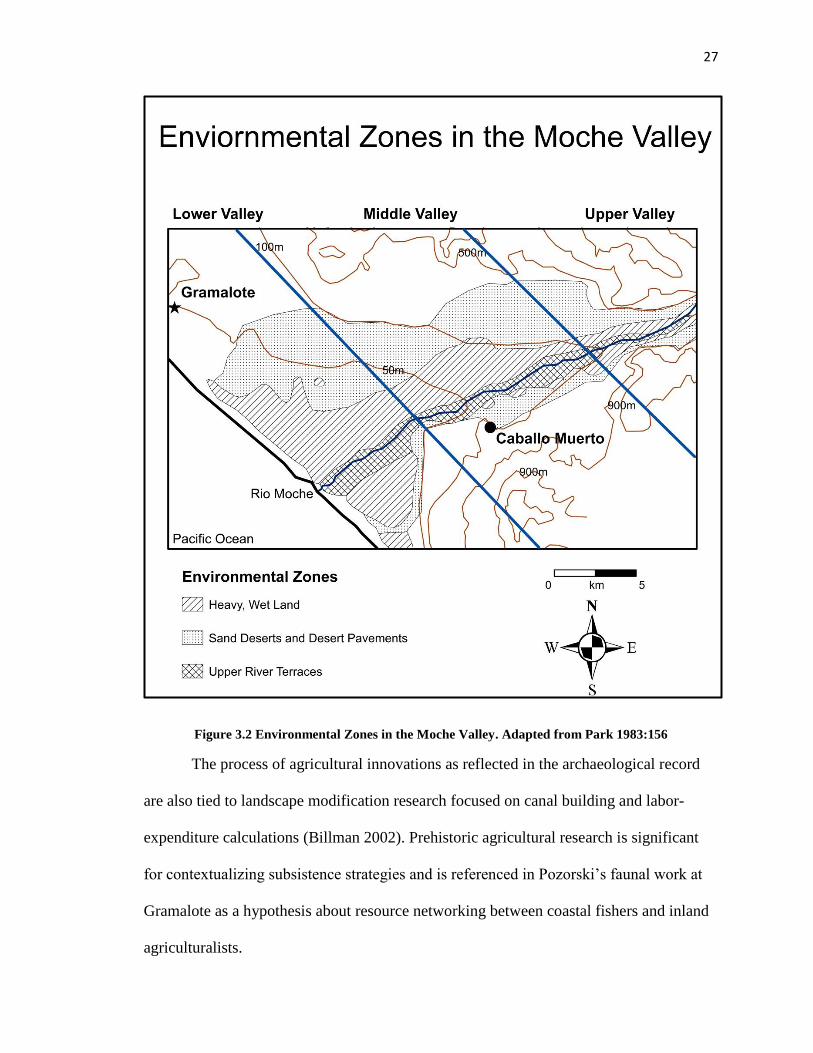
Figure 3.2 Environmental Zones in the Moche Valley. Adapted from Park 1983:156
The process of agricultural innovations as reflected in the archaeological record
are also tied to landscape modification research focused on canal building and labor-
expenditure calculations (Billman 2002). Prehistoric agricultural research is significant
for contextualizing subsistence strategies and is referenced in Pozorski’s faunal work at
Gramalote as a hypothesis about resource networking between coastal fishers and inland
agriculturalists.
28
Gramalote, being in the arid coastal region, was not in a location conducive for
non-irrigation agriculture, as opposed to the site of Caballo Muerto (Figure 3.2). While
excavations at Gramalote have recovered plant cultigens, the majority of the daily
subsistence appears to be marine-focused. This supports the ecological prediction
(MFAC and OFT) of a maritime subsistence. The subsequent analysis of the Unit 18A
sample examines if this reliance increases through time, specifically fish.
Site Background
Gramalote was first surveyed by C.M. Hastings in 1973 and then excavated by
Shelia Pozorski (1976) as a part of the larger Harvard Chan Chan-Moche Valley Project.
Pozorski excavated 2 controlled cuts and approximately 20 test pits, across the 16,500 m
area of the site; she identified the presence of ceramics, and dated the site to the Initial
Period. In 2005, three additional units were excavated in conjunction with salvage efforts
along the eroding southwestern margin of the site (Briceño et al. 2006; Briceño and
Billman 2008). Continued excavations (2010) led by Yale PhD candidate Gabriel Prieto
have focused on the western site profile. Details of Pozorski, Briceño, and Prieto’s works
are reviewed below.
Gramalote is situated on a low plateau adjacent to a dried creek bed
approximately 600m from the ocean (Pozorski 1976). On the surface, the Gramalote site
consists of multiple artifact scatters, with dense artifact deposits, stratified middens, and
buried architecture below the surface. The site is located approximately 250 meters from
the coast (Briceño and Billman 2008; Pozorski 1976; Pozorski and Pozorski 1979).
29
Shelia Pozorski’s 1976 Excavations
Pozorski’s faunal work at Gramalote was one component of her larger dissertation
goal, to evaluate, “subsistence components of ten prehistoric sites in the Moche Valley”
(Pozorski 1976:1). She was specifically looking at procurement strategies and processing
techniques for vertebrate and invertebrates to elucidate temporal shifts, and whenever
possible, spatial ones. All ten sites were located within 20 km of the coast.
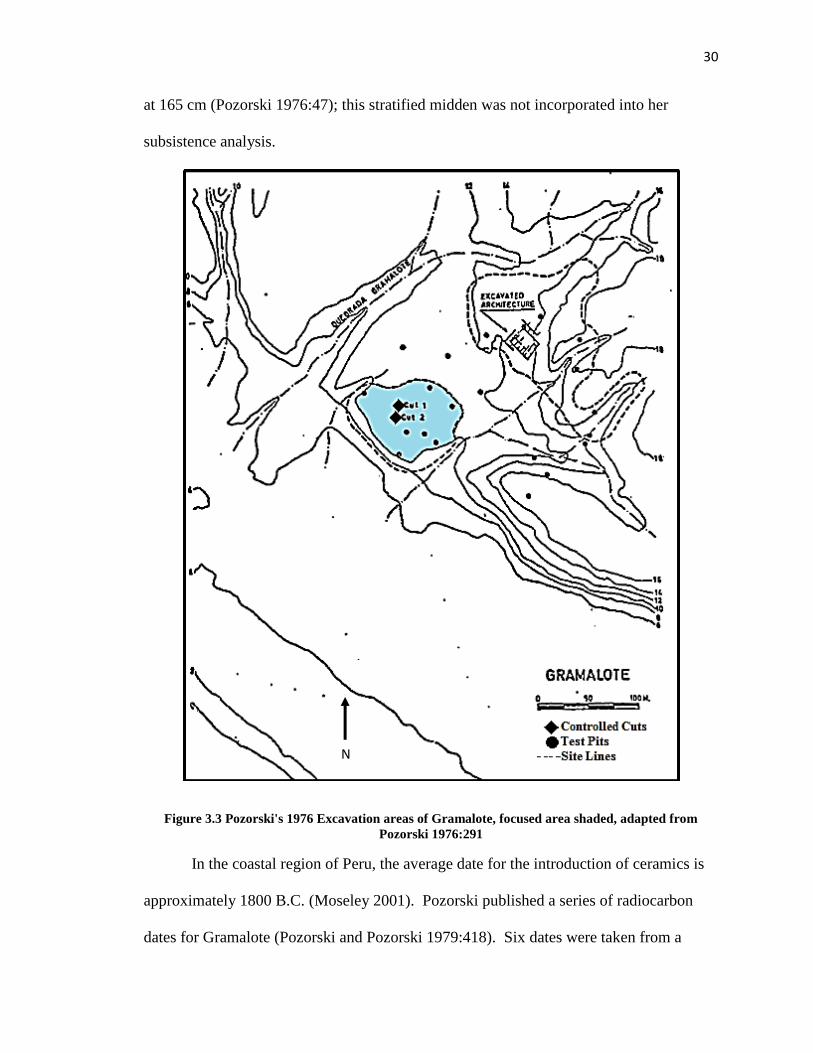
Pozorski’s excavations at Gramalote consisted of test pits and targeted two types
of refuse areas within these sites: “relatively deep deposits with evident natural
stratification” and “shallow deposits consisting of a single homogenous refuse-bearing
layer” (Pozorski 1976:38). In total, approximately 16,500 m2 were mapped with refuse
and scattered architecture were mapped (Pozorski 1976:22-22). She notes how the
architecture was covered with refuse and then studied by Donald Weaver (no published
report available). While she does not include specific numbers of test pits, 20 are
indicated on her site map (1976:291), as adapted (Figure 3.2).
Gramalote contained a stratified deposit (Cut 1) approximately 100 cm x 50 cm,
and 195 cm in depth (Pozorski 1976:39). There were three natural levels in this midden,
and due to the large natural stratigraphy levels, Pozorski separated arbitrary 10cm levels
to assess subtle shifts in subsistence and increase subsistence artifact recovery (Pozorski
1976:47). Half-inch mesh was used to screen the northern unit, while quarter-inch mesh
was used for the other excavations at Gramalote for better subsistence data recovery.
Pozorski's subsistence analysis included only the 1/4 inch samples (Pozorski 1976:46-
47). Cut 1 was the focus of her analysis of Gramalote subsistence (Figure 3.3). Cut 2
contained a buried stone wall at approximately 65 to 95 cm, and a flexed burial recovered
30
at 165 cm (Pozorski 1976:47); this stratified midden was not incorporated into her
subsistence analysis.
Figure 3.3 Pozorski's 1976 Excavation areas of Gramalote, focused area shaded, adapted from
Pozorski 1976:291
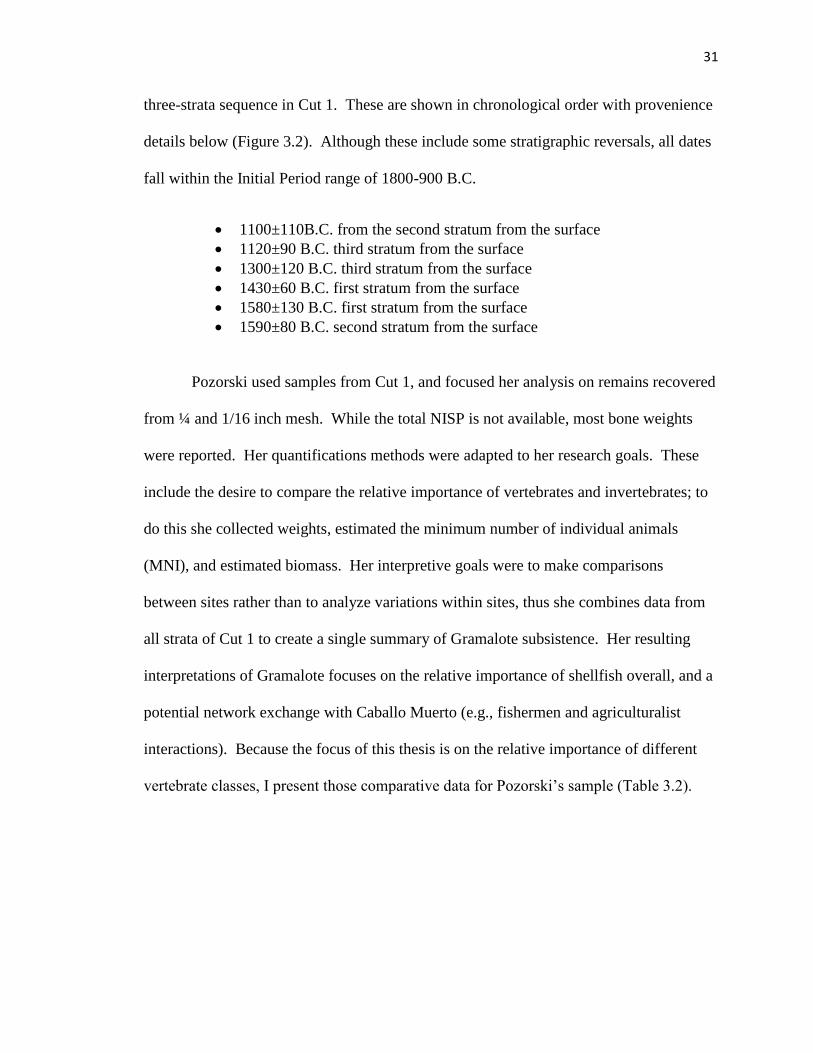
In the coastal region of Peru, the average date for the introduction of ceramics is
approximately 1800 B.C. (Moseley 2001). Pozorski published a series of radiocarbon
dates for Gramalote (Pozorski and Pozorski 1979:418). Six dates were taken from a
N
31
three-strata sequence in Cut 1. These are shown in chronological order with provenience
details below (Figure 3.2). Although these include some stratigraphic reversals, all dates
fall within the Initial Period range of 1800-900 B.C.
1100±110B.C. from the second stratum from the surface
1120±90 B.C. third stratum from the surface
1300±120 B.C. third stratum from the surface
1430±60 B.C. first stratum from the surface
1580±130 B.C. first stratum from the surface
1590±80 B.C. second stratum from the surface
Pozorski used samples from Cut 1, and focused her analysis on remains recovered
from ¼ and 1/16 inch mesh. While the total NISP is not available, most bone weights
were reported. Her quantifications methods were adapted to her research goals. These
include the desire to compare the relative importance of vertebrates and invertebrates; to
do this she collected weights, estimated the minimum number of individual animals
(MNI), and estimated biomass. Her interpretive goals were to make comparisons
between sites rather than to analyze variations within sites, thus she combines data from
all strata of Cut 1 to create a single summary of Gramalote subsistence. Her resulting
interpretations of Gramalote focuses on the relative importance of shellfish overall, and a
potential network exchange with Caballo Muerto (e.g., fishermen and agriculturalist
interactions). Because the focus of this thesis is on the relative importance of different
vertebrate classes, I present those comparative data for Pozorski’s sample (Table 3.2).
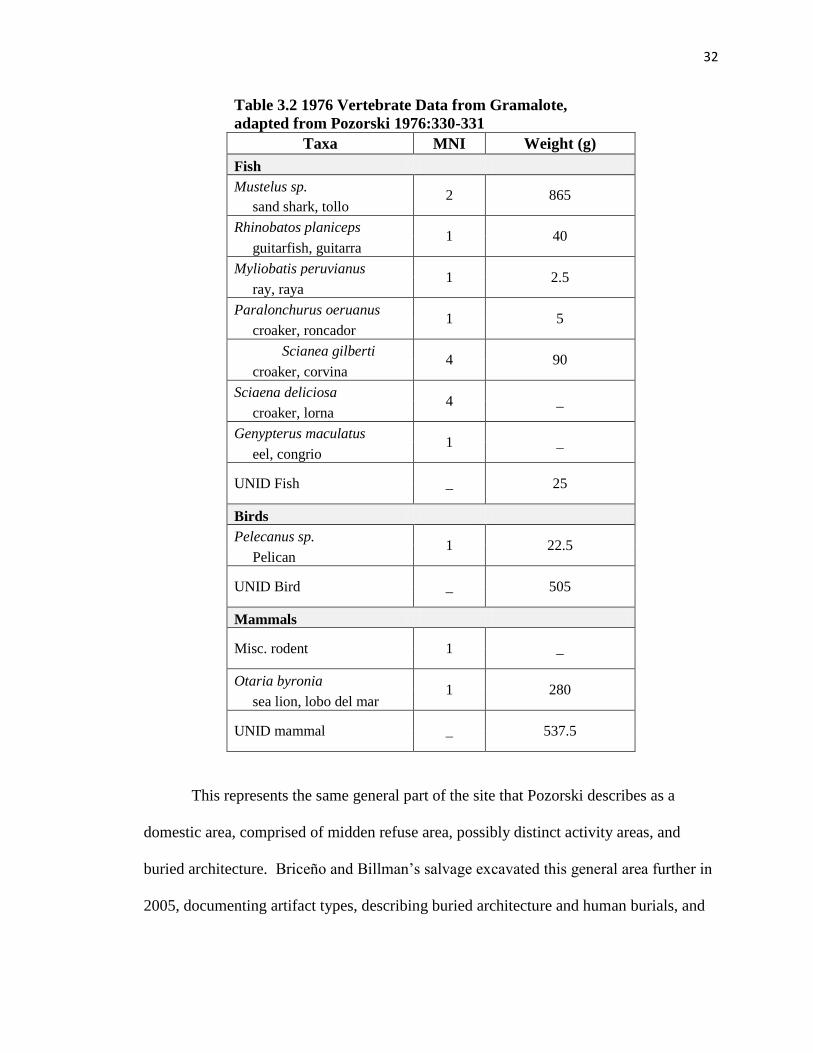
32
Table 3.2 1976 Vertebrate Data from Gramalote,
adapted from Pozorski 1976:330-331
Taxa MNI Weight (g)
Fish
Mustelus sp. 2 865
sand shark, tollo
Rhinobatos planiceps 1 40
guitarfish, guitarra
Myliobatis peruvianus 1 2.5
ray, raya
Paralonchurus oeruanus 1 5
croaker, roncador
Scianea gilberti 4 90
croaker, corvina
Sciaena deliciosa 4 _
croaker, lorna
Genypterus maculatus 1 _
eel, congrio
UNID Fish _ 25
Birds
Pelecanus sp. 1 22.5
Pelican
UNID Bird _ 505
Mammals
Misc. rodent 1 _
Otaria byronia 1 280
sea lion, lobo del mar
UNID mammal _ 537.5
This represents the same general part of the site that Pozorski describes as a
domestic area, comprised of midden refuse area, possibly distinct activity areas, and
buried architecture. Briceño and Billman’s salvage excavated this general area further in
2005, documenting artifact types, describing buried architecture and human burials, and
33
contextualizing initial findings with previous work (Briceño et al. 2006; Briceño and
Billman 2008).
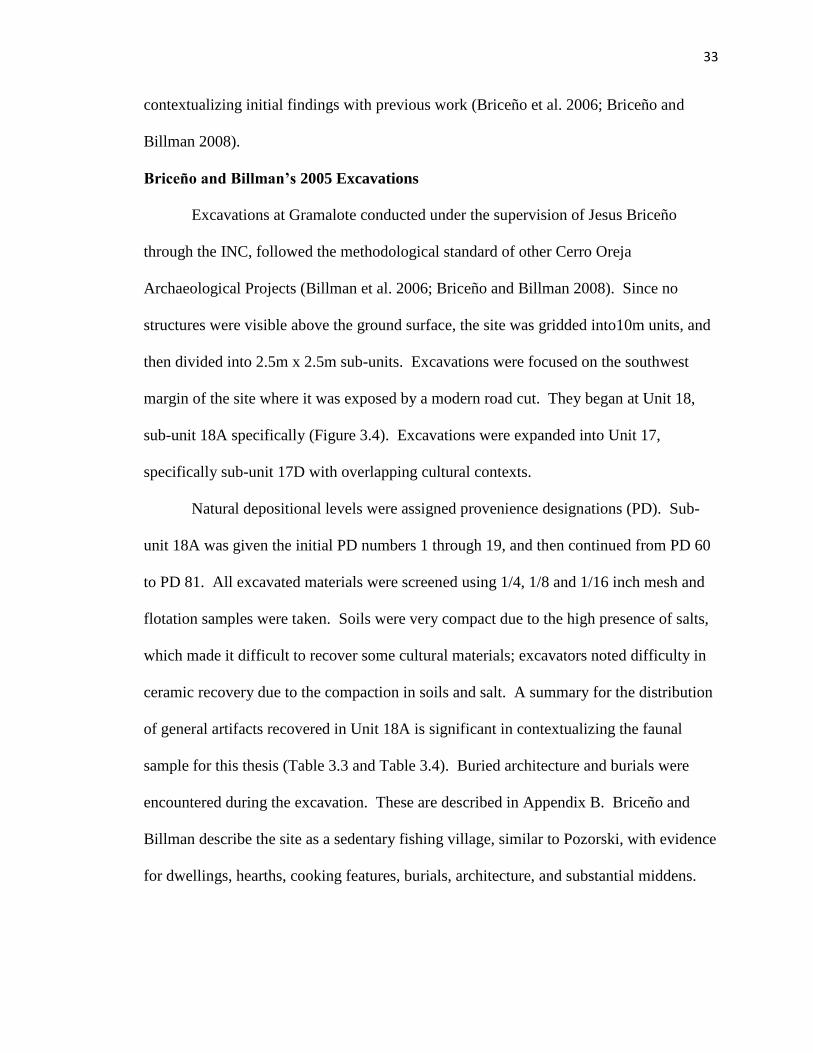
Briceño and Billman’s 2005 Excavations
Excavations at Gramalote conducted under the supervision of Jesus Briceño
through the INC, followed the methodological standard of other Cerro Oreja
Archaeological Projects (Billman et al. 2006; Briceño and Billman 2008). Since no
structures were visible above the ground surface, the site was gridded into10m units, and
then divided into 2.5m x 2.5m sub-units. Excavations were focused on the southwest
margin of the site where it was exposed by a modern road cut. They began at Unit 18,
sub-unit 18A specifically (Figure 3.4). Excavations were expanded into Unit 17,
specifically sub-unit 17D with overlapping cultural contexts.
Natural depositional levels were assigned provenience designations (PD). Sub-
unit 18A was given the initial PD numbers 1 through 19, and then continued from PD 60
to PD 81. All excavated materials were screened using 1/4, 1/8 and 1/16 inch mesh and
flotation samples were taken. Soils were very compact due to the high presence of salts,
which made it difficult to recover some cultural materials; excavators noted difficulty in
ceramic recovery due to the compaction in soils and salt. A summary for the distribution
of general artifacts recovered in Unit 18A is significant in contextualizing the faunal
sample for this thesis (Table 3.3 and Table 3.4). Buried architecture and burials were
encountered during the excavation. These are described in Appendix B. Briceño and
Billman describe the site as a sedentary fishing village, similar to Pozorski, with evidence
for dwellings, hearths, cooking features, burials, architecture, and substantial middens.
34
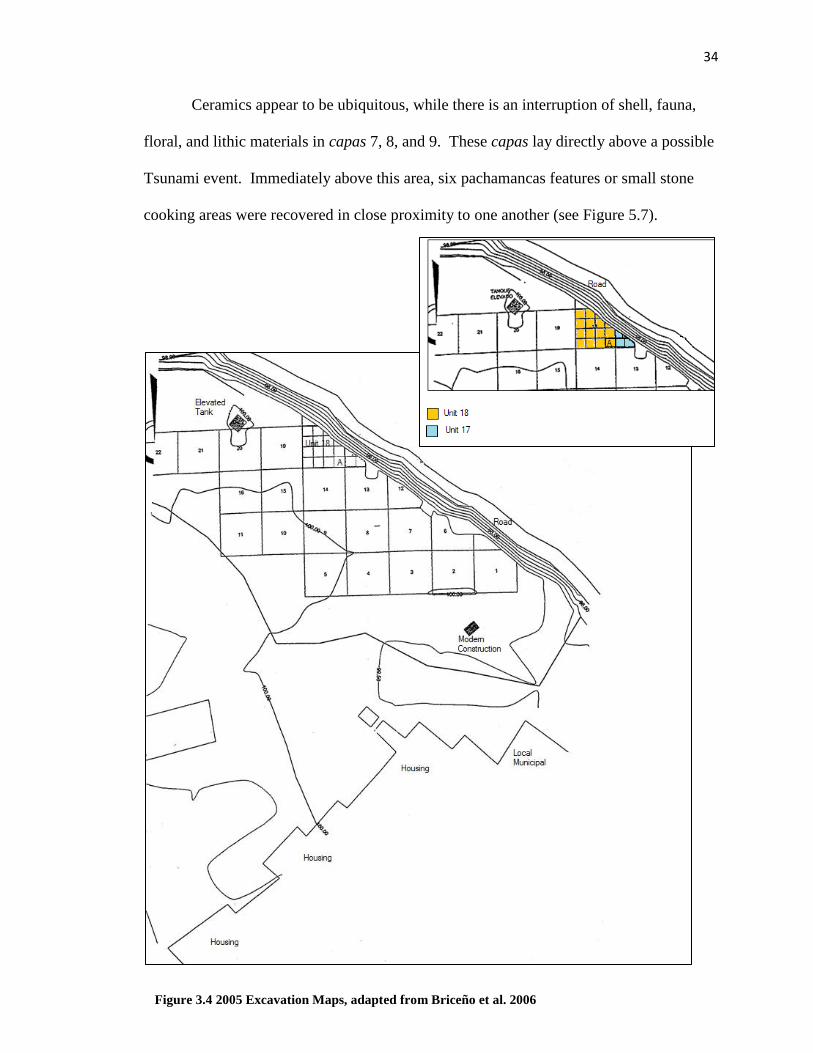
Ceramics appear to be ubiquitous, while there is an interruption of shell, fauna,
floral, and lithic materials in capas 7, 8, and 9. These capas lay directly above a possible
Tsunami event. Immediately above this area, six pachamancas features or small stone
cooking areas were recovered in close proximity to one another (see Figure 5.7).
Figure 3.4 2005 Excavation Maps, adapted from Briceño et al. 2006
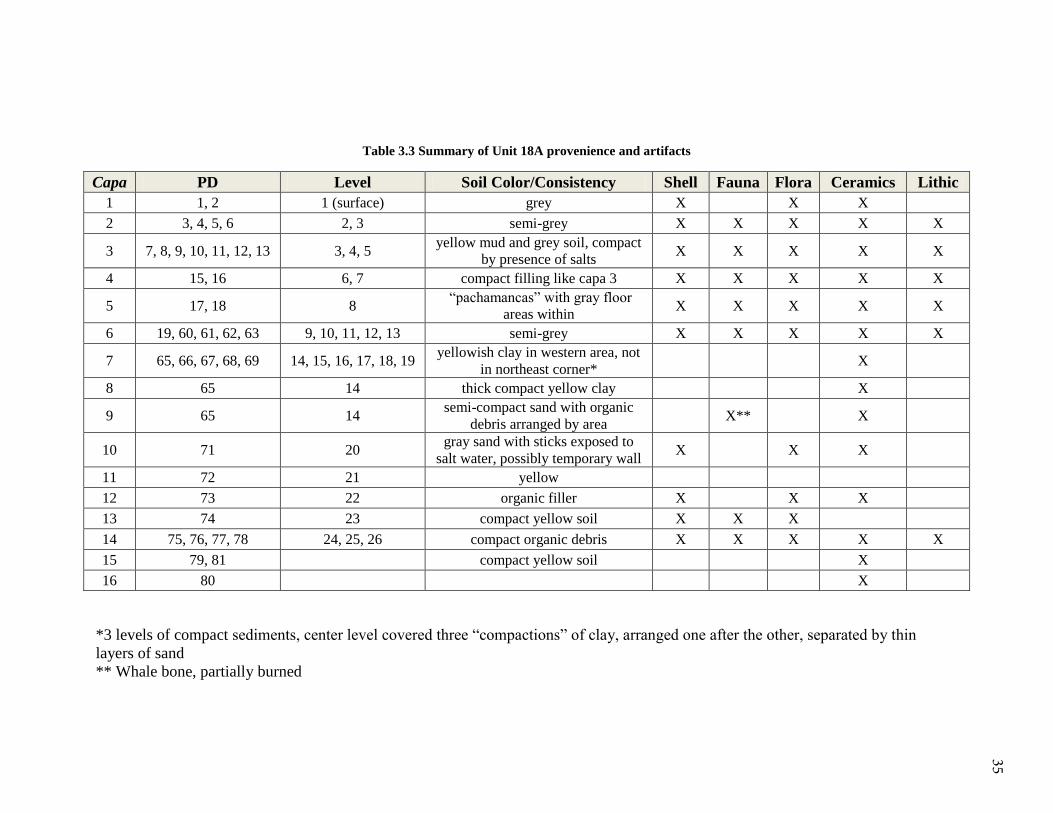
Table 3.3 Summary of Unit 18A provenience and artifacts
Capa PD Level Soil Color/Consistency Shell Fauna Flora Ceramics Lithic
1 1, 2 1 (surface) grey X X X
2 3, 4, 5, 6 2, 3 semi-grey X X X X X
3 7, 8, 9, 10, 11, 12, 13 3, 4, 5 yellow mud and grey soil, compact
by presence of salts X X X X X
4 15, 16 6, 7 compact filling like capa 3 X X X X X
5 17, 18 8 “pachamancas” with gray floor
areas within X X X X X
6 19, 60, 61, 62, 63 9, 10, 11, 12, 13 semi-grey X X X X X
7 65, 66, 67, 68, 69 14, 15, 16, 17, 18, 19 yellowish clay in western area, not
in northeast corner* X
8 65 14 thick compact yellow clay X
9 65 14 semi-compact sand with organic
debris arranged by area X** X
10 71 20 gray sand with sticks exposed to
salt water, possibly temporary wall X X X
11 72 21 yellow
12 73 22 organic filler X X X
13 74 23 compact yellow soil X X X
14 75, 76, 77, 78 24, 25, 26 compact organic debris X X X X X
15 79, 81 compact yellow soil X
16 80 X
*3 levels of compact sediments, center level covered three “compactions” of clay, arranged one after the other, separated by thin
layers of sand
** Whale bone, partially burned
35
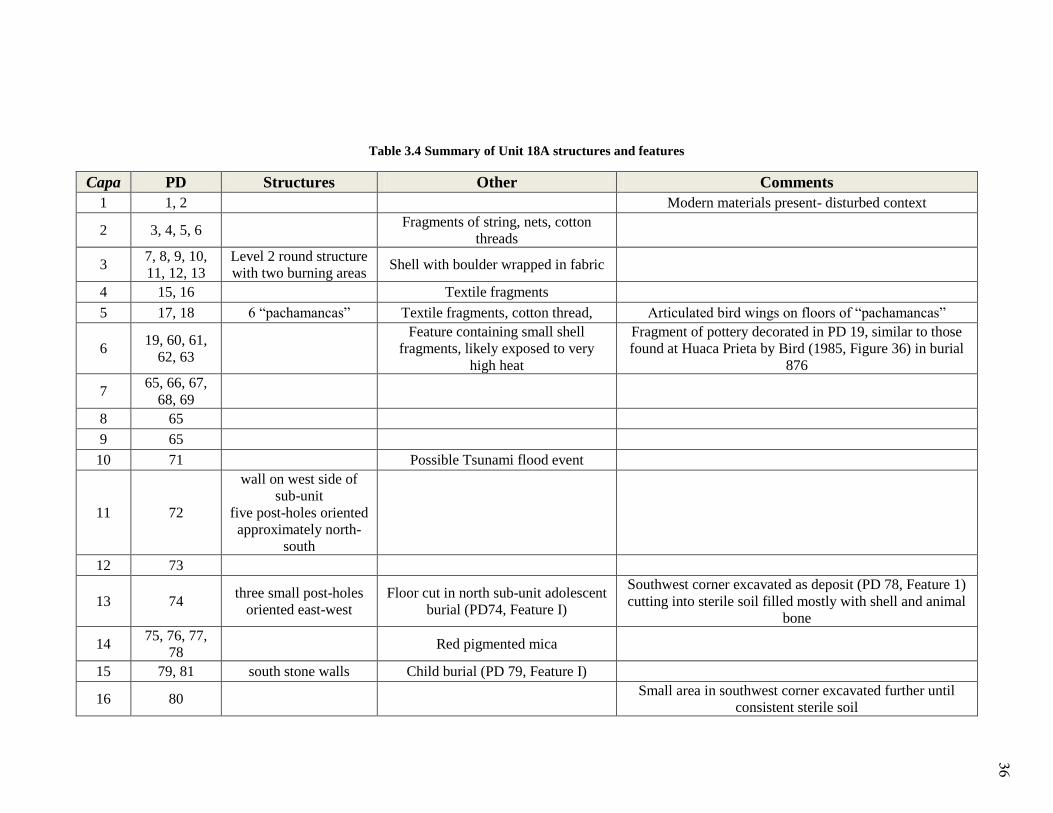
Table 3.4 Summary of Unit 18A structures and features
Capa PD Structures Other Comments
1 1, 2 Modern materials present- disturbed context
2 3, 4, 5, 6 Fragments of string, nets, cotton
threads
3 7, 8, 9, 10,
11, 12, 13
Level 2 round structure
with two burning areas Shell with boulder wrapped in fabric
4 15, 16 Textile fragments
5 17, 18 6 “pachamancas” Textile fragments, cotton thread, Articulated bird wings on floors of “pachamancas”
6 19, 60, 61,
62, 63
Feature containing small shell
fragments, likely exposed to very
high heat
Fragment of pottery decorated in PD 19, similar to those
found at Huaca Prieta by Bird (1985, Figure 36) in burial
876
7 65, 66, 67,
68, 69
8 65
9 65
10 71 Possible Tsunami flood event
11 72
wall on west side of
sub-unit
five post-holes oriented
approximately north-
south
12 73
13 74 three small post-holes
oriented east-west
Floor cut in north sub-unit adolescent
burial (PD74, Feature I)
Southwest corner excavated as deposit (PD 78, Feature 1)
cutting into sterile soil filled mostly with shell and animal
bone
14 75, 76, 77,
78 Red pigmented mica
15 79, 81 south stone walls Child burial (PD 79, Feature I)
16 80 Small area in southwest corner excavated further until
consistent sterile soil
36

37
Gabriel Prieto’s 2010 Excavations
In 2010, excavations led by Prieto reexamined this area of the site, cleaning
approximately 60 meters of the western site profile and extends inwards (Prieto 2010:5).
This work exposed an architectural area consisting of stones walls with “a complex
system of entryways with elevated thresholds, patios, as well as large and small rooms”
(Prieto 2010:4). Prieto interprets this as a domestic area. Complete analysis of this work
is not yet published. Marine resources were recovered, but not detailed in this paper.
The focus of Prieto’s currently available work is expanding our knowledge of
architectural complexities and ritual activities at Gramalote.
Summary
Gramalote was occupied during a period of significant cultural and technological
changes. Specifically, research is being conducted along the coast to examine changes in
the rise in socio-political complexity, increased reliance on fish and domesticated plants
and animals, and new technologies such as ceramics and irrigation agriculture (e.g.,
Billman 2002, Burger and Salazar-Burger 1991, Dillehay et al. 2004, Sandweiss 2008,
2009, Pozorski and Pozorski 2005). Despite the numerous research projects at sites like
Gramalote, there are still many unanswered questions which ongoing research will aid in
regional contextualization.
The Gramalote site has been a locus of several important excavations targeted at
better understanding the transition from the Late Preceramic to the Initial Period along
the north coast of Peru (Briceño et al. 2006, Briceño and Billman 2008, Pozorski 1976,
Prieto 2010, Velasquez 1987). Pozorski’s work presented a basic framework for
subsequent subsistence interpretations, while comparing vertebrates, invertebrates and

38
botanical samples. She further provided the dates to confirm an Initial Period occupation
at Gramalote. Briceño and Billman’s excavations have presented a temporal cultural
sequence for the same general area of the site, and provided a full description of the
buried architecture. Prieto’s work, while still underway, offers a preliminary examination
of the ritual life at the site, as carried out in domestic areas. His continued excavations
will help to contextualize the basic lifeways of the site occupants.
39
CHAPTER 4: METHODS
This chapter describes how the faunal assemblage was excavated, how the
assemblage was identified and quantified in Peru, and how the resulting database was
subsequently analyzed quantitatively in the United States.
Excavation Methods
The total site of Gramalote covers approximately 300m. The study assemblage
comes from Unit 18 which is 2.5x2.5 m across and 1.4 m deep (Briceño et al. 2006). In
Unit 18A, bone was recovered using 1/8 inch mesh in the field. Descriptions of
individual capas estratigráficas (stratigraphic levels), adapted from Briceño and Billman
(2008) are provided in Appendix A. This sample was excavated by provenience
designations (PD) within capas. Although the excavation stratigraphy is complex, as
shown in Figure 4.1, the capas typically span the width of the unit, encompassing diverse
levels and provenience features (e.g. lenses, natural and cultural intrusions). Pisos
(floors) represent living surfaces of some kind that extend across the unit. This study
utilizes the Capas to investigate changes through time.

40
Figure 4.1 Gramalote Unit 18A North Profile, adapted from Briceño et al. 2006, translations by McTavish
40
41
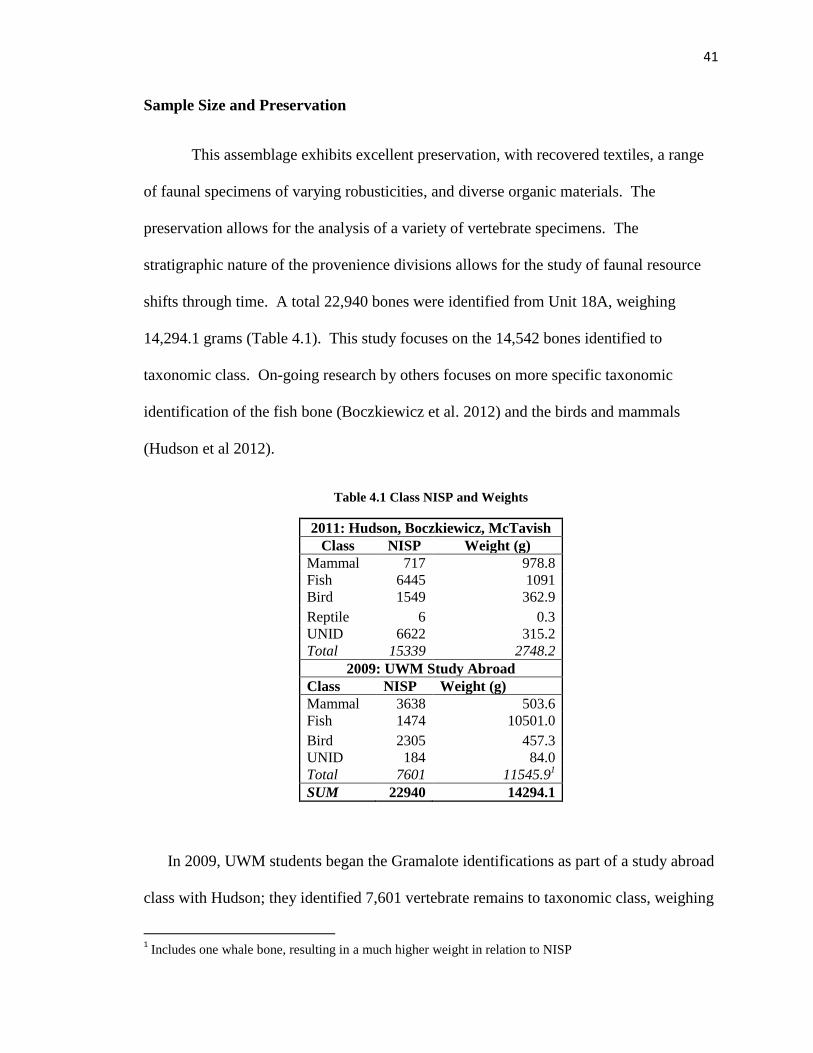
Sample Size and Preservation
This assemblage exhibits excellent preservation, with recovered textiles, a range
of faunal specimens of varying robusticities, and diverse organic materials. The
preservation allows for the analysis of a variety of vertebrate specimens. The
stratigraphic nature of the provenience divisions allows for the study of faunal resource
shifts through time. A total 22,940 bones were identified from Unit 18A, weighing
14,294.1 grams (Table 4.1). This study focuses on the 14,542 bones identified to
taxonomic class. On-going research by others focuses on more specific taxonomic
identification of the fish bone (Boczkiewicz et al. 2012) and the birds and mammals
(Hudson et al 2012).
Table 4.1 Class NISP and Weights
2011: Hudson, Boczkiewicz, McTavish
Class NISP Weight (g)
Mammal 717 978.8
Fish 6445 1091
Bird 1549 362.9
Reptile 6 0.3
UNID 6622 315.2
Total 15339 2748.2
2009: UWM Study Abroad
Class NISP Weight (g)
Mammal 3638 503.6
Fish 1474 10501.0
Bird 2305 457.3
UNID 184 84.0
Total 7601 11545.91
SUM 22940 14294.1
In 2009, UWM students began the Gramalote identifications as part of a study abroad
class with Hudson; they identified 7,601 vertebrate remains to taxonomic class, weighing
1 Includes one whale bone, resulting in a much higher weight in relation to NISP
42
approximately 11,545.9 grams (Table 4.1). This sample was from provenience
designation (PD) numbers 17, 18, 71, 74, 75, 76, 77, 78, and 79. In 2011, in
collaboration with Hudson and Boczkiewicz, I completed the 18A taxonomic class
identifications, adding 15,339 vertebrate specimens, weighing approximately 2,748.2
grams.
Laboratory Protocol
Faunal materials had already been separated from the other archaeological
remains by the Peruvian excavation team. An inventory was taken of the faunal bags,
paying particular attention to the provenience information used by the Peruvian team (e.g.
capa, PD, storage box number).
Bones were gently washed using water and then air-dried. When partially or
completely dried, the bones were checked for salt encrustation. Salt-encrusted bones
were given a secondary washing, then dried. When necessary, drying was expedited by
spreading the bone across large, fine-meshed screens, positioned to allow air circulation,
with fans and desk lamps to provide further air circulation and heat. If salt encrustation
was extreme, the bones were soaked in water for 15-30 minutes. In most cases this was
sufficient to dissolve the salts. If after this washing process, the bones were still salt-
encrusted to a degree that would result in exaggerated weights; it was noted and entered
into the database. While salt encrustation can damage the structure of bone (Baxter 1994;
Brothwell 1972), it was infrequent in the faunal sample analyzed.
The laboratory procedures for sorting and recording information are described.
The goals of this study focus on class-level differences. These goals match the available
43
comparative collection and skill level. After my rough sorting into taxonomic classes,
identifications were reviewed by Dr. Hudson and confirmed, revised, or refined to a more
specific level identification for birds and mammals. Roberta Boczkiewicz refined the
identification for a subsample of the fish.
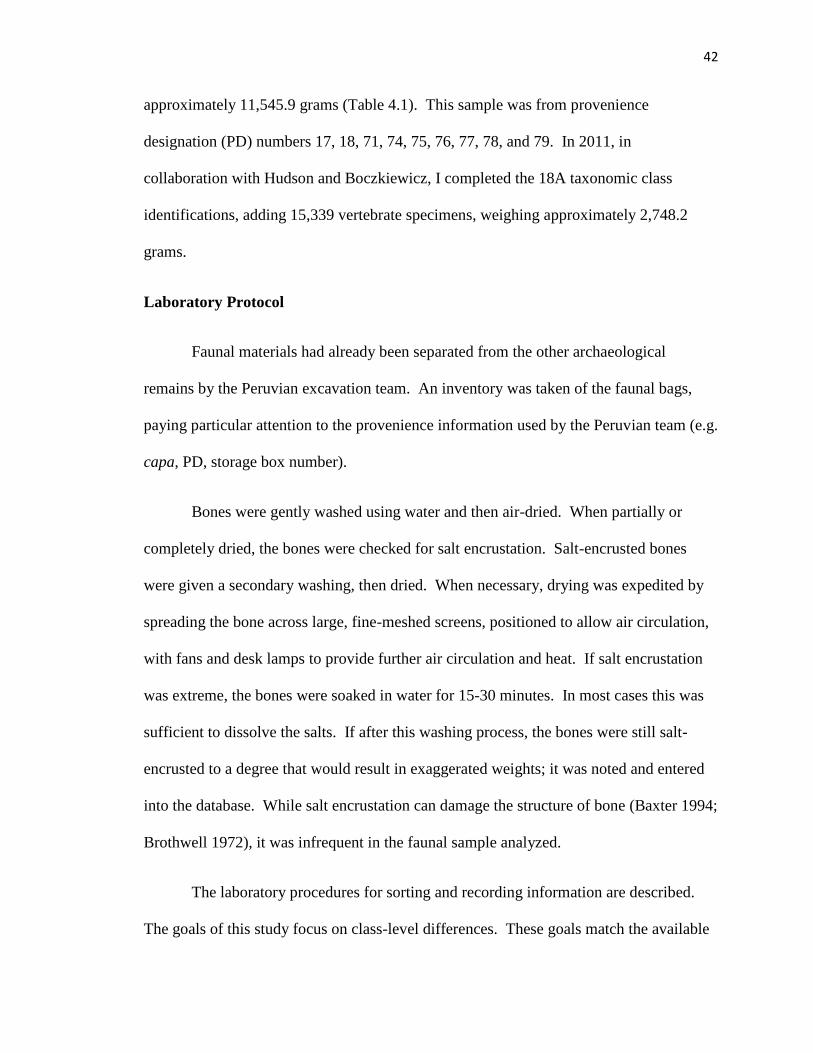
As specimens were identified, information was recorded on tags (Table 5.2). The
tag data was then recorded in a digital database to be used for further analysis in the
United States. The assemblage was re-boxed and returned for continued curation by the
INC in Trujillo, Peru.
Table 4.2 Recorded Information
Box (curation)
Unit
Capa (strata)
PD (provenience designation)
Class
Taxon
Element
Part
Side
Age
Modifications:
burnt, cut, gnawed, worked
Count
Weight (grams)
Identification by
Date of Identification
Identification
Identifiable elements were evaluated with the available comparative collections,
with particular attention paid to expected local fauna and to differentiating marine and
terrestrial mammals and birds. Comparative collections of local fauna, assembled by
44
Hudson and Kaufman during previous lab seasons were used in combination with
illustrated guides (i.e. Wolniewicz 2001; Reitz and Wing 2008; Cooper and Schiller
1975; O’Connell 2000) and photographic guides generated by Hudson from specimens in
the University of Wisconsin-Madison Zoology Museum. Identifications to taxonomic
classes were based on diagnostic attributes such as class-defining articular ends of bones,
and structural characteristics, such as compact bone thickness (Brewer 1992:229; Reitz
and Wing 2008:38).
Identifications beyond the class level, made by Hudson and Boczkiewicz include
the following. Fish include: lorna drum (Sciaena deliciosa), minor stardrum (Stellifer
minor), Peruvian hake (Merluccius gayi peruanus), Peruvian banded croaker
(Paralonchurus peruanus), Peruvian weakfish (Cynoscion analis), shark (Mustelus sp.),
ray (Myliobatis chilensis), anchovy (Engraulis ringens ), and sardine (Sardinops sagax
sagax) (Boczkiewicz et al. 2012). Mammals include sea lion (Otaria flavescens),
pinniped (Pinnipedia), cetacean (Cetacea), and rodent (Rodentia) (Hudson et al. 2012).
Birds include cormorant (Phalacrocorax), Peruvian booby (Sula variegata), Peruvian
pelican (Pelecanus thagus), and Humboldt penguin (Spheniscus humboldti) (Hudson et
al. 2012).
Fragmentation can affect class level identifications. When a class level
distinction could not be made through basic skeletal morphological characteristics, the
specimen was assigned into an unidentified category (UNID). The intent of this analysis
was to be conservative with identifications.
The differentiation between marine and terrestrial vertebrates is significant for
answering my research questions. Although the articular ends of the elements are usually
45
necessary for element identification species identification, more general morphological
characteristics associated with the different gravitational pressures of water versus land
and air sometimes allow otherwise undifferentiated marine and terrestrial mammals to be
separated (Anken and Rahmann 2001; Reitz and Wing 2008). Such characteristics
include compact bone thickness and density, surface texture, and internal bone structure.
Salt encrustation can lead to heavier weights based on soil matrix rather than
taxonomic class. Whenever possible, salt-encrustation was removed. If it biased the
weights, then this was noted. In cases where washing led to further fragmentation of
bone, associated fragments were kept together and counted as a single identified
specimen.
Quantification
I use both bone weight and the number of identified specimens (NISP) to
compare faunal usage through time. Both measures represent primary data (Lyman
1994:38; Reitz and Wing 2008); each has particular strengths. Bone mass is a proxy for
meat weight, which can help in determining resource usage (Hesse and Wapnish 1985).
NISP represents the most basic observational unit, is suitable for a variety of statistical
tests, and often facilitates comparisons with other faunal reports. I use Zeder’s (1991)
definition of “identified” to mean a specimen, which is identified to taxonomic class, will
be counted in the total NISP (Zeder 1991:79). Specimen is defined as a bone or tooth
fragment. Only vertebrates were counted in the sample studied. There is a potential bias
towards the identification of fish elements when using NISP due to their distinctive
skeletal structure. A shift in emphasis between marine and terrestrial, or fish

46
specialization can be traced using the combination of bone weight along with overall
NISP.
47
CHAPTER 5: RESULTS AND ANALYSIS
This chapter reviews the results of my analysis of vertebrate remains from the site
of Gramalote. I began my study with the intent of evaluating how the 2005 sample
compared with Pozorski’s original generalizations about subsistence at the site. I also
took a closer look at potential changes to subsistence patterns during the several hundred
years that the site was occupied. Given the ecological expectations of OFT and MFAC
reviewed in Chapter 1, I expected that fish would increase in importance during the
Initial Period. The analysis that follows addresses this starting expectation. It further
contributes insights into the importance of depositional type (midden versus occupational
surface) when evaluating temporal change within a single stratified unit. This chapter is
organized as follows. It begins with summary data by provenience, followed by a
comparison of the Unit 18A faunal sample to Pozorski’s 1976 analysis, and then an
evaluation of data in reference to my original expectations. This is followed by a
discussion of depositional contexts. The chapter ends with a summary of key results.
Results from Unit 18A
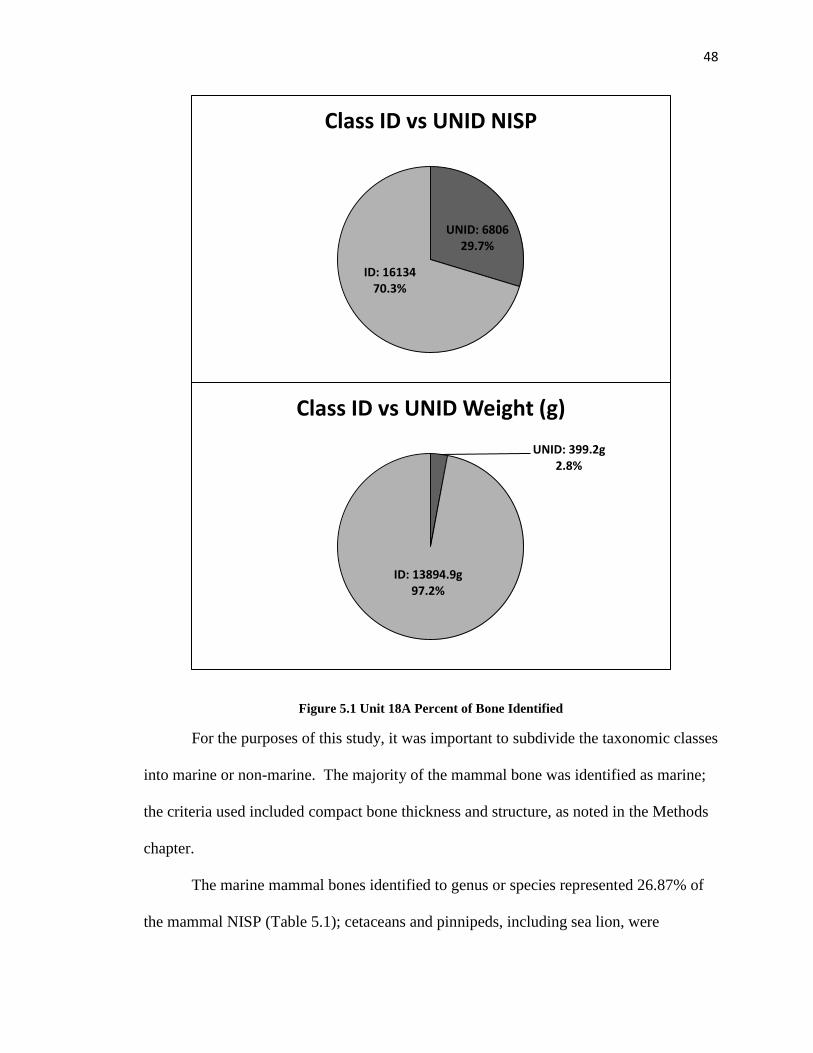
A total NISP of 22,940vertebrate remains were recovered from Unit 18A. Of
these, 14,542 were identified to class level as fish, bird, or mammal. The 6,726 bones
remaining were left as unidentified vertebrate or “UNID”. Figure 5.1 illustrates the
percentages identified by both NISP (70.3%) and bone weight (97.2%). The
undifferentiated bone was not included in the analysis that follows.
48
Figure 5.1 Unit 18A Percent of Bone Identified
For the purposes of this study, it was important to subdivide the taxonomic classes
into marine or non-marine. The majority of the mammal bone was identified as marine;
the criteria used included compact bone thickness and structure, as noted in the Methods
chapter.
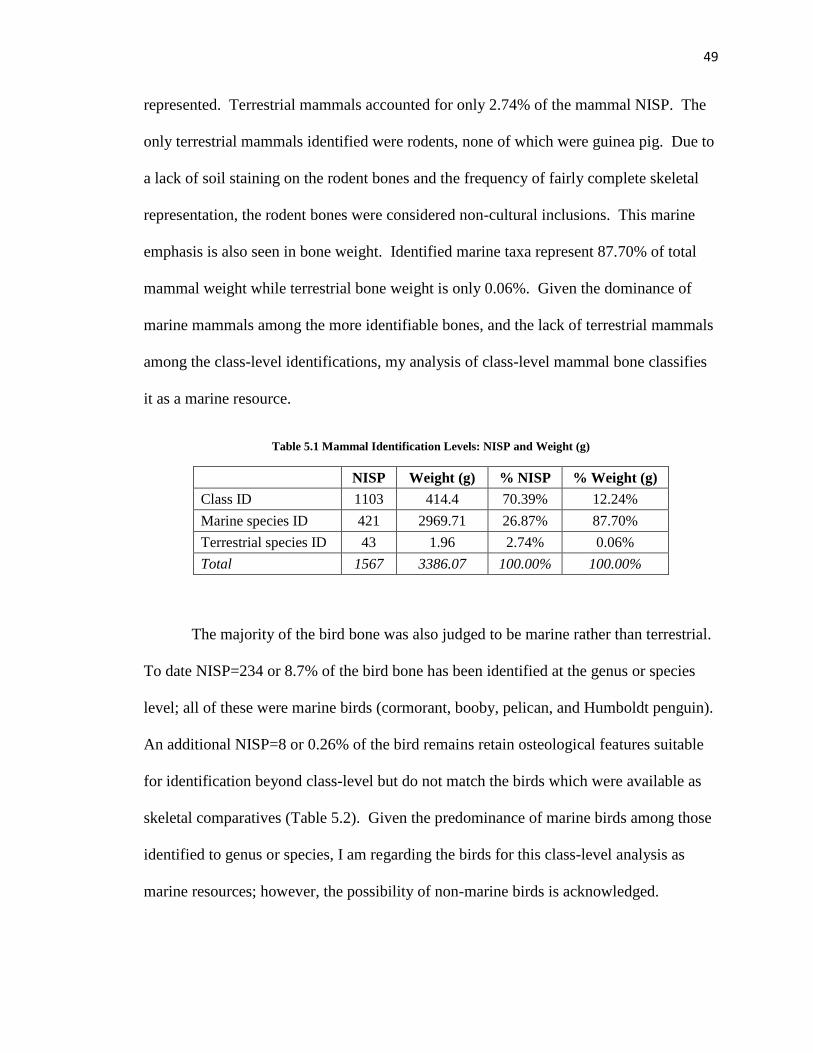
The marine mammal bones identified to genus or species represented 26.87% of
the mammal NISP (Table 5.1); cetaceans and pinnipeds, including sea lion, were
UNID: 6806 29.7%
ID: 16134 70.3%
Class ID vs UNID NISP
UNID: 399.2g 2.8%
ID: 13894.9g 97.2%
Class ID vs UNID Weight (g)
49
represented. Terrestrial mammals accounted for only 2.74% of the mammal NISP. The
only terrestrial mammals identified were rodents, none of which were guinea pig. Due to
a lack of soil staining on the rodent bones and the frequency of fairly complete skeletal
representation, the rodent bones were considered non-cultural inclusions. This marine
emphasis is also seen in bone weight. Identified marine taxa represent 87.70% of total
mammal weight while terrestrial bone weight is only 0.06%. Given the dominance of
marine mammals among the more identifiable bones, and the lack of terrestrial mammals
among the class-level identifications, my analysis of class-level mammal bone classifies
it as a marine resource.
Table 5.1 Mammal Identification Levels: NISP and Weight (g)
NISP Weight (g) % NISP % Weight (g)
Class ID 1103 414.4 70.39% 12.24%
Marine species ID 421 2969.71 26.87% 87.70%
Terrestrial species ID 43 1.96 2.74% 0.06%
Total 1567 3386.07 100.00% 100.00%
The majority of the bird bone was also judged to be marine rather than terrestrial.
To date NISP=234 or 8.7% of the bird bone has been identified at the genus or species
level; all of these were marine birds (cormorant, booby, pelican, and Humboldt penguin).
An additional NISP=8 or 0.26% of the bird remains retain osteological features suitable
for identification beyond class-level but do not match the birds which were available as
skeletal comparatives (Table 5.2). Given the predominance of marine birds among those
identified to genus or species, I am regarding the birds for this class-level analysis as
marine resources; however, the possibility of non-marine birds is acknowledged.
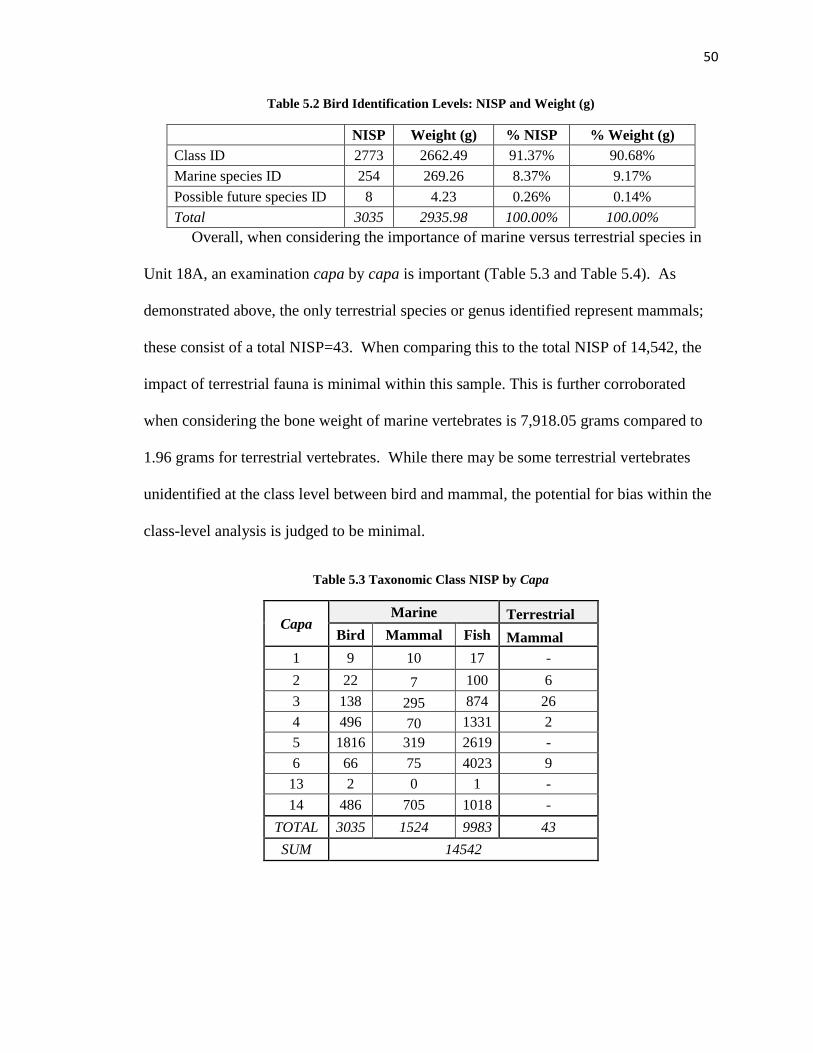
50
Table 5.2 Bird Identification Levels: NISP and Weight (g)
NISP Weight (g) % NISP % Weight (g)
Class ID 2773 2662.49 91.37% 90.68%
Marine species ID 254 269.26 8.37% 9.17%
Possible future species ID 8 4.23 0.26% 0.14%
Total 3035 2935.98 100.00% 100.00%
Overall, when considering the importance of marine versus terrestrial species in
Unit 18A, an examination capa by capa is important (Table 5.3 and Table 5.4). As
demonstrated above, the only terrestrial species or genus identified represent mammals;
these consist of a total NISP=43. When comparing this to the total NISP of 14,542, the
impact of terrestrial fauna is minimal within this sample. This is further corroborated
when considering the bone weight of marine vertebrates is 7,918.05 grams compared to
1.96 grams for terrestrial vertebrates. While there may be some terrestrial vertebrates
unidentified at the class level between bird and mammal, the potential for bias within the
class-level analysis is judged to be minimal.
Table 5.3 Taxonomic Class NISP by Capa
Capa Marine Terrestrial
Bird Mammal Fish Mammal
1 9 10 17 -
2 22 7 100 6
3 138 295 874 26
4 496 70 1331 2
5 1816 319 2619 -
6 66 75 4023 9
13 2 0 1 -
14 486 705 1018 -
TOTAL 3035 1524 9983 43
SUM 14542
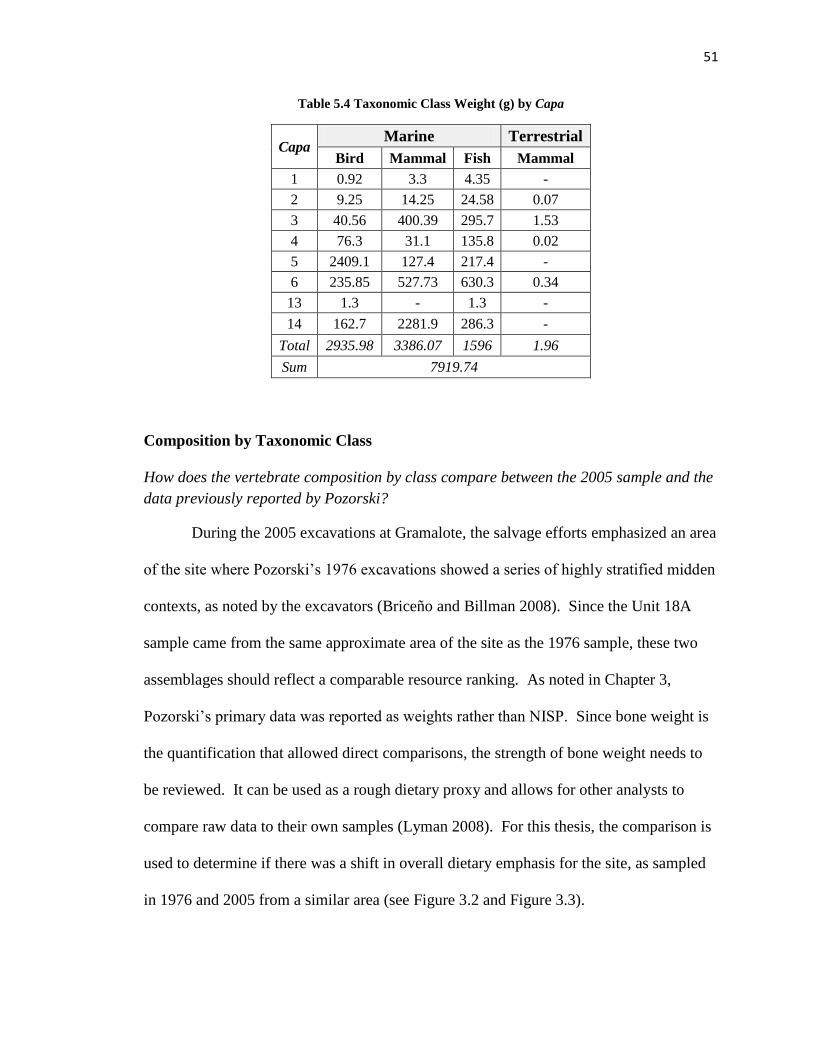
51
Table 5.4 Taxonomic Class Weight (g) by Capa
Capa Marine Terrestrial
Bird Mammal Fish Mammal
1 0.92 3.3 4.35 -
2 9.25 14.25 24.58 0.07
3 40.56 400.39 295.7 1.53
4 76.3 31.1 135.8 0.02
5 2409.1 127.4 217.4 -
6 235.85 527.73 630.3 0.34
13 1.3 - 1.3 -
14 162.7 2281.9 286.3 -
Total 2935.98 3386.07 1596 1.96
Sum 7919.74
Composition by Taxonomic Class
How does the vertebrate composition by class compare between the 2005 sample and the
data previously reported by Pozorski?
During the 2005 excavations at Gramalote, the salvage efforts emphasized an area
of the site where Pozorski’s 1976 excavations showed a series of highly stratified midden
contexts, as noted by the excavators (Briceño and Billman 2008). Since the Unit 18A
sample came from the same approximate area of the site as the 1976 sample, these two
assemblages should reflect a comparable resource ranking. As noted in Chapter 3,
Pozorski’s primary data was reported as weights rather than NISP. Since bone weight is
the quantification that allowed direct comparisons, the strength of bone weight needs to
be reviewed. It can be used as a rough dietary proxy and allows for other analysts to
compare raw data to their own samples (Lyman 2008). For this thesis, the comparison is
used to determine if there was a shift in overall dietary emphasis for the site, as sampled
in 1976 and 2005 from a similar area (see Figure 3.2 and Figure 3.3).
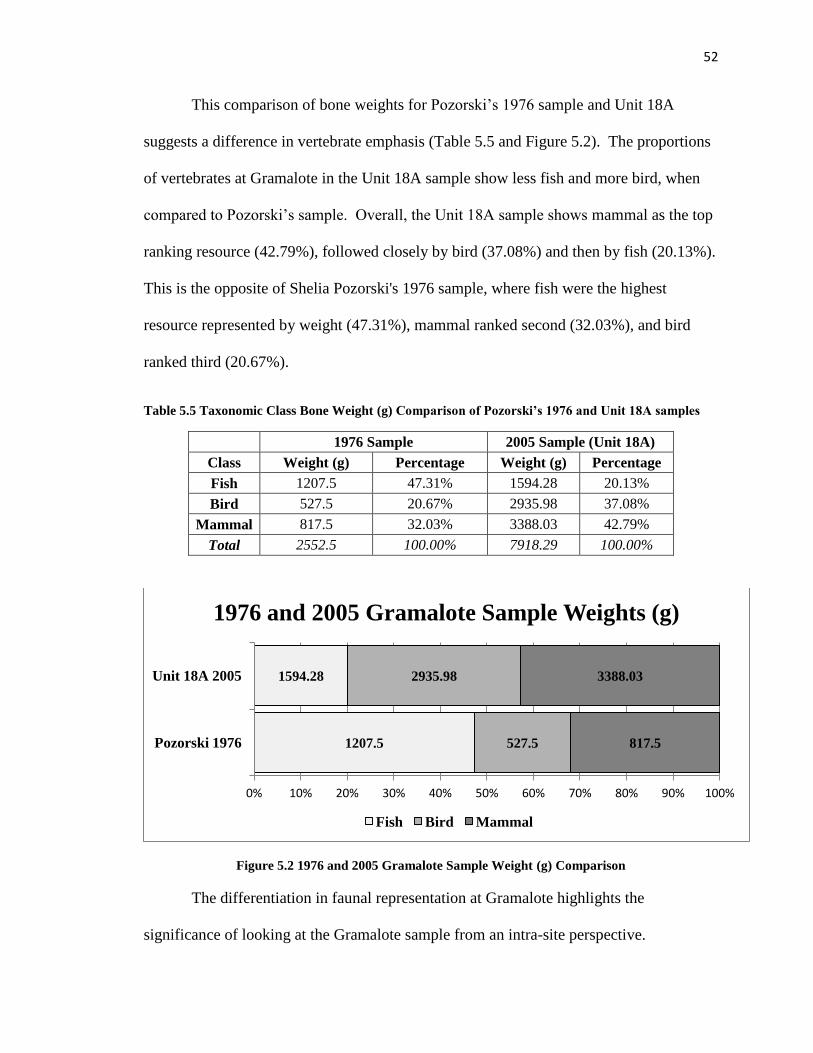
52
This comparison of bone weights for Pozorski’s 1976 sample and Unit 18A
suggests a difference in vertebrate emphasis (Table 5.5 and Figure 5.2). The proportions
of vertebrates at Gramalote in the Unit 18A sample show less fish and more bird, when
compared to Pozorski’s sample. Overall, the Unit 18A sample shows mammal as the top
ranking resource (42.79%), followed closely by bird (37.08%) and then by fish (20.13%).
This is the opposite of Shelia Pozorski's 1976 sample, where fish were the highest
resource represented by weight (47.31%), mammal ranked second (32.03%), and bird
ranked third (20.67%).
Table 5.5 Taxonomic Class Bone Weight (g) Comparison of Pozorski’s 1976 and Unit 18A samples
1976 Sample 2005 Sample (Unit 18A)
Class Weight (g) Percentage Weight (g) Percentage
Fish 1207.5 47.31% 1594.28 20.13%
Bird 527.5 20.67% 2935.98 37.08%
Mammal 817.5 32.03% 3388.03 42.79%
Total 2552.5 100.00% 7918.29 100.00%
Figure 5.2 1976 and 2005 Gramalote Sample Weight (g) Comparison
The differentiation in faunal representation at Gramalote highlights the
significance of looking at the Gramalote sample from an intra-site perspective.
1207.5
1594.28
527.5
2935.98
817.5
3388.03
0% 10% 20% 30% 40% 50% 60% 70% 80% 90% 100%
Pozorski 1976
Unit 18A 2005
1976 and 2005 Gramalote Sample Weights (g)
Fish Bird Mammal
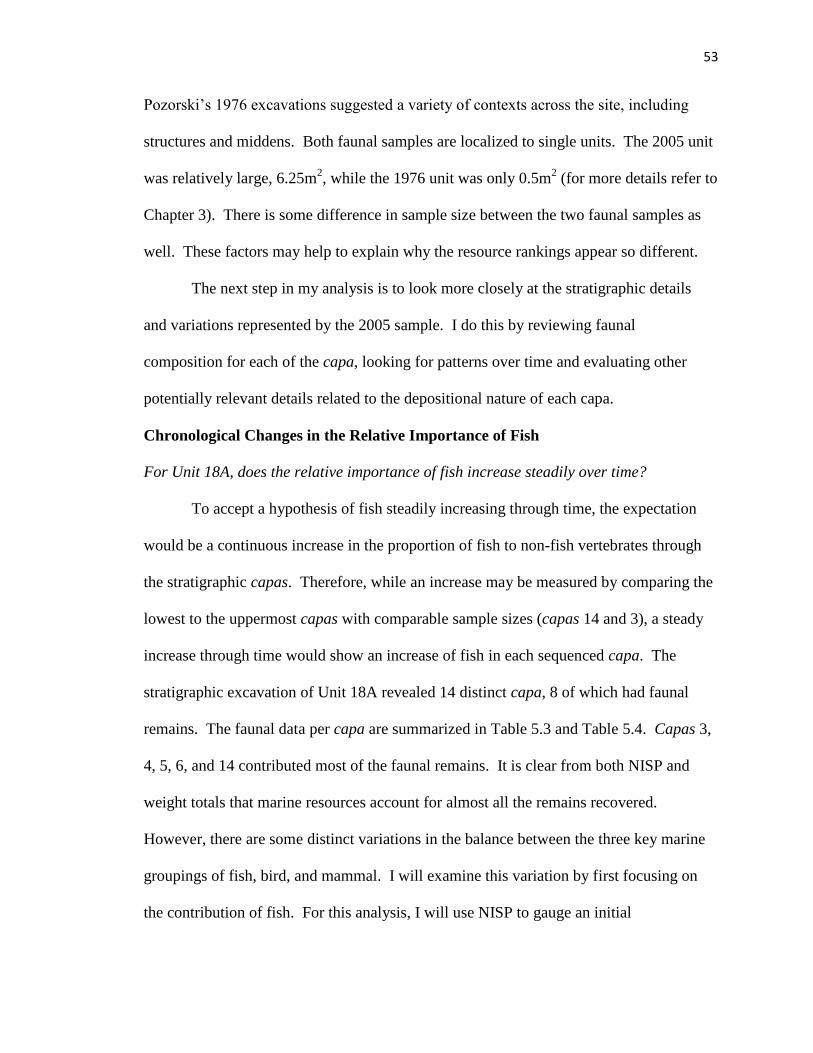
53
Pozorski’s 1976 excavations suggested a variety of contexts across the site, including
structures and middens. Both faunal samples are localized to single units. The 2005 unit
was relatively large, 6.25m2, while the 1976 unit was only 0.5m
2 (for more details refer to
Chapter 3). There is some difference in sample size between the two faunal samples as
well. These factors may help to explain why the resource rankings appear so different.
The next step in my analysis is to look more closely at the stratigraphic details
and variations represented by the 2005 sample. I do this by reviewing faunal
composition for each of the capa, looking for patterns over time and evaluating other
potentially relevant details related to the depositional nature of each capa.
Chronological Changes in the Relative Importance of Fish
For Unit 18A, does the relative importance of fish increase steadily over time?
To accept a hypothesis of fish steadily increasing through time, the expectation
would be a continuous increase in the proportion of fish to non-fish vertebrates through
the stratigraphic capas. Therefore, while an increase may be measured by comparing the
lowest to the uppermost capas with comparable sample sizes (capas 14 and 3), a steady
increase through time would show an increase of fish in each sequenced capa. The
stratigraphic excavation of Unit 18A revealed 14 distinct capa, 8 of which had faunal
remains. The faunal data per capa are summarized in Table 5.3 and Table 5.4. Capas 3,
4, 5, 6, and 14 contributed most of the faunal remains. It is clear from both NISP and
weight totals that marine resources account for almost all the remains recovered.
However, there are some distinct variations in the balance between the three key marine
groupings of fish, bird, and mammal. I will examine this variation by first focusing on
the contribution of fish. For this analysis, I will use NISP to gauge an initial
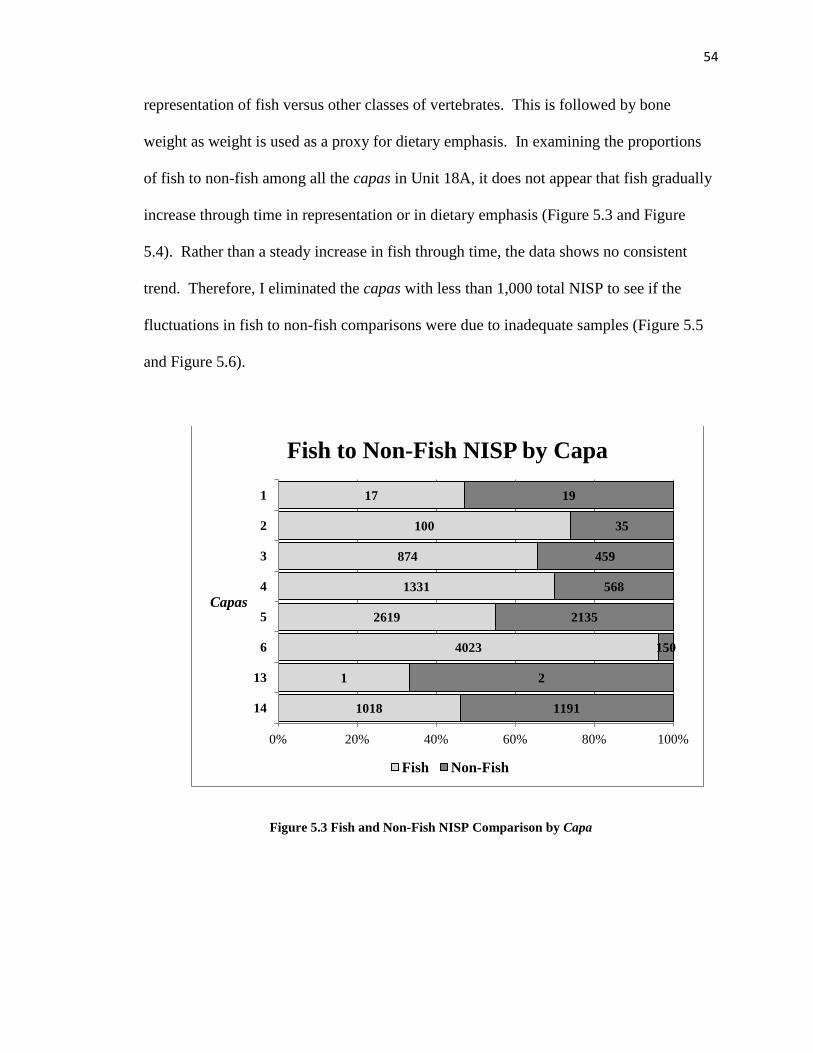
54
representation of fish versus other classes of vertebrates. This is followed by bone
weight as weight is used as a proxy for dietary emphasis. In examining the proportions
of fish to non-fish among all the capas in Unit 18A, it does not appear that fish gradually
increase through time in representation or in dietary emphasis (Figure 5.3 and Figure
5.4). Rather than a steady increase in fish through time, the data shows no consistent
trend. Therefore, I eliminated the capas with less than 1,000 total NISP to see if the
fluctuations in fish to non-fish comparisons were due to inadequate samples (Figure 5.5
and Figure 5.6).
Figure 5.3 Fish and Non-Fish NISP Comparison by Capa
1018
1
4023
2619
1331
874
100
17
1191
2
150
2135
568
459
35
19
0% 20% 40% 60% 80% 100%
14
13
6
5
4
3
2
1
Capas
Fish to Non-Fish NISP by Capa
Fish Non-Fish
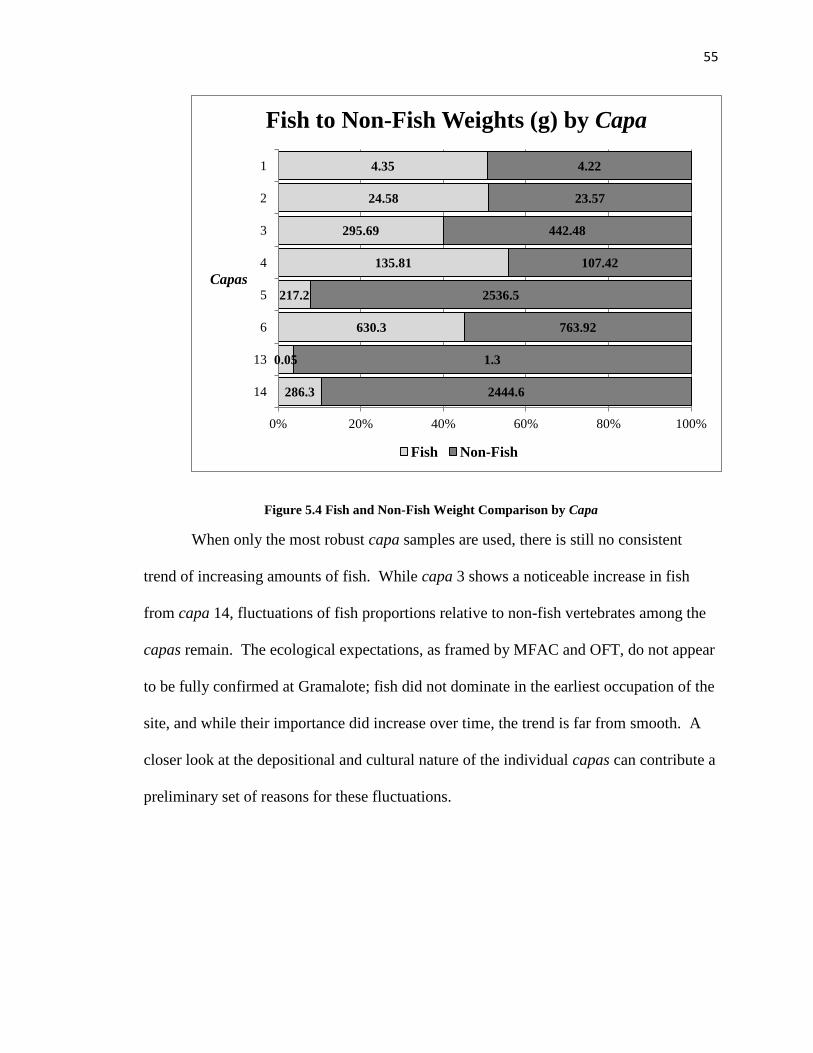
55
Figure 5.4 Fish and Non-Fish Weight Comparison by Capa
When only the most robust capa samples are used, there is still no consistent
trend of increasing amounts of fish. While capa 3 shows a noticeable increase in fish
from capa 14, fluctuations of fish proportions relative to non-fish vertebrates among the
capas remain. The ecological expectations, as framed by MFAC and OFT, do not appear
to be fully confirmed at Gramalote; fish did not dominate in the earliest occupation of the
site, and while their importance did increase over time, the trend is far from smooth. A
closer look at the depositional and cultural nature of the individual capas can contribute a
preliminary set of reasons for these fluctuations.
286.3
0.05
630.3
217.2
135.81
295.69
24.58
4.35
2444.6
1.3
763.92
2536.5
107.42
442.48
23.57
4.22
0% 20% 40% 60% 80% 100%
14
13
6
5
4
3
2
1
Capas
Fish to Non-Fish Weights (g) by Capa
Fish Non-Fish
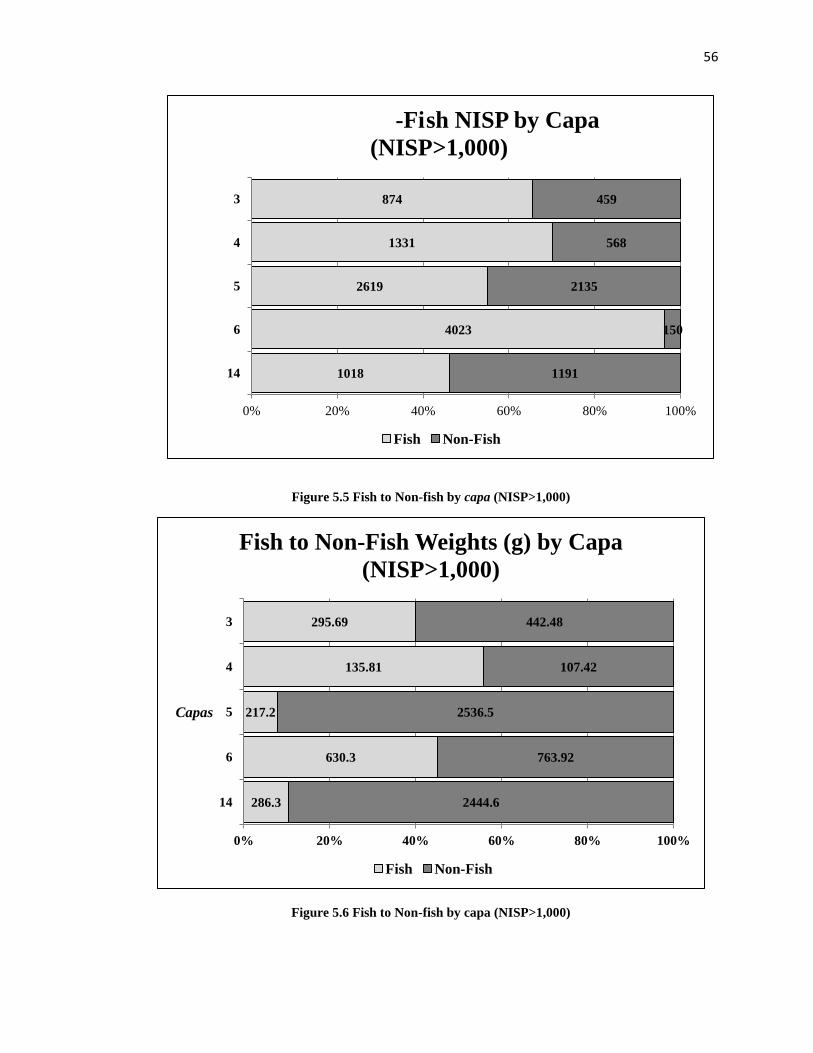
56
Figure 5.5 Fish to Non-fish by capa (NISP>1,000)
Figure 5.6 Fish to Non-fish by capa (NISP>1,000)
1018
4023
2619
1331
874
1191
150
2135
568
459
0% 20% 40% 60% 80% 100%
14
6
5
4
3
Capas
Fish to Non-Fish NISP by Capa
(NISP>1,000)
Fish Non-Fish
286.3
630.3
217.2
135.81
295.69
2444.6
763.92
2536.5
107.42
442.48
0% 20% 40% 60% 80% 100%
14
6
5
4
3
Capas
Fish to Non-Fish Weights (g) by Capa
(NISP>1,000)
Fish Non-Fish
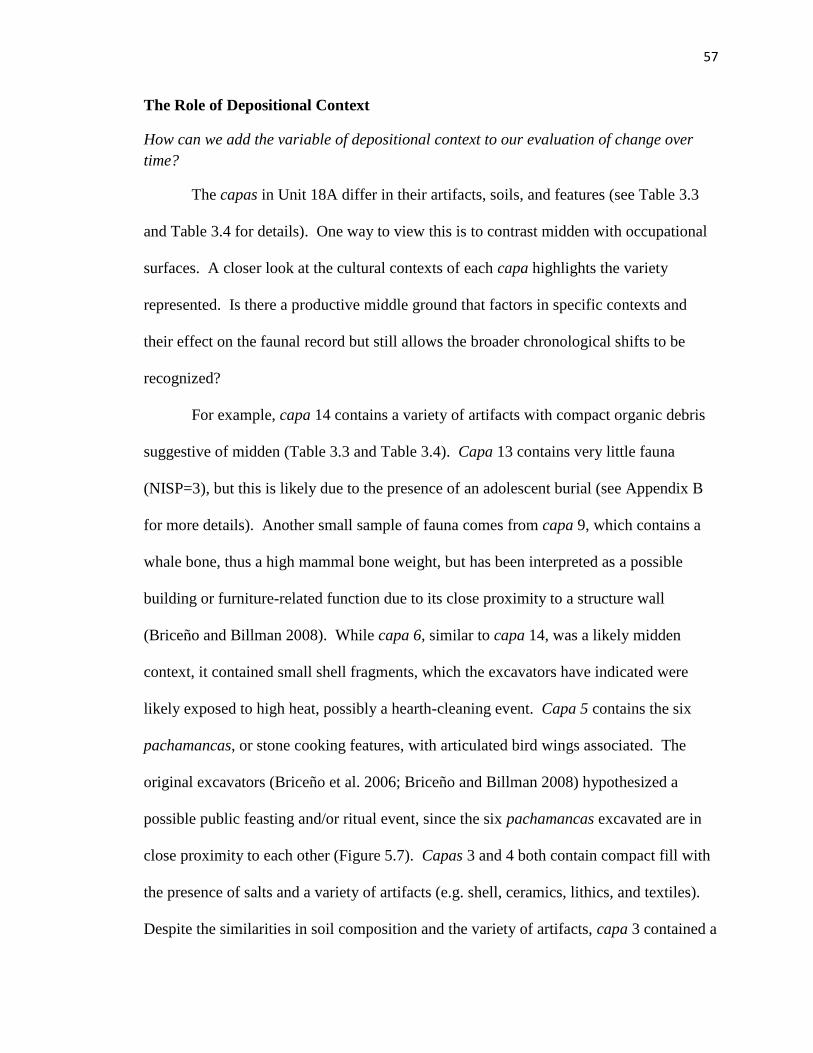
57
The Role of Depositional Context
How can we add the variable of depositional context to our evaluation of change over
time?
The capas in Unit 18A differ in their artifacts, soils, and features (see Table 3.3
and Table 3.4 for details). One way to view this is to contrast midden with occupational
surfaces. A closer look at the cultural contexts of each capa highlights the variety
represented. Is there a productive middle ground that factors in specific contexts and
their effect on the faunal record but still allows the broader chronological shifts to be
recognized?
For example, capa 14 contains a variety of artifacts with compact organic debris
suggestive of midden (Table 3.3 and Table 3.4). Capa 13 contains very little fauna
(NISP=3), but this is likely due to the presence of an adolescent burial (see Appendix B
for more details). Another small sample of fauna comes from capa 9, which contains a
whale bone, thus a high mammal bone weight, but has been interpreted as a possible
building or furniture-related function due to its close proximity to a structure wall
(Briceño and Billman 2008). While capa 6, similar to capa 14, was a likely midden
context, it contained small shell fragments, which the excavators have indicated were
likely exposed to high heat, possibly a hearth-cleaning event. Capa 5 contains the six
pachamancas, or stone cooking features, with articulated bird wings associated. The
original excavators (Briceño et al. 2006; Briceño and Billman 2008) hypothesized a
possible public feasting and/or ritual event, since the six pachamancas excavated are in
close proximity to each other (Figure 5.7). Capas 3 and 4 both contain compact fill with
the presence of salts and a variety of artifacts (e.g. shell, ceramics, lithics, and textiles).
Despite the similarities in soil composition and the variety of artifacts, capa 3 contained a
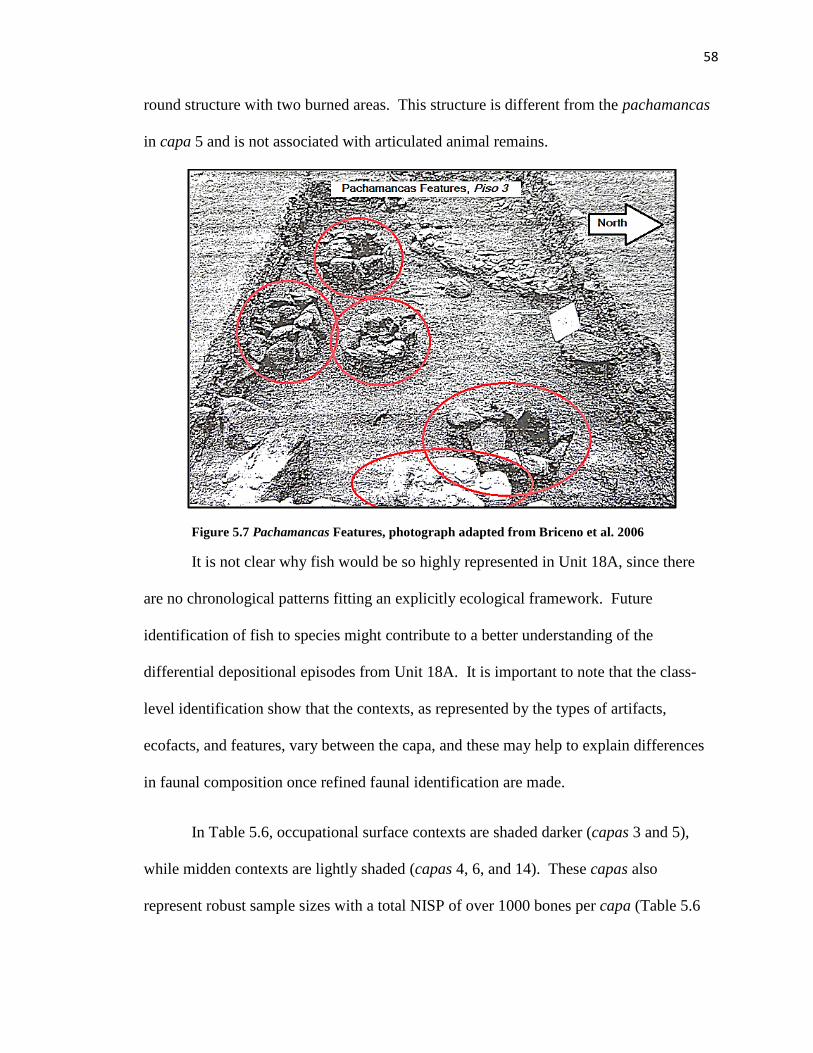
58
round structure with two burned areas. This structure is different from the pachamancas
in capa 5 and is not associated with articulated animal remains.
Figure 5.7 Pachamancas Features, photograph adapted from Briceno et al. 2006
It is not clear why fish would be so highly represented in Unit 18A, since there
are no chronological patterns fitting an explicitly ecological framework. Future
identification of fish to species might contribute to a better understanding of the
differential depositional episodes from Unit 18A. It is important to note that the class-
level identification show that the contexts, as represented by the types of artifacts,
ecofacts, and features, vary between the capa, and these may help to explain differences
in faunal composition once refined faunal identification are made.
In Table 5.6, occupational surface contexts are shaded darker (capas 3 and 5),
while midden contexts are lightly shaded (capas 4, 6, and 14). These capas also
represent robust sample sizes with a total NISP of over 1000 bones per capa (Table 5.6
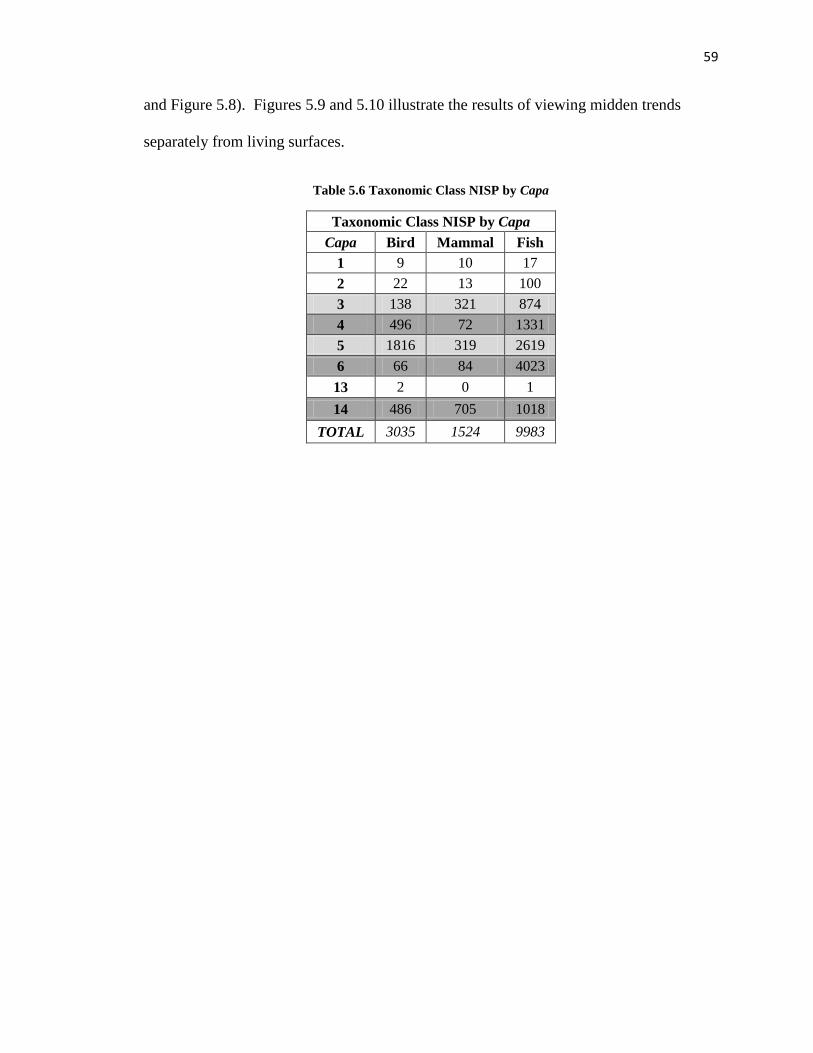
59
and Figure 5.8). Figures 5.9 and 5.10 illustrate the results of viewing midden trends
separately from living surfaces.
Table 5.6 Taxonomic Class NISP by Capa
Taxonomic Class NISP by Capa
Capa Bird Mammal Fish
1 9 10 17
2 22 13 100
3 138 321 874
4 496 72 1331
5 1816 319 2619
6 66 84 4023
13 2 0 1
14 486 705 1018
TOTAL 3035 1524 9983
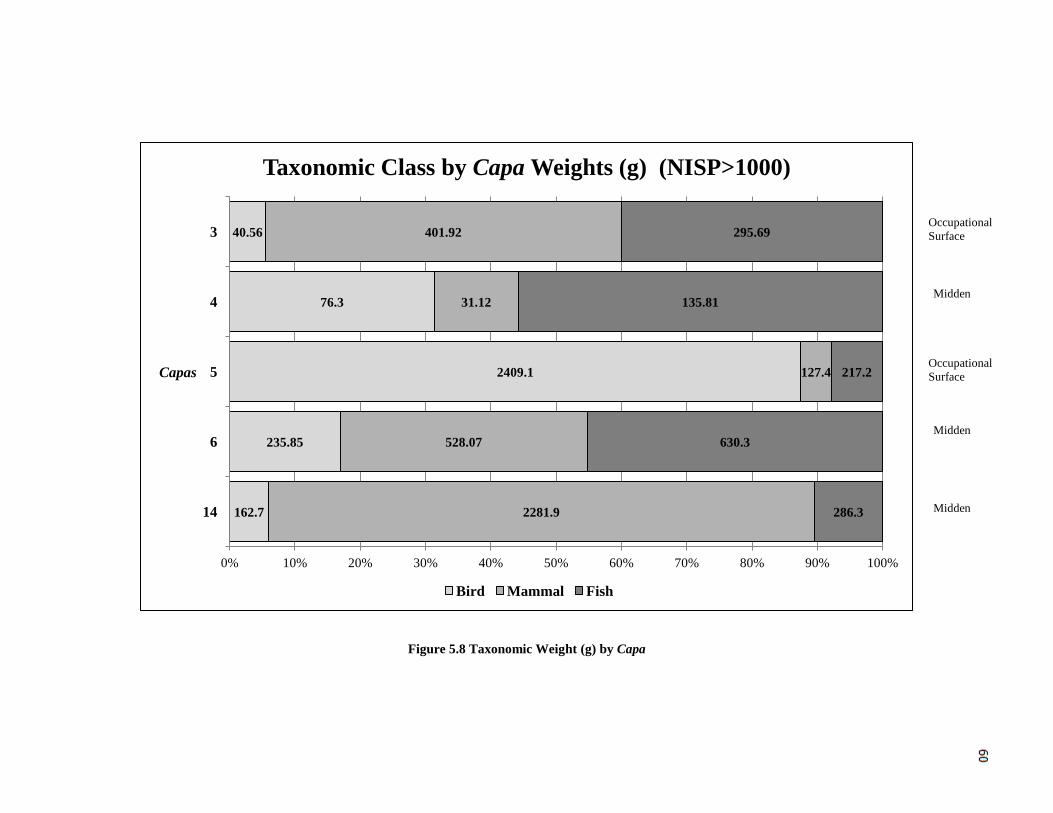
60
Figure 5.8 Taxonomic Weight (g) by Capa
162.7
235.85
2409.1
76.3
40.56
2281.9
528.07
127.4
31.12
401.92
286.3
630.3
217.2
135.81
295.69
0% 10% 20% 30% 40% 50% 60% 70% 80% 90% 100%
14
6
5
4
3
Capas
Taxonomic Class by Capa Weights (g) (NISP>1000)
Bird Mammal Fish
Occupational
Surface
Occupational
Surface
Midden
Midden
Midden
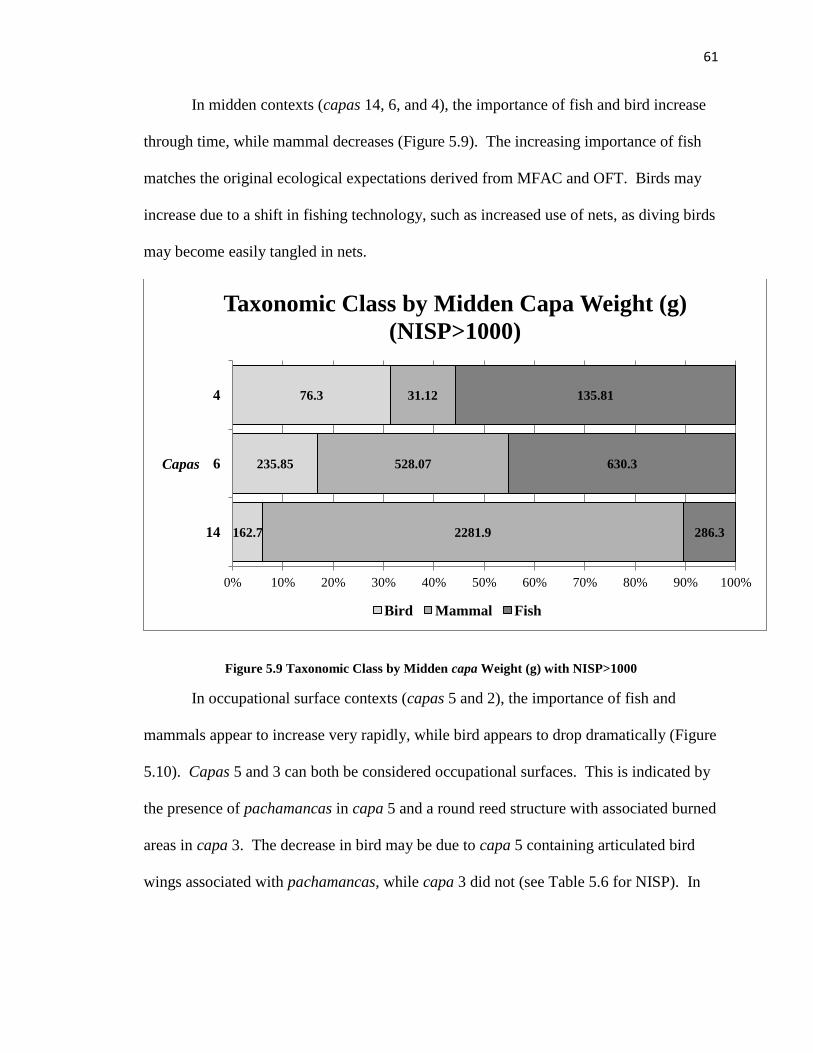
61
In midden contexts (capas 14, 6, and 4), the importance of fish and bird increase
through time, while mammal decreases (Figure 5.9). The increasing importance of fish
matches the original ecological expectations derived from MFAC and OFT. Birds may
increase due to a shift in fishing technology, such as increased use of nets, as diving birds
may become easily tangled in nets.
Figure 5.9 Taxonomic Class by Midden capa Weight (g) with NISP>1000
In occupational surface contexts (capas 5 and 2), the importance of fish and
mammals appear to increase very rapidly, while bird appears to drop dramatically (Figure
5.10). Capas 5 and 3 can both be considered occupational surfaces. This is indicated by
the presence of pachamancas in capa 5 and a round reed structure with associated burned
areas in capa 3. The decrease in bird may be due to capa 5 containing articulated bird
wings associated with pachamancas, while capa 3 did not (see Table 5.6 for NISP). In
162.7
235.85
76.3
2281.9
528.07
31.12
286.3
630.3
135.81
0% 10% 20% 30% 40% 50% 60% 70% 80% 90% 100%
14
6
4
Capas
Taxonomic Class by Midden Capa Weight (g)
(NISP>1000)
Bird Mammal Fish
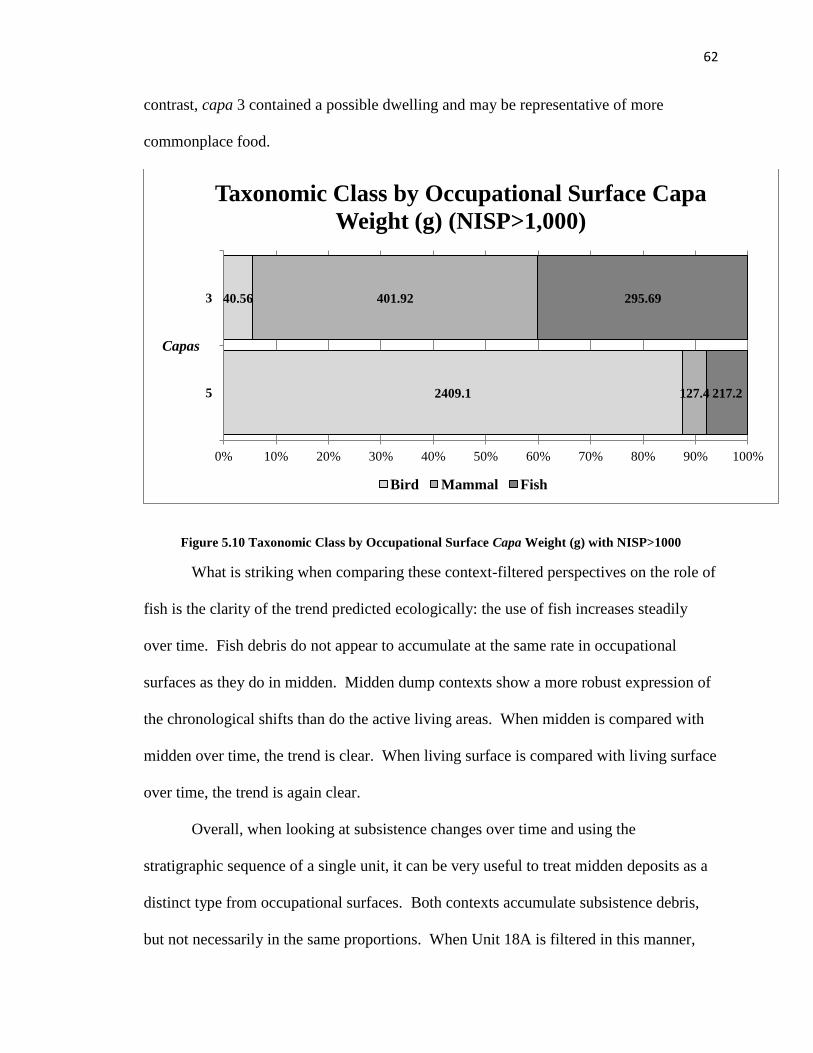
62
contrast, capa 3 contained a possible dwelling and may be representative of more
commonplace food.
Figure 5.10 Taxonomic Class by Occupational Surface Capa Weight (g) with NISP>1000
What is striking when comparing these context-filtered perspectives on the role of
fish is the clarity of the trend predicted ecologically: the use of fish increases steadily
over time. Fish debris do not appear to accumulate at the same rate in occupational
surfaces as they do in midden. Midden dump contexts show a more robust expression of
the chronological shifts than do the active living areas. When midden is compared with
midden over time, the trend is clear. When living surface is compared with living surface
over time, the trend is again clear.
Overall, when looking at subsistence changes over time and using the
stratigraphic sequence of a single unit, it can be very useful to treat midden deposits as a
distinct type from occupational surfaces. Both contexts accumulate subsistence debris,
but not necessarily in the same proportions. When Unit 18A is filtered in this manner,
2409.1
40.56
127.4
401.92
217.2
295.69
0% 10% 20% 30% 40% 50% 60% 70% 80% 90% 100%
5
3
Capas
Taxonomic Class by Occupational Surface Capa
Weight (g) (NISP>1,000)
Bird Mammal Fish
63
the previous sense of ambiguity in trends is removed and replaced with a consistent
increase in fish over time, at one scale in middens and another scale on living surfaces.
Summary
This project aimed to describe patterns in the Unit 18A vertebrate sample at class-
level identifications. The sample of 14,542 bones identified as fish, bird, and mammal
were compared to Pozorski’s 1976 analysis using bone weight. The comparison of bone
weight showed that while the same area of the site was excavated, the 2005 assemblage
as a whole ranks fish lower (20.13%) than the 1976 assemblage (47.31%). This
discrepancy illustrates the necessity for class-level data to be chronologically
contextualized to evaluate subsistence emphases. Pozorski’s work remains significant in
regional comparisons and longer temporal analyses for the Moche Valley and the
Northern Peruvian Coast. The Briceño and Billman 2005 sample analyzed here adds to
our understanding with its focus on chronological change during the Initial Period and
attention to depositional contexts.
Subsistence shifts among vertebrates were evaluated against expectations from an
ecological framework (OFT and MFAC) which proposed increasing reliance on fish
throughout the Initial Period. Overall, this pattern was not seen until midden and
occupational surfaces were compared separately. The initial ambiguity in chronological
vertebrate representation (NISP) and dietary significance (bone weight) was then
eliminated; fish increased to different degrees among midden and occupational surfaces
through time. This shows the significance of considering cultural and depositional
context in addition to ecological parameters when interpreting subsistence strategies
within stratigraphic units.
64
CHAPTER 6: CONCLUSIONS
The stratified dataset from Gramalote allowed the study of temporal shifts in fish
utilization during the Initial Period.
Previous studies (Billman 1996; Moseley 1974; Haas and Creamer 2006; Pozorski
and Pozorski 2006) have suggested that an overall sedentary lifeway along the coast and
the increase of agricultural communities inland may have led to a modification of
established marine resource management. During this analysis, the overarching goal of
quantifying fish exploitation through time was considered from an ecological perspective
(OFT and MFAC).
The coast of Peru has an arid climate and there is a long history of prehistoric
occupation. During the preceding Late Preceramic Period, coastal sites show an increase
in site settlement planning and a continuation of plant cultivation with a sustained
reliance on marine resources (Pozorski and Pozorski 1990, 2005; Moseley 2001; Quilter
1991; Wilson 1999). U-shaped architectural complexes developed and continued into the
Initial Period (Burger 1989; Moseley 2001; Quilter 1991). During the Initial Period,
there was an increase in residential sites inland from the coast associated with the
appearance of ceramics and increasing evidence of irrigation agriculture.
The arid terrestrial ecosystem is juxtaposed with a rich marine ecosystem,
providing the ecological structure for one of the richest fisheries in the world (Moseley
2001; Sandweiss and Keefer 2004; Wilson 1991). MFAC suggests that given this rich
marine ecosystem, prehistoric groups had the potential to maintain stable populations
through the exploitation of fisheries; reliance on agricultural surplus was not a
prerequisite for sedentism or monumental architecture. OFT predicts that groups with
such a rich marine resource base will exploit fish as an optimal resource, due to the high
65
returns with low costs for procurement, year-round availability, abundance, and
clustering.
In quantifying vertebrate resources through time, the ecological models (OFT and
MFAC) predict fish to rank highest in overall NISP and weight. While fish were well
represented in this sample, two of the original ecological expectations were not met: 1)
fish did not appear as the dominate resource in the earlier part of the Initial Period, where
marine mammals played that role; and 2) the increasing importance of fish over the span
of the Initial Period, while evidenced by the contrast between lowermost and uppermost
strata, did not appear as a smooth and steady trend. Exploration of the reasons for the
latter pattern led to a refinement of analytic approach: closer attention to the fuller ranges
of archaeological evidence for depositional context per capa, in particular the
differentiation of midden deposits form occupational surfaces. When midden deposits
are considered separately from living surface deposits, fish do show a steady increase in
importance over time, and that aspect of the original ecological expectations is
confirmed.
Mammals within occupational surfaces also increased, while they decreased in
midden contexts. These divergent patterns may be due to only two occupational surface
capas for comparison (capas 3 and 5). However, it is also likely that this difference in
mammal representation differing due in part to divergence in general discard patterns
among areas where people were actively moving (occupational surfaces) and where they
were accumulating refuse (middens).
Birds increased in midden contexts, but decreased in occupational surface. This is
likely due to differences in site area usage through time, and is possibly related to
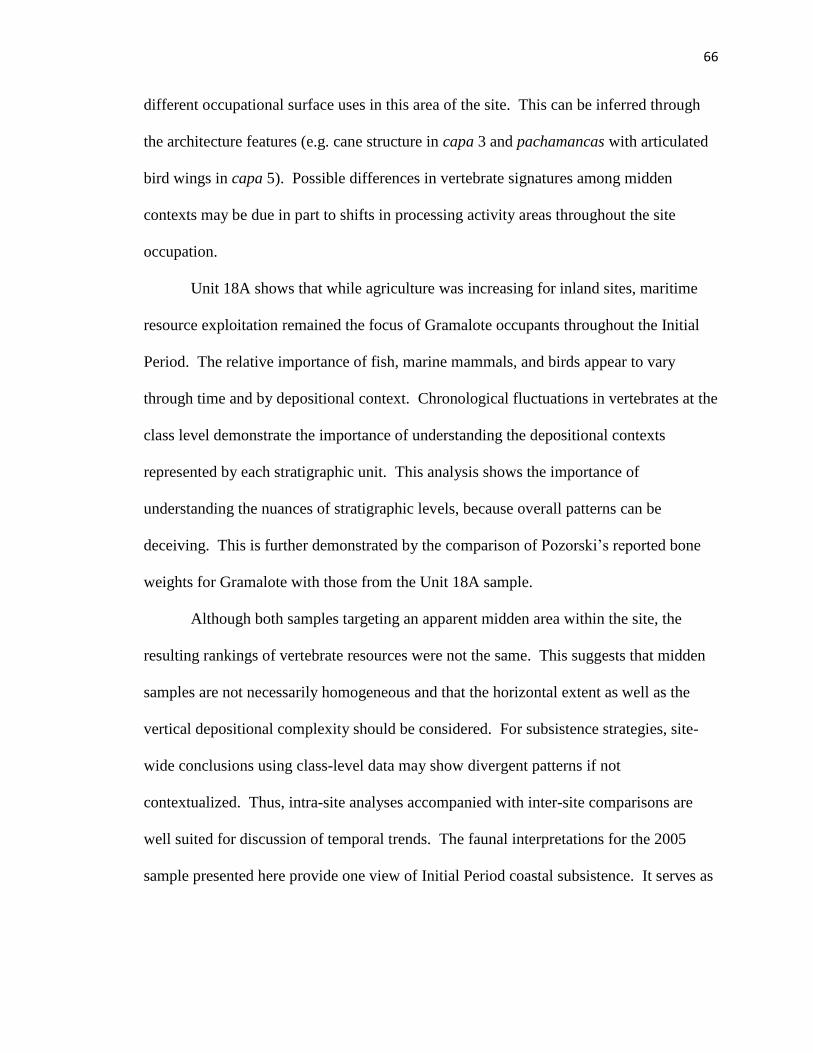
66
different occupational surface uses in this area of the site. This can be inferred through
the architecture features (e.g. cane structure in capa 3 and pachamancas with articulated
bird wings in capa 5). Possible differences in vertebrate signatures among midden
contexts may be due in part to shifts in processing activity areas throughout the site
occupation.
Unit 18A shows that while agriculture was increasing for inland sites, maritime
resource exploitation remained the focus of Gramalote occupants throughout the Initial
Period. The relative importance of fish, marine mammals, and birds appear to vary
through time and by depositional context. Chronological fluctuations in vertebrates at the
class level demonstrate the importance of understanding the depositional contexts
represented by each stratigraphic unit. This analysis shows the importance of
understanding the nuances of stratigraphic levels, because overall patterns can be
deceiving. This is further demonstrated by the comparison of Pozorski’s reported bone
weights for Gramalote with those from the Unit 18A sample.
Although both samples targeting an apparent midden area within the site, the
resulting rankings of vertebrate resources were not the same. This suggests that midden
samples are not necessarily homogeneous and that the horizontal extent as well as the
vertical depositional complexity should be considered. For subsistence strategies, site-
wide conclusions using class-level data may show divergent patterns if not
contextualized. Thus, intra-site analyses accompanied with inter-site comparisons are
well suited for discussion of temporal trends. The faunal interpretations for the 2005
sample presented here provide one view of Initial Period coastal subsistence. It serves as

67
a reference point for continued intra-site analyses for temporal lifeway and site use shifts
within the Initial Period at Gramalote.
68
REFERENCES CITED
Alheit, J. and M. Niquen
2004 Regime shifts in the Humboldt Current ecosystem. Progress in
Oceanography 60(1-2):201-222.
Bakun, A. and K. Broad
2003 Environmental 'loopholes' and fish population dynamics: comparative
pattern recognition with focus on El Nino effects in the Pacific. Fisheries
Oceanography 12(4/5):485-473.
Bawden, G. and R. Reycraft
2009 Exploration of Punctuated Equilibrium and Culture Change in the
Archaeology of Andean Ethnogenesis. In Andean Civilization; A Tribute to
Michael E. Moseley, pp. 195-210. Costen Institute of Archaeology, Los Angeles.
Billman, B. R.
1996 The Evolution of Prehistoric Political Organizations in the Moche Valley,
Peru, Anthropology, University of California, Santa Barbra.
2002 Irrigation and the origins of the southern Moche state on the north coast of
Peru. Latin American Antiquity 13(4):371-400.
Billman, B. R. and G. Huckleberry
2008 El Nino Events on the North Coast of Peru. In El Nino, catastrophism, and
culture change in ancient America: a Symposium at Dumbarton Oaks, 12th-13th
October 2002, edited by D. H. Sandweiss and J. Quilter.
Bird, D. W. and J. F. O'Connell
2006 Behavioral Ecology and Archaeology. Journal of Anthropological
Research 14:143-188.
Bird, J. B., J. Hyslop and M. D. Skinner
1985 The Preceramic Excavations at the Huaca Prieta Chicama Valley, Peru.
Anthropological Papers of the American Museum of Natural History 62: Part 1.
Bocziewicz R., Hudson J., McTavish R., Briceno Rosario J., Billman, B.
2012 Fish Utilization at Gramalote, Peru. Unpublished Poster Presented at the
Midwestern Andean and Amazonian Archaeology and Ethnohistory Conference
69
Bohle-Carbonell, M.
1989 On the Variability of the Peruvian Upwelling System. In The Peruvian
Upwelling Ecosystem: Dynamics and Interactions, edited by D. pauly, P. Muck, J.
Mendo and I. Tsukayama, pp. 14-32. vol. Proceedings of the Workshop on
Models for Yield Prediction in the Peruvian Ecosystem, August 1987, Callao,
Peru. Instituto Del Mar Del Peru (IMARPE), Callao, Peru.
Briceño, J. R., B. Billman and J. Ringberg
2006 Proyecto Arqueológico Cerro Oreja, Valle de Moche, Temporada 2005.
Informe final. Tomo I y II. informe presentado al Instituto Nacional de Cultura.
2008 Gramalote Y El Periodo Inicial En El Valle De Moche. Nuevos Datos De
Un Viejo Sito De Pescadores Tomo II y II. informe presentado al Instituto
Nacional de Cultura.
Burger, O., M. J. Hamilton and R. Walker
2005 The prey as patch model: optimal handling of resources with diminishing
returns. Journal of Archaeological Science 32:1147-1158.
Burger, R. L.
1982 Concluding remarks; early Peruvian civilization and its relation to the
Chavin horizon. In Early ceremonial architecture in the Andes; a conference at
Dumbarton Oaks, 8th to 10th October 1982, pp. 269-289.
1989 An Overview of Peruvian Archaeology (1976-1986). Annual Review of
Anthropology 18:37-69.
Carr, H. S. and A. Fradkin
2008 Animal resource use in ecological and economic context at Formative
Period Cuello, Belize. Quaternary International 191:144-153.
Cavez, F. P., R. T. Barber and M. P. Sanderson
1989 Are Potential Primary Production of the Peruvian Upwelling Ecosystem,
1953-1984. In The Peruvian Upwelling Ecosystem: Dynamics and Interactions,
edited by D. Pauly, P. Muck, J. Mendo and I. Tsukayama, pp. 50-63. Instituto Del
Mar Del Peru (IMARPE), Callao, Peru.
Chapdelaine, C.
1993 Maritime adaptations of the Saint Lawrence Iroquoians. Man in the
Northeast 45:3-19.
Creamer, W., J. Haas, E. J. III and J. Holuin
70
2011 Far From the Shore: Comparison of Marine Invertebrates in Midden
Deposits From Two Sites in the Norte Chico, Peru. The Journal of Island and
Coastal Archaeology 6(2):176-195.
DeFrance, S.
2001 Late Paleo-Indian Coastal Foragers: Specialized extractive behavior at
Quebrada Tacahuay, Peru. Latin American Antiquity 12(4):413-426.
DeFrance, S. D., N. Grayson and K. Wise
2009 Documenting 12,000 Years of Coastal Occupation on the Osmore Littoral,
Peru. Journal of Field Archaeology 34(3):227-246.
Dillehay, T., A. L. Kolta and M. P. Q.
2004 Pre-industrial human and environment interactions in northern Peru during
the late Holocene. The Holocene 14(2):272-281.
Dillehay, T., Duccio B., Goodbred S., Pino M., Vasquez, V., Rosales T., Conklin, W.,
Splitstoser, J., Piperno D., Iriarte, J., Grobman, A., Levi-Lazzaris, G., Moreira, D.,
Lopéz, M., Tung, T., Titelbaum, A., Verano, J., Adovasio, J., Cummings, L.S.,
Bearéz, P., Dufour, E., Tombret, O., Ramirez, M., Beavins, R., DeSantis, L., Rey,
I., Mink, P., Maggard, G. and Franco, T.
2012 Chronology, mound-building and environment at Huaca Prieta, coastal
Peru, from 13 700to 4000 years ago. Antiquity 86(331):48-70
Duffy, D. C.
1983 The Foraging Ecology of Peruvian Seabirds. The Auk 100(4):800-810.
Feldman, R. A.
1983 From maritime chiefdom to agricultural state in formative coastal Peru. In
Civilization in the ancient Americas; essays in honor of Gordon R. Wiley, edited
by R. M. Leventhal and A. L. Kolata, pp. 283-310. University of New Mexico
Press.
1980 Aspero, Peru: Architecture, subsistence economy, and other artifacts of a
Preceramic maritime chiefdom. PhD. Thesis, Harvard University, Cambridge,
MA.
Grayson, D. K.
1984 Quantitative Zooarchaeology, Topics in the Analysis of Archaeological
Faunas. Studies in Archaeological Science. Academic Press, Orlando.
Haas, J.
1985 Excavations on Huaca Grande: an Initial View of the Elite of Pampa
Grande, Peru. Journal of Field Archaeology 12(4):391-409.
71
Haas, J. and W. Creamer
2006 Crucible of Andean Civilization The Peruvian Coast from 3000 to 1800
B.C.. Current Anthopology 47(5):745-775.
Hildebrand, S. F.
1946 A Descriptive Catalog of the Shore Fishes of Peru. Bulletin 189. United
States Government Printing Office, Washington.
Hudson, J. L.
2004 Additional Evidence for Gourd Floats on Fishing Nets. American
Antiquity 69(3):586-587.
2010 Cultural Implications of Worked Bird Bone in Prehistoric Peru. Paper
presented at the International Council for Archaeozoology, Paris, France.
Hudson J., Bocziewicz R., McTavish R., Briceno Rosario J., Billman, B.
2012 Faunal Remains from Gramalote, Peru: Contexts and Overview.
Unpublished Poster presented at the 2012 Midwest Andean and Amazonian
Archaeology and Ethnohistory Conference.
Keatinge, R.
1988 Peruvian Prehistory: An Overview of Pre-Inca and Inca Society
Cambridge University Press.
Lyman, R. L.
1994 Quantitative Units and Terminology in Zooarchaeology. American
Antiquity 59(1):36-71.
Maliuf, P. and J. Reyes
1989 The Marine Mammals of Peru: A Review. In The Peruvian Upwelling
Ecosystem: Dynamics and Interactions, edited by D. Pauly, P. Muck, J. Mendo
and I. Tsukayama, pp. 344-362. Instituto Del Mar Del Peru (IMARPE), Callao,
Peru.
Marzloff, M., Y.-J. Shin, J. Tam, M. Travers and A. Bertrand
2009 Trophic structure of the Peruvian marine ecosystem in 2000-2006:
Insights on the effects of management scenarios for the hake fishery using the
IBM trophic model Osmose. Journal of Marine Systems 75(1-2):290-304.
Moseley, M. E.
1968 Early Peruvian fishhooks. The Masterkey:104-111.
1972 Subsistence and Demography: An Example of Interaction from Prehistoric
Peru. Southwestern Journal of Anthropology 28(1):25-49.
72
1982 Human Exploitation and Organization on the North Andean Coast. In
Chan Chan: Andean Desert City, edited by M. E. Moseley and K. C. Day, pp. 1-
24. University of New Mexico Press, Albuquerque.
1992 The Incas and Their Ancestors: The Arcaheolgy of Peru. Thames and
Hudson.
Moseley, M. E. and C. J. Mackey
1970 The Chan Chan-Moche Valley Archaeological Project, Peru. National
Geographic Society, Research Reports:413-425.
Netherly, P. J.
1984 The Management of Late Andean Irrigation Systems on the North Coast
of Peru. American Antiquity 49(2):227-254.
ONERN
1973 Inventario Evaluation y Uso Racional de los Recursos Naturales de la
Costa: Cuenca del Rio Moche 1. Oficina Nacional de Evaluation de Recursos
Naturales, Republica del Peru, Lima.
Park, Chris C.
1983 Water Resources and Irrigation Agriculture in Pre-Hispanic Peru. The
Geographic Journal. 149(2):153-166
Parsons, M. H.
1970 Preceramic Subsistence on the Peruvian Coast. American Antiquity
35(3):292-304.
Patterson, T. C. and E. P. Lanning
1964 Changing Settlement Patterns on the Central Peruvian Coast. Nawpa
Pacha 3:113-123.
Placzek, C., J. Quade, Julio L. Betancourt, P. J. Patchett, J. A. Rech, C. Latorre, A.
Matmon, C. Holmgren and N. B. English
2009 Climate in the Dry Central Andes over Geologic, Millennial, and
Interannual Timescales. Annals of the Missouri Botanical Garden 96(3):386-397.
Pozorski, S.
1976 Prehistoric Subsistence Patterns and Site Economics in the Moche Valley,
Peru, Anthropology, University of Texas, Austin.
1982 Subsistence Systems in the Chimu State, In: 1982 Edward E. Moseley and
Kent C. Day (eds.) Chan Chan: Andean Desert City, University of New Mexico
Press, Albuquerque: 177-198. In Chan Chan: Andean Desert City
73
edited by M. E. Moseley and K. C. Day, pp. 177-198. University of New Mexico
Press, Albuquerque.
Pozorski, S. and T. Pozorski
1986 Recent Excavations at Pampa de las Llamas-Moxeke, a Complex Initial
Period Site in Peru. Journal of Field Archaeology 13(4):381-401.
1979 An Early Subsistence Exchange System in the Moche Valley, Peru
Journal of Field Archaeology 6(4):413-432
2005 Early Cultural Complexity on the Coast of Peru. In: Handbook of South
American Archaeology. ed. Helaine Silverman and William Iarris Isbell
Springer.
2006 Las Haldas: An Expanding Initial Period Polity of Coastal Peru. Journal of
Anthropological Research 62(1):27-52.
Pozorski, T.
1980 The Early Horizon site of Huaca de los Teyes: societal implications.
American Antiquity 45:100-110.
1982 Early Social Stratification and Subsistence Systems: The Caballo Muerto
Complex. In Chan Chan: Andean Desert City, edited by M. E. Moseley and K. C.
Day, pp. 225-254. University of New Mexico Press, Albuquerque.
Pozorski, T. and S. Pozorski
1990 Huaynuná, a Late Cotton Preceramic Site on the North Coast of Peru.
Journal of Field Archaeology 17(1):17-26.
Prieto, O.G.
2010 Characterizing Ritual Activity in an Early Fishing Village of the Peruvian
North Coast. Unpublished paper presented at the 29th Northeast Conference on
Andean Archaeology and Ethnohistory, Saturday October 23rd, 2010.
Pyke, G. H.
1984 Optimal Foraging Theory: A Critical Review. Annual Review of Ecology
and Systematics 15:523-575.
Quilter, J.
1991 Late Preceramic Peru. Journal of World Prehistory 5(4):387-438.
Reitz, E. J.
1988 Faunal Remains from Paloma, and Archaic Site in Peru. American
Anthropologist 90(2):310-322.
74
Reitz, E. J., C. Fred, T. Andrus and D. H. Sandweiss
2008 Fisheries and Marine Ecology of Coastal Peru. In Human Impacts on
Ancient Marine Ecosystems: A Global Perspective, edited by T. C. Rick and J. M.
Erlandson, pp. 125-146. University of California Press, Berkely.
Rodgers, S. S., D. H. Sandweiss, K. A. Maasch, D. F. Belknap and P. Agouris
2004 Coastal Change and Beach Ridges along the Northwest Coast of Peru:
Image and GIS Analysis of the Chira, Piura, and Colan Beach-Ridge Plains.
Journal of Coastal Research 20(4):1102-1125.
Sandweiss, D. H.
1989 The fishermen of Chincha, Peru: An arcaheological investigation of late
prehispanic coastal specialization. (Volumes I and II), Anthropology, Cornell
University.
2003 Terminal Pleistocene through Mid-Holocene Archaeological Sites as
Paleoclimatic Archives for the Peruvian Coast. Paleogeography,
Palaeoclimatology, Palaeoecology 194:23-40.
2008 Early Fishing Societies in Western South America. In Handbook of South
American Archaeology, edited by H. Silverman and W. H. Isbell. Springer
Science and Business Media.
2009 Early Fishing and Inland Monuments, Challenging The Maritime
Foundations of Andean Civilization? In Andean Civilization; A Tribute to
Michael E. Moseley, pp. 39-54. Costen Institute of Archaeology, Los Angeles.
Sandweiss, D. H., K. A. Maasch, R. Burger, J. B. R. III, H. B. Rollins and A. Clement
2001 Variation in Holocene El Nino frequencies: Climate records and cultural
consequences in ancient Peru. Geology 29:603-606.
Sandweiss, D. H., H. B. Rollins and J. B. R. III
1983 Landscape alteration and prehistoric human occupation on the north coast
of Peru. Annals of Carnegie Museum 52(12):277-298.
Satterlee, D. R.
2001 The Miraflores El Nino disaster: convergent catastrophes and prehistoric
agrarian change in southern Peru. Andean Past 6:95-116.
Sih, A. and B. Christensen
2001 Optimal diet theory: when does it work, and when and why does it fail?
Animal Behaviour 61:379-390.
Smith, E. A.
75
1983 Anthropological Applications of Optimal Foraging Theory: A Critical
Review. Current Anthropology 24(5):625-651.
Stanish, C.
2001 Origin of State Societies in South America. Annual Review of
Anthropology 30:41-64.
Valasquez, P.
1987 Recursos Marinos y Vegetales Durante el Formativo Temprano en el Sito
de Gramalote, Sector Huanchaquito: Valle de Moche. Unpublished Thesis,
National University of Trujillo. Trujillo, Peru
Wilson, D. J.
1981 Of Maize and Men: A Critique of the Maritime Hypothesis of State
Origins on the Coast of Peru. American Anthropologist 83(1):93-120.
1999 Indigenous South Americans of the Past and Present, An Ecological
Perspective. Westview Press, Boulder, Colorado.
Zavalaga, C. B., E. Frere and P. Gandini
2002 Status of the Red-Legged Cormorant in Peru: What Factors Affect
Distribution and Numbers? Waterbirds: The International Journal of Waterbird
Biology 25(1):8-15.
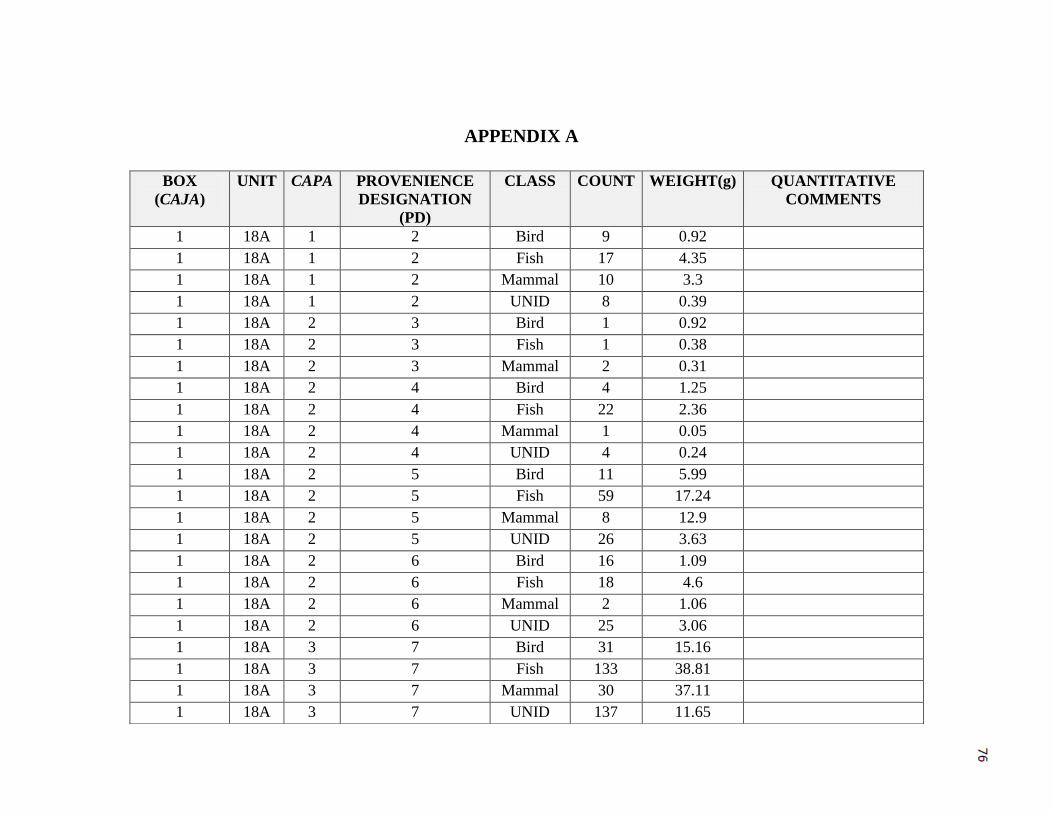
BOX
(CAJA)
UNIT CAPA PROVENIENCE
DESIGNATION
(PD)
CLASS COUNT WEIGHT(g) QUANTITATIVE
COMMENTS
1 18A 1 2 Bird 9 0.92
1 18A 1 2 Fish 17 4.35
1 18A 1 2 Mammal 10 3.3
1 18A 1 2 UNID 8 0.39
1 18A 2 3 Bird 1 0.92
1 18A 2 3 Fish 1 0.38
1 18A 2 3 Mammal 2 0.31
1 18A 2 4 Bird 4 1.25
1 18A 2 4 Fish 22 2.36
1 18A 2 4 Mammal 1 0.05
1 18A 2 4 UNID 4 0.24
1 18A 2 5 Bird 11 5.99
1 18A 2 5 Fish 59 17.24
1 18A 2 5 Mammal 8 12.9
1 18A 2 5 UNID 26 3.63
1 18A 2 6 Bird 16 1.09
1 18A 2 6 Fish 18 4.6
1 18A 2 6 Mammal 2 1.06
1 18A 2 6 UNID 25 3.06
1 18A 3 7 Bird 31 15.16
1 18A 3 7 Fish 133 38.81
1 18A 3 7 Mammal 30 37.11
1 18A 3 7 UNID 137 11.65
APPENDIX A
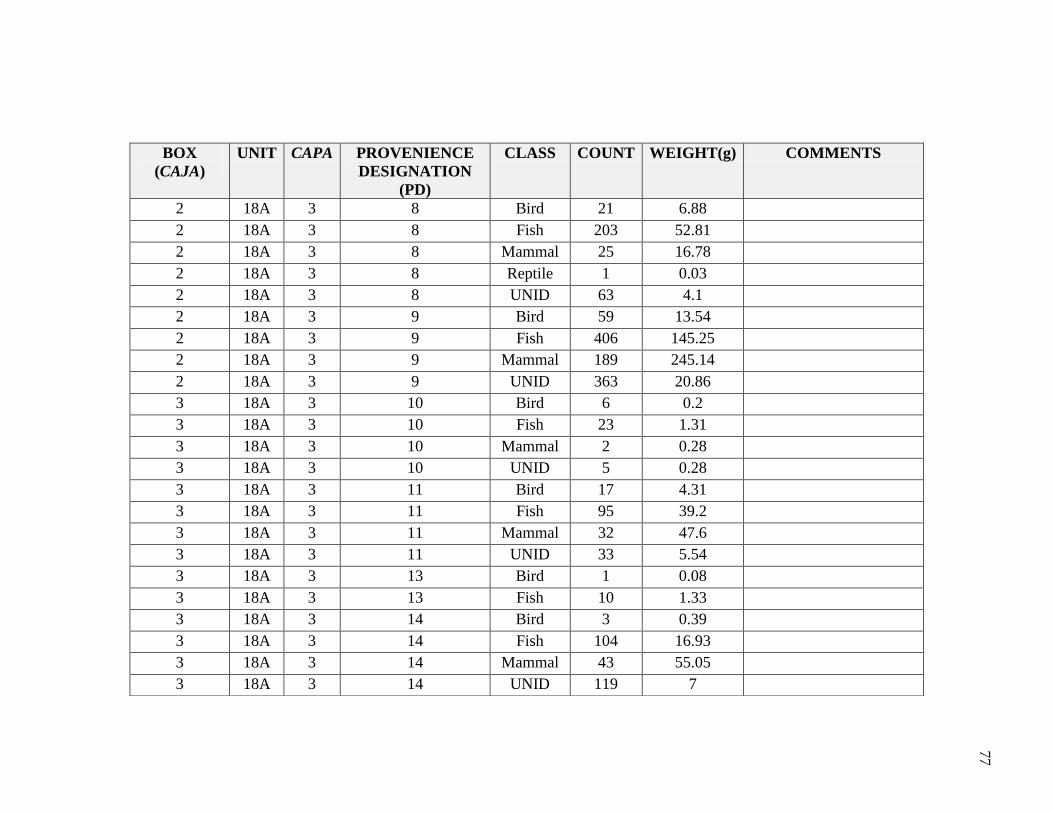
BOX
(CAJA)
UNIT CAPA PROVENIENCE
DESIGNATION
(PD)
CLASS COUNT WEIGHT(g) COMMENTS
2 18A 3 8 Bird 21 6.88
2 18A 3 8 Fish 203 52.81
2 18A 3 8 Mammal 25 16.78
2 18A 3 8 Reptile 1 0.03
2 18A 3 8 UNID 63 4.1
2 18A 3 9 Bird 59 13.54
2 18A 3 9 Fish 406 145.25
2 18A 3 9 Mammal 189 245.14
2 18A 3 9 UNID 363 20.86
3 18A 3 10 Bird 6 0.2
3 18A 3 10 Fish 23 1.31
3 18A 3 10 Mammal 2 0.28
3 18A 3 10 UNID 5 0.28
3 18A 3 11 Bird 17 4.31
3 18A 3 11 Fish 95 39.2
3 18A 3 11 Mammal 32 47.6
3 18A 3 11 UNID 33 5.54
3 18A 3 13 Bird 1 0.08
3 18A 3 13 Fish 10 1.33
3 18A 3 14 Bird 3 0.39
3 18A 3 14 Fish 104 16.93
3 18A 3 14 Mammal 43 55.05
3 18A 3 14 UNID 119 7
77
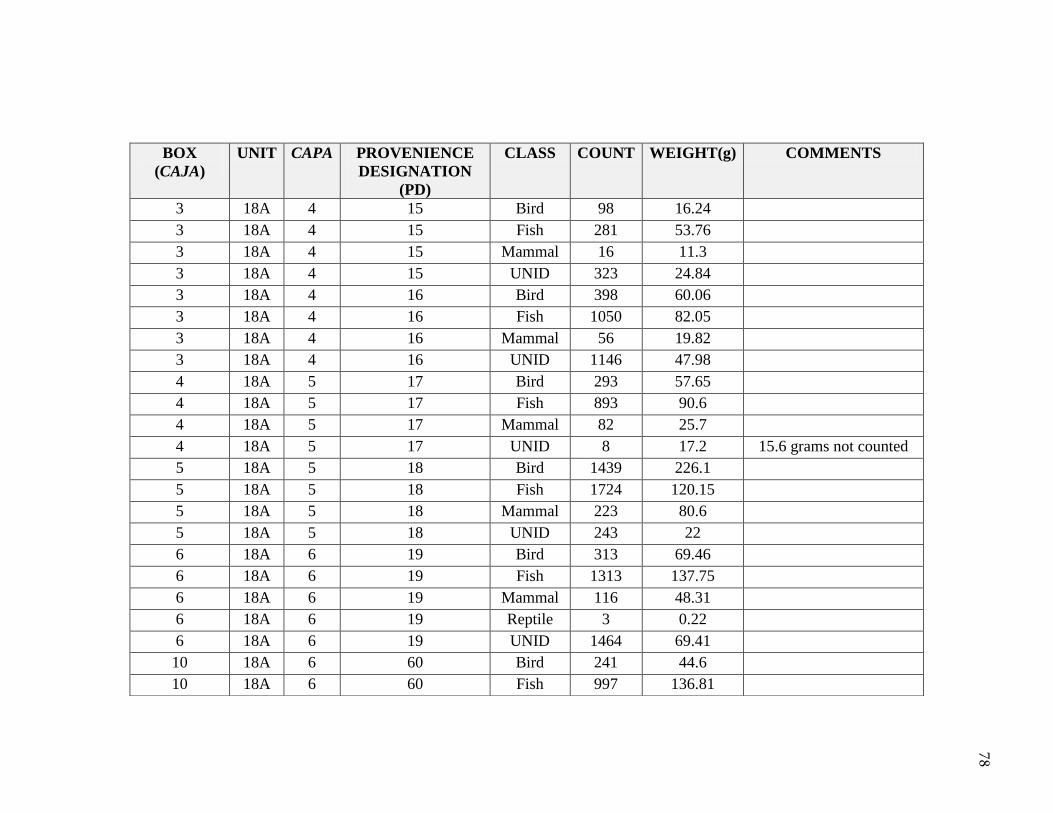
BOX
(CAJA)
UNIT CAPA PROVENIENCE
DESIGNATION
(PD)
CLASS COUNT WEIGHT(g) COMMENTS
3 18A 4 15 Bird 98 16.24
3 18A 4 15 Fish 281 53.76
3 18A 4 15 Mammal 16 11.3
3 18A 4 15 UNID 323 24.84
3 18A 4 16 Bird 398 60.06
3 18A 4 16 Fish 1050 82.05
3 18A 4 16 Mammal 56 19.82
3 18A 4 16 UNID 1146 47.98
4 18A 5 17 Bird 293 57.65
4 18A 5 17 Fish 893 90.6
4 18A 5 17 Mammal 82 25.7
4 18A 5 17 UNID 8 17.2 15.6 grams not counted
5 18A 5 18 Bird 1439 226.1
5 18A 5 18 Fish 1724 120.15
5 18A 5 18 Mammal 223 80.6
5 18A 5 18 UNID 243 22
6 18A 6 19 Bird 313 69.46
6 18A 6 19 Fish 1313 137.75
6 18A 6 19 Mammal 116 48.31
6 18A 6 19 Reptile 3 0.22
6 18A 6 19 UNID 1464 69.41
10 18A 6 60 Bird 241 44.6
10 18A 6 60 Fish 997 136.81
78
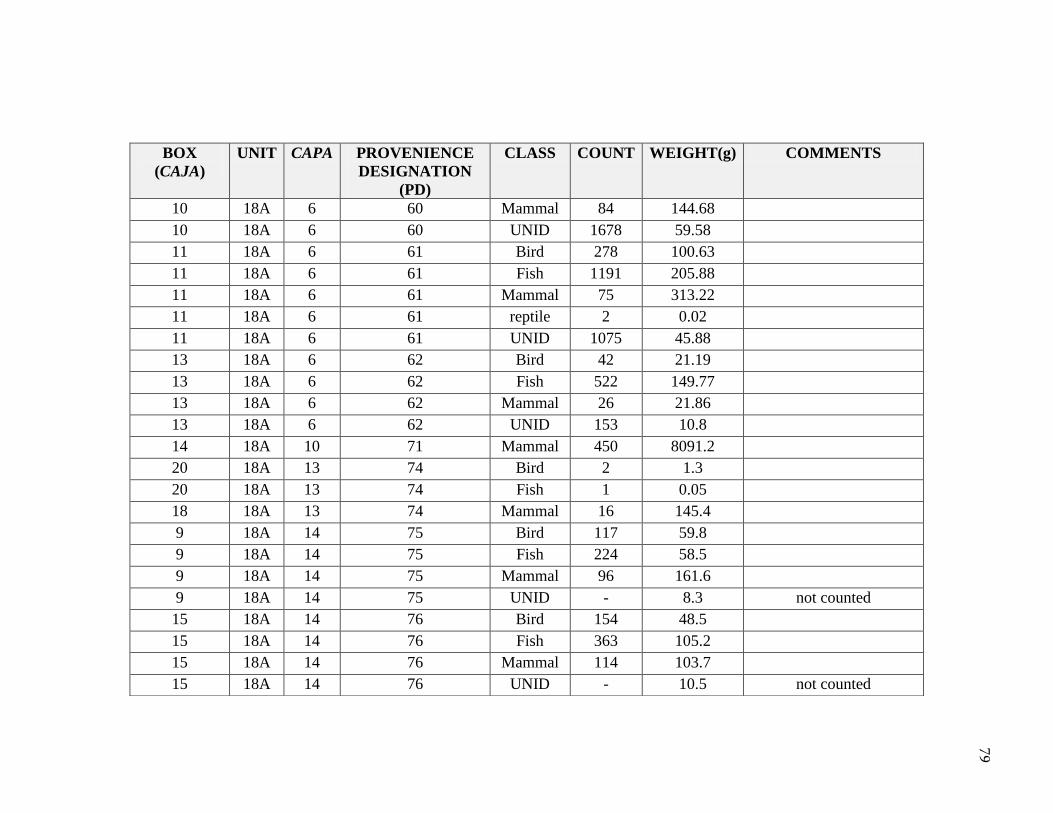
BOX
(CAJA)
UNIT CAPA PROVENIENCE
DESIGNATION
(PD)
CLASS COUNT WEIGHT(g) COMMENTS
10 18A 6 60 Mammal 84 144.68
10 18A 6 60 UNID 1678 59.58
11 18A 6 61 Bird 278 100.63
11 18A 6 61 Fish 1191 205.88
11 18A 6 61 Mammal 75 313.22
11 18A 6 61 reptile 2 0.02
11 18A 6 61 UNID 1075 45.88
13 18A 6 62 Bird 42 21.19
13 18A 6 62 Fish 522 149.77
13 18A 6 62 Mammal 26 21.86
13 18A 6 62 UNID 153 10.8
14 18A 10 71 Mammal 450 8091.2
20 18A 13 74 Bird 2 1.3
20 18A 13 74 Fish 1 0.05
18 18A 13 74 Mammal 16 145.4
9 18A 14 75 Bird 117 59.8
9 18A 14 75 Fish 224 58.5
9 18A 14 75 Mammal 96 161.6
9 18A 14 75 UNID - 8.3 not counted
15 18A 14 76 Bird 154 48.5
15 18A 14 76 Fish 363 105.2
15 18A 14 76 Mammal 114 103.7
15 18A 14 76 UNID - 10.5 not counted
79
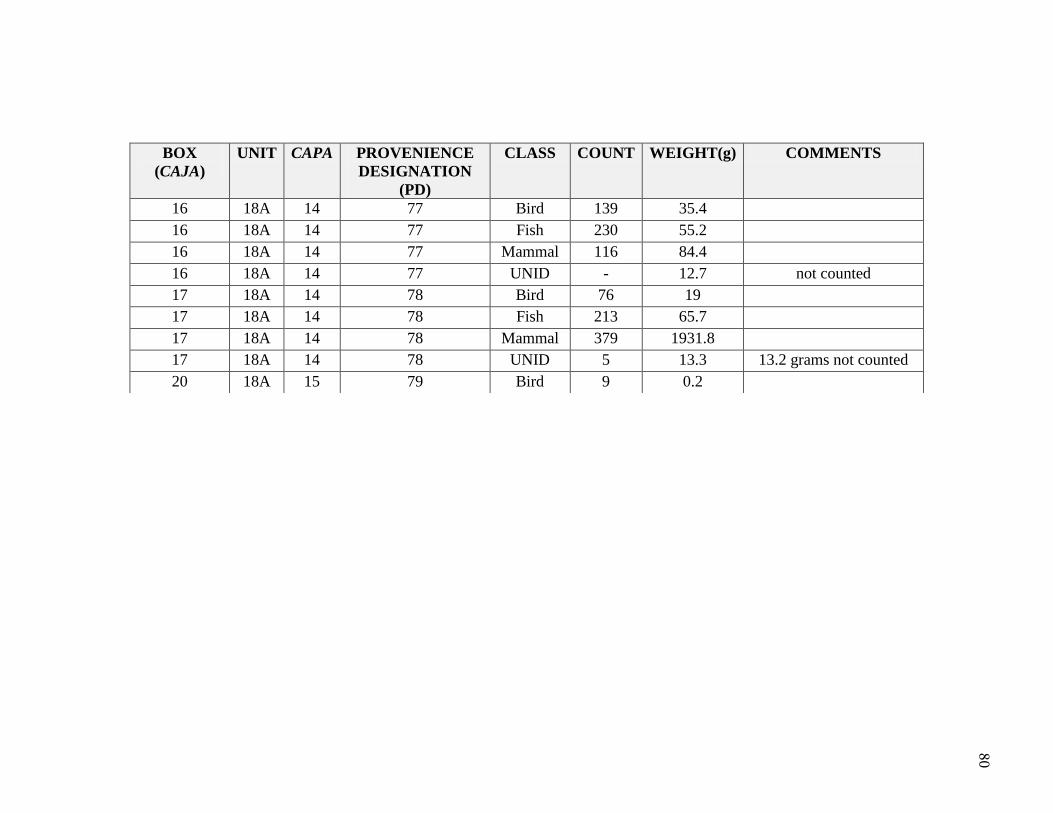
BOX
(CAJA)
UNIT CAPA PROVENIENCE
DESIGNATION
(PD)
CLASS COUNT WEIGHT(g) COMMENTS
16 18A 14 77 Bird 139 35.4
16 18A 14 77 Fish 230 55.2
16 18A 14 77 Mammal 116 84.4
16 18A 14 77 UNID - 12.7 not counted
17 18A 14 78 Bird 76 19
17 18A 14 78 Fish 213 65.7
17 18A 14 78 Mammal 379 1931.8
17 18A 14 78 UNID 5 13.3 13.2 grams not counted
20 18A 15 79 Bird 9 0.2
80
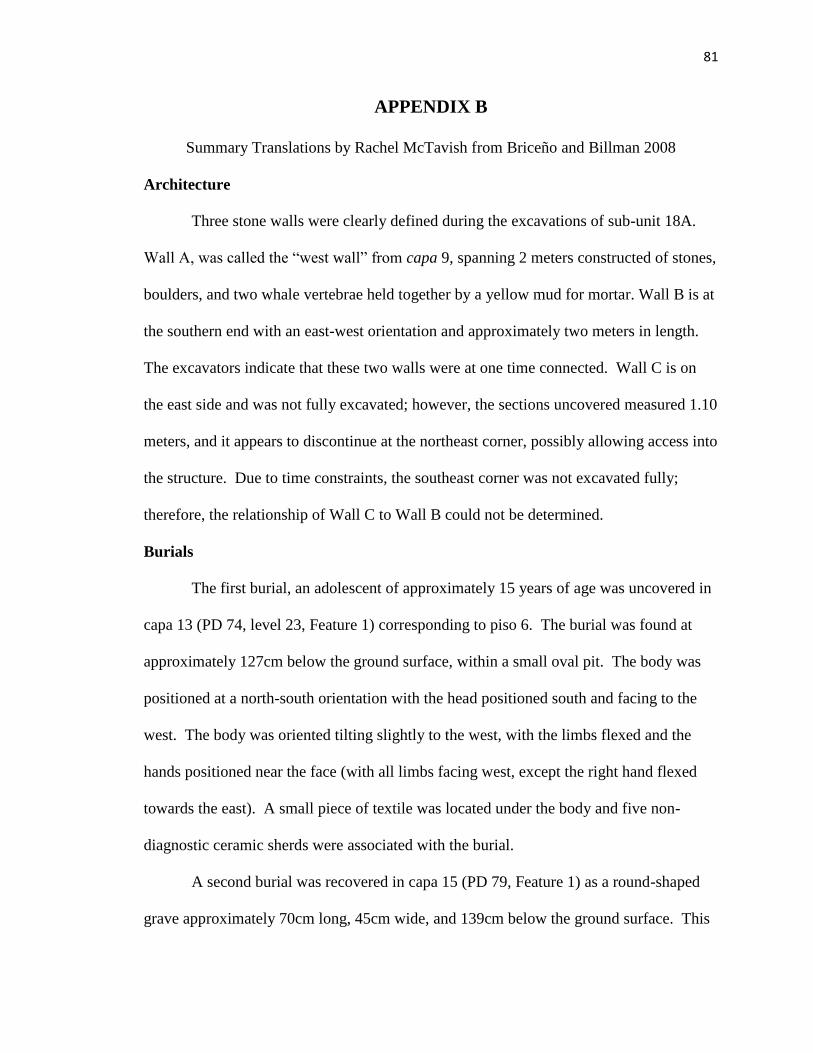
81
APPENDIX B
Summary Translations by Rachel McTavish from Briceño and Billman 2008
Architecture
Three stone walls were clearly defined during the excavations of sub-unit 18A.
Wall A, was called the “west wall” from capa 9, spanning 2 meters constructed of stones,
boulders, and two whale vertebrae held together by a yellow mud for mortar. Wall B is at
the southern end with an east-west orientation and approximately two meters in length.
The excavators indicate that these two walls were at one time connected. Wall C is on
the east side and was not fully excavated; however, the sections uncovered measured 1.10
meters, and it appears to discontinue at the northeast corner, possibly allowing access into
the structure. Due to time constraints, the southeast corner was not excavated fully;
therefore, the relationship of Wall C to Wall B could not be determined.
Burials
The first burial, an adolescent of approximately 15 years of age was uncovered in
capa 13 (PD 74, level 23, Feature 1) corresponding to piso 6. The burial was found at
approximately 127cm below the ground surface, within a small oval pit. The body was
positioned at a north-south orientation with the head positioned south and facing to the
west. The body was oriented tilting slightly to the west, with the limbs flexed and the
hands positioned near the face (with all limbs facing west, except the right hand flexed
towards the east). A small piece of textile was located under the body and five non-
diagnostic ceramic sherds were associated with the burial.
A second burial was recovered in capa 15 (PD 79, Feature 1) as a round-shaped
grave approximately 70cm long, 45cm wide, and 139cm below the ground surface. This
82
individual appears to be a child of approximately five-years of age. The body was found
in a flexed sitting position with the head tilted as though looking down at the torso facing
at an eastward direction. The hands were crossed and the lower limbs were flexed with
the feet positioned near the pelvis. There were only three diagnostic ceramic sherds
associated with the burial.