Embed Size (px)
Citation preview

APPENDIX “G” FINANCIAL TRENDS MONITORING SYSTEM
Note to the reader: The County of Henrico compiles the Financial Trend Monitoring System (Trends) annually as a means of reviewing historical financial and demographic data prior to composing the annual budget. In completing the Trends document, an extensive review of the County’s financial history over the preceding eleven fiscal years is performed using a series of twenty-eight key economic, demographic, and budgetary factors. By reviewing historical actuals over an extensive period of time, long ago forgotten financial impacts may be reviewed for validity to current economic conditions and variables. This marks the twentieth year of this financial trend analysis. Completing the Trends document is one of the first steps in Henrico County’s annual budgetary process. The findings that emerge from this review form the foundation on which budget recommendations are planned and created. The County Manager presents the final Trends Document to the Board of Supervisors prior to the recommended operating and capital budgets. This provides the Board the opportunity to undertake an extensive review of the data, allowing them to make the sort of informed and proactive decisions that have led to Henrico’s premier reputation for planning and financial management. The Trends document is included in the County’s Approved Annual Fiscal Plan to provide the reader with a historical perspective, and thus a more full understanding of the economic, demographic and financial factors that have been accounted for in the process of approving this document. What follows is a reproduction of the original Trends document that was presented by the County Manager to the Board of Supervisors on February 24, 2009.
399

THE FINANCIAL TREND MONITORING SYSTEM
Financial Condition Financial condition is broadly defined as the ability of a locality to maintain existing service levels, withstand local and regional economic disruptions, and meet the demands of natural growth, decline, and change. The ability to maintain existing service levels means more than the ability to pay for services currently being provided. It also means the ability to maintain programs in the future that are currently funded from external sources such as state or federal grants where the support is likely to diminish, and where the service cannot practically be eliminated when the funds do disappear. It also includes the ability to maintain capital facilities, such as roads and buildings, in a manner that would protect the initial investment in them and keep them in usable condition. Finally, it includes the ability to provide funds for future liabilities that may currently be unfunded, such as pension, employee leave, and debt commitments. The ability to withstand local, regional, and national economic disruptions is also important because these disruptions may have a major impact on the businesses and individuals who live and work in the locality, and therefore impact the locality's ability to generate new local tax dollars. This leads to the third component of the definition of financial condition, which is the ability to meet the future demands of change. As time passes, localities grow, shrink or stay the same size. Each condition has its own set of financial pressures. Growth, for example, can force a locality to rapidly assume new debt to finance roads and public facilities, or it can cause a sudden increase in the operating budget to provide necessary services. Shrinkage, on the other hand, leaves a locality with the same number of roads and public facilities to maintain but with fewer people to pay for them. The Financial Trend Monitoring System The Financial Trend Monitoring System (FTMS), adapted from the system developed by the International City/County Management Association (ICMA), "identifies the factors that affect financial condition and arranges them in a rational order so that they can be more easily analyzed and measured.” It is a management tool that pulls together the pertinent information from the County's budgetary and financial reports, mixes it with the appropriate economic and demographic data, and creates a series of local government financial indicators that, when plotted over a period of time, can be used to monitor changes in financial condition. The financial indicators include such things as cash liquidity, level of business activities, changes in fund balance, and external revenue dependencies. This system can also assist the Board of Supervisors in setting long-range policy priorities and can provide a logical way of introducing long-range considerations into the annual budget process. The following discussion has been developed using the ICMA manual entitled Evaluating Financial Condition, A Handbook for Local Government. The FTMS is built on twelve overall "factors" that represent the primary forces that influence financial condition (see Chart 1). These financial condition factors are then associated with twenty-eight "indicators" that measure different aspects of these factors. Once developed, these can be used to monitor changes in the factors, or more importantly, to monitor changes in financial condition. Each factor is classified as an environmental factor, an organizational factor or a financial factor. The environmental factors affect a locality in two ways. First, they create demands. Second, they provide resources. Underlying an analysis of the effect the environmental factors have on financial condition is the question: “Do they provide enough resources to pay for the demands they make?"
400

The organizational factors are the responses the government makes to changes in the environmental factors. It may be assumed in theory that any government can remain in good financial condition if it makes the proper organizational response to adverse conditions by reducing services, increasing efficiency, raising taxes, or taking some other appropriate action. This assumes that public officials have enough notice of the problem, understand its nature and magnitude, know what to do and are willing to do it. Underlying an analysis of the effects the organizational factors have on financial condition is the question: “Do legislative policies and management practices provide the opportunity to make the appropriate response to changes in the environment?" The financial factors reflect the condition of the government's internal finances. In some respects they are a result of the influence of the environmental and organizational factors. If the environment makes greater demands than resources provided and if the County is not effective in making a balanced response, the financial factors would eventually show signs of cash or budgetary problems. In analyzing the effect financial factors have on financial condition, the underlying question is: “Is government paying the full cost of operating without postponing costs to a future period when revenues may not be available to pay these costs?" Financial Indicators The financial indicators are the primary tools of the Financial Trend Monitoring System. They represent a way to quantify changes in the twelve factors. The chart on page 4 shows the twenty-eight indicators along with the factors with which they are associated. Many aspects of financial condition cannot be measured explicitly; however, by quantifying twenty-eight indicators and plotting them over a period of eleven years, decision makers can begin to monitor and evaluate the County’s financial performance. The use of these indicators will not provide answers to why a problem is occurring or what the appropriate solution is, but it may provide the opportunity to make an informed management response. How to Use This Document Twenty-eight indicators have been selected for use in monitoring Henrico County’s financial condition. They are displayed graphically on the following pages. These indicators were chosen based upon the availability of data and their appropriateness for Henrico County. The indicators selected are grouped by the seven financial factors as illustrated on page 4. The remainder of this document, in fact, is structured into seven sections, one for each of the seven factors. Appendix A provides the raw data used to develop the graphs. Appendix B provides a list of the Economic Data Sources used in the analysis.
401
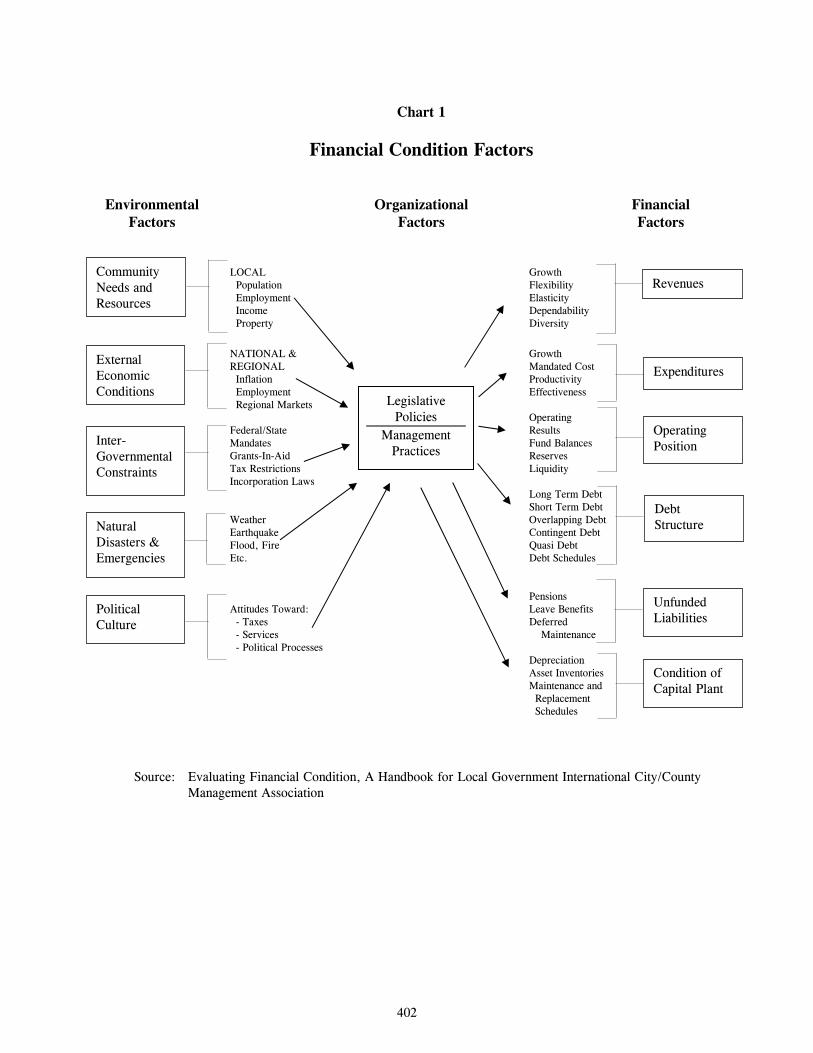
Chart 1
Financial Condition Factors
Environmental Organizational Financial Factors Factors Factors LOCAL Growth Population Flexibility Employment Elasticity Income Dependability Property Diversity
NATIONAL & Growth REGIONAL Mandated Cost Inflation Productivity Employment Effectiveness Regional Markets Operating Federal/State Results Mandates Fund Balances Grants-In-Aid Reserves Tax Restrictions Liquidity Incorporation Laws Long Term Debt Short Term Debt Weather Overlapping Debt Earthquake Contingent Debt Flood, Fire Quasi Debt Etc. Debt Schedules Pensions Attitudes Toward: Leave Benefits - Taxes Deferred - Services Maintenance - Political Processes Depreciation Asset Inventories Maintenance and Replacement Schedules Source: Evaluating Financial Condition, A Handbook for Local Government International City/County
Management Association
Community Needs and Resources
External Economic Conditions
Inter- Governmental Constraints
Natural Disasters & Emergencies
Political Culture
Revenues
Expenditures
Operating Position
Debt Structure
Unfunded Liabilities
Condition of Capital Plant
Legislative Policies
Management Practices
402

FINANCIAL INDICATORS
REVENUES DEBT STRUCTURE Revenues Per Capita Current Liabilities Intergovernmental Revenues Long-Term Debt Elastic Operating Revenues Debt Service General Property Tax Revenues Uncollected Current Property Taxes EMPLOYEE LEAVE User Charge Coverage Accumulated Vacation Leave Revenue Shortfalls
CONDITION OF CAPITAL PLANT EXPENDITURES Level of Capital Outlay
Expenditures Per Capita Depreciation Employees Per Capita Fringe Benefits COMMUNITY NEEDS & RESOURCES
Population OPERATING POSITION Per Capita Income
Operating Surpluses Public Assistance Recipients Enterprise Losses Real Property Values General Fund Unrestricted Balances Residential Development Liquidity Employment Base
Business Activity - Local Retail Sales Tax Receipts and Business License Tax Receipts
Business Activity - Commercial Acres and Market Value of Business Property
403
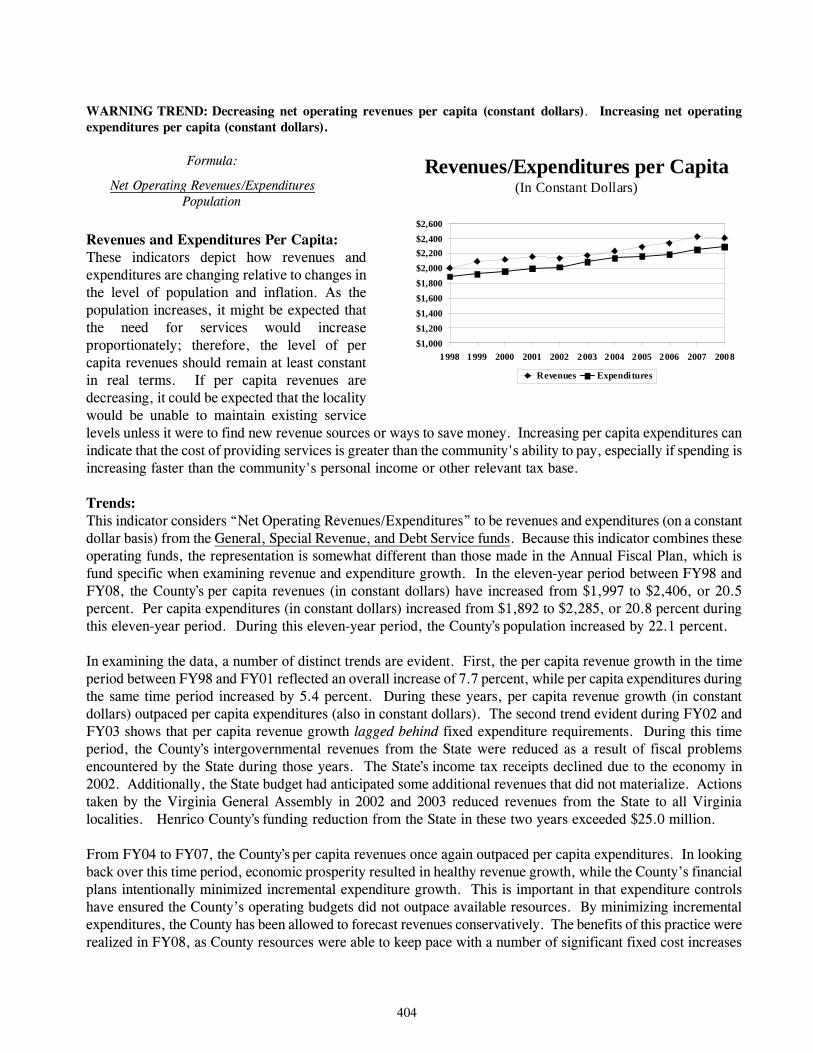
WARNING TREND: Decreasing net operating revenues per capita (constant dollars). Increasing net operating expenditures per capita (constant dollars). Formula: Net Operating Revenues/Expenditures Population Revenues and Expenditures Per Capita: These indicators depict how revenues and expenditures are changing relative to changes in the level of population and inflation. As the population increases, it might be expected that the need for services would increase proportionately; therefore, the level of per capita revenues should remain at least constant in real terms. If per capita revenues are decreasing, it could be expected that the locality would be unable to maintain existing service levels unless it were to find new revenue sources or ways to save money. Increasing per capita expenditures can indicate that the cost of providing services is greater than the community's ability to pay, especially if spending is increasing faster than the community's personal income or other relevant tax base. Trends: This indicator considers “Net Operating Revenues/Expenditures” to be revenues and expenditures (on a constant dollar basis) from the General, Special Revenue, and Debt Service funds. Because this indicator combines these operating funds, the representation is somewhat different than those made in the Annual Fiscal Plan, which is fund specific when examining revenue and expenditure growth. In the eleven-year period between FY98 and FY08, the County’s per capita revenues (in constant dollars) have increased from $1,997 to $2,406, or 20.5 percent. Per capita expenditures (in constant dollars) increased from $1,892 to $2,285, or 20.8 percent during this eleven-year period. During this eleven-year period, the County’s population increased by 22.1 percent. In examining the data, a number of distinct trends are evident. First, the per capita revenue growth in the time period between FY98 and FY01 reflected an overall increase of 7.7 percent, while per capita expenditures during the same time period increased by 5.4 percent. During these years, per capita revenue growth (in constant dollars) outpaced per capita expenditures (also in constant dollars). The second trend evident during FY02 and FY03 shows that per capita revenue growth lagged behind fixed expenditure requirements. During this time period, the County’s intergovernmental revenues from the State were reduced as a result of fiscal problems encountered by the State during those years. The State’s income tax receipts declined due to the economy in 2002. Additionally, the State budget had anticipated some additional revenues that did not materialize. Actions taken by the Virginia General Assembly in 2002 and 2003 reduced revenues from the State to all Virginia localities. Henrico County’s funding reduction from the State in these two years exceeded $25.0 million. From FY04 to FY07, the County’s per capita revenues once again outpaced per capita expenditures. In looking back over this time period, economic prosperity resulted in healthy revenue growth, while the County’s financial plans intentionally minimized incremental expenditure growth. This is important in that expenditure controls have ensured the County’s operating budgets did not outpace available resources. By minimizing incremental expenditures, the County has been allowed to forecast revenues conservatively. The benefits of this practice were realized in FY08, as County resources were able to keep pace with a number of significant fixed cost increases
Revenues/Expenditures per Capita(In Constant Dollars)
$1,000$1,200$1,400$1,600$1,800$2,000$2,200$2,400$2,600
1998 1999 2000 2001 2002 2003 2004 2005 2006 2007 2008
Revenues Expendi tures
404

despite a slowing economy and accompanying slowing revenue growth. Per capita revenues in FY08 declined for the first time since the last economic recession in FY02. On the expense side, fixed costs increased significantly, mostly due to soaring energy prices - notably the costs of gasoline, diesel fuel, electricity, and heating costs (natural gas). With per capita revenues declining and per capita expenditures rising, FY08 experienced the largest percentage margin of per capita expenditure growth to per capita revenue growth since FY91. The County of Henrico continues to prepare multi-year financial plans that factor in infrastructure and operating requirements for an increasing population. Both the capital and operating budgets are cross-walked annually to ensure that all known costs of operations are recognized. Before the County issues any debt, a full debt affordability analysis is undertaken. Finally, both the Henrico County School Board and the Henrico County Board of Supervisors have agreed to a long-term financing plan that is able to phase in $586.3 million in debt ($237.0 million authorized in the November, 2000 General Obligation Bond Referendum and $349.3 million in debt authorized in the March, 2005 General Obligation Bond Referendum) by controlling incremental expenditure growth for continuing operations at a maximum of 5.0 percent. In examining this indicator over this eleven-year period, in spite of fluctuations in the economy and State aid, the overall trend for this indicator shows that Henrico County has a consistent history of meeting current expenditure requirements with current revenues and has avoided the use of one-time revenues in meeting fixed operating expenditures. At this writing, the State is projecting a budget shortfall in excess of $4.0 billion in its $77 billion biennial budget for 2008-10 (includes an additional $800 million shortfall announced by Governor Kaine on February 16, 2009). This shortfall has already resulted in a reduction in State aid to the County of $1.5 million in FY2008-09. Since this cut was made, the State’s budget shortfall has worsened, and at this time it is unknown exactly how this shortfall will be addressed, though it is certain to result in significant additional cuts in State aid to the County. State aid accounts for over one third of the County’s General Fund budgeted revenues in the current fiscal year, FY2008-09. To address these anticipated funding reductions, Henrico County will seek to further cut back expenditures in the current fiscal year and next fiscal year, FY2009-10. A warning trend is noted for this indicator in the near term, specific to anticipated deep cuts in aid to localities due to the State’s budget shortfall.
405

WARNING TREND: Increasing amount of intergovernmental operating revenues as a percentage of gross operating revenues. Formula: Intergovernmental Operating Revenues Gross Operating Revenues Intergovernmental Revenues: Intergovernmental revenues are those revenues received from other governmental entities. The sources of intergovernmental revenue in Henrico County include revenue from the Commonwealth of Virginia and the Federal Government. For example, in the General Fund the County receives a portion of the State Gasoline Tax revenue it generates for street maintenance and construction, as well as State and Federal revenue for schools, social services and a partial reimbursement from the State Compensation Board for salaries and office expenses for Constitutional Officers. In the Special Revenue Fund, the County receives State and Federal revenue for various grant programs for schools, mental health and public safety. Much of this intergovernmental revenue is restricted revenue, and therefore legally earmarked for a specific use as required by State and Federal law or grant requirements. Beginning in 1999, personal property tax payments paid by the State under the Personal Property Tax Relief Act (PPTRA) have been classified as intergovernmental revenues even though the assessment function is performed at the local level. On the graph above, these PPTRA revenues appear as the top stacked bar, which was first received from the State in FY00. An over dependence on intergovernmental revenues can have an adverse impact on financial condition. The "strings" that the external source attaches to these revenues may prove too costly, especially if these conditions are changed in the future after the locality has developed a dependence on the program. In addition, the external source may withdraw the funds and leave the locality with the dilemma of cutting programs or paying for them with General Fund resources. Trends: As the graph above indicates, Henrico County’s intergovernmental revenues as a percentage of operating revenues have increased from 34.0 percent in FY98 to 42.7 percent in FY08. The peak in this indicator is FY08 and largely arises from additional State Aid for local education and the first full year of collections of HB568 Communication Sales & Use Tax. As mentioned above, the State began reimbursing localities under the PPTRA in FY00. The graph above delineates between PPTRA reimbursements and all other intergovernmental revenues. The total bars (FY00-FY08) reflect all intergovernmental revenues, while the lower stacked bars (FY00-FY08) exclude the effects of PPTRA payments. While intergovernmental revenue has increased from 34.0 percent of gross operating revenues recorded in FY98 to the FY08 level of 42.7 percent, there are three distinct patterns that need to be noted. The chart depicts an overall upward trend beginning with FY99. In FY99, State lottery funds were made available for Education and totaled $5.0 million. Unlike many localities, Henrico has used these funds exclusively for Education construction projects. This decision was based on the premise that, if in the future, the State reduced lottery funds for Education - the County’s operating budget would not be impacted in a negative manner. As such, an operational
Intergovernmental Revenues(as a % of Gross Operating Revenues)
30%
32%
34%
36%
38%
40%
42%
44%
1998 1999 2000 2001 2002 2003 2004 2005 2006 2007 2008
406

dependence has not been created for this revenue source. That decision proved correct in FY03, as the State reduced lottery proceeds to Henrico County by nearly $1.0 million. Governor Tim Kaine, in his proposed budget amendments for FY2009-10, has replaced funding cuts to Basic Aid for Education, the largest allocation the County receives from the State, with the entirety of State lottery funds to help offset its current biennial budget shortfall. Because the County has used these proceeds exclusively for Education infrastructure as opposed to operating revenue, the impact in FY10 will be the same as in FY03, and will result in a deferral of capital projects rather than an operating reduction. It should also be noted that in FY00, House Bill 599 funds for police were “unfrozen” from levels that had remained constant since FY92. (In the eight years between FY92 and FY99, this revenue remained at a “frozen” level of $2.3 million per annum). The House Bill 599 payments were increased to $6.3 million in FY00 (based on the original House Bill 599 formula), thereby impacting this indicator. Henrico utilizes the House Bill 599 funds for operational enhancements and long-term capital projects for police. The second trend which is evident is that State Aid for all other program areas (Education, Public Safety, Jails, Constitutional Officers, Mental Health, etc) was actually reduced between FY00 and FY03 as a result of budget shortfalls at the State level during that time. That is, while total intergovernmental aid reflects an increase since FY00, the increase is largely due to PPTRA payments. In all other areas, the County actually experienced a net decrease in State aid.
While, overall, State aid looks like it is increasing since FY06, the increase is somewhat misleading. One example that depicts why these increases are misleading is legislation that replaced four local revenue sources with a monthly “revenue neutral” payment from the State Department of Taxation, known as HB568 Communication Sales & Use Tax, which became effective January 1, 2007. The following local revenue sources were replaced: Consumer Utility Tax, Cable TV Franchise Fee, Cellular Telephone Tax, and E-911 Tax. This legislation changed the distribution formula in a manner that has impacted Henrico’s receipts, as the State deducts an administrative fee from the revenue collections and redistributes the funding monthly to localities as a fixed percentage of State-wide collections, which was established by FY06 local collection levels. This is noted because it represents an example of the State’s continued forays into issues of local taxing authority. This concern of State involvement in local revenues continues to be noted as a concern, as it is a significant wildcard in the County’s multi-year financial planning efforts. As mentioned, creating a dependency on a revenue source not controlled locally may create fiscal difficulties if that revenue source is altered. This is exactly what has occurred with the PPTRA revenue paid by the State. In FY00, the Virginia General Assembly made a commitment to reimburse localities for a State tax reduction of a local revenue source (individual personal property). Since FY00, the County of Henrico has built a dependency on this revenue source and the prior six Trends documents have included a warning for this indicator. PPTRA payments since FY00 reflect the following:
407

Fiscal Year PPTRA Payment FY00 $4.3 million FY01 $25.1 million FY02 $33.9 million FY03 $33.6 million FY04 $34.1 million FY05 $33.3 million FY06 $42.1 million FY07 $37.2 million FY08 $37.0 million
From FY01 through FY07, PPTRA payments constituted between 4.0 and 5.0 percent of all intergovernmental aid received by the County. In FY08, PPTRA payments made up 3.8 percent of all intergovernmental revenues to the County. The 2003 Trends document included the following warning regarding PPTRA payments from the State:
“While the [budget] reductions above suggest a warning trend, Henrico’s largest exposure remains with Personal Property Tax reimbursements from the State, as opposed to incremental programmatic reductions in aid. That warning trend was first noted in last year’s Trends document. The PPTRA reimbursement being made to the localities represents a significant outlay of funds for the State and is now depicted as “Aid to Localities” by the State. The warning concerns possible legislation or a wish to index future PPTRA payments in some manner so that the State may be able to control the growth of these expenditures in the future. In times of budgetary unease, that may offer a simple solution for decision makers at the State level. Locally, the results of such a change would have a materially adverse affect on the County’s revenues.”
In the 2004 session of the Virginia General Assembly, the legislature did in fact make such a change to these payments – effective for FY06. The legislature capped the State’s PPTRA payments to localities at approximately $950.0 million and will use a pro-rata distribution mechanism for making these payments in the future. In essence, what that means is that Henrico’s PPTRA reimbursements from the State will remain at a level amount in the future, while the taxpayer portion will once again increase. Long term, if the State does not re-adjust these payments to localities, residents of each locality will pay more each year in Personal Property taxes and at this current writing, the State’s promise of maintaining reimbursement levels at 70.0 percent for the County’s taxpayers has slipped to 61.0 percent. The differential, of course, is being paid by the County’s taxpayers. Given the current State budget shortfall, estimated at $4.0 billion for the current biennial budget (includes an additional $800 million shortfall announced by Governor Kaine on February 16, 2009), the State could possibly initiate further legislation capping, reducing, or even eliminating specific payments to localities. In fact, in the 2008 Virginia General Assembly, the legislature eliminated two such distributions to localities: distribution of the net profits of the sale of alcoholic beverages by the ABC commission (ABC profit revenue); and tax on wine and other alcoholic beverages sold in Virginia (wine tax revenue). Other possibilities exist that would allow for the continued foray into locally collected revenues. A warning trend continues for this indicator.
408

WARNING TREND: Decreasing (or unplanned) amount of elastic operating revenues as a percentage of net operating revenues. Formula: Elastic Operating Revenues Net Operating Revenues Elastic Operating Revenues: Elastic operating revenues are those that are highly responsive to changes in the economic base and inflation. The highly elastic revenue categories used for this indicator are: local sales and use taxes; business and professional license taxes; and structure and equipment permit fees. It is to a locality's advantage to have a balance between elastic and inelastic revenues to mitigate the effects of economic growth or decline. The relationship between elastic revenues and total receipts is largely driven by consumer consumption. During an economic downturn, elastic revenues should decrease as a percentage of net operating revenues. Trends: The graph shown above indicates that the percentage of elastic tax revenues for Henrico County have decreased from a high of 12.3 percent of operating revenues in and FY98 to a low of 9.0 percent in FY08. In this time period, there have only been two actual decreases of elastic tax revenues, in FY02 and FY08, both due to periods of economic recession. The first four years reflected above, FY98 through FY01, reflected a period of economic expansion. As a result of the expansion during those years, the Board of Supervisors implemented a Business and Professional License Tax (BPOL) reduction strategy as a means of encouraging more businesses to locate in Henrico County. That strategy was first implemented by the Board of Supervisors in January 1996 and was phased in over a period of years. By January 2000, this tax reduction strategy fully exempted the first $100,000 in gross receipts from taxation for County businesses and established a uniform maximum tax rate of $.20/$100 for County businesses. While the tax reduction did impact this indicator, it has had two beneficial impacts. First, due to the phase-in of the Board’s BPOL tax reduction strategy, Henrico reduced its operating reliance on these elastic revenues prior to the actual recession of FY02. Second, commercial taxpayers do not require the same service levels as residential taxpayers, so a net benefit to the County’s revenues has been achieved by attracting more businesses to Henrico. A recent synopsis of these receipts is warranted. In FY02, due to the effects of the recession, elastic revenues actually declined from the $71.4 million recorded the prior fiscal year to $69.0 million. In FY03, the County’s elastic revenues increased by 6.3 percent. In FY04, these revenues increased by another 1.6 percent and FY05 actual receipts increased by 6.3 percent. FY06 data reflects receipts of $85.2 million, which is a 7.6 percent increase over FY05. FY07 data reflects receipts of $89.3 million which is a 4.8 percent increase over the prior fiscal year. The most recent FY08 data reflects only the second year-over-year decline in receipts in this time period, with collections of $87.6 million, which is a 1.9 percent decrease from the prior fiscal year. The reduction in gross elastic revenues reflects the downturn in the economy and the struggling housing market, as local sales & use tax
Elastic Operating Revenues(as a % of Net Operating Revenues)
8%
10%
12%
14%
1998 1999 2000 2001 2002 2003 2004 2005 2006 2007 2008
409

receipts and BPOL collections declined greater than 1.0 percent, and structure and equipment permit revenues declined nearly 17.0 percent. Despite the recent declines, over this eleven-year period, while the County has reduced its operational reliance from these elastic revenue sources, the actual revenue derived from them has increased by 43.7 percent. On a positive note, Henrico County ranked second among all localities in Virginia for total taxable sales in 2007. Refer to the chart below for comparisons to other localities. As of this writing, the economic environment continues to worsen and the housing market continues to struggle. No two economists agree on how long the economic downturn will last, but what is certain is that without significant economic growth in the second half of FY09, which is highly unlikely, elastic revenues will decline once again in the current fiscal year. That being said, Henrico’s commercial sector remains strong. Because of the strong and diverse commercial sector and the County’s decreased reliance on elastic revenues, even in the face of perhaps the worst economic environment since the Great Depression, the declining elastic revenues will not significantly impact County operations in the current fiscal year. However, with it likely that the economic environment will worsen in the near term, elastic revenues are likely to continue their downward trend. As the majority of revenue sources decline, the reliance on elastic revenue receipts will increase. Therefore, a warning trend is warranted for this indicator.
2007 Virginia Taxable SalesTotal Taxable Sales are from February 1, 2007 to January 31, 2008
Per CapitalRank Locality Total Taxable Sales Taxable Sales
1 Fairfax County 13,881,490,656.78 13,709.96
2 Henrico 5,074,051,665.14 17,509.54 3 Virginia Beach 4,937,885,411.98 11,403.02 4 Prince William 4,190,609,139.65 11,266.93 5 Loudoun 4,185,298,374.65 15,186.33 6 Chesterfield 3,593,575,942.04 12,029.88 7 Chesapeake 3,235,156,673.90 14,938.28 8 Norfolk 2,888,403,404.85 12,239.70 9 Arlington 2,887,800,527.44 14,355.49
10 Richmond City 2,477,325,358.95 12,684.70 11 Newport News 2,121,689,631.75 11,627.11 12 Alexandria 2,090,141,647.35 15,286.43 13 Roanoke City 1,900,930,871.85 20,330.01 14 Hanover 1,677,157,316.60 17,189.54 15 Spotsylvania 1,408,121,720.45 11,743.48
410

WARNING TREND: Decreasing or negative growth in general property tax revenues (constant dollars). Formula: Property Tax Revenues (Constant Dollars) General Property Tax Revenues: General property tax revenues in Henrico County include both current and delinquent real and personal property tax revenue levied and collected by the County. These revenues constitute Henrico County’s largest local revenue category, representing 63.7 percent of total local operating revenue in Henrico County in FY08. It should be noted that beginning with FY99, the State’s reimbursements of personal property tax revenues have been recorded as “intergovernmental” revenue. That is to say, the PPTRA revenue is not reflected on this indicator. This indicator does capture the “local” component of personal property – including the machinery and tools tax. Trends: Henrico County has experienced a healthy increase in general property tax revenues over the last eleven years. In unadjusted dollars, general property tax revenue has increased from $198.4 million in FY98 to $368.0 million in FY08. This represents an average annual increase of 6.5 percent in this eleven-year period. Henrico’s strong local economy and community of choice designation for new area residents and businesses have had a positive impact on the County’s real property assessed valuations. During the past eleven years, between CY98 and CY08, the County’s unadjusted real estate tax base has increased by $21.2 billion. In this eleven year time period, it should also be noted that when looking at these property tax revenues and comparing them to total net revenues, a revealing pattern emerges. In FY98, property tax revenues constituted 40.1 percent of net operating revenues, which includes intergovernmental revenues. By FY05, this percentage had dropped to 36.1 percent. FY05 year’s Trends document included the following observation: “The reduction arises as a result of other revenue sources, specifically, intergovernmental aid that has increased in this time period. As noted earlier on the “Intergovernmental Revenues” indicator, there was a notable increase in intergovernmental aid beginning in FY99. However, with the capping of the PPTRA payments from the State beginning in FY06, it is likely that property tax revenues as a percent of total operating revenues will increase in the future again”. In FY06, property tax revenues actually represented 36.9 percent of net revenues, reflecting an increase over the prior fiscal year. In FY07 property tax revenue stayed constant with the prior year, representing 37.0 percent of net operating revenues. In the most recent fiscal year, FY08, property tax revenues increased again, to 37.7 percent of net revenues. While it is too early to use this data as representative of a trend, concern is noted as State aid to localities is expected to be reduced significantly in the coming fiscal year, FY2009-10, in an effort to make up its budget shortfall in the current biennial budget. This is in addition to changes already enacted through
General Property Tax Revenue(In Constant Dollars)
$150,000
$175,000
$200,000
$225,000
$250,000
$275,000
$300,000
1998 1999 2000 2001 2002 2003 2004 2005 2006 2007 2008
Thousands
411

the PPTRA legislation. Each of these points of emphasis will increase the County’s reliance on property tax revenues. Another observation from the graph on the prior page is the “leveling off” of general property tax revenue (in constant dollars) in the most recent fiscal year, FY08. This is directly reflective of the downturn in the economy and the continued struggle of the housing market. General property tax revenue, adjusted for inflation (in constant dollars) grew at 2.2 percent in FY08, the lowest growth since the final phase-in of the State PPTRA initiative in FY01. There are several statistics in reference to property tax revenue collections in FY08 that are worthy of note. Residential reassessments increased 2.6 percent, the lowest year-over-year increment since 1995. Total car registrations in the County were down 7.2 percent from the prior fiscal year (new car registrations were down 8.3 percent and used car registrations were down 6.9 percent), as individuals have begun to keep their vehicles longer. Overall, the continued growth of the County’s total tax base over this time period is a very positive trend, however there is no doubt that the recent nationwide concerns regarding the solvency of residential mortgages has impacted the real estate market. The national decline in sales prices has not been as severe in Henrico County, although there has definitely been an impact. Also, a number of large commercial projects are currently underway Countywide. It is anticipated that this new commercial construction will help offset residential and commercial real estate valuation declines in the near term. However, with the real estate market continuing to struggle and a growing number of vacant commercial properties Countywide, a warning trend is noted for the immediate future.
412

WARNING TREND: Increasing amount of current uncollected property taxes as a percentage of the current total property tax levy. Formula: Uncollected Current Property Taxes Current Property Tax Levy Uncollected Current Property Taxes: Every year a certain percentage of current real and personal property taxes go uncollected because property owners are unable to pay them. As this percentage increases over time, it may be an indication of an overall decline in a locality's economic health. Bond rating agencies consider that a locality will normally be unable to collect between 2.0 to 3.0 percent of its property tax levy each year. If uncollected property taxes rise to more than 5.0 percent, rating agencies consider this to be a negative indicator that signals potential problems in the stability of the property tax base or is indicative of systemic problems with local tax collection efforts.
Trends: As the graph above indicates, for this eleven-year period, Henrico County's percentage of current uncollected real and personal property taxes has ranged from 1.1 percent in FY98 to the most recent level of 0.5 percent recorded in FY08. The high point in this time period was in FY00, when uncollected real and personal property taxes totaled 2.9 percent of the property taxes levied. In looking at this indicator, a consistency in collections on the part of the County is depicted, as the range on the graph is within expected parameters. In the past several years, significant enhancements were made in the collection of delinquent real estate taxes. This, in part, can be attributed to Henrico’s commitment to improving customer service by streamlining collection procedures and increasing payment options for County residents. In this time period, Henrico has implemented acceptance of payments by credit card over the telephone and via the internet, implemented acceptance of payments by debit card in person, instituted a monthly debit program for personal and real property tax payments, continued to be more timely in collecting delinquent taxes and enhanced its collection processes. The results of these efforts can clearly be seen above. Between FY02 and FY05, this indicator measured at 0.6 percent before the most recent results of 0.5 percent were recorded.
One ancillary fact that needs to be mentioned is that the County’s top ten “Principal Taxpayers” continues to constitute a large percentage of the tax base. In FY08, these ten “Principal Taxpayers” comprised 8.8 percent of the County’s tax base. Closer examination of the ten “Principal Taxpayers” is indicative of the diversity found in Henrico’s local economy. The list includes utilities, warehouses, office space, apartment property management companies, and retail establishments. This is an important note for this indicator due to the fact that collections of current taxes from the “Principle Taxpayers” of a locality are generally made in the year they are due.
In looking at this indicator over the eleven-year time period, a peak is depicted in FY00. However, even at its peak, uncollected current property taxes as a percent of the total levy measured 3.0 percent, well below the 5.0 percent level that Bond Rating agencies consider negative.
Uncollected Current Property Taxes (as a % of Total Levy)
0%
1%
2%
3%
4%
5%
1998 1999 2000 2001 2002 2003 2004 2005 2006 2007 2008
413

Due to enhancements made in the collections area in the past several years, it is not anticipated that this indicator will be negatively affected in the next several years. No long term warning trend is noted for this indicator, though the current recessionary economic environment may be a factor in the number of uncollected taxes in the immediate future.
414

WARNING TREND: Decreasing revenues from user charges as a percentage of total expenditures for providing related service. Formula: Revenues from User Charges Expenditures for Related Services User Charge Coverage: User charge coverage refers to whether or not fees and charges cover the full cost of providing a service. Henrico County charges fees for the employee cafeteria, recreation activities, and building permits in the General Fund. In the Special Revenue Fund there are fees for the school cafeteria, mental health services, street lighting, and solid waste services. As coverage declines, the burden on other revenues to support these services increases. Inflation will erode the user charge coverage if not reviewed and amended periodically. Therefore, costs and fees should be reviewed frequently to ensure that the desired level of coverage is maintained. Trends: As shown in the graph, the user charge coverage for the County has measured less than 63.0 percent for this eleven-year period, with a low of 48.0 percent occurring in the most recent fiscal year, FY08, and a high of 62.3 percent occurring in FY99. The indicator measures user coverage of seven specific expenditure areas. These are: Building Inspections, Employee Cafeteria, Mental Health, Recreation, Street Lighting, School Cafeteria and Solid Waste. In looking at the larger operational components, the user charge coverage percentages for Building Inspections has typically been sufficient to cover the activities of that department. The lone exception was in the most recent fiscal year, FY08, as user charges only covered 77.5 percent of expenditures for Building Inspections, due to a nearly 17.0 percent decline in structure and equipment permit revenues as a result of the downturn in the real estate market. Mental Health’s user charge coverage has actually increased over the eleven-year period from 35.3 percent to 39.3 percent due to third party fee payments made to that entity. The user charge coverage for Solid Waste has fluctuated, as in years where large capital expenditures are required for the landfill, operational revenues will not meet operational requirements. However, because Solid Waste has built up reserves for these occurrences, this has not impacted this operation in a negative manner. In looking at Recreation, the user charge coverage in this area has fluctuated at approximately 5.0 percent throughout this time period. Also in this eleven-year time period, the School Cafeteria has typically generated sufficient revenues to cover operational requirements. In FY08, however, this was not the case, as the School Cafeteria generated just under 85.0 percent of operational requirements, mostly due to significant increases in the cost of food. However, the School Cafeteria has increased charges for school lunches in the current fiscal year, FY09, to help offset these rising operating costs. As such, no warning trend is noted in this area. This indicator in the eleven-year period has averaged 54.5 percent. Excluding Recreation, the indicator has averaged 70.7 percent in the eleven-year period. No warning trend is noted for this indicator although the County will continue to maximize efforts to ensure coverage rates are appropriate to reduce reliance on other County revenues.
User Charge Coverage(Revenues/Expenditures)
35%
45%
55%
65%
75%
1998 1999 2000 2001 2002 2003 2004 2005 2006 2007 2008
415

WARNING TREND: Increase in revenue shortfalls as a percentage of net operating revenues. Formula: Revenue Shortfalls Net Operating Revenues Revenue Shortfalls: This financial indicator examines the differences between revenue estimates and revenues actually received. It includes revenues in the General, Special Revenue, and Debt Service funds. Major discrepancies in revenue estimates can be an indication of a declining economy, inefficient collection procedures, or inaccurate estimating techniques. On the graph above, the “0” represents the fiscal year budgeted estimates. A positive number reflects a revenue shortfall, while a negative number reflects a revenue surplus. Trends: The overall trend depicted above reveals that the County’s revenues exceeded budget estimates for each of the eleven years analyzed. In looking at this eleven-year period, this indicator peaked in FY04, when the budget to actual revenue variance reached 6.6 percent. The low points may be found in FY98 and FY03, when the variances reflected were 1.6 percent and 2.1 percent respectively. The indicator for FY08 measures 5.8 percent. In no case in this eleven-year time period did the County’s actual revenues not meet budgeted estimates. Looking at the trend since FY98, the County’s annual revenue variance has averaged 3.7 percent. The County of Henrico maintains a conservative posture when projecting revenues on an annual basis. In FY02 and FY03, the County experienced significant reductions in aid from the State of Virginia in a myriad of areas – the largest being Education. These reductions were the result of State budget shortfalls that came about due to the recession in 2001. By maintaining a conservative posture in the projection of revenues, the County was able to weather both the recession and maintain service levels in key areas, such as Education and Public Safety while continuing to expand needed infrastructure. As noted earlier, the County’s reliance on elastic revenues has decreased over the past eleven years and in the pages that follow, a depiction of the County’s fund balance is positive. Because of the initiatives established by the Board of Supervisors over this time span - notably the capping of annual incremental expenditure growth and the decreasing reliance on elastic revenues - despite a struggling economy, the County has the ability to continue to maintain a conservative revenue posture in the future as a means of ensuring operational and financial stability. In fact, in spite of the recessionary economic environment in FY08, the budget to actual revenue variance of 5.8 percent reflects the second highest level in this eleven-year period, only behind FY04, the first fiscal year after the last economic recession. No warning trend is noted for this indicator.
Revenue Shortfalls(as a % of Net Operating Revenues)
-8%
-6%
-4%
-2%
0%
2%
4%
1998 1999 2000 2001 2002 2003 2004 2005 2006 2007 2008
416
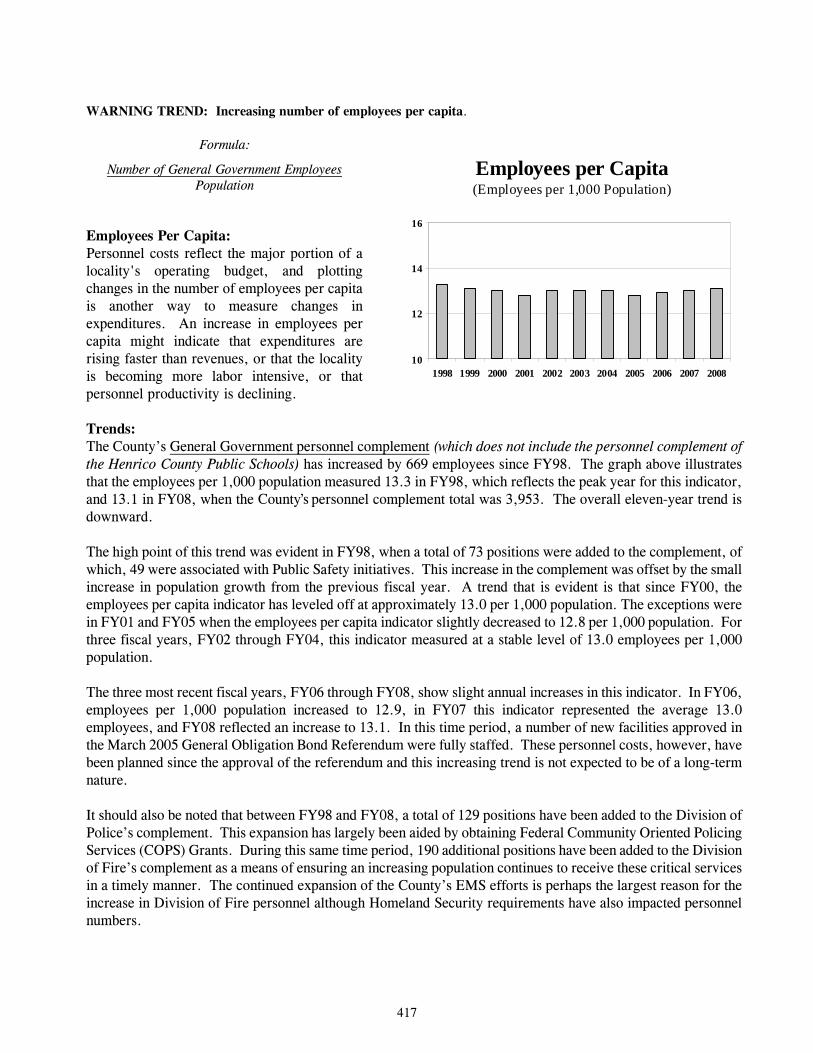
WARNING TREND: Increasing number of employees per capita.
Formula:
Number of General Government Employees Population
Employees Per Capita: Personnel costs reflect the major portion of a locality's operating budget, and plotting changes in the number of employees per capita is another way to measure changes in expenditures. An increase in employees per capita might indicate that expenditures are rising faster than revenues, or that the locality is becoming more labor intensive, or that personnel productivity is declining. Trends: The County’s General Government personnel complement (which does not include the personnel complement of the Henrico County Public Schools) has increased by 669 employees since FY98. The graph above illustrates that the employees per 1,000 population measured 13.3 in FY98, which reflects the peak year for this indicator, and 13.1 in FY08, when the County’s personnel complement total was 3,953. The overall eleven-year trend is downward. The high point of this trend was evident in FY98, when a total of 73 positions were added to the complement, of which, 49 were associated with Public Safety initiatives. This increase in the complement was offset by the small increase in population growth from the previous fiscal year. A trend that is evident is that since FY00, the employees per capita indicator has leveled off at approximately 13.0 per 1,000 population. The exceptions were in FY01 and FY05 when the employees per capita indicator slightly decreased to 12.8 per 1,000 population. For three fiscal years, FY02 through FY04, this indicator measured at a stable level of 13.0 employees per 1,000 population. The three most recent fiscal years, FY06 through FY08, show slight annual increases in this indicator. In FY06, employees per 1,000 population increased to 12.9, in FY07 this indicator represented the average 13.0 employees, and FY08 reflected an increase to 13.1. In this time period, a number of new facilities approved in the March 2005 General Obligation Bond Referendum were fully staffed. These personnel costs, however, have been planned since the approval of the referendum and this increasing trend is not expected to be of a long-term nature. It should also be noted that between FY98 and FY08, a total of 129 positions have been added to the Division of Police’s complement. This expansion has largely been aided by obtaining Federal Community Oriented Policing Services (COPS) Grants. During this same time period, 190 additional positions have been added to the Division of Fire’s complement as a means of ensuring an increasing population continues to receive these critical services in a timely manner. The continued expansion of the County’s EMS efforts is perhaps the largest reason for the increase in Division of Fire personnel although Homeland Security requirements have also impacted personnel numbers.
Employees per Capita(Employees per 1,000 Population)
10
12
14
16
1998 1999 2000 2001 2002 2003 2004 2005 2006 2007 2008
417

The graph above does not exclude departments that offer specialized services not offered by most localities in the State. Henrico County is one of two Counties in the State that maintain their own roads, and the information above includes 265 employees in the Public Works department. This is because this trend analysis is not intended to be a comparable benchmark against other localities.
418

WARNING TREND: Increasing fringe benefit expenditures as a percentage of salaries and wages. Formula: Fringe Benefit Expenditures Salaries and Wages Fringe Benefits: The fringe benefits measured on this indicator are: FICA Taxes, Payments to the Virginia Retirement System (VRS), Health Insurance, VRS Group Life Insurance, Unemployment costs and Worker’s Compensation. The cost of these benefits is divided by the cost of salaries and wages paid in these years to obtain the percentages depicted on this chart. Charting these costs is valuable as they can inadvertently escalate and place a financial strain on a locality. Trends: The fringe benefits ratio has averaged 27.3 percent between FY98 and FY08. The high points reflected in this time frame are the most current fiscal years, FY07 and FY08, which measure 31.3 percent and 32.2 percent, respectively. The long-term trend in this indicator is clearly upward and prospects for the future continue to remain negative. The two principal reasons for the increase are health care and Virginia Retirement System costs. Both of these costs fall largely outside of the direct control of the County, as free market forces, or the Virginia General Assembly dictate costs in both of these areas. First, in looking at health care costs, the County’s cost for providing health care per employee in FY98 was $1,887. By FY08, this cost had increased to $5,353 per employee, or a change of 183.7 percent. In the FY09 budget, the cost of health care has increased to $5,651 per employee. While the County cannot influence national trends regarding the cost of health care insurance, Henrico has taken a very aggressive approach in cost-containment by recently transitioning health care to a self-insurance program. Prior to this transition, the County’s health care program operated as a fully insured program, which, in exchange for the payment of a premium, an insurance company assumed the risk, administered the program, and paid all claims. With the transition to a self-insured program, the County pays claims and third party administrative fees. Self-insurance allows the County to more fully control all aspects of the plan, including setting rates to smooth out the impact of increases on employees and the County, while maintaining adequate funding to cover claims, expenses, and services. The second cost that is outside of the County’s control is the cost of Virginia Retirement System (VRS) and life insurance benefits. The past five Trends documents have noted concern regarding these rising costs. The concern is principally focused on one-time budget balancing actions of the Virginia General Assembly that reduce a State contribution rate for a finite period of time (to reduce immediate costs) and in later years, increase contribution rates as a result of segments of the system that are “under-funded.” A recent example of the impact of these past actions occurred in the FY05 budget, where the VRS rate for General Government employees increased by 42.5% in one year. The FY08 budget reflected a cost requirement of 17.21 percent of salaries for General Government – excluding teachers. In looking at the eleven-year trend for VRS costs, it should be noted that in FY98, these costs required 12.74 percent of budgeted salary costs, while the FY08 level of 17.21 percent
Fringe Benefits(as a % of Salaries)
20%
22%
24%
26%
28%
30%
32%
34%
1998 1999 2000 2001 2002 2003 2004 2005 2006 2007 2008
419

represents a differential of 35.1 percent. An additional cost that impacted this indicator is that the VRS Life Insurance benefit for employees. This benefit was not funded by the State between FY02 and FY06 (and therefore – the County could not fund the local required amount). In FY07, the State re-instituted payment requirements, and in FY08, the County’s cost in this area required 1.13 percent of all salaries to be budgeted for this benefit, which equated to approximately $4.2 million. With the transition to a self-insured health care program, the County is no longer completely at the mercy of health care market trends, with the self-insurance fund establishing a rate stabilization fund intended to “flatten out” future health care cost increases. However, VRS and life insurance benefits continue to remain completely outside of the County’s control. With the recent declines in the stock market, the VRS pension fund has experienced its share of losses as well. With significant gains in the stock market unlikely in the near future, these losses will likely be shouldered by localities in the next biennial budget, 2010-12, through significant rate increases. Because of continued concern over cost increases for retirement benefits, a warning trend for this indicator continues.
420

WARNING TREND: Decreasing amount of General Fund operating surpluses as a percentage of net operating revenues. Formula: General Fund Operating Surpluses Net Operating Revenues Operating Surpluses: An operating surplus occurs when current revenues exceed current expenditures. If the reverse is true, it means that at least during the current year, the locality is spending more than it receives. This can occur because of an emergency such as a natural catastrophe that requires a large immediate outlay. It can also occur as a result of a conscious policy to use surplus fund balances that have accumulated over the years. The existence of an operating deficit in any one-year may not be cause for concern, but frequent occurrences may indicate that current revenues are not supporting current expenditures and serious problems may lie ahead. Trends: The County of Henrico has produced an operating surplus for each of the eleven years presented. Between FY98 and FY01, the local economy rebounded from the recession of the early 1990’s with solid growth in the revenue categories of general property tax, sales tax, and business and professional license tax, producing annual operating surpluses that averaged 6.0 percent over those four years. In FY02, as a result of the recessionary period and the decline in the County’s elastic revenue sources and State budget reductions, the operating surplus dropped to 3.9 percent. State budget reductions also impacted the County’s revenue streams in FY03 as evidenced by a drop in the operating surplus from 3.9 percent in FY02 to the FY03 level of 3.2 percent. In FY04, the operating surplus improved to a level of 3.6 percent, although the effects of the State’s recent budget reductions continued to be reflected in this lower than average operating surplus. In FY05, the operating surplus returned to historic post-recession averages and measured 6.0 percent, followed by a healthy 8.4 percent in FY06. In FY07, with continued increases in the County’s elastic tax revenues, the operating surplus reflected a variance of 9.6 percent, the highest surplus in this eleven-year period. In FY08, despite net operating revenue collection growth at its lowest level since the last recessionary period of FY02 and FY03, the operating surplus reflected a variance of 6.9 percent. This statement is a testament to the County’s conservative financial policies of capping incremental expenditure growth annually and, as a result, estimating revenues extremely conservatively. In fact, the eleven-year trend of annual operating surpluses is an indication of Henrico County’s sound financial condition and reflects Henrico’s conservative budgetary policies. In addition, while of lesser margin than the past few fiscal years, this trend reflects growth in recurring revenues that consistently exceed the growth in recurring expenditures and therefore minimize the use of one-time funding sources, such as fund balance. As of this writing, the State is estimating a budget shortfall in excess of $4.0 billion in its current biennial budget, 2008-2010 (includes an additional $800 million shortfall announced by Governor Kaine on February 16, 2009), which will likely have significant implications on State aid to localities, which accounts for just over a third of total General Fund revenues in the FY09 budget. Combining these anticipated revenue reductions with the impact of the struggling economy on other local revenues, notably elastic revenues, the County’s operating
Operating Surpluses(as a % of Net Operating Revenues)
0%
2%
4%
6%
8%
10%
1998 1999 2000 2001 2002 2003 2004 2005 2006 2007 2008
421

surplus may shrink in the coming fiscal years. However, the County has and will continue to do its part in continuing the reduction of expenditures to offset revenue collections. Between FY02 and FY04, State budget reductions and a recessionary economic environment did not prevent the County from achieving an operating surplus. In looking back at the early 1990’s, the County experienced much of the same, as an operating surplus was again achieved despite significant budget reductions from the State and an economic recession. The County fully anticipates an operating surplus in the current fiscal year. No warning trend is noted for this indicator.
422
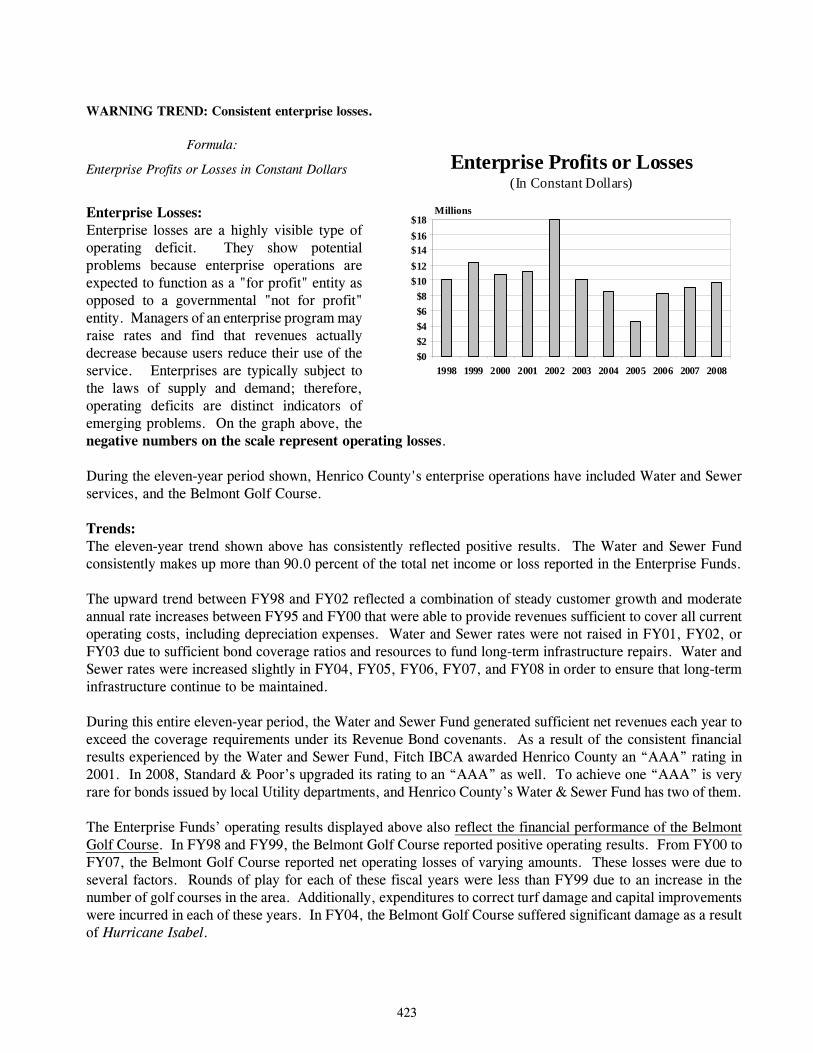
WARNING TREND: Consistent enterprise losses. Formula: Enterprise Profits or Losses in Constant Dollars Enterprise Losses: Enterprise losses are a highly visible type of operating deficit. They show potential problems because enterprise operations are expected to function as a "for profit" entity as opposed to a governmental "not for profit" entity. Managers of an enterprise program may raise rates and find that revenues actually decrease because users reduce their use of the service. Enterprises are typically subject to the laws of supply and demand; therefore, operating deficits are distinct indicators of emerging problems. On the graph above, the negative numbers on the scale represent operating losses. During the eleven-year period shown, Henrico County's enterprise operations have included Water and Sewer services, and the Belmont Golf Course. Trends: The eleven-year trend shown above has consistently reflected positive results. The Water and Sewer Fund consistently makes up more than 90.0 percent of the total net income or loss reported in the Enterprise Funds. The upward trend between FY98 and FY02 reflected a combination of steady customer growth and moderate annual rate increases between FY95 and FY00 that were able to provide revenues sufficient to cover all current operating costs, including depreciation expenses. Water and Sewer rates were not raised in FY01, FY02, or FY03 due to sufficient bond coverage ratios and resources to fund long-term infrastructure repairs. Water and Sewer rates were increased slightly in FY04, FY05, FY06, FY07, and FY08 in order to ensure that long-term infrastructure continue to be maintained. During this entire eleven-year period, the Water and Sewer Fund generated sufficient net revenues each year to exceed the coverage requirements under its Revenue Bond covenants. As a result of the consistent financial results experienced by the Water and Sewer Fund, Fitch IBCA awarded Henrico County an “AAA” rating in 2001. In 2008, Standard & Poor’s upgraded its rating to an “AAA” as well. To achieve one “AAA” is very rare for bonds issued by local Utility departments, and Henrico County’s Water & Sewer Fund has two of them. The Enterprise Funds’ operating results displayed above also reflect the financial performance of the Belmont Golf Course. In FY98 and FY99, the Belmont Golf Course reported positive operating results. From FY00 to FY07, the Belmont Golf Course reported net operating losses of varying amounts. These losses were due to several factors. Rounds of play for each of these fiscal years were less than FY99 due to an increase in the number of golf courses in the area. Additionally, expenditures to correct turf damage and capital improvements were incurred in each of these years. In FY04, the Belmont Golf Course suffered significant damage as a result of Hurricane Isabel.
Enterprise Profits or Losses(In Constant Dollars)
$0$2$4$6$8
$10$12$14$16$18
1998 1999 2000 2001 2002 2003 2004 2005 2006 2007 2008
Millions
423
In the most recent fiscal year, FY08, the Belmont Golf Course posted its first positive operating result since FY00. The Belmont Golf Course has recently implemented a number of business model changes that will promote finding efficiencies in its operations to allow for reduced expenditures and the ability to maximize revenues from every source. In FY08, revenue collections increased nearly 11.0 percent from the prior fiscal year, while expenditures were actually reduced by 1.4 percent. Rounds of play in the fiscal year were up 3.3 percent from the prior fiscal year. Current information regarding the number of rounds of golf played suggests a slight increase in the number of rounds played, as well as an increase in golf course revenues. However, the current economic environment will likely take its toll on Belmont Golf Course and hinder revenue growth in the near future. As such, a warning trend for the Golf Course continues.
424

WARNING TREND: Declining unrestricted General Fund Balance as a percentage of net operating revenues. Formula: Unrestricted General Fund Balance Net Operating Revenues General Fund Unrestricted Balance: The level of a locality's unrestricted fund balance may determine its ability to withstand unexpected financial emergencies, which may result from natural disasters, revenue shortfalls, or steep rises in inflation. It also may determine a locality's ability to accumulate funds for large-scale one-time purchases without having to incur debt. Note: This historical depiction is reflected differently than the percentages typically referred to in the Annual Fiscal Plan as “net operating revenues.” In the Trends document, this includes the General, Special Revenue and Debt Service Funds. As such, the percentage reflected on this page is lower than what is reflected in the Annual Fiscal Plan, which reflects the General Fund Unrestricted balance as a percentage of General Fund expenditures.
Trends: Henrico County’s unrestricted General Fund balance as a percentage of net operating revenues has grown from 7.0 percent in FY98 to 13.5 percent in FY08. As noted above, the depiction of this indicator in the Trends document is different than the indicator reflected in the Annual Fiscal Plan. Looking at the trend, between FY98 and FY03, the County’s percentage of unrestricted fund balance reflected an upward trend before leveling off in FY04 and remaining constant at 13.3 for FY06 and FY07, and with a slight uptick to 13.5 in FY08. This is particularly positive considering that during FY02, FY03, and FY04, the County’s revenues were impacted by State funding reductions, and the effects and after-effects of a national recession. The increase in this indicator has been influenced by the County’s conservative posture when estimating available revenues and expenditure controls imposed on both General Government and Education. In FY04, the County of Henrico faced a significant natural disaster, Hurricane Isabel. In the aftermath of the storm, the County’s Board of Supervisors was able to appropriate over $20.0 million for the massive cleanup that was required. In FY05, the County of Henrico was deluged with Tropical Storm Gaston and the Board again was able to quickly react to the damage to public facilities by appropriating $8.0 million. The fact that the County has a strong unrestricted fund balance ensures that in times of emergency, the County has the resources to react quickly and effectively to ensure that the service delivery our residents expect continues in the manner expected. Overall, the County’s Unrestricted General Fund Balance reflects a positive trend since FY98 that places Henrico in a desirable position for a local government. Henrico County has been assigned an AAA/AAA/Aaa bond rating, making it one of twenty-one counties in the nation to hold such a rating. The maintenance of a healthy fund balance is a critical component examined by rating agencies when assigning bond ratings. Henrico has a long history of maintaining a healthy unrestricted General Fund balance and will continue to use prudence in safeguarding this resource. No warning trend is noted for this indicator.
General Fund Unrestricted Balance(as a % of Net Operating Revenues)
0%
4%
8%
12%
16%
1998 1999 2000 2001 2002 2003 2004 2005 2006 2007 2008
425
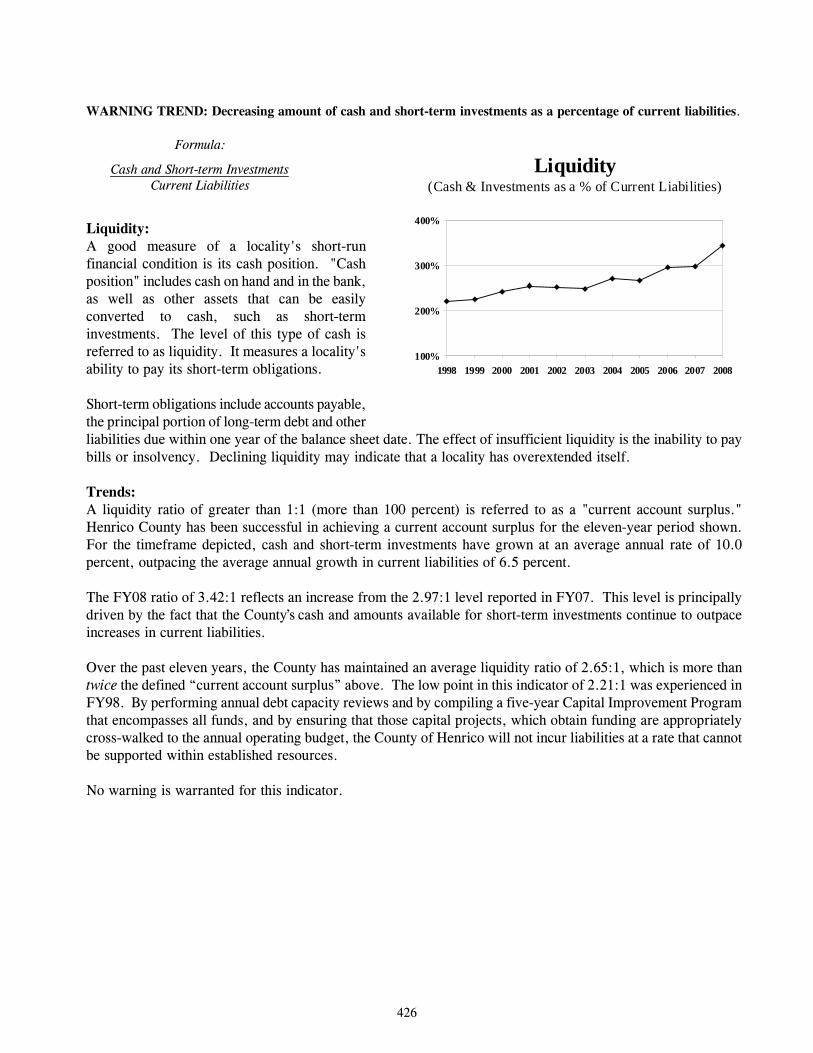
WARNING TREND: Decreasing amount of cash and short-term investments as a percentage of current liabilities. Formula: Cash and Short-term Investments Current Liabilities Liquidity: A good measure of a locality's short-run financial condition is its cash position. "Cash position" includes cash on hand and in the bank, as well as other assets that can be easily converted to cash, such as short-term investments. The level of this type of cash is referred to as liquidity. It measures a locality's ability to pay its short-term obligations. Short-term obligations include accounts payable, the principal portion of long-term debt and other liabilities due within one year of the balance sheet date. The effect of insufficient liquidity is the inability to pay bills or insolvency. Declining liquidity may indicate that a locality has overextended itself. Trends: A liquidity ratio of greater than 1:1 (more than 100 percent) is referred to as a "current account surplus." Henrico County has been successful in achieving a current account surplus for the eleven-year period shown. For the timeframe depicted, cash and short-term investments have grown at an average annual rate of 10.0 percent, outpacing the average annual growth in current liabilities of 6.5 percent. The FY08 ratio of 3.42:1 reflects an increase from the 2.97:1 level reported in FY07. This level is principally driven by the fact that the County’s cash and amounts available for short-term investments continue to outpace increases in current liabilities. Over the past eleven years, the County has maintained an average liquidity ratio of 2.65:1, which is more than twice the defined “current account surplus” above. The low point in this indicator of 2.21:1 was experienced in FY98. By performing annual debt capacity reviews and by compiling a five-year Capital Improvement Program that encompasses all funds, and by ensuring that those capital projects, which obtain funding are appropriately cross-walked to the annual operating budget, the County of Henrico will not incur liabilities at a rate that cannot be supported within established resources. No warning is warranted for this indicator.
Liquidity(Cash & Investments as a % of Current Liabilities)
100%
200%
300%
400%
1998 1999 2000 2001 2002 2003 2004 2005 2006 2007 2008
426

WARNING TREND: Increasing current liabilities at end of year as a percentage of net operating revenues. Formula: Current Liabilities Net Operating Revenues Current Liabilities: Current liabilities include short-term debt, the current principal portion of long-term debt, accounts payable and other current liabilities due within one year of the balance sheet date. A major component of current liabilities may be short-term debt in the form of tax or bond anticipation notes. Although the use of short-term borrowing is an accepted way to handle erratic flows of revenues, an increasing amount of short-term debt outstanding at the end of successive years can indicate liquidity problems, deficit spending, or both. Trends: In the eleven-year trend depicted above the indicator has gone from a low of 8.9 percent in the most recent fiscal year, FY08, to a high of 11.3 percent in FY03. The level for FY08 is the lowest in this eleven-year period, despite the lowest net operating revenue collections growth since the last recessionary economy in FY02 and FY03. Current liabilities decreased 3.6 percent in FY08 from FY07 levels. There are two large components that make up this indicator, the first of which is recorded “accounts payable.” The FY08 total for this liability measured $49.4 million, which reflects a decrease of $2.0 million when compared to the FY07 totals. It is important to note that the accounts payable does fluctuate based on purchasing activity within the governmental unit. The second large component, “principal due in 12 months,” reflected a decrease of $2.5 million in FY08. In November 2000 the voters approved a $237.0 million General Obligation Bond Referendum. In March of 2005, the voters approved a $349.3 million General Obligation Bond Referendum. Both referenda included School, Fire, Roadway, Public Library, and Recreation and Parks projects. The County of Henrico chose to phase in this debt over a multi-year time period (both referenda assume the debt would be phased in over a seven-year time frame). By taking this approach, the County has been able to pay required debt service costs and ancillary operating expenses without negatively impacting its operating budget and this indicator is reflective of that planning. For this eleven-year period, this ratio has been between 8.9 percent and 11.3 percent of net operating revenues. Although the general trend over this time period is upward, the fact that the County has not experienced significant annual changes in this indicator is reflective of the County’s conservative financial management approach. Also, this consistency is reflective of the County’s conservative debt management practices and successful long-term planning for infrastructure improvements. This indicator is very much aligned with the next two indicators: 1) long-term debt as a percentage of assessed valuation and 2) debt service as a percentage of net operating revenues. No warning trend is noted for this indicator.
Current Liabilities(as a % of Net Operating Revenues)
0%
2%
4%
6%
8%
10%
12%
1998 1999 2000 2001 2002 2003 2004 2005 2006 2007 2008
427
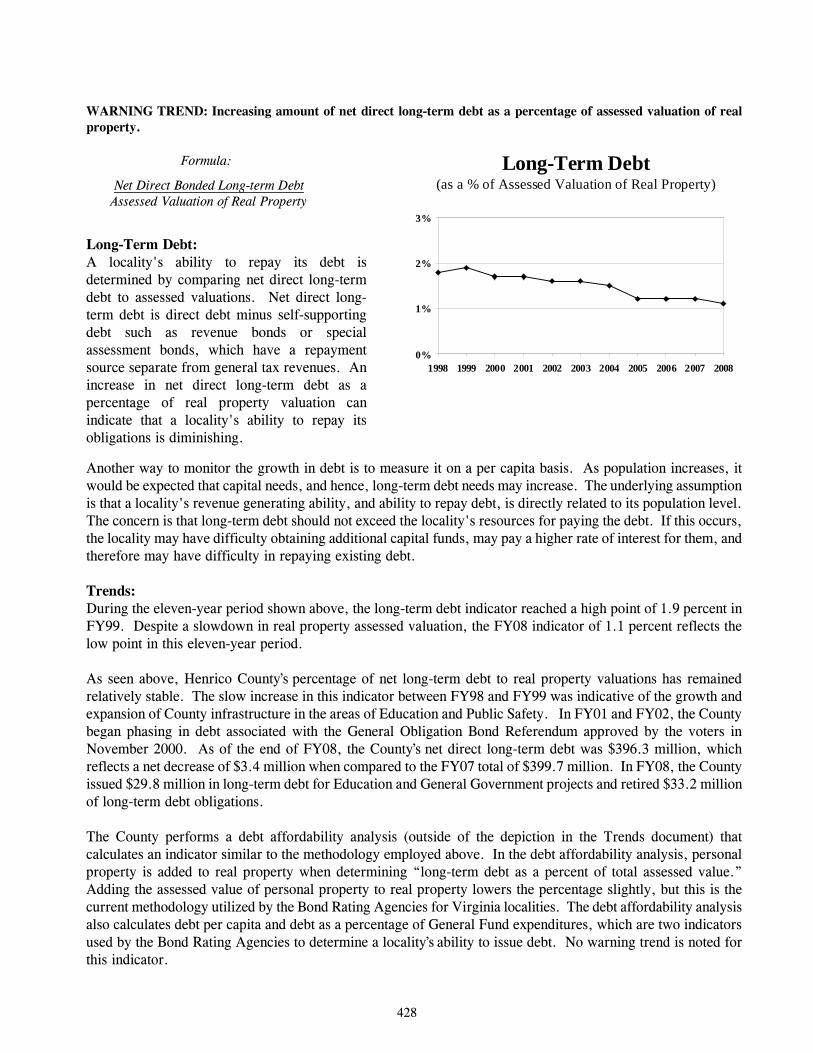
WARNING TREND: Increasing amount of net direct long-term debt as a percentage of assessed valuation of real property. Formula: Net Direct Bonded Long-term Debt Assessed Valuation of Real Property Long-Term Debt: A locality's ability to repay its debt is determined by comparing net direct long-term debt to assessed valuations. Net direct long-term debt is direct debt minus self-supporting debt such as revenue bonds or special assessment bonds, which have a repayment source separate from general tax revenues. An increase in net direct long-term debt as a percentage of real property valuation can indicate that a locality's ability to repay its obligations is diminishing.
Another way to monitor the growth in debt is to measure it on a per capita basis. As population increases, it would be expected that capital needs, and hence, long-term debt needs may increase. The underlying assumption is that a locality's revenue generating ability, and ability to repay debt, is directly related to its population level. The concern is that long-term debt should not exceed the locality's resources for paying the debt. If this occurs, the locality may have difficulty obtaining additional capital funds, may pay a higher rate of interest for them, and therefore may have difficulty in repaying existing debt. Trends: During the eleven-year period shown above, the long-term debt indicator reached a high point of 1.9 percent in FY99. Despite a slowdown in real property assessed valuation, the FY08 indicator of 1.1 percent reflects the low point in this eleven-year period. As seen above, Henrico County’s percentage of net long-term debt to real property valuations has remained relatively stable. The slow increase in this indicator between FY98 and FY99 was indicative of the growth and expansion of County infrastructure in the areas of Education and Public Safety. In FY01 and FY02, the County began phasing in debt associated with the General Obligation Bond Referendum approved by the voters in November 2000. As of the end of FY08, the County’s net direct long-term debt was $396.3 million, which reflects a net decrease of $3.4 million when compared to the FY07 total of $399.7 million. In FY08, the County issued $29.8 million in long-term debt for Education and General Government projects and retired $33.2 million of long-term debt obligations. The County performs a debt affordability analysis (outside of the depiction in the Trends document) that calculates an indicator similar to the methodology employed above. In the debt affordability analysis, personal property is added to real property when determining “long-term debt as a percent of total assessed value.” Adding the assessed value of personal property to real property lowers the percentage slightly, but this is the current methodology utilized by the Bond Rating Agencies for Virginia localities. The debt affordability analysis also calculates debt per capita and debt as a percentage of General Fund expenditures, which are two indicators used by the Bond Rating Agencies to determine a locality’s ability to issue debt. No warning trend is noted for this indicator.
Long-Term Debt(as a % of Assessed Valuation of Real Property)
0%
1%
2%
3%
1998 1999 2000 2001 2002 2003 2004 2005 2006 2007 2008
428
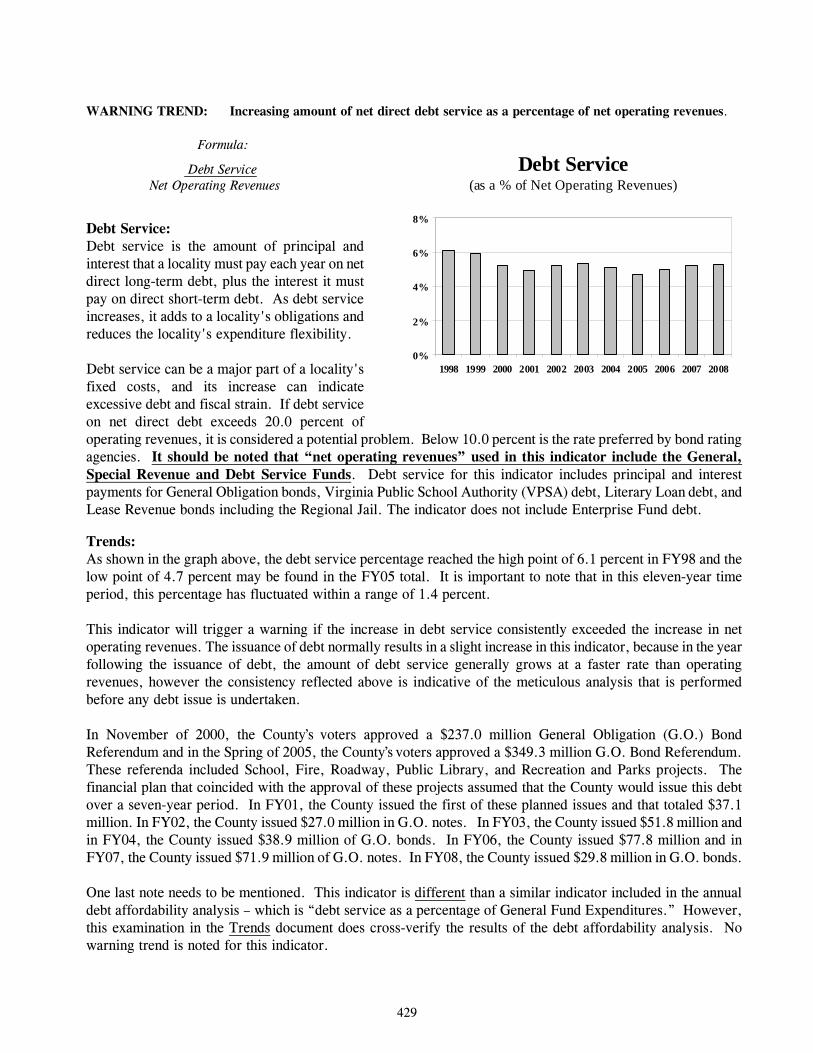
WARNING TREND: Increasing amount of net direct debt service as a percentage of net operating revenues. Formula: Debt Service Net Operating Revenues Debt Service: Debt service is the amount of principal and interest that a locality must pay each year on net direct long-term debt, plus the interest it must pay on direct short-term debt. As debt service increases, it adds to a locality's obligations and reduces the locality's expenditure flexibility. Debt service can be a major part of a locality's fixed costs, and its increase can indicate excessive debt and fiscal strain. If debt service on net direct debt exceeds 20.0 percent of operating revenues, it is considered a potential problem. Below 10.0 percent is the rate preferred by bond rating agencies. It should be noted that “net operating revenues” used in this indicator include the General, Special Revenue and Debt Service Funds. Debt service for this indicator includes principal and interest payments for General Obligation bonds, Virginia Public School Authority (VPSA) debt, Literary Loan debt, and Lease Revenue bonds including the Regional Jail. The indicator does not include Enterprise Fund debt. Trends: As shown in the graph above, the debt service percentage reached the high point of 6.1 percent in FY98 and the low point of 4.7 percent may be found in the FY05 total. It is important to note that in this eleven-year time period, this percentage has fluctuated within a range of 1.4 percent. This indicator will trigger a warning if the increase in debt service consistently exceeded the increase in net operating revenues. The issuance of debt normally results in a slight increase in this indicator, because in the year following the issuance of debt, the amount of debt service generally grows at a faster rate than operating revenues, however the consistency reflected above is indicative of the meticulous analysis that is performed before any debt issue is undertaken. In November of 2000, the County’s voters approved a $237.0 million General Obligation (G.O.) Bond Referendum and in the Spring of 2005, the County’s voters approved a $349.3 million G.O. Bond Referendum. These referenda included School, Fire, Roadway, Public Library, and Recreation and Parks projects. The financial plan that coincided with the approval of these projects assumed that the County would issue this debt over a seven-year period. In FY01, the County issued the first of these planned issues and that totaled $37.1 million. In FY02, the County issued $27.0 million in G.O. notes. In FY03, the County issued $51.8 million and in FY04, the County issued $38.9 million of G.O. bonds. In FY06, the County issued $77.8 million and in FY07, the County issued $71.9 million of G.O. notes. In FY08, the County issued $29.8 million in G.O. bonds. One last note needs to be mentioned. This indicator is different than a similar indicator included in the annual debt affordability analysis – which is “debt service as a percentage of General Fund Expenditures.” However, this examination in the Trends document does cross-verify the results of the debt affordability analysis. No warning trend is noted for this indicator.
Debt Service(as a % of Net Operating Revenues)
0%
2%
4%
6%
8%
1998 1999 2000 2001 2002 2003 2004 2005 2006 2007 2008
429

WARNING TREND: Increasing days of unused vacation leave per municipal employee.
Formula:
Total Days of Unused Vacation Leave Number of General Government Employees
Accumulated Vacation Leave: Localities usually allow their employees to accumulate some portion of unused vacation, which may be paid at termination or retirement. This expenditure is rarely funded while it is being accumulated although the costs of the benefit are covered through normal attrition. This is because of the fact that when an employee with many years of service is replaced, that employee is typically replaced with an employee with fewer or no years of service. The salary differential on a global basis is sufficient to pay for this benefit on any given fiscal year. While there is no fiscal impact that arises from this indicator, its inclusion is useful in depicting the overall vacation leave balances of the General Government workforce. Finally, it needs to be noted that vacation leave balances not utilized by the beginning of the new calendar year, are readjusted downward (that is, time is “lost”), so the number included within this indicator is simply a reflection of June 30 balances. Because this number is not on a calendar year basis, the indicator may slightly overstate the actual vacation leave balances (as it does not account for actual vacation leave not utilized). Trends: In terms of the overall trend, the accumulated vacation leave indicator has averaged 23.1 days during the eleven-year period. What can be seen throughout this time period is stability in this indicator as it has ranged from a low of 22.2 days in FY98 to the high point of 24.5 days in FY08. In looking at the graph above, the indicator in FY08 clearly reflects the largest year-over-year increase in this eleven-year period. This is due to an adjustment of annual leave accrual rates and increased “carry-over” hours (less time “lost”) for employees with fifteen or more years of service. The FY08 accumulated vacation leave indicator increased for the first time since FY04. In the entire eleven-year period, this indicator has fluctuated within a range of 2.3 days. The overall slight upward movement since FY98 is reflective of the County’s workforce, which is aging to a certain extent and employees with more seniority earn more hours of vacation leave than less senior employees. Henrico County's vacation leave indicator will generally increase as the average length of employment of County employees’ increases. The most recent information suggests the County has a workforce whose average age is 45. The average County employee has been with the County for 10 years (Source: Human Resources Department Annual Report, FY2007-08). No warning trend is noted for this indicator.
Accumulated Vacation Leave(Days per Employee)
0
5
10
15
20
25
30
1998 1999 2000 2001 2002 2003 2004 2005 2006 2007 2008
430

WARNING TREND: A decline in capital outlay in operating funds as a percentage of net operating expenditures. Formula: Capital Outlay from Operating Funds Net Operating Expenditures Level of Capital Outlay: Capital outlay includes expenditures for equipment in the operating budget, such as vehicles or computers. It normally includes equipment that will last longer than one year. Capital outlay does not include capital improvement expenditures for construction of capital facilities such as streets, buildings, fire stations, or schools. The purpose of capital outlay in the operating budget is to replace worn equipment or add new equipment. The level of capital outlay is a rough indicator of whether or not the stock of equipment is being maintained in good condition. However, this indicator does not reflect the cost of routine maintenance and repair. If this indicator is declining in the short run of one to three years, it could mean that a locality's needs have temporarily been satisfied, because most equipment lasts more than one year. If the decline persists over three or more years, it can be an indication that capital outlay needs are being deferred, resulting in the use of obsolete and inefficient equipment and the creation of a future unfunded liability. Trends: The eleven-year trend for this indicator depicts a range between 3.0 percent and 3.9 percent, which is indicative of the consistency of meeting capital outlay requirements within the operating budget. In FY98, this indicator reflected a total of 3.6 percent, while the FY08 total measures 3.1 percent. In fiscal years FY05 and FY06, the indicator remained constant at 3.5 percent and decreased by 0.5 percent to 3.0 in FY07, representing the low point in the eleven-year time period. Although this percentage dropped in FY07, it is important to note that the indicator rebounded in FY08, showing a positive increase over the prior fiscal year. The County's level of capital outlay has averaged 3.5 percent of net operating expenditures throughout this eleven-year period. Given the current state of the economy and looming reductions in State Aid due to its anticipated budget shortfall, it is important to note that in the last recessionary time period and subsequent State budget reductions, FY02 through FY04, the County was able to maintain a stable level of capital outlay expenditures. This may be considered positive as the County has not been forced to defer capital outlay expenditures in order to maintain a balanced budget. The consistency in capital outlay expenditures may be viewed as a positive trend as current capital outlay needs are being met within existing resources. These capital outlay expenditures are largely concentrated in the areas of new data processing equipment, replacement computers for Education facilities, and replacement vehicles, particularly in the area of public safety. No warning trend is noted for this indicator.
Level of Capital Outlay(as a % of Net Operating Expenditures)
0%
2%
4%
6%
1998 1999 2000 2001 2002 2003 2004 2005 2006 2007 2008
431

WARNING TREND: Decreasing amount of depreciation expense as a percentage of total depreciable fixed assets for Enterprise Funds and Internal Service Funds. Formula: Depreciation Expense Cost of Depreciable Fixed Assets Depreciation: Depreciation is the mechanism by which a cost is associated with the use of a fixed asset over its estimated useful life. Depreciation is recorded only in the Enterprise and Internal Service Funds. Total depreciation expense typically remains a relatively stable proportion of the cost of the entity's fixed assets. The reason is that older assets, which are fully depreciated, are usually removed from service and newer assets take their place. If depreciation expenses start to decline as a proportion of the fixed asset cost, the assets on hand are probably being used beyond their estimated useful life. Trends: The chart above reflects two overall trends. First, between FY98 and FY01, depreciation expense for the County of Henrico fluctuated very little – between 2.3 percent and 2.4 percent. However, in FY02, with the implementation of GASB 34, a change was required in the length of depreciation for Utilities infrastructure. The change increased the time for depreciating many of these assets and is based on an industry standard. (GASB 34 required standardization in many areas that encompass fixed assets of localities and one of the changes actually increased the term of depreciation for certain assets). Concurrent with this, the value of fixed assets arising from the County’s new Water Treatment Plant resulted in an increase in County “assets” of nearly $92.0 million over a two-year period, although that increase is really of a one-time nature. In FY08, depreciation expenditures as a percentage of depreciable fixed assets yielded 2.7 percent, a decrease from the prior fiscal year indicator of 2.9 percent. This decrease is the first such decrease since FY03, when GASB 34 requirements were impacting this indicator, and is a result of a change in the capitalization threshold for personal property (furniture, vehicles, and equipment/software) from $2,500 to $5,000. What this graph shows clearly, is that with the standardization in the recordation of fixed assets that is the result of GASB 34, this indicator now reflects a level that is slightly higher than that noted in the 1990’s. This result was anticipated as assets of the Enterprise Fund continue to increase in value as the number of customers and the assets of the system continue to increase. The absence of a truly downward trend suggests that the County’s depreciable assets are not currently being used past their depreciable useful life. No warning trend is noted for this indicator.
Depreciation(Depreciation Expense as a % of Assets)
1.0%
1.5%
2.0%
2.5%
3.0%
1998 1999 2000 2001 2002 2003 2004 2005 2006 2007 2008
432

WARNING TREND: A decreasing growth rate or a sudden increase in population. Indicator: Population of County Residents Population: Empirical evidence indicates that changes in population can have a direct effect on a locality's revenue because of the impact upon related issues, such as employment, income, and property value. A sudden increase in population can create immediate pressures for new capital outlays for infrastructure and for higher levels of service, particularly in the areas of Education, Public Safety and Recreation. A locality faced with a declining population is rarely able to reduce expenditures in the same proportion as it is losing population. Many expenditures such as debt service, government mandates, and salaries are fixed and cannot effectively be reduced in the short run. In addition, because of the interrelationship between population levels and other economic and demographic factors, a decline in population tends to have a cumulative negative effect on revenues - the further the decline, the more adverse the effect on employment, income, housing and business activity. Trends: The County of Henrico has experienced a steady growth in population from 247,832 in FY98 to 302,518 in FY08, an increase of 22.1 percent in this eleven-year time span, or an annual average of 2.0 percent per year. In the eleven-year period, the County’s resources have kept pace with the increased demand for services from a rising population. According to the 2000 United States Census, Henrico and Chesterfield were in competition for the largest population within the Central Virginia region with Henrico having a slightly higher total. The population number for FY01 represents actual Census Data. All other years have been obtained from the Henrico County Department of Planning (see website: www.co.henrico.va.us). Henrico continues to prepare for expanded and enhanced services to serve an increasing population as evidenced by construction of new facilities for education, recreation, roads, fire stations and libraries and through continuing to maximize the use of technology, where appropriate, to enhance productivity and thereby minimize requirements for additional personnel.
Population
200 210 220 230 240 250 260 270 280 290 300 310
1998
2000
2002
2004
2006
2008
Thousands
433

WARNING TREND: Decline in the level, or growth rate, of personal income per capita. Indicator: Per Capita Income Source: Bureau of Economic Analysis Per Capita Income: Per capita income is one measure of a community's wealth. Credit rating agencies use per capita income as an important measure of a local government's ability to repay debt. A decline in per capita income causes a drop in consumer purchasing power and can provide advance notice that businesses, especially in the retail sector, will suffer a decline that can ripple through the rest of the local economy. Changes in per capita income are especially important for communities that have little commercial or industrial tax base, because personal income is the primary source from which taxes can be paid. Trends: In the nine years depicted above, per capita income has increased by 36.0 percent from $31,217 in 1998 to the $42,459 reported for 2006. It should be noted that this indicator factors in increases to the County’s population, which increased 18.4 percent between 1998 and 2006. The per capita income statistics depicted above come from the United States Bureau of Economic Analysis. That source is based on income tax returns and therefore data is only available through the 2006 tax year. Since the recessionary period of the early 1990’s, this indicator has consistently increased with the exception of 2005, where this indicator remained somewhat constant from 2004. In 1998, this indicator reached its highest growth rate in the nine-year period at 8.7 percent. In 1999, the increase was 2.9 percent. In calendar years 2000 through 2002, there was a steady increase in the per capita income average growth, ranging from a low of 3.6 percent in 2000 to a high of 4.0 percent increase in 2002. In calendar year 2003, the growth rate decreased slightly to 3.1 percent. The 2004 data reveals that per capita income in Henrico County reached its second highest growth rate in the nine-year period at 8.6 percent, which represents a dramatic increase from the previous calendar year. In 2005, however, this indicator leveled off and actually decreased by .05 percent from the previous year. In calendar year 2006, the increase was a healthy 6.0 percent. It should be noted that while the County’s population has increased by an annual average of 2.0 percent in the past eleven years, taxpayer returns from County residents reflect an average annual increase of 4.5 percent in the nine years reflected on the graph above.
Per Capita Income
$28$30
$32$34
$36
$38$40
$42$44
1998 1999 2000 2001 2002 2003 2004 2005 2006
Thousands
434
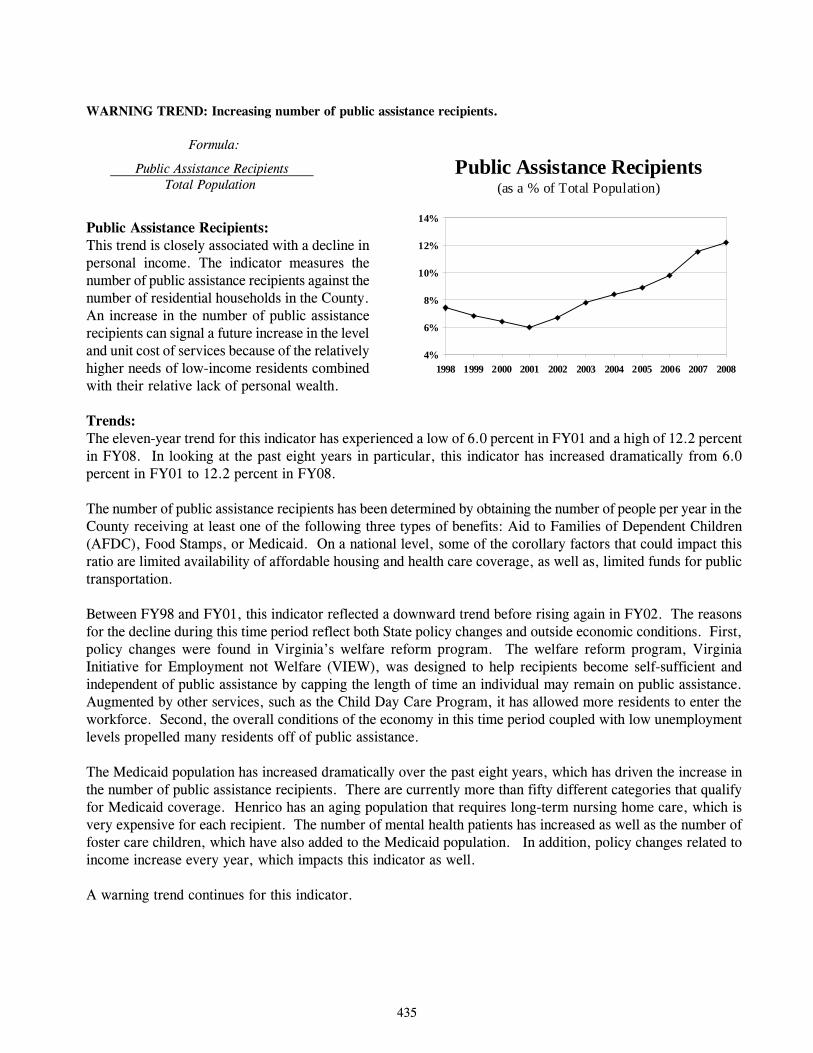
WARNING TREND: Increasing number of public assistance recipients. Formula: Public Assistance Recipients Total Population Public Assistance Recipients: This trend is closely associated with a decline in personal income. The indicator measures the number of public assistance recipients against the number of residential households in the County. An increase in the number of public assistance recipients can signal a future increase in the level and unit cost of services because of the relatively higher needs of low-income residents combined with their relative lack of personal wealth. Trends: The eleven-year trend for this indicator has experienced a low of 6.0 percent in FY01 and a high of 12.2 percent in FY08. In looking at the past eight years in particular, this indicator has increased dramatically from 6.0 percent in FY01 to 12.2 percent in FY08. The number of public assistance recipients has been determined by obtaining the number of people per year in the County receiving at least one of the following three types of benefits: Aid to Families of Dependent Children (AFDC), Food Stamps, or Medicaid. On a national level, some of the corollary factors that could impact this ratio are limited availability of affordable housing and health care coverage, as well as, limited funds for public transportation. Between FY98 and FY01, this indicator reflected a downward trend before rising again in FY02. The reasons for the decline during this time period reflect both State policy changes and outside economic conditions. First, policy changes were found in Virginia’s welfare reform program. The welfare reform program, Virginia Initiative for Employment not Welfare (VIEW), was designed to help recipients become self-sufficient and independent of public assistance by capping the length of time an individual may remain on public assistance. Augmented by other services, such as the Child Day Care Program, it has allowed more residents to enter the workforce. Second, the overall conditions of the economy in this time period coupled with low unemployment levels propelled many residents off of public assistance. The Medicaid population has increased dramatically over the past eight years, which has driven the increase in the number of public assistance recipients. There are currently more than fifty different categories that qualify for Medicaid coverage. Henrico has an aging population that requires long-term nursing home care, which is very expensive for each recipient. The number of mental health patients has increased as well as the number of foster care children, which have also added to the Medicaid population. In addition, policy changes related to income increase every year, which impacts this indicator as well. A warning trend continues for this indicator.
Public Assistance Recipients(as a % of Total Population)
4%
6%
8%
10%
12%
14%
1998 1999 2000 2001 2002 2003 2004 2005 2006 2007 2008
435

WARNING TREND: Declining or negative growth in market value of residential, commercial or agricultural property (constant dollars). Formula: Real Property Values (Constant Dollars) Real Property Values: Changes in real property values are important because most local governments depend on property taxes for a substantial portion of their revenues, and Henrico County is no exception. If a locality has a stable tax rate, the higher the aggregate property value, the higher the revenues generated. Localities experiencing rapid population and economic growth are also likely to experience growth in property values in the short-run. This is because in the short-run, the supply of housing is fixed and the increase in demand due to growth will force prices up. The extent to which declining real property values affect a locality's revenues will depend on the locality's reliance on property tax revenue. The extent to which the decline will ripple through the local economy and affect other revenues is difficult to determine. However, all of the economic and demographic factors are closely related. Most probably, a decline in property values will not be a cause, but rather a symptom of other underlying problems. Trends: The above graph illustrates real property values in constant dollars for residential, commercial, and agricultural properties. As such, any increases in this indicator are reported after negating the “effect” of inflation. The increases in valuation reflected above have been mitigated by a reduction in the Real Estate Tax Rate in this period of time. Specifically, since CY98, the Real Estate Tax Rate has been reduced from $0.94/$100 to the current level of $0.87/$100 of assessed valuation. In looking at the historical Real Estate Tax rates for the County of Henrico, two facts are clearly evident. First, stability is clearly evident as the Real Estate Tax Rate was maintained at $0.98/$100 of assessed valuation for a period of sixteen consecutive years (CY80-CY95). The second trend that is evident is that since CY98, as property valuations have increased, the Board of Supervisors has mitigated these increases with prudent Real Estate Tax rate reductions that have been able to balance the County’s debt obligations and capital infrastructure needs while offering tax relief to County residents. This is a very difficult balancing act, but one that has been achieved because of the consistency of Board actions in establishing the Real Estate Tax rate on an annual basis. In FY08, residential property values (in constant dollars) showed a slight decrease from the prior fiscal year, the first such decrease in this indicator since data collection began for the Trends document in 1981. The reasons for this decrease are twofold. First, the struggle in the residential real estate market hindered property value increases, as evidenced by residential reassessment values only increasing 2.6 percent in January 2008, the lowest year-over-year increase since 1995. Second, the property values noted in the graph are inflation adjusted (constant dollars), and in FY08 the consumer price index (CPI), commonly referred to when measuring inflation, yielded a 5.0 percent increase over the prior year, the largest such increase since 1989. It is important to note that unadjusted real property values actually increased nearly $1.1 billion or 4.7 percent in FY08 from the prior
Real Property Values(In Constant Dollars)
$0$2$4$6$8
$10$12$14$16$18$20
1998 1999 2000 2001 2002 2003 2004 2005 2006 2007 2008Residential Commercial Agricultural
Billions
436

fiscal year. With the continued struggle in the real estate market, in both the residential and commercial markets, property values will likely see slight declines or no growth in the current fiscal year, FY09. A number of large commercial projects are currently underway Countywide, which will help offset declining property values in the near term. However, with the real estate market continuing to struggle and a growing number of vacant commercial properties Countywide, a warning trend is noted for the immediate future.
437
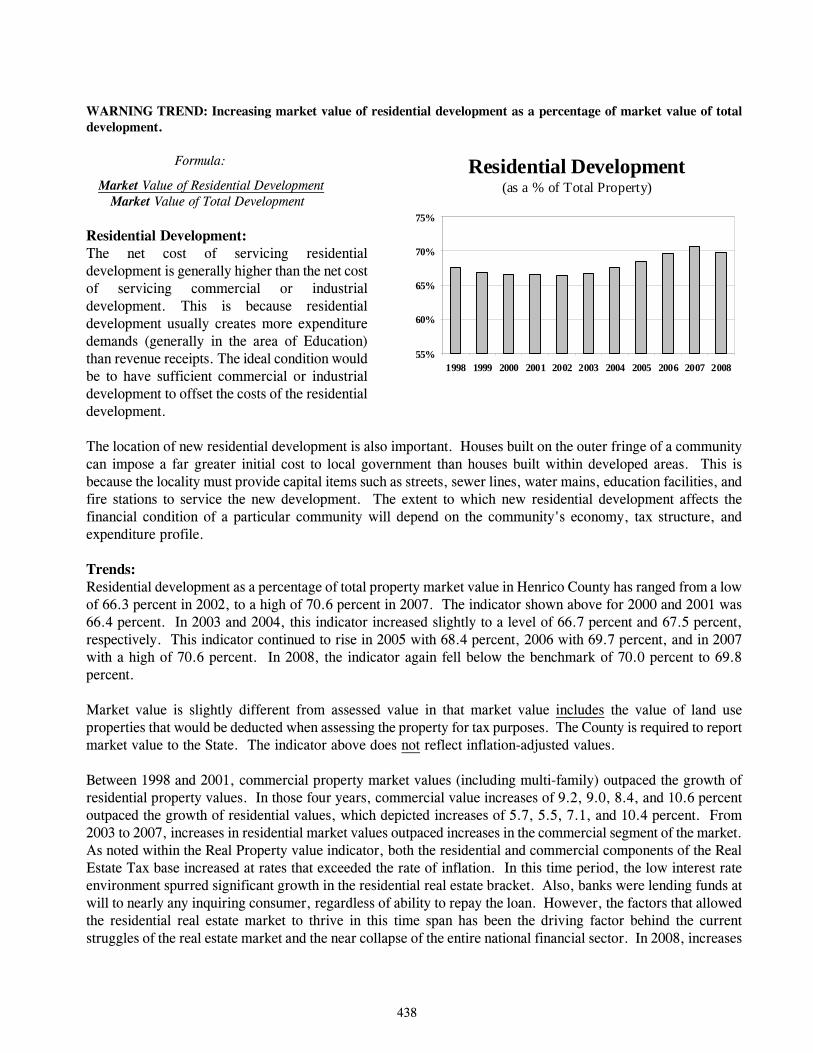
WARNING TREND: Increasing market value of residential development as a percentage of market value of total development. Formula: Market Value of Residential Development Market Value of Total Development Residential Development: The net cost of servicing residential development is generally higher than the net cost of servicing commercial or industrial development. This is because residential development usually creates more expenditure demands (generally in the area of Education) than revenue receipts. The ideal condition would be to have sufficient commercial or industrial development to offset the costs of the residential development. The location of new residential development is also important. Houses built on the outer fringe of a community can impose a far greater initial cost to local government than houses built within developed areas. This is because the locality must provide capital items such as streets, sewer lines, water mains, education facilities, and fire stations to service the new development. The extent to which new residential development affects the financial condition of a particular community will depend on the community's economy, tax structure, and expenditure profile. Trends: Residential development as a percentage of total property market value in Henrico County has ranged from a low of 66.3 percent in 2002, to a high of 70.6 percent in 2007. The indicator shown above for 2000 and 2001 was 66.4 percent. In 2003 and 2004, this indicator increased slightly to a level of 66.7 percent and 67.5 percent, respectively. This indicator continued to rise in 2005 with 68.4 percent, 2006 with 69.7 percent, and in 2007 with a high of 70.6 percent. In 2008, the indicator again fell below the benchmark of 70.0 percent to 69.8 percent. Market value is slightly different from assessed value in that market value includes the value of land use properties that would be deducted when assessing the property for tax purposes. The County is required to report market value to the State. The indicator above does not reflect inflation-adjusted values. Between 1998 and 2001, commercial property market values (including multi-family) outpaced the growth of residential property values. In those four years, commercial value increases of 9.2, 9.0, 8.4, and 10.6 percent outpaced the growth of residential values, which depicted increases of 5.7, 5.5, 7.1, and 10.4 percent. From 2003 to 2007, increases in residential market values outpaced increases in the commercial segment of the market. As noted within the Real Property value indicator, both the residential and commercial components of the Real Estate Tax base increased at rates that exceeded the rate of inflation. In this time period, the low interest rate environment spurred significant growth in the residential real estate bracket. Also, banks were lending funds at will to nearly any inquiring consumer, regardless of ability to repay the loan. However, the factors that allowed the residential real estate market to thrive in this time span has been the driving factor behind the current struggles of the real estate market and the near collapse of the entire national financial sector. In 2008, increases
Residential Development(as a % of Total Property)
55%
60%
65%
70%
75%
1998 1999 2000 2001 2002 2003 2004 2005 2006 2007 2008
438

in commercial values remained relatively strong but, as noted within the Real Property value indicator, residential values began to show signs of slowing down, as values as a result of reassessments increased 2.6 percent in 2008. In total, residential market value increased 4.7 percent, while total commercial market value increased 9.0 percent. As a result, the Residential Development indicator fell to 69.8 percent in the most recent fiscal year. Though both commercial and residential real estate markets are continuing to struggle, new commercial construction continues in the County, as a number of large projects are underway. The net change in both the value of residential development and the value of commercial development will be relatively flat in the near term, as property value declines due to reassessments will be mostly offset by new construction. With both markets equally struggling, it is unlikely that either will outpace the other. As such, the value of residential development as a percentage of the value of total development will remain relatively unchanged in the foreseeable future, and no warning trend is noted.
439

WARNING TREND: Increasing rate of local unemployment or a decline in number of jobs provided within the community. Indicators: Local Unemployment Rate and Number of Jobs within the Community Employment Base: Employment base considers both the unemployment rate and the number of jobs because they are closely related. This indicator is significant because it is directly related to the levels of business activity and personal income. Changes in the number of jobs provided by the community are a measure of and an influence on business activity. Changes in the rate of employment of the community's residents is related to fluctuations in personal income and, thus, is a measure of and an influence on the community's ability to support its local business sector. If the employment base is growing, if its diversity provides a cushion against short-run economic fluctuations or a downturn in one sector, and if the employment base provides sufficient income to support the local business community, then it will have a positive influence on the locality's financial condition. A decline in employment base as measured by jobs or lack of employment can be an early warning sign of declining economic activity and thus, governmental revenues. The data source for this information is the Virginia Employment Commission. Trends: I. Unemployment: Henrico County's unemployment rate, in the eleven-year period above, reflects a high of 3.5 percent in FY03 and the most recent fiscal year, FY08, to lows at or below the 2.0 percent level for FY98, FY99, FY00, and FY01. Between FY98 and FY01, local economic conditions continued to improve, which resulted in lower unemployment rates. The FY02 unemployment depicts an increase to 3.4 percent and FY03 showed a leveling off of the local unemployment rate at 3.5 percent. The FY02 and FY03 increases were indicative of the recessionary period at the time. In FY04 and FY05, the unemployment rate remained constant at 3.1 percent. The FY06 unemployment rate of 2.9 percent as well as the FY07 unemployment rate of 2.7 percent illustrates the improvement in economic conditions at the time from the prior recessionary period. FY08 experienced the beginning of a new recessionary period, one that continues at this writing, which is reflected in the sharp increase in unemployment to 3.5 percent. This indicator is highly indicative of changes in the economy and thus, is a solid representation of the condition of the local economy. A warning trend is noted for the near term, as job losses in the area will likely continue until the economy shows signs of recovery. Though unemployment is once again on the rise, Henrico County’s local economy continues to outperform both the State of Virginia (which has a very low unemployment rate) and the nation. Therefore, despite near-term unemployment rises, no long-term warning trend is noted. II. Number of Jobs: Since FY98, the number of jobs in Henrico has increased from 150,692 to 179,426, which represents an increase of 19.1 percent. In FY02, FY03, and FY04 however, the number of jobs reflected a decrease from the 170,793 level reported for 2001. The decrease can be attributed to the recession that encompassed FY02 and FY03. This
Employment Base
0.0%
2.0%
4.0%
6.0%
1998 1999 2000 2001 2002 2003 2004 2005 2006 2007 2008100,000
125,000
150,000
175,000
200,000
Local Unempl. Rate Jobs in Community
440

recession led to a number of corporate layoffs in the Richmond Metropolitan Area. The recession also impacted the State of Virginia’s budget and there were a number of State governmental jobs in this time period that were eliminated, downsized or privatized. In FY07, this indicator was impacted in a positive manner due to a several large corporate entries into the Richmond Metropolitan Area as well as a number of new businesses that opened in Henrico. FY08 also had a slight increase in jobs. The current recessionary environment has already led a number of local companies to lay off scores of employees in the Richmond Metro Area. Because of the area’s cluster of finance and insurance firms, the sectors being impacted the hardest nationally by the economic slowdown, the Richmond area has been and will likely continue to be susceptible to job losses. A number of manufacturing companies in the area have also been forced to downsize, resulting in additional layoffs. In all, the Metropolitan Richmond Area has lost over 6,900 jobs from January 1, 2008 through January 26, 2009. With the economic environment worsening, a warning trend is noted for the near term, as area employers will likely be forced to continue shedding jobs to cut costs until the economy shows some sign of recovery. However, because of its industry mix, it is anticipated that the Richmond Metro Area will weather this economic storm as it has with other recessions - and when the economy recovers, the Richmond area will again grow.
441
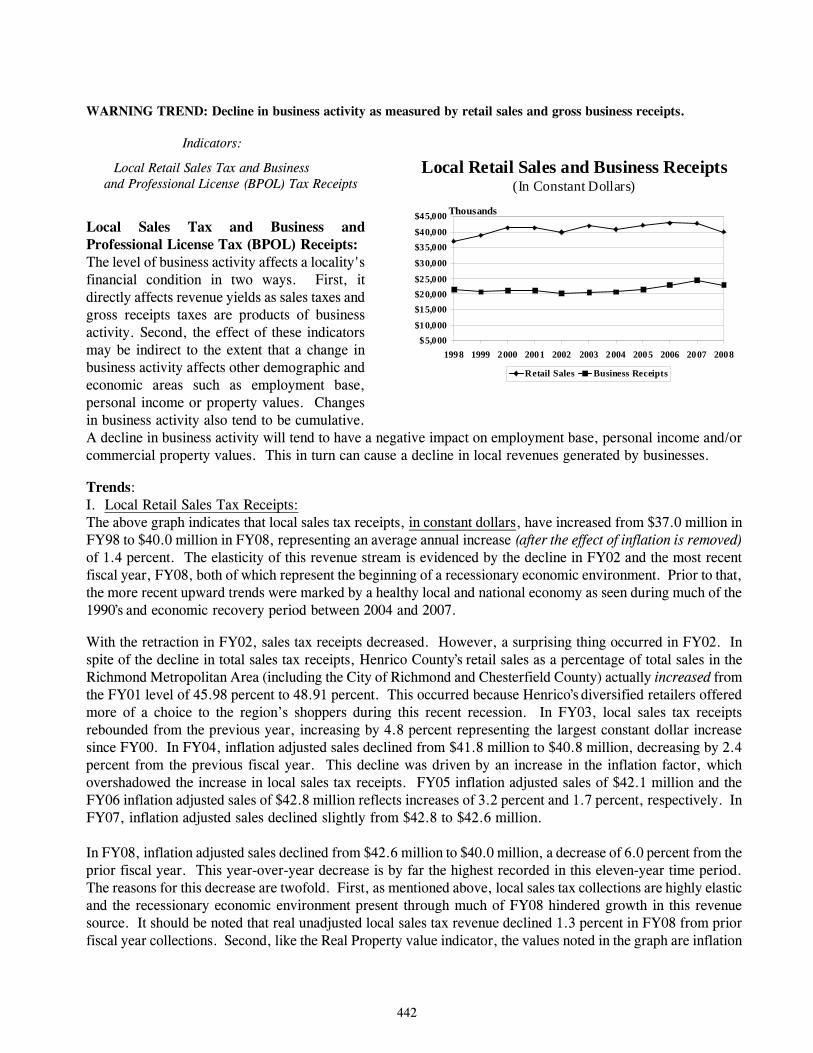
WARNING TREND: Decline in business activity as measured by retail sales and gross business receipts. Indicators: Local Retail Sales Tax and Business
and Professional License (BPOL) Tax Receipts Local Sales Tax and Business and Professional License Tax (BPOL) Receipts: The level of business activity affects a locality's financial condition in two ways. First, it directly affects revenue yields as sales taxes and gross receipts taxes are products of business activity. Second, the effect of these indicators may be indirect to the extent that a change in business activity affects other demographic and economic areas such as employment base, personal income or property values. Changes in business activity also tend to be cumulative. A decline in business activity will tend to have a negative impact on employment base, personal income and/or commercial property values. This in turn can cause a decline in local revenues generated by businesses. Trends: I. Local Retail Sales Tax Receipts: The above graph indicates that local sales tax receipts, in constant dollars, have increased from $37.0 million in FY98 to $40.0 million in FY08, representing an average annual increase (after the effect of inflation is removed) of 1.4 percent. The elasticity of this revenue stream is evidenced by the decline in FY02 and the most recent fiscal year, FY08, both of which represent the beginning of a recessionary economic environment. Prior to that, the more recent upward trends were marked by a healthy local and national economy as seen during much of the 1990’s and economic recovery period between 2004 and 2007. With the retraction in FY02, sales tax receipts decreased. However, a surprising thing occurred in FY02. In spite of the decline in total sales tax receipts, Henrico County’s retail sales as a percentage of total sales in the Richmond Metropolitan Area (including the City of Richmond and Chesterfield County) actually increased from the FY01 level of 45.98 percent to 48.91 percent. This occurred because Henrico’s diversified retailers offered more of a choice to the region’s shoppers during this recent recession. In FY03, local sales tax receipts rebounded from the previous year, increasing by 4.8 percent representing the largest constant dollar increase since FY00. In FY04, inflation adjusted sales declined from $41.8 million to $40.8 million, decreasing by 2.4 percent from the previous fiscal year. This decline was driven by an increase in the inflation factor, which overshadowed the increase in local sales tax receipts. FY05 inflation adjusted sales of $42.1 million and the FY06 inflation adjusted sales of $42.8 million reflects increases of 3.2 percent and 1.7 percent, respectively. In FY07, inflation adjusted sales declined slightly from $42.8 to $42.6 million. In FY08, inflation adjusted sales declined from $42.6 million to $40.0 million, a decrease of 6.0 percent from the prior fiscal year. This year-over-year decrease is by far the highest recorded in this eleven-year time period. The reasons for this decrease are twofold. First, as mentioned above, local sales tax collections are highly elastic and the recessionary economic environment present through much of FY08 hindered growth in this revenue source. It should be noted that real unadjusted local sales tax revenue declined 1.3 percent in FY08 from prior fiscal year collections. Second, like the Real Property value indicator, the values noted in the graph are inflation
Local Retail Sales and Business Receipts(In Constant Dollars)
$5,000$10,000
$15,000$20,000$25,000
$30,000
$35,000$40,000
$45,000
1998 1999 2000 2001 2002 2003 2004 2005 2006 2007 2008
Retail Sales Business Receipts
Thousands
442
adjusted (constant dollars), and in FY08 the consumer price index was measured at 5.0 percent, the largest such increase since 1989. With the continuing economic downturn, a warning trend is noted for this indicator in the near term, as it is likely that sales tax revenue collections will decline or remain stagnant throughout this economic environment. However, because of the diversity of retailers that Henrico County offers, when the economy begins its recovery, it is anticipated that local sales tax revenues will again show signs of healthy growth. II. Local Business and Professional License (BPOL) Tax Receipts: The graph for the eleven-year period shown above indicates that local business license tax receipts, in constant dollars, have been maintained at a level that kept up with inflationary changes. This is important because of the fact that between FY98 and FY00, the Henrico County Board of Supervisors phased in a tax reduction strategy, (implemented in 1996), which reduced BPOL tax rates as a means of encouraging more businesses to locate in the County. The mostly positive trend in business and professional license tax receipts since this strategy was implemented strongly suggests that the tax reduction strategy paid off. The FY02, FY03, and FY04 totals reflect a decrease when compared to the FY01 totals, however a decrease was anticipated as the local economy was in recession. FY05, FY06, and FY07 totals rebounded strongly from the recessionary period, with constant dollar gains of 3.5 percent, 7.3 percent, and 6.3 percent, respectively. Like local sales tax revenues, FY08 BPOL tax receipts (constant dollars) reflect the sharpest year-over-year decrease in this eleven-year time period due to the struggling economy and unusually high inflation. While this indicator reflects a significant decrease, real unadjusted BPOL tax revenue only reflects a slight decrease of 1.0 percent. It should be noted that in FY02, the beginning of the last economic recession, BPOL tax receipts declined 2.4 percent from the prior fiscal year, more than twice as high as in FY08, and reflects the only other decline in unadjusted BPOL tax receipts in this eleven-year time period. As with local sales tax collections, a warning trend is noted for the immediate future, as the current economic downturn is impacting every facet of the business community, which will have a direct impact on BPOL tax receipts. Because of the diversified nature of the County’s business community, when the current economic recession is over and the economy begins to rebound, BPOL tax receipts will again show strong growth.
443
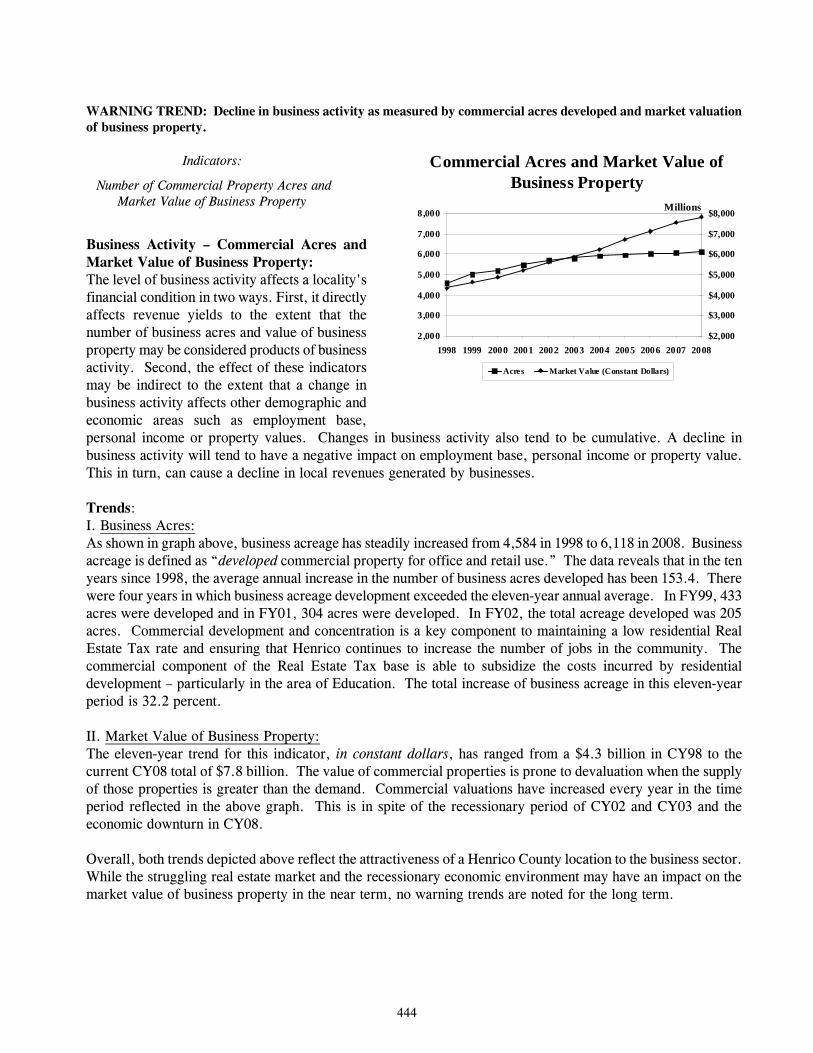
WARNING TREND: Decline in business activity as measured by commercial acres developed and market valuation of business property. Indicators: Number of Commercial Property Acres and Market Value of Business Property
Business Activity – Commercial Acres and Market Value of Business Property: The level of business activity affects a locality's financial condition in two ways. First, it directly affects revenue yields to the extent that the number of business acres and value of business property may be considered products of business activity. Second, the effect of these indicators may be indirect to the extent that a change in business activity affects other demographic and economic areas such as employment base, personal income or property values. Changes in business activity also tend to be cumulative. A decline in business activity will tend to have a negative impact on employment base, personal income or property value. This in turn, can cause a decline in local revenues generated by businesses. Trends: I. Business Acres: As shown in graph above, business acreage has steadily increased from 4,584 in 1998 to 6,118 in 2008. Business acreage is defined as “developed commercial property for office and retail use.” The data reveals that in the ten years since 1998, the average annual increase in the number of business acres developed has been 153.4. There were four years in which business acreage development exceeded the eleven-year annual average. In FY99, 433 acres were developed and in FY01, 304 acres were developed. In FY02, the total acreage developed was 205 acres. Commercial development and concentration is a key component to maintaining a low residential Real Estate Tax rate and ensuring that Henrico continues to increase the number of jobs in the community. The commercial component of the Real Estate Tax base is able to subsidize the costs incurred by residential development – particularly in the area of Education. The total increase of business acreage in this eleven-year period is 32.2 percent. II. Market Value of Business Property: The eleven-year trend for this indicator, in constant dollars, has ranged from a $4.3 billion in CY98 to the current CY08 total of $7.8 billion. The value of commercial properties is prone to devaluation when the supply of those properties is greater than the demand. Commercial valuations have increased every year in the time period reflected in the above graph. This is in spite of the recessionary period of CY02 and CY03 and the economic downturn in CY08. Overall, both trends depicted above reflect the attractiveness of a Henrico County location to the business sector. While the struggling real estate market and the recessionary economic environment may have an impact on the market value of business property in the near term, no warning trends are noted for the long term.
Commercial Acres and Market Value of Business Property
2,000
3,000
4,000
5,000
6,000
7,000
8,000
1998 1999 2000 2001 2002 2003 2004 2005 2006 2007 2008$2,000
$3,000
$4,000
$5,000
$6,000
$7,000
$8,000
Acres Market Value (Constant Dollars)
Millions
444

Des
crip
tion
1998
1999
2000
2001
2002
2003
2004
2005
2006
2007
2008
Rev
enue
s P
er C
apit
a1,
996.
62,
084.
12,
115.
02,
150.
12,
131.
02,
166.
52,
230.
72,
283.
82,
332.
02,
423.
42,
405.
5E
xpen
ditu
res
Per
Cap
ita
1,89
1.7
1,91
7.9
1,95
6.6
1,99
3.8
2,01
3.3
2,08
8.3
2,13
4.3
2,15
5.5
2,18
5.5
2,24
3.6
2,28
5.2
(In
Con
stan
t Dol
lars
)
Inte
rgov
ernm
enta
l Rev
enue
s (w
itho
ut P
PT
RA
)34
.0%
35.8
%35
.6%
35.6
%35
.4%
35.2
%36
.5%
37.2
%36
.2%
37.9
%38
.9%
Inte
rgov
ernm
enta
l Rev
enue
s (P
PT
RA
onl
y)2.
7%4.
0%5.
3%5.
0%4.
7%4.
2%4.
9%4.
0%3.
8%
Ela
stic
Tax
Rev
enue
s12
.3%
11.7
%11
.8%
11.4
%10
.8%
10.9
%10
.2%
10.1
%10
.0%
9.6%
9.0%
(as
a %
of
Net
Ope
rati
ng R
even
ue)
Pro
pert
y T
ax R
even
ues
198,
413
205,
547
199,
859
198,
846
205,
003
213,
546
222,
598
238,
188
252,
128
268,
228
274,
183
(In
Con
stan
t Dol
lars
)
Unc
olle
cted
Pro
pert
y T
ax R
even
ues
1.1%
2.1%
2.9%
1.8%
0.6%
0.6%
0.6%
0.6%
0.5%
0.5%
0.5%
(as
a %
of
Tot
al L
evy)
Use
r C
harg
e C
over
age
57.0
%62
.3%
59.2
%60
.7%
50.6
%55
.3%
50.6
%53
.0%
52.4
%50
.1%
48.0
%(R
even
ues/
Exp
endi
ture
s)
Rev
enue
Sho
rtfa
lls
-1.6
%-3
.0%
-3.0
%-3
.2%
-2.4
%-2
.1%
-6.6
%-3
.1%
-5.4
%-5
.1%
-5.8
%(a
s a
% o
f N
et O
pera
ting
Rev
enue
)
Em
ploy
ees
Per
Cap
ita
13.3
13.1
13.0
12.8
13.0
13.0
13.0
12.8
12.9
13.0
13.1
(Em
ploy
ees
per
thou
sand
pop
ulat
ion)
Fri
nge
Ben
efit
s24
.9%
25.6
%25
.9%
26.0
%25
.3%
26.1
%26
.7%
27.6
%28
.4%
31.3
%32
.2%
(as
a %
of
Sal
arie
s)
Ope
rati
ng S
urpl
uses
5.3%
7.4%
5.3%
5.9%
3.9%
3.2%
3.6%
6.0%
8.4%
9.6
%
6
.9%
(as
a %
of
Net
Ope
rati
ng R
even
ue)
Ent
erpr
ise
Los
ses
(In
Con
stan
t Dol
lars
)10
.103
12.2
2810
.794
11.1
6717
.947
10.1
158.
540
4.58
68.
343
9.05
29.
657
Gen
eral
Fun
d B
alan
ces
7.0%
8.2%
10.0
%12
.1%
13.6
%14
.3%
14.2
%13
.8%
13.3
%13
.3%
13.5
%(a
s a
% o
f N
et O
pera
ting
Rev
enue
)
Liq
uidi
ty22
1.4%
225.
0%24
0.9%
255.
2%25
1.4%
248.
5%27
1.1%
266.
0%29
4.9%
297.
1%34
2.2%
(Cas
h &
Inv
estm
ents
as
a %
of
Cur
rent
Lia
bili
ties
)
Cur
rent
Lia
bili
ties
9.4%
9.3%
9.4%
9.9%
10.7
%11
.3%
10.6
%11
.2%
9.7%
9.7%
8.9%
(as
a %
of
Net
Ope
rati
ng R
even
ue)
Lon
g T
erm
Deb
t1.
8%1.
9%1.
7%1.
7%1.
6%1.
6%1.
5%1.
2%1.
2%1.
2%1.
1%(a
s a
% o
f A
sses
sed
Val
uati
on)
Deb
t Ser
vice
6.1%
5.9%
5.2%
4.9%
5.2%
5.4%
5.1%
4.7%
5.0%
5.2%
5.3%
(as
a %
of
Net
Ope
rati
ng R
even
ue)
Acc
umul
ated
Em
ploy
ee L
eave
Lia
bili
ty22
.223
.023
.023
.022
.823
.123
.323
.223
.022
.524
.5(i
n D
ays)
Lev
el o
f C
apit
al O
utla
y3.
6%3.
8%3.
5%3.
7%3.
7%3.
9%3.
4%3.
5%3.
5%3.
0%3.
1%
FIN
AN
CIA
L IN
DIC
AT
OR
S D
ISPL
AY
ED
GR
APH
ICA
LL
Y
445
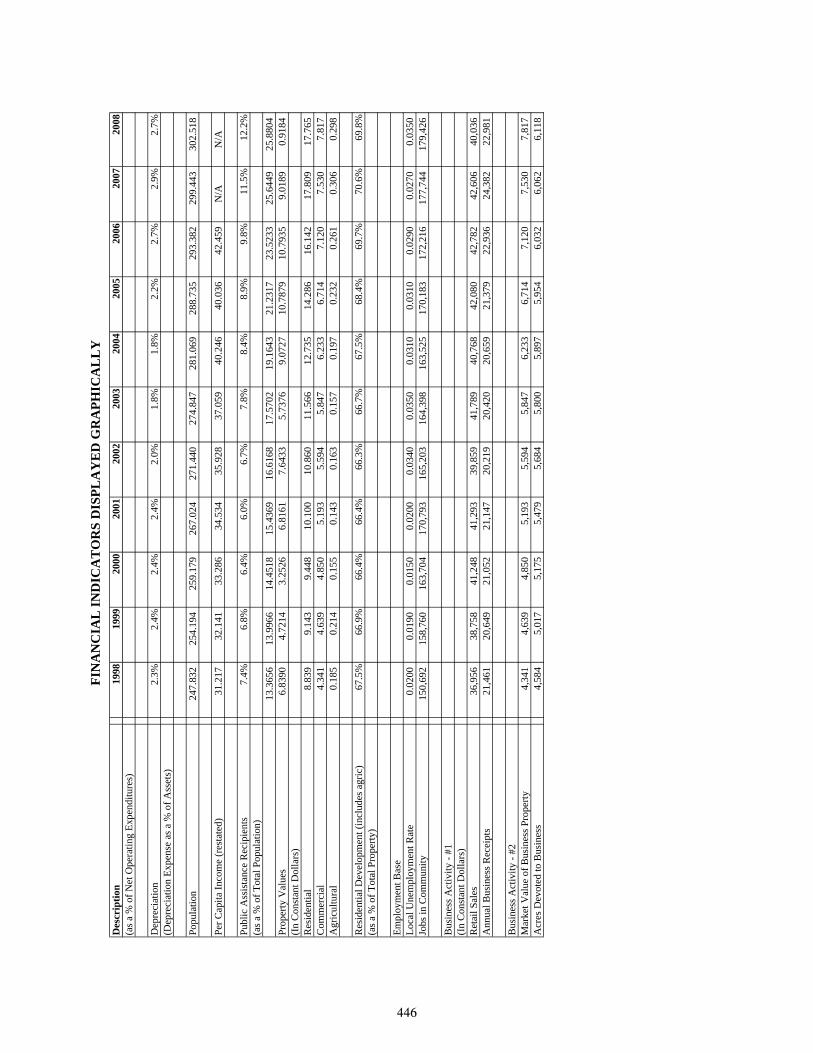
Des
crip
tion
1998
1999
2000
2001
2002
2003
2004
2005
2006
2007
2008
FIN
AN
CIA
L IN
DIC
AT
OR
S D
ISPL
AY
ED
GR
APH
ICA
LL
Y
(as
a %
of
Net
Ope
rati
ng E
xpen
ditu
res)
Dep
reci
atio
n2.
3%2.
4%2.
4%2.
4%2.
0%1.
8%1.
8%2.
2%2.
7%2.
9%2.
7%(D
epre
ciat
ion
Exp
ense
as
a %
of
Ass
ets)
Pop
ulat
ion
247.
832
254.
194
259.
179
267.
024
271.
440
274.
847
281.
069
288.
735
293.
382
299.
443
302.
518
Per
Cap
ita
Inco
me
(res
tate
d)31
.217
32.1
4133
.286
34.5
3435
.928
37.0
5940
.246
40.0
3642
.459
N/A
N/A
Pub
lic
Ass
ista
nce
Rec
ipie
nts
7.4%
6.8%
6.4%
6.0%
6.7%
7.8%
8.4%
8.9%
9.8%
11.5
%12
.2%
(as
a %
of
Tot
al P
opul
atio
n)13
.365
613
.996
614
.451
815
.436
916
.616
817
.570
219
.164
321
.231
723
.523
325
.644
925
.880
4P
rope
rty
Val
ues
6.83
904.
7214
3.25
266.
8161
7.64
335.
7376
9.07
2710
.787
910
.793
59.
0189
0.91
84(I
n C
onst
ant D
olla
rs)
Res
iden
tial
8.83
99.
143
9.44
810
.100
10.8
6011
.566
12.7
3514
.286
16.1
4217
.809
17.7
65C
omm
erci
al4.
341
4.63
94.
850
5.19
35.
594
5.84
76.
233
6.71
47.
120
7.53
07.
817
Agr
icul
tura
l0.
185
0.21
40.
155
0.14
30.
163
0.15
70.
197
0.23
20.
261
0.30
60.
298
Res
iden
tial
Dev
elop
men
t (in
clud
es a
gric
)67
.5%
66.9
%66
.4%
66.4
%66
.3%
66.7
%67
.5%
68.4
%69
.7%
70.6
%69
.8%
(as
a %
of
Tot
al P
rope
rty)
Em
ploy
men
t Bas
eL
ocal
Une
mpl
oym
ent R
ate
0.02
000.
0190
0.01
500.
0200
0.03
400.
0350
0.03
100.
0310
0.02
900.
0270
0.03
50Jo
bs in
Com
mun
ity
150,
692
158,
760
163,
704
170,
793
165,
203
164,
398
163,
525
170,
183
172,
216
177,
744
179,
426
Bus
ines
s A
ctiv
ity
- #1
(In
Con
stan
t Dol
lars
)R
etai
l Sal
es36
,956
38
,758
41
,248
41
,293
39
,859
41
,789
40
,768
42
,080
42
,782
42
,606
40
,036
A
nnua
l Bus
ines
s R
ecei
pts
21,4
61
20,6
49
21,0
52
21,1
47
20,2
19
20,4
20
20,6
59
21,3
79
22,9
36
24,3
82
22,9
81
Bus
ines
s A
ctiv
ity
- #2
Mar
ket V
alue
of
Bus
ines
s P
rope
rty
4,34
1
4,63
9
4,85
0
5,19
3
5,59
4
5,84
7
6,23
3
6,71
4
7,12
0
7,53
0
7,81
7
Acr
es D
evot
ed to
Bus
ines
s4,
584
5,
017
5,
175
5,
479
5,
684
5,
800
5,
897
5,
954
6,
032
6,
062
6,
118
446

Item
Des
crip
tion
1998
1999
2000
2001
2002
2003
2004
2005
2006
2007
2008
1.3
Cas
h &
Sho
rt T
erm
Inv
estm
ents
103,
318
112,
855
131,
589
158,
160
171,
895
187,
865
209,
971
23
4,08
5
24
2,87
9
268,
646
29
8,30
4
1.
4A
ccou
nts
Pay
able
26,7
36
27
,416
32,1
65
37
,329
41,5
02
47
,298
49,6
07
54
,607
46,6
17
51
,420
49,4
07
1.
7P
rinc
iple
due
in 1
2 m
onth
s16
,322
18,9
27
18
,382
20,3
17
22
,142
23,3
51
23
,132
27,0
38
29
,870
33,2
24
30
,749
1.8
Oth
er C
urre
nt L
iabi
liti
es3,
610
3,
823
4,
078
4,
334
4,
730
4,
939
4,
700
6,
354
5,
875
5,
771
7,
021
1.
9T
otal
Cur
rent
Lia
bili
ties
46,6
68
50
,166
54,6
25
61
,980
68,3
73
75
,587
77,4
39
87
,999
82,3
62
90
,414
87,1
77
1.10
Net
Dir
ect L
ong
Ter
m D
ebt
238,
827
268,
245
264,
534
283,
262
287,
105
314,
423
329,
992
30
6,86
1
35
7,63
8
399,
683
39
6,26
9
1.
12C
ost D
epre
ciab
le F
ixed
Ass
ets
639,
991
667,
164
714,
837
739,
416
774,
354
831,
112
880,
456
92
2,32
6
95
7,37
7
982,
096
1,
015,
665
1.13
Dep
reci
atio
n E
xpen
se14
,733
15,9
42
17
,041
17,5
87
15
,744
15,1
86
16
,028
19,9
95
25
,879
28,0
10
27
,596
1.14
Gen
eral
Fun
d O
pera
ting
Sur
plus
26,4
03
40
,122
30,5
72
37
,266
24,7
33
21
,720
25,9
57
47
,396
71,8
14
88
,709
67
,853
1.15
Ent
erpr
ise
Ope
rati
ng R
esul
ts10
,103
12,4
68
11
,410
12,1
95
19
,808
11,4
00
9,
939
5,
472
10
,386
11,5
74
12
,962
1.16
Gen
eral
Fun
d B
alan
ces
68,2
29
75
,705
89,8
79
11
2,55
3
11
8,78
1
12
6,95
0
14
0,67
0
161,
517
199,
079
20
7,45
3
239,
708
1.17
Gen
eral
Fun
d R
estr
icte
d B
alan
ces
33,6
98
31
,557
31,9
28
36
,860
31,6
91
31
,298
36,7
18
53
,132
85,4
42
84
,029
107,
615
1.18
Gen
eral
Fun
d U
nres
tric
ted
Bal
ance
s34
,532
44,1
47
57
,951
75,6
93
87
,090
95,6
52
10
3,95
2
108,
385
113,
637
12
3,42
4
132,
093
1.19
Unc
olle
cted
Pro
pert
y T
axes
2,25
7
4,47
9
6,67
0
4,41
7
1,53
9
1,55
3
1,67
8
2,03
7
1,63
8
1,90
1
2,03
5
1.20
Ful
l Pro
pert
y T
ax L
evy
198,
886
213,
104
230,
461
244,
518
256,
109
265,
314
287,
938
32
4,71
2
33
9,09
1
352,
305
36
9,93
0
2.1
Pro
pert
y T
ax R
even
ues
198,
413
209,
583
211,
261
217,
145
226,
258
240,
665
259,
061
28
4,21
8
31
3,84
5
342,
937
36
8,04
4
2.
2C
omm
itte
d U
ser
Cha
rges
19,0
49
20
,887
22,0
25
24
,104
23,1
79
24
,135
23,9
07
26
,143
28,3
34
29
,142
28,8
65
2.
3U
ncom
mit
ted
Use
r C
harg
es6,
962
7,
080
7,
345
7,
890
8,
457
8,
961
9,
646
9,
744
9,
970
6,
730
2,
830
2.
4O
ther
Rev
enue
gre
ater
than
5%
82,3
46
90
,183
95,4
57
10
2,02
9
10
1,46
8
10
9,46
5
11
6,44
3
118,
320
125,
617
12
5,92
7
122,
796
2.5
Oth
er R
even
ue le
ss th
an 5
%19
,982
18,8
91
21
,402
27,7
49
19
,064
17,8
06
20
,081
22,4
79
23
,470
33,8
00
37
,612
2.6
Tot
al L
ocal
Ope
rati
ng R
even
ue32
6,75
2
34
6,62
3
35
7,49
1
37
8,91
6
37
8,42
7
40
1,03
1
42
9,13
7
460,
904
501,
236
53
8,53
5
560,
147
2.7
Inte
rgov
ernm
enta
l Ope
rati
ng R
even
ue16
8,06
8
19
3,53
5
22
1,94
9
24
8,04
7
25
9,99
3
27
0,03
4
30
0,53
5
325,
935
350,
394
38
9,24
9
416,
686
2.7
Inte
rgov
ernm
enta
l Ope
rati
ng R
even
ue (
wit
hout
PP
TR
A r
eim
burs
emen
ts)
206,
338
222,
944
226,
102
236,
387
266,
444
29
2,61
2
30
8,26
3
352,
028
37
9,68
6
2.
10G
ross
Ope
rati
ng R
even
ues
494,
820
540,
159
579,
440
626,
964
638,
420
671,
066
729,
672
78
6,83
9
85
1,62
9
927,
785
97
6,83
3
2.
13N
et O
pera
ting
Rev
enue
s49
4,82
0
54
0,15
9
57
9,44
0
62
6,96
4
63
8,42
0
67
1,06
6
72
9,67
2
786,
839
851,
629
92
7,78
5
976,
833
2.14
Res
tric
ted
Ope
rati
ng R
even
ues
141,
441
161,
581
176,
207
186,
473
191,
910
204,
837
231,
539
26
2,13
6
28
0,14
8
317,
359
32
8,34
8
2.
15E
last
ic O
pera
ting
Rev
enue
60,9
58
62
,956
68,5
70
71
,451
69,0
17
73
,331
74,5
09
79
,200
85,2
08
89
,286
87,5
79
2.
17N
et O
pera
ting
Rev
enue
Bud
gete
d48
6,82
2
52
4,05
7
56
2,08
4
60
7,12
4
62
3,40
9
65
7,00
0
68
1,73
5
762,
685
806,
056
88
0,55
7
920,
221
3.1
Sal
arie
s an
d W
ages
263,
904
276,
056
302,
193
316,
750
332,
167
346,
539
363,
879
39
3,16
0
41
3,03
1
440,
213
46
4,01
6
3.
2F
ring
e B
enef
its
65,7
87
70
,614
78,2
28
82
,348
83,9
45
90
,538
97,2
82
10
8,50
5
11
7,37
9
137,
938
14
9,22
0
3.
3S
uppl
ies
21,9
94
23
,196
25,0
16
32
,612
27,2
82
27
,386
28,2
52
31
,976
34,4
33
36
,858
40,7
64
3.
4S
ervi
ces
46,1
87
52
,493
58,1
88
64
,681
88,0
36
78
,659
94,0
74
93
,720
88,0
68
10
9,41
3
117,
670
3.5
Cap
ital
Out
lay
16,8
50
18
,697
18,8
28
21
,553
22,0
31
25
,398
23,6
78
25
,788
28,0
75
25
,447
28,3
22
3.
6P
rinc
ipal
-Lon
g te
rm D
ebt
15,6
47
17
,267
17,3
97
18
,382
19,9
87
21
,792
22,9
86
22
,747
26,6
33
29
,450
32,7
79
3.
7In
tere
st-L
ong
term
Deb
t14
,624
14,3
69
12
,732
12,4
87
13
,047
14,4
39
13
,961
14,4
66
15
,598
18,5
88
18
,900
3.8
Tot
al D
irec
t Deb
t30
,271
31,6
36
30
,128
30,8
69
33
,034
36,2
31
36
,947
37,2
13
42
,230
48,0
38
51
,679
3.9
Oth
er E
xpen
ditu
res
17,7
89
18
,448
17,4
65
26
,268
29,3
69
34
,656
46,0
93
44
,101
54,8
42
36
,926
52,4
00
3.
10In
tern
al S
ervi
ce F
und
Tra
nsfe
rs6,
044
5,
946
5,
990
6,
316
6,
852
7,
441
7,
930
8,
173
20
,083
24,1
13
23
,917
3.11
Tot
al N
et O
pera
ting
Exp
endi
ture
s46
8,82
7
49
7,08
6
53
6,03
6
58
1,39
8
60
3,15
0
64
6,84
8
69
8,13
6
742,
636
798,
141
85
8,94
6
927,
990
3.12
Num
ber
of G
ener
al G
over
nmen
t Em
ploy
ees
3,28
4
3,31
8
3,35
8
3,41
6
3,51
7
3,56
1
3,64
0
3,69
4
3,77
4
3,89
5
3,95
3
3.13
Unu
sed
Ann
ual L
eave
(in
day
s)72
,946
76,3
39
77
,361
78,5
19
80
,217
82,1
82
84
,862
85,6
61
86
,980
87,5
02
96
,971
3.14
Unu
sed
Sic
k L
eave
(in
day
s)24
3,54
8
24
4,96
8
24
7,07
4
24
8,17
8
25
1,41
1
25
5,59
3
25
7,59
0
261,
646
267,
779
27
2,36
0
270,
336
3.15
Exp
endi
ture
s C
over
ed b
y C
harg
es33
,428
33,5
25
37
,233
39,7
28
45
,846
43,6
74
47
,267
49,2
96
54
,040
58,1
76
60
,157
7.1
Pop
ulat
ion
(Cal
enda
r Y
ear)
247,
832
254,
194
259,
179
267,
024
271,
440
274,
847
281,
069
28
8,73
5
29
3,38
2
299,
443
30
2,51
8
7.
3T
otal
Per
sona
l Inc
ome
(Tho
us. o
f $)
7,91
2,16
9
8,
288,
655
8,76
1,63
3
9,
184,
465
9,62
2,92
0
10
,065
,647
11,1
06,3
99
11,2
34,0
15
12
,125
,029
N
/AN
/AP
er C
apit
a In
com
e31
.217
32.1
41
33
.286
34.5
3435
.928
37.0
5940
.246
40.0
3642
.459
N/A
N/A
7.4
Pub
lic
Ass
ista
nce
Rec
ipie
nts
18,2
97
17
,285
16,6
45
16
,028
18,1
82
21
,369
23,6
28
25
,591
28,6
56
34
,469
36,7
99
7.
6M
arke
t Val
ue o
f P
rope
rty
(Mil
. of
$)13
,366
14,2
71
15
,276
16,8
57
18
,340
19,8
01
22
,303
25,3
35
29
,282
32,7
88
34
,740
7.8
Mar
ket V
alue
-Res
iden
tial
(M
il. o
f $)
8,83
9
9,32
3
9,98
7
11,0
30
11
,986
13,0
35
14
,821
17,0
47
20
,093
22,7
70
23
,847
7.9
Mar
ket V
alue
-Com
mer
cial
(M
il. o
f $)
4,34
1
4,73
0
5,12
6
5,67
1
6,17
3
6,59
0
7,25
4
8,01
2
8,86
3
9,62
7
10,4
93
7.
10M
arke
t Val
ue-A
gric
ultu
ral (
Mil
. of
$)18
5
21
8
16
4
15
7
18
0
17
7
22
9
27
7
32
5
39
1
40
0
7.
11R
esid
enti
al H
ouse
hold
s (C
alen
dar
Yea
r)10
6,43
1
11
0,08
3
11
1,98
2
11
3,04
1
11
4,88
4
11
6,34
5
11
9,10
7
121,
505
123,
457
12
5,97
2
127,
046
7.12
Vac
ancy
Rat
es-R
esid
enti
al (
Cal
enda
r Y
ear)
1.9%
1.7%
1.8%
1.4%
1.4%
1.4%
1.4%
1.5%
1.5%
1.6%
1.6%
7.15
Loc
al U
nem
ploy
men
t Rat
e2.
0%1.
9%1.
5%2.
0%3.
4%3.
5%3.
1%3.
1%2.
9%2.
7%3.
5%7.
16Jo
bs W
ithi
n C
omm
unit
y15
0,69
2
15
8,76
0
16
3,70
4
17
0,79
3
16
5,20
3
16
4,39
8
16
3,52
5
170,
183
172,
216
17
7,74
4
179,
426
7.17
Ret
ail S
ales
(T
hous
. of
$)36
,956
39,5
19
43
,602
45,0
93
43
,992
47,0
96
47
,446
50,2
12
53
,254
54,4
73
53
,742
7.19
Ann
ual B
usin
ess
Rec
eipt
s (T
hous
. of
$)21
,461
21,0
54
22
,253
23,0
93
22
,315
23,0
13
24
,042
25,5
10
28
,551
31,1
74
30
,848
7.20
Bus
ines
s A
cres
(C
alen
dar
Yea
r)4,
584
5,
017
5,
175
5,
479
5,
684
5,
800
5,
897
5,
954
6,
032
6,
062
6,
118
7.
21C
PI
163.
016
6.2
172.
317
8.0
179.
918
3.7
189.
719
4.5
202.
920
8.4
218.
87.
22C
PI-
Inde
x1.
0000
1.01
961.
0571
1.09
201.
1037
1.12
701.
1638
1.19
331.
2448
1.27
851.
3423
GE
NE
RA
L F
INA
NC
IAL
AN
D E
CO
NO
MIC
DA
TA
447

ECONOMIC DATA SOURCES
External Sources: Bureau of Economic Analysis Bureau of Labor Statistics Economic Assumptions for the United States and Virginia Virginia Employment Commission Evaluating Financial Condition, A Handbook for Local Government International City/County Management Association Federal Reserve Bulletins Periodicals:
Richmond Times-Dispatch Wall Street Journal
The Commercial Real Estate Report (published annually) A Review of Richmond and Global Trends in Commercial Real Estate Published by Morton G. Thalhimer, Inc. The Richmond Region at a Glance, August 2008 A Sampler of Economic and Demographic Characteristics for the Richmond-Petersburg Metropolitan Statistical Area Published by the Richmond Regional Planning District Commission U.S. Census Bureau Virginia Economic Indicators Virginia Employment Commission Weldon Cooper Center for Public Service Internal Sources: Department of Human Resources, Annual Reports Departments of Finance, Human Resources, Planning, and Social Services Henrico County Approved Annual Fiscal Plans, FY98 – FY08 Henrico County Comprehensive Annual Financial Reports, June 30, 1998 - 2008 Manager's Monthly Reports
448