Embed Size (px)
Citation preview

16
Appendix A – Technical Briefs

17
ALTERNATIVE ENERGY ANALYSIS
Technical Briefs for Alternative Technologies
Chapel Hill, North Carolina
July 18, 2008
Prepared for:
Prepared by:

18
TABLE OF CONTENTS – TECHNICAL BRIEFS
Overview & Methodology ...................................................................................................................... OM‐1
Section A – Biomass Gasification ............................................................................................................... A‐1
Section B – Co‐Firing Biomass .................................................................................................................... B‐1
Section C – Poultry Litter ........................................................................................................................... C‐1
Section D – Solar PV .................................................................................................................................. D‐1
Section E – Solar Thermal .......................................................................................................................... E‐1
Section F – Anaerobic Digestion of Animal Waste ..................................................................................... F‐1
Section G – Wind Power ........................................................................................................................... G‐1
Section H – Fuel Cell .................................................................................................................................. H‐1
Section I – Geothermal ............................................................................................................................... I‐1
Section J – Ocean/Tidal Energy ................................................................................................................... J‐1
Section K – Algae ........................................................................................................................................ K‐1
Section L – Sequestration .......................................................................................................................... L‐1
Section M – Landfill Gas ............................................................................................................................M‐1

OVERVIEW AND METHODOLOGY
Page OM‐1
The following pages include summary information on each of the technologies listed in the table of
contents above. This information was assembled from various sources including government agencies,
technology developers and industry associations. These summaries were compiled to provide high level
background information on each technology and are not intended to be a comprehensive assessment of
the latest research and developments in each technology area, although efforts have been made to
include the most current information as possible.
Each summary is organized into the following sections:
Executive Summary
Technology (different types, successful implementations)
Market (strength of potential partners, potential volatility of resource potential)
Availability of Resource (national overview)
Preliminary Economic Assessment (relative cost of fuel, relative cost of implementation)
Environmental Considerations (carbon reduction, community support, etc.)
Political/Regulatory Considerations (regulatory complexity, permitting, siting, etc.)
Risk (technology, implementation, arguments for/against, fuel availability and reliability)
Potential Industry Partners
This information will be used in a preliminary scoring and prioritization of the technologies relative to
the following considerations:
Maturity of technology (mature, emerging, untested)
Maturity of market
Potential industry partners
Political/regulatory considerations
Relative cost of fuel
Relative implementation cost
Preliminary economic assessment (based on publicly available and limited vendor information)
Preliminary operability assessment
Environmental impact (carbon reduction, permitting, community support, etc)
Risk (Technology, fuel availability and reliability)

Section A
Preliminary Technology Screen –
Biomass Gasification

SECTION A ‐ PRELIMINARY TECHNOLOGY SCREEN – BIOMASS GASIFICATION
Page A‐1
Executive Summary Biomass gasification is regarded as one of the most promising renewable energy technologies in terms
of enabling the increased utilization of biomass for power and heat production. Systems for industrial
scale biomass‐fueled combined heat and power production are becoming commercialized. Over the past
few decades, full scale demonstration projects have proven the technologies and notable progress has
been made towards improving systems and reducing capital costs.
Gasification is an old technology yet is still undergoing critical advancements necessary for full
commercialization. Coal gasification was widely used throughout the industrial revolution, but was
heavily offset by the advent of petroleum. Gasification technology has recently experienced a
reawakening due to environmental regulations along with increased interest in the utilization of
biomass.
Gasification is a proven “BTU conversion” technology that can offer viable solutions for a variety of
electrical, thermal, and chemical fuels applications. A main advantage of gasification technology is the
ability to use a variety of feeds and offer a clean gas, similar to natural gas. Gasification of biomass
permits the use of highly efficient movers such as gas turbines and internal combustion engines.
There are a variety of biomass gasification technologies that can provide UNC with the means of
offsetting conventional fuels in lieu of renewable fuels. Possible methods of implementation range from
small systems to highly efficient, fully integrated combined cycle systems.
Additional information on specific applications of this technology is included in the Biomass Gasification
Supplement at the end of this document.
Overview of Biomass Gasification Process
Biomass Gasification is a thermal conversion technology where a solid fuel is converted into a
combustible gas, also known as synthesis gas (syngas). The process is an extremely efficient means of
extracting energy from biomass, offering an improvement on energy conversion efficiency over direct
combustion of the original biomass.
The principle of gasification is to heat biomass materials at low equivalence ratios or in a fully oxygen‐
starved environment as to break the bonds between carbon‐hydrogen compounds with high molecular‐
weight, converting them to hydrocarbons with low molecular weight that can be used more
conveniently.
Gasification relies on endothermic reactions taking place at elevated temperatures >1200°F,
distinguishing it from the natural biological process of anaerobic digestion that produces biogas. Any
biomass can undergo gasification making it attractive when compared to ethanol production or biogas
where only selected biomass materials can be used to produce the fuel.

SECTION A ‐ PRELIMINARY TECHNOLOGY SCREEN – BIOMASS GASIFICATION
Page A‐2
Gasification can utilize feedstocks that are not otherwise useful fuels, such as certain recalcitrant feeds
and organic waste. Large scale gasification technologies have been demonstrated using a variety of
agricultural and industrial residues such as waste tires and refuse‐derived fuel (RDF).
Biomass feed often has a variety of contaminants that can limit its potential as a viable fuel source. High
temperatures in the gasification process help to remove corrosive ash elements such as chloride and
potassium, allowing clean gas production from otherwise problematic fuels.
Specific syngas composition depends on the fuel source as well as the gasifier design. The same fuel may
offer different heating values and gas qualities when processed in two different gasifiers. Fuel type and
downstream gas utilization are the two major factors in determining what type of gasification system
best suits a given application.
The gasification process consists of two major stages:
Pyrolysis
Gasification
Although there is a considerable overlap of the processes, each can be assumed to occupy a separate
zone where fundamentally different chemical and thermal reactions take place.
Pyrolysis: When a carbonaceous fuel is heated to 500‐900°F in the absence of an oxidizing agent it
pyrolyses to solid char, condensable hydrocarbons (tar), and gases. The relative levels of gas, liquid, and
char depend mostly on heating rate and final temperature.
Up to 400°F only water is driven off. Between 400 ‐500°F carbon dioxide, acetic acid and water are given
off. The real pyrolysis takes place between 500 ‐900°F where large quantities of tar and carbon dioxide
gas is produced. Besides light tars some methyl alcohol is also formed. Between 900 ‐1300°F the gas
production is small and contains hydrogen.
Generally pyrolysis proceeds at a much quicker rate than gasification and the latter is thus the rate
controlling step.
Gasification: Heat and water are added to the process either by the partial oxidation of fuel or from an
external source. Water, carbon dioxide and uncombusted partially cracked pyrolysis products react with
red‐hot char where the following reactions take place:
C+CO2→2CO (‐164.9 MJ/mole) O+H2O→CO+ H2 (+42 MJ/mole)
C+H2O→CO+ H2 (‐122.6 MJ/mole) +2H2 →CH4 (+75 MJ/mole)
CO2+H2 →CO+H2O (‐42.3 MJ/mole)

SECTION A ‐ PRELIMINARY TECHNOLOGY SCREEN – BIOMASS GASIFICATION
Page A‐3
These reactions are main reduction reactions and being endothermic, reduce gas temperatures in the
reduction zone to 1500 ‐1800°F. The lower the reduction zone temperatures indicate lower heating
value of gas.
Overview of Biomass Gasification Feedstock: Most any carbonaceous biomass can be gasified. Existing
gasification technologies can utilize a wide variety of feeds including refuse‐derived fuel and a diverse
assortment of industrial waste and agricultural residues. The key to successful implementation of a
gasification facility is the local availability of feedstock. Certain gasification/power technologies have the
appetite for large throughputs that require a constant supply of biomass.
Many small scale gasification systems have been fully commercialized and are generally an excellent
means of dealing with a localized availability of residues. These examples are commonly seen in
agriculture where local crop residues are used in smaller gasification units to produce gas for heating
and to power internal combustion engines for agricultural processes or electrical generation.
Woody Biomass is an abundant resource and is commonly used as feed in gasification. Producing wood
gas using a fixed bed reactor is the most common example of gasification worldwide. On average, 1 kg
of biomass produces about 2.5 m3 of producer gas at standard temperature and pressure. In this process
it consumes about 1.5 m3 of air for combustion1. For complete combustion of wood about 4.5 m3 of air
is required. Biomass gasification consumes about one third of the stoichiometric air ratio for wood
burning.
Wood is a young fuel; therefore it has a higher hydrogen/carbon ratio and oxygen/carbon ratio than
older (fossil) fuels. This results in a higher gasification yield of both gasses and hydrocarbons such as
tars. Tars are generally not an issue if they do not polymerise or condense. If the tar is allowed to
condense considerable problems can occur with equipment contamination.
Overview of Biomass Gasification Applications: The following diagram shows the products and
applications of gasification and pyrolysis as compared to combustion technologies.
There are three main applications associated with today’s thermal conversion technologies:
direct heat applications
shaft power systems
chemical production

SECTION A ‐ PRELIMINARY TECHNOLOGY SCREEN – BIOMASS GASIFICATION
Page A‐4
Direct heat may prove to have the widest range off application due to the simplistic design. The main
advantage of direct heating is that gas quality and heating value is not a major concern allowing the
usage of simple gasifier designs. Direct heating can be performed with minimal or no gas treatment
necessary.
Among some of the agricultural uses are grain drying and green house heating. A useful commercial
application is using steam for space heating or to run absorption chillers. These systems can also be
easily coupled with other renewable heat sources such as solar thermal.
Shaft power systems are commonly used in developing countries to drive small generator sets or
agricultural equipment such as pumps, tractors, and harvesters. Syngas often supplements or replaces
diesel fuel in reciprocating engines with minimal modifications.
A major advantage of biomass gasification over direct combustion is the ability to utilize high efficiency
movers such as the combustion turbine. Combustion turbine‐based combined‐cycle technology has
been effectively married to the fluidized bed reactor in a number of full scale demonstration projects.
The result is a reliable combined heat and power generation system with exceptional overall plant
efficiency.
Production of chemicals such as methanol and formic acid from producer gas is a relatively new
achievement. With fossil fuels on the decline and gasification technologies improving, production of
these chemicals with producer gas may prove to be economically feasible.
Future applications will surely include the utilization of hydrogen‐rich syngas in fuel cell plants. The
energy density of such a plant will be favorable compared to an IC engine system.
The most important ingredient to all these applications is the availability of biomass fuel. Gasification
plants have historically been placed in a location where local biomass resources are readily available. For
large utility‐scale gasification, there are increased concerns over biomass delivery and there associated
issues with storage, preparation, handling, and ensuring a uniform and consistent feed. Cost and
reliability of fuel is a major factor in determining whether a gasification plant is economically viable.
Gasification of Biomass and Coal: Although technology for biomass use in turbines remains in early
stages of development, substantial funding has been committed in the U.S., Europe, and Japan to
research and development efforts aimed at marrying the gas turbine to coal using coal‐integrated
gasifier/gas turbine systems.
These efforts have been motivated in part by the large thermodynamic advantages offered by the gas
turbine for power generation and the desire to exploit these advantages with coal in part by the
prospect that burning of coal can be done with much less environmental damage through gasification
than with conventional approaches.
Gasification of coal also has connections to emerging carbon sequestration technologies.
SECTION A ‐ PRELIMINARY TECHNOLOGY SCREEN – BIOMASS GASIFICATION
Page A‐5
Technology While gasification is an old technology it is also a developing one since it was never fully adopted on a
commercial scale. Historically the majority of emphasis has been placed on small‐scale gasifiers devoted
to direct heating applications. It ranges from being fully commercialized for certain feedstocks and
technologies to scientific exploration for other feedstock and more advanced technologies.
Dozens of small gasification facilities are located throughout the world, fueled by local agricultural
residues or industrial byproducts. Until recently, large scale gasification technology has not experienced
notable improvements. In the 1980s government and private industry began to sponsor research and
development efforts to gain a better understanding of the reaction chemistry and scale‐up issues
associated with gasification technologies. In the 1990s, combined heat and power (CHP) systems were
identified as a potential near‐term opportunity for gasification due to existing incentives and favorable
power market drivers. Efforts focused on integrated gasification combined cycle and co‐firing,
culminating on several commercial‐scale systems.
Technical Issues: The efficient removal of tar still remains the main technical barrier for the successful
commercialization of biomass gasification technologies.
The main attempts to eliminate tar concentrate on three approaches: scrubbing, catalytic reforming
followed by scrubbing and hot gas clean up. In the later case the producer gas is kept above 400 °C in
order to avoid tar condensation and the hot fuel gas is burned in the combustion chamber of a gas
turbine. However this approach applies only to pressurized gasification IGCC systems and has been
successfully demonstrated at the Varnamo plant (18) while the quality of the tar produced by the
FOSTER WHEELER gasifier has been reported (36). This approach has been proven successful as there
were no problems due to tar (either in the filters or in the gas turbine) during the operation of the
Varnamo plant for more than 3600 h on IGCC operation.
Firing in Boilers: Firing the raw gas in boilers or direct heat applications after removal of dust and
particulates is the simplest application since gas remains hot and the tar problem is avoided. However
there are few known successful applications which have been operating in a commercial environment.
This market is one where all types of gasifiers can compete and more concerted efforts have been taken
by the gasification industry to increase the number of successful cases.
Indirect Gasification: The Battelle/FERCO project in the US was built at the McNeil power plant in
Burlington, Vermont. The 200 ton per day project employs the low pressure Battelle gasification process
that consists of two reactors: a gasification reactor in which the biomass is converted into a MCV gas
and residual char at a temperature of 1300‐ 1550°F, and a combustion reactor that burns the residual
char to provide heat for gasification. Heat transfer between reactors is accomplished by circulating sand
between the gasifier and combustor. Since the gasification reactions are supported by indirect heating,
the primary fuel gas is a medium calorific value fuel gas. The estimated calorific value of this fuel gas is
approximately 600 BTU/ft3. Full plant operation was achieved in mid 2000 using wood chips from local
logging industry. The fuel gas will be cooled for heat recovery, scrubbed, and recompressed prior to
energy conversion and recovery in a 15MWe gas turbine system.

SECTION A ‐ PRELIMINARY TECHNOLOGY SCREEN – BIOMASS GASIFICATION
Page A‐6
Integrated Gasification Combined Cycle: Several project have been initiated for IGCC applications over
the last decade, however, only two have been implemented, the SYDKRAFT plant at Varnamo based on
FOSTER WHEELER technology and the ARBRE plant based on TPS technology. The Vermont project based
on Battelle/FERCO may be upgraded to an IGCC plant in the medium to long term; however, there are
no concrete plans at present. The Energy Farm project in Pisa with LURGI technology and the Brazilian
project with TPS technology still face implementation problems and their future is uncertain. This
indicates that such large scale projects still face barriers which are mainly related to high installation
cost and high technical risks due to the emerging technology status of gasification. However, the
successful operation of the ARBRE project, the first commercial IGCC, will provide reliability for the
technology and a basis for scaling up with confidence so that the second generation ARBRE could be
built with reduced costs indicated by learning effects.
Market Biomass gasification technologies have reached the point where the first simple applications with
minimal technical risks have been completed and the technology is continuing to advance and more
packaged equipment is becoming commercially available. In addition, the first biomass based IGCC
plants are being demonstrated and are expected to reach commercial status within the next decade.
Continued market opportunities exist for liquid biofuels production and synthetic gas for combustion in
a boiler. These systems have continued to be researched and developed through the 1980’s, and have
reached the point where they are being implemented in the energy market. The development of the
technology has moved beyond the element of the gasifier to the critical area of the supply of a clean
gas, free of particulates and tar.

SECTION A ‐ PRELIMINARY TECHNOLOGY SCREEN – BIOMASS GASIFICATION
Page A‐7
Resource Availability
According to the data collected by NREL, It is estimated that North Carolina produces approximately
3,000 dry tons of forest residue per year.
Emerging specialty energy crops have the potential to supply feedstock to gasification facilities. Coppice
cultures and switchgrass have potential for providing a renewable fuel stream. Intensive pine cultivation
is prevalent in the Southeast U.S. Pine is typically grown for high value lumber and industry but as many
of those markets are changing due to increased international competition, there is interest in finding
new markets for small diameter pine.
A study in the mid‐1990s by the Southeast Regional Biomass Energy Program estimates that a total of
92 Tg of biomass fuel is produced annually in the Southeast. This translates to an estimated 2.3 EJ of
annual energy. North Carolina and Virginia are the leading wood fuel producers at 10.4 Tg and 10.1 Tg
respectively.
Wood energy continues to lead the United States in biomass energy production and accounts for 80% of
the biomass market. Wood waste comes from logging operations, industrial processes, construction
activities, yard waste, and disposal of wood products such as pallets. In North Carolina, wood and wood

SECTION A ‐ PRELIMINARY TECHNOLOGY SCREEN – BIOMASS GASIFICATION
Page A‐8
wastes produced 1.5 million megawatt‐hours of electricity in 1999 representing almost 1/3 of total net
renewable production. The industrial sector is the largest user of wood waste in the form of mill residue.
In fact, wood and wood wastes provide over 11% of North Carolina’s industrial energy needs. Common
industrial uses of wood and forestry residues include on‐site electricity generation and process heat.
Political/Regulatory Considerations North Carolina is the first state in the southeast to adopt a renewable energy standard policy. The bill
calls for 12.5% renewable energy by 2020.
In the advent of deregulation there will be no guaranteed return on investment for utilities and
therefore companies will be forced to minimize production cost for energy. Electric utilities will face
added hardship by the proposed environmental regulations. Unregulated markets promote product
diversity and cause companies to seek out specialized “niche” profits.
Clean coal technologies such as gasification will be of paramount importance for the United States and
other developed countries due to relatively abundant coal supplies and stable prices.
Relative Cost of Fuel Today’s cost for biomass products for use in gasification is relatively inexpensive as compared to
conventional fossil fuel options and is generally equal to or lower than the price of coal. As the demand
for more renewables increases, the cost of the biomass will also increase. There will be some risk
relative to the availability of fuel resources as the demand increase, so there is some element of risk
inherent in the use of this fuel.
Since the gasification process can accommodate multiple fuel types, it would be advantageous to design
a system capable of accepting these multiple fuel source. These could include:
Woody biomass
RDF or municipal waste
Energy crops or other agricultural products
Relative Implementation Cost Cost reductions and performance improvements are expected to continue based on the technical
experience gained through various demonstration projects. The largest cost reductions will certainly
occur in the least commercially mature technologies such as in gasification and hot gas clean up.
Overall capital costs are likely to reduce 30% from pioneer plant to fully mature technology. This is due
in great part to the need for large contingencies and spare equipment and overall uncertainties
regarding the pioneer plants.
Gasifier technology for biomass applications is expected to be largely mature by 2010. The fully mature
system costs will closely reflect the mature plant costs associated with coal gasification combined cycle.
As an example for very large scale plants, the $2,400/kW first cost for the Demkolec plant is projected to
be $1,500/kW based on full maturation of the technology. The projected costs for 2010 are also in

SECTION A ‐ PRELIMINARY TECHNOLOGY SCREEN – BIOMASS GASIFICATION
Page A‐9
alignment with that of natural gas fired combined cycle plants. Gas Turbine World reports a price of
$713/kW, which after adding costs for biomass gasification and fuel handling, the price reaches
$1,200/kW.
Additional cost reduction past 2010 will likely result from improvements in system efficiency and
required biomass throughputs. Advanced turbine technology is expected to allow for higher firing
temperatures. Improved steam generation and turbine efficiency will continue to improve costs and
equipment footprint. The following is a summary of projected costs for a 100 MW installation.
Preliminary Economic Assessment Gasification technology holds promise for electricity generation at different scales. At capacities
between a few tens of KW and 5MWe, fixed bed gasifiers coupled with reciprocating engines and small
turbines could generate electricity with efficiencies of about 25%
At capacities above 30MWe, circulating fluidized bed gasifiers coupled with combined cycle steam and
gas turbines could generate electricity with efficiencies between 40 and 50%. However utility scale
gasification systems are currently at the pre‐commercial stage and demonstration projects are required
to prove the long‐term reliability of the technology and reduce its costs. Co‐firing could allow an
efficient use of biomass and favor its early uptake, with an estimated 10‐20 GW co‐firing potential in the
next 20 years in the US. This represents roughly 1.5 to 3% of total current US installed capacity.

SECTION A ‐ PRELIMINARY TECHNOLOGY SCREEN – BIOMASS GASIFICATION
Page A‐10
Environmental Considerations Regardless of the final fuel, gasification itself and subsequent fuel processing neither emits nor traps
greenhouse gasses such as carbon dioxide. Combustion of synthesis gas or derived fuels does of course
emit carbon dioxide yet biomass production removes carbon from the atmosphere. While other biofuel
technologies such as biogas and biodeisel are also carbon neutral, gasification can be run on a wider
variety of input materials and can be used to produce a wider variety of output fuels.
Biomass gasification is one of the most technically and economically convincing energy solutions for a
carbon neutral economy.
Risk Many commercial and industrial gasification technologies are largely based on the experience of coal
gasification. These large gasifiers will require biomass fuels to be collected and transported to
centralized locations. However biomass fuels are often distributed in rural areas. The cost to collect and
transport the “wet” biomass is an important factor limiting the economic competitiveness of this
technology.
A principle risk is the long term availability of the feedstocks.
Potential Industry Partners Partner
AES
Nexterra Energy Corp.
http://www.nexterra.ca/
Heat Transfer International
http://www.heatxfer.com/
Diversified Energy Corporation
http://www.diversified‐energy.com/
Aspen One – Process, Chemicals
Recovered Energy
Dakota Gasification Company
Biomass Gasification Company
Biomass Technology Group (BTG)
SOLENA

SECTION A ‐ PRELIMINARY TECHNOLOGY SCREEN – BIOMASS GASIFICATION
Page A‐11
GE
Community Power Corporation, CPC
http://www.gasifiers.org/ (Gasifier Inventory)
Over 90 installations and over 60 manufacturers are listed now indicating the large interest in biomass
gasification.
Despite many R&D efforts for the last decades, commercial status is still not achieved for several
technical and non‐technical reasons. To promote the technology in general and to contribute to the
Kyoto protocol, BTG initiated a European wide Network on Gasification, GasNet, in which 20 members
from all European countries participate.
http://www.btgworld.com/technologies/gasification.html
References Knoef. H.A.M., (2000) Inventory of Biomass Gasifier Manufacturures & Installations, Final Report to
European Commission, Contract DIS/1734/98‐NL, Biomass Technology Group B.V., University of Twente,
Enschede
Waldheim, L., Morris, M., & Leal M.R.L.V., (2001) Biomass power generation: Sugar cane bagasse and
trash.
Nieminen, J., (1999) Biomass CFB gasifier connected to a 350 MWth steam boiler fired with coal and
natural gas – THERMIE demonstration project in Lahti, Finland. In Power Production from Biomass III,
Gasification & Pyrolysis R&D7D for Industry (Ed. by K. Sipila & M. Korhonen), VTT Symposium 192,
VTT Espoo.
Paisley, M.A., Overend, R.P., Farris, M.C., (2001) Preliminary operating results from Battelle/FERCO
gasification demonstration plant in Burlington, Vermont, USA,. In Proceedings 1st World Biomass
Conference In Proceedings 1st World Conference & Exhibition on Biomass for Energy & Industry, (Ed. by S.
Kyritsis, A.A.C.M. Beenackers, P. Helm, A. Grassi & D. Chiaramonti), James & James.
Vierrath, H., & Greil, C., (2001) Energy and electricity from biomass, forestry and agricultural waste. In
Proceedings 1st World Biomass Conference, In Proceedings 1st World Conference & Exhibition on
Biomass for Energy & Industry (Ed. by S. Kyritsis, A.A.C.M. Beenackers, P. Helm, A. Grassi & D.
Chiaramonti), James & James.
Anderl, H. & Mory, A., (1999) Operation experiences in the CFB gasification project BioCoComb for
biomass with co‐combustion of the gas in a PF boiler at Zeltweg power plant, Austria. In Power
Production from Biomass III, Gasification & Pyrolysis R&D7D for Industry (Ed. by K. Sipila & M.
Korhonen), VTT Symposium 192, VTT Espoo.

SECTION A ‐ PRELIMINARY TECHNOLOGY SCREEN – BIOMASS GASIFICATION
Page A‐12
Salo, K., Horwath, A., (1999) Minnesota agri‐power project (MAP). In Power Production from Biomass III,
Gasification & Pyrolysis R&D7D for Industry (Ed. by K. Sipila & M. Korhonen), VTT Symposium 192,
VTT Espoo.
De Ruyck, J., Allard, G.& Maniatis K., (1996), An externally fired evaporative gas turbine cycle for small
scale biomass CHP production., In Proceedings 9th European Bioenergy conference, Copenhagen (Ed. P.
Chartier et al.) Pergamon, Oxford
Stahl, K., (2000) Varnamo – demonstration programme 1996‐2000, SYDKRAFT, Malmo.
T. Knoef, H.A.M., (2000) Status and development of fixed bed gasification, Report EWAB 9929, NOVEM,
Utrecht.
Aznar, M.P., et al., (2001) A new 7‐lump model for catalytic tar (from biomass gasification) elimination.
In Proceedings 1st World Biomass Conference, In Proceedings 1st World Conference & Exhibition on
Biomass for Energy & Industry (Ed. by S. Kyritsis, A.A.C.M. Beenackers, P. Helm, A. Grassi & D.
Chiaramonti),James & James.
Corella, J., et al., (2001) Testing commercial full‐size steam reforming catalysts for tar elimination in
biomass gasification at pilot scale. 6
Schapfer, P., and Tobler, J., Theoretical and Practical Investigations Upon the Driving of Motor Vehicles
with Wood Gas., Bern 1937.
Solar Energy Research Institute (SERI), Generator Gas – The Swedish Experience from 1939‐1945. SERI,
Golden, Colorado, 1979, Chap. 2.
Ince, P. J., How to Estimate Recoverable Heat Energy in Wood or Bark Fuels, General Tech. Rep. FPL 29,
USDA, 1979.
Skov, N. A., and Paperworth, M. L., The Pegasus Unit, Pegasus Publishers, Olympia, Washington, 1974,
Chap IX.
Beagle, E. C., Gasifier – Stirling: An Innovative Concept, presented at First International Producer Gas
Conference, Colombo, Sri Lanka, November 8‐12, 1982.
Reed, T. B., Graboski, M., and Markson, M., The SERI High Pressure Oxygen Gasifier, Report SERI/TP‐234‐
1455R, Solar Energy Research Institute, Golden, Colorado, Feb. 1982.
Foley, G., and Barnard, G., Biomass Gasification in Developing Countries, Technical Report No. 1,
Earthscan, London, 1983, Chap 2.4.
Goss, J. R. State of Art of Agriculture Residue Gasifiers in the U.S., Proceedings First USAID/GOI
Workshop on Alternative Energy Resources and Development, New Delhi, India, November 7‐11, 1983.

SECTION A ‐ PRELIMINARY TECHNOLOGY SCREEN – BIOMASS GASIFICATION
Page A‐13
E.D. Larson, S. Svenningsson and I. Bjerle, Biomass gasification for gas turbine power generation, in T. B.
Johansson, B. Bodlund and R. H. Williams (eds),Electricity: Efficient End‐use and New Generation
Technologies and their Planning Implications, pp. 697‐739. Lund University Press, Lund (1989)

Section B
Preliminary Technology Screen –
Co‐Firing Biomass

SECTION B: PRELIMINARY TECHNOLOGY SCREEN – CO‐FIRING BIOMASS
Page B‐1
Executive Summary Biomass is organic material from living things, including plant matter such as trees, grasses, and
agricultural crops. These materials, grown using energy from sunlight, can be good sources of renewable
energy and fuels for electric generating facilities.
Biomass energy technologies convert renewable biomass fuels to heat or electricity. Next to hydro‐
power, more electricity is generated from biomass than from any other renewable energy resource in
the United States. Biomass co‐firing is attracting interest because it is the most economical near‐term
option for introducing new biomass resources into today’s energy mix. Co‐firing is the simultaneous
combustion of different fuels in the same boiler.
Biomass co‐firing can be economical at generating facilities where most or all of these criteria are met:
current use of a coal fired boiler, access to a steady supply of competitively priced biomass, high coal
prices, and favorable regulatory and market conditions for renewable energy use and waste reduction.
Wood is the most commonly used biomass fuel for heat and power. The most economical sources of
wood fuels are wood residues from manufacturers and mill residues, such as sawdust and shavings;
discarded wood products, such as crates and pallets; woody yard trimmings; right‐of‐way trimmings
diverted from landfills; and clean, nonhazardous wood debris resulting from construction and
demolition work. Using these materials as sources of energy recovers their energy value and avoids the
need to dispose of them in landfills, as well as other disposal methods.
Technology The most promising, near‐term, proven option for co‐firing is using solid biomass to replace a portion of
the coal combusted in existing coal‐fired boilers. This type of co‐firing has been successfully
demonstrated in nearly all coal‐fired boiler types and configurations, including stokers, fluidized beds,
pulverized coal boilers, and cyclones. Specific requirements depend on the site, but in general, co‐firing
biomass in an existing coal fired boiler involves modifying or adding to the fuel handling, storage, and
feed systems. Fuel sources and the type of boiler at the site will dictate fuel processing requirements.
Market Approximately 8,000 MWe is generated in the United States from biomasses other than municipal solid
wastes. This portion of electricity generated from biomass represents only 1% of the generating
capacity of the United States. However this value is quite a bit larger than the 2,500 MWe that comes
from wind generation and 2,500 MWe from geothermal generation.
Availability of Resource A screening analysis was done by the Department of Energy to determine which states have the most
favorable conditions for a financially successful co‐firing project. The primary factors considered were
average delivered state coal prices, estimated low‐cost biomass residue supply density (heat content in
Btu of estimated available low‐cost biomass residues per year per square mile of state land area), and
average state landfill tipping fees.

SECTION B: PRELIMINARY TECHNOLOGY SCREEN – CO‐FIRING BIOMASS
Page B‐2
The states with high potential for successful projects are shown on the map in light blue. Those states
considered to have good potential are colored gray.
The Southeast is a large timber producer, and logging and logging residues are projected to increase
over the next 40 years. A study by J. Gan and C.T. Smith completed in 2004 states that it is expected
that logging residues in the southeast would increase by 18.4% in 2010 when compared to the base year
of 1997. By 2050 in the Southeast, logging residues would be increased 68% from the base year. In the
Southeast states, only Georgia would have more recoverable logging residues than North Carolina. In
1997, North Carolina was ranked 4th in the nation for recoverable logging residues from growing stock.
A recent study of the amount of roundwood products2, logging residues3, and other removals4 within a
2 Any primary product, such as lumber, poles, pilings, pulp, or fuelwood that is produced from roundwood.
3 The unused merchantable portion of growing-stock trees cut or destroyed during logging operations.
4 The growing-stock volume of trees removed from the inventory by cultural operations such as timber stand improvement, land clearing, and other changes in land use, resulting in the removal of the trees from timberland.
SECTION B: PRELIMINARY TECHNOLOGY SCREEN – CO‐FIRING BIOMASS
Page B‐3
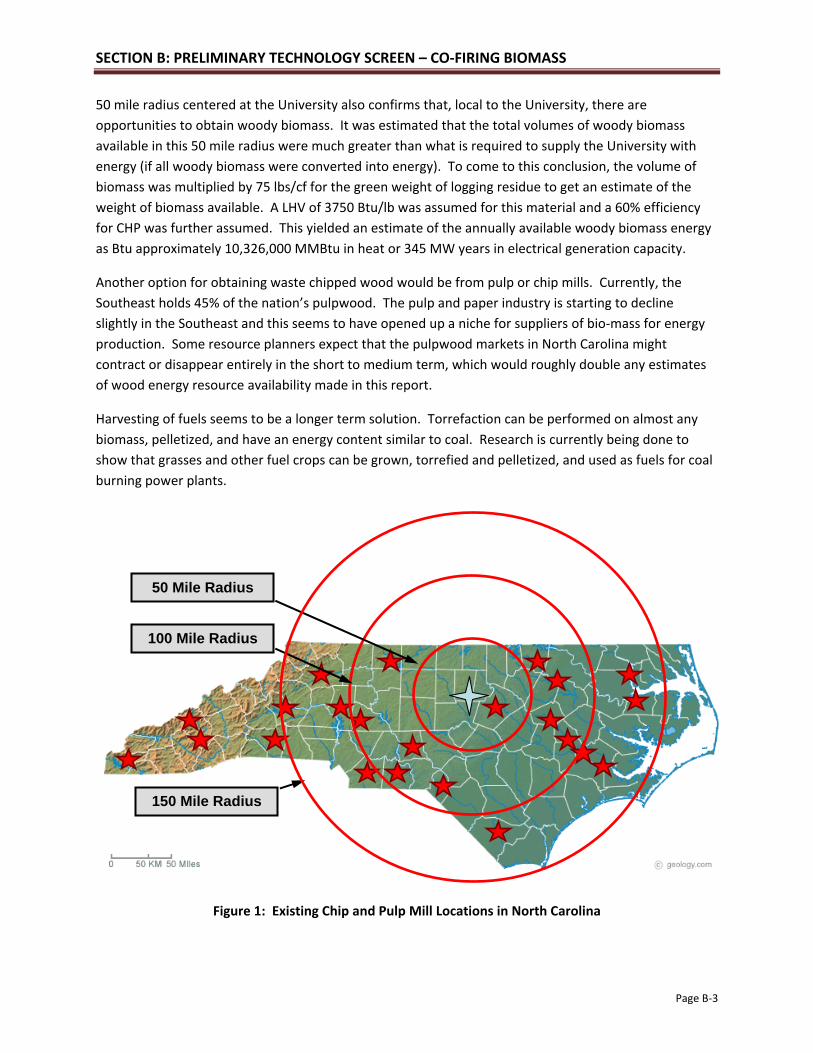
50 mile radius centered at the University also confirms that, local to the University, there are
opportunities to obtain woody biomass. It was estimated that the total volumes of woody biomass
available in this 50 mile radius were much greater than what is required to supply the University with
energy (if all woody biomass were converted into energy). To come to this conclusion, the volume of
biomass was multiplied by 75 lbs/cf for the green weight of logging residue to get an estimate of the
weight of biomass available. A LHV of 3750 Btu/lb was assumed for this material and a 60% efficiency
for CHP was further assumed. This yielded an estimate of the annually available woody biomass energy
as Btu approximately 10,326,000 MMBtu in heat or 345 MW years in electrical generation capacity.
Another option for obtaining waste chipped wood would be from pulp or chip mills. Currently, the
Southeast holds 45% of the nation’s pulpwood. The pulp and paper industry is starting to decline
slightly in the Southeast and this seems to have opened up a niche for suppliers of bio‐mass for energy
production. Some resource planners expect that the pulpwood markets in North Carolina might
contract or disappear entirely in the short to medium term, which would roughly double any estimates
of wood energy resource availability made in this report.
Harvesting of fuels seems to be a longer term solution. Torrefaction can be performed on almost any
biomass, pelletized, and have an energy content similar to coal. Research is currently being done to
show that grasses and other fuel crops can be grown, torrefied and pelletized, and used as fuels for coal
burning power plants.
Figure 1: Existing Chip and Pulp Mill Locations in North Carolina
150 Mile Radius
100 Mile Radius
50 Mile Radius

SECTION B: PRELIMINARY TECHNOLOGY SCREEN – CO‐FIRING BIOMASS
Page B‐4
Shipping cost is a major component of this fuel. Luckily, due to the location of the University, many
options are available. Within a 50 mile radius, the most cost effective shipping method for this woody
biomass is over roads via trucking. Although trucking to the site within this area may be the most cost
effective, trucking may pose a problem to further fuel handling at the site. Bringing the woody biomass
in by rail car from distances greater than 50 miles may be the best overall option. It can be seen from
Figure 1 that beyond 50 miles from the University there are substantial amount of pulp and chip mills
where product may be obtained. For torrefied wood, which may not require major modifications to the
existing plants fuel handling system, there is a possibility that the coal cars can bring the coal to a
torrefaction facility that is located by rail, and within 50 miles of a chip mill, and the coal and torrefied
wood blended at the mill site and brought to the existing Cogeneration Plant.
Preliminary Economic Assessment The National Renewable Energy Laboratory (NREL) conducted a study of the economic and
environmental impacts of biomass co‐firing in existing boilers, as well as associated savings. Results of
the study are presented in Table 3.
Their results showed an estimated payback period of 1 to 5 years.
Currently, the market for green wood chips and torrefied wood is extremely variable as it is relatively
new to the American market as a fuel source. Also, the transportation of the fuel is a major cost. At the
current time, shipping the product over land using trucks is the most cost effective means, but this may
not be easily or inexpensively integrated into the existing Cogeneration Plant fuel handling system.
Latest transportation cost values show 13.5¢ per ton‐mile for trucked woody biomass. Biomass
delivered over railcar can be estimated to be between 35‐50¢ per ton‐mile.

SECTION B: PRELIMINARY TECHNOLOGY SCREEN – CO‐FIRING BIOMASS
Page B‐5
It can be expected that in the coming years the cost of woody biomass for fuel should become less
volatile. Recent discussions with woodchip distributors servicing the Raleigh area yielded price quotes
ranging from $17.50 to $23.50 per green ton of woodchips, delivered, and the latest costs that have
been published show oven dried wood chips to be roughly $60‐$70 a dry ton in this area. Torrefied
wood prices would be roughly $110 per ton, with the prices currently moving downward as torrefication
plant come online and local demand increases.
Relative Implementation Cost A small torrefication plant could be placed on a piece of University property and owned and operated by
the University. It is estimated that the amount of woody biomass needed to create 10% on a heat input
basis would be around 12,500 to 15,000 tons per year. A torrefication plant of this size would be
considered in the industry to be very small, and have an output of about 2 tons per hour. An estimate
on the capital required to construct this plant would be approximately $7,000,000.
As will be described in the remainder of this report, the handling of the woody biomass can be a major
challenge for this site. One option is to design and construct a totally separate fuel train for injection of
the woody biomass fuel into the boiler. Although an estimate, this could range up to $1,000,000 for the
construction, and be at a minimum 3 years before the equipment is up and running.
Environmental Impact Table 4 shows the environmental results from NREL’s study.
As shown in the table, Co‐firing biomass with coal offers several environmental benefits. Co‐firing
reduces emissions of carbon dioxide, a greenhouse gas that can contribute to the global warming effect.
Also, biomass contains significantly less sulfur than most coal. This means that co‐firing will reduce
emissions of sulfurous gases such as sulfur dioxide that will then reduce acid rain. Early test results with
woody biomass co‐firing showed a reduction potential as great as 30% in oxides of nitrogen, which can
cause smog and ozone pollution.

SECTION B: PRELIMINARY TECHNOLOGY SCREEN – CO‐FIRING BIOMASS
Page B‐6
It must be noted that co‐firing with wood chips, green or torrefied, does not equate to cutting down
trees for fuel. The woody residues found at logging operations could provide enough “waste” that may
be able to be tapped for energy. In essence, in order for a carbon closed loop, we must use biomass
that has recently grown for fuel.
It is estimated by J. Gan and C.T. Smith that for every 2.1 tons of wood residue recovered from logging
operations and co‐fired could equal the reduction of 1 ton of carbon. For the sake of reviewing carbon
reduction, let’s estimate that the existing Cogeneration plant uses 111,500 short tons of coal per year.
Let’s also estimate that the Cogeneration Plant can burn 10% woody biomass on a heat input basis, and
that this would displace approximately 11,150 short tons of coal. One short ton of coal produces
approximately 2.73 metric tons of CO2 equivalent. With approximately 11,500 short tons of coal
displaced, approximately 31,400 metric tons of CO2, equivalent or 6% of the total campus building
energy carbon footprint, could be eliminated.
For other emissions, green wood produces more volatile organic compounds. Also, there have been
cases where the varying temperatures of the co‐fired wood fuel caused greater NOX emissions.
Torrefied wood products are refined and do not have this volatility and have not been shown to increase
NOX emissions.
The energy impact on harvesting and shipping this fuel should also be reviewed. When compared to
green wood chips, shipping torrefied wood is less energy intensive due to its weight to energy content
ratio. Shipping by boat is relatively cost effective and is why it is economical to deliver woody biomass
overseas. For inland shipping, trucking is currently the most cost effective, but higher in CO2 emissions.
National Renewable Energy Laboratory has performed a “life cycle analysis” of woody biomass and
shows that 2% to 8% of the energy output of a power plant using biomass is required to compensate for
the emissions created from planting through harvesting and shipping of the product. The close
proximity of wood harvesting operations to the University makes the shipment of woody biomass viable.
Political/Regulatory Considerations As the burning of woody biomass produces much less SO2 and net CO2 emissions when compared with
coal, so there may be some regulatory benefits. Also, the business of selling credits for SO2 and CO2,
although speculatory at this time, may produce profits in the future. As for emission standards, woody
biomass co‐firing should be evaluated such that it is not treated as a substantial enough modification to
make the plant subject to “new source” performance standards under the Clean Air Act.
The standards for selling the ash byproduct for cement manufacturing are highly regulated and co‐firing
may modify the quality of ash to be sold. Analysis must be performed in order to see if the ash
produced with co‐firing may be able to be sold.
Risk The woody biomass waste stream in the Southeastern United States is a reliable source for sustainable
fuels. As was stated previously, the University is primely situated in an area near an abundant energy
resource. With this being said, signing a contract with a local company for fuel handling, be it green

SECTION B: PRELIMINARY TECHNOLOGY SCREEN – CO‐FIRING BIOMASS
Page B‐7
wood chips or torrefied wood, should be attainable in the near future. Polling local distributors of
torrefied wood shows that the fuel product could be delivered anywhere between 9 months to 1 year of
the signing of the contract.
Burning woody biomass may increase the maintenance time required for the boilers and additional
scale, sludge or corrosion of the boiler tubes due to the chlorine content of the woody biomass. Burning
of green wood chips, containing high amounts of volatile organic compounds, can cause creosote
buildup inside the boiler and exhaust gas paths (note, torrefied wood would have much less volatile
organic compounds, and less creosote buildup). Handling of woody biomass may also increase
maintenance for the fuel handling system. The two options for feeding this fuel into the boiler is either
a dedicated mill/blower system or a mix with the coal in the railcar, more than likely need to be
performed off site.
With the dedicated woody biomass mill/blower, additional equipment can cause additional
maintenance. Also, being injected in from a separate system, certain balancing between the woody
biomass system and the coal system coming from different streams must be carefully balanced. Lastly,
placement of additional fuel handling equipment in the relatively small footprint of the plant may cause
additional maintenance problems.
With the woody biomass mixed in the railcar, little new capital equipment is needed. On the other
hand, it must be insured that the fuel is evenly blended and the blending variations do not have any
adverse affects with the existing systems.
Potential Industry Partners Partner
Southern Alternative Fuels – Based in Ashville, local producer of torrefied wood chips and pellets.
Bio‐coal – Producers of biomass product for coal‐burning power plants. Can be visited on the web at
www.biocoal.net.
New Earth – Producers of biomass product for coal‐burning power plants. Producers of E‐coal, among
others. Can be visited on the web at Newearth1.net
Bio‐Stock – Consulting and manager of biomass feedstock in the U.S. and Australia. Can be visited on the
web at www.price biostock.com
Airless Drying Technology ‐ Airless Drying is an internationally patented method of drying which uses dry
superheated steam as the heating medium, capable of performing any drying process. More
information can be found on the web at www.airless‐systems.co.uk/airless‐drying.shtml.
Resources
Evan Hughes, (July 2000), Biomass cofiring: economics, policy and opportunities

SECTION B: PRELIMINARY TECHNOLOGY SCREEN – CO‐FIRING BIOMASS
Page B‐8
Richard Bergman & John Zerbe (January 2008), Primer on Wood Biomass for Energy
Veronika Dornburg & Andre’ P.C. Faaij (May 15, 2001), Efficiency and economy of wood‐fired biomass
energy systems in relation to scale regarding heat and power generation using combustion and
gasification technologies
Technical Study Report on Biomass Fired, Fluidized Bed Combustion Boiler Technology for Cogeneration
http://www.uneptie.org/energy
David Dayton (May 2002) A Summary of NOx Emissions Reduction from Biomass Cofiring
Mark J. Prins, Krzysztof J. Ptasinski, Frans J.J.G. Janssen (August 2005), More efficient biomass
gasification via torrefaction
Wood Resources International, Hakan Ekstrom (March 2008), First quarter wood chip costs up almost
50% in western US, but pulpmills in the US South experienced only small upward price adjustments
Jianbang Gan, C.T. Smith (2006), Availability of logging residues and potential for electricity production
and carbon displacement in the USA

Section C
Preliminary Technology Screen –
Poultry Litter

SECTION C: PRELIMINARY TECHNOLOGY SCREEN – POULTRY LITTER
Page C‐1
Executive Summary The recently ratified Senate Bill 3 pertains to renewable energy and energy efficiency portfolio standards
(REPS) for public utilities in the State of North Carolina. This bill contains very specific requirements for
power production from poultry waste resources. Specifically, the following requirements are included:
Calendar Year Requirements for Poultry Waste Resources
2012 170,000 megawatt hours
2013 700,000 megawatt hours
2014 900,000 megawatt hours
Planning for several new poultry litter plants in North Carolina is currently underway. At this time, plans
for construction of plants in both Sampson County (Southeastern part of State) and Surry County
(Northwestern part of State) have been announced, with a third future plant site to be determined.
Technology Fibrowatt, LLC is a Pennsylvania‐based developer, builder, owner and operator of electrical power plants
fueled by poultry litter and other agricultural biomass. It was founded in 2000 by the management team
that built the world’s first three poultry litter fueled power plants in the United Kingdom in the 1990’s.
The United Kingdom has converted more than seven million tons of poultry litter into more than four
million megawatt‐hours of electricity and 500,000 tons of ash fertilizer. The operational plants in the UK
are as follows:
Eye Power Station Commissioned 1992 Design Output 12.7 MW
Glanford Power Station Commissioned 1993 Design Output 13.5 MW
Thetford Power Station Commissioned 1992 Design Output 38.5 MW
Fibrowatt’s subsidiary, Fibrominn, has built the first poultry litter fueled power plant in the United States
in Minnesota, which opened in mid‐2007. This plant will combust over 700,000 ton/yr. of poultry litter
and other biomass and has a design output rating of 55 MW. Fibrowatt has 15 years of operating
experience using a proven technology. A typical plant arrangement is as shown below:

SECTION C: PRELIMINARY TECHNOLOGY SCREEN – POULTRY LITTER
Page C‐2
Market The use of poultry litter as a fuel for power production is still relatively new, especially in the United
States. One of the biggest challenges is the collection and distribution of the fuel to the power plant.
The strategy to date has been to locate the plant in close proximity to the poultry farms, resulting in
plants in more rural areas and the inability to use combined heat and power due to the lack of an
adjacent thermal load.
Availability of Resource The following shows the available poultry litter quantities throughout the country.

SECTION C: PRELIMINARY TECHNOLOGY SCREEN – POULTRY LITTER
Page C‐3
Specifically, the total farm value of poultry facilities in the State of North Carolina is as follows:
The poultry industry plays a significant role in the economy of North Carolina. In 1992 it contributed
more than 30 percent of the state's farm income, and the gross sale value of its products is over $2
billion annually. In addition, more than 23,000 North Carolinians work in processing plants, hatcheries,
feed mills, and other segments of the industry, earning more than $300 million annually. Over 4,400
farmers grow poultry in North Carolina, and one of every six farms with annual sales of more than
$10,000 is engaged in poultry production
SECTION C: PRELIMINARY TECHNOLOGY SCREEN – POULTRY LITTER
Page C‐4
Preliminary Economic Assessment Due to the proximity of the fuel source and the logistics of transporting fuel onto a University campus, it
is not practical to consider siting a plant at the University. The most logical option would be to enter
into a purchase power agreement through Duke Energy to purchase the electricity generated from a
third party owned and operated plant. Therefore, the costs of implementation will be included in the
purchase price for the electricity.
Since the plants constructed to date have been through a private developer (Fibrowatt), there is no
publicly available information of the cost of the plant.
Based on preliminary discussions with Fibrowatt, they are still developing their project costs for the new
plants in North Carolina and are open to discussing a power purchase agreement for the “green power”
produced by the plant through Duke Energy. In initial conversations Fibrowatt has mentioned costs of
about $100/MW, but further dialog is required to refine these costs and the quantity of power available.
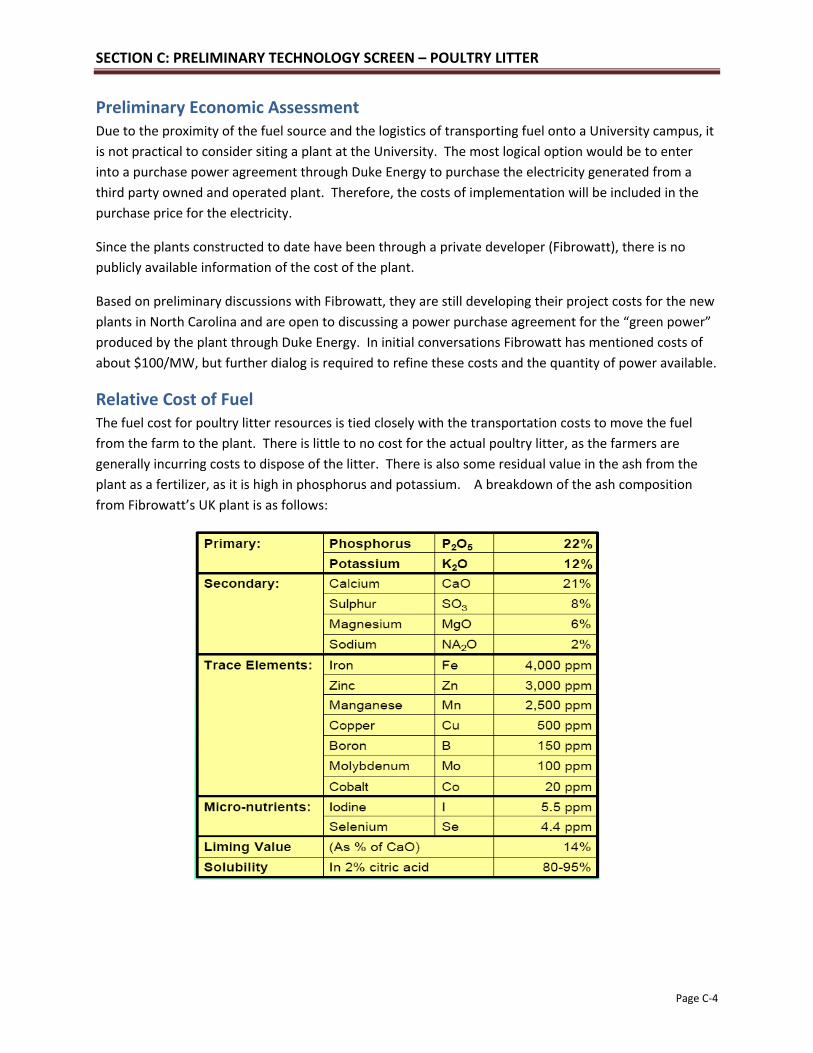
Relative Cost of Fuel The fuel cost for poultry litter resources is tied closely with the transportation costs to move the fuel
from the farm to the plant. There is little to no cost for the actual poultry litter, as the farmers are
generally incurring costs to dispose of the litter. There is also some residual value in the ash from the
plant as a fertilizer, as it is high in phosphorus and potassium. A breakdown of the ash composition
from Fibrowatt’s UK plant is as follows:
SECTION C: PRELIMINARY TECHNOLOGY SCREEN – POULTRY LITTER
Page C‐5
Environmental Considerations In August 2007, North Carolina enacted a Renewable Energy and Energy Efficiency Portfolio Standard
requiring all investor‐owned utilities in the state to supply 12.5% of 2020 retail electricity sales in the
state from eligible energy resources by 2021. The overall target for renewable energy includes
technology‐specific targets of 0.2% solar by 2018 (which includes PV, solar water heating, solar
absorption cooling, solar dehumidification, solar thermally driven refrigeration, and solar industrial
process heat), 0.2% energy recovery from swine waste by 2018, and 900,000 megawatt‐hours (MWh) of
electricity derived from poultry waste by 2014.
The use of poultry litter has some environmental and economic benefits as follows:
Use of sustainable, local fuel sources
Reduction in CO2 emissions
Reuse of ash as fertilizer
Provides value for poultry litter
Relative to permitting issues, the poultry litter plants in the US will meet with some opposition from
Environmental advocates. Specifically, the contention is that poultry litter air emissions are greater on a
per MW basis than a fossil fueled plant. However, the majority of these emissions are in the form of
carbon dioxide, which one can claim would be released over time as the poultry litter is disposed of.
Overall, since Senate Bill 3 has required the production of a significant amount of power through the use
of poultry litter, it appears that any permitting concerns will be overcome.
Relative to community support, Fibrowatt’s position is that there are significant benefits to the poultry
industry and farmers. These include:
Value of poultry litter is guaranteed over a long period of time
Opportunity for more frequent clean‐pout can enhance bio‐security and bird health
Record keeping for poultry litter disposal is reduced or eliminated
Helps to minimize odor impacts by eliminating stockpiling and spreading
Risk The greatest risk pertains to the availability of the fuel supply, which is highly dependent upon the
continued viability of the poultry industry in North Carolina. If the proposed plants are located in areas
of dense poultry farms, the risk is somewhat mitigated.
Potential Industry Partners Fibrowatt, LLC

Section D
Preliminary Technology Screen –
Solar PV

SECTION D: PRELIMINARY TECHNOLOGY SCREEN – SOLAR PV
Page D‐1
Executive Summary The use of solar PV for power plant scale applications continues to increase. Programs such as NC Green
Power and the recently passed Senate Bill 3 will continue to spur interest in this technology. The
limiting factor in the State of North Carolina continues to be the solar resource and the efficiency of the
conversion of solar energy to electrical energy. Duke Energy recently announced the construction of an
18 MWe solar PV system in Davidson County, North Carolina, demonstrating the continued interest in
this technology. Megawatt Solar, a recently formed company using technology developed at the
University of North Carolina‐Chapel Hill, is actively seeking to participate in this large scale power
production market and has been a great resource for efficiency and cost information.
Solar PV applications convert solar energy to a DC current. The DC current is passed through a series of
AC invertors and step‐up transformers to connect and integrate with the local power system. In the
case of UNC, this would be 15 KV for connection to the primary distribution system or 480 V if
connected to a local building system. For the purposes of this technical brief, we will be examining
systems that support power needs on a utility scale and would connect to the primary distribution
system to allow service to the entire campus.
Technology The technology continues to develop and mature rapidly. Research continues on more innovative and
efficient solar cells, as well as the methods to concentrate solar energy on these cells. Heat removal
continues to be a challenge and limiting factor in the overall system efficiency. The figure below

SECTION D: PRELIMINARY TECHNOLOGY SCREEN – SOLAR PV
Page D‐2
illustrates relative efficiency by technology type throughout time as represented by NREL.
In the 1990s, when silicon cells were twice as thick, efficiencies were 30% lower than today and lifetimes
were shorter, it may well have cost more energy to make a cell than it could generate in a lifetime. In
the meantime, the technology has progressed significantly, and the energy payback time of a modern
photovoltaic module is typically from 1 to 4 years depending on the type and where it is used.
Market Solar PV technology is in the growth stage of market maturity according to a report done by New Energy
Capital. According to EIA statistics, in 2006, domestic photovoltaic shipments topped 206,511 peak kW,
although the recent years have been significantly higher. Along with hydroelectric, geothermal and
wind, photovoltaic energy is considered to be among the most mature renewable technologies.
According to the Prometheus Institute, US PV installations grew by over 20% in 2007 to 120 MW‐dc,
demonstrating one of the fastest growth rates among world markets. According to the same
Prometheus Institute report, the US continues to lead the world in both next‐generation thin film
technologies and the polysilicon feedstock used in most PV applications. The image below illustrates
generally how prices per watt have dropped over time relative to cumulative global installations.
Source http://www.seia.org/solartypes.php#

SECTION D: PRELIMINARY TECHNOLOGY SCREEN – SOLAR PV
Page D‐3
Availability of Resource in North Carolina
While North Carolina’s solar resources compare favorably to most locations in the Southeast, the
availability is significantly lower than prime locations in the southwestern United States. In any
application, power still needs to be secured for adverse weather conditions and for the 12 or so hours
that the sun does not shine. In situations like at UNC, the solar energy gathered during the day is used
to meet a portion of the overall campus needs and is intended to be supplemented by purchased power
or others means of self‐generated power.
During July in North Carolina, there are 14 hours between sunrise and sunset. Much of that time the
sun does not shine at peak intensity (1,000 Watts/m2) because clouds, haze and the atmosphere
reduces solar intensity. The solar intensity seen by a PV array is reduced when the sun’s rays are not
perpendicular to the surface. To estimate the output of a potential PV system, and in particular, one in
North Carolina, peak sun hours are measured, which is the number of hours the sun would had to have
shone at peak intensity on a PV array equal to the amount of radiation that was actually received by the
array during the day. This value is reported as kilowatt‐hours per square meter (kWh/m2). For a South
Facing Tracking Array in Raleigh‐Durham NC, this measurement ranges from 4.4‐8.0 kWh/m2.

SECTION D: PRELIMINARY TECHNOLOGY SCREEN – SOLAR PV
Page D‐4
Source: North Carolina Solar Center
http://www.ncsc.ncsu.edu/information_resources/factsheets/PVElecSun.pdf
A recent study done by the PV Environmental Research Center, Brookhaven National Laboratory and the
Copernicus Institute of Sustainable Development dispels a myth that Solar PV panels are inefficient with
respect to reducing a carbon footprint due to the carbon intensive production process required to make
them. The report shows that even with the intensive production process, that at least 89% of air
emissions associated with electricity generation could be prevented if electricity from photovoltaics
displaces electricity from the grid.
For UNC’s application, the physical land area required to meet all they campus needs using solar PV is
not practical – for a 100 MW peak load, nearly 1000 acres of land would be required. Even for the
developing Carolina North Campus, this type of land area use does not allow a system installation of
sufficient size to meet the peak campus demand.
Preliminary Economic Assessment The US has the best solar resources in the world (although they exist primarily in the desert Southwest
and not NC), and yet Germany, with much weaker solar installation rates has 8 times as much PV
installed capacity as the US because Germany has provided generous incentives that stimulate demand
for solar energy. In 2006, however, California enacted the largest solar program outside of Germany
through the passage of the California Solar Initiative. The accompanying programs target installing
3,000MW of electricity capacity in the next 10 years. Eight other states including North Carolina have
also expanded incentives or required the use of solar as part of their RPS. The following is a list of some
of the available tax credits and incentives, recognizing that these are targeted at private investors and
not public institutions like UNC.

SECTION D: PRELIMINARY TECHNOLOGY SCREEN – SOLAR PV
Page D‐5
NC TAX CREDITS/INCENTIVES‐
Renewable Energy Tax Credit (corporate) ‐ 35% of cost with a maximum incentive of $2.5 million
per installation. The credit is taken in five equal installments; allowable credit may not exceed
50% of a taxpayer’s liability for the year, reduced by the sum of all other credits. System must
be less than 50kWh of battery storage capacity per KW of hydro generator capacity and a
maximum of 35 kWh battery storage capacity per kW for other technologies.
Active Solar Heating and Cooling Systems Exemption‐ Active solar systems used for solar water
heat or solar space heating or cooling are exempt from Property Taxes but must not be assessed
at more than the value of a conventional system for property tax purposes. Payments are
offered for grid‐tied electricity generated by solar, wind and small hydro (10MW or less) and
biomass resources. Payments are arranged through a periodical RFP process. Owners of solar‐
electric systems enrolled in the NC Green Power program receive $.18/kWh from the program,
plus approximately $.04/kWh from their utility under the power‐purchase agreement, for a total
production payment of about $.22/kWh.
TVA – Green Power Switch Generation Partners Program‐ Program offers production‐based
incentives for PV and wind projects to residential/small‐commercial customers and incentives
for PV projects to large commercial customers. Under the contract, TVA will purchase the entire
output of a qualifying system at $.15/kWh through a participating power distributor, and the
customer will receive a credit for the power generated. TVA will purchase the output at
$.20/kWh
FEDERAL TAX CREDITS/INCENTIVES‐
Modified Accelerated Cost‐Recovery System (MACRS) ‐ Allows solar property placed in service
after 1986 to be depreciated for a period of five years after construction is completed.
Corporate Tax Credit‐ Equipment installed 2006 ‐2008 will receive a tax credit for 30% of their
expenditures. Solar energy property includes equipment that uses solar energy to generate
electricity, to heat or cool (or provide hot water for use in) a structure, or to provide solar
process heat. Energy property does not include public utility property, passive solar systems or
pool heating equipment. If the project is financed in whole or in part by subsidized energy
financing or by tax‐exempt private equity bonds, the basis on which the credit is calculated must
be reduced.
Federal Grant Program‐ Applicable to solar water heat, solar space heat, PV as well as other
renewable. The maximum grant award is 25% of eligible project costs up to $500,000 for
renewable energy projects and up to $250,000 for energy efficiency improvements. Assistance
to one individual or entity is not to exceed $750,000. The minimum grant request is $2,500 for
renewable energy projects. Under the guaranteed loan option, funds up to 50% of eligible
project costs with a maximum project cost of $10,000,000 are available. The minimum amount
of a guaranteed loan made to a borrower is $5,000. A combined grant and guaranteed loan
under this program cannot exceed 50% of eligible project costs, and the applicant or borrower is
responsible for having other funding sources for the remaining funds. The maximum

SECTION D: PRELIMINARY TECHNOLOGY SCREEN – SOLAR PV
Page D‐6
percentage of guarantee ranges from 70% to 85% depending on the loan value, the percentage
for a given project will be negotiated between the lender and the Rural Business‐Cooperative
Service. The interest rate will be negotiated between the lender and the applicant.
Renewable Energy Production Incentive (REPI) – Facilities are eligible for annual incentive
payments of $.015/kWh(in 1993 dollars and indexed for inflation) for the first 10 year period of
their operation. Eligible production facilities include not‐for‐profit electrical cooperatives, public
utilities, state governments, commonwealths, territories, possessions of the U.S., the District of
Columbia, Indian tribal governments etc.
Typically, it requires these tax and grant benefits to make a large scale solar PV project viable in the
State of North Carolina.
Relative Cost of Fuel Volatility with respect to fuel cost for solar resources is tied closely with the solar potential of the
desired area. The capacity factor can vary greatly according to the region’s weather and geography and
the resource cost will likewise vary. See section above, “Availability of Resource in North Carolina.”
From preliminary data offered by Megawatt Solar, the capacity factor for a 1 MW installation using
tracking type concentrated solar was 14%, although they expect technological advances to increase this
to 28% within the next several years. For the Duke Energy application using flat solar panels in Davidson
County, the utilization factor was calculated at approximately 20%. Therefore, one must be careful
when comparing the rated capacity of the solar systems to other constant operation technologies, as
they typically operate in the 80% to 90% capacity factor range.
Relative Implementation Cost The cost for a 1 MW solar PV system for Carolina North was estimated to be approximately $8/watt or
$8 million. As the scale of the project ramps up in size, these costs tend to reduce.
Solar plants are generally easy to install with the International Energy Agency in their 2005 report,
“Projecting Costs of Generating Electricity” reporting the time to generally be less than one year. O&M
costs are also generally low according the International Energy Agency placing the figure around $2‐
3/kWe, although the actual costs can be much greater depending on the maturity of the specific PV
technology. The technical lifetime reported for solar power plants in the US according to the same IEA
study is 40 years in the United States.
Environmental Considerations The biggest environmental impact of the use of solar PV is land use and aesthetics. At 10 acres/MW,
this technology is very land intensive when implemented on a power plant scale.
Community support for this technology is generally very high, especially in the Chapel Hill area and with
the students. Permitting issues are generally fairly minor, as no emissions are generated.

SECTION D: PRELIMINARY TECHNOLOGY SCREEN – SOLAR PV
Page D‐7
Risk Solar PV is generally a very reliable resource with minimal risks. The major risks involve weather related
damage to the equipment from hail storms and high winds. For most tracking type systems, safety
measures are provide to attempt to shield the systems from these weather conditions.
The technology continues to advance and higher efficiencies are obtained. Most concentrated solar
application allow for replacement of solar cells to take advantage of efficiency increases
Potential Industry Partners Partner
MegaWatt Solar
SunEdison
Solargenix
Epuron
SunPower (PowerLight)
First Solar
References http://en.wikipedia.org/wiki/Solar_cell, visited July 2008.

Section E
Preliminary Technology Screen –
Solar Thermal
SECTION E: PRELIMINARY TECHNOLOGY SCREEN – SOLAR THERMAL
Page E‐1
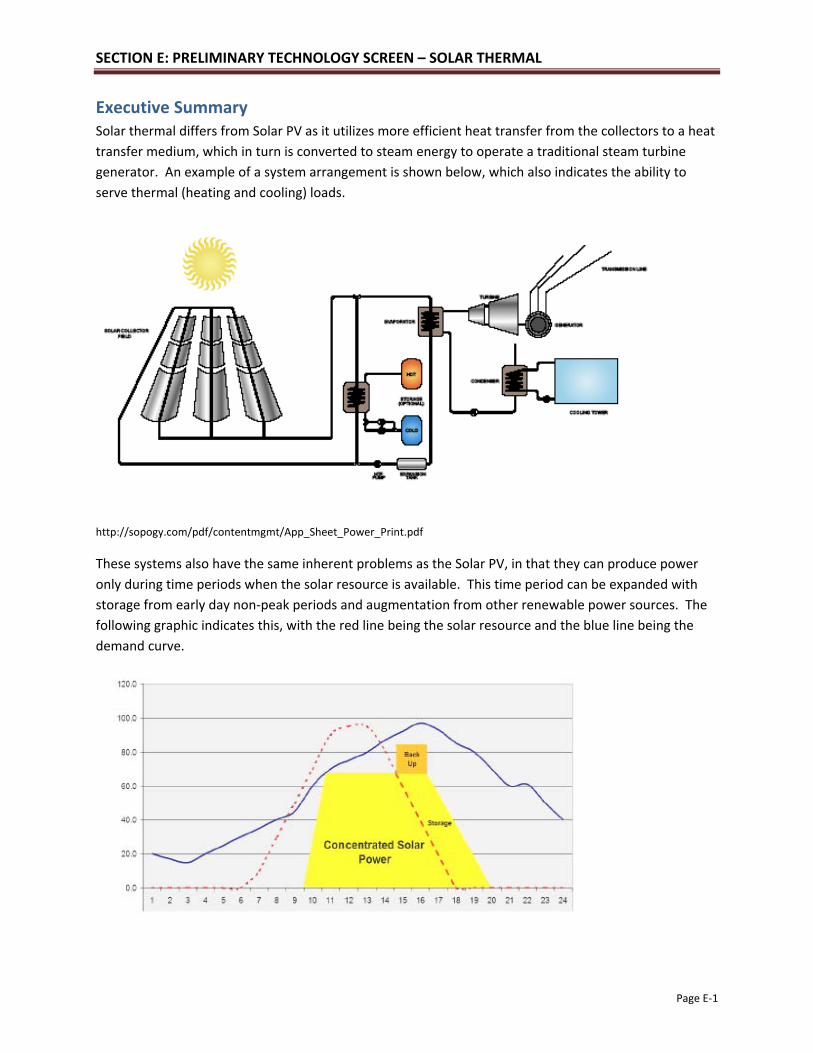
Executive Summary Solar thermal differs from Solar PV as it utilizes more efficient heat transfer from the collectors to a heat
transfer medium, which in turn is converted to steam energy to operate a traditional steam turbine
generator. An example of a system arrangement is shown below, which also indicates the ability to
serve thermal (heating and cooling) loads.
http://sopogy.com/pdf/contentmgmt/App_Sheet_Power_Print.pdf
These systems also have the same inherent problems as the Solar PV, in that they can produce power
only during time periods when the solar resource is available. This time period can be expanded with
storage from early day non‐peak periods and augmentation from other renewable power sources. The
following graphic indicates this, with the red line being the solar resource and the blue line being the
demand curve.

SECTION E: PRELIMINARY TECHNOLOGY SCREEN – SOLAR THERMAL
Page E‐2
Technology The first utility scale solar power systems in the United States were parabolic trough systems that were
installed in the Mohave Desert between 1985 and 1991. These facilities, the Solar Energy Generating
Systems (SEGS) I through IX plants, have been in successful operation since that time and continued to
be the only operating utility scale solar thermal electric generation facility of any kind until Nevada Solar
One was synchronized with the grid in June 2007. The Nevada Solar One project also utilizes parabolic
trough technology. The parabolic trough operations have been characterized as being cost effective and
reliable.
Abengoa Solar began R&D projects utilizing solar thermal or CSP technology in 1994. These projects
involved both trough and tower systems. In 2007, Abengoa Solar inaugurated the world’s first
commercial solar tower plant, the 11MW, PS10, and the world’s largest low‐concentration PV plant.
These two plants are part of the company’s Sanlucar Platform, which when complete in 2013 will have a
total capacity of 300 MW. Such output can supply the needs of 18,000 households in Seville, while
eliminating 600,000 tons of CO2 per year. Besides the Sanucar Platform, Abengoa Solar is building
additional plants in Spain, the US (Arizona), Algeria and Morocco. The Arizona plant, scheduled to go
into operation by 2011, is located 70 miles southwest of Phoenix, near Gila Bend, Arizona. It will sell the
electricity produced to APS over the next 30 years for a total revenue of around $4 billion, bringing over
$1 billion in economic benefits to the state of Arizona. The plant will create about 1,500 construction
jobs and employ 85 skilled full‐time workers once completed.
Acciona energy is a world leader in renewable energies with almost 5,500 MW in service and a varying
portfolio of renewable technologies. In addition to their recent project, Nevada Solar One, they have
installed an additional 29 MW of solar thermal power in addition to 41 MW of PV solar power. In 2007,
Acciona opened Nevada Solar One, in cooperation with Raleigh, NC based Solargenix (formerly Duke
Solar), a 64 MW solar thermal electric plant located in the Nevada desert. It is the biggest facility of its
type built in the world in the last 17 years. With an investment of 266 million dollars, it will supply
electricity equivalent to the consumption of 14,000 homes.
The Renewable Energy Policy Network as of 2006 lists solar thermal power as high technology maturity.
Market The Renewable Energy Policy Network as of 2006 lists solar thermal power as low market maturity.
Depending on where the line of demarcation is drawn, the technology is arguably moving into a more
mature market as increasing numbers of solar thermal (more specifically parabolic trough solar thermal
which are more mature technologically) plants are built.
Availability of Resource in North Carolina Refer to Solar PV technical brief for a description of resources in NC, as they are identical.
Preliminary Economic Assessment Solar thermal to power projects are still heavily subsidized by tax incentives and credits, similar to solar
PV. Refer to the solar PV technical brief for a listing of current programs. The projects are also
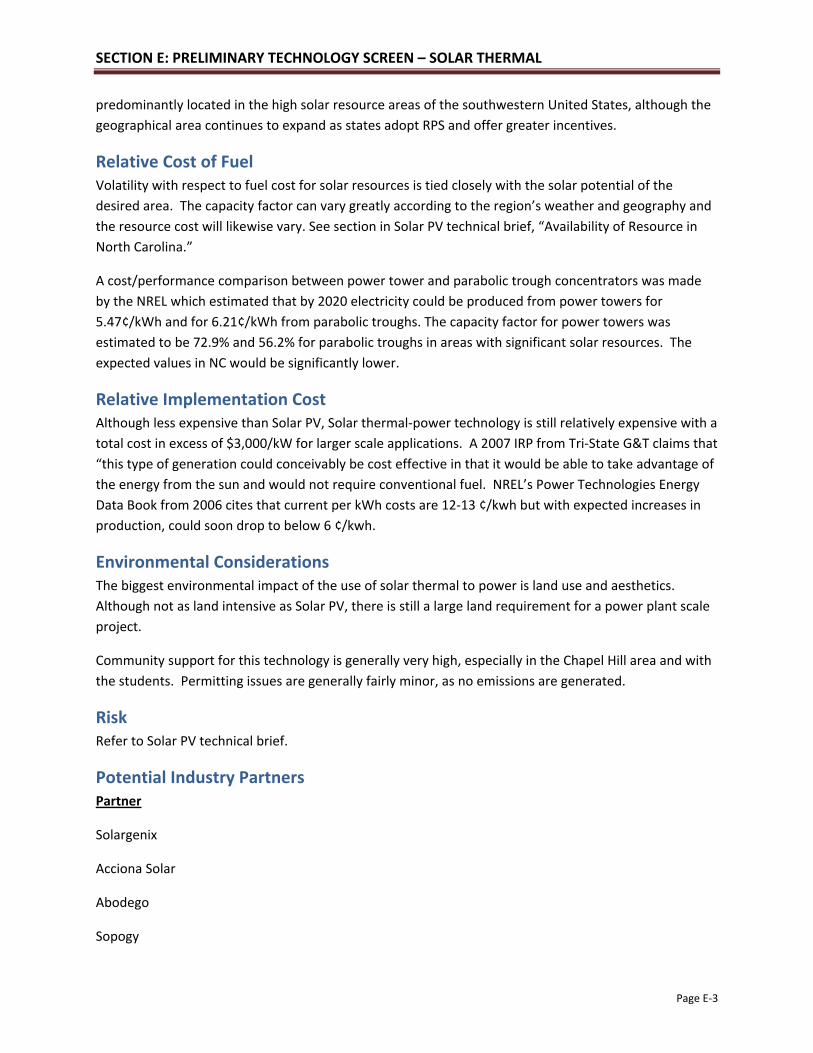
SECTION E: PRELIMINARY TECHNOLOGY SCREEN – SOLAR THERMAL
Page E‐3
predominantly located in the high solar resource areas of the southwestern United States, although the
geographical area continues to expand as states adopt RPS and offer greater incentives.
Relative Cost of Fuel Volatility with respect to fuel cost for solar resources is tied closely with the solar potential of the
desired area. The capacity factor can vary greatly according to the region’s weather and geography and
the resource cost will likewise vary. See section in Solar PV technical brief, “Availability of Resource in
North Carolina.”
A cost/performance comparison between power tower and parabolic trough concentrators was made
by the NREL which estimated that by 2020 electricity could be produced from power towers for
5.47¢/kWh and for 6.21¢/kWh from parabolic troughs. The capacity factor for power towers was
estimated to be 72.9% and 56.2% for parabolic troughs in areas with significant solar resources. The
expected values in NC would be significantly lower.
Relative Implementation Cost Although less expensive than Solar PV, Solar thermal‐power technology is still relatively expensive with a
total cost in excess of $3,000/kW for larger scale applications. A 2007 IRP from Tri‐State G&T claims that
“this type of generation could conceivably be cost effective in that it would be able to take advantage of
the energy from the sun and would not require conventional fuel. NREL’s Power Technologies Energy
Data Book from 2006 cites that current per kWh costs are 12‐13 ¢/kwh but with expected increases in
production, could soon drop to below 6 ¢/kwh.
Environmental Considerations The biggest environmental impact of the use of solar thermal to power is land use and aesthetics.
Although not as land intensive as Solar PV, there is still a large land requirement for a power plant scale
project.
Community support for this technology is generally very high, especially in the Chapel Hill area and with
the students. Permitting issues are generally fairly minor, as no emissions are generated.
Risk Refer to Solar PV technical brief.
Potential Industry Partners Partner
Solargenix
Acciona Solar
Abodego
Sopogy

Section F
Preliminary Technology Screen –
Anaerobic Digestion of Animal Waste

SECTION F: PRELIMINARY TECHNOLOGY SCREEN – ANAEROBIC DIGESTION OF ANIMAL WASTE
Page F‐1
Executive Summary About Anaerobic Digestion (Excerpt from EPA, Managing Manure with Biogas Recovery Systems)
Biogas recovery systems are sometimes known as anaerobic digesters, because they use a process called
anaerobic digestion. (Conventional lagoons operate on the same biological principle.) During anaerobic
digestion, bacteria break down manure in an oxygen‐free environment. One of the natural products of
anaerobic digestion is biogas, which typically contains between 60 to 70 percent methane, 30 to 40
percent carbon dioxide, and trace amounts of other gases.
Biogas and energy. When biogas is captured, it can be used to generate heat, hot water, or electricity—
significantly reducing the cost of electricity and other farm fuels such as natural gas, propane, and fuel
oil. Biogas can also be flared to control odor if energy recovery is not feasible. Both the flaring and use of
biogas reduce greenhouse gas emissions. Biogas is a renewable source of energy with much lower
environmental impacts than conventional fossil fuel. The methane generated from anaerobic digestion
provides rural electric cooperatives and utilities with a source of “green power” to sell to customers who
wish to purchase power from renewable sources. Biogas recovery also provides rural energy benefits
such as distributed generation and voltage support.
High‐quality fertilizer and soil amendment. Because anaerobic digestion reduces ammonia losses,
digested manure can contain more valuable nitrogen for crop production. Also, the fiber in digested
dairy manure can be used on the farm as bedding or recovered for sale as a high‐quality potting soil
ingredient or mulch.
How Are Biogas Recovery Systems Designed? Biogas recovery systems have four basic components: a
digester, a gas‐handling system, a gas‐use device, and a manure storage tank or pond to hold the
treated effluent prior to land application (see Figure 1).

SECTION F: PRELIMINARY TECHNOLOGY SCREEN – ANAEROBIC DIGESTION OF ANIMAL WASTE
Page F‐2
System Selection.
Technology Status of Anaerobic Digestion: Biogas recovery systems are a proven technology. As of Winter 2006,
more than 80 digester systems are in operation at commercial U.S. livestock farms, with an additional 19
in the Start‐up/Construction stage. An additional 80 systems were in the planning stages in Winter 2006
(follow Winter 2006 link for details on operational systems). As of Winter 2006, the relative share of
digester types is shown below:

SECTION F: PRELIMINARY TECHNOLOGY SCREEN – ANAEROBIC DIGESTION OF ANIMAL WASTE
Page F‐3
Market As of Winter 2006, more than 80 digester systems are in operation at commercial U.S. livestock farms,
with an additional 19 in the Start‐up/Construction stage. An additional 80 systems were in the planning
stages in Winter 2006.
The map below illustrates the national distribution of anaerobic digesters:
Availability of Resource The figure below illustrates that North Carolina has greatest potential methane production from swine
population of any state in the U.S. North Carolina is not in the top ten for potential production from
dairy population so only the swine related information is considered below.

SECTION F: PRELIMINARY TECHNOLOGY SCREEN – ANAEROBIC DIGESTION OF ANIMAL WASTE
Page F‐4

SECTION F: PRELIMINARY TECHNOLOGY SCREEN – ANAEROBIC DIGESTION OF ANIMAL WASTE
Page F‐5
North Carolina had two AD systems in place as of Winter 2006.
These two systems averaged a GHG emission reduction of 0.735 MT/yr per Swine.

SECTION F: PRELIMINARY TECHNOLOGY SCREEN – ANAEROBIC DIGESTION OF ANIMAL WASTE
Page F‐6
Preliminary Economic Assessment
Relative Cost of Fuel
see EPA, Managing Manure with Biogas Recovery Systems, p. 6‐8)
(
The costs of these options can vary greatly, in terms of both initial investment and annual operation and
maintenance. For example, the cost of a typical manure storage facility can range between $60 per
Animal Unit (AU) for a typical pond to $300 per AU for an above‐ground prefabricated tank. (An AU
equals 1,000 pounds live animal weight, or approximately the weight of one beef cow.) Similarly, an
open‐air conventional lined lagoon that combines both treatment and storage functions can range
between $200 to $400 or more per AU, depending on annual rainfall and process water use at the
facility.
Anaerobic digestion is cost‐competitive when compared to conventional waste management practices.
For example, the installed cost of both a covered lagoon and heated digester (including an attached
storage pond) ranges between $200 and $450 per AU. These systems can also have financially attractive
payback periods of 3 to 7 years when energy gas uses are employed. Conventional waste systems, in
contrast, do not provide this payback opportunity and become sunk costs to the farm enterprise.

SECTION F: PRELIMINARY TECHNOLOGY SCREEN – ANAEROBIC DIGESTION OF ANIMAL WASTE
Page F‐7
Relative Implementation Cost
(Graph from EPA AgSTAR Digest, Winter 2006, p. 4)

SECTION F: PRELIMINARY TECHNOLOGY SCREEN – ANAEROBIC DIGESTION OF ANIMAL WASTE
Page F‐8
Environmental Impact (see EPA, Managing Manure with Biogas Recovery Systems, p. 6‐8)
North Carolina had two AD systems in place as of Winter 2006.
These two systems averaged a GHG emission reduction of 0.735 MT/yr per Swine.
The Environmental benefits of AD systems include:
Odor control
Greenhouse gas reductions
Ammonia control
Greenhouse Gas Reductions
Political/Regulatory Considerations In July 2007, North Carolina became the first state in the nation to ban the construction or expansion of
new lagoons and sprayfields on swine farms by passing the Swine Farm Environmental Performance
Standards Act. The Act also sets strict health and environmental standards for any new waste

SECTION F: PRELIMINARY TECHNOLOGY SCREEN – ANAEROBIC DIGESTION OF ANIMAL WASTE
Page F‐9
management systems on swine farms. In addition, the Act establishes a voluntary cost‐share program to
help swine farmers convert existing lagoons to cleaner systems.
North Carolina has also set a Renewable Portfolio Standard, per Senate Bill 3 of 2007, which calls for
12.5% of 2020 electricity retail sales after 2020 to be from a renewable source. The bill specifically calls
out an energy requirement of 0.2% from swine waste by 2018, and 900,000 MWh of poultry waste by
2014 and 0.2% solar electricity and thermal energy by 2018.
Potential Industry Partners Candidate Partner Contact
AES Alternative Energy Strategies Brian Cartwright
ARES Blue Sun Gerry Runte
BioEnergy Solutions Tom Hintz
Bogas Nord Michael Zanders
Conergy AG (Epuron) Mac Moore
Microgy (xergi licensee) Sean Breen
The Shaw Group Phil Lusk/Mike McGuigan
References AgStar Digest, United States Environmental Protection Agency, Winter 2006.
United States Environmental Protection Agency, Market Opportunities for Biogas Recovery
Opportunities, 2006.
United States Environmental Protection Agency, Office of Air and Radiation, Managing Manure with
Biogas Recovery Systems, 2002.
North Carolina Environmental Defense, 2007 NC Swine Farm Environmental Performance Standards Act,
August 2007.

Section G
Preliminary Technology Screen –
Wind Power

SECTION G: PRELIMINARY TECHNOLOGY SCREEN – WIND POWER
Page G‐1
Executive Summary Wind energy systems transform the kinetic energy of the wind into mechanical or electrical energy that
can be harnessed for practical use. Mechanical energy is most commonly used for pumping water in
rural or remote locations. Wind electric turbines generate electricity for homes and businesses and for
sale to utilities. There are two basic designs of wind electric turbines: vertical‐axis, or "egg beater" style,
and horizontal‐axis machines. Horizontal‐axis wind turbines are most common today, constituting nearly
all of the "utility‐scale" (100 kilowatts, kW, capacity and larger) turbines in the global market. Turbine
subsystems include:
a rotor, or blades, which convert the wind's energy into rotational shaft energy;
a nacelle (enclosure) containing a drive train, usually including a gearbox and a generator;
a tower, to support the rotor and drive train; and
electronic equipment such as controls, electrical cables, ground support equipment, and
interconnection equipment.
2007 was the largest year on record for U.S. wind capacity additions according to AWEA’s 3rd quarter of
2007 Market Report, with over 5,000 MW of wind added. The new installations expanded the nation’s
total wind power generating capacity by 45% in a single year, bringing the U.S. total installed wind
power capacity to over 16,800 MW. North Carolina, however, had no projects and only one project
potentially in the pipeline (a proposed $65 million dollar wind facility in the western mountains of the
state done by Northwest Wind Developers LLC) that is still in the permitting process. According to the
National Renewable Energy Laboratory, aside from offshore projects and possibly the western
mountains, North Carolina has poor resources with respect to wind energy.
Technology An October 2007 study done by the NREL lists various wind technologies in the following developmental
stages:
Utility Land‐Based Wind – GW Scale
Offshore Wind (bottom mounted) – MW Scale
Distributed Energy (communities residences) ‐ >KW Scale
Offshore Wind (floating turbines) – Concept Study
2007 was the largest year on record for U.S. wind capacity additions according to AWEA’s 3rd quarter of
2007 Market Report, with over 5,000 MW of wind added. The new installations expanded the nation’s
total wind power generating capacity by 45% in a single year, bringing the U.S. total installed wind
power capacity to over 16,800 MW.
Market The wind industry in North Carolina’s FERC region, NERC is quite limited; however the four active
producers in the area are Invenergy LLC, John Deere Renewables, LLC, Tennessee Valley Authority and

SECTION G: PRELIMINARY TECHNOLOGY SCREEN – WIND POWER
Page G‐2
the Illinois Rural Electric Cooperative. Invenergy LLC has over 400 MW of installed wind capacity
nationwide, John Deere 150 MW, TVA 1.8 MW and the Illinois Rural Electric Cooperative 1.6.
Availability of Resource (national overview) Wind installations and current wind projects and the wind resource map of North Carolina are
represented in the DOE figures below.

SECTION G: PRELIMINARY TECHNOLOGY SCREEN – WIND POWER
Page G‐3
Preliminary Economic Assessment As of July 2007, the NREL estimates the cost of wind energy when generated at a site rated at least
“good,” by their standards, to be between ¢6‐9 per kWh without the additional benefit of the
Production Tax Credit.
According to the NREL, the cost of turbines in 2006 for all sizes was between $1,000 and $1,200 per
kWh. And the DOE’s Energy Efficiency and Renewable Energy 2006 Annual Report on U.S. Wind Power
Installation, Cost, and Performance Trends, reported that installed costs for 2006 ranged from
$1,150/kW to $2,240/kW, with an average cost of $1,480/kW‐up $220/kW (18%) from $1,260/kW in
2005. The report also sites reason to believe that recent increases in turbine costs did not fully work
their way into installed project costs in 2006. The average cost estimate for proposed projects in their
sample was $1,680/kW, or $200/kW higher than for projects completed in 2006. The same report
suggests that projects may reach an average of $1,800/kW or higher in future years, primarily due to
increases in turbine cost. Turbine prices have gone up due to many reasons including the declining
value of the U.S. dollar relative to the Euro, increased materials and energy input prices, a general move
by manufacturers to improve their profitability, shortages in certain turbine components, and an up‐
scaling of turbine size and sophistication, according to the same EERE report.
Implementation time for wind is relatively short, Horizon Wind Energy sites case studies on the
company’s website that claim an average construction time of 1‐1.5 years depending on the size. The
Northwest Power and Coordination Council lists the time as closer to one year.

SECTION G: PRELIMINARY TECHNOLOGY SCREEN – WIND POWER
Page G‐4
Environmental Considerations The potential for wind power to deliver energy to UNC is practically irrefutable given the current state of
wind technology; however the potential for local wind power to deliver energy to UNC is unlikely.
Another important environmental consideration is that wind energy also relatively cheap when it comes
to CO2 reduction, the International Carbon Bank and Exchange estimates the cost of wind is $50 for one
ton of CO2 reduction.
Political/Regulatory Considerations The Utility Wind Interest Group considers regulatory complexity and wind integration into the grid one
of the most pressing issues wind power faces in the United States. Regulatory complexity in North
Carolina is dependent on the location, local, state, or federal jurisdictions or a combination of the three
could apply to a particular project. A brief description of the required permits is included below in the
permitting complexity section.
Siting concerns for wind power include:
(1) Wildlife/Ecological Concerns‐ The most viable site for wind energy is often situated near or in a
main migratory path for birds, and while firm statistics are hard to come by, this can sometimes
bog down a project if significant complaints are made in the community.
(2) Aesthetic Impacts‐ Wind turbines are often located in open areas, making them conspicuous
and highly visible and some people are adverse to this. Another problem of some note is a small
amount of noise generated by the turbines, but new technology is eliminating this problem.
(3) Technological Impacts‐Wind turbines emit electromagnetic signals that can cause technological
impacts by interfering with electronic equipment such as televisions. A more serious concern is
interference with radar systems. There are no clear permitting guidelines to mitigate this issue
yet, but the military is developing a communication system so wind developers can get feedback
on proposed developments early in the process. Radar interference would be a particular issue
in costal North Carolina due to the large military presence in the eastern part of the state.
Wind power is viewed as favorable within most realms of politics because it is a proven technology, its
quick implementation time, and relatively low cost. With many states implementing Renewable
Portfolio Standards, wind power is even easier to make a case for as it is one of the cheapest forms of
renewable energy.
Incentives for renewable energy in North Carolina with respect to wind include:
(1) NC GreenPower Production Incentive‐ NC GreenPower, a statewide green‐power program was
designed to encourage the use of renewable energy in North Carolina offers production
payments for grid‐tied electricity generated by various renewable sources. Payment
arrangements for electricity generated by these systems are available through a periodic RFP
process. Owners of small wind‐energy systems receive $0.06/kWh from the program, plus

SECTION G: PRELIMINARY TECHNOLOGY SCREEN – WIND POWER
Page G‐5
approximately $0.04/kWh from their utility, for a total production payment of about
$0.10/kWh.
(2) Modified Accelerated Cost‐Recovery System (MACRS) ‐ Under MACRS, businesses may recover
investments in renewable energy through depreciation deductions. For solar, wind, and
geothermal property placed in service after 1986 the current MACRS property class is five years.
(3) Renewable Electricity Production Tax Credit‐ The PTC provides a credit of $0.015 per kWh in
1993 dollars and indexed for inflation. The duration of the credit is 10 years.
(4) USDA Renewable Energy Systems and Energy Efficiency Improvements Program‐ This program
includes both a loan and a grant program. For the grant option, funds of up to 25% of eligible
project costs are available with a minimum of $2,500 and a maximum of $500,000. Under the
guaranteed loan option, funds of up to 50% of eligible project costs are available. The maximum
amount of a guarantee to be provided to a borrower is $10 million, and the minimum amount is
$5,000.
(5) Clean Renewable Energy Bonds (CREBs) ‐ The federal Energy Tax Incentive Act of 2005
established CREBs as a financing mechanism for public sector renewable energy projects. CREBs
may be issued by electric cooperatives, government entities and certain lenders. CREBs are
issued with a 0% interest rate. The borrower pays back only the principle of the bond, and the
bondholder receives federal tax credits in lieu of the traditional bond interest.
(6) NC Renewable Energy Tax Credit (corporate) ‐ 35% of cost with a maximum incentive of $2.5
million per installation. The credit is taken in five equal installments; allowable credit may not
exceed 50% of a taxpayer’s liability for the year, reduced by the sum of all other credits. System
must be less than 50kWh of battery storage capacity per KW of hydro generator capacity and a
maximum of 35 kWh battery storage capacity per kW for other technologies.
With respect to the ability of wind to contribute to the state’s RPS, wind is a highly volatile natural
resource and in most cases must be backed up by an alternate resource when the wind isn’t blowing.
Large banks of batteries can reduce the need for backup power when wind speeds are low, but if you do
need to utilize an additional resource such as gas, the ability of wind power to reduce carbon emissions
decreases.
Risk The potential for wind power to deliver energy to UNC is practically irrefutable given the current state of
wind technology; however the potential for local wind power to deliver energy to UNC is unlikely given
the lack of available onshore resources in North Carolina.
Potential Industry Partners The wind industry in North Carolina’s FERC region, NERC is quite limited; however the four active
producers in the area are:
Invenergy LLC
John Deere Renewables, LLC

SECTION G: PRELIMINARY TECHNOLOGY SCREEN – WIND POWER
Page G‐6
Tennessee Valley Authority
Illinois Rural Electric Cooperative
**Invenergy LLC has over 400 MW of installed wind capacity nationwide, John Deere 150 MW, TVA 1.8
MW and the Illinois Rural Electric Cooperative 1.6.
References
Duke Library @ http://dukespace.lib.duke.edu/dspace/bitstream/10161/72/1/MP_ek15_a_122006.pdf
http://www.dsireusa.org/
http://www1.eere.energy.gov/windandhydro/

Section H
Preliminary Technology Screen –
Fuel Cell

SECTION H: PRELIMINARY TECHNOLOGY SCREEN – FUEL CELL
Page H‐1
Executive Summary Fuel cell technologies are an exciting emerging technology especially with respect to the transportation
and small electronic markets. While the fuel cell industry for stationary utility‐level generation is less
mature, and perhaps being pursued less rigorously, it still presents many exciting options for alternative
energy generation. In the future, utilizing renewable energy to reform hydrogen would present an
extremely clean and efficient source of renewable energy.
Technology A fuel cell is a device that generates electricity by a chemical reaction. Every fuel cell has two electrodes,
one positive and one negative, called, respectively, the cathode and anode. The reactions that produce
electricity take place at the electrodes. Every fuel cell also has an electrolyte, which carries electrically
charged particles from one electrode to the other, and a catalyst, which speeds the reactions at the
electrodes. Hydrogen is the basic fuel, but fuel cells also require oxygen. One great appeal of fuel cells
is that they generate electricity with very little pollution—much of the hydrogen and oxygen used in
generating electricity ultimately combine to form a harmless byproduct, namely water. A single fuel cell
generates a tiny amount of direct current (DC) electricity. In practice, many fuel cells are usually
assembled into a stack. Cell or stack, the principles are the same.
The purpose of a fuel cell is to produce an electrical current that can be directed outside the cell to do
work, such as powering an electric motor or illuminating a light bulb or a city. Because of the way
electricity behaves, this current returns to the fuel cell, completing an electrical circuit. The chemical
reactions that produce this current are the key to how a fuel cell works.
There are several kinds of fuel cells, and each operates a bit differently. But in general terms, hydrogen
atoms enter a fuel cell at the anode where a chemical reaction strips them of their electrons. The
hydrogen atoms are now “ionized,” and carry a positive electrical charge. The negatively charged
electrons provide the current through wires to do work. If alternating current (AC) is needed, the DC
output of the fuel cell must be routed through a conversion device called an inverter.
Oxygen enters the fuel cell at the cathode and, in some cell types, it there combines with electrons
returning from the electrical circuit and hydrogen ions that have traveled through the electrolyte from
the anode. In other cell types the oxygen picks up electrons and then travels through the electrolyte to
the anode, where it combines with hydrogen ions. The electrolyte plays a key role. It must permit only
the appropriate ions to pass between the anode and cathode. If free electrons or other substances could
travel through the electrolyte, they would disrupt the chemical reaction. Whether they combine at
anode or cathode, together hydrogen and oxygen form water, which drains from the cell. As long as a
fuel cell is supplied with hydrogen and oxygen, it will generate electricity.
Since fuel cells create electricity chemically, rather than by combustion, they are not subject to the
thermodynamic laws that limit a conventional power plant. Therefore, fuel cells are more efficient in
extracting energy from a fuel. Waste heat from some cells can also be harnessed, boosting system

SECTION H: PRELIMINARY TECHNOLOGY SCREEN – FUEL CELL
Page H‐2
efficiency still further. While the basic fuel principles of a fuel cell are easy to illustrate, commercially
producing the technology has proven difficult and costly.
Scientists and inventors have designed many different types and sizes of fuel cells in the search for
greater efficiency, and the technical details of each kind vary. Many of the choices facing fuel cell
developers are constrained by the choice of electrolyte. The design of electrodes, for example, and the
materials used to make them depend on the electrolyte. Today, the main electrolyte types are alkali,
molten carbonate, phosphoric acid, proton exchange membrane (PEM) and solid oxide. The first three
are liquid electrolytes; the last two are solids.
The type of fuel also depends on the electrolyte. Some cells need pure hydrogen, and therefore demand
extra equipment such as a “reformer” to purify the fuel. Other cells can tolerate some impurities, but
might need higher temperatures to run efficiently. Liquid electrolytes circulate in some cells, which
require pumps. The type of electrolyte also dictates a cell’s operating temperature–“molten” carbonate
cells run hot, just as the name implies.
Each type of fuel cell has advantages and drawbacks compared to the others, and none is yet cheap and
efficient enough to widely replace traditional ways of generating power, such coal‐fired, hydroelectric,
or even nuclear power plants. Only the Phosphoric Acid and Molten Carbonate fuel cells are shown
here as they represent technology most widely utilized for fixed generation.
Molten Carbonate fuel cells (MCFC) use high‐temperature compounds of salt (like sodium or
magnesium) carbonates (chemically, CO3) as the electrolyte. Efficiency ranges from 60 to 80 percent,
and operating temperature is about 650 degrees C (1,200 degrees F). Units with output up to 2
megawatts (MW) have been constructed, and designs exist for units up to 100 MW. The high
temperature limits damage from carbon monoxide "poisoning" of the cell and waste heat can be
recycled to make additional electricity. Their nickel electrode‐catalysts are inexpensive compared to the
platinum used in other cells. But the high temperature also limits the materials and safe uses of
MCFCs—they would probably be too hot for home use. Also, carbonate ions from the electrolyte are
used up in the reactions, making it necessary to inject carbon dioxide to compensate.

SECTION H: PRELIMINARY TECHNOLOGY SCREEN – FUEL CELL
Page H‐3
Phosphoric Acid fuel cells (PAFC) use phosphoric acid as the electrolyte. Efficiency ranges from 40 to 80
percent, and operating temperature is between 150 to 200 degrees C (about 300 to 400 degrees F).
Existing phosphoric acid cells have outputs up to 200 kW, and 11 MW units have been tested. PAFCs
tolerate a carbon monoxide concentration of about 1.5 percent, which broadens the choice of fuels they
can use. If gasoline is used, the sulfur must be removed. Platinum electrode‐catalysts are needed, and
internal parts must be able to withstand the corrosive acid.
In 2007 California State University Northridge installed a 1 MW stationary fuel cell power plant system
produced by FuelCell Energy. The system is a modular unit comprised of four Direct FuelCell 300 MA
power plants with internal reformers that produce hydrogen from natural gas to power the fuel cell. At
the time of its installation, this was the largest fuel cell system at any university worldwide.

SECTION H: PRELIMINARY TECHNOLOGY SCREEN – FUEL CELL
Page H‐4
Approximately 18% of the University’s baseload power requirement is met by the fuel cell power plant.
The University further benefits from the fuel cell by utilizing waste heat to provide 22 billion BTUs of
thermal energy per year in the form of hot water to be used on campus and, by channeling residual
CO2into an adjacent greenhouse where research on carbon dioxide plan enrichment is taking place.
The nation’s largest fuel cell project is located in Garden City, N.Y. and owned by communications giant
Verizon. The seven fuel cells were built by UTC Power of South Windsor Connecticut. Verizon expects
to receive funding assistance from the U.S. DOE as well as the New York State Energy Research and
Development Authority (NYSERDA). The fuel cells from UTC Power generate 200 kW each, providing a
total of 1.4 MW of power to the Verizon center. The UTC CHP system can achieve overall efficiencies of
approximately 90% according to the company’s website, and the fuel cells will reduce the facility’s
carbon footprint by 5,400 tons each year. Water savings and Nox reductions are also results of Verizon’s
fuel cell project.
The concept of a fuel cell is nothing new; it was envisioned in 1939 by a German scientist and actualized
in 1955. Fuel cell technology however, has not yet reached its potential level of commercial success and
many factors are at fault. While the technology is at hand to make an effective fuel cell, the industry has
yet to see fuel cell technology become cost‐efficient. The materials used to make fuel cells, specifically
the platinum used as a catalyst and the cost of the Nafion membrane in a Proton Exchange Membrane
Fuel Cell are driving up the cost of fuel cells.
Market UNITED TECHNOLOGIES CORP. –UTC Fuel Cells began producing fuel cells for the Apollo space missions
and now makes a full line of fuel cell products. UTC stationary fuel cells have capabilities ranging from
180 to 360 kw of electricity as well as heat and boast upwards of 85% efficiency when used in
coordination with CHP applications. Experience includes over 75 MW installed capacity, over 8 million
operating hours as well as installations in 85 cities and 19 countries. Completed projects include the
Verizon routing call center in Garden City, New York, the largest U.S. commercial fuel cell installation of
its kind. The natural gas fired fuel cells from UTC Power generate 200 kilowatts each providing a total of
1.4 megawatts of clean power to the center. The CHP component of the Verizon installation achieves
efficiencies of approximately 90%.
FUELCELLENERGY‐ Founded in 1969, the company offers products ranging in size from 300 kilowatts to
2.4 megawatts and scalable products for distributed generation applications 10 MW and larger. One
third of FuelCellEnergy’s currently installed or backlog units rely on biofuels or renewable like anaerobic
digester gas, including the city of Tulare, California that will convert renewable dairy processing waste
into electricity for powering a wastewater treatment facility as well as the Sierra Nevada Brewing
Company which upgraded its 1 MW DFC power plant to employ renewable fuel created from a waste
by‐product of the beer brewing process. The company is currently working to expand sales of MW and
multi‐MW product sales.
SECTION H: PRELIMINARY TECHNOLOGY SCREEN – FUEL CELL
Page H‐5
Predicting potential volatility of the resources cost associated with fuel cells requires a decision as to
which type of fuel will be utilized to reform the hydrogen. Costs and volatility vary greatly if you are
using wind power as opposed to natural gas.
Availability of Resource Fuel cells don’t face similar problems of resource availability that for example, geothermal and wind
face. Hydrogen can be reformed onsite and is often combined into a modular unit with the fuel cell
itself and the two are fueled by natural gas which is supplied by PSNC Energy in the Chapel Hill area.
Preliminary Economic Assessment This figure is also similarly based upon many variables. For example, depending on which company you
go through to manufacture the fuel cells, you may be installing one unit in every building or building a
centralized housing for a number of modules, costs for these installations will vary accordingly. Hard
figures for capital outlay costs run anywhere from $500 to $6,000/kWh depending on the size of the fuel
cell. The higher the capacity, the cheaper the capital outlay as economies of scale play a role in shaping
the cost, while smaller, residential sized fuel cells remain quite expensive. Operation and management
costs vary greatly as well depending on the generation capacity, with a study done in 2004 by UC
Berkeley placing them around $19‐$90/kW year for a 250kW stationary load following fuel cell
operation. It is not mandatory that personnel is hired specifically for fuel cell O&M, however,
dependant on the specific annual fuel cell O&M charge the entity implementing the technology may find
this route is more economical than engaging a third party such as FuelCellEnergy’s Carrier Corporation.
A similar plant was installed in 2006 on the Cal State Northridge campus. The facility is a 1 MW plant
installed by FuelCellEnergy, an industry leader, designed to produce base‐load power parallel with the
utility grid. Total project cost is $5,260,000 dollars or about $5,000/kW installed cost. There are only
about 12 plants of this capacity factor world wide and this contributes to the increased cost.
Available information shows that fuel cells can produce electricity at competitive rates ≈$2,000/kW for
larger scale (>250kW) settings. However, these prices are representative of fuel cell plants powered by
natural gas, using a renewable source to power the electrolyzer would likely increase this cost as the
technology is immature. The fuel cell facilities at Verizon (1.4 MW), for example cost the company $13
million dollars as well as an additional $300,000 in the first year to operate and maintain its seven fuel
cells. Energy savings attributed to the 7 fuel cells, however, were better‐than‐expected: $680,000
annually versus the predicted $250,000. The California Energy Commission estimates that annually the
fuel supply system will need to be checked as well as the reformer system, and that every 40,000 hours
of operation, you will have to replace the cell stack. This totals an estimated ¢0.5‐¢1.0 cents per kWh.
As with many other aspects of fuel cells, implementation time varies greatly depending on the
configuration utilized. If fuel cell units are going to be placed in every building on campus, or if a large
housing unit needs to be constructed, then there will be added construction time. As an example, a 1
MW fuel cell CHP project at the Santa Rita jail in Alameda County, CA housed in a central unit recently
took 7 months of construction that included retrofitting the jail’s system to the fuel cell machinery.

SECTION H: PRELIMINARY TECHNOLOGY SCREEN – FUEL CELL
Page H‐6
Environmental Considerations A presentation by Bob Rose of the US Fuel Cell Council and Breakthrough Technologies Institute, Inc. at
the Engineers Forum on Sustainability in January of 2007 showed that a UTC fuel cell unit producing
1650 MWH of electricity versus an average U.S. fossil plant producing the same amount emitted only 75
pounds of total emissions while the fossil fuel plant emitted 41,427 pounds. It also found that CO2
emissions specifically were reduced by 45%.
Given the plethora of available options for fuel cell configurations, sizes, producers, and technologies,
hard numbers detailing the cost per Mt of CO2 reduction are almost impossible to come by. Using the
International Carbon Bank and Exchange and rough approximations of inputs, we can estimate that it
roughly costs $160 USD/ton of CO2 to reduce emissions utilizing fuel cell technology. Not as expensive
as Photovoltaic, but certainly not comparable to wind power.
Political/Regulatory Considerations Fuel cells represent a new area where in many cases, no applicable regulations exist. There are a
multitude of regulatory agencies and a multitude of different aspects of fuel cells that must be regulated
and standardized in order to ensure the quality and safety of these systems. These regulatory codes and
standards specific to stationary fuel cells utilized in buildings include: installation and site requirements,
building codes, interconnection requirements and electric utility requirements. Another interesting
regulatory element not found in many other renewables is the restrictions imposed upon shipping some
of the components used in fuel cells due to their hazardous nature.
In North Carolina, any electric generation facility or transmission line must apply for and obtain a
certificate from the North Carolina Utilities Commission. North Carolina also has a state level version of
the National Environmental Policy Act (NEPA) which provides a process for environmental review of
projects in which the state is involved. NEPA reviews are only required for projects that meet three
criteria (1) where there is an expenditure of public monies or use of a public land, and (2) a state action
(such as a permit), and (3) a potential environmental effect “upon either natural resources, public health
and safety, natural beauty, or historical or cultural elements of the state’s common in heritance. Given
these criteria, it seems likely that a project on built onsite at UNC would have to go through North
Carolina’s equivalent of the NEPA process.
Other siting and permitting issues are primarily concerned with construction and safety issues
surrounding the installation of the fuel cell. These issues include, but are not limited to:
Fuel Supply and Storage
General Siting (outdoor vs. indoor)
Fuel Cell Equipment Inspection
Fire Protection
Interconnections (includes disconnecting means, wiring methods, grounding, marking,
connection to other circuits, etc.)
SECTION H: PRELIMINARY TECHNOLOGY SCREEN – FUEL CELL
Page H‐7
NC TAX CREDITS/INCENTIVES‐
Renewable Energy Tax Credit (corporate)‐ 35% of cost with a maximum incentive of $2.5 million
per installation. The credit is taken in five equal installments; allowable credit may not exceed
50% of a taxpayer’s liability for the year, reduced by the sum of all other credits. System must
be less than 50kWh of battery storage capacity per KW of hydro generator capacity and a
maximum of 35 kWh battery storage capacity per kW for other technologies.
FEDERAL TAX CREDITS/INCENTIVES‐
Modified Accelerated Cost‐Recovery System (MACRS) ‐ Allows renewable property placed in
service after 1986 to be depreciated for a period of five years after construction is completed.
Corporate Tax Credit‐ Equipment installed 2006 ‐2008 will receive a tax credit for 30% of their
expenditures. If the project is financed in whole or in part by subsidized energy financing or by
tax‐exempt private equity bonds, the basis on which the credit is calculated must be reduced.
Federal Grant Program‐ This grant only applies to fuel cells if they utilize renewable energy to
reform the hydrogen. The maximum grant award is 25% of eligible project costs up to $500,000
for renewable energy projects and up to $250,000 for energy efficiency improvements.
Assistance to one individual or entity is not to exceed $750,000. The minimum grant request is
$2,500 for renewable energy projects. Under the guaranteed loan option, funds up to 50% of
eligible project costs with a maximum project cost of $10,000,000 are available. The minimum
amount of a guaranteed loan made to a borrower is $5,000. A combined grant and guaranteed
loan under this program cannot exceed 50% of eligible project costs, and the applicant or
borrower is responsible for having other funding sources for the remaining funds. The
maximum percentage of guarantee ranges from 70% to 85% depending on the loan value, the
percentage for a given project will be negotiated between the lender and the Rural Business‐
Cooperative Service. The interest rate will be negotiated between the lender and the applicant.
The grant program however, only applies to fuel cells with electrolyzers fueld by alternative
resources.
Renewable Energy Production Incentive (REPI) – Facilities are eligible for annual incentive
payments of $.015/kWh(in 1993 dollars and indexed for inflation) for the first 10 year period of
their operation. Eligible production facilities include not‐for‐profit electrical cooperatives, public
utilities, state governments, commonwealths, territories, possessions of the U.S., the District of
Columbia, Indian tribal governments etc.
Whether or not fuel cell technology will be able to contribute to state RPS objectives is entirely
dependent on the fuel utilized in the reforming process. If natural gas is utilized, efficiencies will be
boosted anywhere from 5% to 30%, while if biogas or wind were utilized, that number would be much
higher and carbon emissions would be reduced to almost nothing.

SECTION H: PRELIMINARY TECHNOLOGY SCREEN – FUEL CELL
Page H‐8
Risk Fuel cells have a distinct advantage over other clean generators such as wind turbines and photovoltaics
in that they can produce continuous and consistent power as long as they are supplied with a steady
supply of hydrogen. The ability to produce continuous power makes fuel cells well suited for supporting
critical loads or emergency applications. The power output of fuel cells is also high quality in that it is
“clean” computer‐grade power free from voltage disturbances such as sags, spikes, or transients that
affect the performance of some other technologies. Another advantage of fuel cells is that the fuel cell
stack (the powerhouse of the system) does not contain any moving parts, which typically increase the
risk of mechanical breakdowns in other generators. As the technology matures, fuel cells may become
more reliable than conventional engines.
References http://www.fuelcellenergy.com/files/FCE_CSUN_Northridge_Spotlight_073007.pdf
http://www.fuelcells.org/info/engineersforum.pdf
http://www.news.com/Verizon‐heeds‐call‐of‐fuel‐cells‐‐‐page‐2/2100‐1033_3‐6102552‐2.html
http://www.dsireusa.org/Index.cfm?EE=0&RE=1
http://www.eea‐inc.com/
http://www.fuelcellsworks.com/Supppage8347.html

Section I
Preliminary Technology Screen –
Geothermal

SECTION I: PRELIMINARY TECHNOLOGY SCREEN – GEOTHERMAL
Page I‐1
Summary
The National Renewable Energy Laboratory has characterized geothermal resources into the following
categories:
Hyrdothermal ‐ A hydrothermal system is defined as a subterranean geothermal reservoir that
transfers heat energy upward by vertical circulation of fluids driven by differences in fluid
density that correspond to differences in temperature. Hydrothermal systems can be classified
into two types—vapor‐dominated and hot water—depending on whether the fluid is steam or
liquid water, respectively.
Deep Geothermal Systems ‐ Deep geothermal systems (a.k.a. enhanced geothermal systems or
EGS) are defined as engineered reservoirs that have been created to extract heat from
economically unproductive geothermal resources. The deep geothermal/EGS concept is to
extract heat by creating a subsurface fracture system to which water can be added through
injection wells. The water is heated by contact with the rock and returns to the surface through
production wells, just as in naturally occurring hydrothermal systems.
Geothermal Heat Pumps ‐ Geothermal heat pumps (GHPs) use the Earth’s huge energy storage
capability to heat and cool buildings, and to provide hot water. GHPs use conventional vapor
compression (refrigerant‐based) heat pumps to extract the low‐grade heat from the Earth for
space heating. In summer, the process reverses and the Earth becomes a heat sink while
providing space cooling.

SECTION I: PRELIMINARY TECHNOLOGY SCREEN – GEOTHERMAL
Page I‐2
Geopressured Resources ‐ The geopressured resource consists of deeply buried reservoirs of hot
brine, under abnormally high pressure, that contain dissolved methane. Geopressured brine
reservoirs with pressures approaching lithostatic load are known to occur both onshore and
offshore beneath the Gulf of Mexico coast, along the Pacific west coast, in Appalachia, and in
deep sedimentary basins elsewhere in the United States. The resource contains three forms of
energy: methane, heat, and hydraulic pressure.
The following map represents geothermal resources throughout the U.S. at depths of 6km. Most of the
high quality resources that would be appropriate for electricity product are in the Western U.S. North
Carolina may have resource sufficient for a GHP system integrated with on‐campus buildings – a
prospect which is outside the scope of this supply side evaluation of renewable resources.

SECTION I: PRELIMINARY TECHNOLOGY SCREEN – GEOTHERMAL
Page I‐3
References
Green, Bruce D and R. Gerald Nix, Geothermal – the Energy Under Our Feet, National Renewable Energy
Laboratory, November 2006.

Section J
Preliminary Technology Screen –
Ocean/Tidal Energy

SECTION J: PRELIMINARY TECHNOLOGY SCREEN – OCEAN/TIDAL ENERGY
Page J‐1
Executive Summary Wave and tidal energy are two exciting technologies that have the potential to bring clean renewable
energy to market in costal locations across the globe. While wave energy is indeed being implemented
in “utility scale” in Europe, both wave and tidal energy have yet to see success commercially in the
United States.
Wave and tidal energy face three main challenges: (1)Efficiently converting wave motion into electricity‐
wave power is generally available in low‐speed, high forces, and the motion of forces is not in a single
direction; most readily‐available electric generators operate at higher speeds, and most readily‐available
turbines require a constant, steady flow. (2) Constructing devices that can survive storm damage and
saltwater corrosion‐ likely sources of failure include seized bearings, broken welds, and snapped
mooring lines, knowing this, designers may create prototypes that are so overbuilt that materials could
prohibit affordable production. (3) High total cost of electricity‐ wave power will only be competitive
when the total cost of generation is reduced; the total cost includes the primary converter, the power
takeoff system, the mooring system, installation and maintenance cost, and electricity delivery costs.
Ocean/Tidal energy technology is still in its infancy, and the lack of a dominant technology among
literally a dozen or more options is proof of this immaturity.
Technology Wave
The total power of waves breaking on the world’s coastlines is estimated at 2‐3 million MW. In favorable
locations, wave energy density can average 65 MW per mile of coastline. Three approaches to capturing
wave energy are:
Floats or pitching devices ‐ these devices generate electricity from the
bobbing or pitching action of a floating object. The object can be
mounted to a floating raft or to a device fixed on the ocean floor.
Oscillating water columns ‐ these generate electricity from the wave‐
driven rise and fall of water in a cylindrical shaft. The rising and falling
water column drives air into and out of the top of the shaft, powering an
air‐driven turbine.
Wave surge or focusing devices ‐ these shoreline devices, also called
‘tapered channel’ or ‘tapchan’ systems, rely on a shore‐mounted
structure to channel and concentrate the waves, driving them into an
elevated reservoir. Water flow out of this reservoir is used to generate
electricity, using standard hydropower technologies.

SECTION J: PRELIMINARY TECHNOLOGY SCREEN – OCEAN/TIDAL ENERGY
Page J‐2
Tidal
Tidal energy traditionally involves erecting a dam across the opening to a tidal basin. The dam includes a
sluice that is opened to allow the tide to flow into the basin; the sluice is then closed, and as the sea
level drops, traditional hydropower technologies can be used to generate electricity from the elevated
water in the basin. Some researchers are also trying to extract energy directly from tidal flow streams.
The energy potential of tidal basins is large ‐ the largest facility, the La Rance station in France,
generates 240 MW of power. Tidal energy systems can have environmental impacts on tidal basins
because of reduced tidal flow and silt build up.
According to the Australian Institute of Technology, there must be a tidal range of greater than seven
meters for a viable tidal energy site, and in North Carolina there is a tidal range of less than 4 meters,
effectively ruling out tidal energy as an option for UNC. The bulk of the information here, therefore, will
pertain to wave energy.
Ocean Power Delivery’s Pelamis wave units are currently the most commercially available wave
technology. They are located 5 km off the Atlantic coastline of northern Portugal and have a combined
capacity of 2.25 MW. The project constitutes the world’s first multi‐unit wave farm and also the first
commercial order for wave energy converters.
Market Ocean Power Delivery is currently the manufacturer with the most experience in this emerging field, but
other companies include: AquaEnergy LTD which has a buoy system of capturing weave energy, Ocean
Power Technologies and WaveBob which both utilize buoy systems.
The volatility of wave energy is difficult to determine currently, and will be predicted better as there are
increasing numbers of large scale and test projects are installed. As with other renewable resources
that depend on naturally occurring events, wave energy production fluctuates greatly depending on a
variety of factors including weather. Most areas see higher wave energy potential in the winter. Areas
such as Western Europe, the Northeastern and Northwestern United States, and Alaska all have higher
energy loads in the winter and thus this technology in these areas is especially interesting.
Availability of Resource According to the Australian Institute of Technology, there must be a tidal range of greater than seven
meters for a viable tidal energy site, and in North Carolina there is a tidal range of less than 4 meters,
effectively ruling out tidal energy as an option for UNC. Wave potential is also low with a good wave
energy site having a flux of 50 kw/m of shoreline and NC having somewhere from 5 to 20 kw/m of
shoreline.
Preliminary Economic Assessment
A recent survey of wave energy by the Carbon Trust in Britain found that the current cost of wave
energy is about 45 cents to 50 cents per kilowatt‐hour, about 10 times the price of electricity from
fossil fuels.

SECTION J: PRELIMINARY TECHNOLOGY SCREEN – OCEAN/TIDAL ENERGY
Page J‐3
Cost of implementation is still relatively unknown at this point because the only projects that are
actually in operation are test projects. The first commercial scale project in Portugal consists of three
Pelamis wave power units that will generate 2.25 MW of electricity for a cost of €8.2 million or $11.89
million.
Environmental Considerations The cost of carbon reduction is difficult to uncover given market immaturity, as well as the various
technological options, but an example from the Australian Institute of Energy shows a case study
utilizing wave energy, and using the carbon calculation tool available at from the International Carbon
Bank and Exchange’s website, we can estimate the cost per ton of CO2 reduction at around $150.
Another estimation, however that seems more viable, comes from the planned Finavera Renewables
that will be the first in the United States. This project is estimated to cost $5,000,000 and the cost per
ton of CO2 reduction will be around $385.
Political/Regulatory Considerations Regulatory obstacles for ocean/tidal energy include: (1) Confusion and disparity as to applicable
licensing agency (2) No exemptions for pilots or prototypes (3) No certainty as to property rights (4) lack
of clarity on benefits available for ocean energy generation.
Siting complexity for ocean/tidal energy is complex and dependent on the type of technology utilized. A
wave flux measurement (in kW/m) is a good measurement for wave energy, and tidal range (in meters)
is a good measuring stick for the viability of a tidal facility. Other than these basic requirements, formal
siting procedures have yet to be fleshed out in this developing industry.
Permitting is also in its infancy with regards to ocean/tidal energy, but will likely include: FERC, U.S.
Coast Guard, U.S. Fish and Wildlife Service, NOAA/OCNMS, USACE, national Marine Fisheries Service, as
well as various state offices, such as the State Department of Ecology, the State Department of Fish and
Wildlife and the State Department of Natural Resources.
None of the current Federal or North Carolina tax incentives apply to wave or tidal energy.
Risk Overall, the potential for wave energy, let alone tidal energy to the University is very low. To begin with,
UNC is removed from costal areas, tidal and wave technology are both in immature stages of
development as well as market maturity, and lastly, the area is ill‐suited to both tidal and wave energy.
Good wave power locations have a flux of about 50 kw/m of shoreline. In North Carolina, this measure
is somewhere between 5 and 20 kw/m of shoreline. Given the low probability of tidal and wave energy
to be delivered to UNC, the potential that these renewable technologies have to reduce the University’s
carbon footprint is similarly low.
References http://www.dsireusa.org/Index.cfm?EE=0&RE=1

SECTION J: PRELIMINARY TECHNOLOGY SCREEN – OCEAN/TIDAL ENERGY
Page J‐4
http://www.ecoworld.com/home/articles2.cfm?tid=334
http://www.oceanpowertechnologies.com/
web.mit.edu/ehl/www/uwenergy/ocean%20power%20overview.doc

Section K
Preliminary Technology Screen –
Algae

SECTION K: PRELIMINARY TECHNOLOGY SCREEN – ALGAE
Page K‐1
Executive Summary The basic concept fueling the interest in algae is its ability to utilize solar energy to combine water and
carbon dioxide (CO2) to create biomass that can be converted into biodiesel. Researchers view this as a
potential way to recycle carbon emissions from power plants and in the process create a transportation
biofuel that is carbon neutral. Another important advantage of algae is that it does not compete for the
same resources as other crops such as palm and corn that are used to develop biofuels. Research has
also shown that algae use land more efficiently. A field of corn, when converted into biofuel ethanol,
may produce about 0.2 tons of oil equivalent per hectare. Rapeseed may generate around 1.2 tons.
Micro algae can theoretically produce between 50 and 140 tons using the same plot of land.
Technology The concept of using algae to capture CO2 and create biofuel is not new. MIT and other universities
began experimenting with algae for oil production back in the 1950’s. The Department of Energy’s
National Renewable Energy Lab (NREL) began a program in 1978 to explore algal biodiesel called the
“Aquatic Species Program: Biodiesel from Algae” (ASP). That program was abandoned a decade ago due
to budget cuts and the relative cheap price of oil. NREL released a report at the closure of the project
that stated, “This report should not be seen as an ending, but as a beginning. When the time is right, we
fully expect to see renewed interest in algae as a source of fuels and other chemicals.” (taken from “A
Look Back at the U.S. Department of Energy’s Aquatic Species Program: Biodiesel from Algae.”) Last
year, NREL resurrected its algal fuel program in a joint venture being funded by Chevron Technology
Ventures, a subsidiary of Chevron. In recent years large amounts of venture capital dollars have gone to
companies worldwide that are working to develop an economical way of successfully using algae to
create biofuel. Key technical challenges that remain include identifying the strains with the highest oil
content and growth rates, developing cost‐effective growing and harvesting methods, and keeping algae
production free from contamination.
Algae production is generally divided into two different methodologies. The first method developed
makes use of open, shallow ponds in which some source of waste CO2 is bubbled into the water and
captured by the algae as shown below.

SECTION K: PRELIMINARY TECHNOLOGY SCREEN – ALGAE
Page K‐2
The ponds are “raceway” designs, in which the algae, water and nutrients circulate around a racetrack.
Paddlewheels provide the flow. The algae are thus kept suspended in water. Algae are circulated back
up to the surface on a regular frequency. The ponds are kept shallow because of the need to keep the
algae exposed to sunlight and the limited depth to which sunlight can penetrate the pond water. The
ponds are operated continuously; that is, water and nutrients are constantly fed to the pond, while
algae‐containing water is removed at the other end. Some kind of harvesting system is required to
recover the algae, which contains substantial amounts of natural oil.
The second method of algae production utilizes a vertical closed‐looped photobioreactor such as the
one shown in the picture below. Algae and CO2 are pumped into the bioreactors. Gravity then takes
control and moves the algae through the reactors. As the algae passes through the reactors it is exposed
to sunlight. Using the energy provided by the sun, the algae photosynthesizes the carbon dioxide and
creates biomass. Then the algae is recycled through the tank to start the process all over again.
The process is the same as the open pond method, but this method attempts to increase efficiency by
increasing surface area that is exposed to sunlight and decrease both water evaporation and the level of
contaminants that compete with or graze on the desired strain of algae being produced.
The open pond method is much less expensive than the closed‐loop method, but it also requires more
water due to higher evaporation rates and is more likely to be contaminated by anything that is carried
in the wind. Due to the lower cost, NREL’s program focused on the open pond method.

SECTION K: PRELIMINARY TECHNOLOGY SCREEN – ALGAE
Page K‐3
The biomass that is developed through this these processes can be converted into a number of different
fuel products. Some potential products include the production of methane gas via biological or thermal
gasification, production of ethanol via fermentation, production of biodiesel, or direct combustion of
biomass for production of steam or electricity. Most of the R&D in this area in the United States has
been focused on production of biodiesel. The concept of algal biomass as a fuel extender in coal‐fired
power plants has been pursued by the Japanese.
Market The technology is not yet ready on a commercial scale, but there are several development projects
underway. GreenFuel, based in Cambridge Massachusetts, is running pilot programs at the following
electric generating facilities: MIT Cogen (MA), APS Redhawk (AZ), NRG Dunkirk (NY), Sunflower Electric
(KS), NRG Big Cajun (LA), and APS Fourcorners (NM).
Availability of Resource The scientists involved in NREL’s study from 1978 to 1996 regularly revisited the question of available
resources for producing biodiesel from microalgae in the U.S. Such resource assessments required a
combined evaluation of appropriate climate, land and resource availability. These analyses indicated
that significant potential land, water and CO2 resources do exist to support this technology on a national
scale. Algal biodiesel could easily supply several “quads” of biodiesel—substantially more than existing
oilseed crops could provide. Microalgae systems use far less water than traditional oilseed crops. Land is
not a limitation. Two hundred thousand hectares (less than 0.1% of climatically suitable land areas in the
U.S.) could produce one quad of fuel. Thus, though the technology faces many R&D hurdles before it can
be practicable, it is clear that resource limitations are not an argument against the technology. Vetigro
Energy, a company developing a vertical closed‐loop system, claims that dedicating land 1/10th the size
of New Mexico to algae production would be able to supply the energy needs for the entire country.
There are no publicly available resource data on the resource availability in North Carolina.
Preliminary Economic Assessment Engineering design and cost studies were done throughout the course of the NREL’s study. The last set
of cost estimates for the program was developed in 1995. These estimates showed that algal biodiesel
cost would range from $1.40 to $4.40 per gallon based on current and long‐term projections for the
performance of the technology. With assumptions of $50 per ton of CO2 as a carbon credit, NREL found
that the cost of biodiesel didn’t compete with the projected cost of petroleum diesel, but with the
recent spike in petroleum prices, this may no longer be the case.
Environmental Considerations A GreenFuel algae farm will consume approximately 500 metric tons of CO2 per hectare per year based
on current algae composition and growth rates. Based on information in the US Energy Information
Administration 2006 power plant database, for the approximately 500 power plants in the US that
generate and sell electricity as their primary business and use coal as the primary power source, the
average facility nameplate size is 655 megawatts. For this 'average' plant, when both the power plant

SECTION K: PRELIMINARY TECHNOLOGY SCREEN – ALGAE
Page K‐4
and algae farm are in full operation, approximately 3400 hectares of algae growing area is required to
consume 40% of CO2 emissions. To achieve a 5.2% reduction in CO2 emissions, which is comparable to
the 2008‐2012 Kyoto Protocol overall goal, 420 hectares of algae growing area would be required for the
same 655 megawatt plant.
Risk The main risk at this point is technology risk. Opponents believe that this process will never be
economical.
Potential Industry Partners Sapphire Energy is a San Diego based startup that is hoping to have a demonstration plant built within
the next 5 years that will be capable of producing 10,000 barrels per day of “green crude” which they
claim can be refined to 91‐octane gasoline.
GreenFuel Technologies Corporation founded in 2001 in Cambridge, Massachusetts recycles carbon
dioxide from flue gases to produce biofuels and feed.
Chevron Technology Ventures teamed up with NREL in 2007 to study and advance technology to
produce liquid transportation fuels usuing algae.
Vertigro Energy is a joint venture between Valcent Products Inc. and Global Green Solutions Inc.
References
Benemann, John R. “Overview: Algae Oil to Biofuels” NREL‐AFOSR Workshop. Arlington, VA. February
19th, 2008.
“A Look Back at the U.S. Department of Energy’s Aquatic Species Program: Biodiesel from Algae.” U.S.
DOE, NREL/TP‐580‐24190. July 1998.
NREL New Release NR‐2607, October 31, 2007.”Chevron and NREL to Collaborate on Research to
Produce Transportation Fuels using Algae.”
Horn, Miriam. “Algae, a Promising Fuel Source?” Environmental Defense Blog. May 8, 2008.
Valcent Products Inc. Video Clip from website. http://www.valcent.net/i/misc/HDVG/index.html
GreenFuel Inc website. http://www.valcent.net/i/misc/HDVG/index.html

Section L
Preliminary Technology Screen –
Sequestration
SECTION L: PRELIMINARY TECHNOLOGY SCREEN – SEQUESTRATION
Page L‐1
Executive Summary Carbon capture and sequestration begins with the separation and capture of CO2 from power plant flue
gas and other stationary CO2 sources. At present, this process is costly and energy intensive, accounting
for the majority of the cost of sequestration. However, analysis shows the potential for cost reductions
of 30–45 percent for CO2 capture. Post‐combustion, pre‐combustion, and oxy‐combustion capture
systems being developed are expected to be capable of capturing more than 90 percent of flue gas CO2.
The next step is to sequester (store) the CO2. The primary means for carbon storage are injecting CO2
into geologic formations or using terrestrial applications. Geologic sequestration involves taking the CO2
that has been captured from power plants and other stationary sources and storing it in deep
underground geologic formations in such a way that CO2 will remain permanently stored. Geologic
formations such as oil and gas reservoirs, un‐mineable coal seams, and underground saline formations
are potential options for storing CO2. Storage in basalt formations and organic rich shales is also being
investigated.
Terrestrial sequestration involves the net removal of CO2 from the atmosphere by plants and
microorganisms that use CO2 in their natural cycles. Terrestrial sequestration requires the development
of technologies to quantify with a high degree of precision and reliability the amount of carbon stored in
a given ecosystem. Program efforts in this area are focused on increasing carbon uptake on mined lands
and evaluation of no‐till agriculture, reforestation, rangeland improvement, wetlands recovery, and
riparian restoration.
Technology There are three types of CO2 capture technology: post‐combustion, pre‐combustion, and oxy‐
combustion. Post‐combustion CO2 capture mainly applies to conventional coal‐fired power generation,
but may also be applied to gas‐fired generation using combustion turbines. In a typical coal‐fired power
generation system, fuel is burned with air in a boiler to produce steam; the steam drives a turbine to
generate electricity. The boiler exhaust, or flue gas, consists mostly of nitrogen (N2) and CO2. Separating
CO2 from this flue gas stream is challenging for several reasons:
CO2 is present at dilute concentrations (13‐15 volume percent in coal‐fired systems and 3‐4
volume percent in gas‐fired turbines) and at low pressure (15‐25 pounds per square inch absolute
[psia]), which dictates that a high volume of gas be treated.
Trace impurities (particulate matter, sulfur dioxide, nitrogen oxides) in the flue gas can degrade
sorbents and reduce the effectiveness of certain CO2 capture processes.
Compressing captured or separated CO2 from atmospheric pressure to pipeline pressure (about
2,000 psia) represents a large auxiliary power load on the overall power plant system.
Absorption processes based on chemical solvents such as amines have been developed and deployed
commercially in certain industries. To date, however, their use in pulverized coal (PC) power plants has
been restricted to slipstream applications.

SECTION L: PRELIMINARY TECHNOLOGY SCREEN – SEQUESTRATION
Page L‐2
Pre‐combustion CO2 capture relates to gasification plants, where fuel such as coal is converted into
gaseous components by applying heat under pressure in the presence of steam. In a gasification reactor,
the amount of air or oxygen (O2) available inside the gasifier is carefully controlled so that only a portion
of the fuel burns completely. This “partial oxidation” process provides the heat necessary to chemically
decompose the fuel and produce synthesis gas (syngas), which is composed of hydrogen (H2), carbon
monoxide (CO), and minor amounts of other gaseous constituents. The syngas is then processed in a
water‐gas‐shift reactor, which converts the CO to CO2 and increases the CO2 and H2 molecular
concentrations to 40 percent and 55 percent, respectively, in the syngas stream. At this point, the CO2
has a high partial pressure (and high chemical potential), which improves the driving force for various
types of separation and capture technologies. Near‐term applications of CO2 capture from pre‐
combustion systems will likely involve physical or chemical absorption processes, with the current state
of the art being a glycol‐based solvent called Selexol. Mid‐term to long‐term opportunities to reduce
capture costs through improved performance could come from membranes and sorbents currently at
the laboratory stage of development.
The objective of oxygen‐fired pulverized coal combustion is to combust coal in an enriched oxygen
environment using pure oxygen diluted with recycled CO2 or H2O. Under these conditions, the primary
products of combustion are CO2 and H2O, and the CO2 can be captured by condensing the water in the
exhaust stream.
NETL’s efforts to store CO2 are focused on two categories of repositories: geologic formations and
terrestrial ecosystems. Geologic sequestration involves injecting CO2 into underground reservoirs that
have the ability to securely contain it. Geologic CO2 storage R&D focuses on five types of geologic
formations: oil and gas reservoirs, deep saline formations, un‐mineable coal seams, oil‐ and gas‐rich
organic shales, and basalts. Oil and gas reservoirs are layers of porous rock formations that have trapped
crude oil or natural gas for millions of years. An impermeable, overlying rock formation forms a seal that
traps the oil and gas; the same mechanism would apply to CO2 storage. As a value‐added benefit, CO2
injected into these reservoirs can facilitate recovery of oil and gas resources left behind by earlier
recovery efforts. CO2 can increase oil recovery from a depleting reservoir by an additional 10‐20 percent
of the original oil in place. CO2 enhance oil recovery (EOR) accounts for 4 percent of the Nation's oil
production, and DOE studies have indicated that a widespread CO2 EOR program in large, favorable
reservoirs could significantly boost U.S. oil production.
Saline formations are composed of porous rock saturated with brine and capped by one or more
regionally extensive impermeable rock formations, enabling trapping of injected CO2. Compared with
coal seams or oil and gas reservoirs, saline formations are more common and offer the added benefits
of greater proximity to emission sources, higher CO2 storage capacity, and fewer existing well
penetrations. On the other hand, much less is currently known about the potential of saline formations
to store and immobilize CO2.
Un‐mineable coal seams, at depths beyond conventional recovery limits, represent another promising
opportunity for CO2 storage and can result in enhanced coalbed methane recovery (ECBM). Most coals
contain adsorbed methane, but will preferentially adsorb CO2, causing the methane to desorb. Similar to

SECTION L: PRELIMINARY TECHNOLOGY SCREEN – SEQUESTRATION
Page L‐3
the by‐product value gained from EOR, the recovered methane provides a value‐added revenue stream
to the carbon capture and storage process, reducing overall net costs. CO2 injection is known to displace
methane, and a greater understanding of the displacement mechanism is being developed to optimize
CO2 storage and to understand the problems of coal swelling and decreased permeability.
Shale, the most common type of sedimentary rock, is characterized by thin horizontal layers of rock with
very low permeability in the vertical direction. Many shales contain 1–5 percent organic material, and
this hydrocarbon material provides an adsorption substrate for CO2 storage, similar to CO2 storage in
coal seams. Research is focused on achieving economically viable CO2 injection rates, given shales'
generally low permeability
Basalt formations are geologic formations of solidified lava. Basalt formations have a unique chemical
makeup that could potentially convert all of the injected CO2 to a solid mineral form, thus isolating it
from the atmosphere permanently. Research is focused on enhancing and utilizing the mineralization
reactions and increasing CO2 flow within a basalt formation. Although oil‐ and gas‐rich organic shales
and basalts research is in its infancy, these formations may, in the future, prove to be optimal storage
sites for stranded emissions sources.
Terrestrial sequestration is the enhancement of the CO2 uptake by plants that grow on land and in
freshwater and, importantly, the enhancement of carbon storage in soils where it may remain more
permanently stored. Terrestrial sequestration provides an opportunity for low‐cost CO2 emissions
offsets. Early efforts include tree plantings, no‐till farming, and forest preservation. More‐advanced
research includes the development of fast‐growing trees and grasses and deciphering the genomes of
carbon‐storing soil microbes. NETL's terrestrial sequestration R&D is focused on reforesting and
amending minelands and other damaged soils and analyzing various land management techniques,
including no‐till farming, reforestation, rangeland improvement, wetlands recovery, and riparian
restoration.
Market Commercial scale capture and sequestration is still several years down the road. The Department of
Energy’s National Energy Technology Lab (NETL) is working on 25 geologic injection test sites and 11
terrestrial field test sites as shown on the following map.

SECTION L: PRELIMINARY TECHNOLOGY SCREEN – SEQUESTRATION
Page L‐4
Availability of Resources The Southeast Regional Carbon Sequestration Partnership (SECARB) is one of the seven Regional
Partnerships created by DOE in 2003, as part of its program to advance the mitigation of greenhouse gas
emissions. After two years of fact finding across the United States, the Partnerships are now engaged in
individual carbon sequestration validation projects. Each Partnership project is distinct in its geology,
land use, and population base. SECARB, led by the Southern States Energy Board, represents the 11
southeastern states of Alabama, Arkansas, Florida, Georgia, Louisiana, Mississippi, North Carolina, South
Carolina, Tennessee, Texas, and Virginia, plus counties in Kentucky and West Virginia. SECARB’s
validation project is a four‐year effort devoted to conducting validation field tests of carbon
sequestration technologies, and to evaluating options and potential opportunities for carbon
sequestration in the region. See Map.

SECTION L: PRELIMINARY TECHNOLOGY SCREEN – SEQUESTRATION
Page L‐5
http://www.netl.doe.gov/technologies/carbon_seq/core_rd/RegionalPartnership/42590.html
Saline formations are the primary CO2 geologic options for the SECARB region, because of the extensive
saline formations that underlie many of the region’s power plants. SECARB research has identified an
estimated 1,440 billion metric tons of potential sequestration in saline formations in the region. Saline
formations with favorable sequestration potential underlie Alabama, Florida, Louisiana, Mississippi, East
Texas, and Tennessee.
Other significant geologic storage opportunities in the SECARB region include an estimated 32.4 billion
metric tons of potential storage capacity in depleted oil and gas fields and 82.1 billion metric tons of
potential storage capacity in un‐mineable coal seams.
Preliminary Economics Aqueous amines are the state‐of‐the‐art technology for CO2 capture for PC power plants. Analysis
conducted at NETL shows that CO2 capture and compression using amines raises the cost of electricity
from a newly‐built supercritical PC power plant by 84 percent, from 4.9 cents/kWh to 9.0 cents/kWh.
The goal for advanced CO2 capture systems is that CO2 capture and compression added to a newly
constructed power plant increases the cost of electricity by no more than 20 percent compared to a no‐
capture case.
The state‐of‐the‐art for CO2 capture from an IGCC power plant is glycol‐based Selexol sorbent. Analysis
conducted at NETL shows that CO2 capture and compression using Selexol raises the cost of electricity
from a newly built IGCC power plant by 25 percent, from 5.5 cents/kWh to 6.5 cents/kWh. The goal for
advanced CO2 capture and sequestration systems applied to an IGCC is no more than a 10 percent

SECTION L: PRELIMINARY TECHNOLOGY SCREEN – SEQUESTRATION
Page L‐6
increase in the cost of electricity. It is a more stringent goal given that the conditions for CO2 capture
are more favorable in an IGCC plant.
Political/Regulatory Considerations Although there is not yet a comprehensive federal legal and regulatory framework for carbon storage,
the Environmental Protection Agency (EPA) has jurisdiction under the Safe Drinking Water Act of 1974
(SDWA) to regulate most types of underground injection. According to the EPA, the injection of CO2 for
underground storage is included. Specific regulations are brought together in the Underground
Injection Control (UIC) Program, which regulates underground injection in five different classes of
injection wells. States are allowed to assume primary responsibility for implementing the UIC
requirements within their boundaries, as long as the state program is consistent with EPA regulations
and has received EPA approval. The SDWA itself authorizes any state to assume primary responsibility
for controlling underground injection related to oil and gas recovery and production by demonstrating
that its program meets SDWA requirements and represents an effective program.
The EPA announced in March 2007 through its “Guidance” procedure that it recommends using an
experimental well category (Class V) for permitting pilot carbon sequestration projects. This special
classification is aimed at pilot and demonstration projects with experimental goals. The EPA expressly
recognizes that in the future, the technology surrounding CO2 will no longer be considered
experimental, but expects by then to have made a decision on a strategy to address CO2 injection on a
commercial scale. A different classification or an exemption of CO2 in a manner analogous to that
accorded natural gas may be called for in the long term. In any event, large commercial carbon
sequestration operations raise broad issues of site selection criteria, monitoring for subsurface
migration, injection well design standards, conditions attaching to any abandonment of the site, and
standards for halting CO2 injection if a loss of containment should occur. In short, as the need for
carbon sequestration projects grows, comprehensive regulation will be required, addressing access to
pipeline networks, pricing of transportation and storage, policies regarding monopoly control, and the
mix of federal and state authority over the safety aspects of transportation and storage facilities. The
legislative history of existing regulations pertaining to oil and natural gas transportation and storage will
be instructive.
Risks A sudden and large release of CO2 would pose immediate dangers to human life and health, if there
were exposure to concentrations of CO2 greater than 7–10% by volume in air. The severity of health
effects depends on the actual CO2 concentration and length of exposure. Exposure to concentrations of
above 5,000 ppm to 30,000 ppm may cause headaches, dizziness, and other reversible side effects.
Unconsciousness can occur at concentrations above 50,000 ppm and concentrations above 100,000
ppm are considered to be life threatening. Pipeline transport of CO2 through populated areas requires
attention to route selection, overpressure protection, leak detection and other design factors.
Impacts of elevated CO2 concentrations in the shallow subsurface could include lethal effects on plants
and subsoil animals and the contamination of groundwater. High fluxes in conjunction with stable

SECTION L: PRELIMINARY TECHNOLOGY SCREEN – SEQUESTRATION
Page L‐7
atmospheric conditions could lead to local high CO2 concentrations in the air that could harm animals or
people. Pressure build‐up caused by CO2 injection could trigger small seismic events.
References http://www.netl.doe.gov/technologies/carbon_seq/index.html
http://www.netl.doe.gov/technologies/carbon_seq/partnerships/validation.html
http://www.netl.doe.gov/technologies/carbon_seq/core_rd/RegionalPartnership/42590.html
IPCC, 2005: IPCC Special Report on Carbon Dioxide Capture and Storage. Prepared by Working Group III
of the Intergovernmental Panel on Climate Change [Metz, B., O. Davidson, H. C. de Coninck, M. Loos,
and L. A. Meyer (eds.)]. Cambridge University Press, Cambridge, United Kingdom and New York, NY,
USA, 442 pp.

Section M
Preliminary Technology Screen –
Landfill Gas

Executive Summary Most municipal solid waste (MSW) in the United States is deposited in landfills, where bacteria
decompose the organic material. A product of the bacterial decomposition is landfill gas, which is
composed of methane (CH4) and carbon dioxide (CO2) in approximately equal concentrations, as well as
smaller amounts of nonmethane volatile organic compounds (NMVOC), nitrogen oxides (NOX), and
carbon monoxide (CO). If not collected and combusted, over time, this landfill gas is released to the
atmosphere. In the United States, landfills are the largest source of anthropogenic emissions of CH4,
accounting for 25 percent of total CH4 emissions.
Gas collection systems installed at a landfill collect and convey CH4 to a flare or gas utilization project.
These collection systems typically consist of wells, pipes, blowers, caps and other technologies that
enable or enhance gas collection. At some landfills, a flare will be the only site where landfill gas is
destroyed. At landfills that install energy or process heat technologies that combust landfill gas, such as
turbines, reciprocating engines, boilers, heaters, or kilns, these devices will be the main sites where
landfill gas is combusted. For safety and regulatory purposes, most projects that produce energy or
process heat also include a flare in their design to combust gas during periods when the gas utilization
project is down for repair or maintenance.
Technology LFG can be used to generate electricity and process heat, or can be upgraded for pipeline sales. Power
production from an LFG facility is typically less than 10 MW. There are several types of commercial
power generation technologies that can be easily modified to burn LFG. Internal combustion engines are
by far the most common generating technology choice. About 75 percent of the landfills that generate
electricity use internal combustion engines. Depending on the scale of the gas collection facility, it may
be feasible to generate power via a combustion turbine or a boiler and steam turbine. LFG co‐firing in
larger utility boilers is also in use; nearly 35 percent of all landfill gas projects in the U.S. are co‐fired.
Testing with microturbines and fuel cells is also under way, although these technologies do not appear
to be economically viable for power generation.
Market Landfill gas (LFG) projects have been around since the late 1970s, providing renewable energy in the
form of electricity and alternative fuel to citizens, businesses, and industry. In 2004 alone, more than
375 operational LFG energy projects in 38 states supplied 9 billion kilowatt hours of electricity, and 74
billion cubic feet of LFG to end users.
More than 50 green pricing programs include LFG, and at least 14 states accept LFG energy in their
renewable portfolio standards. LFG is a good fit for green power programs. LFG is a recognized
renewable energy resource (e.g., by the Green‐e voluntary certification program for green power
products; EPA’s Green Power Partnership). LFG serves as the “baseload renewable” for many green
power programs, providing online availability exceeding 90 percent. Landfills that can support projects
are available in every state. LFG projects tend to be one of the more cost‐competitive forms of
renewable energy generation.

Resource Availability Gas production at a landfill is primarily dependent on the depth and age of waste in place and the
amount of precipitation received by the landfill. In general, LFG recovery may be economically feasible
at sites that have more than 1 million tons of waste in place, more than 30 acres available for gas
recovery, a waste depth greater than 40 feet, and at least 25 inches of annual precipitation. The
economic life of an LFG resource is limited. After waste deliveries to a landfill cease and the landfill is
capped, LFG production will decline, typically following a first order decay.
Preliminary Economic Assessment The economics of installing an LFG energy facility depend heavily on the characteristics of the candidate
landfill. The payback period of an LFG energy facility at a landfill that has an existing gas collection
system can be as short as 2 to 5 years, especially if environmental credits are available. However, the
cost of installing a new gas collection system at a landfill can prohibit installing an LFG facility. Table 5‐4
presents cost and performance estimates for typical LFG projects using reciprocating engines. The low
end of the capital cost range represents larger facilities employing combustion turbine technologies and
minimal gas cleanup requirements, while the high end of the capital cost range represents sites with
small generation capacities, employing reciprocating engines and significant gas cleanup equipment to
remove siloxanes and acid gases. Facilities with multiple engines or turbines, minimal gas cleanup
equipment and reliable delivery of LFG from well field tend to have higher capacity factors than those of
facilities with a single engine or turbine, complex gas cleanup systems and sporadic delivery of LFG from
the well field.

Environmental Considerations Combustion of LFG releases pollutants similar to those released by many other fuels, but the
combustion of LFG is generally perceived as environmentally beneficial. Since LFG is principally
composed of methane, if it is not combusted, LFG is released into the atmosphere as a greenhouse gas.
As a greenhouse gas, methane is 23 times more harmful than CO2. Collecting the gas and converting the
methane to CO2 through combustion greatly reduces the potency of LFG as a source of greenhouse gas
emissions.
The estimated annual environmental benefits and energy savings associated with currently operational
projects are equivalent to:
Planting 19,000,000 acres of forest, or
Preventing the use of 150,000,000 barrels of oil, or
Removing the CO2 emissions equivalent to 14,000,000 cars, or
Offsetting the use of 325,000 railcars of coal.
Political/Regulatory Considerations The performance standard subjects greenhouse gas offset projects to a regulatory “screen” to
ensure that the emission reductions achieved would not have occurred in the absence of the project
due to federal, state or local regulations.
Federal Regulations. There are several EPA regulations for municipal solid waste landfills that have a
bearing on the eligibility of methane collection and combustion projects as GHG offset projects. These
regulations include:
New Source Performance Standards (NSPS) for Municipal Solid Waste Landfills,
codified in 40 CFR 60 subpart WWW – Targets landfills that commenced construction
or made modifications after May 1991.
Emission Guidelines (EG) for Municipal Solid Waste Landfills, codified in 40 CFR 60
subpart Cc. – Targets existing landfills that commenced construction before May 30,
1991, but accepted waste after November 8, 1987.
The National Emission Standards for Hazardous Air Pollutants (NESHAP), codified in 40
CFR 63 subpart AAAA – Regulates new and existing landfills.
These regulations require control of nonmethane organic compounds (NMOC) from landfills according
to certain size and emission thresholds. In most cases, activities to reduce NMOC will also lead to a
reduction in CH4 emissions, as gas collection and combustion is a common NMOC management
technique employed at regulated landfills.
Landfills with a design capacity of at least 2.5 million megagrams and 2.5 million cubic meters of
municipal solid waste are subject to the NSPS, EG and the NESHAP. Landfills above the size cutoff must
calculate their annual NMOC emissions using equations in the rules. If the calculated uncontrolled

NMOC emissions reach 50 megagrams per year, the landfill must install a gas treatment system to
reduce emissions of NMOC.
Landfills smaller than 2.5 million megagrams or 2.5 million cubic meters of waste, and those landfills
not defined as municipal solid waste landfills, such as landfills that contain only construction and
demolition material or industrial waste, are not usually subject to NSPS or EG, but can be subject to
NESHAP.
State and Local Regulations. All states are required by the Clean Air Act (CAA) and Subtitle D of the
Resource Conservation and Control Act (RCRA subtitle D) to promulgate rules for landfills. It is also
possible that some landfills that exceed applicable emission thresholds will require site specific permits
requiring controls under the New Source Review (NSR) permitting program authorized by the CAA and
implemented by states. These state level rules generally follow federal guidelines, however, the state
rules can be more stringent or require the installation of a gas collection and combustion system, or the
destruction of volatile organic compounds (VOC), NMOC, or CH4 earlier, or at smaller facilities, than the
federal regulations would require.
Local governments may also regulate municipal solid waste landfills, for example, by putting in place
nuisance laws or requiring solid waste facilities, smaller than the facilities regulated by the CAA or RCRA
Subtitle D, to obtain permits and control landfill gas. Other regulations may require minimal gas
collection to prevent lateral migration of the landfill gas to neighboring properties.
Collection and combustion activities at landfills regulated under NSPS, EG, the NESHAP, CAA or RCRA
Subtitle D are not eligible as greenhouse gas offset projects.
Collection and combustion projects at
landfills that have minimal gas collection systems in place (i.e., to address local nuisance laws or to
prevent lateral migration of the landfill gas to neighboring properties but that are not required to
control NMOCs)) are eligible as GHG offset projects for those reductions resulting from collection and
combustion of landfill gas beyond that from the system currently in place.
Potential Industry Partners Following list is available online at http://www.epa.gov/landfill/part/industry2.htm#NC
Partner Contact
Carlson Environmental Consultants, PC
305 South Main Street
Monroe, NC 28112
Carlson Environmental Consultants, PC (CEC) provides LFG and
renewable energy engineering and consulting services to public and
private waste facilities. CEC has an emphasis on LFG collection and
control system design, LFG sampling and testing, air permitting and
Mr. Kristofer L. Carlson P.E., President
(704) 506‐7312
Mr. Jeff McNabb, Vice President
(704) 202‐5199

NSPS compliance services, and LFG and LFGE system operations and
maintenance.
Duke Solutions
400 South Tryon Street
Charlotte, NC 28201‐1004
Duke Solutions provides engineering consultation, design, and
project management services for LFG utilization. To date it has
completed one medium‐Btu boiler project.
Mr. George Irwin
(704) 373‐6903
Mr. Larry Bennett
(704) 382‐3832
Mr. Gus Hapas
(704) 382‐1508
Mr. Chuck Johnson, Business Manager
(336) 686‐5102
Enerdyne Power Systems, Inc.
10801 Monroe Road
Suite F
Matthews, NC 28105
Enerdyne Power Systems provides project development services,
including project facilitation, installation, and operation;
assessment of project economics; and help with LFG end‐use.
Enerdyne has assisted with 10 LFGE projects.
Mr. Bill Brinker, President
(704) 844‐8990
Mr. William Brinker, Operations Manager
(704) 844‐8990
Heath and Associates, Inc.
108 West Warren Street
300
Shelby, NC 28150
Founded in 1959, Heath and Associates, Inc. is an engineering and
management consulting firm with their services directed at natural
gas transmission, distribution systems, and LFG pipelines. Heath
and Associates serves public and private natural gas systems and
LFG systems in the Southeastern United States. Their services
include detailed project design for gas systems, permitting related
to pipeline projects, feasibility studies, rate design, contract
negotiations with industrial customers, regulatory compliance
consulting such as Operations and Maintenance Plans, Operator
Qualification Plans, Integrity Managements Plans, and general
operations consulting. Heath and Associates also assists landfill gas
owners with selling carbon offset credits.
Mr. E. Scott Heath P.E., President
(704) 487‐8516
Mr. Kelly P. Kinnett P.E., Vice President
(704) 487‐8516
Mr. Robert S. Miller, Engineering Technician
(704) 487‐8516
Ingersoll‐Rand Company Mr. Chris Tomondi, Applications Engineer
(602) 331‐0031

800‐D Beaty Street
Davidson, NC 28036
IR Energy Systems is a growth business within Ingersoll‐Rand's
Industrial Productivity Sector focused on the commercialization of
distributed generation solutions based on microturbine technology.
IR provides microturbines, cogeneration packages, and related
equipment to companies seeking to develop landfill gas energy
projects. IR can also provide financing, monitoring, service
contracts, and installation services to LFG developers. IR offers
microturbines in the 70kW and 250kW sizes.
Ms. Holly Emerson, Mgr, Market Development ‐
Eastern US
(704) 896‐4051
Mr. Jay Johnson, Business Development Manager
(704) 896‐4013
Mr. Patrick Rienks, Market Development Manager
(704) 896‐4358
Mr. Craig Wilkens, Sales Manager
(704) 896‐4249
Mr. George Wiltsee, Mgr, Market Development ‐
Western US
(661) 878‐3654
Ms. Diane Wood, Senior Applications Engineer, E.
Region
(954) 929‐9579
Kipling Godwin & Associates, Inc.
P.O. Box 1844
Whiteville, NC 28472
Kipling Godwin & Associates, Inc. is a full‐service, professional
consulting firm offering a variety of products and services including
project development and management project services for the
Columbus County LFG Utilization Project through the
CommunityTIES (Trash Into Energy Savings) Project at Appalachian
State University Energy Center. Kipling Godwin & Associates, Inc. is
also available to consult with other landfill owners, operators, and
developers regarding their LFG utilization, project development,
contract negotiations, financing, design, and operation.
Mr. Kipling Godwin, President & CEO
(910) 840‐6743
McGee Environmental, Inc.
128 Virginia Avenue
Asheville, NC 28806
McGee Environmental, Inc. provides the following services to the
LFG industry: operates, monitors, and maintains LFG systems;
designs and installs LFG collection systems and LFG energy systems;
and performs LFG sampling and analysis.
Mr. Eric S. McGee, President
(828) 278‐0122

Mountain Environmental Group
1560 Pisgah Drive
Canton, NC 28716
Mountain Environmental Group performs feasibility studies and
Tier II testing to assist clients in project development and establish
status under NSPS. Mountain Environmental can construct,
operate, and offer turn key LFG systems. Mountain Environmental
will assist clients in monetizing their carbon credits. For small LFG
projects they may integrate the use of solar power to supply energy
needs of project and offer the customer a complete green energy
project.
Ms. Denese Ballew, Project Manager
(800) 261‐0031 x108
Natural Power, Inc.
2820 Rowland Road
Raleigh, NC 27615
Natural Power, an LFG recovery company, has provided project
design and facilitation services for four LFGE projects.
Ms. Cynthia R. McCoy, President
(919) 876‐6722
Mr. Bill I. Rowland, President
(919) 876‐6722
Nixon Energy Solutions
14300 South Lakes Drive
Charlotte, NC 28273
Nixon Energy Solutions is the exclusive distributor for GE Jenbacher
power generation equipment and services in the Southeastern and
Mid‐Atlantic U.S. From totally turnkey to selectively customized,
Nixon Energy Solutions specializes in making the most of every LFG
energy opportunity. Unsurpassed resources, experience, and
integrity have helped Nixon set the gold standard in power
generation equipment and service for more than 50 years.
Mr. Marty Siebert, Sales Director
(901) 751‐3634
Oak Capital Group, LLC
20723 Torrence Chapel Road
202
Cornelius, NC 28031
Oak Capital Group is a boutique merchant banking and financial
advisory firm that serves emerging and underperforming lower
middle market companies. Their merchant bank services focus on
firms with annual revenues of $3 million to $30 million serving the
consumer product, business services, energy, manufacturing,
Mr. Richard Walker, Managing Partner
(704) 892‐4465

distribution, project finance, and non‐profit markets.
Parker domnick hunter ‐ GES Siloxane Removal Systems
5900‐B Northwoods Business Parkway
Charlotte, NC 28269
domnick hunter, a division of Parker Hannifin, has led the industry
for more than 40 years in the technological advancement of
filtration, separation, and purification of air and gas, and offers a
guaranteed and cost effective siloxane removal system.
Mr. Vince Higgins, Project Engineering Manager
(704) 607‐9346
Process Systems Consulting
1117 Mineral Springs Road
Charlotte, NC 28262‐4911
Process Systems Consulting specializes in alternative use of landfill
gas (CO2 recovery and use, methanol production, and integrated
plants).
Mr. Steven J. Cooke FAIC, President
(704) 598‐4819
Richardson Smith Gardner & Associates, Inc. (RSG)
14 North Boylan Avenue
Raleigh, NC 27603
RSG provides engineering and design services to landfills and assists
with solid waste and air permitting issues. They have implemented
gas collection and control system (GCCS) design plans and
conducted NSPS Tier 1 and 2. As an approved third party verifier
with the Chicago Climate Exchange (CCX), RSG provides landfill
methane offset verification for LFGE projects and voluntary
collection/control systems. They also perform feasibility studies to
determine the overall value of LFGE projects and provide assistance
to develop these projects.
Mr. Matthew S. Lamb, Project Manager
(919) 828‐0577 x121
Mr. Stacey A. Smith P.E., President, Senior
Engineer
(919) 828‐0577 x127
Rollcast Energy, Inc.
301 South Tryon Street
Suite 1590
Charlotte, NC 28202
Rollcast Energy develops, acquires, and operates independent
renewable power projects. Their primary focus is the greenfield
development of biomass‐fired projects, including LFG.
Mr. Penn Cox, Managing Director
(704) 625‐3475
Siemens Mr. Scott Keeley, Project Developer
(704) 968‐5235

3203 Planters Ridge Road
1000
Charlotte, NC 28270
Siemens is a large diversified energy company. Siemens
manufactures many components used in the landfill gas industry
from CT's to electrical switchgear. Siemens also provides project
development services including project financing.
Stewardship Associates
175 Westside Drive
Vilas, NC 28692
Stewardship Associates is a consulting firm which specializes in
helping to create LFG energy projects for community and economic
development. They typically engage the community in project
planning and can also deliver project management, LFG
development, grant implementation, and create funding strategies
for project development.
Mr. Stan W. Steury
(828) 297‐4774
Waste Industries USA, Inc.
33011 Benson Drive
Suite 601
Raleigh, NC 27609
A direct‐use landfill gas project is in development at Sampson
County Disposal.
Mr. Jerry Johnson, Vice President, Landfill Division
(919) 325‐3000
References
U.S. EPA Climate Leaders Program, “Climate Leaders Greenhouse Gas Inventory Protocol Offset Project
Methodology for Project Type: Landfill Methane Collection and Combustion.” April 2008, Version 1.2
Black & Veatch. California RETI Phase 1A Report, Chapter 5.0 Technology Assumptions. May 2008
EPA’s Landfill Methane Outreach Program. http://www.epa.gov/lmop
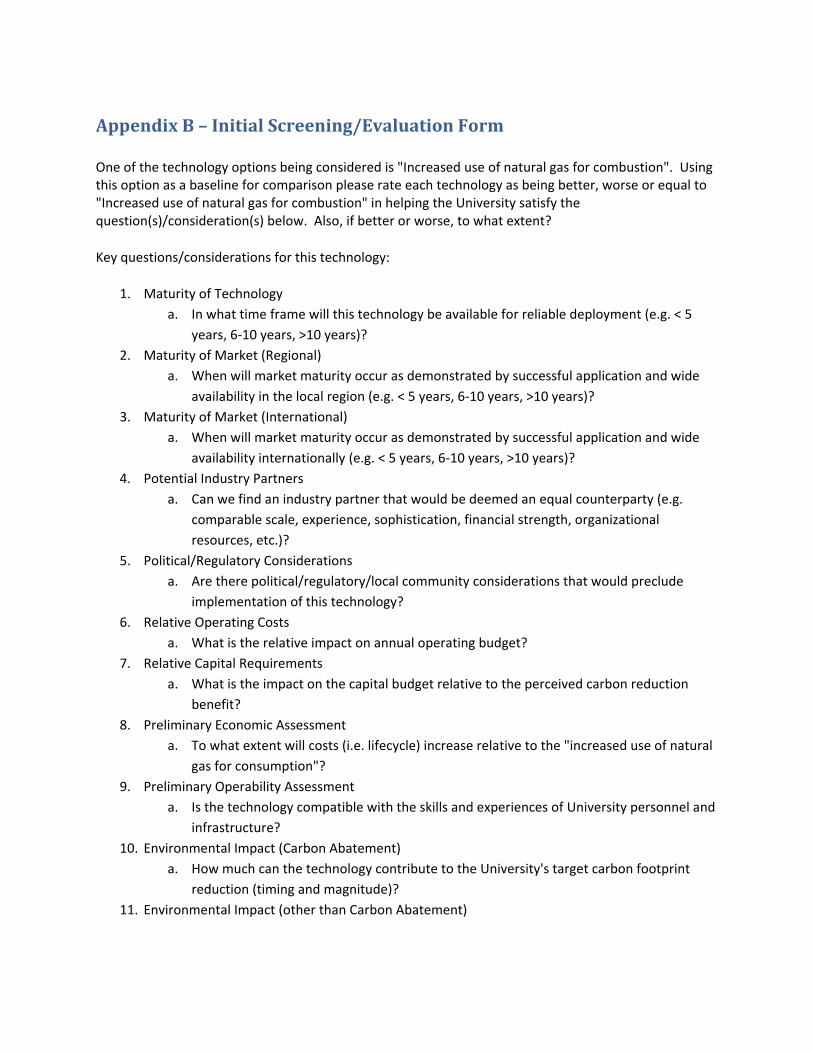
Appendix B – Initial Screening/Evaluation Form
One of the technology options being considered is "Increased use of natural gas for combustion". Using this option as a baseline for comparison please rate each technology as being better, worse or equal to "Increased use of natural gas for combustion" in helping the University satisfy the question(s)/consideration(s) below. Also, if better or worse, to what extent?
Key questions/considerations for this technology:
1. Maturity of Technology
a. In what time frame will this technology be available for reliable deployment (e.g. < 5
years, 6‐10 years, >10 years)?
2. Maturity of Market (Regional)
a. When will market maturity occur as demonstrated by successful application and wide
availability in the local region (e.g. < 5 years, 6‐10 years, >10 years)?
3. Maturity of Market (International)
a. When will market maturity occur as demonstrated by successful application and wide
availability internationally (e.g. < 5 years, 6‐10 years, >10 years)?
4. Potential Industry Partners
a. Can we find an industry partner that would be deemed an equal counterparty (e.g.
comparable scale, experience, sophistication, financial strength, organizational
resources, etc.)?
5. Political/Regulatory Considerations
a. Are there political/regulatory/local community considerations that would preclude
implementation of this technology?
6. Relative Operating Costs
a. What is the relative impact on annual operating budget?
7. Relative Capital Requirements
a. What is the impact on the capital budget relative to the perceived carbon reduction
benefit?
8. Preliminary Economic Assessment
a. To what extent will costs (i.e. lifecycle) increase relative to the "increased use of natural
gas for consumption"?
9. Preliminary Operability Assessment
a. Is the technology compatible with the skills and experiences of University personnel and
infrastructure?
10. Environmental Impact (Carbon Abatement)
a. How much can the technology contribute to the University's target carbon footprint
reduction (timing and magnitude)?
11. Environmental Impact (other than Carbon Abatement)

a. Not considering carbon abatement potential, what is the potential environmental
impact (e.g. land, water, etc.) of this technology?
12. Cost of Early Action
a. What is the impact on future flexibility (e.g. ability to react to improvements in
technology/market changes/regulatory changes)?
13. Reliable Fuel Supply
a. What is the potential impact of the fuel supply on the reliability of campus utility
operations?
14. Risk
a. Does this technology present a risk (e.g. reliability, safety, etc.) that is unacceptable to
the University?
15. In your opinion, which timeframe is the most appropriate for UNC to consider implementing
each technology? Also, which technology options should be considered for the compost pile?
16. In your opinion, which are the top 3 technology options that should be considered by
timeframe?