Embed Size (px)
Citation preview
2016
U.S. Energy Information Administration | Natural Gas Annual 185
Appendix A Summary of Data Collection and Report Methodology
The 2016 data for the Natural Gas Annual are taken primarily from Form EIA‐176, “Annual Report of Natural and Supplemental Gas Supply and Disposition.” This survey and all other sources of data for this report are discussed separately in the following sections.
Form EIA‐176
Survey Design
The original version of Form EIA‐176 was approved in 1980 with a mandatory response requirement. Prior to 1980, published data were based on voluntary responses to Bureau of Mines, U.S. Department of the Interior predecessor Forms BOM‐6‐1340‐A and BOM‐6‐1341‐A of the same title.
The Form EIA‐176 is a five‐page form consisting of seven parts. Part 1 of the form contains identifying information including the company identification number, the company name and address, the state for which the report is filed, and address correction information. Part 2 contains information on reporting requirements, while Part 3 asks for the type of operations the company conducts. The body of the form (Parts 4‐7) is a multi‐line schedule for reporting all supplies of natural gas and supplemental gaseous fuels and their disposition within the state indicated. Respondents filed completed forms with the EIA in Washington, D.C. Data for the year 2016 were due March 1, 2017.
A copy of the Form EIA‐176 and instructions is available at:
http://www.eia.gov/survey/#eia‐176
Data reported on this form are not considered proprietary.
In January 2017, forms for report year 2016 were mailed to all identified interstate natural gas pipeline companies; intrastate natural gas pipeline companies; investor and municipally owned natural gas distributors; underground natural gas storage operators; synthetic natural gas plant operators; field, well, or processing plant operators that delivered natural gas directly to consumers (including their own industrial facilities) other than for lease or plant use or processing; field, well, or processing‐plant operators that transported gas to, across, or from a state border through field or gathering facilities; and liquefied natural gas (LNG) storage operators. Detailed instructions for completing the form were included in each survey package.
Completed forms were returned to EIA, where each was checked for errors, corrected as necessary, and processed into computer‐generated state and national data summaries.
Response Statistics
Each company and its parent company or subsidiaries were required to file for each state in which their operations met the EIA‐176 survey criteria. The original mailing totaled 2,034 questionnaire packages. To the original mailing list, 18 names were added and 14 were deleted as a result of the survey processing. Additions were identified from a special frames update process and by way of comparisons to additional natural gas industry survey mailing lists. Deletions resulted from post office returns and other research that identified companies that were out of
2016
186 U.S. Energy Information Administration | Natural Gas Annual
business, sold, or out of the scope of the survey. After all updates, the 2016 survey universe consisted of 2,038 active respondents.
Following the original mailing, a second request mailing, and nonrespondent follow‐up, there were 27 nonrespondents.
Summary of Form EIA‐176 Data Reporting Requirements
Computer edit programs verify the report year, state code, and arithmetic totals. Further tests were made to ensure that all necessary data elements were present and that the data were reasonable and internally consistent. The computerized edit system produced error listings with messages for each failed edit test. To resolve problems, respondents were contacted and required to file amended forms with corrected data where necessary.
Comparison of the Form EIA‐176 with Other Data Sources
Comparison of the EIA‐176 data with data from similar series is another method of ensuring the validity of the data published in this report. When these comparisons on a company‐by‐company basis showed significant differences, respondents were required to reconcile the data.
Data on imports and exports of natural gas, as collected by the EIA‐176 survey, were checked by comparing individual responses with quarterly data reports, “Natural Gas Imports and Exports,” filed with the Office of Fossil Energy, U.S. Department of Energy. These quarterly reports are required as a condition of import/export authorizations. Where discrepancies were noted, respondents were required to file corrected reports.
Similarly, data on the underground storage of natural gas were compared with submissions of Form EIA‐191, “Monthly Underground Gas Storage Report." If significant differences were noted, companies were contacted to reconcile the discrepancies.
Data on deliveries to residential, commercial, and industrial consumers were compared with data submitted on Form EIA‐857, “Monthly Report of Natural Gas Purchases and Deliveries to Consumers.” Where discrepancies were noted, respondents were required to file corrected reports, sometimes for both surveys. Numerous contacts were made to clarify any misunderstandings concerning the correct filing of data. Typical errors included electric power volumes combined with industrial volumes, sales for resale volumes reported as industrial consumption, and misinterpretation of general instructions.
Pipeline flows were also compared to pipeline capacity information filed at the Federal Energy Regulatory Commission. Flow volumes in excess of pipeline capacity required research and, in some cases, respondents were required to file corrected reports.
Cautionary Note: Number of Residential and Commercial Consumers
There may be some double counting in the number of residential and commercial consumers reported for the years presented in this report, 2012 through 2016.
EIA collects data on the number of residential and commercial consumers through a survey of companies that deliver gas to consumers (Form EIA‐176). The survey asks companies for the number of customers served as sales customers as well as customers to whom they deliver gas purchased from others. Traditionally, residential and commercial customers obtained the gas and all services associated with delivering it from their local distribution company (LDC). The LDC records these customers as sales customers. Customer choice programs allow consumers to select the provider from whom they purchase gas. When customers elect to purchase gas from a provider other than the LDC, the LDC continues to deliver the gas to the household even though it no longer sells the gas. When customers switch to another provider, they become transportation service customers for the LDC.
2016
U.S. Energy Information Administration | Natural Gas Annual 187
A residential customer who enters a customer choice program during a year may be classified both as a traditional sales customer and, after entering the customer choice program, as a transportation service customer. In addition, some residential and commercial consumers may switch from transportation to sales service, for instance, when a choice pilot program ends. The potential double reporting affects the number of consumers shown in the Natural Gas Annual.
Tables 20‐22 assist readers in evaluating the extent and possible effect of double reporting. Tables 20‐22 list the number of sales and transportation customers, for residential, commercial, and industrial consumers, respectively, reported on Form EIA‐176 for 2015 and 2016. Appendix A provides a link to the survey Form EIA‐176, “Annual Report of Natural and Supplemental Gas Supply and Disposition,” on the EIA web site. Numbers of residential customers are reported on this form for both sales (in Part 6, lines 10.1) and transportation (in Part 6, line 11.1). Numbers of commercial customers are reported on this form for both sales (in Part 6, line 10.2) and transportation (in Part 6, line 11.2). Numbers of industrial customers are reported on this form for both sales (in Part 6, line 10.3) and transportation (in Part 6, line 11.3).
Customer choice programs, also known as retail unbundling programs, were implemented starting in the late 1990s. A description of these programs for states offering customer choice is on the EIA web site at:
http://www.eia.gov/oil_gas/natural_gas/restructure/restructure.html
Production Data Sources
Forms EIA‐627 and EIA‐895
Beginning with 1980 data, natural gas production data previously obtained on an informal basis from appropriate state agencies were collected on Form EIA‐627. This form was designed by EIA to collect annual natural gas production data from the appropriate state agencies under a standard data reporting system within the limits imposed by the diversity of data collection systems of the various producing states.
In 1996, Form EIA‐627 was redesigned and designated as the voluntary Form EIA‐895, “Monthly and Annual Report of Natural and Supplemental Gas Supply and Disposition.” Form EIA‐895 included both a Monthly and an Annual Schedule for quantity and value of natural gas production. The Monthly Schedule was discontinued in 2008. The Annual Schedule was requested to be filed each year 90 days after the end of the report year, through 2010.
Starting in 2011, production data for all producing states were obtained directly from state agencies, state‐sponsored public record databases, or commercial data vendors such as DrillingInfo (DI), PointLogic Energy, or Ventyx. Production data for the Federal Gulf of Mexico region are provided by the U.S. Bureau of Safety and Environmental Enforcement (BSEE), formerly the Minerals Management Service (MMS). Federal Offshore Pacific production, currently allocated to California, is also collected from BSEE.
Gross Withdrawals from Oil Wells, Gas Wells, Coalbeds, and Shale Formations
Prior to 2012, gross withdrawals from gas wells and gross withdrawals from oil wells were published according to state agency gas well and oil well definitions. In 2012, gas wells and oil wells were defined by EIA using gas‐to‐oil ratios (GOR) of monthly well production. Before calculation, gas production volumes are standardized to the federal pressure base, 14.73 psia. Wells with a GOR of 6000cf/bbl or less are defined as oil wells. Wells with a GOR greater than 6000cf/bbl are defined as gas wells. EIA used the DI database to calculate gas‐to‐oil ratios, determined the percentage of production from each well type, and then applied these percentages to the total gross withdrawals for each state. The only exception to EIA’s GOR methodology is Alaska. For Alaska, EIA continues to use oil and gas well definitions as determined by the Alaska Oil and Gas Conservation Commission (AOGCC).
2016
188 U.S. Energy Information Administration | Natural Gas Annual
The recovery of natural gas from shale formations and coalbeds contributes significantly to total gas production in many states. In addition to gas production from both oil and gas wells, the NGA also provides shale gas and coalbed methane production data (see Tables 1, 3, and applicable state summary tables). Shale gas and coalbed methane production volumes are primarily sourced from PointLogic Energy. When necessary, EIA supplements PointLogic Energy’s production volumes with data from state agencies or internal data from EIA’s Office of Energy Analysis. Producing reservoirs may not be consistently classified in some areas; different interpretations of how to classify shale and non‐shale formations are possible.
Non‐Marketed Gas Disposition
Non‐marketed gas disposition includes nonhydrocarbon gases removed, gas vented and flared, and gas reinjected into reservoirs for repressuring, cycling, or other purposes.
Prior to 2010, non‐marketed gas disposition were sourced from the now‐discontinued Form EIA‐895. Some, but not all, states provided these data. After the discontinuation of Form EIA‐895, when these data were not available for a state that historically provided these data to EIA, volumes were either estimated, gathered via good‐faith outreach attempts with state agencies, or gathered from publicly available data on state agency websites. State agencies are contacted by telephone or email in order to gain insight on information obtained from their websites, and to correct potential errors. When necessary, estimates of these data are based on the average ratio of gas volumes in the missing category to total gross withdrawals in states with values in that category. This average ratio is applied to the volume of total gross withdrawals obtained to calculate the volume for the missing items. When data availability prevents EIA from determining reasonable estimates for these categories of non‐marketed gas disposition, the volume will receive an ‘NA’ (not available) designation.
Marketed Gas Production
Marketed production of natural gas is calculated by EIA as the remaining portion of gross withdrawals after non‐marketed gas disposition is removed. Fuel used in lease or plant operations are not removed from gross withdrawals and are therefore considered components of marketed production.
Marketed gas production is listed in Tables 3 and 6, as well as each individual state page.
Production Data Quality Assurance
Production data are manually checked for reasonableness and mathematical accuracy. Volumes are converted, as necessary, to a standard 14.73 pounds per square inch absolute pressure base. Data are compared to the previous year’s data and other commercial sources for reasonableness.
EIA’s gross withdrawals may differ from production volumes sourced from state websites. The largest discrepancies exist due to accounting differences of nonhydrocarbon gases. Some states receive production reports from operators that include volumes of nonhydrocarbon gases that were injected into the producing reservoir from an external source (e.g., CO2 pipeline or N2 from nitrogen rejection units). EIA does not consider these volumes to be gross withdrawals and makes extensive efforts to identify and remove these volumes from gross withdrawals. Other discrepancies typically are a result of amended reports being received by state agencies that include data that were not available at the time of NGA publication.
Additionally, annual production data are compared to other data sources to ensure accuracy and reasonableness. These sources include monthly production data from Form EIA‐914, annual production data from Form EIA‐23L, as well as third party data providers such as DrillingInfo, PointLogic Energy, IHS Markit, Ventyx, and BENTEK Energy, LLC.
2016
U.S. Energy Information Administration | Natural Gas Annual 189
Form EIA‐910
Survey Design
The Form EIA‐910, “Monthly Natural Gas Marketer Survey,” collects information on natural gas sales from marketers in selected states that have active customer choice programs. Up to 2010, these states included Florida, Georgia, Illinois, Maryland, Michigan, New Jersey, New York, Ohio, Pennsylvania, West Virginia, Virginia, and the District of Columbia. Beginning in 2011, the EIA‐910 is collected only in Georgia, New York and Ohio. These states were selected based on the percentage of natural gas sold by marketers in the residential and commercial end‐use sectors. The survey collects monthly price and volume data on natural gas sold by all marketers in the selected states. A natural gas marketer is a company that competes with other companies to sell natural gas, but relies on regulated local distribution companies to deliver the gas. The data collected on the Form EIA‐910 are integrated with residential and commercial price data from the Form EIA‐176 and Form EIA‐857 for the states and sectors where the EIA‐910 data are published.
Response Statistics
Response to the Form EIA‐910 is mandatory and data are considered proprietary. Approximately 100 natural gas marketers reported to the survey in 2016. Final monthly survey response rates are approximately 100 percent. Responses are filed with EIA in Washington, DC, on or before the 30th day after the end of the report month.
Routine Form EIA‐910 Edit Checks
Each filing of the Form EIA‐910 is manually checked for reasonableness and mathematical accuracy. State‐level price and volume data are compared to data collected on the Form EIA‐857 on a monthly basis and the Form EIA‐176 on an annual basis. Residential and commercial volume data collected from marketers on the Form EIA‐910 are expected to match residential and commercial transportation volume data collected monthly on the Form EIA‐857 and annually on the Form EIA‐176. When discrepancies are noted, respondents on one or all of the surveys are required to submit corrected reports.
Other Data Sources
Natural Gas Processed and Natural Gas Plant Liquid Production, Gas Equivalent Volume
The natural gas plant liquids production, gas equivalent volume, is the reduction in volume of natural gas available for disposition resulting from the removal of natural gas plant liquids constituents such as ethane, propane, butane, isobutane and pentanes plus. It represents that portion of the “raw” gas stream transferred from the natural gas supply chain to the petroleum and natural gas liquids supply chain. The gas equivalent volume of natural gas plant liquid production does not include the reduction in volume resulting from the removal of nonhydrocarbon constituents, or gas used as fuel, vented, flared, or otherwise disposed of within natural gas processing plants. The extraction of natural gas plant liquids also results in a reduction in the total heat (Btu) content of the natural gas stream proportionate to the heat content of the liquids extracted.
The Form EIA‐64A, “Annual Report of the Origin of Natural Gas Liquids Production,” collects data on the volume of natural gas received for processing, the total quantity of natural gas plant liquids produced, and the resulting shrinkage (defined as “natural gas plant liquids production, gas equivalent volume” in this report) from all natural gas processing‐ and cycling‐plant operators. The quantity of natural gas received and liquids produced are reported by point of origin of the natural gas. Shrinkage volumes are calculated and reported by plant operators based upon the chemical composition of the liquids extracted using standard conversion factors specified in the form instructions. A description of the Form EIA‐64A survey is presented in the EIA publication, U.S. Crude Oil,
2016
190 U.S. Energy Information Administration | Natural Gas Annual
Natural Gas, and Natural Gas Liquids Reserves, Annual Report. Beginning in 2012, NGPL production, gaseous equivalent, was broken down further geographically to show both the state where the processed gas originated and the state where it was processed. Prior to 2012, NGPL production (gaseous equivalent) was shown to be produced in the state where the processing plant was located, with the exception of the Gulf of Mexico, where processing was shown to occur in bordering states.
The heat (Btu) content of natural gas plant liquids production is not reported on the Form EIA‐64A. Therefore, in order to estimate the heat content loss, data reported on the Form EIA‐816, “Monthly Natural Gas Liquids Report,” were used to determine the individual products contained in the total liquids reported on Form EIA‐64A. A description of the Form EIA‐816 survey is presented in the EIA publication, Petroleum Supply Annual, Volume II.
The Form EIA‐816 captures information on the quantity of individual natural gas plant liquids components (i.e., ethane, propane, normal butane, isobutane, and pentanes plus) produced at gas processing plants as determined by chemical analysis. The volumetric ratios of the individual components to the total liquids, as calculated from the 12 monthly Form EIA‐816 reports for each state, were applied to the annual total liquids production, as reported on the Form EIA‐64A, to estimate the quantities of individual components removed at gas‐processing plants.
The heat (Btu) content of natural gas plant liquids production was estimated by applying conversion factors to the estimated quantities of products extracted in each state. These conversion factors, in million Btu per barrel of liquid produced, were ethane, 3.082; propane, 3.836; normal butane, 4.326; isobutane, 3.974; and pentanes plus, 4.620.
Imports and Exports
Volumes and prices of natural gas imports and exports were reported to the Office of Fossil Energy, U.S. Department of Energy, Natural Gas Imports and Exports. These data are nonproprietary and are filed annually by each individual or organization having authorization to import and export natural gas.
Lease and Plant Fuel
Lease and plant fuel represent those quantities of natural gas used in well, field, and/or lease operations (such as gas used in production operations, heaters, dehydrators, and field compressors) and as fuel in natural gas processing plants.
Lease fuel data were collected for report year 2016 via state agencies and other sources, described in the “Production Data Sources” section. In the absence of reporting quantities through those sources, an average of the state’s historical ratio of lease fuel to gross withdrawals was used to estimate lease fuel quantities.
Natural gas plant fuel data are obtained from Form EIA‐64A.
Electric Power Generation Data
The data reported for the electric power sector in the Natural Gas Annual 2016 are derived entirely from data submitted on electricity data collection forms. These include Form EIA‐860, “Annual Electric Generator Report,” Form EIA‐906, “Power Plant Report,” Form EIA‐920, “Combined Heat and Power Plant Report,” FERC Form 423, “Monthly Report of Cost and Quality of Fuels for Electric Plants,” and Form EIA‐423, “Monthly Report of Costs and Quality of Fuels for Electric Plants Report.” From 2007 forward, all data previously derived from Form EIA‐906, Form EIA‐920, FERC Form 423, and Form EIA‐423 are now derived from Form EIA‐923, “Power Plant Operations Report.”
The electric power sector includes electricity‐only and combined heat and power plants whose primary business is to sell electricity, or electricity and heat, to the public. The change in reported volumes from “electric utilities”
2016
U.S. Energy Information Administration | Natural Gas Annual 191
to “electric power sector” affected in the Natural Gas Annual 2001 was made in order to maintain consistency among EIA publications.
Natural Gas Consumed as a Vehicle Fuel
Volumes of natural gas consumed as vehicle fuel that are published in the Natural Gas Annual 2016 for years 2011 to 2013 were reported on Form EIA‐886, “Annual Survey of Alternative Fueled Vehicles.” To estimate consumption for the year 2014, 2015, and 2016, data on the EIA‐176 were used to represent the total US vehicle fuel consumption and data on the EIA‐886 were used to determine the allocation between the states.
Coverage of Consumer Prices
Coverage for prices varies by consumer sector as discussed below. All average prices are computed by dividing the reported revenue by its associated sales volume. Prices for deliveries of natural gas to residential, commercial and industrial consumers are calculated from reports to Form EIA‐176, “Annual Report of Natural and Supplemental Gas Supply and Disposition,” for most states and sectors.
Beginning with 2002 data in the states of Georgia, Maryland, New York, Ohio, and Pennsylvania, the residential and commercial sector prices reported include data on prices of gas sold to customers in those sectors by energy marketers. These latter data are collected on Form EIA‐910, “Monthly Natural Gas Marketer Survey.” Beginning in 2005, residential prices in Florida, New Jersey, Virginia and commercial prices in Florida, Michigan, Virginia and the District of Columbia also include sales by energy marketers that are collected on the Form EIA‐910.
With the unbundling of services in the natural gas industry, pipeline and local distribution companies provide transportation service for end‐user customers to whom they do not sell the gas. In this report, those volumes are described as deliveries of gas for the account of others.
When companies that deliver gas are the sellers of that gas, they are able to report the associated revenue to EIA. Those volumes are described as onsystem sales. When the firm that physically delivers gas to the end user acts as a transportation agent, it does not know the sales price of the gas. Respondents, therefore, do not report a revenue amount associated with deliveries for the account of others in their submissions of the Form EIA‐176. Beginning in 2002 in the states of Georgia, Maryland, New York, Ohio and Pennsylvania, natural gas marketers who sell gas transported to residential and commercial customers by local distribution companies report the revenues from the sale of this gas to EIA on Form EIA‐910, “Monthly Natural Gas Marketer Survey.” Beginning in 2005, the same is true for Florida in the residential and commercial sector, Michigan in the commercial sector, New Jersey in the residential sector, Virginia in the residential and commercial sector and in the District of Columbia in the commercial sector. In these states, prices in the residential and commercial sectors are calculated by combining data from the Form EIA‐176, Form EIA‐857 and Form EIA‐910.
Citygate prices are calculated from reports to the Form EIA‐857, “Monthly Report of Natural Gas Purchases and Deliveries to Consumers.” Both the Forms EIA‐176 and EIA‐857 are completed by companies that deliver natural gas to end‐use consumers while the Form EIA‐910 is completed by marketers or companies that sell but do not deliver natural gas to end‐use consumers.
Citygate: Citygate prices represent the total cost paid by gas distribution companies for gas received at the point where the gas is physically transferred from a pipeline company or transmission system. This price is intended to reflect all charges for the acquisition, storage, and transportation of gas as well as other charges associated with the LDCs obtaining the gas for sale to consumers.
2016
192 U.S. Energy Information Administration | Natural Gas Annual
Prices for gas delivered to the citygate represent all of the volumes of gas purchased by LDCs for subsequent sale and delivery to consumers in their service area. Since these prices are reported on a monthly form, the annual average citygate price is calculated by summing the monthly revenues reported and dividing that figure by the sum of the monthly reported volumes.
Residential: Prices in this publication for the residential sector cover nearly all of the volumes of gas delivered.
Commercial and Industrial: Prices for the commercial and industrial sectors are often associated with relatively small volumes of the total gas delivered. This occurs because they are reported by those that deliver gas and not by either the gas resellers or by the consumers. The delivery agent provides transportation service only and does not know the commodity cost of the gas it transports.
Natural gas prices reported for commercial and industrial consumers represent only those purchases from local distribution companies except for the states of Georgia, New York, and Ohio, where commercial prices include data from natural gas marketers who sell gas transported to end‐use commercial customers by local distribution companies. With the above exception, natural gas prices for commercial and industrial customers exclude volumes transported, but not sold, by the local distribution company or pipeline company.
Electric Utilities: Prior to 2007, prices for natural gas were also reported to EIA on the FERC Form 423, “Monthly Report of Cost and Quality of Fuels for Electric Plants.” Electric utility prices in this report are taken from this form. The respondents are regulated electric utilities that report receipts and prices of fuels and represent most of the volumes delivered to electric utilities. These prices are also published in several other EIA reports, i.e., Electric Power Monthly, Electric Power Annual, and Cost and Quality of Fuels for Electric Plants. From 2007 forward, these electric utility data are derived from Form EIA‐923, “Power Plant Operations Report.” Prices to electric utilities cover gas purchased by regulated electric generating plants whose total steam turbine electric generating capacity and/or combined‐cycle (gas turbine with associated steam turbine) generating capacity is 50 or more megawatts. The Natural Gas Annual reports natural gas prices for electric utilities through 2001 and for the electric power sector thereafter.
Electric Power: From 2003 to 2006, prices for natural gas were supported by two separate surveys: FERC Form 423, which is completed by regulated utilities and Form EIA‐423, “Monthly Report of Cost and Quality of Fuels for Electric Plants Report,” which is completed by nonregulated power producers. The Form EIA‐423 survey began in January 2002 and collects information from the nonutility portion of the electric power sector. Data in this report for 2003 forward cover the regulated (steam‐electric and combined‐cycle units) and unregulated (regardless of unit type) generating plants whose total facility fossil‐fueled nameplate generating capacity is 50 megawatts or greater. Beginning in 2007, data previously collected on Form EIA‐423 and FERC Form 423 are now collected on Form EIA‐923, “Power Plant Operations Report.”
Vehicle Fuel: Volumes of natural gas consumed as vehicle fuel that are published in the Natural Gas Annual 2016 for years 2012 to 2016 were estimated by EIA based on Form EIA‐886, “Annual Survey of Alternative Fueled Vehicles,” and Form EIA‐176. To estimate consumption for a given year, data on the EIA‐176 were used to represent the total US vehicle fuel consumption and data on the EIA‐886 were used to determine the allocation between the states.
Natural Gas Balancing Item
The natural gas balancing item represents the difference between the sum of the components of natural gas supply and the sum of the components of natural gas disposition. It is calculated for each state as the result of a comparison between total reported supply and total reported disposition (Table 2). In the formula used, total reported supply is the sum of marketed production, net interstate movements, net movements across U.S.
2016
U.S. Energy Information Administration | Natural Gas Annual 193
borders, and supplemental gaseous fuels supplies. Total reported disposition is the sum of natural gas plant liquids production, net storage changes (net additions to storage), and consumption. When this calculation results in a negative quantity for the balancing item it represents an excess of reported supply in relation to reported disposition, and positive quantities indicate the opposite situation.
The differences between supply and demand represent quantities lost, the net result of gas company conversions of flow data metered at varying temperature and pressure conditions to a standard temperature and pressure base, metering inaccuracies, the effect of variations in company accounting and billing practices, differences between billing cycle and calendar‐period time frames, and imbalances resulting from EIA’s merger of data reporting systems, which vary in scope, format, definitions, and type of respondents. The balancing items in individual states may also reflect the underreporting on Form EIA‐176 of gas transported across state borders for the account of others by some interstate pipelines.
2016
U.S. Energy Information Administration | Natural Gas Annual 194
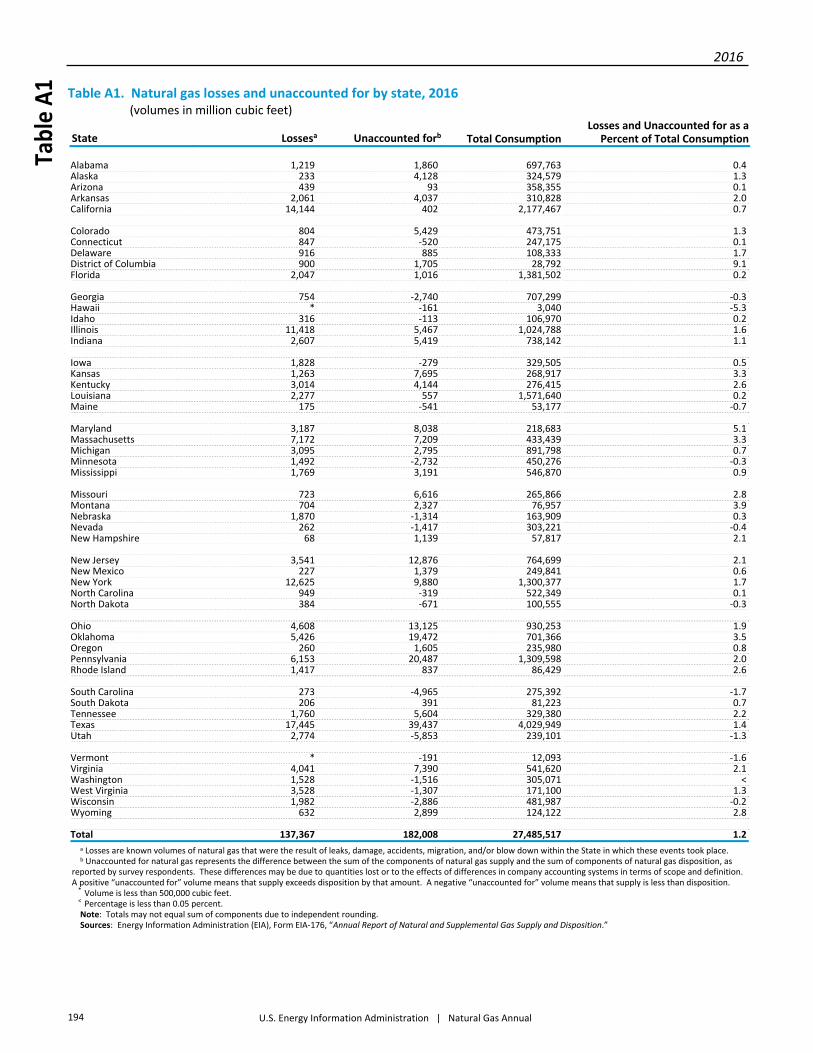
Table A1. Natural gas losses and unaccounted for by state, 2016 (volumes in million cubic feet)
Alabama 1,219 1,860 697,763 0.4Alaska 233 4,128 324,579 1.3Arizona 439 93 358,355 0.1Arkansas 2,061 4,037 310,828 2.0California 14,144 402 2,177,467 0.7 Colorado 804 5,429 473,751 1.3Connecticut 847 ‐520 247,175 0.1Delaware 916 885 108,333 1.7District of Columbia 900 1,705 28,792 9.1Florida 2,047 1,016 1,381,502 0.2 Georgia 754 ‐2,740 707,299 ‐0.3Hawaii * ‐161 3,040 ‐5.3Idaho 316 ‐113 106,970 0.2Illinois 11,418 5,467 1,024,788 1.6Indiana 2,607 5,419 738,142 1.1 Iowa 1,828 ‐279 329,505 0.5Kansas 1,263 7,695 268,917 3.3Kentucky 3,014 4,144 276,415 2.6Louisiana 2,277 557 1,571,640 0.2Maine 175 ‐541 53,177 ‐0.7 Maryland 3,187 8,038 218,683 5.1Massachusetts 7,172 7,209 433,439 3.3Michigan 3,095 2,795 891,798 0.7Minnesota 1,492 ‐2,732 450,276 ‐0.3Mississippi 1,769 3,191 546,870 0.9 Missouri 723 6,616 265,866 2.8Montana 704 2,327 76,957 3.9Nebraska 1,870 ‐1,314 163,909 0.3Nevada 262 ‐1,417 303,221 ‐0.4New Hampshire 68 1,139 57,817 2.1 New Jersey 3,541 12,876 764,699 2.1New Mexico 227 1,379 249,841 0.6New York 12,625 9,880 1,300,377 1.7North Carolina 949 ‐319 522,349 0.1North Dakota 384 ‐671 100,555 ‐0.3 Ohio 4,608 13,125 930,253 1.9Oklahoma 5,426 19,472 701,366 3.5Oregon 260 1,605 235,980 0.8Pennsylvania 6,153 20,487 1,309,598 2.0Rhode Island 1,417 837 86,429 2.6 South Carolina 273 ‐4,965 275,392 ‐1.7South Dakota 206 391 81,223 0.7Tennessee 1,760 5,604 329,380 2.2Texas 17,445 39,437 4,029,949 1.4Utah 2,774 ‐5,853 239,101 ‐1.3 Vermont * ‐191 12,093 ‐1.6Virginia 4,041 7,390 541,620 2.1Washington 1,528 ‐1,516 305,071 <West Virginia 3,528 ‐1,307 171,100 1.3Wisconsin 1,982 ‐2,886 481,987 ‐0.2Wyoming 632 2,899 124,122 2.8 Total 137,367 182,008 27,485,517 1.2
State Lossesa Unaccounted forb Total ConsumptionLosses and Unaccounted for as a
Percent of Total Consumption
a Losses are known volumes of natural gas that were the result of leaks, damage, accidents, migration, and/or blow down within the State in which these events took place. b Unaccounted for natural gas represents the difference between the sum of the components of natural gas supply and the sum of components of natural gas disposition, as reported by survey respondents. These differences may be due to quantities lost or to the effects of differences in company accounting systems in terms of scope and definition. A positive “unaccounted for” volume means that supply exceeds disposition by that amount. A negative “unaccounted for” volume means that supply is less than disposition. * Volume is less than 500,000 cubic feet. < Percentage is less than 0.05 percent. Note: Totals may not equal sum of components due to independent rounding. Sources: Energy Information Administration (EIA), Form EIA‐176, “Annual Report of Natural and Supplemental Gas Supply and Disposition.”
Table A1
2016
U.S. Energy Information Administration | Natural Gas Annual 195 194
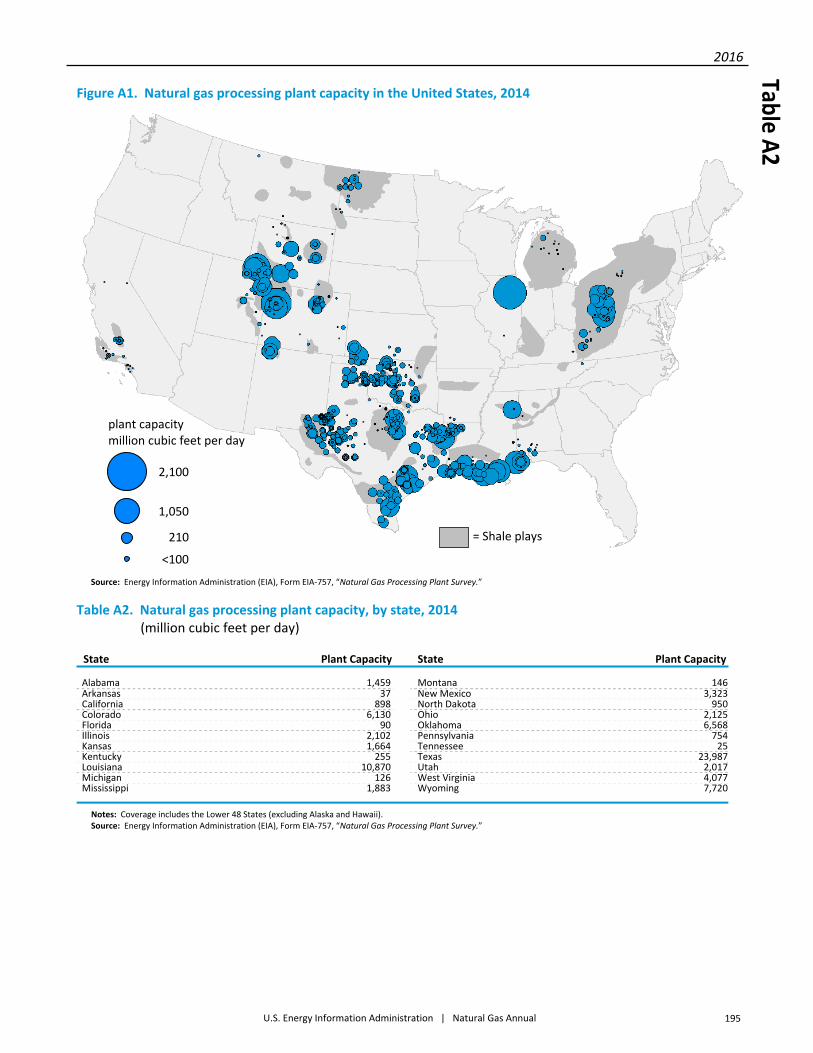
Figure A1. Natural gas processing plant capacity in the United States, 2014 2014
Table A2. Natural gas processing plant capacity, by state, 2014 (million cubic feet per day)
Alabama 1,459Arkansas 37California 898Colorado 6,130Florida 90Illinois 2,102Kansas 1,664Kentucky 255Louisiana 10,870Michigan 126Mississippi 1,883
State Plant Capacity
Notes: Coverage includes the Lower 48 States (excluding Alaska and Hawaii). Source: Energy Information Administration (EIA), Form EIA‐757, “Natural Gas Processing Plant Survey.”
State Plant Capacity
Montana 146New Mexico 3,323North Dakota 950Ohio 2,125Oklahoma 6,568Pennsylvania 754Tennessee 25Texas 23,987Utah 2,017West Virginia 4,077Wyoming 7,720
plant capacity million cubic feet per day
2,100
1,050
210
<100
= Shale plays
Source: Energy Information Administration (EIA), Form EIA‐757, “Natural Gas Processing Plant Survey.”
Table A2

This page intentionally blank.