Embed Size (px)
Citation preview
LA CONFIANCE TRANSPORTE LE MONDE
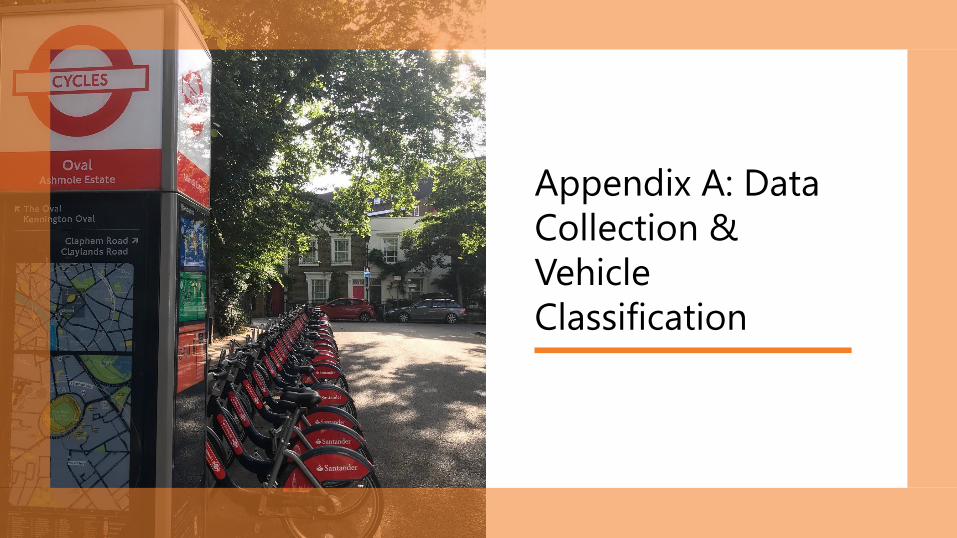
Appendix A: Data Collection & Vehicle Classification
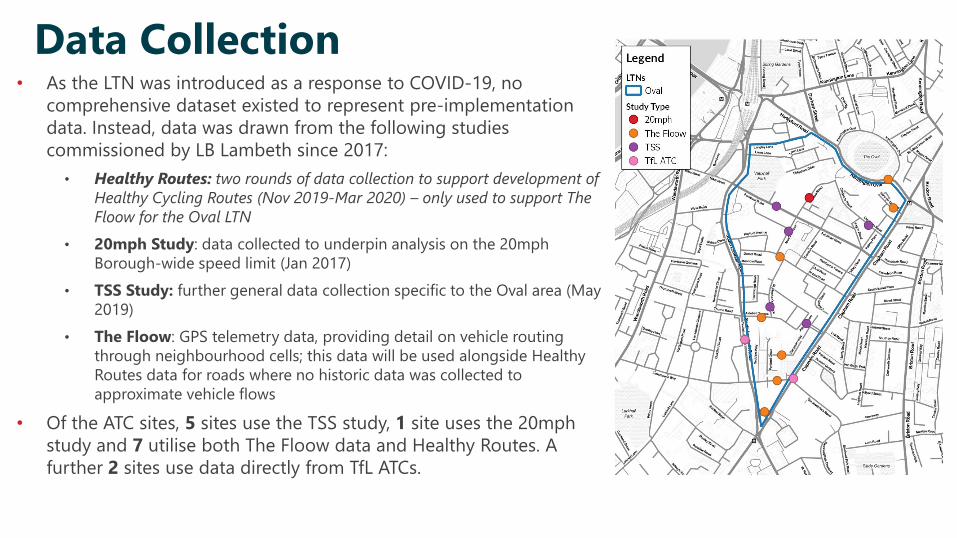
Data Collection• As the LTN was introduced as a response to COVID-19, no
comprehensive dataset existed to represent pre-implementation data. Instead, data was drawn from the following studies commissioned by LB Lambeth since 2017:
• Healthy Routes: two rounds of data collection to support development of Healthy Cycling Routes (Nov 2019-Mar 2020) – only used to support The Floow for the Oval LTN
• 20mph Study: data collected to underpin analysis on the 20mph Borough-wide speed limit (Jan 2017)
• TSS Study: further general data collection specific to the Oval area (May 2019)
• The Floow: GPS telemetry data, providing detail on vehicle routing through neighbourhood cells; this data will be used alongside Healthy Routes data for roads where no historic data was collected to approximate vehicle flows
• Of the ATC sites, 5 sites use the TSS study, 1 site uses the 20mph study and 7 utilise both The Floow data and Healthy Routes. A further 2 sites use data directly from TfL ATCs.
3
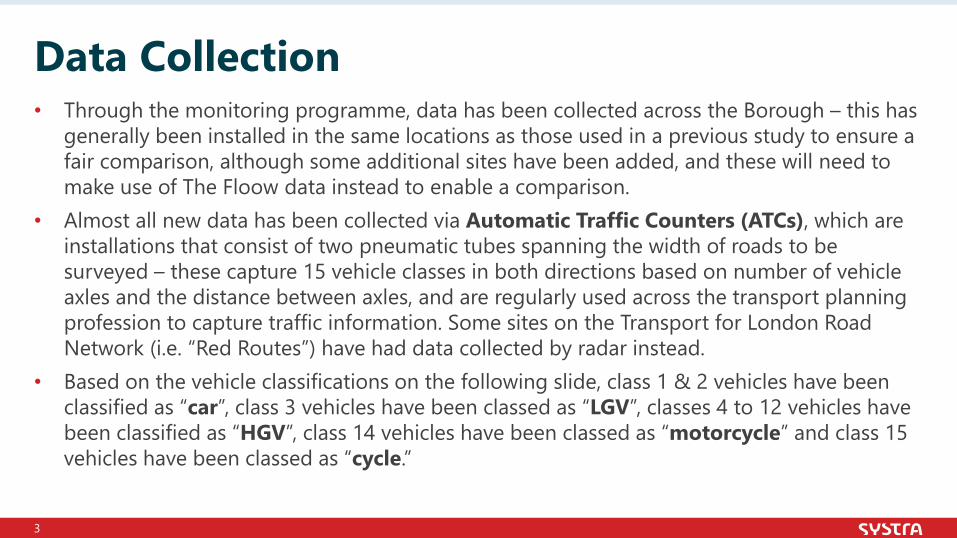
Data Collection• Through the monitoring programme, data has been collected across the Borough – this has
generally been installed in the same locations as those used in a previous study to ensure a fair comparison, although some additional sites have been added, and these will need to make use of The Floow data instead to enable a comparison.
• Almost all new data has been collected via Automatic Traffic Counters (ATCs), which are installations that consist of two pneumatic tubes spanning the width of roads to be surveyed – these capture 15 vehicle classes in both directions based on number of vehicle axles and the distance between axles, and are regularly used across the transport planning profession to capture traffic information. Some sites on the Transport for London Road Network (i.e. “Red Routes”) have had data collected by radar instead.
• Based on the vehicle classifications on the following slide, class 1 & 2 vehicles have been classified as “car”, class 3 vehicles have been classed as “LGV”, classes 4 to 12 vehicles have been classified as “HGV”, class 14 vehicles have been classed as “motorcycle” and class 15 vehicles have been classed as “cycle.”
4
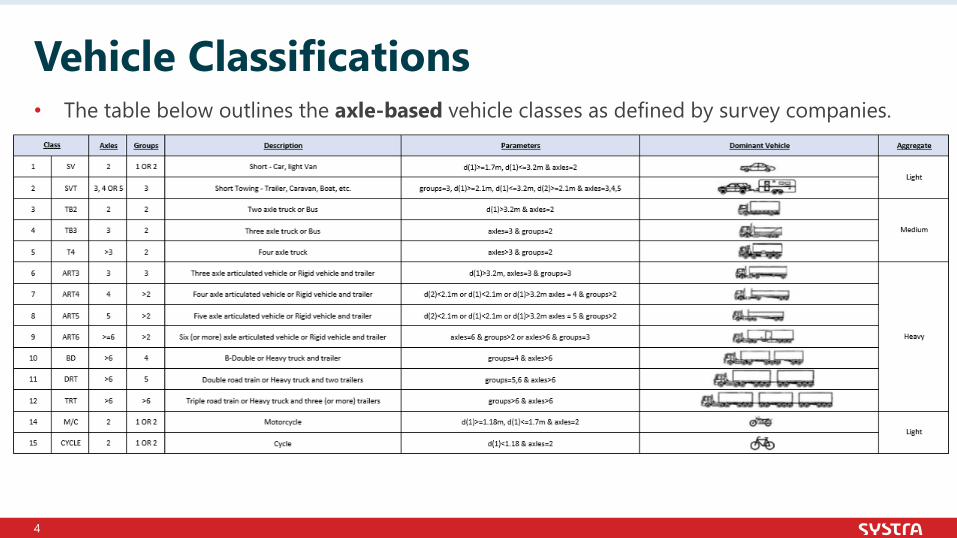
Vehicle Classifications• The table below outlines the axle-based vehicle classes as defined by survey companies.
5
Vehicle Classifications• The Automatic Traffic Counters (ATCs) used in this study are considered a reliable, tested
method of data collection, and are utilised throughout the transport industry to understand traffic volumes on roads.
• Whilst such counters are generally considered at least 95% accurate in collecting correct traffic data, there is some room for error in vehicle classification (for example tandem cycles being classed as motorbikes given the distance between axles, or scooters being classed as cycles). However, most issues occur in the sorting of different types of HGVs into the 9 relevant categories.
• More commonly, vehicles park on or across ATCs, leading to periods where no data is collected. This occurs in pre- and post-implementation data in equal measure, and where such occurrences are likely to have a material impact on analysis results, such missing data has been “patched” or “infilled” using appropriate replacements (for example, patching blank data 10-11am on a Wednesday with data from 10-11am the day before). This is a standard practice in the transport industry.
LA CONFIANCE TRANSPORTE LE MONDE
Appendix B: Baseline Calculations
7
Baseline Calculations (1) A “baselining” or “normalisation” process has been undertaken to approximate a “no-LTN”
case for all sites, providing a point of comparison against which recorded “with-LTN” data can be compared. Under normal circumstances, this baseline case would have taken flows from before the
scheme implementation and compared these (sometimes with a slight adjustment to compensate for population change/employment levels/etc.) to post-implementation flows. The nominal (# of vehicles) and percentage changes would help indicate, amongst other
factors, whether the scheme had achieved its stated goals. Given that the LTNs have been part of Lambeth’s emergency response to the COVID-19
pandemic, and that background traffic flows have been very abnormal since March 2020, the aforementioned process could not be followed in such a straightforward manner.
8
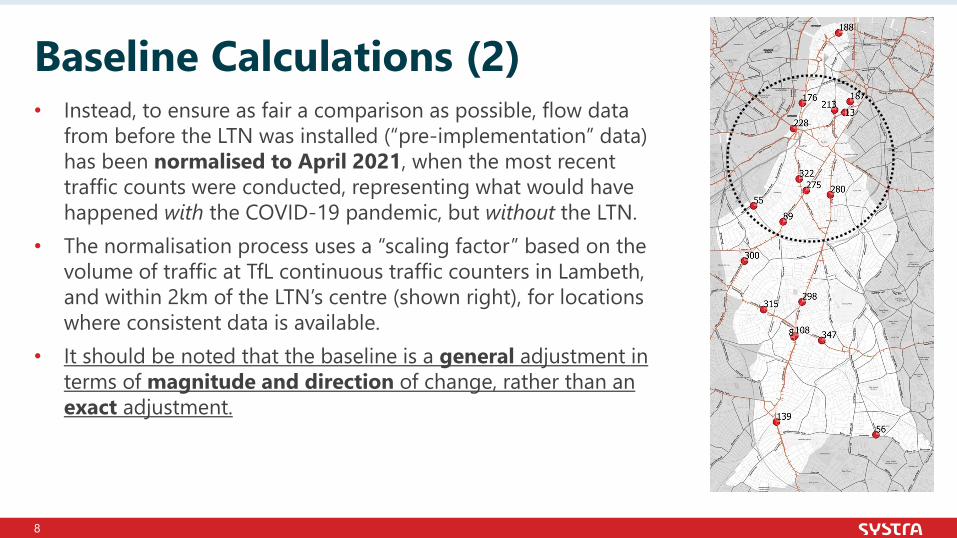
Baseline Calculations (2)• Instead, to ensure as fair a comparison as possible, flow data
from before the LTN was installed (“pre-implementation” data) has been normalised to April 2021, when the most recent traffic counts were conducted, representing what would have happened with the COVID-19 pandemic, but without the LTN.
• The normalisation process uses a “scaling factor” based on the volume of traffic at TfL continuous traffic counters in Lambeth, and within 2km of the LTN’s centre (shown right), for locations where consistent data is available.
• It should be noted that the baseline is a general adjustment in terms of magnitude and direction of change, rather than an exact adjustment.
9
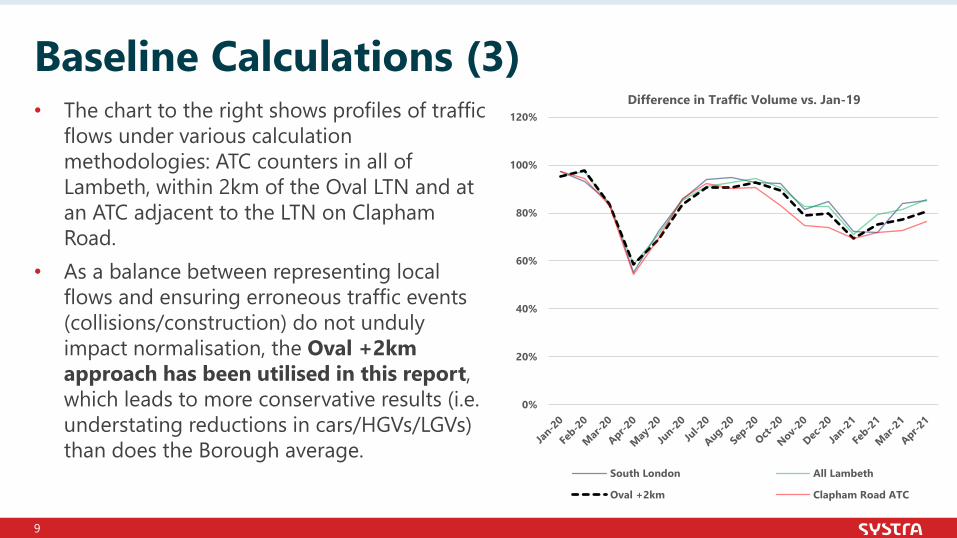
Baseline Calculations (3)• The chart to the right shows profiles of traffic
flows under various calculation methodologies: ATC counters in all of Lambeth, within 2km of the Oval LTN and at an ATC adjacent to the LTN on Clapham Road.
• As a balance between representing local flows and ensuring erroneous traffic events (collisions/construction) do not unduly impact normalisation, the Oval +2km approach has been utilised in this report, which leads to more conservative results (i.e. understating reductions in cars/HGVs/LGVs) than does the Borough average.
0%
20%
40%
60%
80%
100%
120%Difference in Traffic Volume vs. Jan-19
South London All Lambeth
Oval +2km Clapham Road ATC
10
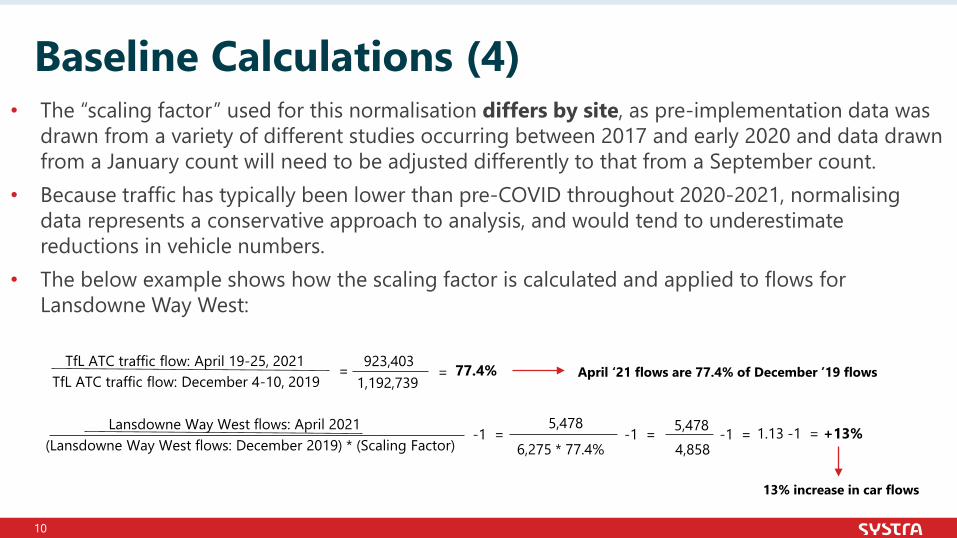
Baseline Calculations (4)• The “scaling factor” used for this normalisation differs by site, as pre-implementation data was
drawn from a variety of different studies occurring between 2017 and early 2020 and data drawn from a January count will need to be adjusted differently to that from a September count.
• Because traffic has typically been lower than pre-COVID throughout 2020-2021, normalising data represents a conservative approach to analysis, and would tend to underestimate reductions in vehicle numbers.
• The below example shows how the scaling factor is calculated and applied to flows for Lansdowne Way West:
TfL ATC traffic flow: April 19-25, 2021TfL ATC traffic flow: December 4-10, 2019 1,192,739
923,403= = 77.4%
Lansdowne Way West flows: April 2021(Lansdowne Way West flows: December 2019) * (Scaling Factor)
5,478
6,275 * 77.4%-1 = -1 = 5,478
4,858-1 = 1.13 -1 = +13%
13% increase in car flows
April ‘21 flows are 77.4% of December ’19 flows
LA CONFIANCE TRANSPORTE LE MONDE
Appendix C: Traffic Flow Results
12
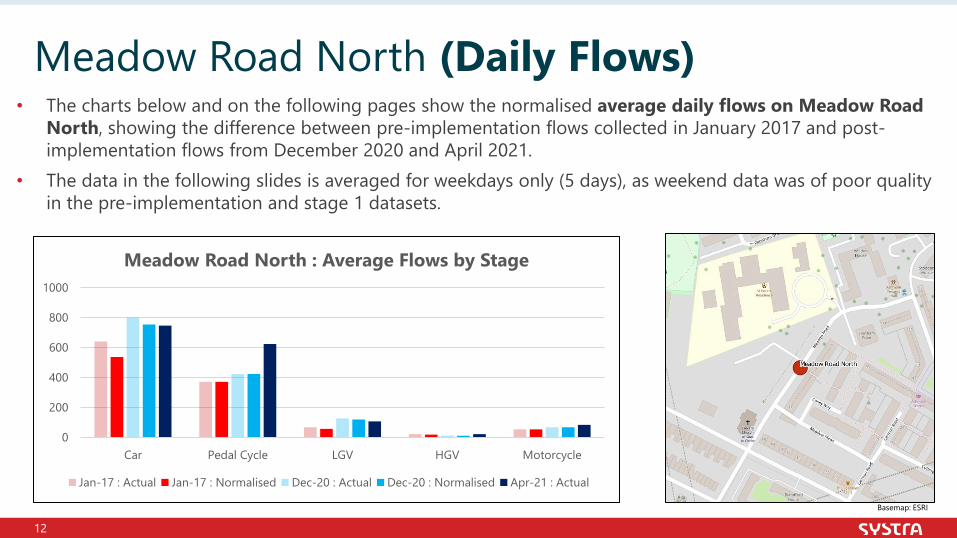
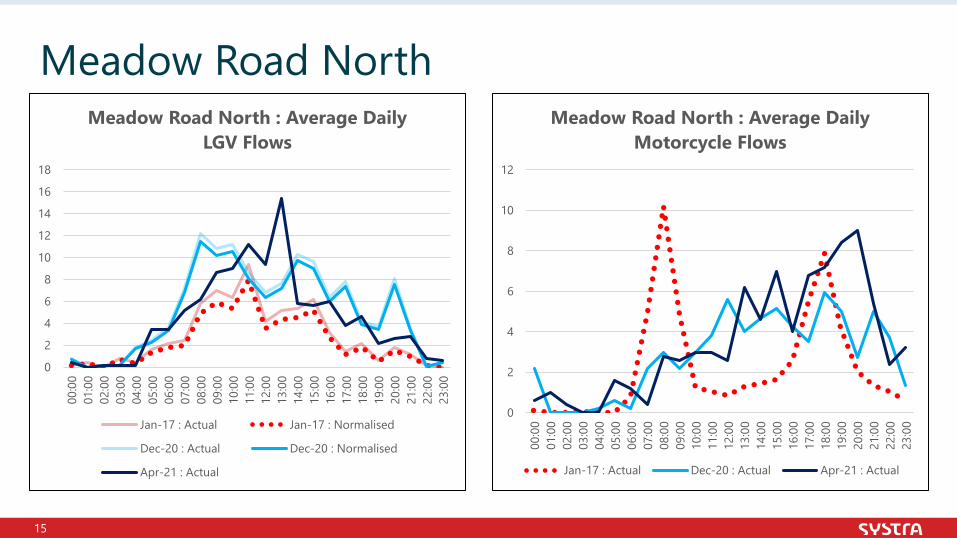
• The charts below and on the following pages show the normalised average daily flows on Meadow Road North, showing the difference between pre-implementation flows collected in January 2017 and post-implementation flows from December 2020 and April 2021.
• The data in the following slides is averaged for weekdays only (5 days), as weekend data was of poor quality in the pre-implementation and stage 1 datasets.
Meadow Road North (Daily Flows)
Basemap: ESRI
0
200
400
600
800
1000
Car Pedal Cycle LGV HGV Motorcycle
Meadow Road North : Average Flows by Stage
Jan-17 : Actual Jan-17 : Normalised Dec-20 : Actual Dec-20 : Normalised Apr-21 : Actual
13
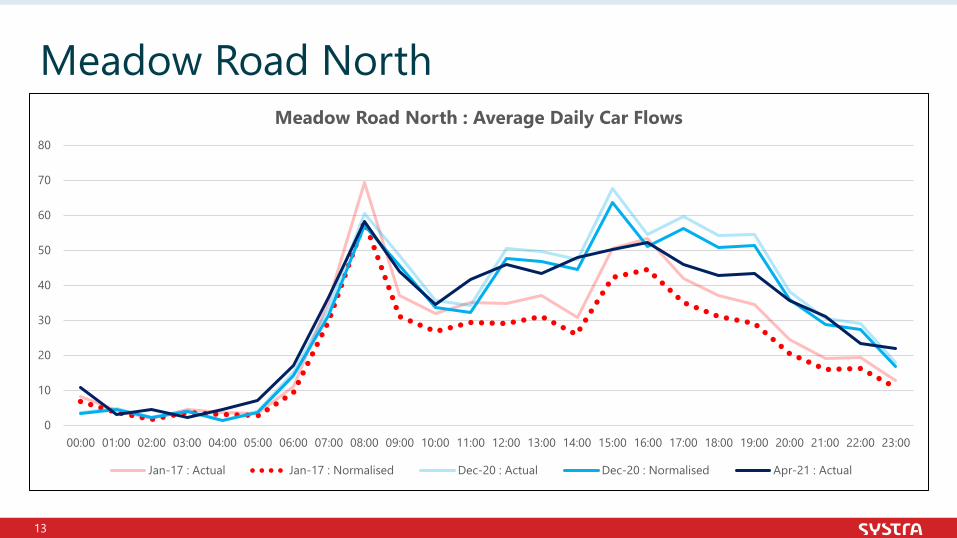
Meadow Road North
0
10
20
30
40
50
60
70
80
00:00 01:00 02:00 03:00 04:00 05:00 06:00 07:00 08:00 09:00 10:00 11:00 12:00 13:00 14:00 15:00 16:00 17:00 18:00 19:00 20:00 21:00 22:00 23:00
Meadow Road North : Average Daily Car Flows
Jan-17 : Actual Jan-17 : Normalised Dec-20 : Actual Dec-20 : Normalised Apr-21 : Actual
14
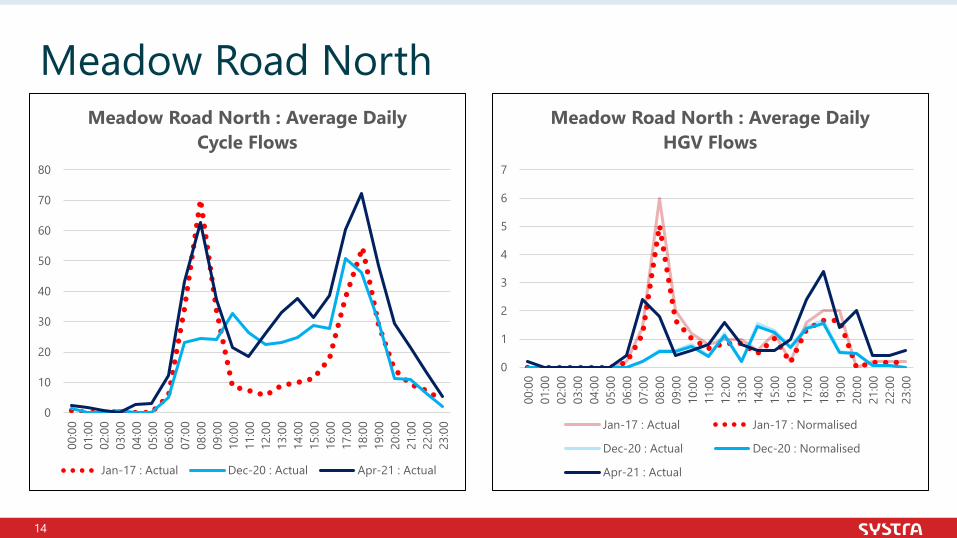
Meadow Road North
0
10
20
30
40
50
60
70
80
00:0
001
:00
02:0
003
:00
04:0
005
:00
06:0
007
:00
08:0
009
:00
10:0
011
:00
12:0
013
:00
14:0
015
:00
16:0
017
:00
18:0
019
:00
20:0
021
:00
22:0
023
:00
Meadow Road North : Average Daily Cycle Flows
Jan-17 : Actual Dec-20 : Actual Apr-21 : Actual
0
1
2
3
4
5
6
7
00:0
001
:00
02:0
003
:00
04:0
005
:00
06:0
007
:00
08:0
009
:00
10:0
011
:00
12:0
013
:00
14:0
015
:00
16:0
017
:00
18:0
019
:00
20:0
021
:00
22:0
023
:00
Meadow Road North : Average Daily HGV Flows
Jan-17 : Actual Jan-17 : Normalised
Dec-20 : Actual Dec-20 : Normalised
Apr-21 : Actual
15
Meadow Road North
0
2
4
6
8
10
12
14
16
18
00:0
001
:00
02:0
003
:00
04:0
005
:00
06:0
007
:00
08:0
009
:00
10:0
011
:00
12:0
013
:00
14:0
015
:00
16:0
017
:00
18:0
019
:00
20:0
021
:00
22:0
023
:00
Meadow Road North : Average Daily LGV Flows
Jan-17 : Actual Jan-17 : Normalised
Dec-20 : Actual Dec-20 : Normalised
Apr-21 : Actual
0
2
4
6
8
10
12
00:0
001
:00
02:0
003
:00
04:0
005
:00
06:0
007
:00
08:0
009
:00
10:0
011
:00
12:0
013
:00
14:0
015
:00
16:0
017
:00
18:0
019
:00
20:0
021
:00
22:0
023
:00
Meadow Road North : Average Daily Motorcycle Flows
Jan-17 : Actual Dec-20 : Actual Apr-21 : Actual
16
Meadow Road North– Summary TableJa
n-17
: A
ctua
l
Jan-
17 :
Nor
mal
ised
Dec
-20
: A
ctua
l
Dec
-20
: N
orm
alis
ed
Jan-
17 ->
Dec
-20
: Act
ual
Diff
eren
ce
Jan-
17 ->
Dec
-20
: Act
ual %
D
iffer
ence
Jan-
17 ->
Dec
-20
: N
orm
alis
ed D
iffer
ence
Jan-
17 ->
Dec
-20
: N
orm
alis
ed %
Diff
eren
ce
Apr
-21
: A
ctua
l
Apr
-21
: N
orm
alis
ed
Jan-
17 ->
Apr
-21
: Act
ual
Diff
eren
ce
Jan-
17 ->
Apr
-21
: Act
ual %
D
iffer
ence
Jan-
17 ->
Apr
-21
: N
orm
alis
ed D
iffer
ence
Jan-
17 ->
Apr
-21
: N
orm
alis
ed %
Diff
eren
ce
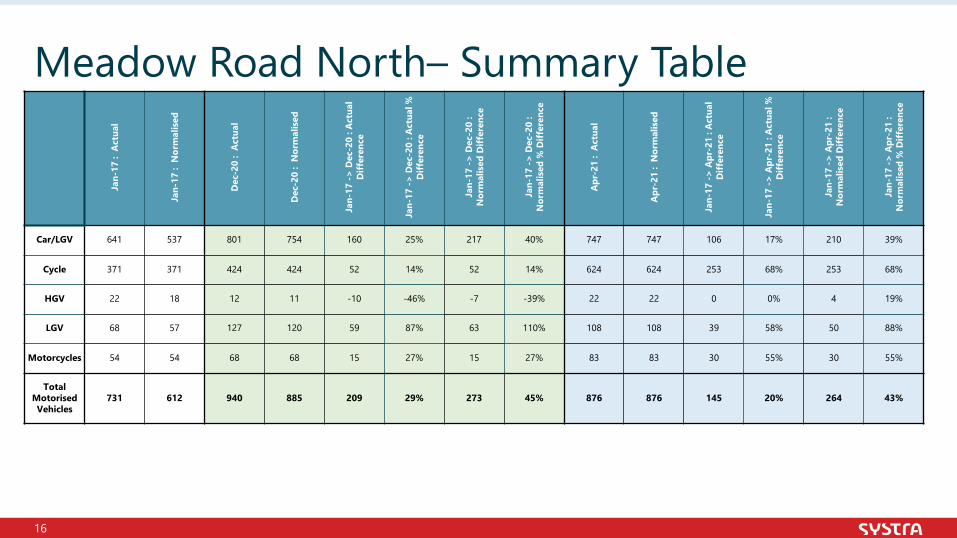
Car/LGV 641 537 801 754 160 25% 217 40% 747 747 106 17% 210 39%
Cycle 371 371 424 424 52 14% 52 14% 624 624 253 68% 253 68%
HGV 22 18 12 11 -10 -46% -7 -39% 22 22 0 0% 4 19%
LGV 68 57 127 120 59 87% 63 110% 108 108 39 58% 50 88%
Motorcycles 54 54 68 68 15 27% 15 27% 83 83 30 55% 30 55%
Total Motorised Vehicles
731 612 940 885 209 29% 273 45% 876 876 145 20% 264 43%
17
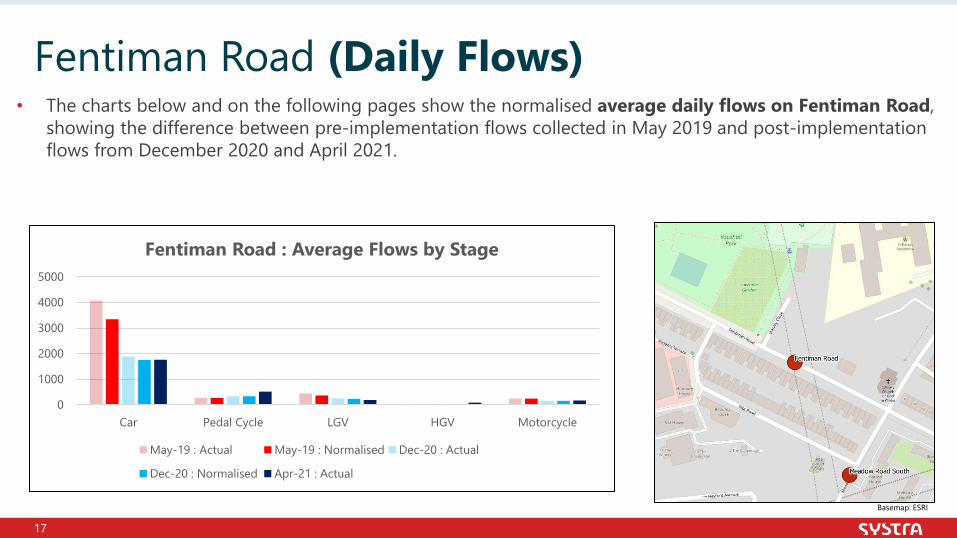
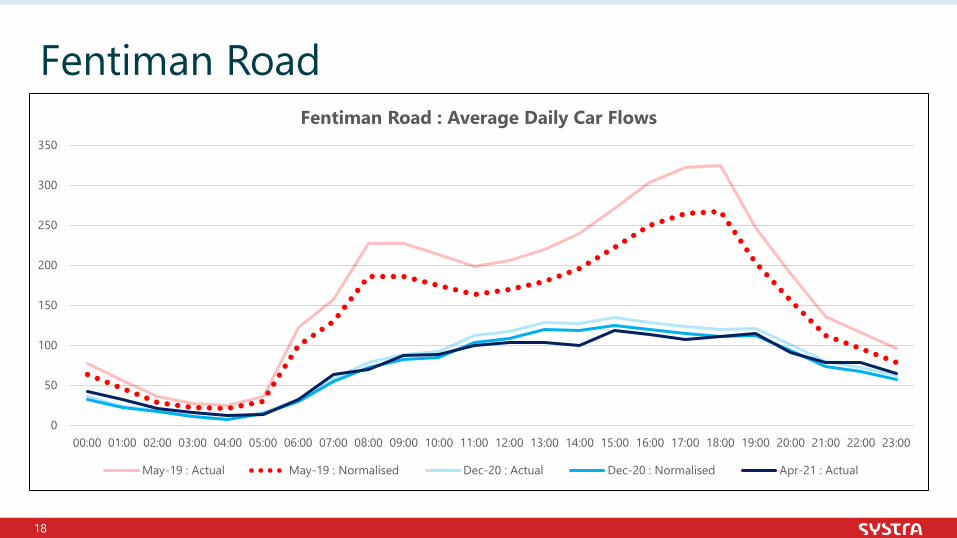
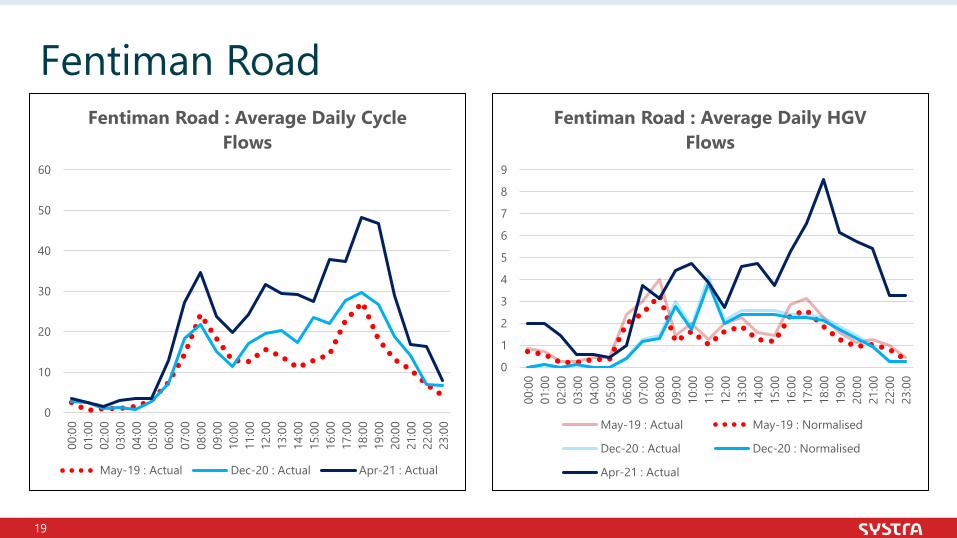
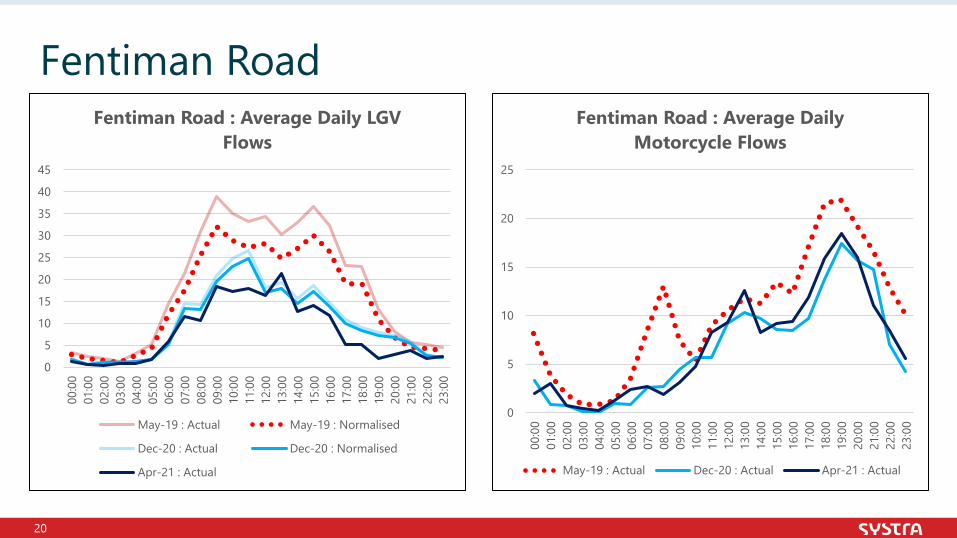
• The charts below and on the following pages show the normalised average daily flows on Fentiman Road, showing the difference between pre-implementation flows collected in May 2019 and post-implementation flows from December 2020 and April 2021.
Fentiman Road (Daily Flows)
Basemap: ESRI
0
1000
2000
3000
4000
5000
Car Pedal Cycle LGV HGV Motorcycle
Fentiman Road : Average Flows by Stage
May-19 : Actual May-19 : Normalised Dec-20 : Actual
Dec-20 : Normalised Apr-21 : Actual
18
Fentiman Road
0
50
100
150
200
250
300
350
00:00 01:00 02:00 03:00 04:00 05:00 06:00 07:00 08:00 09:00 10:00 11:00 12:00 13:00 14:00 15:00 16:00 17:00 18:00 19:00 20:00 21:00 22:00 23:00
Fentiman Road : Average Daily Car Flows
May-19 : Actual May-19 : Normalised Dec-20 : Actual Dec-20 : Normalised Apr-21 : Actual
19
Fentiman Road
0
10
20
30
40
50
60
00:0
001
:00
02:0
003
:00
04:0
005
:00
06:0
007
:00
08:0
009
:00
10:0
011
:00
12:0
013
:00
14:0
015
:00
16:0
017
:00
18:0
019
:00
20:0
021
:00
22:0
023
:00
Fentiman Road : Average Daily Cycle Flows
May-19 : Actual Dec-20 : Actual Apr-21 : Actual
0
1
2
3
4
5
6
7
8
9
00:0
001
:00
02:0
003
:00
04:0
005
:00
06:0
007
:00
08:0
009
:00
10:0
011
:00
12:0
013
:00
14:0
015
:00
16:0
017
:00
18:0
019
:00
20:0
021
:00
22:0
023
:00
Fentiman Road : Average Daily HGV Flows
May-19 : Actual May-19 : Normalised
Dec-20 : Actual Dec-20 : Normalised
Apr-21 : Actual
20
Fentiman Road
0
5
10
15
20
25
30
35
40
45
00:0
001
:00
02:0
003
:00
04:0
005
:00
06:0
007
:00
08:0
009
:00
10:0
011
:00
12:0
013
:00
14:0
015
:00
16:0
017
:00
18:0
019
:00
20:0
021
:00
22:0
023
:00
Fentiman Road : Average Daily LGV Flows
May-19 : Actual May-19 : Normalised
Dec-20 : Actual Dec-20 : Normalised
Apr-21 : Actual
0
5
10
15
20
25
00:0
001
:00
02:0
003
:00
04:0
005
:00
06:0
007
:00
08:0
009
:00
10:0
011
:00
12:0
013
:00
14:0
015
:00
16:0
017
:00
18:0
019
:00
20:0
021
:00
22:0
023
:00
Fentiman Road : Average Daily Motorcycle Flows
May-19 : Actual Dec-20 : Actual Apr-21 : Actual
21
Fentiman Road – Summary TableM
ay-1
9 :
Act
ual
May
-19
: N
orm
alis
ed
Dec
-20
: A
ctua
l
Dec
-20
: N
orm
alis
ed
May
-19
-> D
ec-2
0 : A
ctua
l D
iffer
ence
May
-19
-> D
ec-2
0 : A
ctua
l %
Diff
eren
ce
May
-19
-> D
ec-2
0 :
Nor
mal
ised
Diff
eren
ce
May
-19
-> D
ec-2
0 :
Nor
mal
ised
% D
iffer
ence
Apr
-21
: A
ctua
l
Apr
-21
: N
orm
alis
ed
May
-19
-> A
pr-2
1 : A
ctua
l D
iffer
ence
May
-19
-> A
pr-2
1 : A
ctua
l %
Diff
eren
ce
May
-19
-> A
pr-2
1 :
Nor
mal
ised
Diff
eren
ce
May
-19
-> A
pr-2
1 :
Nor
mal
ised
% D
iffer
ence
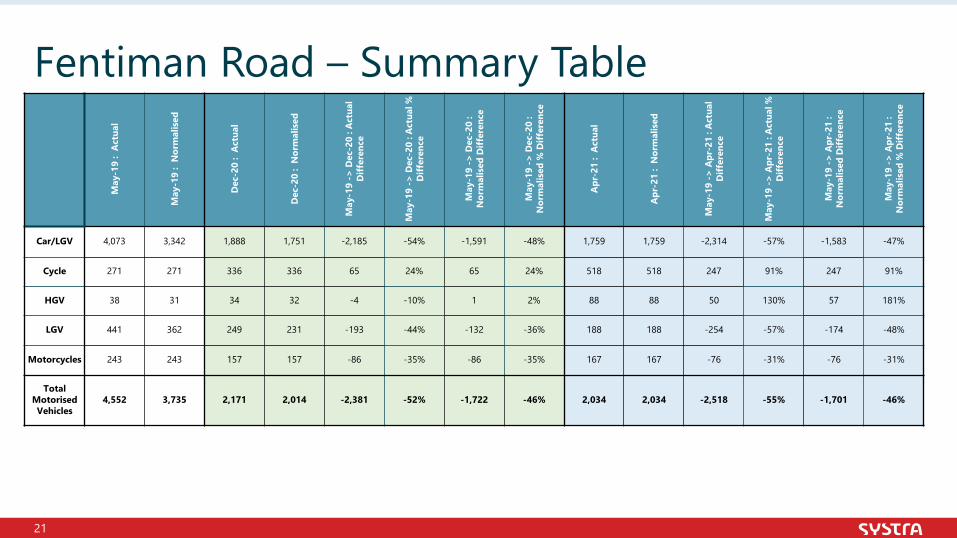
Car/LGV 4,073 3,342 1,888 1,751 -2,185 -54% -1,591 -48% 1,759 1,759 -2,314 -57% -1,583 -47%
Cycle 271 271 336 336 65 24% 65 24% 518 518 247 91% 247 91%
HGV 38 31 34 32 -4 -10% 1 2% 88 88 50 130% 57 181%
LGV 441 362 249 231 -193 -44% -132 -36% 188 188 -254 -57% -174 -48%
Motorcycles 243 243 157 157 -86 -35% -86 -35% 167 167 -76 -31% -76 -31%
Total Motorised Vehicles
4,552 3,735 2,171 2,014 -2,381 -52% -1,722 -46% 2,034 2,034 -2,518 -55% -1,701 -46%
22
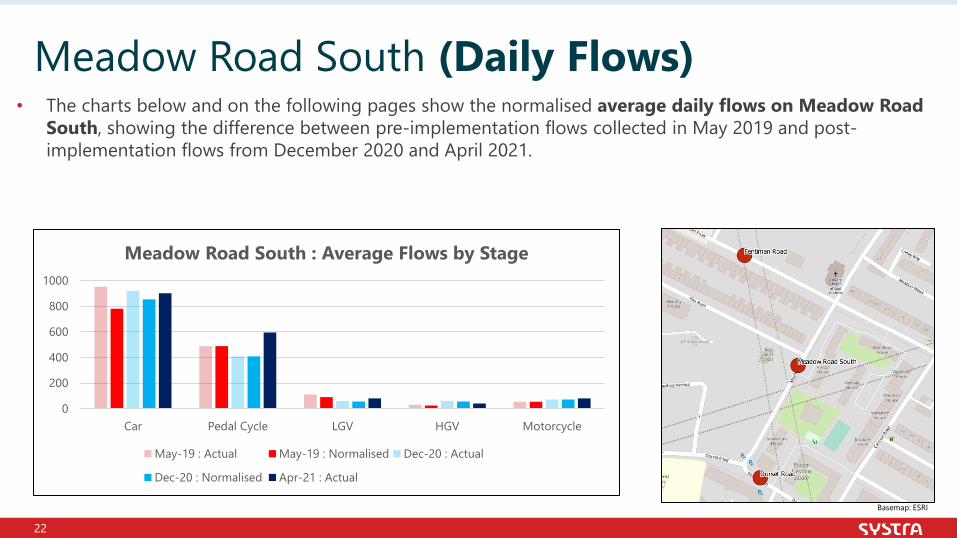
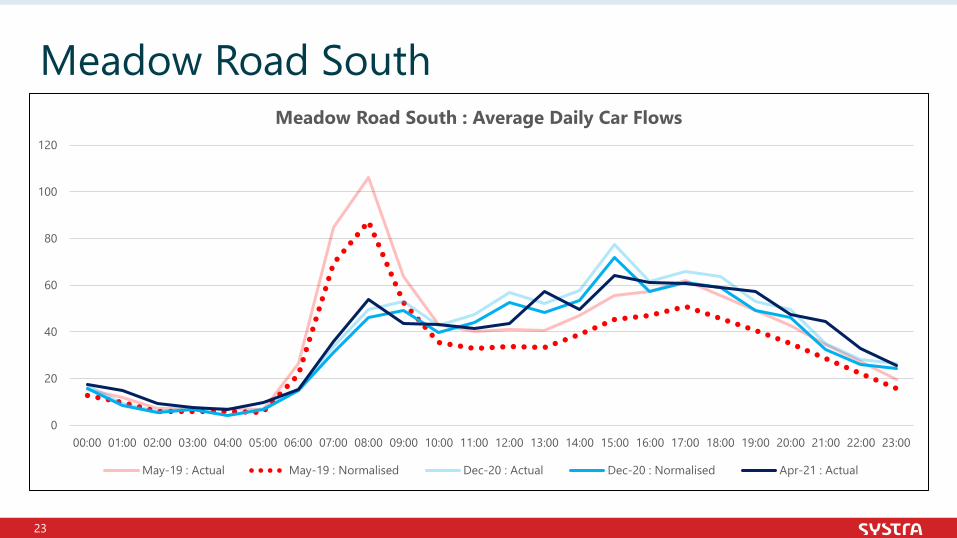
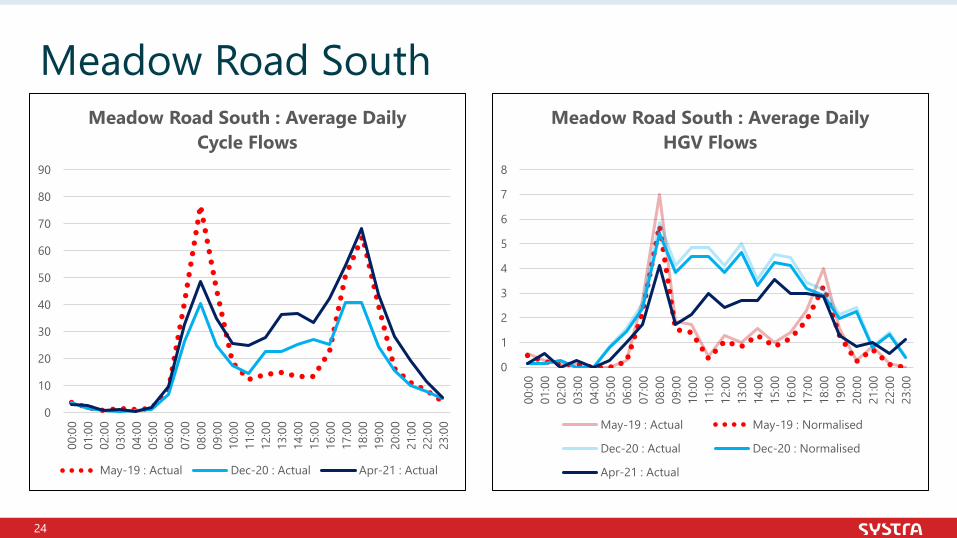
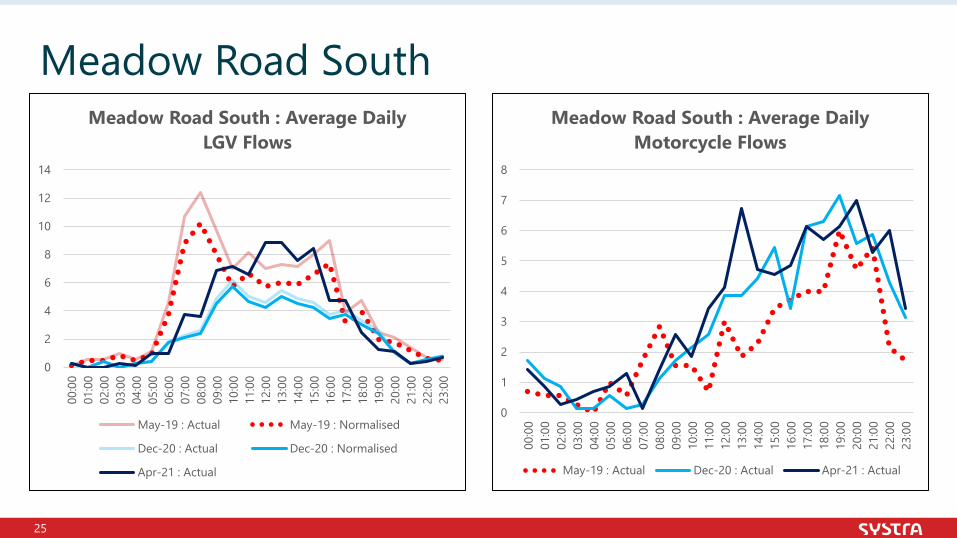
• The charts below and on the following pages show the normalised average daily flows on Meadow Road South, showing the difference between pre-implementation flows collected in May 2019 and post-implementation flows from December 2020 and April 2021.
Meadow Road South (Daily Flows)
Basemap: ESRI
0
200
400
600
800
1000
Car Pedal Cycle LGV HGV Motorcycle
Meadow Road South : Average Flows by Stage
May-19 : Actual May-19 : Normalised Dec-20 : Actual
Dec-20 : Normalised Apr-21 : Actual
23
Meadow Road South
0
20
40
60
80
100
120
00:00 01:00 02:00 03:00 04:00 05:00 06:00 07:00 08:00 09:00 10:00 11:00 12:00 13:00 14:00 15:00 16:00 17:00 18:00 19:00 20:00 21:00 22:00 23:00
Meadow Road South : Average Daily Car Flows
May-19 : Actual May-19 : Normalised Dec-20 : Actual Dec-20 : Normalised Apr-21 : Actual
24
Meadow Road South
0
10
20
30
40
50
60
70
80
90
00:0
001
:00
02:0
003
:00
04:0
005
:00
06:0
007
:00
08:0
009
:00
10:0
011
:00
12:0
013
:00
14:0
015
:00
16:0
017
:00
18:0
019
:00
20:0
021
:00
22:0
023
:00
Meadow Road South : Average Daily Cycle Flows
May-19 : Actual Dec-20 : Actual Apr-21 : Actual
0
1
2
3
4
5
6
7
8
00:0
001
:00
02:0
003
:00
04:0
005
:00
06:0
007
:00
08:0
009
:00
10:0
011
:00
12:0
013
:00
14:0
015
:00
16:0
017
:00
18:0
019
:00
20:0
021
:00
22:0
023
:00
Meadow Road South : Average Daily HGV Flows
May-19 : Actual May-19 : Normalised
Dec-20 : Actual Dec-20 : Normalised
Apr-21 : Actual
25
Meadow Road South
0
2
4
6
8
10
12
14
00:0
001
:00
02:0
003
:00
04:0
005
:00
06:0
007
:00
08:0
009
:00
10:0
011
:00
12:0
013
:00
14:0
015
:00
16:0
017
:00
18:0
019
:00
20:0
021
:00
22:0
023
:00
Meadow Road South : Average Daily LGV Flows
May-19 : Actual May-19 : Normalised
Dec-20 : Actual Dec-20 : Normalised
Apr-21 : Actual
0
1
2
3
4
5
6
7
8
00:0
001
:00
02:0
003
:00
04:0
005
:00
06:0
007
:00
08:0
009
:00
10:0
011
:00
12:0
013
:00
14:0
015
:00
16:0
017
:00
18:0
019
:00
20:0
021
:00
22:0
023
:00
Meadow Road South : Average Daily Motorcycle Flows
May-19 : Actual Dec-20 : Actual Apr-21 : Actual
26
Meadow Road South – Summary TableM
ay-1
9 :
Act
ual
May
-19
: N
orm
alis
ed
Dec
-20
: A
ctua
l
Dec
-20
: N
orm
alis
ed
May
-19
-> D
ec-2
0 : A
ctua
l D
iffer
ence
May
-19
-> D
ec-2
0 : A
ctua
l %
Diff
eren
ce
May
-19
-> D
ec-2
0 :
Nor
mal
ised
Diff
eren
ce
May
-19
-> D
ec-2
0 :
Nor
mal
ised
% D
iffer
ence
Apr
-21
: A
ctua
l
Apr
-21
: N
orm
alis
ed
May
-19
-> A
pr-2
1 : A
ctua
l D
iffer
ence
May
-19
-> A
pr-2
1 : A
ctua
l %
Diff
eren
ce
May
-19
-> A
pr-2
1 :
Nor
mal
ised
Diff
eren
ce
May
-19
-> A
pr-2
1 :
Nor
mal
ised
% D
iffer
ence
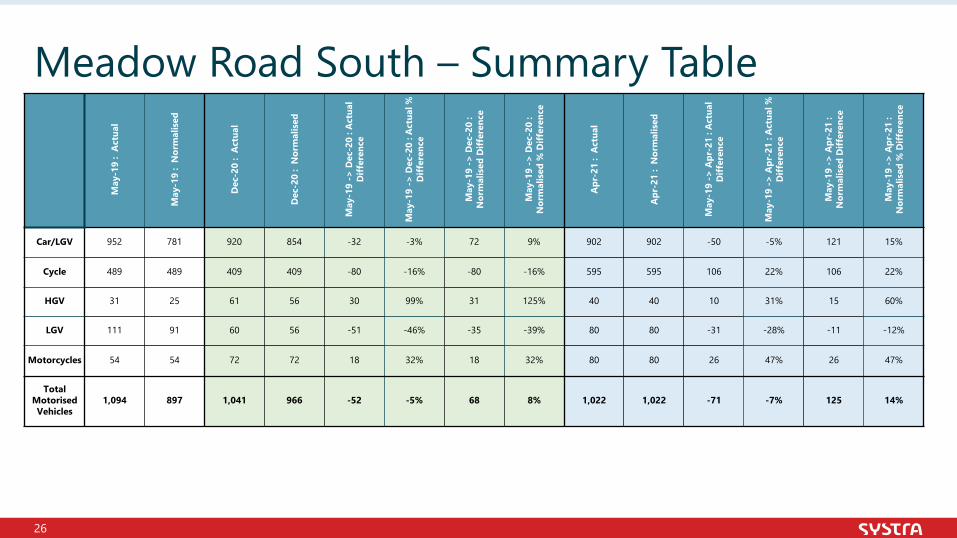
Car/LGV 952 781 920 854 -32 -3% 72 9% 902 902 -50 -5% 121 15%
Cycle 489 489 409 409 -80 -16% -80 -16% 595 595 106 22% 106 22%
HGV 31 25 61 56 30 99% 31 125% 40 40 10 31% 15 60%
LGV 111 91 60 56 -51 -46% -35 -39% 80 80 -31 -28% -11 -12%
Motorcycles 54 54 72 72 18 32% 18 32% 80 80 26 47% 26 47%
Total Motorised Vehicles
1,094 897 1,041 966 -52 -5% 68 8% 1,022 1,022 -71 -7% 125 14%
27
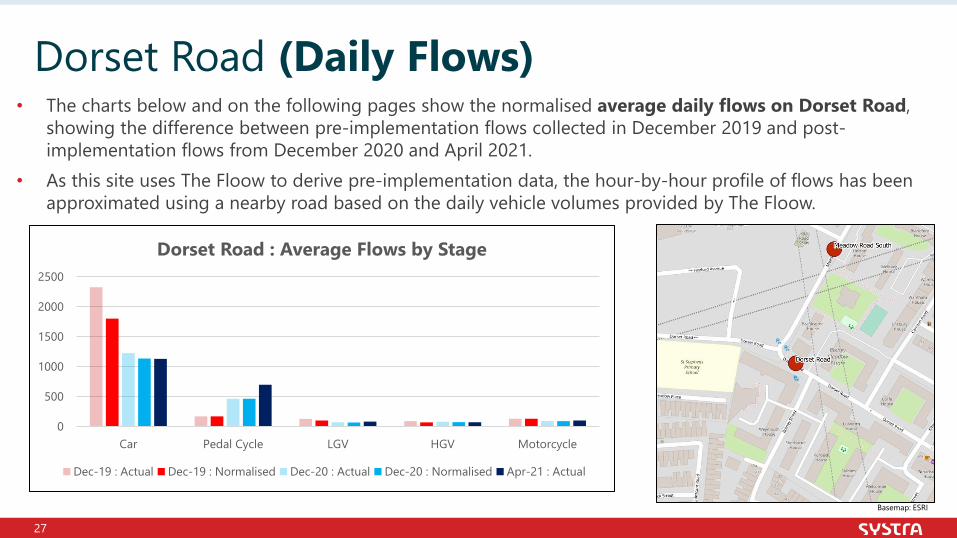
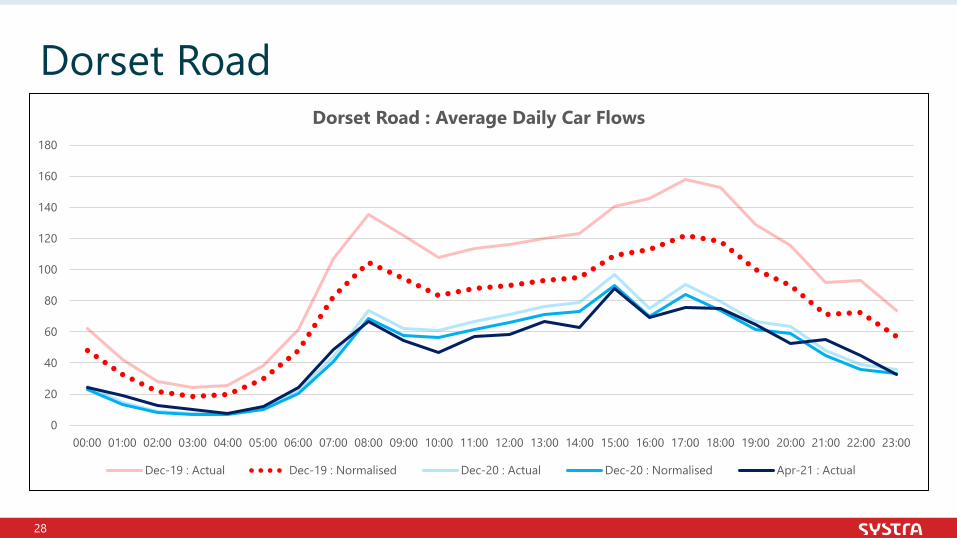
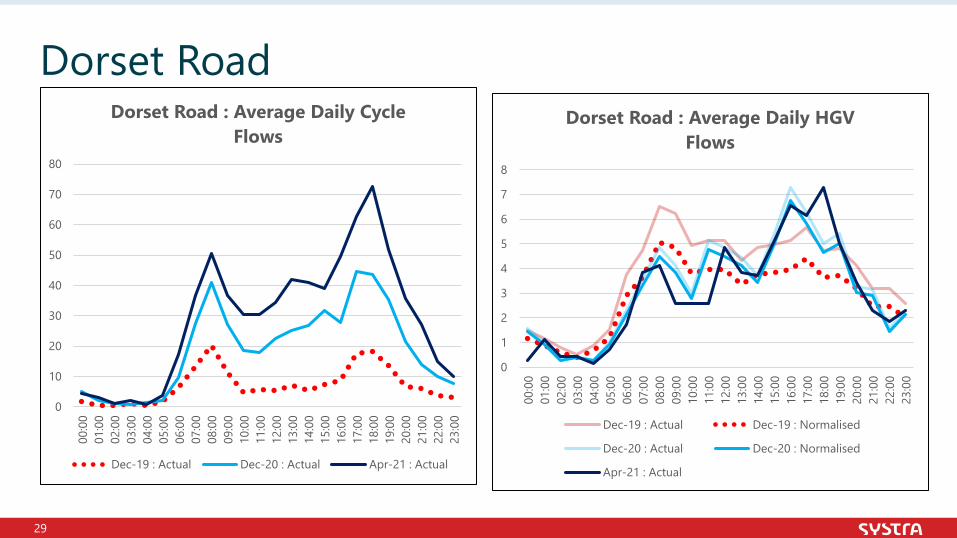
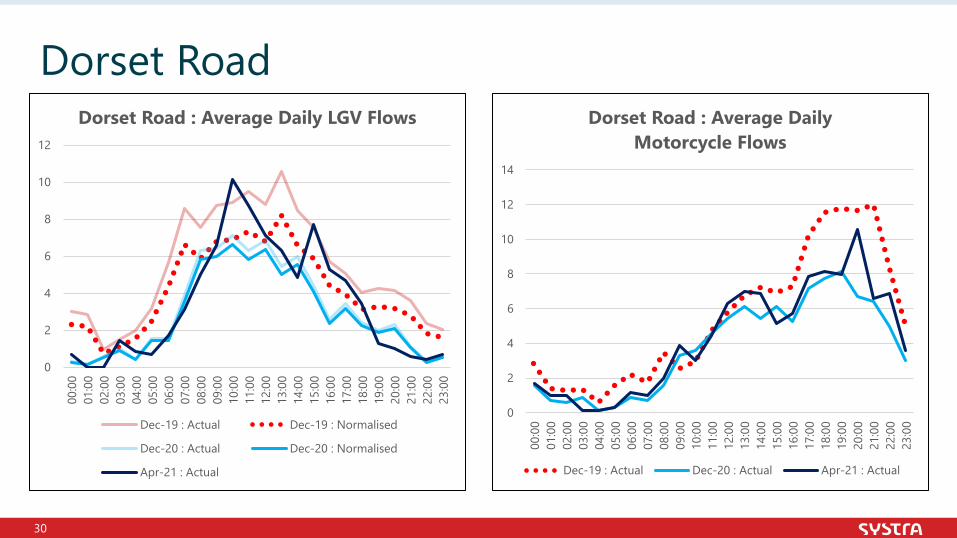
• The charts below and on the following pages show the normalised average daily flows on Dorset Road, showing the difference between pre-implementation flows collected in December 2019 and post-implementation flows from December 2020 and April 2021.
• As this site uses The Floow to derive pre-implementation data, the hour-by-hour profile of flows has been approximated using a nearby road based on the daily vehicle volumes provided by The Floow.
Dorset Road (Daily Flows)
Basemap: ESRI
0
500
1000
1500
2000
2500
Car Pedal Cycle LGV HGV Motorcycle
Dorset Road : Average Flows by Stage
Dec-19 : Actual Dec-19 : Normalised Dec-20 : Actual Dec-20 : Normalised Apr-21 : Actual
28
Dorset Road
0
20
40
60
80
100
120
140
160
180
00:00 01:00 02:00 03:00 04:00 05:00 06:00 07:00 08:00 09:00 10:00 11:00 12:00 13:00 14:00 15:00 16:00 17:00 18:00 19:00 20:00 21:00 22:00 23:00
Dorset Road : Average Daily Car Flows
Dec-19 : Actual Dec-19 : Normalised Dec-20 : Actual Dec-20 : Normalised Apr-21 : Actual
29
Dorset Road
0
10
20
30
40
50
60
70
80
00:0
001
:00
02:0
003
:00
04:0
005
:00
06:0
007
:00
08:0
009
:00
10:0
011
:00
12:0
013
:00
14:0
015
:00
16:0
017
:00
18:0
019
:00
20:0
021
:00
22:0
023
:00
Dorset Road : Average Daily Cycle Flows
Dec-19 : Actual Dec-20 : Actual Apr-21 : Actual
0
1
2
3
4
5
6
7
8
00:0
001
:00
02:0
003
:00
04:0
005
:00
06:0
007
:00
08:0
009
:00
10:0
011
:00
12:0
013
:00
14:0
015
:00
16:0
017
:00
18:0
019
:00
20:0
021
:00
22:0
023
:00
Dorset Road : Average Daily HGV Flows
Dec-19 : Actual Dec-19 : Normalised
Dec-20 : Actual Dec-20 : Normalised
Apr-21 : Actual
30
Dorset Road
0
2
4
6
8
10
12
00:0
001
:00
02:0
003
:00
04:0
005
:00
06:0
007
:00
08:0
009
:00
10:0
011
:00
12:0
013
:00
14:0
015
:00
16:0
017
:00
18:0
019
:00
20:0
021
:00
22:0
023
:00
Dorset Road : Average Daily LGV Flows
Dec-19 : Actual Dec-19 : Normalised
Dec-20 : Actual Dec-20 : Normalised
Apr-21 : Actual
0
2
4
6
8
10
12
14
00:0
001
:00
02:0
003
:00
04:0
005
:00
06:0
007
:00
08:0
009
:00
10:0
011
:00
12:0
013
:00
14:0
015
:00
16:0
017
:00
18:0
019
:00
20:0
021
:00
22:0
023
:00
Dorset Road : Average Daily Motorcycle Flows
Dec-19 : Actual Dec-20 : Actual Apr-21 : Actual
31
Dorset Road – Summary TableD
ec-1
9 :
Act
ual
Dec
-19
: N
orm
alis
ed
Dec
-20
: A
ctua
l
Dec
-20
: N
orm
alis
ed
Dec
-19
-> D
ec-2
0 : A
ctua
l D
iffer
ence
Dec
-19
-> D
ec-2
0 : A
ctua
l %
Diff
eren
ce
Dec
-19
-> D
ec-2
0 :
Nor
mal
ised
Diff
eren
ce
Dec
-19
-> D
ec-2
0 :
Nor
mal
ised
% D
iffer
ence
Apr
-21
: A
ctua
l
Apr
-21
: N
orm
alis
ed
Dec
-19
-> A
pr-2
1 : A
ctua
l D
iffer
ence
Dec
-19
-> A
pr-2
1 : A
ctua
l %
Diff
eren
ce
Dec
-19
-> A
pr-2
1 :
Nor
mal
ised
Diff
eren
ce
Dec
-19
-> A
pr-2
1 :
Nor
mal
ised
% D
iffer
ence
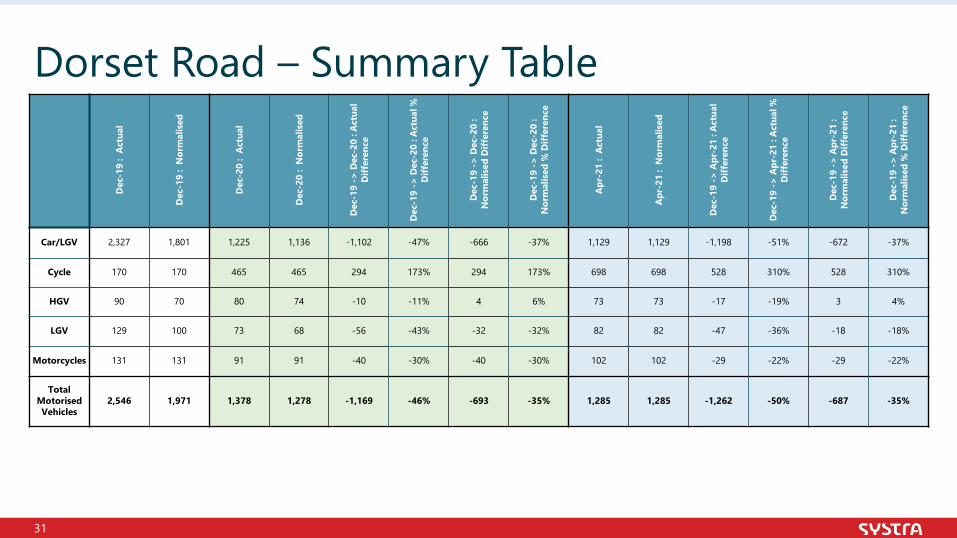
Car/LGV 2,327 1,801 1,225 1,136 -1,102 -47% -666 -37% 1,129 1,129 -1,198 -51% -672 -37%
Cycle 170 170 465 465 294 173% 294 173% 698 698 528 310% 528 310%
HGV 90 70 80 74 -10 -11% 4 6% 73 73 -17 -19% 3 4%
LGV 129 100 73 68 -56 -43% -32 -32% 82 82 -47 -36% -18 -18%
Motorcycles 131 131 91 91 -40 -30% -40 -30% 102 102 -29 -22% -29 -22%
Total Motorised Vehicles
2,546 1,971 1,378 1,278 -1,169 -46% -693 -35% 1,285 1,285 -1,262 -50% -687 -35%
32
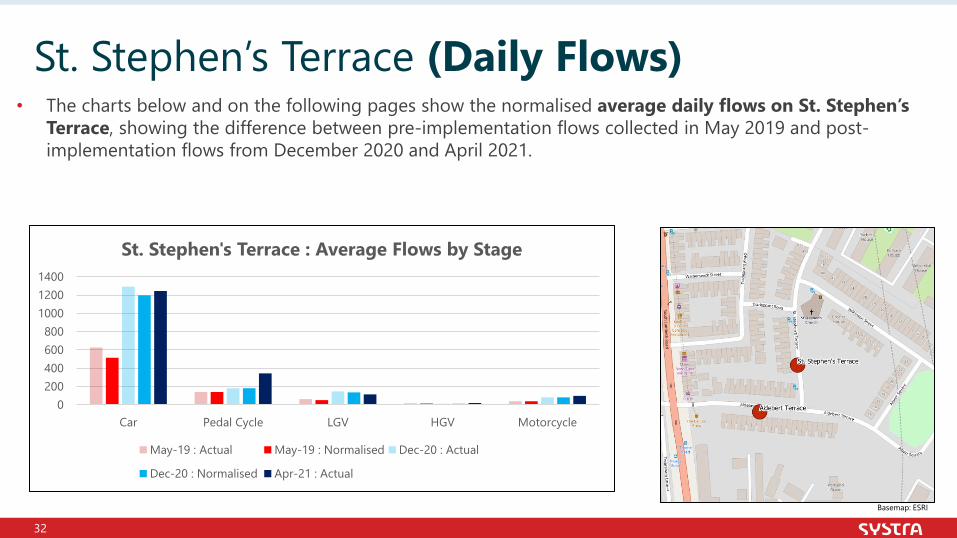
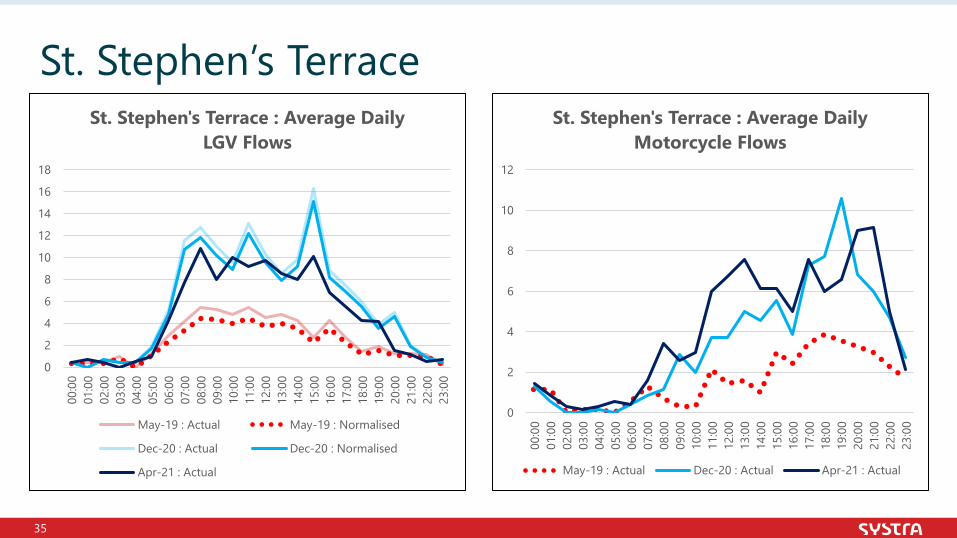
• The charts below and on the following pages show the normalised average daily flows on St. Stephen’s Terrace, showing the difference between pre-implementation flows collected in May 2019 and post-implementation flows from December 2020 and April 2021.
St. Stephen’s Terrace (Daily Flows)
Basemap: ESRI
0200400600800
100012001400
Car Pedal Cycle LGV HGV Motorcycle
St. Stephen's Terrace : Average Flows by Stage
May-19 : Actual May-19 : Normalised Dec-20 : Actual
Dec-20 : Normalised Apr-21 : Actual
33
St. Stephen’s Terrace
0
20
40
60
80
100
120
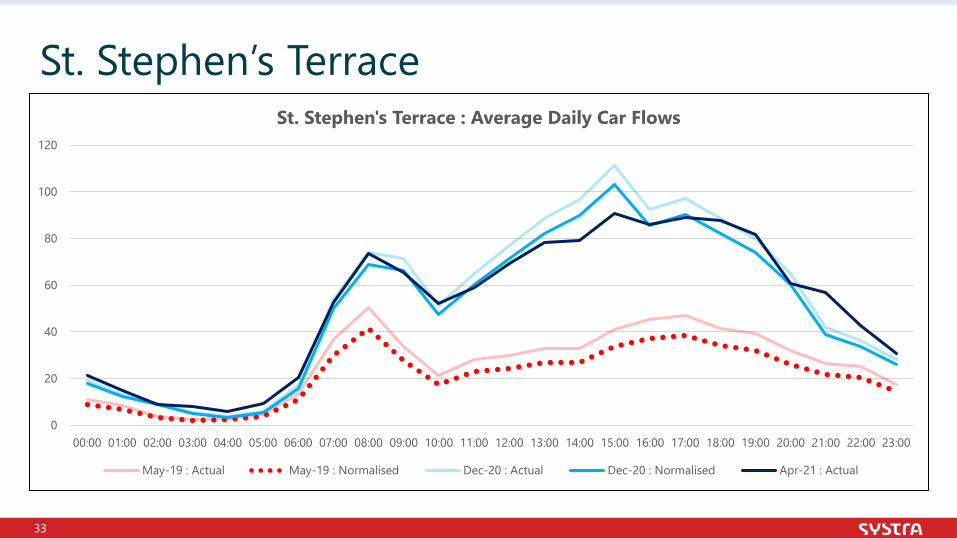
00:00 01:00 02:00 03:00 04:00 05:00 06:00 07:00 08:00 09:00 10:00 11:00 12:00 13:00 14:00 15:00 16:00 17:00 18:00 19:00 20:00 21:00 22:00 23:00
St. Stephen's Terrace : Average Daily Car Flows
May-19 : Actual May-19 : Normalised Dec-20 : Actual Dec-20 : Normalised Apr-21 : Actual
34
St. Stephen’s Terrace
0
5
10
15
20
25
30
35
40
45
00:0
001
:00
02:0
003
:00
04:0
005
:00
06:0
007
:00
08:0
009
:00
10:0
011
:00
12:0
013
:00
14:0
015
:00
16:0
017
:00
18:0
019
:00
20:0
021
:00
22:0
023
:00
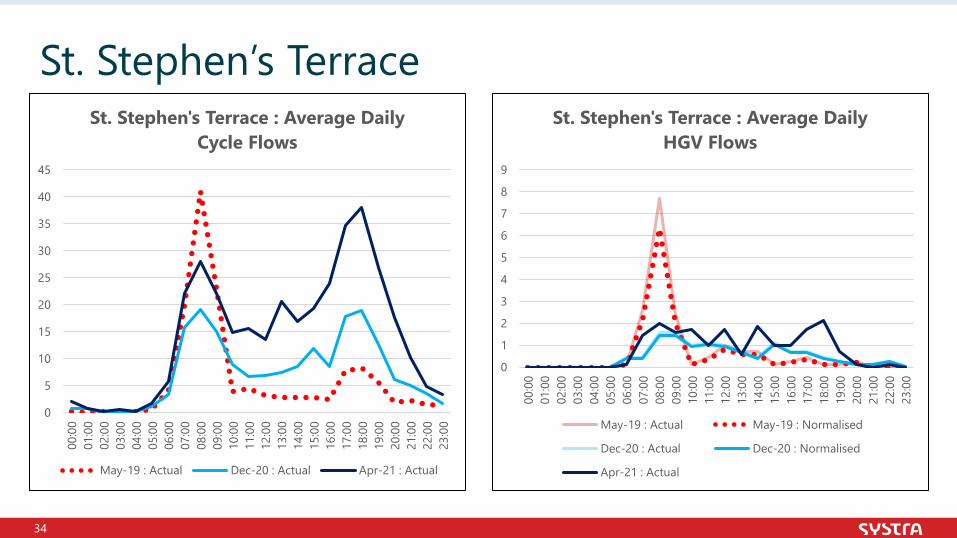
St. Stephen's Terrace : Average Daily Cycle Flows
May-19 : Actual Dec-20 : Actual Apr-21 : Actual
0
1
2
3
4
5
6
7
8
9
00:0
001
:00
02:0
003
:00
04:0
005
:00
06:0
007
:00
08:0
009
:00
10:0
011
:00
12:0
013
:00
14:0
015
:00
16:0
017
:00
18:0
019
:00
20:0
021
:00
22:0
023
:00
St. Stephen's Terrace : Average Daily HGV Flows
May-19 : Actual May-19 : Normalised
Dec-20 : Actual Dec-20 : Normalised
Apr-21 : Actual
35
St. Stephen’s Terrace
0
2
4
6
8
10
12
14
16
18
00:0
001
:00
02:0
003
:00
04:0
005
:00
06:0
007
:00
08:0
009
:00
10:0
011
:00
12:0
013
:00
14:0
015
:00
16:0
017
:00
18:0
019
:00
20:0
021
:00
22:0
023
:00
St. Stephen's Terrace : Average Daily LGV Flows
May-19 : Actual May-19 : Normalised
Dec-20 : Actual Dec-20 : Normalised
Apr-21 : Actual
0
2
4
6
8
10
12
00:0
001
:00
02:0
003
:00
04:0
005
:00
06:0
007
:00
08:0
009
:00
10:0
011
:00
12:0
013
:00
14:0
015
:00
16:0
017
:00
18:0
019
:00
20:0
021
:00
22:0
023
:00
St. Stephen's Terrace : Average Daily Motorcycle Flows
May-19 : Actual Dec-20 : Actual Apr-21 : Actual
36
St. Stephen’s Terrace – Summary TableM
ay-1
9 :
Act
ual
May
-19
: N
orm
alis
ed
Dec
-20
: A
ctua
l
Dec
-20
: N
orm
alis
ed
May
-19
-> D
ec-2
0 : A
ctua
l D
iffer
ence
May
-19
-> D
ec-2
0 : A
ctua
l %
Diff
eren
ce
May
-19
-> D
ec-2
0 :
Nor
mal
ised
Diff
eren
ce
May
-19
-> D
ec-2
0 :
Nor
mal
ised
% D
iffer
ence
Apr
-21
: A
ctua
l
Apr
-21
: N
orm
alis
ed
May
-19
-> A
pr-2
1 : A
ctua
l D
iffer
ence
May
-19
-> A
pr-2
1 : A
ctua
l %
Diff
eren
ce
May
-19
-> A
pr-2
1 :
Nor
mal
ised
Diff
eren
ce
May
-19
-> A
pr-2
1 :
Nor
mal
ised
% D
iffer
ence
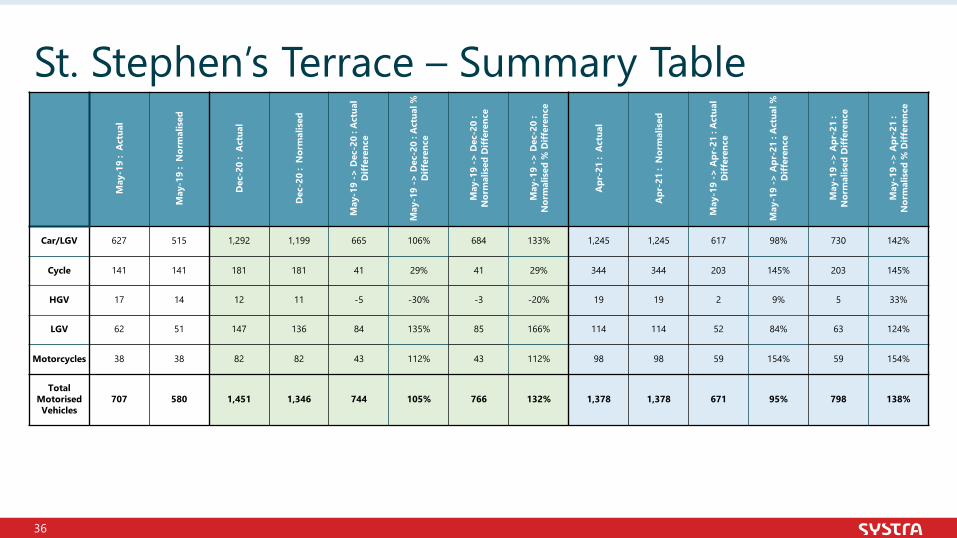
Car/LGV 627 515 1,292 1,199 665 106% 684 133% 1,245 1,245 617 98% 730 142%
Cycle 141 141 181 181 41 29% 41 29% 344 344 203 145% 203 145%
HGV 17 14 12 11 -5 -30% -3 -20% 19 19 2 9% 5 33%
LGV 62 51 147 136 84 135% 85 166% 114 114 52 84% 63 124%
Motorcycles 38 38 82 82 43 112% 43 112% 98 98 59 154% 59 154%
Total Motorised Vehicles
707 580 1,451 1,346 744 105% 766 132% 1,378 1,378 671 95% 798 138%
37
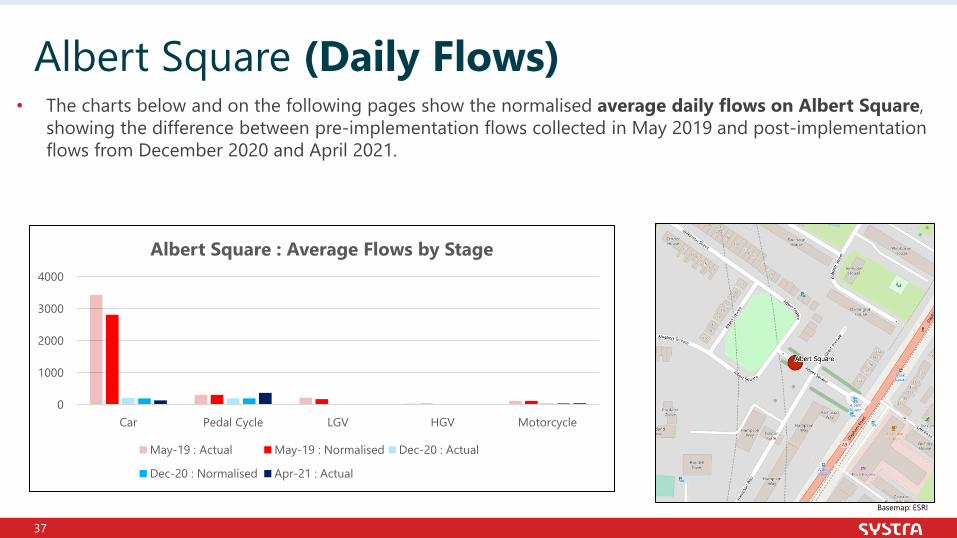
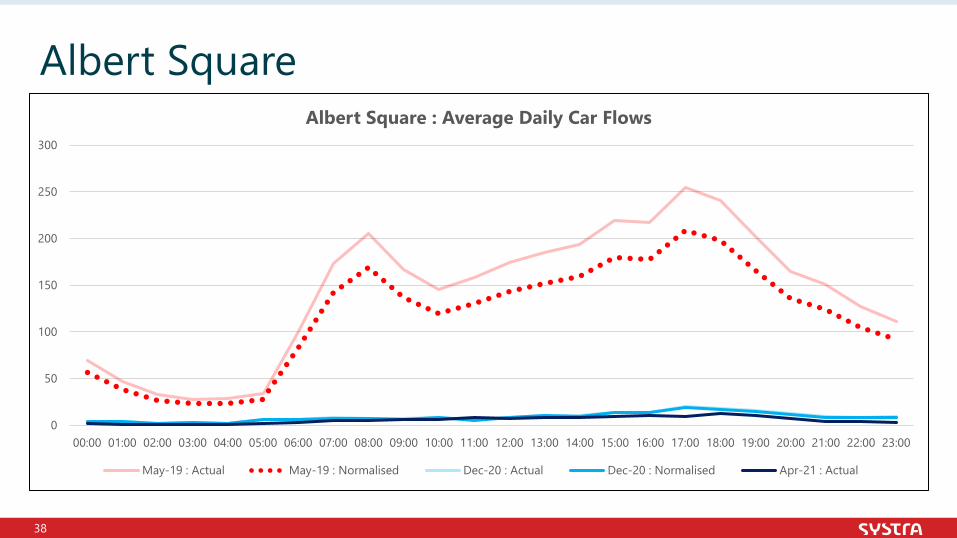
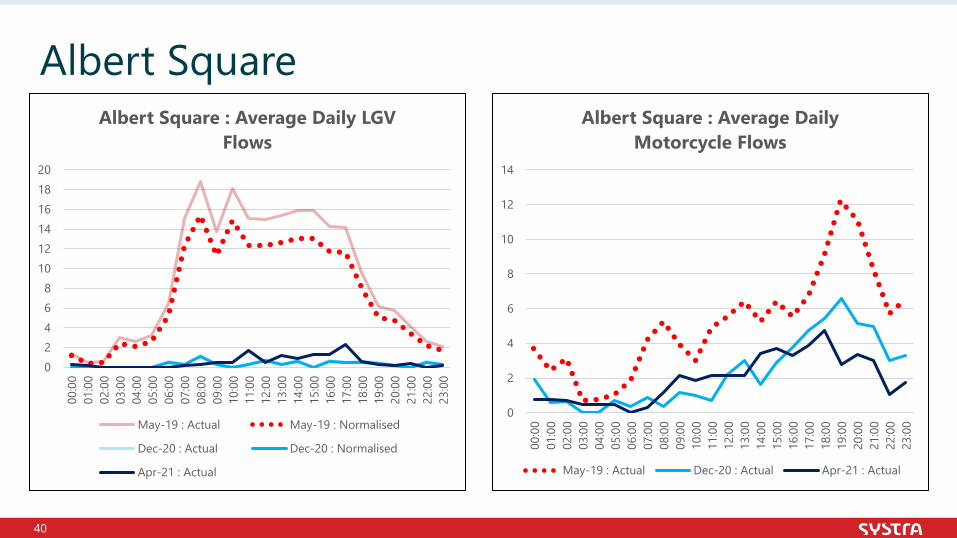
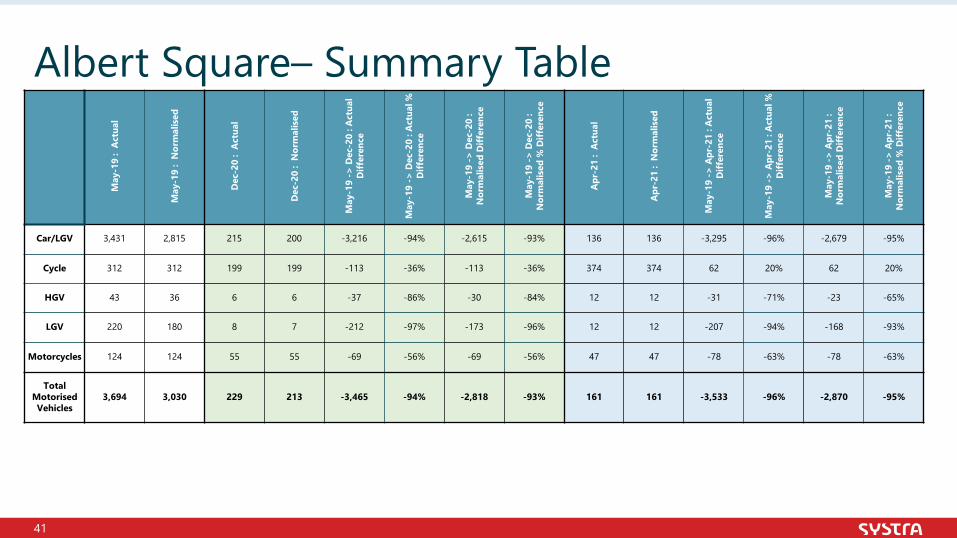
• The charts below and on the following pages show the normalised average daily flows on Albert Square, showing the difference between pre-implementation flows collected in May 2019 and post-implementation flows from December 2020 and April 2021.
Albert Square (Daily Flows)
Basemap: ESRI
0
1000
2000
3000
4000
Car Pedal Cycle LGV HGV Motorcycle
Albert Square : Average Flows by Stage
May-19 : Actual May-19 : Normalised Dec-20 : Actual
Dec-20 : Normalised Apr-21 : Actual
38
Albert Square
0
50
100
150
200
250
300
00:00 01:00 02:00 03:00 04:00 05:00 06:00 07:00 08:00 09:00 10:00 11:00 12:00 13:00 14:00 15:00 16:00 17:00 18:00 19:00 20:00 21:00 22:00 23:00
Albert Square : Average Daily Car Flows
May-19 : Actual May-19 : Normalised Dec-20 : Actual Dec-20 : Normalised Apr-21 : Actual
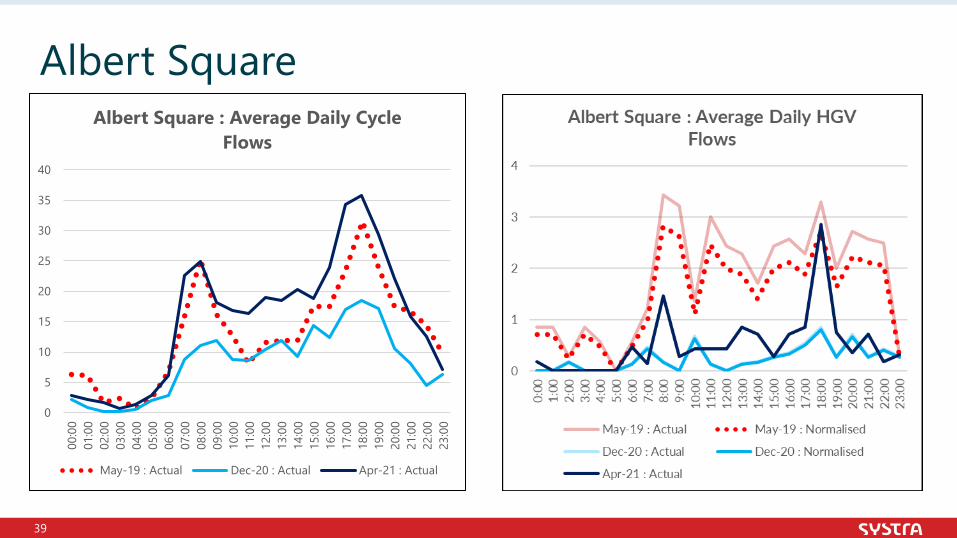
39
Albert Square
0
5
10
15
20
25
30
35
40
00:0
001
:00
02:0
003
:00
04:0
005
:00
06:0
007
:00
08:0
009
:00
10:0
011
:00
12:0
013
:00
14:0
015
:00
16:0
017
:00
18:0
019
:00
20:0
021
:00
22:0
023
:00
Albert Square : Average Daily Cycle Flows
May-19 : Actual Dec-20 : Actual Apr-21 : Actual
40
Albert Square
02468
101214161820
00:0
001
:00
02:0
003
:00
04:0
005
:00
06:0
007
:00
08:0
009
:00
10:0
011
:00
12:0
013
:00
14:0
015
:00
16:0
017
:00
18:0
019
:00
20:0
021
:00
22:0
023
:00
Albert Square : Average Daily LGV Flows
May-19 : Actual May-19 : Normalised
Dec-20 : Actual Dec-20 : Normalised
Apr-21 : Actual
0
2
4
6
8
10
12
14
00:0
001
:00
02:0
003
:00
04:0
005
:00
06:0
007
:00
08:0
009
:00
10:0
011
:00
12:0
013
:00
14:0
015
:00
16:0
017
:00
18:0
019
:00
20:0
021
:00
22:0
023
:00
Albert Square : Average Daily Motorcycle Flows
May-19 : Actual Dec-20 : Actual Apr-21 : Actual
41
Albert Square– Summary TableM
ay-1
9 :
Act
ual
May
-19
: N
orm
alis
ed
Dec
-20
: A
ctua
l
Dec
-20
: N
orm
alis
ed
May
-19
-> D
ec-2
0 : A
ctua
l D
iffer
ence
May
-19
-> D
ec-2
0 : A
ctua
l %
Diff
eren
ce
May
-19
-> D
ec-2
0 :
Nor
mal
ised
Diff
eren
ce
May
-19
-> D
ec-2
0 :
Nor
mal
ised
% D
iffer
ence
Apr
-21
: A
ctua
l
Apr
-21
: N
orm
alis
ed
May
-19
-> A
pr-2
1 : A
ctua
l D
iffer
ence
May
-19
-> A
pr-2
1 : A
ctua
l %
Diff
eren
ce
May
-19
-> A
pr-2
1 :
Nor
mal
ised
Diff
eren
ce
May
-19
-> A
pr-2
1 :
Nor
mal
ised
% D
iffer
ence
Car/LGV 3,431 2,815 215 200 -3,216 -94% -2,615 -93% 136 136 -3,295 -96% -2,679 -95%
Cycle 312 312 199 199 -113 -36% -113 -36% 374 374 62 20% 62 20%
HGV 43 36 6 6 -37 -86% -30 -84% 12 12 -31 -71% -23 -65%
LGV 220 180 8 7 -212 -97% -173 -96% 12 12 -207 -94% -168 -93%
Motorcycles 124 124 55 55 -69 -56% -69 -56% 47 47 -78 -63% -78 -63%
Total Motorised Vehicles
3,694 3,030 229 213 -3,465 -94% -2,818 -93% 161 161 -3,533 -96% -2,870 -95%
42
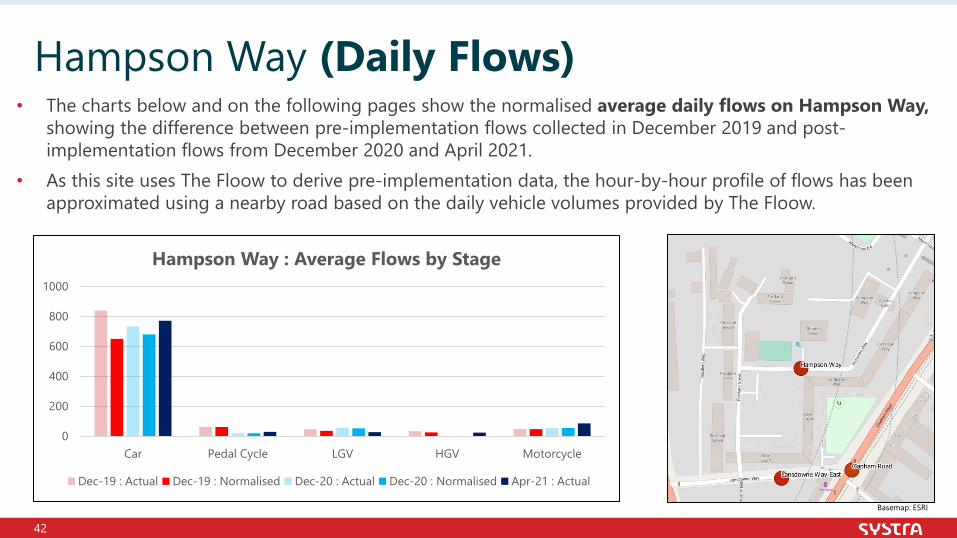
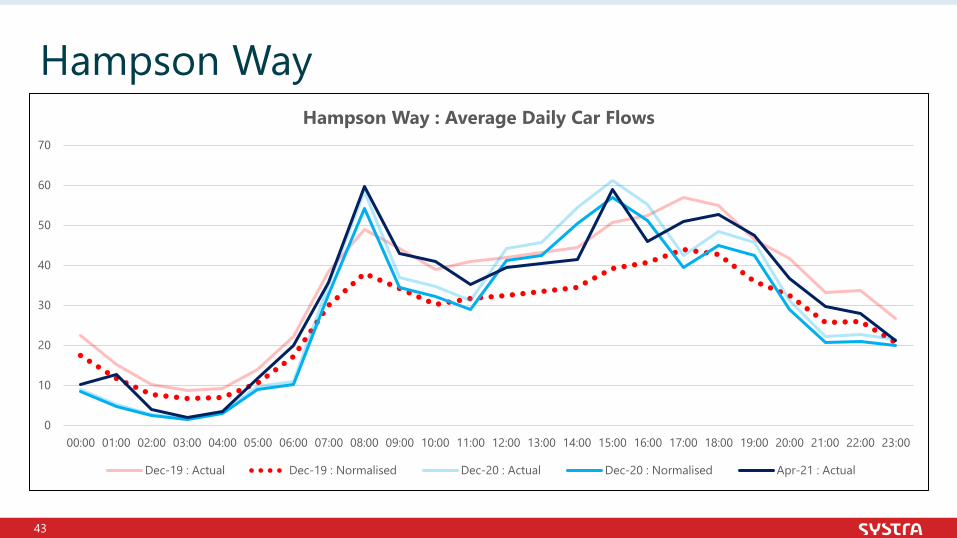
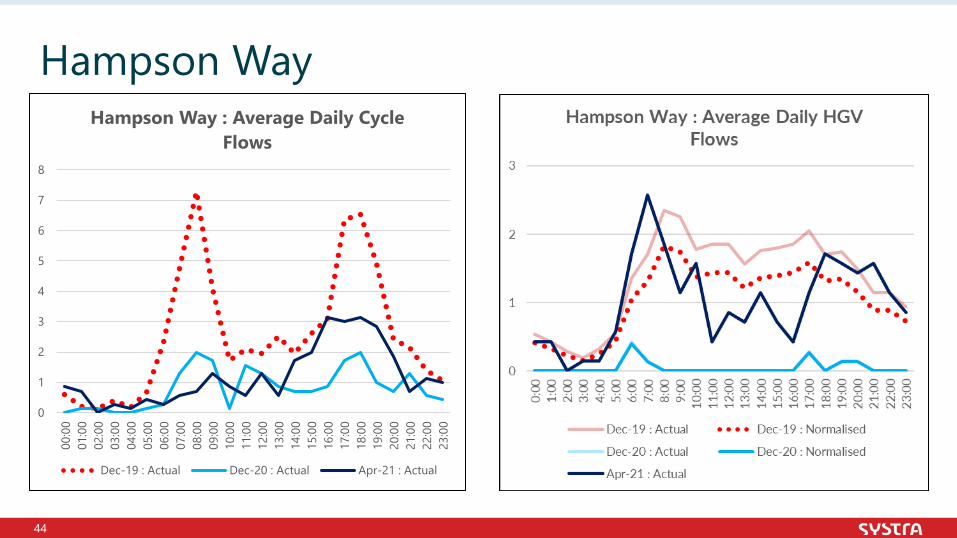
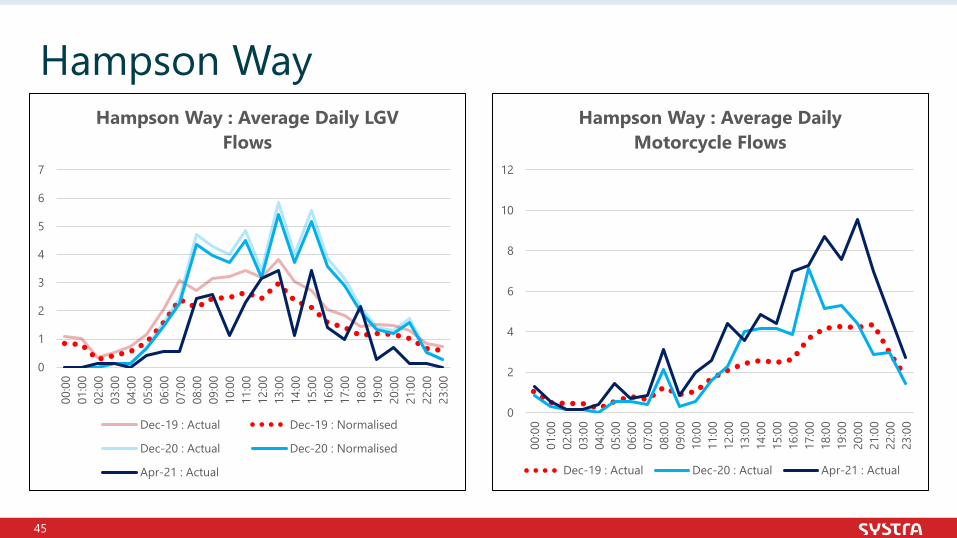
• The charts below and on the following pages show the normalised average daily flows on Hampson Way, showing the difference between pre-implementation flows collected in December 2019 and post-implementation flows from December 2020 and April 2021.
• As this site uses The Floow to derive pre-implementation data, the hour-by-hour profile of flows has been approximated using a nearby road based on the daily vehicle volumes provided by The Floow.
Hampson Way (Daily Flows)
Basemap: ESRI
0
200
400
600
800
1000
Car Pedal Cycle LGV HGV Motorcycle
Hampson Way : Average Flows by Stage
Dec-19 : Actual Dec-19 : Normalised Dec-20 : Actual Dec-20 : Normalised Apr-21 : Actual
43
Hampson Way
0
10
20
30
40
50
60
70
00:00 01:00 02:00 03:00 04:00 05:00 06:00 07:00 08:00 09:00 10:00 11:00 12:00 13:00 14:00 15:00 16:00 17:00 18:00 19:00 20:00 21:00 22:00 23:00
Hampson Way : Average Daily Car Flows
Dec-19 : Actual Dec-19 : Normalised Dec-20 : Actual Dec-20 : Normalised Apr-21 : Actual
44
Hampson Way
0
1
2
3
4
5
6
7
8
00:0
001
:00
02:0
003
:00
04:0
005
:00
06:0
007
:00
08:0
009
:00
10:0
011
:00
12:0
013
:00
14:0
015
:00
16:0
017
:00
18:0
019
:00
20:0
021
:00
22:0
023
:00
Hampson Way : Average Daily Cycle Flows
Dec-19 : Actual Dec-20 : Actual Apr-21 : Actual
45
Hampson Way
0
1
2
3
4
5
6
7
00:0
001
:00
02:0
003
:00
04:0
005
:00
06:0
007
:00
08:0
009
:00
10:0
011
:00
12:0
013
:00
14:0
015
:00
16:0
017
:00
18:0
019
:00
20:0
021
:00
22:0
023
:00
Hampson Way : Average Daily LGV Flows
Dec-19 : Actual Dec-19 : Normalised
Dec-20 : Actual Dec-20 : Normalised
Apr-21 : Actual
0
2
4
6
8
10
12
00:0
001
:00
02:0
003
:00
04:0
005
:00
06:0
007
:00
08:0
009
:00
10:0
011
:00
12:0
013
:00
14:0
015
:00
16:0
017
:00
18:0
019
:00
20:0
021
:00
22:0
023
:00
Hampson Way : Average Daily Motorcycle Flows
Dec-19 : Actual Dec-20 : Actual Apr-21 : Actual
46
Hampson Way – Summary TableD
ec-1
9 :
Act
ual
Dec
-19
: N
orm
alis
ed
Dec
-20
: A
ctua
l
Dec
-20
: N
orm
alis
ed
Dec
-19
-> D
ec-2
0 : A
ctua
l D
iffer
ence
Dec
-19
-> D
ec-2
0 : A
ctua
l %
Diff
eren
ce
Dec
-19
-> D
ec-2
0 :
Nor
mal
ised
Diff
eren
ce
Dec
-19
-> D
ec-2
0 :
Nor
mal
ised
% D
iffer
ence
Apr
-21
: A
ctua
l
Apr
-21
: N
orm
alis
ed
Dec
-19
-> A
pr-2
1 : A
ctua
l D
iffer
ence
Dec
-19
-> A
pr-2
1 : A
ctua
l %
Diff
eren
ce
Dec
-19
-> A
pr-2
1 :
Nor
mal
ised
Diff
eren
ce
Dec
-19
-> A
pr-2
1 :
Nor
mal
ised
% D
iffer
ence
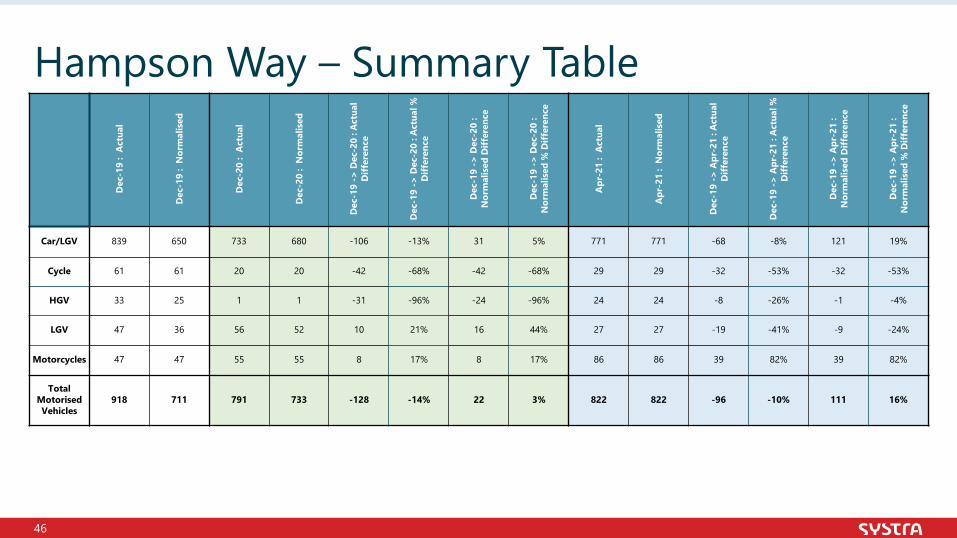
Car/LGV 839 650 733 680 -106 -13% 31 5% 771 771 -68 -8% 121 19%
Cycle 61 61 20 20 -42 -68% -42 -68% 29 29 -32 -53% -32 -53%
HGV 33 25 1 1 -31 -96% -24 -96% 24 24 -8 -26% -1 -4%
LGV 47 36 56 52 10 21% 16 44% 27 27 -19 -41% -9 -24%
Motorcycles 47 47 55 55 8 17% 8 17% 86 86 39 82% 39 82%
Total Motorised Vehicles
918 711 791 733 -128 -14% 22 3% 822 822 -96 -10% 111 16%
47
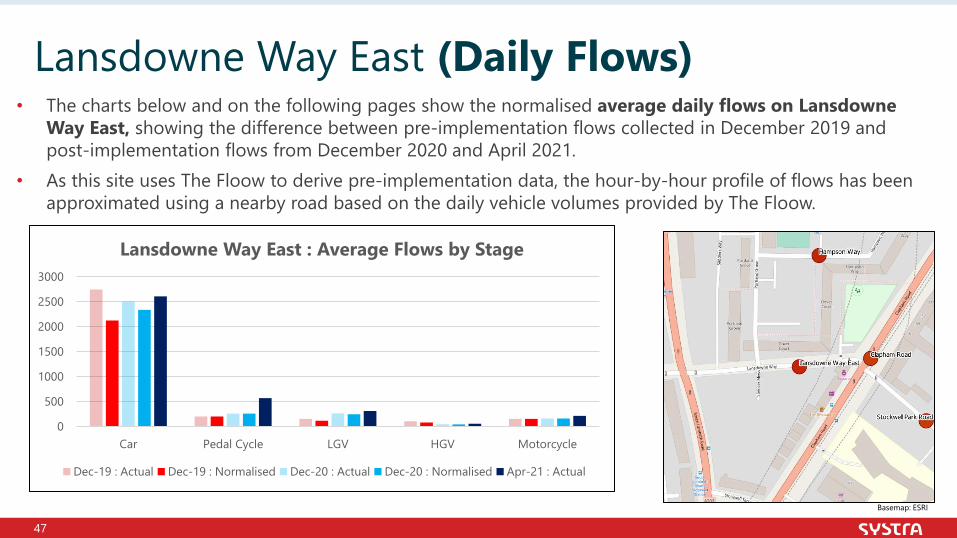
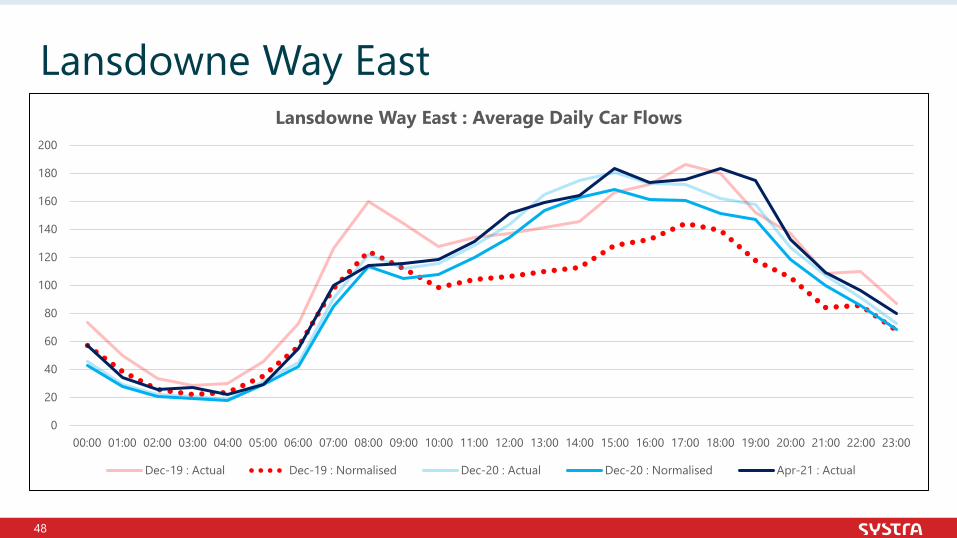
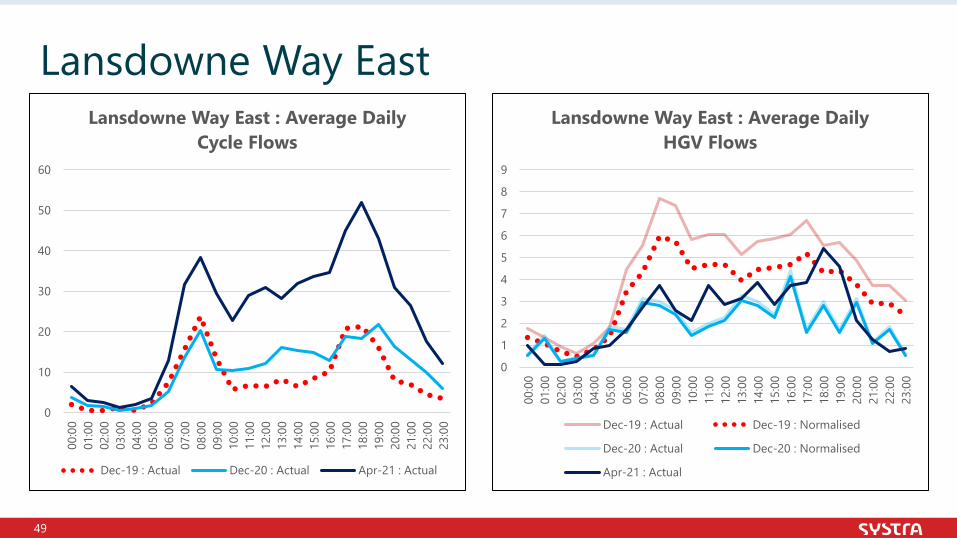
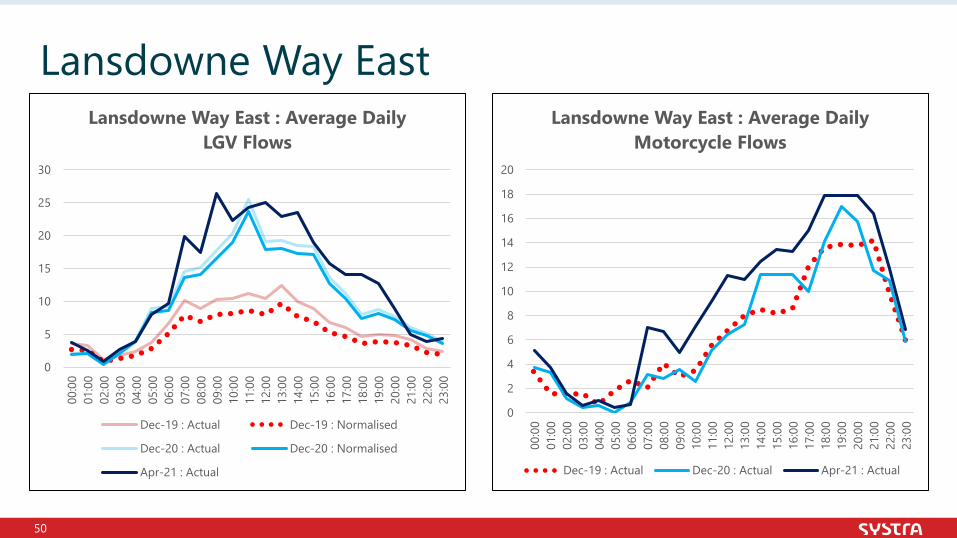
• The charts below and on the following pages show the normalised average daily flows on Lansdowne Way East, showing the difference between pre-implementation flows collected in December 2019 and post-implementation flows from December 2020 and April 2021.
• As this site uses The Floow to derive pre-implementation data, the hour-by-hour profile of flows has been approximated using a nearby road based on the daily vehicle volumes provided by The Floow.
Lansdowne Way East (Daily Flows)
Basemap: ESRI
0
500
1000
1500
2000
2500
3000
Car Pedal Cycle LGV HGV Motorcycle
Lansdowne Way East : Average Flows by Stage
Dec-19 : Actual Dec-19 : Normalised Dec-20 : Actual Dec-20 : Normalised Apr-21 : Actual
48
Lansdowne Way East
0
20
40
60
80
100
120
140
160
180
200
00:00 01:00 02:00 03:00 04:00 05:00 06:00 07:00 08:00 09:00 10:00 11:00 12:00 13:00 14:00 15:00 16:00 17:00 18:00 19:00 20:00 21:00 22:00 23:00
Lansdowne Way East : Average Daily Car Flows
Dec-19 : Actual Dec-19 : Normalised Dec-20 : Actual Dec-20 : Normalised Apr-21 : Actual
49
Lansdowne Way East
0
10
20
30
40
50
60
00:0
001
:00
02:0
003
:00
04:0
005
:00
06:0
007
:00
08:0
009
:00
10:0
011
:00
12:0
013
:00
14:0
015
:00
16:0
017
:00
18:0
019
:00
20:0
021
:00
22:0
023
:00
Lansdowne Way East : Average Daily Cycle Flows
Dec-19 : Actual Dec-20 : Actual Apr-21 : Actual
0
1
2
3
4
5
6
7
8
9
00:0
001
:00
02:0
003
:00
04:0
005
:00
06:0
007
:00
08:0
009
:00
10:0
011
:00
12:0
013
:00
14:0
015
:00
16:0
017
:00
18:0
019
:00
20:0
021
:00
22:0
023
:00
Lansdowne Way East : Average Daily HGV Flows
Dec-19 : Actual Dec-19 : Normalised
Dec-20 : Actual Dec-20 : Normalised
Apr-21 : Actual
50
Lansdowne Way East
0
5
10
15
20
25
30
00:0
001
:00
02:0
003
:00
04:0
005
:00
06:0
007
:00
08:0
009
:00
10:0
011
:00
12:0
013
:00
14:0
015
:00
16:0
017
:00
18:0
019
:00
20:0
021
:00
22:0
023
:00
Lansdowne Way East : Average Daily LGV Flows
Dec-19 : Actual Dec-19 : Normalised
Dec-20 : Actual Dec-20 : Normalised
Apr-21 : Actual
0
2
4
6
8
10
12
14
16
18
20
00:0
001
:00
02:0
003
:00
04:0
005
:00
06:0
007
:00
08:0
009
:00
10:0
011
:00
12:0
013
:00
14:0
015
:00
16:0
017
:00
18:0
019
:00
20:0
021
:00
22:0
023
:00
Lansdowne Way East : Average Daily Motorcycle Flows
Dec-19 : Actual Dec-20 : Actual Apr-21 : Actual
51
Lansdowne Way East – Summary TableD
ec-1
9 :
Act
ual
Dec
-19
: N
orm
alis
ed
Dec
-20
: A
ctua
l
Dec
-20
: N
orm
alis
ed
Dec
-19
-> D
ec-2
0 : A
ctua
l D
iffer
ence
Dec
-19
-> D
ec-2
0 : A
ctua
l %
Diff
eren
ce
Dec
-19
-> D
ec-2
0 :
Nor
mal
ised
Diff
eren
ce
Dec
-19
-> D
ec-2
0 :
Nor
mal
ised
% D
iffer
ence
Apr
-21
: A
ctua
l
Apr
-21
: N
orm
alis
ed
Dec
-19
-> A
pr-2
1 : A
ctua
l D
iffer
ence
Dec
-19
-> A
pr-2
1 : A
ctua
l %
Diff
eren
ce
Dec
-19
-> A
pr-2
1 :
Nor
mal
ised
Diff
eren
ce
Dec
-19
-> A
pr-2
1 :
Nor
mal
ised
% D
iffer
ence
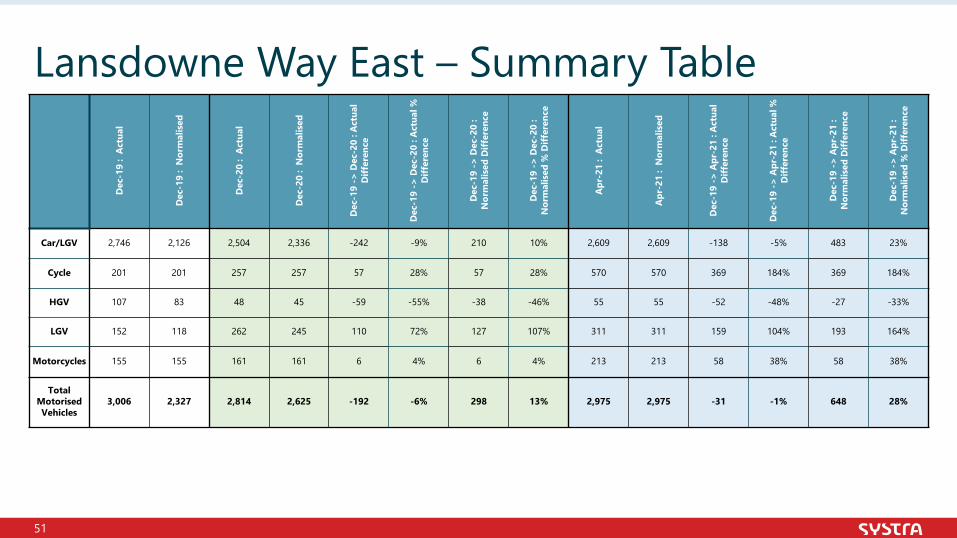
Car/LGV 2,746 2,126 2,504 2,336 -242 -9% 210 10% 2,609 2,609 -138 -5% 483 23%
Cycle 201 201 257 257 57 28% 57 28% 570 570 369 184% 369 184%
HGV 107 83 48 45 -59 -55% -38 -46% 55 55 -52 -48% -27 -33%
LGV 152 118 262 245 110 72% 127 107% 311 311 159 104% 193 164%
Motorcycles 155 155 161 161 6 4% 6 4% 213 213 58 38% 58 38%
Total Motorised Vehicles
3,006 2,327 2,814 2,625 -192 -6% 298 13% 2,975 2,975 -31 -1% 648 28%
52
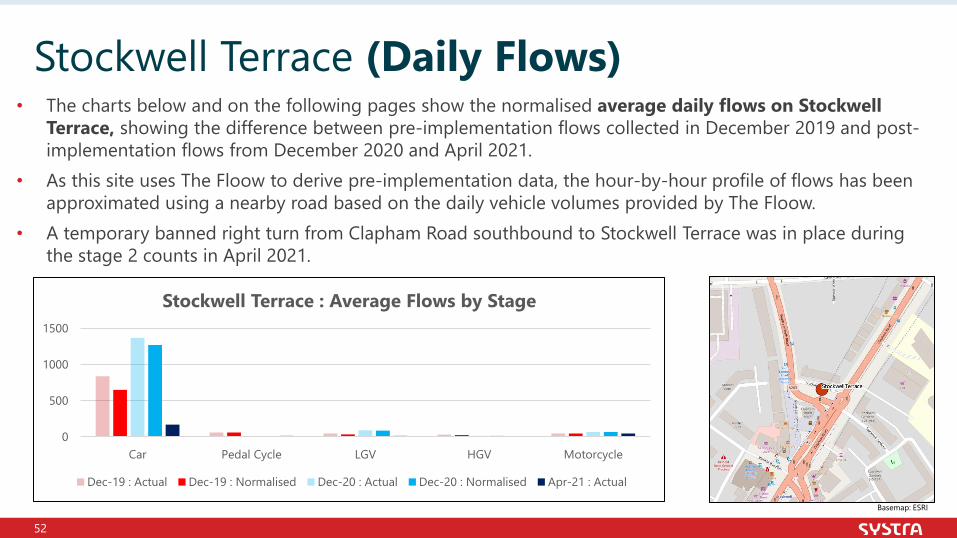
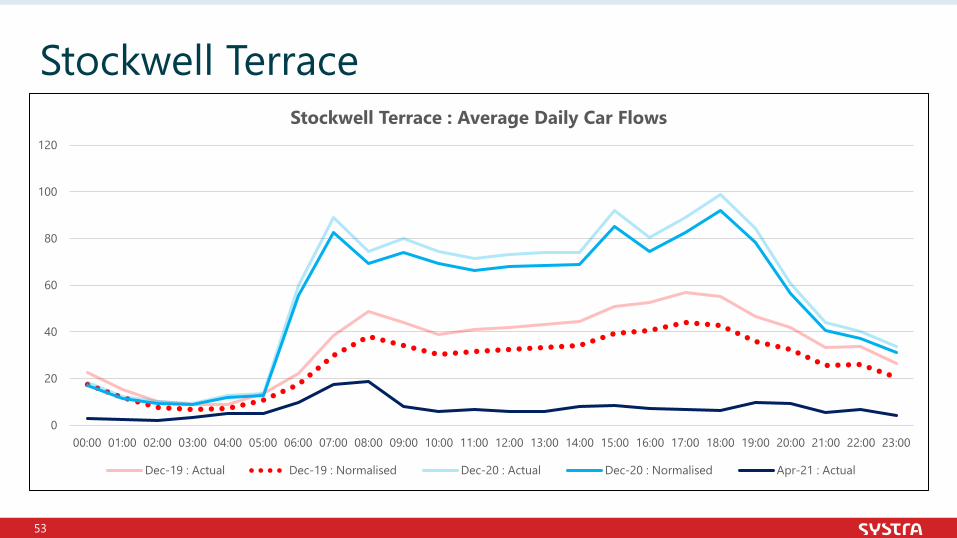
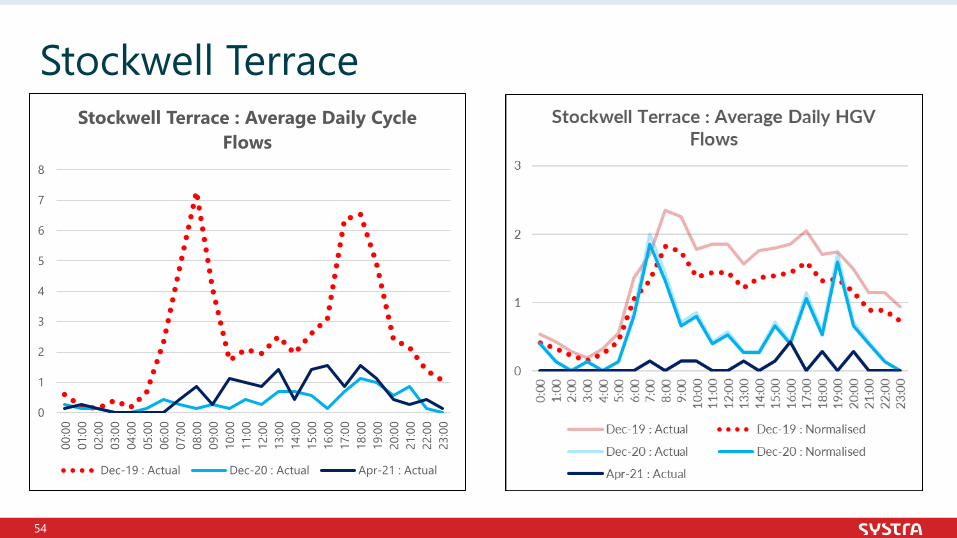
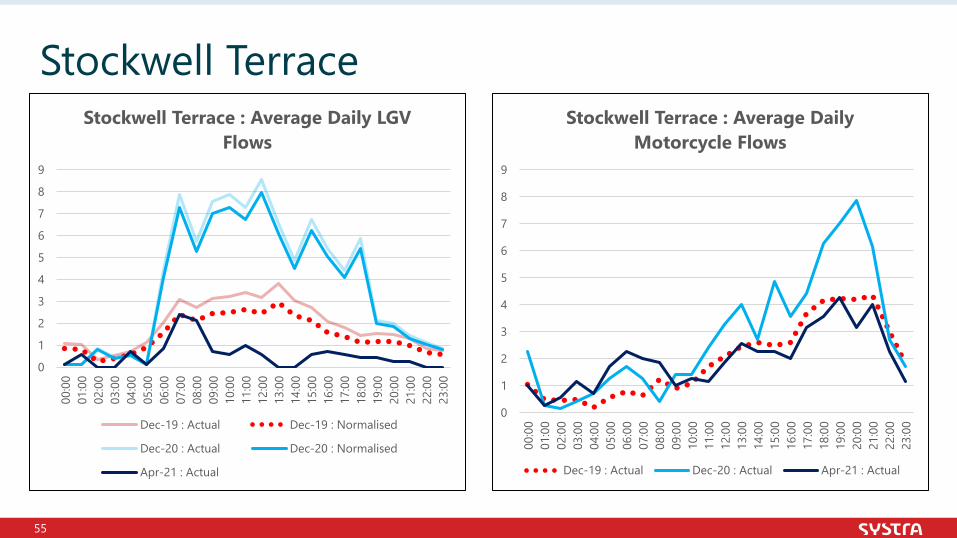
• The charts below and on the following pages show the normalised average daily flows on Stockwell Terrace, showing the difference between pre-implementation flows collected in December 2019 and post-implementation flows from December 2020 and April 2021.
• As this site uses The Floow to derive pre-implementation data, the hour-by-hour profile of flows has been approximated using a nearby road based on the daily vehicle volumes provided by The Floow.
• A temporary banned right turn from Clapham Road southbound to Stockwell Terrace was in place during the stage 2 counts in April 2021.
Stockwell Terrace (Daily Flows)
Basemap: ESRI
0
500
1000
1500
Car Pedal Cycle LGV HGV Motorcycle
Stockwell Terrace : Average Flows by Stage
Dec-19 : Actual Dec-19 : Normalised Dec-20 : Actual Dec-20 : Normalised Apr-21 : Actual
53
Stockwell Terrace
0
20
40
60
80
100
120
00:00 01:00 02:00 03:00 04:00 05:00 06:00 07:00 08:00 09:00 10:00 11:00 12:00 13:00 14:00 15:00 16:00 17:00 18:00 19:00 20:00 21:00 22:00 23:00
Stockwell Terrace : Average Daily Car Flows
Dec-19 : Actual Dec-19 : Normalised Dec-20 : Actual Dec-20 : Normalised Apr-21 : Actual
54
Stockwell Terrace
0
1
2
3
4
5
6
7
8
00:0
001
:00
02:0
003
:00
04:0
005
:00
06:0
007
:00
08:0
009
:00
10:0
011
:00
12:0
013
:00
14:0
015
:00
16:0
017
:00
18:0
019
:00
20:0
021
:00
22:0
023
:00
Stockwell Terrace : Average Daily Cycle Flows
Dec-19 : Actual Dec-20 : Actual Apr-21 : Actual
55
Stockwell Terrace
0
1
2
3
4
5
6
7
8
9
00:0
001
:00
02:0
003
:00
04:0
005
:00
06:0
007
:00
08:0
009
:00
10:0
011
:00
12:0
013
:00
14:0
015
:00
16:0
017
:00
18:0
019
:00
20:0
021
:00
22:0
023
:00
Stockwell Terrace : Average Daily LGV Flows
Dec-19 : Actual Dec-19 : Normalised
Dec-20 : Actual Dec-20 : Normalised
Apr-21 : Actual
0
1
2
3
4
5
6
7
8
9
00:0
001
:00
02:0
003
:00
04:0
005
:00
06:0
007
:00
08:0
009
:00
10:0
011
:00
12:0
013
:00
14:0
015
:00
16:0
017
:00
18:0
019
:00
20:0
021
:00
22:0
023
:00
Stockwell Terrace : Average Daily Motorcycle Flows
Dec-19 : Actual Dec-20 : Actual Apr-21 : Actual
56
Stockwell Terrace – Summary TableD
ec-1
9 :
Act
ual
Dec
-19
: N
orm
alis
ed
Dec
-20
: A
ctua
l
Dec
-20
: N
orm
alis
ed
Dec
-19
-> D
ec-2
0 : A
ctua
l D
iffer
ence
Dec
-19
-> D
ec-2
0 : A
ctua
l %
Diff
eren
ce
Dec
-19
-> D
ec-2
0 :
Nor
mal
ised
Diff
eren
ce
Dec
-19
-> D
ec-2
0 :
Nor
mal
ised
% D
iffer
ence
Apr
-21
: A
ctua
l
Apr
-21
: N
orm
alis
ed
Dec
-19
-> A
pr-2
1 : A
ctua
l D
iffer
ence
Dec
-19
-> A
pr-2
1 : A
ctua
l %
Diff
eren
ce
Dec
-19
-> A
pr-2
1 :
Nor
mal
ised
Diff
eren
ce
Dec
-19
-> A
pr-2
1 :
Nor
mal
ised
% D
iffer
ence
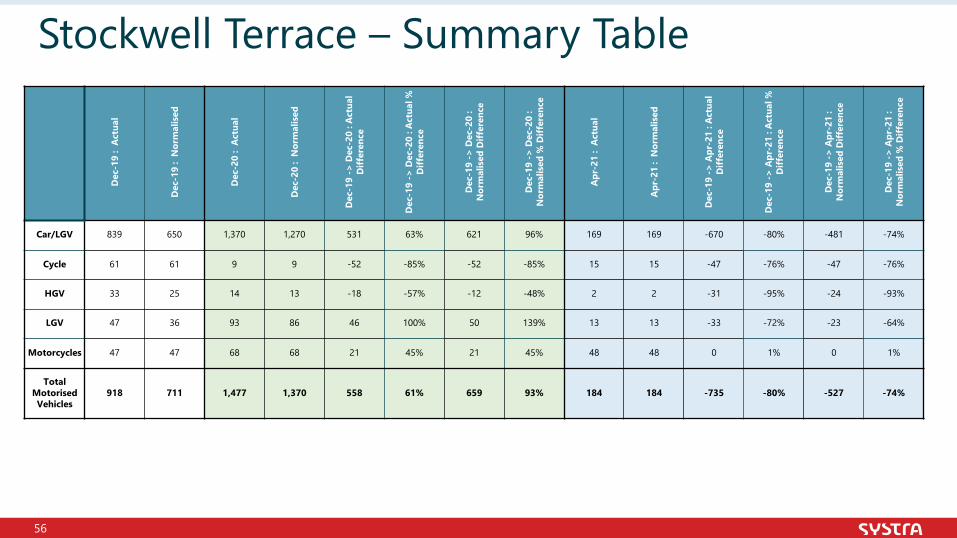
Car/LGV 839 650 1,370 1,270 531 63% 621 96% 169 169 -670 -80% -481 -74%
Cycle 61 61 9 9 -52 -85% -52 -85% 15 15 -47 -76% -47 -76%
HGV 33 25 14 13 -18 -57% -12 -48% 2 2 -31 -95% -24 -93%
LGV 47 36 93 86 46 100% 50 139% 13 13 -33 -72% -23 -64%
Motorcycles 47 47 68 68 21 45% 21 45% 48 48 0 1% 0 1%
Total Motorised Vehicles
918 711 1,477 1,370 558 61% 659 93% 184 184 -735 -80% -527 -74%
57
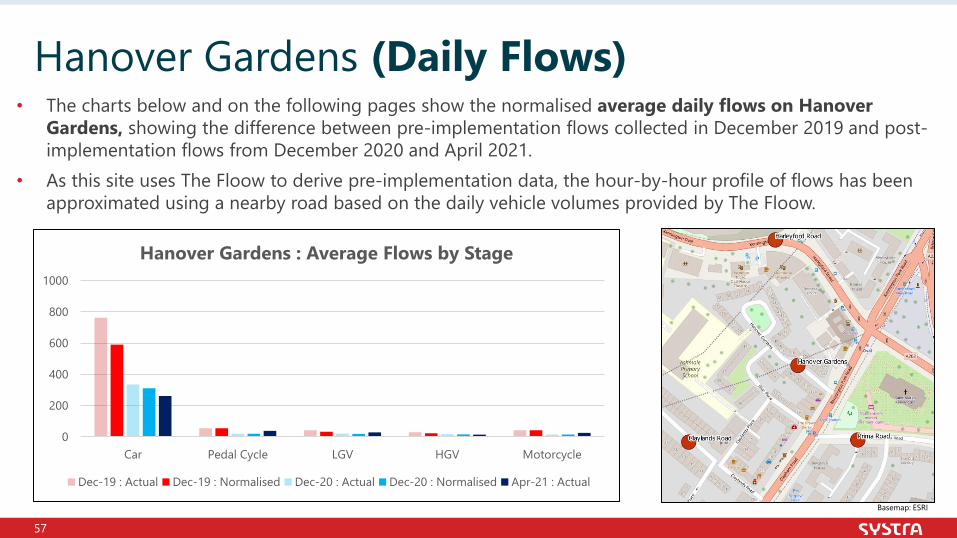
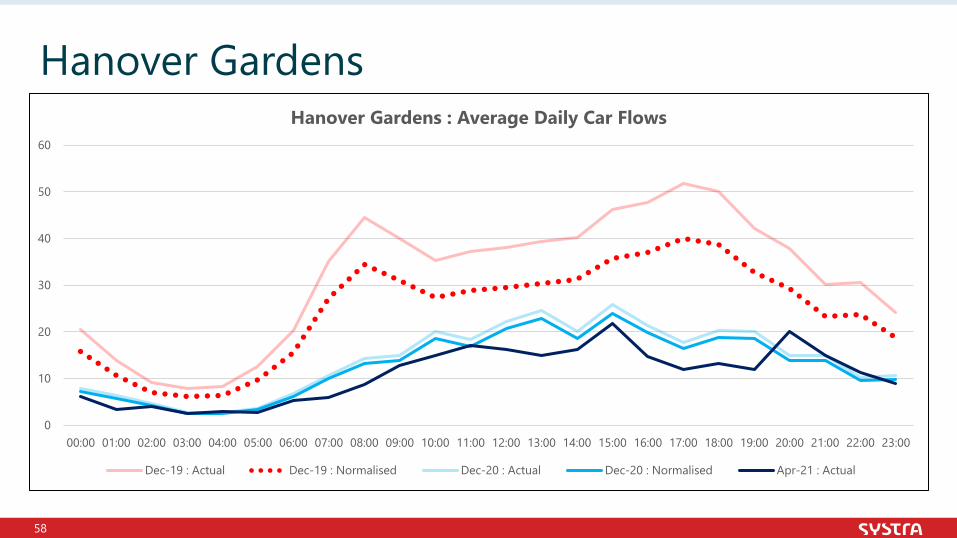
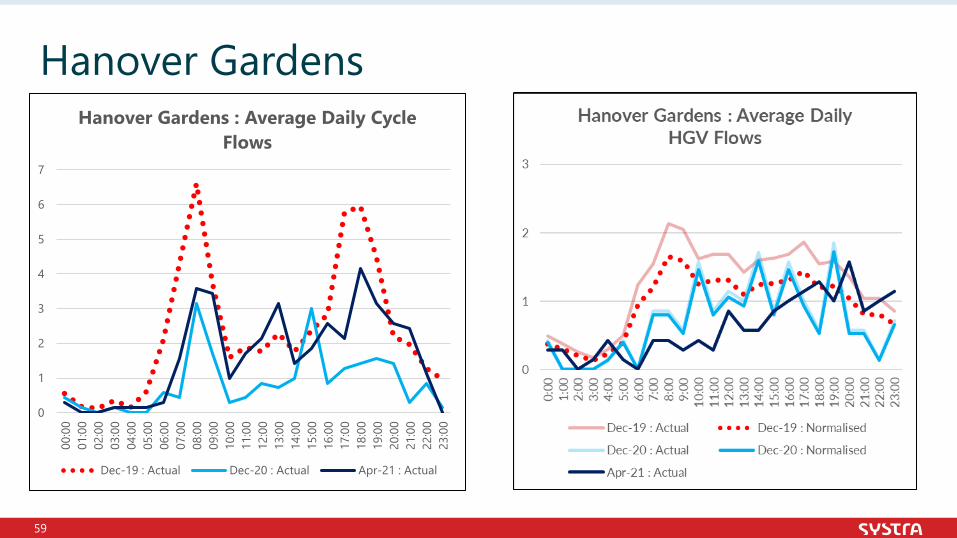
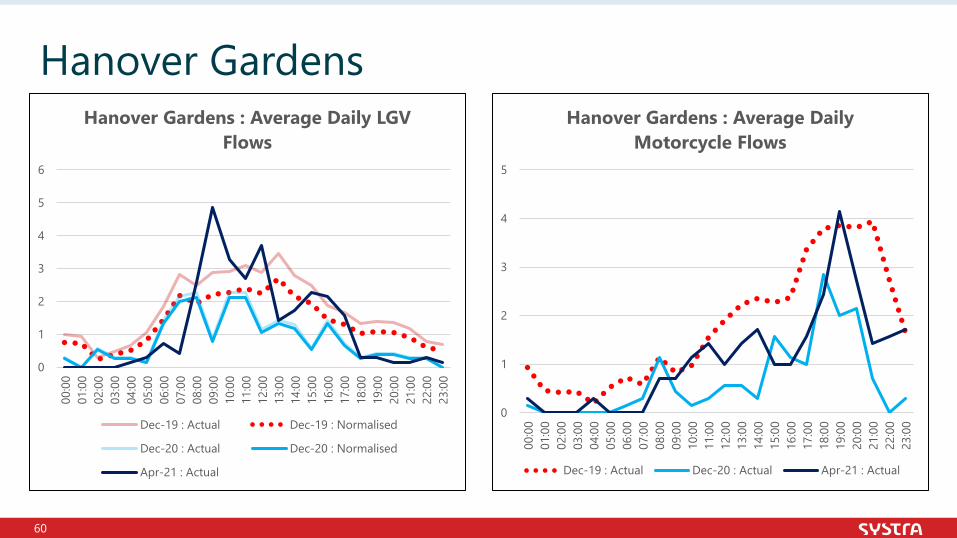
• The charts below and on the following pages show the normalised average daily flows on Hanover Gardens, showing the difference between pre-implementation flows collected in December 2019 and post-implementation flows from December 2020 and April 2021.
• As this site uses The Floow to derive pre-implementation data, the hour-by-hour profile of flows has been approximated using a nearby road based on the daily vehicle volumes provided by The Floow.
Hanover Gardens (Daily Flows)
Basemap: ESRI
0
200
400
600
800
1000
Car Pedal Cycle LGV HGV Motorcycle
Hanover Gardens : Average Flows by Stage
Dec-19 : Actual Dec-19 : Normalised Dec-20 : Actual Dec-20 : Normalised Apr-21 : Actual
58
Hanover Gardens
0
10
20
30
40
50
60
00:00 01:00 02:00 03:00 04:00 05:00 06:00 07:00 08:00 09:00 10:00 11:00 12:00 13:00 14:00 15:00 16:00 17:00 18:00 19:00 20:00 21:00 22:00 23:00
Hanover Gardens : Average Daily Car Flows
Dec-19 : Actual Dec-19 : Normalised Dec-20 : Actual Dec-20 : Normalised Apr-21 : Actual
59
Hanover Gardens
0
1
2
3
4
5
6
7
00:0
001
:00
02:0
003
:00
04:0
005
:00
06:0
007
:00
08:0
009
:00
10:0
011
:00
12:0
013
:00
14:0
015
:00
16:0
017
:00
18:0
019
:00
20:0
021
:00
22:0
023
:00
Hanover Gardens : Average Daily Cycle Flows
Dec-19 : Actual Dec-20 : Actual Apr-21 : Actual
60
Hanover Gardens
0
1
2
3
4
5
6
00:0
001
:00
02:0
003
:00
04:0
005
:00
06:0
007
:00
08:0
009
:00
10:0
011
:00
12:0
013
:00
14:0
015
:00
16:0
017
:00
18:0
019
:00
20:0
021
:00
22:0
023
:00
Hanover Gardens : Average Daily LGV Flows
Dec-19 : Actual Dec-19 : Normalised
Dec-20 : Actual Dec-20 : Normalised
Apr-21 : Actual
0
1
2
3
4
5
00:0
001
:00
02:0
003
:00
04:0
005
:00
06:0
007
:00
08:0
009
:00
10:0
011
:00
12:0
013
:00
14:0
015
:00
16:0
017
:00
18:0
019
:00
20:0
021
:00
22:0
023
:00
Hanover Gardens : Average Daily Motorcycle Flows
Dec-19 : Actual Dec-20 : Actual Apr-21 : Actual
61
Hanover Gardens – Summary TableD
ec-1
9 :
Act
ual
Dec
-19
: N
orm
alis
ed
Dec
-20
: A
ctua
l
Dec
-20
: N
orm
alis
ed
Dec
-19
-> D
ec-2
0 : A
ctua
l D
iffer
ence
Dec
-19
-> D
ec-2
0 : A
ctua
l %
Diff
eren
ce
Dec
-19
-> D
ec-2
0 :
Nor
mal
ised
Diff
eren
ce
Dec
-19
-> D
ec-2
0 :
Nor
mal
ised
% D
iffer
ence
Apr
-21
: A
ctua
l
Apr
-21
: N
orm
alis
ed
Dec
-19
-> A
pr-2
1 : A
ctua
l D
iffer
ence
Dec
-19
-> A
pr-2
1 : A
ctua
l %
Diff
eren
ce
Dec
-19
-> A
pr-2
1 :
Nor
mal
ised
Diff
eren
ce
Dec
-19
-> A
pr-2
1 :
Nor
mal
ised
% D
iffer
ence
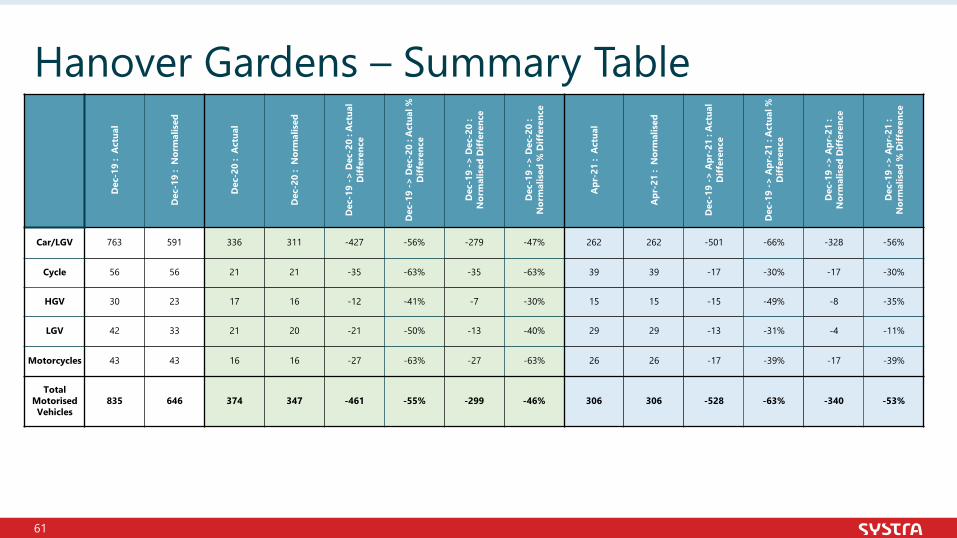
Car/LGV 763 591 336 311 -427 -56% -279 -47% 262 262 -501 -66% -328 -56%
Cycle 56 56 21 21 -35 -63% -35 -63% 39 39 -17 -30% -17 -30%
HGV 30 23 17 16 -12 -41% -7 -30% 15 15 -15 -49% -8 -35%
LGV 42 33 21 20 -21 -50% -13 -40% 29 29 -13 -31% -4 -11%
Motorcycles 43 43 16 16 -27 -63% -27 -63% 26 26 -17 -39% -17 -39%
Total Motorised Vehicles
835 646 374 347 -461 -55% -299 -46% 306 306 -528 -63% -340 -53%
62
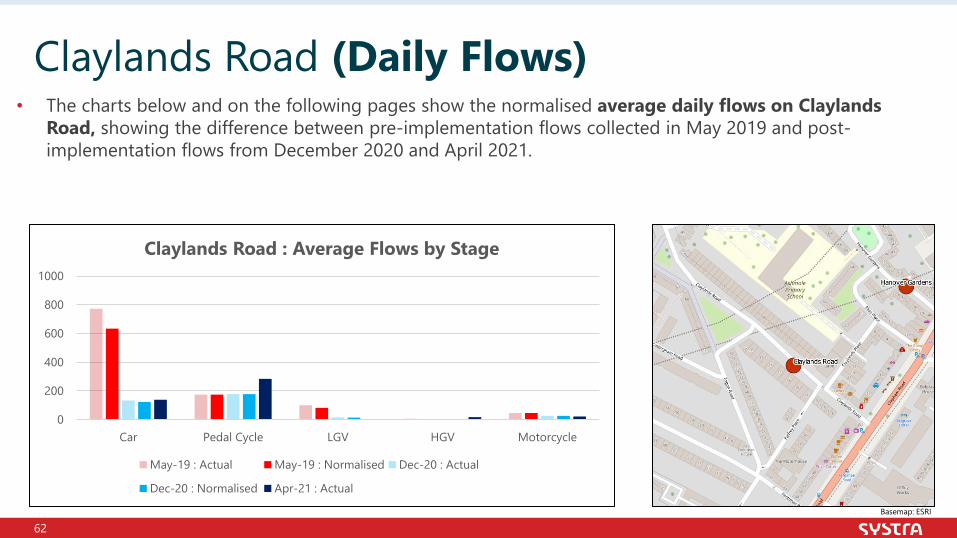
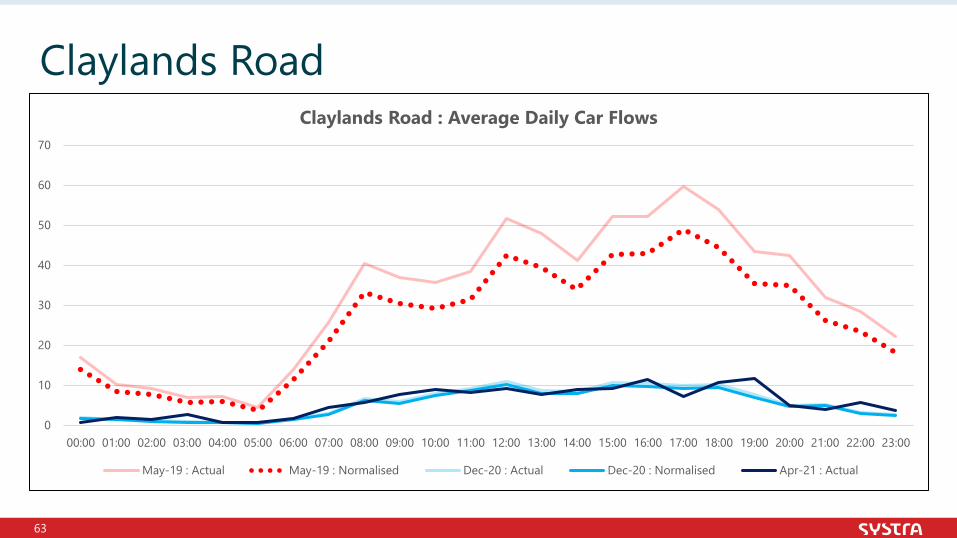
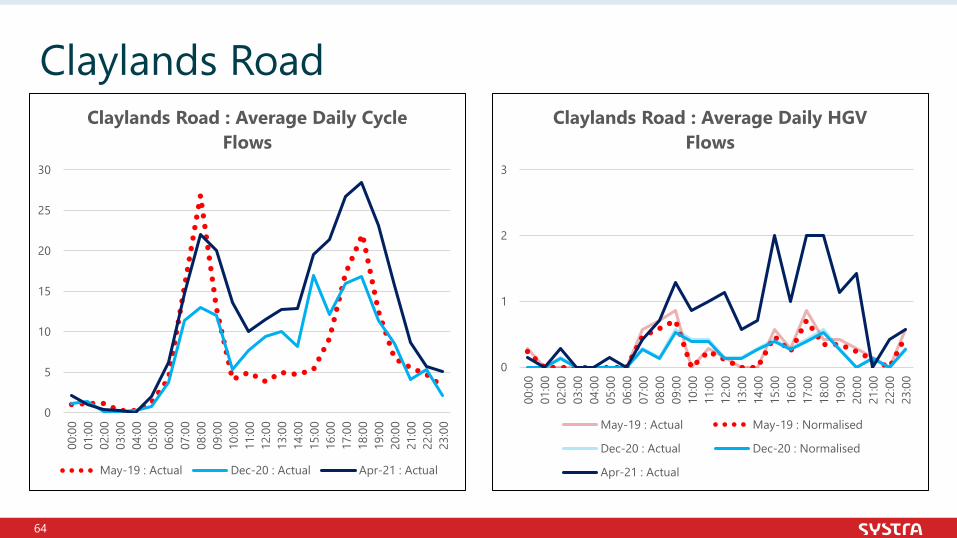
• The charts below and on the following pages show the normalised average daily flows on ClaylandsRoad, showing the difference between pre-implementation flows collected in May 2019 and post-implementation flows from December 2020 and April 2021.
Claylands Road (Daily Flows)
Basemap: ESRI
0
200
400
600
800
1000
Car Pedal Cycle LGV HGV Motorcycle
Claylands Road : Average Flows by Stage
May-19 : Actual May-19 : Normalised Dec-20 : Actual
Dec-20 : Normalised Apr-21 : Actual
63
Claylands Road
0
10
20
30
40
50
60
70
00:00 01:00 02:00 03:00 04:00 05:00 06:00 07:00 08:00 09:00 10:00 11:00 12:00 13:00 14:00 15:00 16:00 17:00 18:00 19:00 20:00 21:00 22:00 23:00
Claylands Road : Average Daily Car Flows
May-19 : Actual May-19 : Normalised Dec-20 : Actual Dec-20 : Normalised Apr-21 : Actual
64
Claylands Road
0
5
10
15
20
25
30
00:0
001
:00
02:0
003
:00
04:0
005
:00
06:0
007
:00
08:0
009
:00
10:0
011
:00
12:0
013
:00
14:0
015
:00
16:0
017
:00
18:0
019
:00
20:0
021
:00
22:0
023
:00
Claylands Road : Average Daily Cycle Flows
May-19 : Actual Dec-20 : Actual Apr-21 : Actual
0
1
2
3
00:0
001
:00
02:0
003
:00
04:0
005
:00
06:0
007
:00
08:0
009
:00
10:0
011
:00
12:0
013
:00
14:0
015
:00
16:0
017
:00
18:0
019
:00
20:0
021
:00
22:0
023
:00
Claylands Road : Average Daily HGV Flows
May-19 : Actual May-19 : Normalised
Dec-20 : Actual Dec-20 : Normalised
Apr-21 : Actual
65
Claylands Road
0
2
4
6
8
10
12
00:0
001
:00
02:0
003
:00
04:0
005
:00
06:0
007
:00
08:0
009
:00
10:0
011
:00
12:0
013
:00
14:0
015
:00
16:0
017
:00
18:0
019
:00
20:0
021
:00
22:0
023
:00
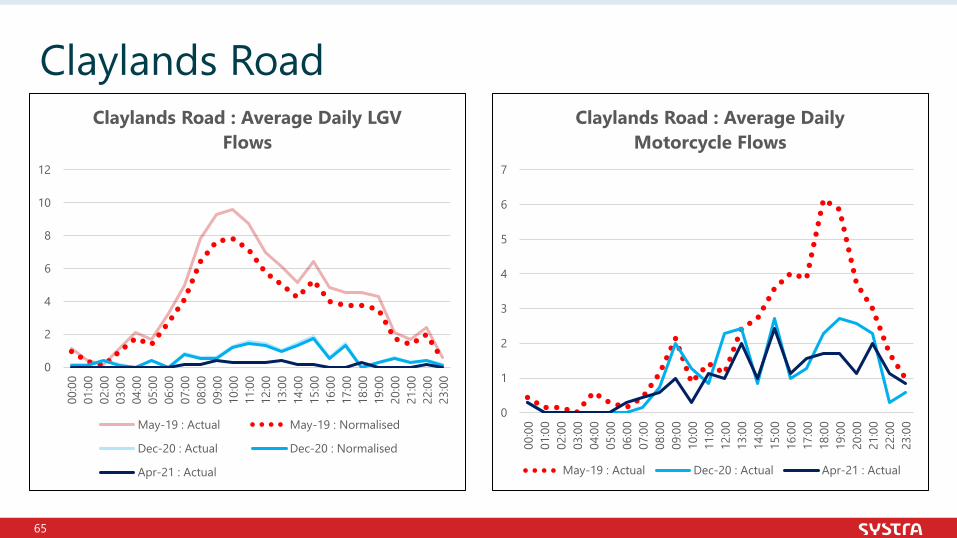
Claylands Road : Average Daily LGV Flows
May-19 : Actual May-19 : Normalised
Dec-20 : Actual Dec-20 : Normalised
Apr-21 : Actual
0
1
2
3
4
5
6
7
00:0
001
:00
02:0
003
:00
04:0
005
:00
06:0
007
:00
08:0
009
:00
10:0
011
:00
12:0
013
:00
14:0
015
:00
16:0
017
:00
18:0
019
:00
20:0
021
:00
22:0
023
:00
Claylands Road : Average Daily Motorcycle Flows
May-19 : Actual Dec-20 : Actual Apr-21 : Actual
66
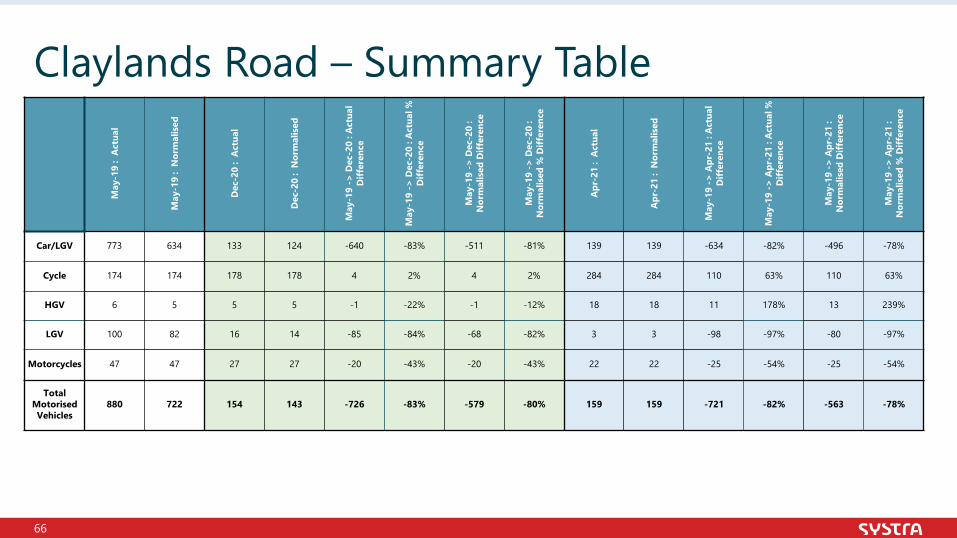
Claylands Road – Summary TableM
ay-1
9 :
Act
ual
May
-19
: N
orm
alis
ed
Dec
-20
: A
ctua
l
Dec
-20
: N
orm
alis
ed
May
-19
-> D
ec-2
0 : A
ctua
l D
iffer
ence
May
-19
-> D
ec-2
0 : A
ctua
l %
Diff
eren
ce
May
-19
-> D
ec-2
0 :
Nor
mal
ised
Diff
eren
ce
May
-19
-> D
ec-2
0 :
Nor
mal
ised
% D
iffer
ence
Apr
-21
: A
ctua
l
Apr
-21
: N
orm
alis
ed
May
-19
-> A
pr-2
1 : A
ctua
l D
iffer
ence
May
-19
-> A
pr-2
1 : A
ctua
l %
Diff
eren
ce
May
-19
-> A
pr-2
1 :
Nor
mal
ised
Diff
eren
ce
May
-19
-> A
pr-2
1 :
Nor
mal
ised
% D
iffer
ence
Car/LGV 773 634 133 124 -640 -83% -511 -81% 139 139 -634 -82% -496 -78%
Cycle 174 174 178 178 4 2% 4 2% 284 284 110 63% 110 63%
HGV 6 5 5 5 -1 -22% -1 -12% 18 18 11 178% 13 239%
LGV 100 82 16 14 -85 -84% -68 -82% 3 3 -98 -97% -80 -97%
Motorcycles 47 47 27 27 -20 -43% -20 -43% 22 22 -25 -54% -25 -54%
Total Motorised Vehicles
880 722 154 143 -726 -83% -579 -80% 159 159 -721 -82% -563 -78%
67
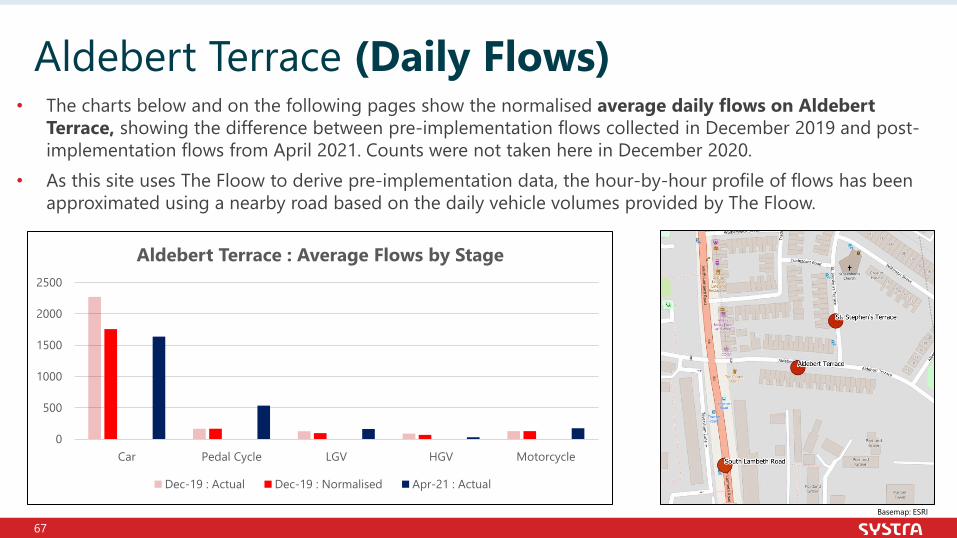
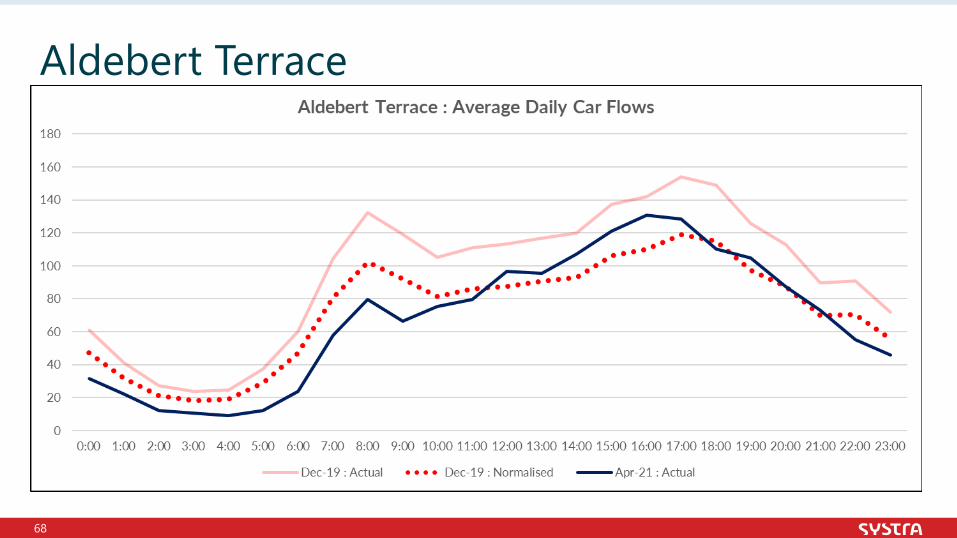
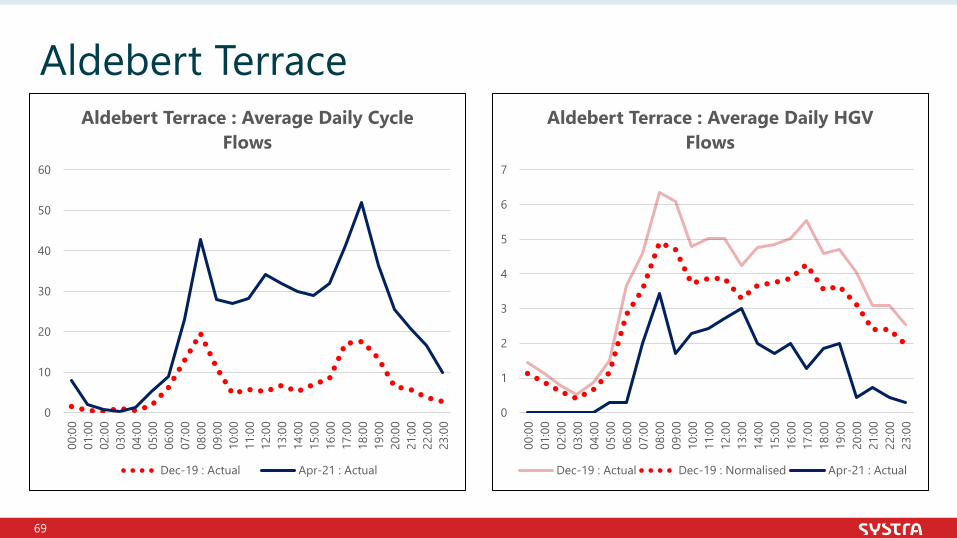
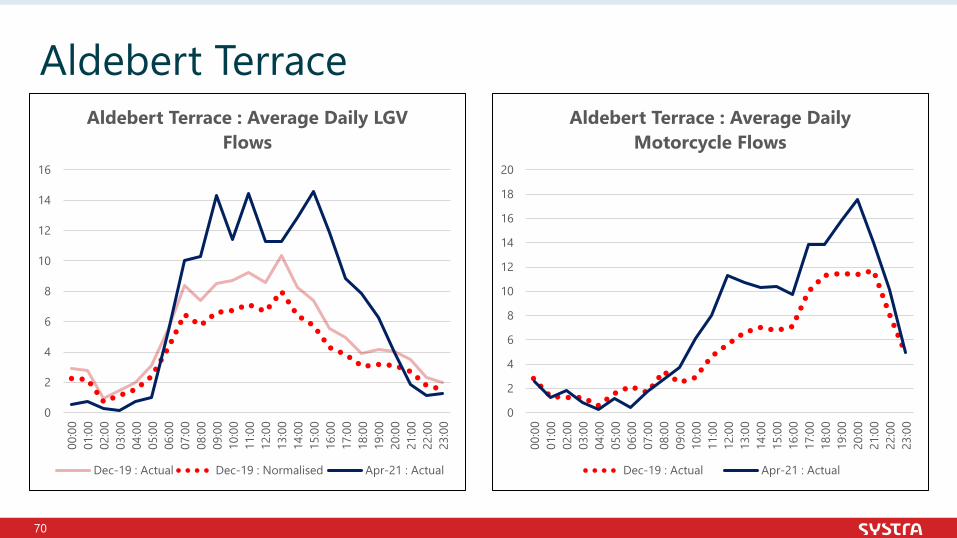
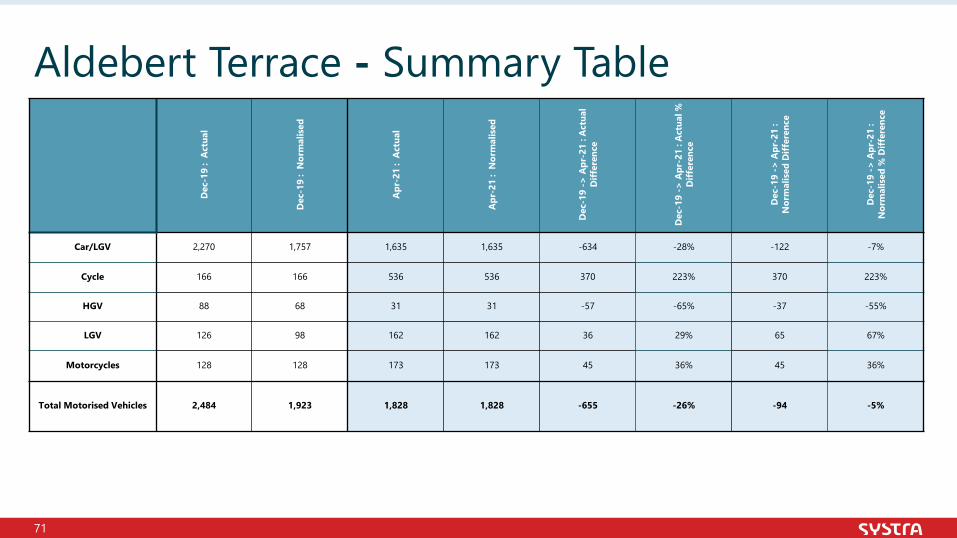
• The charts below and on the following pages show the normalised average daily flows on AldebertTerrace, showing the difference between pre-implementation flows collected in December 2019 and post-implementation flows from April 2021. Counts were not taken here in December 2020.
• As this site uses The Floow to derive pre-implementation data, the hour-by-hour profile of flows has been approximated using a nearby road based on the daily vehicle volumes provided by The Floow.
Aldebert Terrace (Daily Flows)
Basemap: ESRI
0
500
1000
1500
2000
2500
Car Pedal Cycle LGV HGV Motorcycle
Aldebert Terrace : Average Flows by Stage
Dec-19 : Actual Dec-19 : Normalised Apr-21 : Actual
68
Aldebert Terrace
69
Aldebert Terrace
0
10
20
30
40
50
60
00:0
001
:00
02:0
003
:00
04:0
005
:00
06:0
007
:00
08:0
009
:00
10:0
011
:00
12:0
013
:00
14:0
015
:00
16:0
017
:00
18:0
019
:00
20:0
021
:00
22:0
023
:00
Aldebert Terrace : Average Daily Cycle Flows
Dec-19 : Actual Apr-21 : Actual
0
1
2
3
4
5
6
7
00:0
001
:00
02:0
003
:00
04:0
005
:00
06:0
007
:00
08:0
009
:00
10:0
011
:00
12:0
013
:00
14:0
015
:00
16:0
017
:00
18:0
019
:00
20:0
021
:00
22:0
023
:00
Aldebert Terrace : Average Daily HGV Flows
Dec-19 : Actual Dec-19 : Normalised Apr-21 : Actual
70
Aldebert Terrace
0
2
4
6
8
10
12
14
16
00:0
001
:00
02:0
003
:00
04:0
005
:00
06:0
007
:00
08:0
009
:00
10:0
011
:00
12:0
013
:00
14:0
015
:00
16:0
017
:00
18:0
019
:00
20:0
021
:00
22:0
023
:00
Aldebert Terrace : Average Daily LGV Flows
Dec-19 : Actual Dec-19 : Normalised Apr-21 : Actual
0
2
4
6
8
10
12
14
16
18
20
00:0
001
:00
02:0
003
:00
04:0
005
:00
06:0
007
:00
08:0
009
:00
10:0
011
:00
12:0
013
:00
14:0
015
:00
16:0
017
:00
18:0
019
:00
20:0
021
:00
22:0
023
:00
Aldebert Terrace : Average Daily Motorcycle Flows
Dec-19 : Actual Apr-21 : Actual
71
Aldebert Terrace - Summary Table
Dec
-19
: A
ctua
l
Dec
-19
: N
orm
alis
ed
Apr
-21
: A
ctua
l
Apr
-21
: N
orm
alis
ed
Dec
-19
-> A
pr-2
1 : A
ctua
l D
iffer
ence
Dec
-19
-> A
pr-2
1 : A
ctua
l %
Diff
eren
ce
Dec
-19
-> A
pr-2
1 :
Nor
mal
ised
Diff
eren
ce
Dec
-19
-> A
pr-2
1 :
Nor
mal
ised
% D
iffer
ence
Car/LGV 2,270 1,757 1,635 1,635 -634 -28% -122 -7%
Cycle 166 166 536 536 370 223% 370 223%
HGV 88 68 31 31 -57 -65% -37 -55%
LGV 126 98 162 162 36 29% 65 67%
Motorcycles 128 128 173 173 45 36% 45 36%
Total Motorised Vehicles 2,484 1,923 1,828 1,828 -655 -26% -94 -5%
72
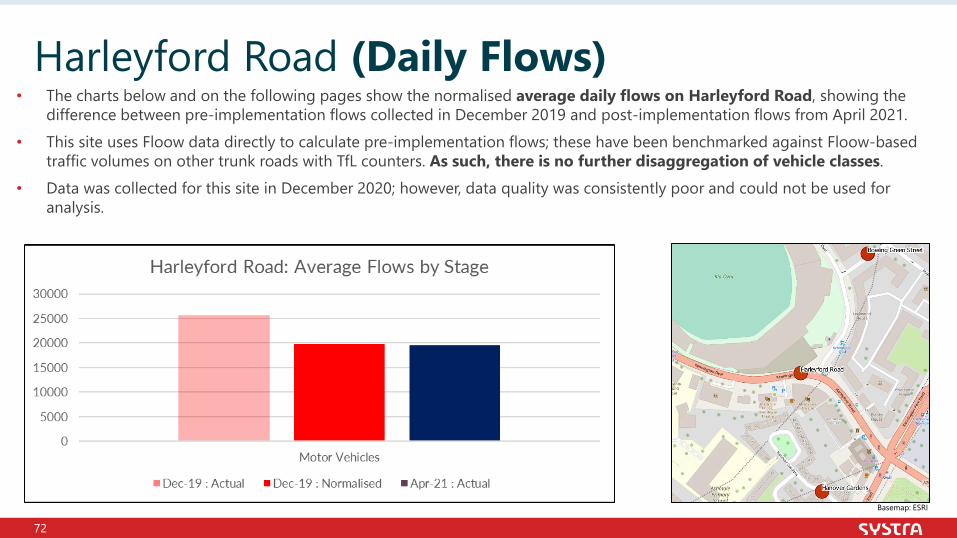
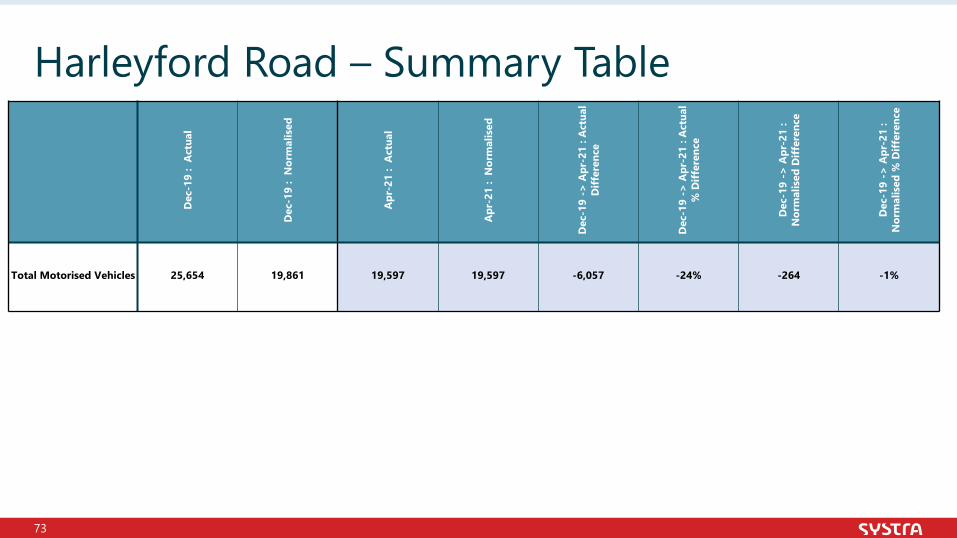
• The charts below and on the following pages show the normalised average daily flows on Harleyford Road, showing the difference between pre-implementation flows collected in December 2019 and post-implementation flows from April 2021.
• This site uses Floow data directly to calculate pre-implementation flows; these have been benchmarked against Floow-based traffic volumes on other trunk roads with TfL counters. As such, there is no further disaggregation of vehicle classes.
• Data was collected for this site in December 2020; however, data quality was consistently poor and could not be used for analysis.
Harleyford Road (Daily Flows)
Basemap: ESRI
73
Harleyford Road – Summary Table
Dec
-19
: A
ctua
l
Dec
-19
: N
orm
alis
ed
Apr
-21
: A
ctua
l
Apr
-21
: N
orm
alis
ed
Dec
-19
-> A
pr-2
1 : A
ctua
l D
iffer
ence
Dec
-19
-> A
pr-2
1 : A
ctua
l %
Diff
eren
ce
Dec
-19
-> A
pr-2
1 :
Nor
mal
ised
Diff
eren
ce
Dec
-19
-> A
pr-2
1 :
Nor
mal
ised
% D
iffer
ence
Total Motorised Vehicles 25,654 19,861 19,597 19,597 -6,057 -24% -264 -1%
74
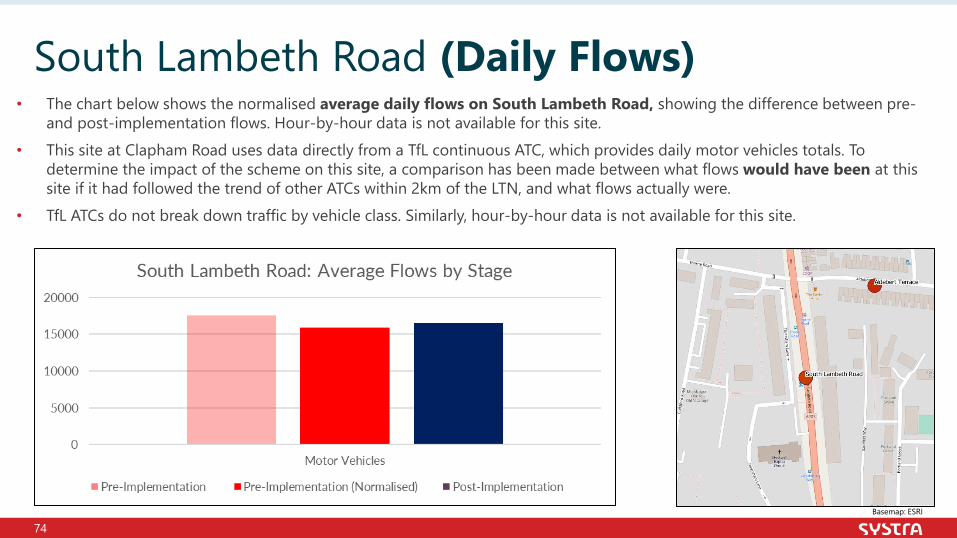
South Lambeth Road (Daily Flows)• The chart below shows the normalised average daily flows on South Lambeth Road, showing the difference between pre-
and post-implementation flows. Hour-by-hour data is not available for this site.• This site at Clapham Road uses data directly from a TfL continuous ATC, which provides daily motor vehicles totals. To
determine the impact of the scheme on this site, a comparison has been made between what flows would have been at this site if it had followed the trend of other ATCs within 2km of the LTN, and what flows actually were.
• TfL ATCs do not break down traffic by vehicle class. Similarly, hour-by-hour data is not available for this site.
Basemap: ESRI
75
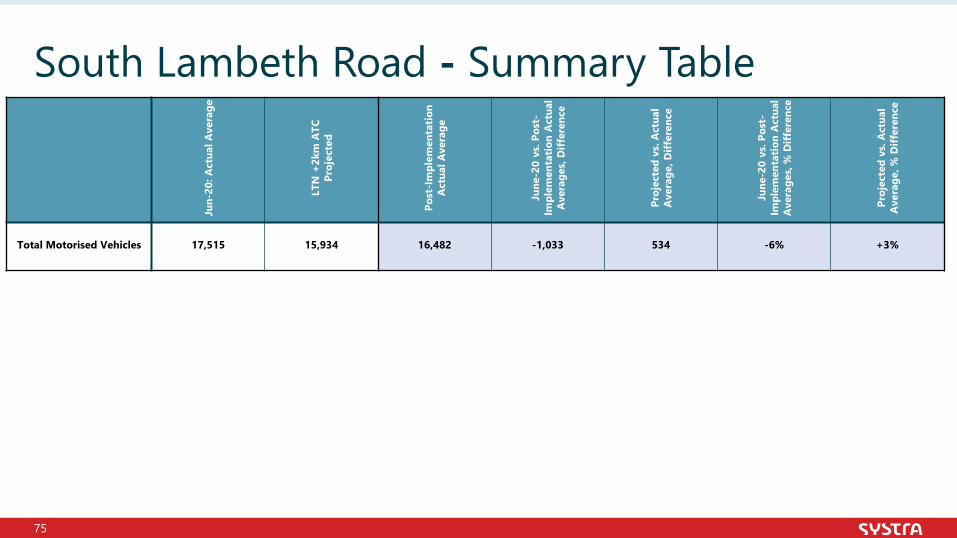
South Lambeth Road - Summary Table
Jun-
20: A
ctua
l Ave
rage
LTN
+2k
m A
TC
Proj
ecte
d
Post
-Im
plem
enta
tion
Act
ual A
vera
ge
June
-20
vs. P
ost-
Impl
emen
tatio
n A
ctua
l A
vera
ges,
Diff
eren
ce
Proj
ecte
d vs
. Act
ual
Ave
rage
, Diff
eren
ce
June
-20
vs. P
ost-
Impl
emen
tatio
n A
ctua
l A
vera
ges,
% D
iffer
ence
Proj
ecte
d vs
. Act
ual
Ave
rage
, % D
iffer
ence
Total Motorised Vehicles 17,515 15,934 16,482 -1,033 534 -6% +3%
76
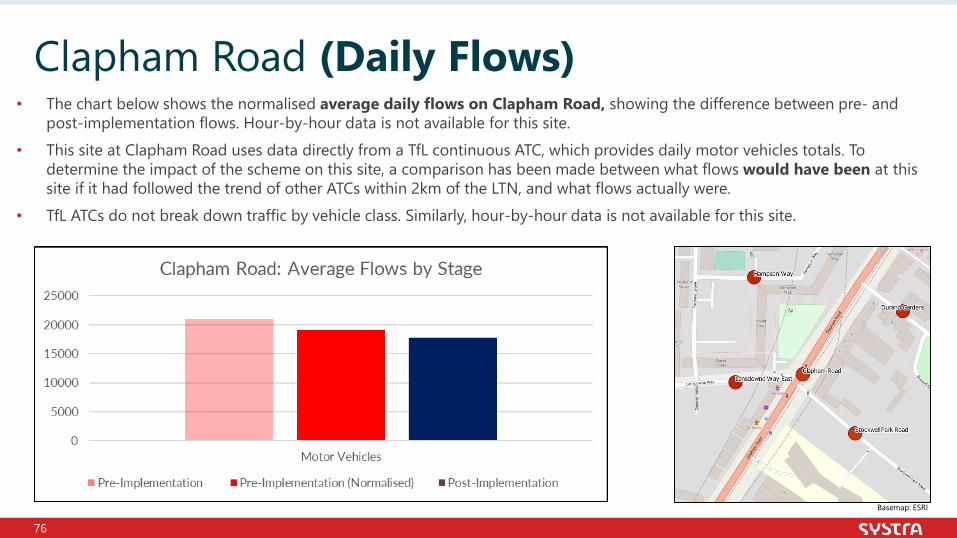
• The chart below shows the normalised average daily flows on Clapham Road, showing the difference between pre- and post-implementation flows. Hour-by-hour data is not available for this site.
• This site at Clapham Road uses data directly from a TfL continuous ATC, which provides daily motor vehicles totals. To determine the impact of the scheme on this site, a comparison has been made between what flows would have been at this site if it had followed the trend of other ATCs within 2km of the LTN, and what flows actually were.
• TfL ATCs do not break down traffic by vehicle class. Similarly, hour-by-hour data is not available for this site.
Clapham Road (Daily Flows)
Basemap: ESRI
77
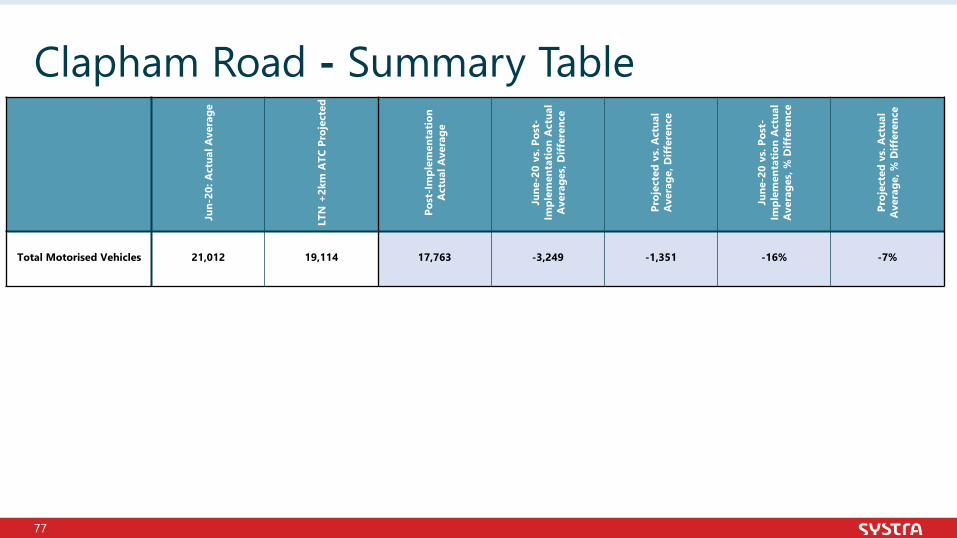
Clapham Road - Summary Table
Jun-
20: A
ctua
l Ave
rage
LTN
+2k
m A
TC P
roje
cted
Post
-Im
plem
enta
tion
Act
ual A
vera
ge
June
-20
vs. P
ost-
Impl
emen
tatio
n A
ctua
l A
vera
ges,
Diff
eren
ce
Proj
ecte
d vs
. Act
ual
Ave
rage
, Diff
eren
ce
June
-20
vs. P
ost-
Impl
emen
tatio
n A
ctua
l A
vera
ges,
% D
iffer
ence
Proj
ecte
d vs
. Act
ual
Ave
rage
, % D
iffer
ence
Total Motorised Vehicles 21,012 19,114 17,763 -3,249 -1,351 -16% -7%
78
LA CONFIANCE TRANSPORTE LE MONDE
Appendix D: Additional Sites
79
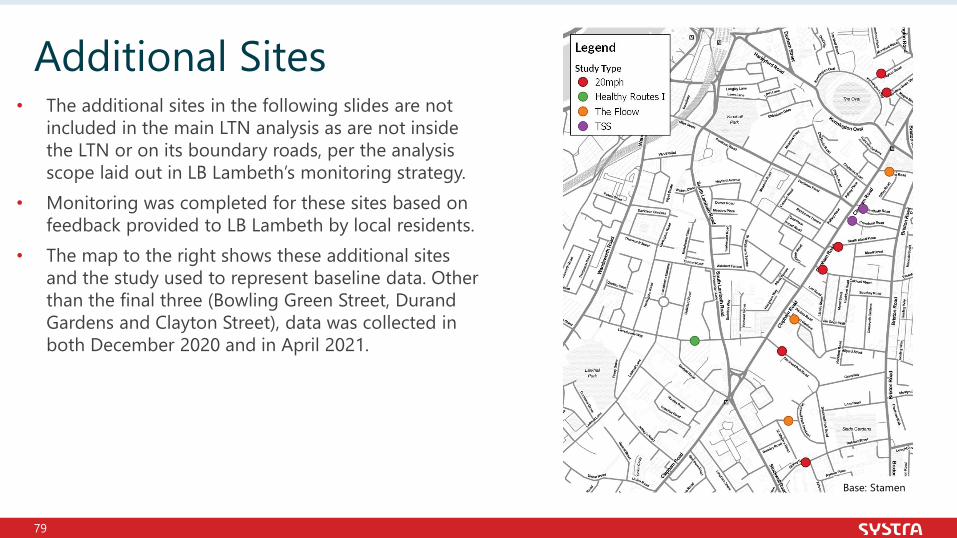
• The additional sites in the following slides are not included in the main LTN analysis as are not inside the LTN or on its boundary roads, per the analysis scope laid out in LB Lambeth’s monitoring strategy.
• Monitoring was completed for these sites based on feedback provided to LB Lambeth by local residents.
• The map to the right shows these additional sites and the study used to represent baseline data. Other than the final three (Bowling Green Street, Durand Gardens and Clayton Street), data was collected in both December 2020 and in April 2021.
Additional Sites
Base: Stamen
80
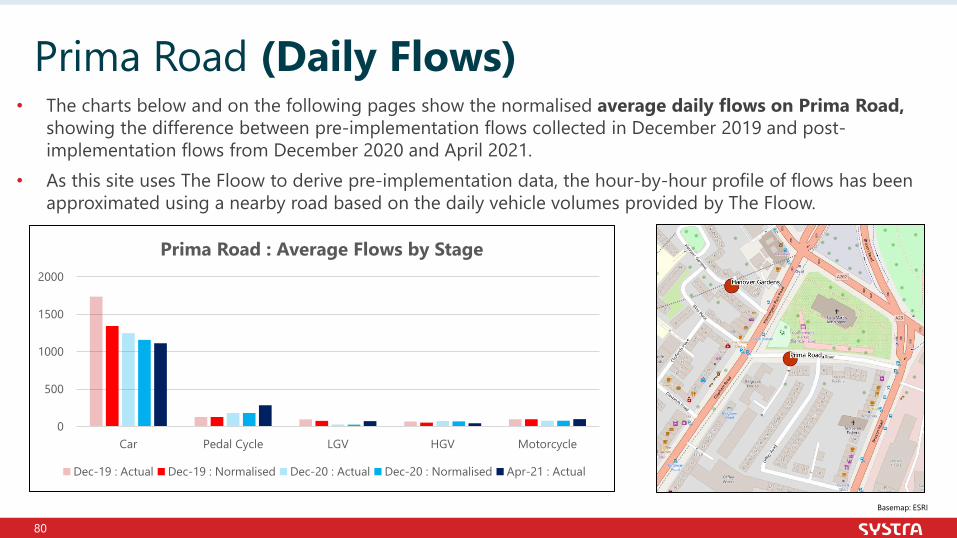
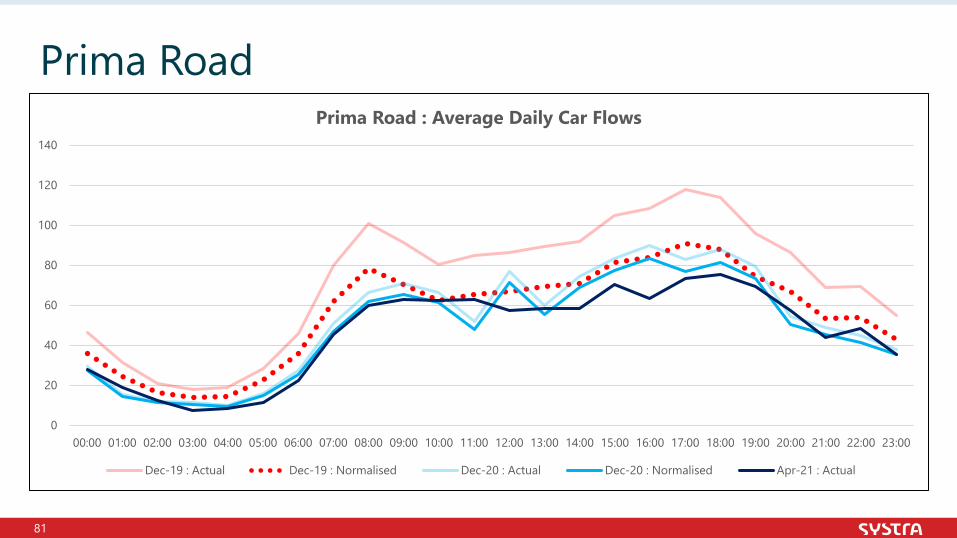
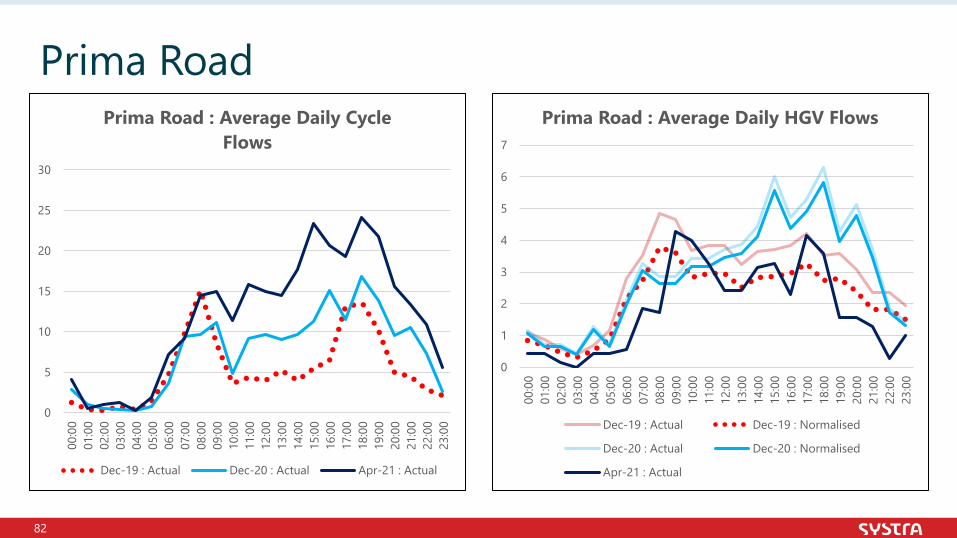
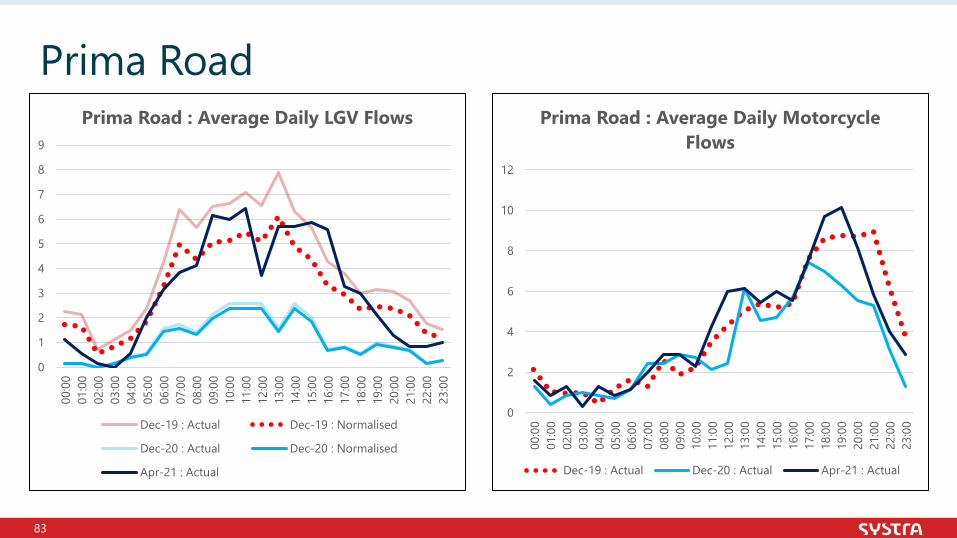
• The charts below and on the following pages show the normalised average daily flows on Prima Road, showing the difference between pre-implementation flows collected in December 2019 and post-implementation flows from December 2020 and April 2021.
• As this site uses The Floow to derive pre-implementation data, the hour-by-hour profile of flows has been approximated using a nearby road based on the daily vehicle volumes provided by The Floow.
Prima Road (Daily Flows)
Basemap: ESRI
0
500
1000
1500
2000
Car Pedal Cycle LGV HGV Motorcycle
Prima Road : Average Flows by Stage
Dec-19 : Actual Dec-19 : Normalised Dec-20 : Actual Dec-20 : Normalised Apr-21 : Actual
81
Prima Road
0
20
40
60
80
100
120
140
00:00 01:00 02:00 03:00 04:00 05:00 06:00 07:00 08:00 09:00 10:00 11:00 12:00 13:00 14:00 15:00 16:00 17:00 18:00 19:00 20:00 21:00 22:00 23:00
Prima Road : Average Daily Car Flows
Dec-19 : Actual Dec-19 : Normalised Dec-20 : Actual Dec-20 : Normalised Apr-21 : Actual
82
Prima Road
0
5
10
15
20
25
30
00:0
001
:00
02:0
003
:00
04:0
005
:00
06:0
007
:00
08:0
009
:00
10:0
011
:00
12:0
013
:00
14:0
015
:00
16:0
017
:00
18:0
019
:00
20:0
021
:00
22:0
023
:00
Prima Road : Average Daily Cycle Flows
Dec-19 : Actual Dec-20 : Actual Apr-21 : Actual
0
1
2
3
4
5
6
7
00:0
001
:00
02:0
003
:00
04:0
005
:00
06:0
007
:00
08:0
009
:00
10:0
011
:00
12:0
013
:00
14:0
015
:00
16:0
017
:00
18:0
019
:00
20:0
021
:00
22:0
023
:00
Prima Road : Average Daily HGV Flows
Dec-19 : Actual Dec-19 : Normalised
Dec-20 : Actual Dec-20 : Normalised
Apr-21 : Actual
83
Prima Road
0
1
2
3
4
5
6
7
8
9
00:0
001
:00
02:0
003
:00
04:0
005
:00
06:0
007
:00
08:0
009
:00
10:0
011
:00
12:0
013
:00
14:0
015
:00
16:0
017
:00
18:0
019
:00
20:0
021
:00
22:0
023
:00
Prima Road : Average Daily LGV Flows
Dec-19 : Actual Dec-19 : Normalised
Dec-20 : Actual Dec-20 : Normalised
Apr-21 : Actual
0
2
4
6
8
10
12
00:0
001
:00
02:0
003
:00
04:0
005
:00
06:0
007
:00
08:0
009
:00
10:0
011
:00
12:0
013
:00
14:0
015
:00
16:0
017
:00
18:0
019
:00
20:0
021
:00
22:0
023
:00
Prima Road : Average Daily Motorcycle Flows
Dec-19 : Actual Dec-20 : Actual Apr-21 : Actual
84
Prima Road – Summary TableD
ec-1
9 :
Act
ual
Dec
-19
: N
orm
alis
ed
Dec
-20
: A
ctua
l
Dec
-20
: N
orm
alis
ed
Dec
-19
-> D
ec-2
0 : A
ctua
l D
iffer
ence
Dec
-19
-> D
ec-2
0 : A
ctua
l %
Diff
eren
ce
Dec
-19
-> D
ec-2
0 :
Nor
mal
ised
Diff
eren
ce
Dec
-19
-> D
ec-2
0 :
Nor
mal
ised
% D
iffer
ence
Apr
-21
: A
ctua
l
Apr
-21
: N
orm
alis
ed
Dec
-19
-> A
pr-2
1 : A
ctua
l D
iffer
ence
Dec
-19
-> A
pr-2
1 : A
ctua
l %
Diff
eren
ce
Dec
-19
-> A
pr-2
1 :
Nor
mal
ised
Diff
eren
ce
Dec
-19
-> A
pr-2
1 :
Nor
mal
ised
% D
iffer
ence
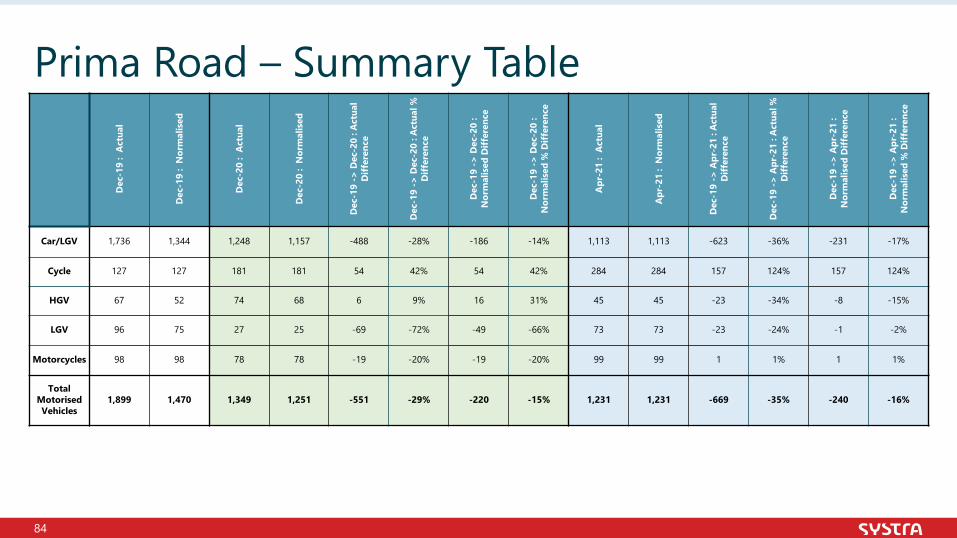
Car/LGV 1,736 1,344 1,248 1,157 -488 -28% -186 -14% 1,113 1,113 -623 -36% -231 -17%
Cycle 127 127 181 181 54 42% 54 42% 284 284 157 124% 157 124%
HGV 67 52 74 68 6 9% 16 31% 45 45 -23 -34% -8 -15%
LGV 96 75 27 25 -69 -72% -49 -66% 73 73 -23 -24% -1 -2%
Motorcycles 98 98 78 78 -19 -20% -19 -20% 99 99 1 1% 1 1%
Total Motorised Vehicles
1,899 1,470 1,349 1,251 -551 -29% -220 -15% 1,231 1,231 -669 -35% -240 -16%
85
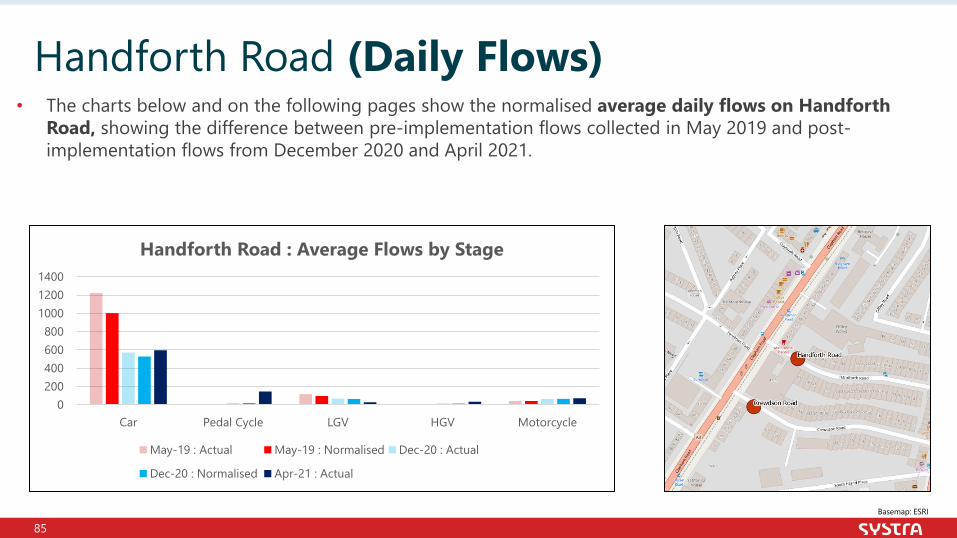
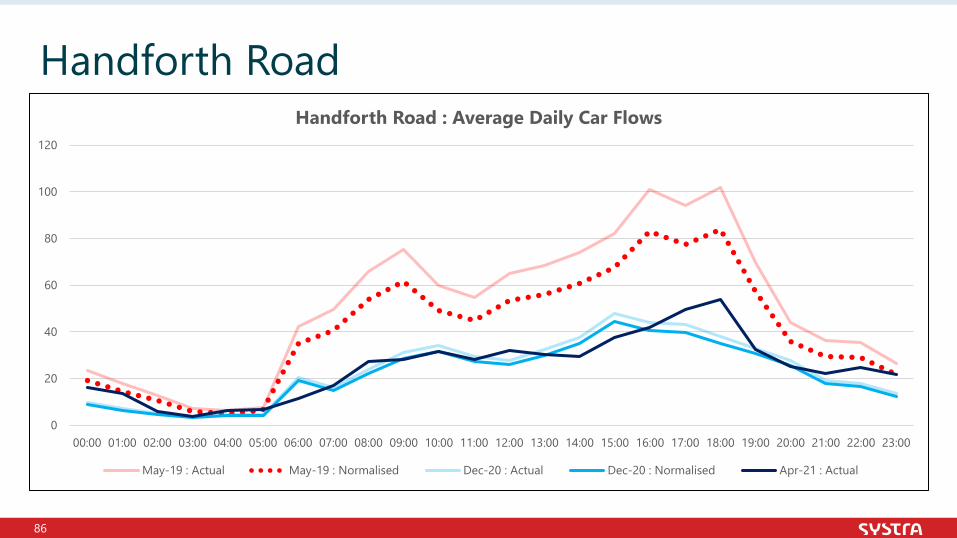
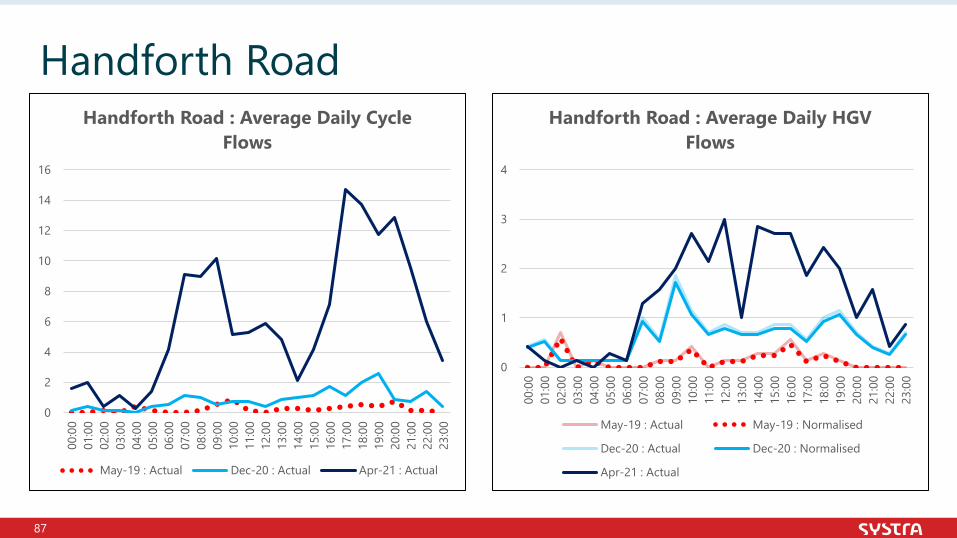
• The charts below and on the following pages show the normalised average daily flows on HandforthRoad, showing the difference between pre-implementation flows collected in May 2019 and post-implementation flows from December 2020 and April 2021.
Handforth Road (Daily Flows)
Basemap: ESRI
0200400600800
100012001400
Car Pedal Cycle LGV HGV Motorcycle
Handforth Road : Average Flows by Stage
May-19 : Actual May-19 : Normalised Dec-20 : Actual
Dec-20 : Normalised Apr-21 : Actual
86
Handforth Road
0
20
40
60
80
100
120
00:00 01:00 02:00 03:00 04:00 05:00 06:00 07:00 08:00 09:00 10:00 11:00 12:00 13:00 14:00 15:00 16:00 17:00 18:00 19:00 20:00 21:00 22:00 23:00
Handforth Road : Average Daily Car Flows
May-19 : Actual May-19 : Normalised Dec-20 : Actual Dec-20 : Normalised Apr-21 : Actual
87
Handforth Road
0
2
4
6
8
10
12
14
16
00:0
001
:00
02:0
003
:00
04:0
005
:00
06:0
007
:00
08:0
009
:00
10:0
011
:00
12:0
013
:00
14:0
015
:00
16:0
017
:00
18:0
019
:00
20:0
021
:00
22:0
023
:00
Handforth Road : Average Daily Cycle Flows
May-19 : Actual Dec-20 : Actual Apr-21 : Actual
0
1
2
3
4
00:0
001
:00
02:0
003
:00
04:0
005
:00
06:0
007
:00
08:0
009
:00
10:0
011
:00
12:0
013
:00
14:0
015
:00
16:0
017
:00
18:0
019
:00
20:0
021
:00
22:0
023
:00
Handforth Road : Average Daily HGV Flows
May-19 : Actual May-19 : Normalised
Dec-20 : Actual Dec-20 : Normalised
Apr-21 : Actual
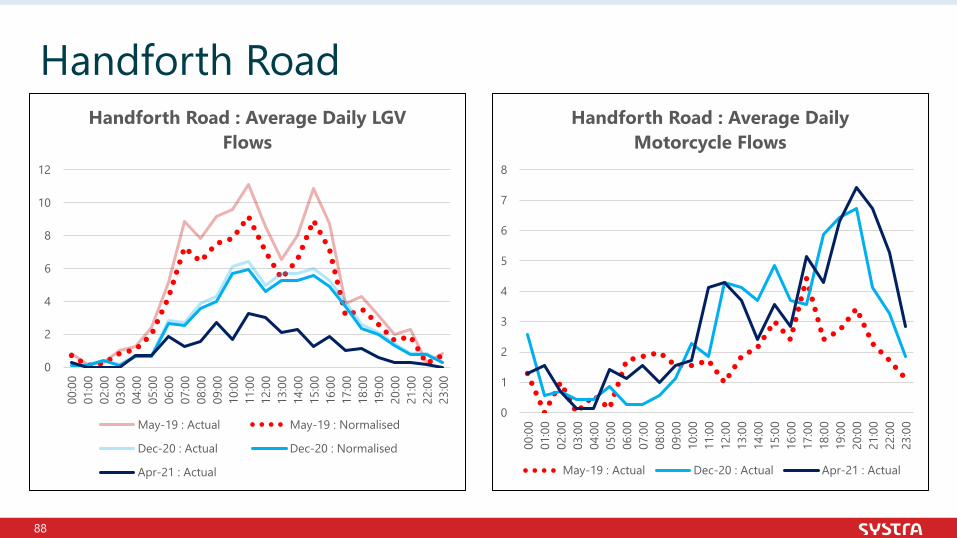
88
Handforth Road
0
2
4
6
8
10
12
00:0
001
:00
02:0
003
:00
04:0
005
:00
06:0
007
:00
08:0
009
:00
10:0
011
:00
12:0
013
:00
14:0
015
:00
16:0
017
:00
18:0
019
:00
20:0
021
:00
22:0
023
:00
Handforth Road : Average Daily LGV Flows
May-19 : Actual May-19 : Normalised
Dec-20 : Actual Dec-20 : Normalised
Apr-21 : Actual
0
1
2
3
4
5
6
7
8
00:0
001
:00
02:0
003
:00
04:0
005
:00
06:0
007
:00
08:0
009
:00
10:0
011
:00
12:0
013
:00
14:0
015
:00
16:0
017
:00
18:0
019
:00
20:0
021
:00
22:0
023
:00
Handforth Road : Average Daily Motorcycle Flows
May-19 : Actual Dec-20 : Actual Apr-21 : Actual
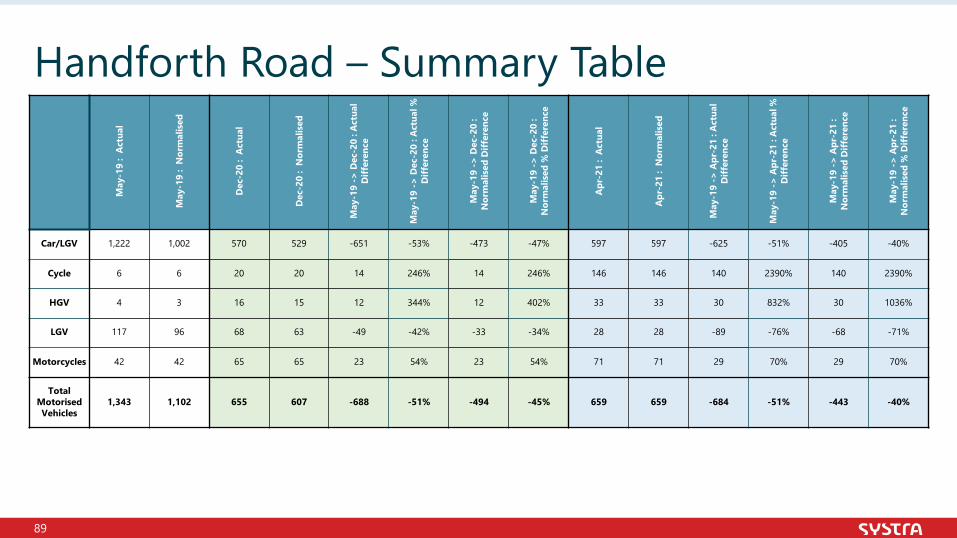
89
Handforth Road – Summary TableM
ay-1
9 :
Act
ual
May
-19
: N
orm
alis
ed
Dec
-20
: A
ctua
l
Dec
-20
: N
orm
alis
ed
May
-19
-> D
ec-2
0 : A
ctua
l D
iffer
ence
May
-19
-> D
ec-2
0 : A
ctua
l %
Diff
eren
ce
May
-19
-> D
ec-2
0 :
Nor
mal
ised
Diff
eren
ce
May
-19
-> D
ec-2
0 :
Nor
mal
ised
% D
iffer
ence
Apr
-21
: A
ctua
l
Apr
-21
: N
orm
alis
ed
May
-19
-> A
pr-2
1 : A
ctua
l D
iffer
ence
May
-19
-> A
pr-2
1 : A
ctua
l %
Diff
eren
ce
May
-19
-> A
pr-2
1 :
Nor
mal
ised
Diff
eren
ce
May
-19
-> A
pr-2
1 :
Nor
mal
ised
% D
iffer
ence
Car/LGV 1,222 1,002 570 529 -651 -53% -473 -47% 597 597 -625 -51% -405 -40%
Cycle 6 6 20 20 14 246% 14 246% 146 146 140 2390% 140 2390%
HGV 4 3 16 15 12 344% 12 402% 33 33 30 832% 30 1036%
LGV 117 96 68 63 -49 -42% -33 -34% 28 28 -89 -76% -68 -71%
Motorcycles 42 42 65 65 23 54% 23 54% 71 71 29 70% 29 70%
Total Motorised Vehicles
1,343 1,102 655 607 -688 -51% -494 -45% 659 659 -684 -51% -443 -40%
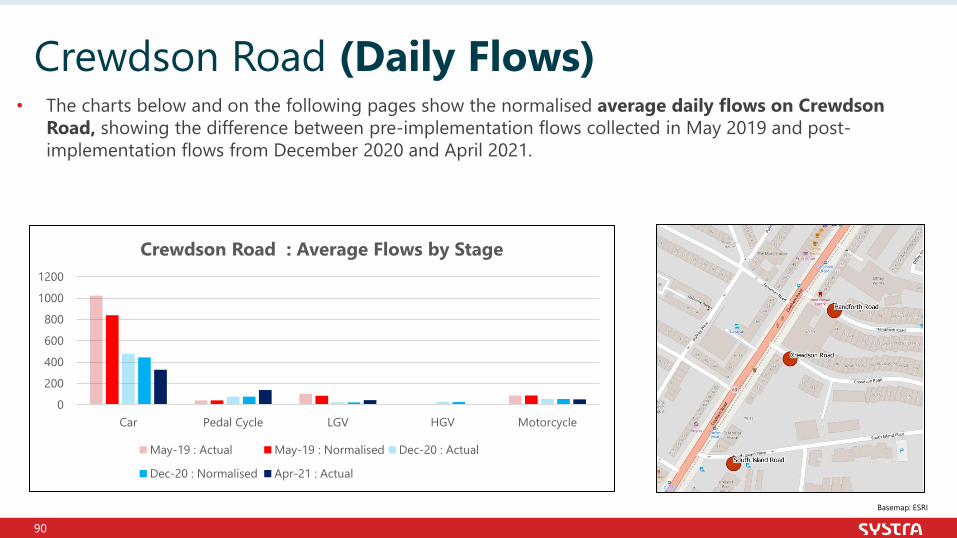
90
• The charts below and on the following pages show the normalised average daily flows on CrewdsonRoad, showing the difference between pre-implementation flows collected in May 2019 and post-implementation flows from December 2020 and April 2021.
Crewdson Road (Daily Flows)
Basemap: ESRI
0
200
400
600
800
1000
1200
Car Pedal Cycle LGV HGV Motorcycle
Crewdson Road : Average Flows by Stage
May-19 : Actual May-19 : Normalised Dec-20 : Actual
Dec-20 : Normalised Apr-21 : Actual
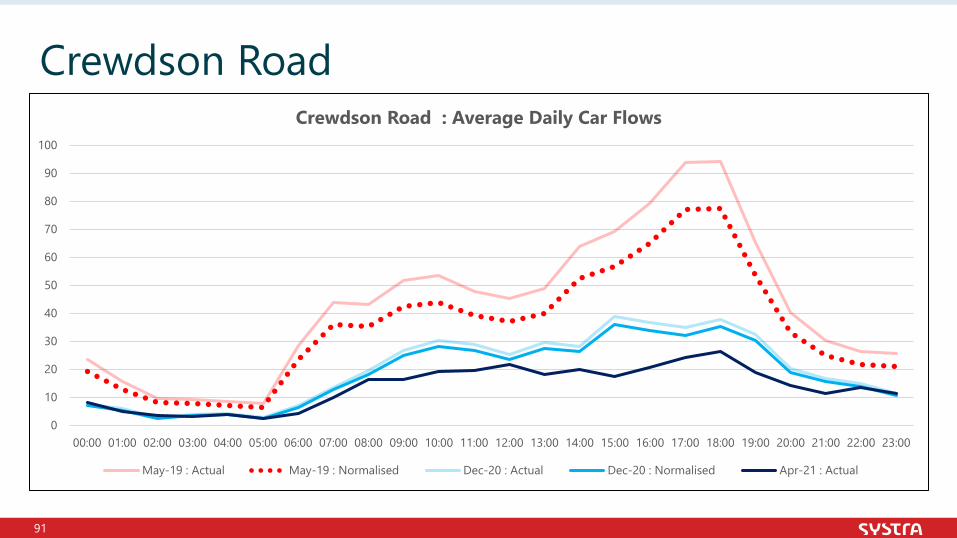
91
Crewdson Road
0
10
20
30
40
50
60
70
80
90
100
00:00 01:00 02:00 03:00 04:00 05:00 06:00 07:00 08:00 09:00 10:00 11:00 12:00 13:00 14:00 15:00 16:00 17:00 18:00 19:00 20:00 21:00 22:00 23:00
Crewdson Road : Average Daily Car Flows
May-19 : Actual May-19 : Normalised Dec-20 : Actual Dec-20 : Normalised Apr-21 : Actual
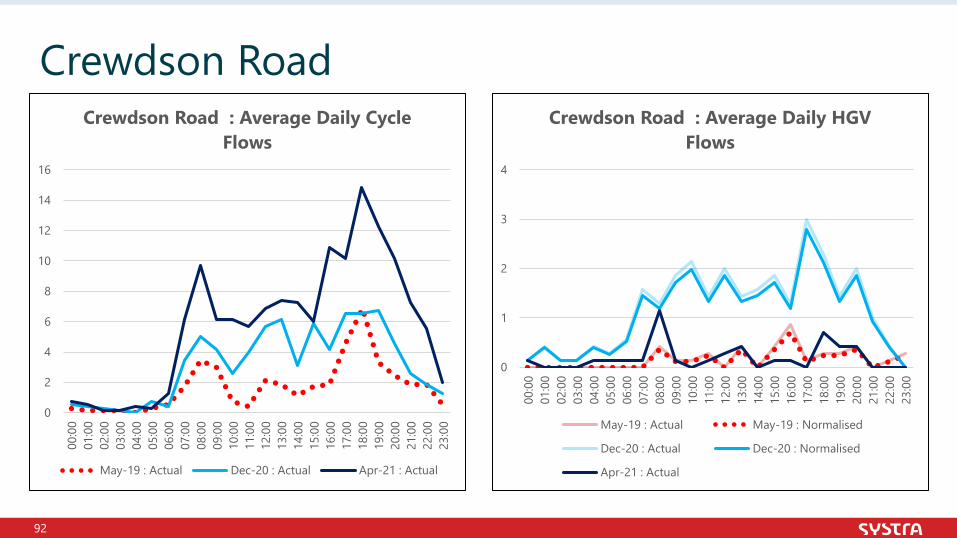
92
Crewdson Road
0
2
4
6
8
10
12
14
16
00:0
001
:00
02:0
003
:00
04:0
005
:00
06:0
007
:00
08:0
009
:00
10:0
011
:00
12:0
013
:00
14:0
015
:00
16:0
017
:00
18:0
019
:00
20:0
021
:00
22:0
023
:00
Crewdson Road : Average Daily Cycle Flows
May-19 : Actual Dec-20 : Actual Apr-21 : Actual
0
1
2
3
4
00:0
001
:00
02:0
003
:00
04:0
005
:00
06:0
007
:00
08:0
009
:00
10:0
011
:00
12:0
013
:00
14:0
015
:00
16:0
017
:00
18:0
019
:00
20:0
021
:00
22:0
023
:00
Crewdson Road : Average Daily HGV Flows
May-19 : Actual May-19 : Normalised
Dec-20 : Actual Dec-20 : Normalised
Apr-21 : Actual
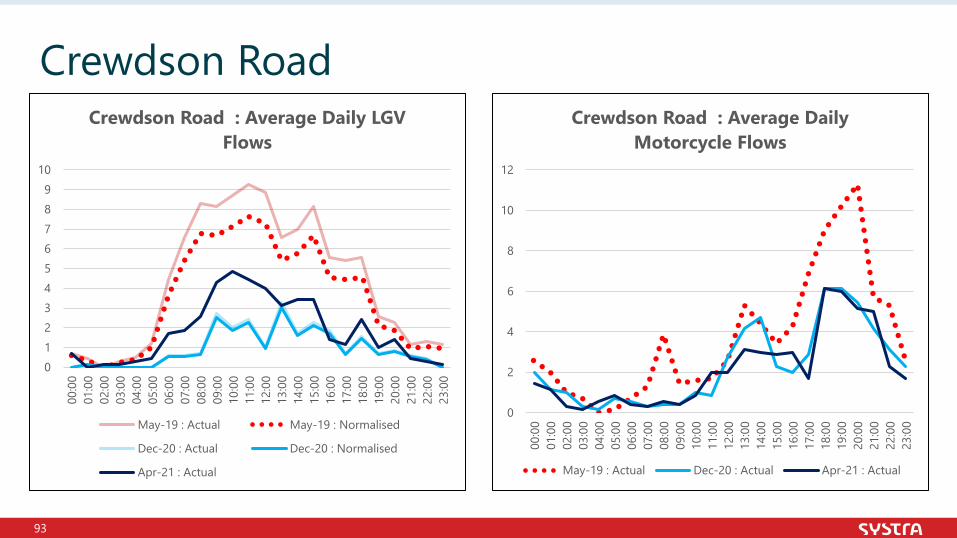
93
Crewdson Road
0123456789
10
00:0
001
:00
02:0
003
:00
04:0
005
:00
06:0
007
:00
08:0
009
:00
10:0
011
:00
12:0
013
:00
14:0
015
:00
16:0
017
:00
18:0
019
:00
20:0
021
:00
22:0
023
:00
Crewdson Road : Average Daily LGV Flows
May-19 : Actual May-19 : Normalised
Dec-20 : Actual Dec-20 : Normalised
Apr-21 : Actual
0
2
4
6
8
10
12
00:0
001
:00
02:0
003
:00
04:0
005
:00
06:0
007
:00
08:0
009
:00
10:0
011
:00
12:0
013
:00
14:0
015
:00
16:0
017
:00
18:0
019
:00
20:0
021
:00
22:0
023
:00
Crewdson Road : Average Daily Motorcycle Flows
May-19 : Actual Dec-20 : Actual Apr-21 : Actual
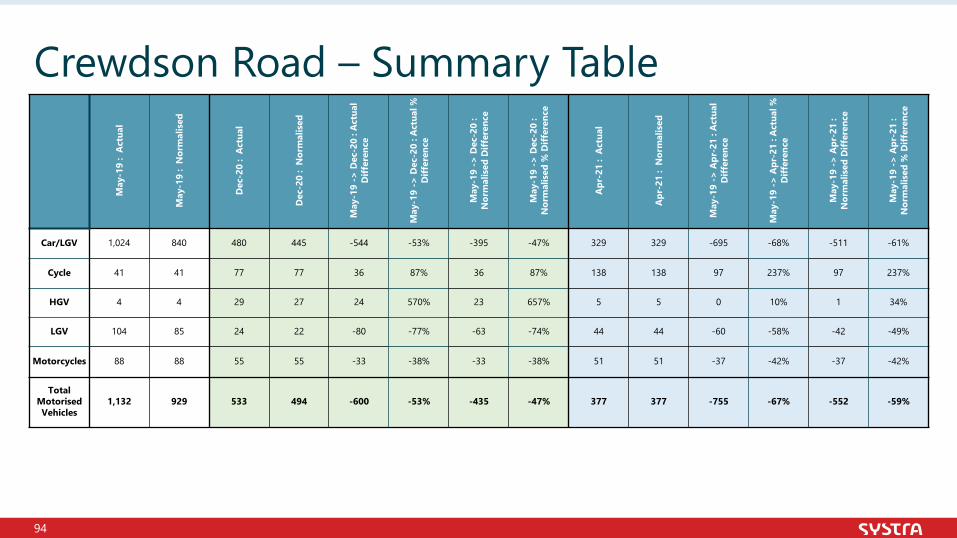
94
Crewdson Road – Summary TableM
ay-1
9 :
Act
ual
May
-19
: N
orm
alis
ed
Dec
-20
: A
ctua
l
Dec
-20
: N
orm
alis
ed
May
-19
-> D
ec-2
0 : A
ctua
l D
iffer
ence
May
-19
-> D
ec-2
0 : A
ctua
l %
Diff
eren
ce
May
-19
-> D
ec-2
0 :
Nor
mal
ised
Diff
eren
ce
May
-19
-> D
ec-2
0 :
Nor
mal
ised
% D
iffer
ence
Apr
-21
: A
ctua
l
Apr
-21
: N
orm
alis
ed
May
-19
-> A
pr-2
1 : A
ctua
l D
iffer
ence
May
-19
-> A
pr-2
1 : A
ctua
l %
Diff
eren
ce
May
-19
-> A
pr-2
1 :
Nor
mal
ised
Diff
eren
ce
May
-19
-> A
pr-2
1 :
Nor
mal
ised
% D
iffer
ence
Car/LGV 1,024 840 480 445 -544 -53% -395 -47% 329 329 -695 -68% -511 -61%
Cycle 41 41 77 77 36 87% 36 87% 138 138 97 237% 97 237%
HGV 4 4 29 27 24 570% 23 657% 5 5 0 10% 1 34%
LGV 104 85 24 22 -80 -77% -63 -74% 44 44 -60 -58% -42 -49%
Motorcycles 88 88 55 55 -33 -38% -33 -38% 51 51 -37 -42% -37 -42%
Total Motorised Vehicles
1,132 929 533 494 -600 -53% -435 -47% 377 377 -755 -67% -552 -59%
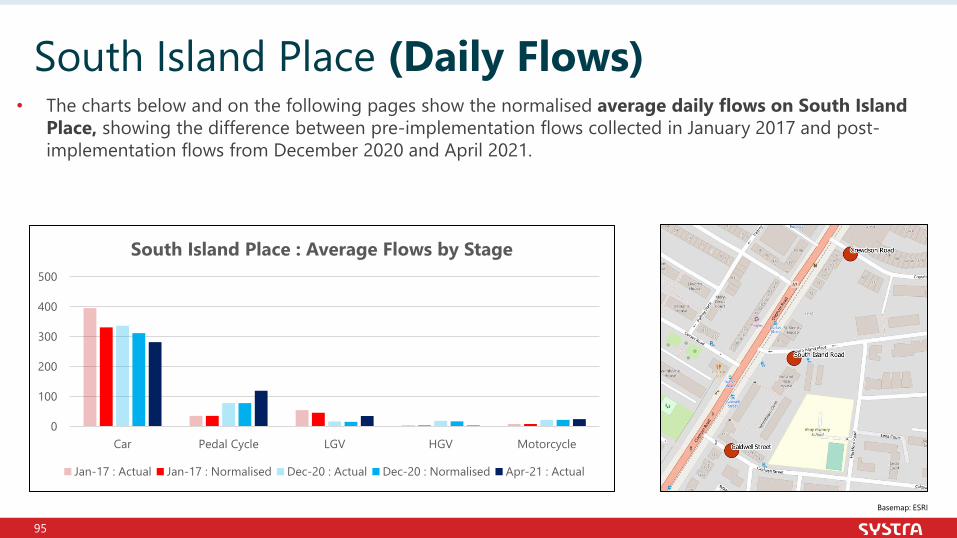
95
• The charts below and on the following pages show the normalised average daily flows on South Island Place, showing the difference between pre-implementation flows collected in January 2017 and post-implementation flows from December 2020 and April 2021.
South Island Place (Daily Flows)
Basemap: ESRI
0
100
200
300
400
500
Car Pedal Cycle LGV HGV Motorcycle
South Island Place : Average Flows by Stage
Jan-17 : Actual Jan-17 : Normalised Dec-20 : Actual Dec-20 : Normalised Apr-21 : Actual
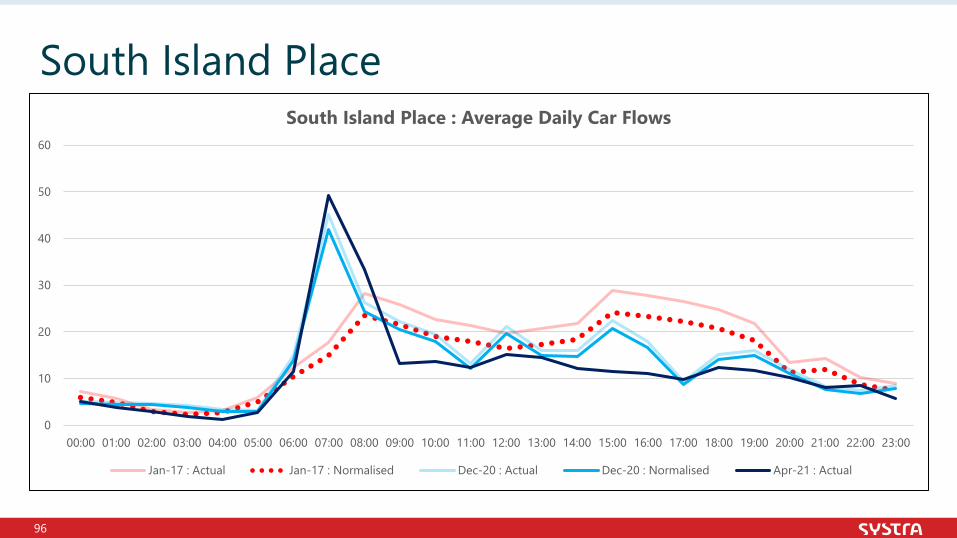
96
South Island Place
0
10
20
30
40
50
60
00:00 01:00 02:00 03:00 04:00 05:00 06:00 07:00 08:00 09:00 10:00 11:00 12:00 13:00 14:00 15:00 16:00 17:00 18:00 19:00 20:00 21:00 22:00 23:00
South Island Place : Average Daily Car Flows
Jan-17 : Actual Jan-17 : Normalised Dec-20 : Actual Dec-20 : Normalised Apr-21 : Actual
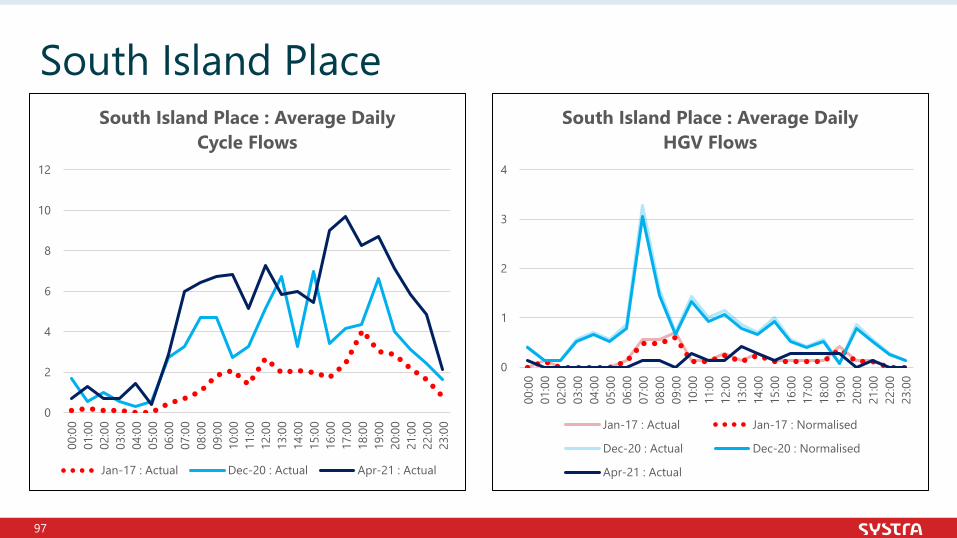
97
South Island Place
0
2
4
6
8
10
12
00:0
001
:00
02:0
003
:00
04:0
005
:00
06:0
007
:00
08:0
009
:00
10:0
011
:00
12:0
013
:00
14:0
015
:00
16:0
017
:00
18:0
019
:00
20:0
021
:00
22:0
023
:00
South Island Place : Average Daily Cycle Flows
Jan-17 : Actual Dec-20 : Actual Apr-21 : Actual
0
1
2
3
4
00:0
001
:00
02:0
003
:00
04:0
005
:00
06:0
007
:00
08:0
009
:00
10:0
011
:00
12:0
013
:00
14:0
015
:00
16:0
017
:00
18:0
019
:00
20:0
021
:00
22:0
023
:00
South Island Place : Average Daily HGV Flows
Jan-17 : Actual Jan-17 : Normalised
Dec-20 : Actual Dec-20 : Normalised
Apr-21 : Actual
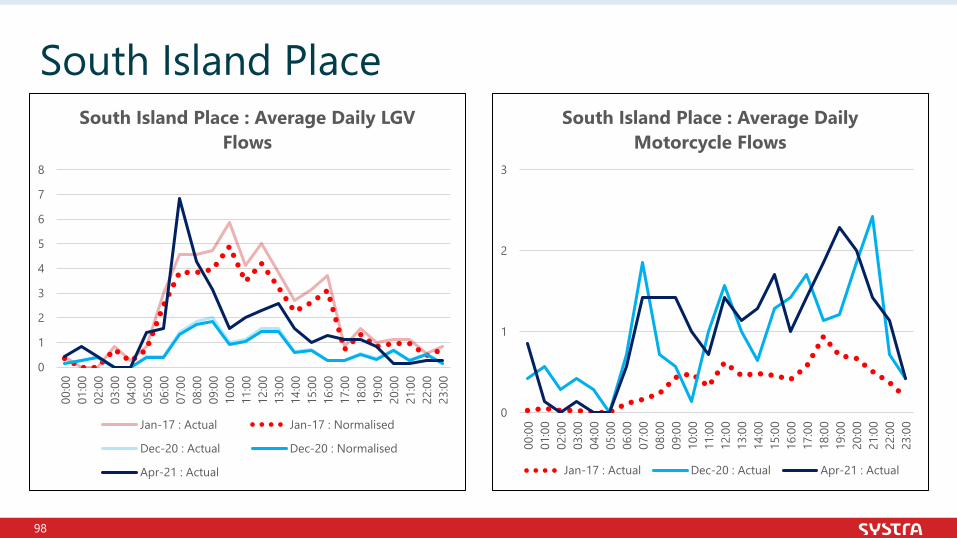
98
South Island Place
0
1
2
3
4
5
6
7
8
00:0
001
:00
02:0
003
:00
04:0
005
:00
06:0
007
:00
08:0
009
:00
10:0
011
:00
12:0
013
:00
14:0
015
:00
16:0
017
:00
18:0
019
:00
20:0
021
:00
22:0
023
:00
South Island Place : Average Daily LGV Flows
Jan-17 : Actual Jan-17 : Normalised
Dec-20 : Actual Dec-20 : Normalised
Apr-21 : Actual
0
1
2
3
00:0
001
:00
02:0
003
:00
04:0
005
:00
06:0
007
:00
08:0
009
:00
10:0
011
:00
12:0
013
:00
14:0
015
:00
16:0
017
:00
18:0
019
:00
20:0
021
:00
22:0
023
:00
South Island Place : Average Daily Motorcycle Flows
Jan-17 : Actual Dec-20 : Actual Apr-21 : Actual
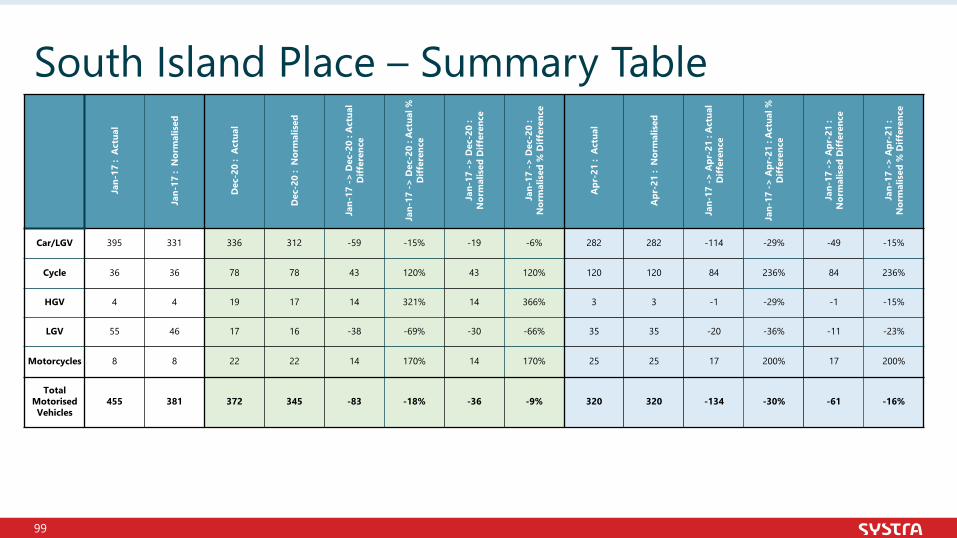
99
South Island Place – Summary TableJa
n-17
: A
ctua
l
Jan-
17 :
Nor
mal
ised
Dec
-20
: A
ctua
l
Dec
-20
: N
orm
alis
ed
Jan-
17 ->
Dec
-20
: Act
ual
Diff
eren
ce
Jan-
17 ->
Dec
-20
: Act
ual %
D
iffer
ence
Jan-
17 ->
Dec
-20
: N
orm
alis
ed D
iffer
ence
Jan-
17 ->
Dec
-20
: N
orm
alis
ed %
Diff
eren
ce
Apr
-21
: A
ctua
l
Apr
-21
: N
orm
alis
ed
Jan-
17 ->
Apr
-21
: Act
ual
Diff
eren
ce
Jan-
17 ->
Apr
-21
: Act
ual %
D
iffer
ence
Jan-
17 ->
Apr
-21
: N
orm
alis
ed D
iffer
ence
Jan-
17 ->
Apr
-21
: N
orm
alis
ed %
Diff
eren
ce
Car/LGV 395 331 336 312 -59 -15% -19 -6% 282 282 -114 -29% -49 -15%
Cycle 36 36 78 78 43 120% 43 120% 120 120 84 236% 84 236%
HGV 4 4 19 17 14 321% 14 366% 3 3 -1 -29% -1 -15%
LGV 55 46 17 16 -38 -69% -30 -66% 35 35 -20 -36% -11 -23%
Motorcycles 8 8 22 22 14 170% 14 170% 25 25 17 200% 17 200%
Total Motorised Vehicles
455 381 372 345 -83 -18% -36 -9% 320 320 -134 -30% -61 -16%
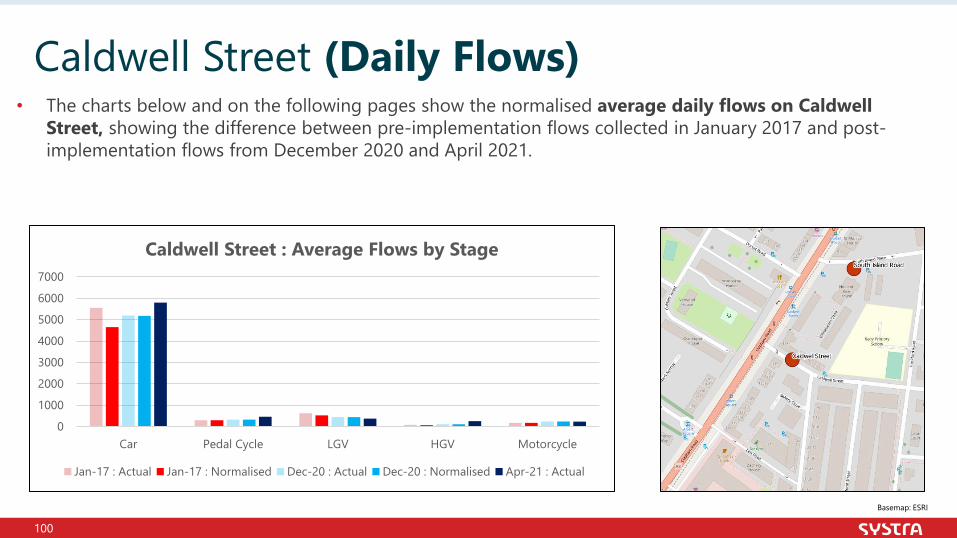
100
• The charts below and on the following pages show the normalised average daily flows on Caldwell Street, showing the difference between pre-implementation flows collected in January 2017 and post-implementation flows from December 2020 and April 2021.
Caldwell Street (Daily Flows)
Basemap: ESRI
0
1000
2000
3000
4000
5000
6000
7000
Car Pedal Cycle LGV HGV Motorcycle
Caldwell Street : Average Flows by Stage
Jan-17 : Actual Jan-17 : Normalised Dec-20 : Actual Dec-20 : Normalised Apr-21 : Actual
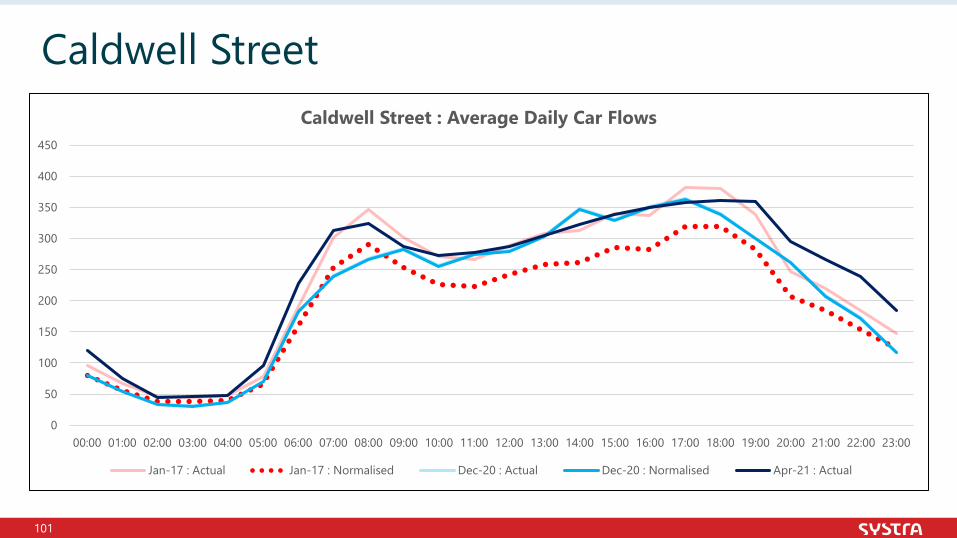
101
Caldwell Street
0
50
100
150
200
250
300
350
400
450
00:00 01:00 02:00 03:00 04:00 05:00 06:00 07:00 08:00 09:00 10:00 11:00 12:00 13:00 14:00 15:00 16:00 17:00 18:00 19:00 20:00 21:00 22:00 23:00
Caldwell Street : Average Daily Car Flows
Jan-17 : Actual Jan-17 : Normalised Dec-20 : Actual Dec-20 : Normalised Apr-21 : Actual
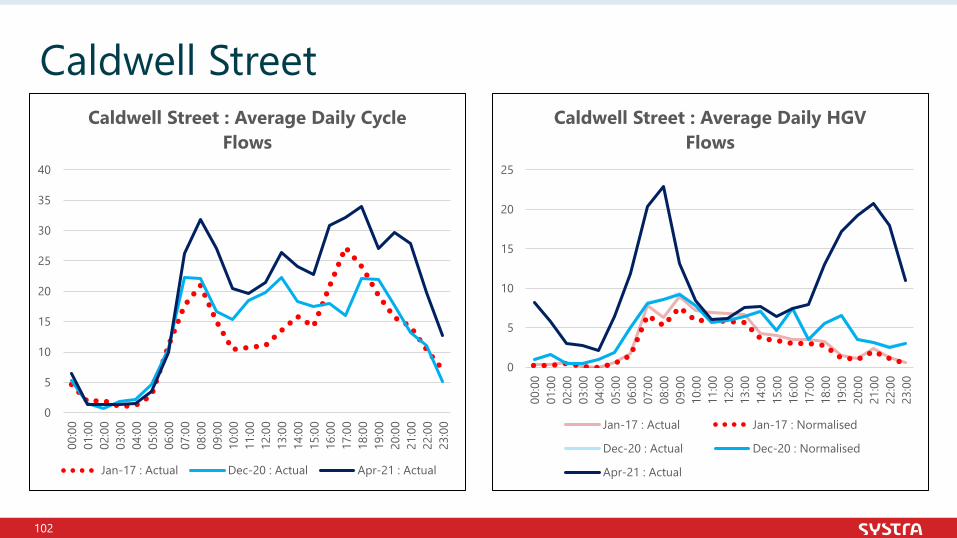
102
Caldwell Street
0
5
10
15
20
25
30
35
40
00:0
001
:00
02:0
003
:00
04:0
005
:00
06:0
007
:00
08:0
009
:00
10:0
011
:00
12:0
013
:00
14:0
015
:00
16:0
017
:00
18:0
019
:00
20:0
021
:00
22:0
023
:00
Caldwell Street : Average Daily Cycle Flows
Jan-17 : Actual Dec-20 : Actual Apr-21 : Actual
0
5
10
15
20
25
00:0
001
:00
02:0
003
:00
04:0
005
:00
06:0
007
:00
08:0
009
:00
10:0
011
:00
12:0
013
:00
14:0
015
:00
16:0
017
:00
18:0
019
:00
20:0
021
:00
22:0
023
:00
Caldwell Street : Average Daily HGV Flows
Jan-17 : Actual Jan-17 : Normalised
Dec-20 : Actual Dec-20 : Normalised
Apr-21 : Actual
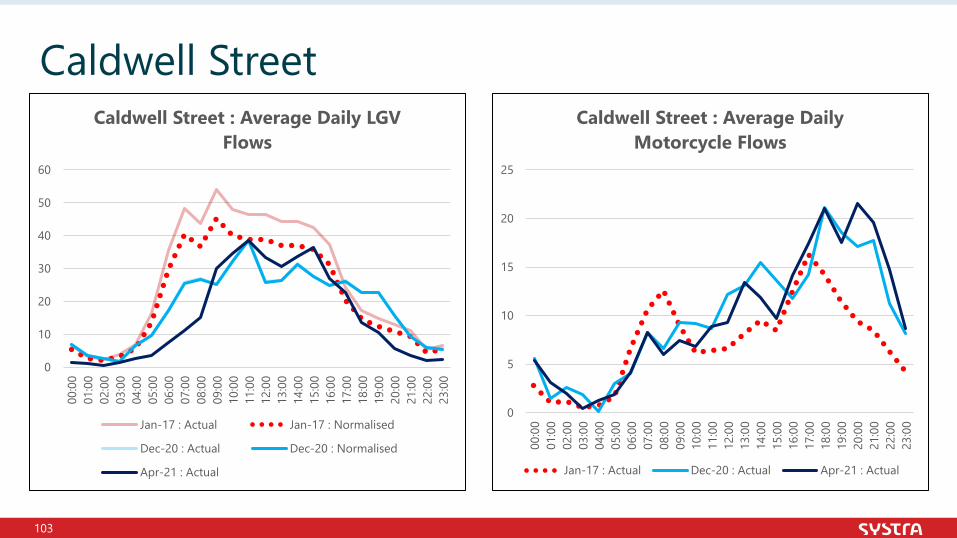
103
Caldwell Street
0
10
20
30
40
50
60
00:0
001
:00
02:0
003
:00
04:0
005
:00
06:0
007
:00
08:0
009
:00
10:0
011
:00
12:0
013
:00
14:0
015
:00
16:0
017
:00
18:0
019
:00
20:0
021
:00
22:0
023
:00
Caldwell Street : Average Daily LGV Flows
Jan-17 : Actual Jan-17 : Normalised
Dec-20 : Actual Dec-20 : Normalised
Apr-21 : Actual
0
5
10
15
20
25
00:0
001
:00
02:0
003
:00
04:0
005
:00
06:0
007
:00
08:0
009
:00
10:0
011
:00
12:0
013
:00
14:0
015
:00
16:0
017
:00
18:0
019
:00
20:0
021
:00
22:0
023
:00
Caldwell Street : Average Daily Motorcycle Flows
Jan-17 : Actual Dec-20 : Actual Apr-21 : Actual
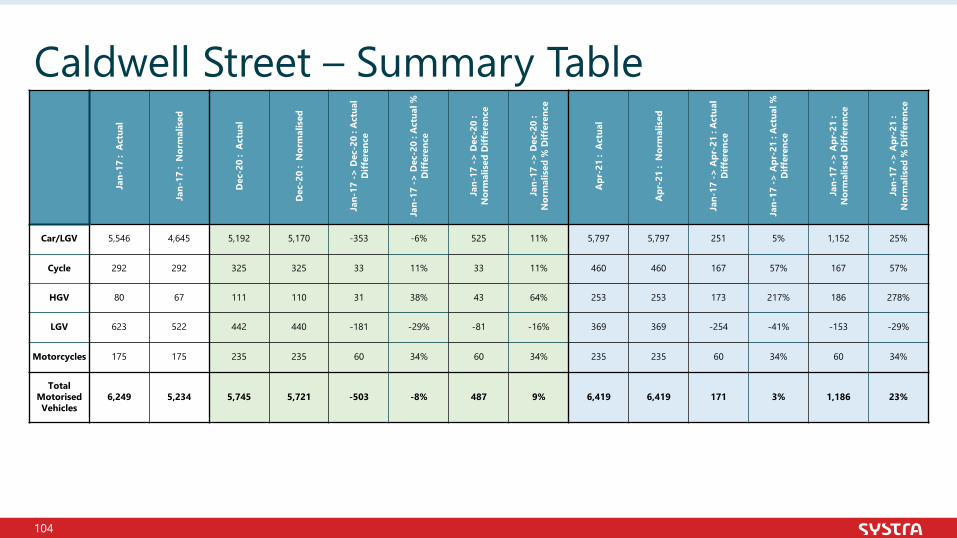
104
Caldwell Street – Summary TableJa
n-17
: A
ctua
l
Jan-
17 :
Nor
mal
ised
Dec
-20
: A
ctua
l
Dec
-20
: N
orm
alis
ed
Jan-
17 ->
Dec
-20
: Act
ual
Diff
eren
ce
Jan-
17 ->
Dec
-20
: Act
ual %
D
iffer
ence
Jan-
17 ->
Dec
-20
: N
orm
alis
ed D
iffer
ence
Jan-
17 ->
Dec
-20
: N
orm
alis
ed %
Diff
eren
ce
Apr
-21
: A
ctua
l
Apr
-21
: N
orm
alis
ed
Jan-
17 ->
Apr
-21
: Act
ual
Diff
eren
ce
Jan-
17 ->
Apr
-21
: Act
ual %
D
iffer
ence
Jan-
17 ->
Apr
-21
: N
orm
alis
ed D
iffer
ence
Jan-
17 ->
Apr
-21
: N
orm
alis
ed %
Diff
eren
ce
Car/LGV 5,546 4,645 5,192 5,170 -353 -6% 525 11% 5,797 5,797 251 5% 1,152 25%
Cycle 292 292 325 325 33 11% 33 11% 460 460 167 57% 167 57%
HGV 80 67 111 110 31 38% 43 64% 253 253 173 217% 186 278%
LGV 623 522 442 440 -181 -29% -81 -16% 369 369 -254 -41% -153 -29%
Motorcycles 175 175 235 235 60 34% 60 34% 235 235 60 34% 60 34%
Total Motorised Vehicles
6,249 5,234 5,745 5,721 -503 -8% 487 9% 6,419 6,419 171 3% 1,186 23%
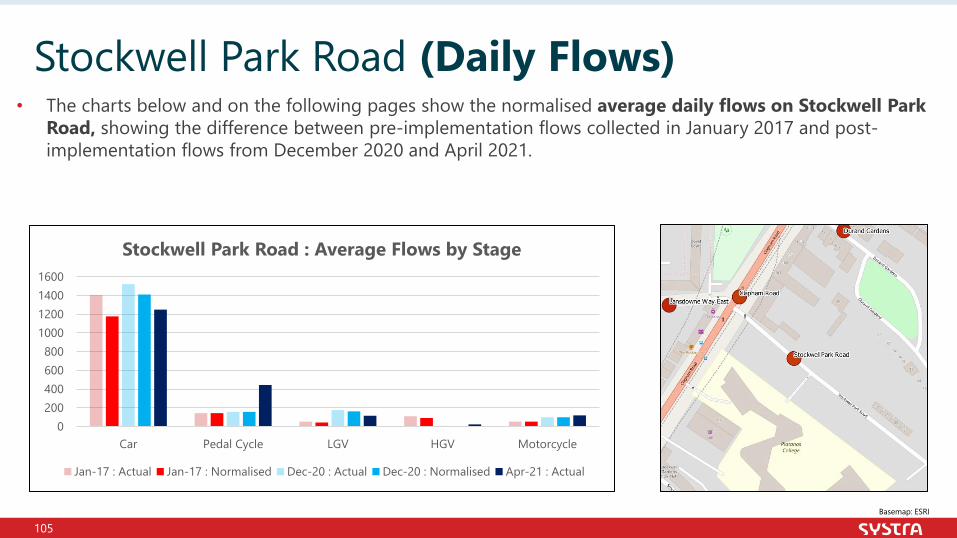
105
• The charts below and on the following pages show the normalised average daily flows on Stockwell Park Road, showing the difference between pre-implementation flows collected in January 2017 and post-implementation flows from December 2020 and April 2021.
Stockwell Park Road (Daily Flows)
Basemap: ESRI
0200400600800
1000120014001600
Car Pedal Cycle LGV HGV Motorcycle
Stockwell Park Road : Average Flows by Stage
Jan-17 : Actual Jan-17 : Normalised Dec-20 : Actual Dec-20 : Normalised Apr-21 : Actual
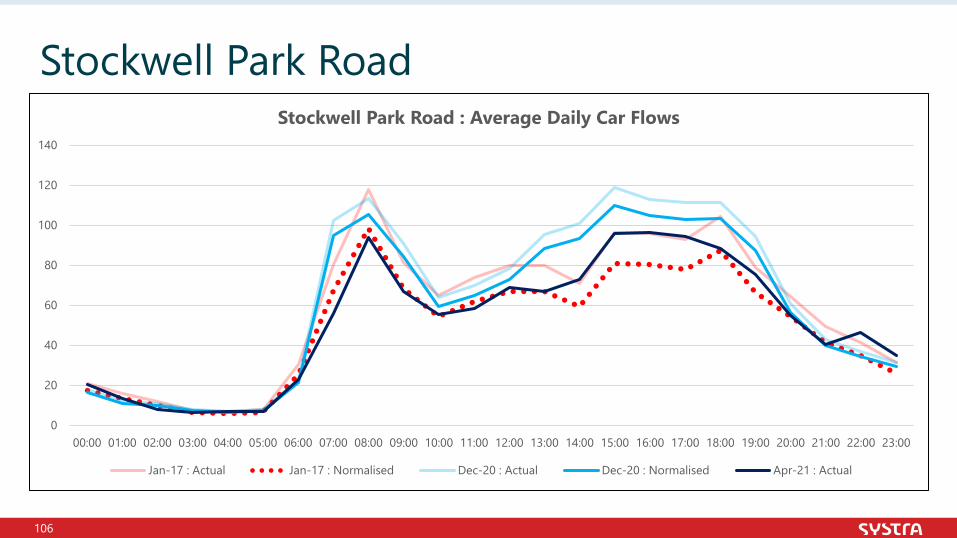
106
Stockwell Park Road
0
20
40
60
80
100
120
140
00:00 01:00 02:00 03:00 04:00 05:00 06:00 07:00 08:00 09:00 10:00 11:00 12:00 13:00 14:00 15:00 16:00 17:00 18:00 19:00 20:00 21:00 22:00 23:00
Stockwell Park Road : Average Daily Car Flows
Jan-17 : Actual Jan-17 : Normalised Dec-20 : Actual Dec-20 : Normalised Apr-21 : Actual
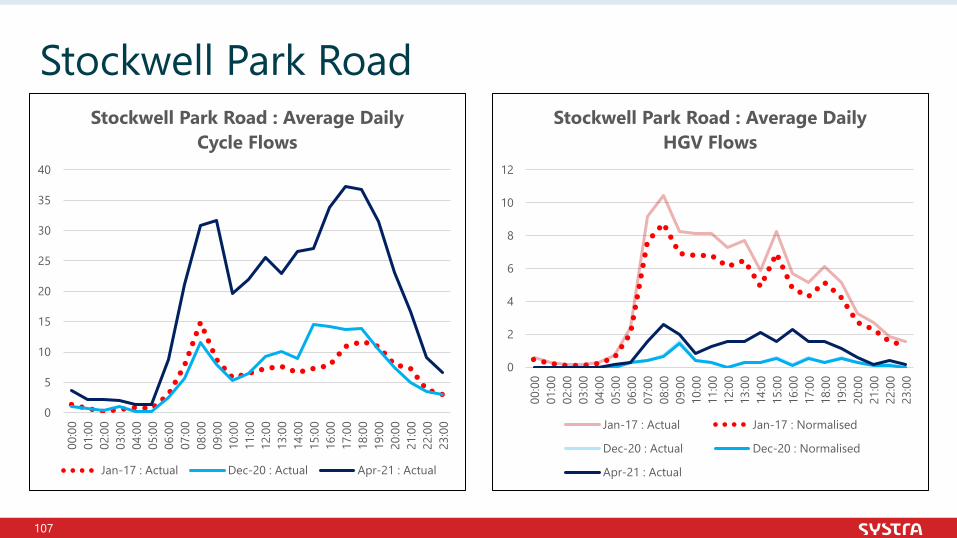
107
Stockwell Park Road
0
5
10
15
20
25
30
35
40
00:0
001
:00
02:0
003
:00
04:0
005
:00
06:0
007
:00
08:0
009
:00
10:0
011
:00
12:0
013
:00
14:0
015
:00
16:0
017
:00
18:0
019
:00
20:0
021
:00
22:0
023
:00
Stockwell Park Road : Average Daily Cycle Flows
Jan-17 : Actual Dec-20 : Actual Apr-21 : Actual
0
2
4
6
8
10
12
00:0
001
:00
02:0
003
:00
04:0
005
:00
06:0
007
:00
08:0
009
:00
10:0
011
:00
12:0
013
:00
14:0
015
:00
16:0
017
:00
18:0
019
:00
20:0
021
:00
22:0
023
:00
Stockwell Park Road : Average Daily HGV Flows
Jan-17 : Actual Jan-17 : Normalised
Dec-20 : Actual Dec-20 : Normalised
Apr-21 : Actual
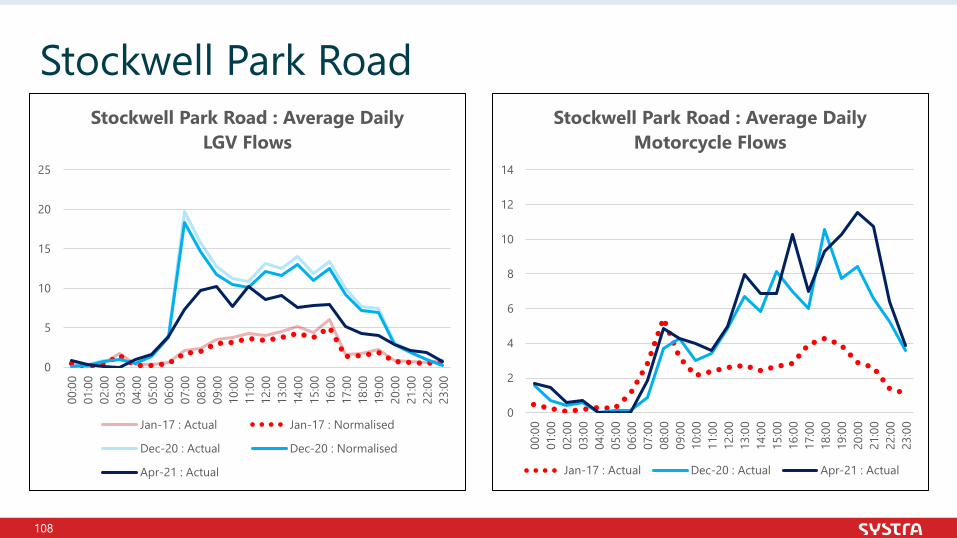
108
Stockwell Park Road
0
5
10
15
20
25
00:0
001
:00
02:0
003
:00
04:0
005
:00
06:0
007
:00
08:0
009
:00
10:0
011
:00
12:0
013
:00
14:0
015
:00
16:0
017
:00
18:0
019
:00
20:0
021
:00
22:0
023
:00
Stockwell Park Road : Average Daily LGV Flows
Jan-17 : Actual Jan-17 : Normalised
Dec-20 : Actual Dec-20 : Normalised
Apr-21 : Actual
0
2
4
6
8
10
12
14
00:0
001
:00
02:0
003
:00
04:0
005
:00
06:0
007
:00
08:0
009
:00
10:0
011
:00
12:0
013
:00
14:0
015
:00
16:0
017
:00
18:0
019
:00
20:0
021
:00
22:0
023
:00
Stockwell Park Road : Average Daily Motorcycle Flows
Jan-17 : Actual Dec-20 : Actual Apr-21 : Actual
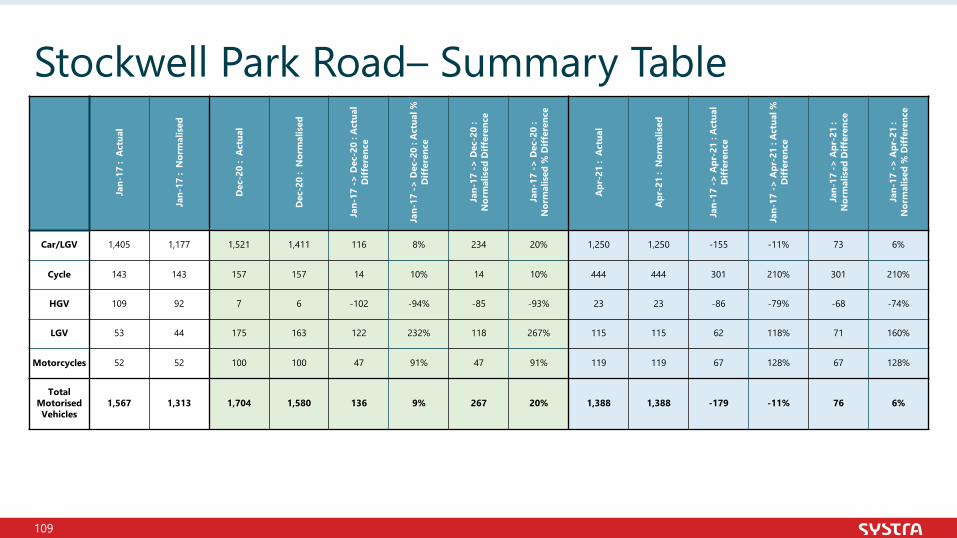
109
Stockwell Park Road– Summary TableJa
n-17
: A
ctua
l
Jan-
17 :
Nor
mal
ised
Dec
-20
: A
ctua
l
Dec
-20
: N
orm
alis
ed
Jan-
17 ->
Dec
-20
: Act
ual
Diff
eren
ce
Jan-
17 ->
Dec
-20
: Act
ual %
D
iffer
ence
Jan-
17 ->
Dec
-20
: N
orm
alis
ed D
iffer
ence
Jan-
17 ->
Dec
-20
: N
orm
alis
ed %
Diff
eren
ce
Apr
-21
: A
ctua
l
Apr
-21
: N
orm
alis
ed
Jan-
17 ->
Apr
-21
: Act
ual
Diff
eren
ce
Jan-
17 ->
Apr
-21
: Act
ual %
D
iffer
ence
Jan-
17 ->
Apr
-21
: N
orm
alis
ed D
iffer
ence
Jan-
17 ->
Apr
-21
: N
orm
alis
ed %
Diff
eren
ce
Car/LGV 1,405 1,177 1,521 1,411 116 8% 234 20% 1,250 1,250 -155 -11% 73 6%
Cycle 143 143 157 157 14 10% 14 10% 444 444 301 210% 301 210%
HGV 109 92 7 6 -102 -94% -85 -93% 23 23 -86 -79% -68 -74%
LGV 53 44 175 163 122 232% 118 267% 115 115 62 118% 71 160%
Motorcycles 52 52 100 100 47 91% 47 91% 119 119 67 128% 67 128%
Total Motorised Vehicles
1,567 1,313 1,704 1,580 136 9% 267 20% 1,388 1,388 -179 -11% 76 6%
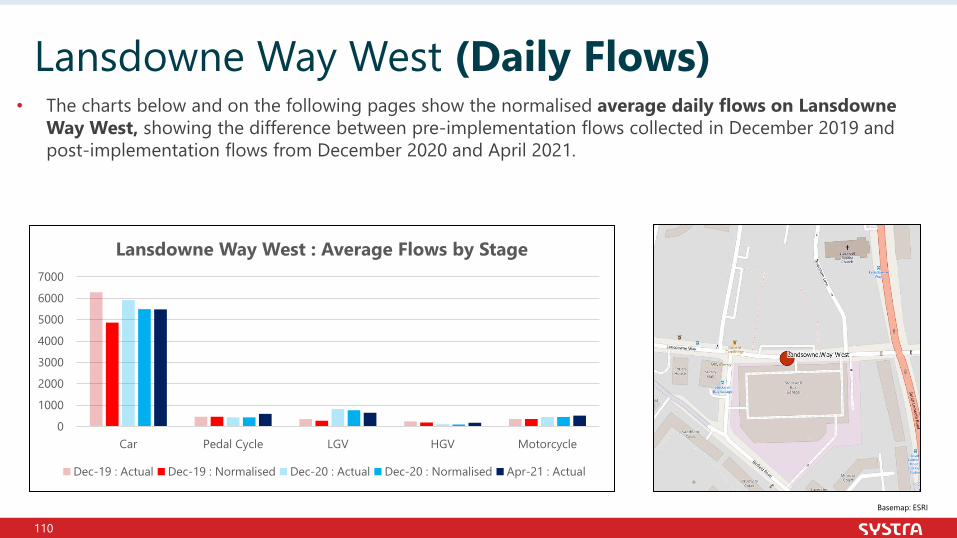
110
• The charts below and on the following pages show the normalised average daily flows on Lansdowne Way West, showing the difference between pre-implementation flows collected in December 2019 and post-implementation flows from December 2020 and April 2021.
Lansdowne Way West (Daily Flows)
Basemap: ESRI
0
1000
2000
3000
4000
5000
6000
7000
Car Pedal Cycle LGV HGV Motorcycle
Lansdowne Way West : Average Flows by Stage
Dec-19 : Actual Dec-19 : Normalised Dec-20 : Actual Dec-20 : Normalised Apr-21 : Actual
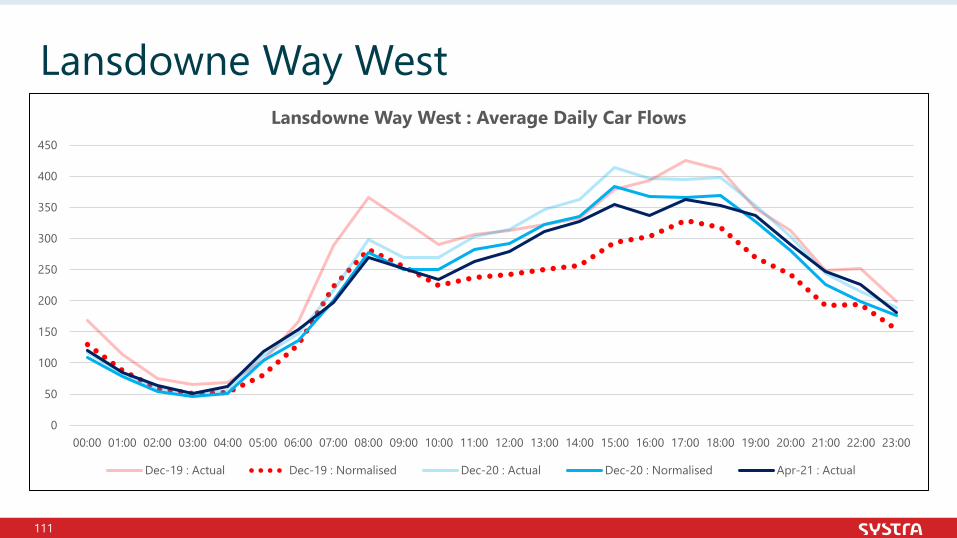
111
Lansdowne Way West
0
50
100
150
200
250
300
350
400
450
00:00 01:00 02:00 03:00 04:00 05:00 06:00 07:00 08:00 09:00 10:00 11:00 12:00 13:00 14:00 15:00 16:00 17:00 18:00 19:00 20:00 21:00 22:00 23:00
Lansdowne Way West : Average Daily Car Flows
Dec-19 : Actual Dec-19 : Normalised Dec-20 : Actual Dec-20 : Normalised Apr-21 : Actual
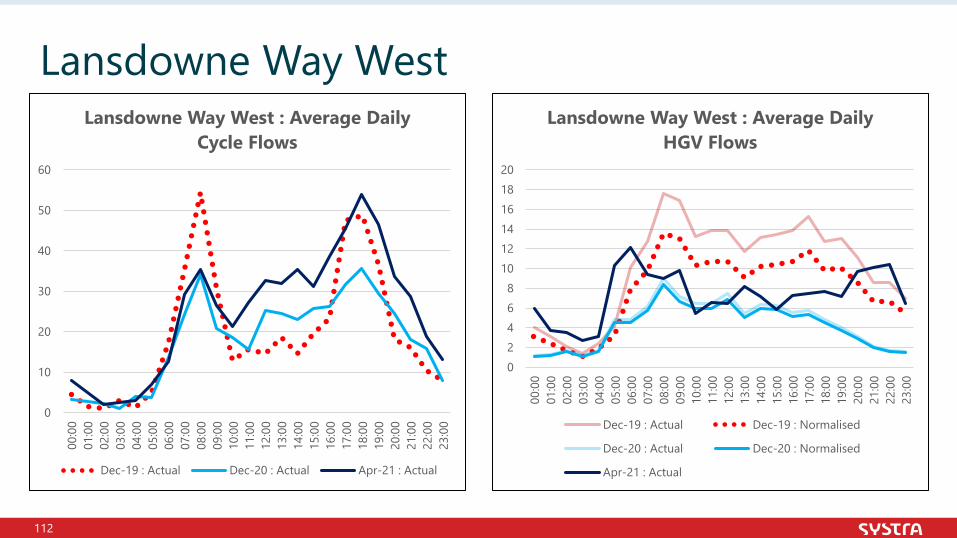
112
Lansdowne Way West
0
10
20
30
40
50
60
00:0
001
:00
02:0
003
:00
04:0
005
:00
06:0
007
:00
08:0
009
:00
10:0
011
:00
12:0
013
:00
14:0
015
:00
16:0
017
:00
18:0
019
:00
20:0
021
:00
22:0
023
:00
Lansdowne Way West : Average Daily Cycle Flows
Dec-19 : Actual Dec-20 : Actual Apr-21 : Actual
02468
101214161820
00:0
001
:00
02:0
003
:00
04:0
005
:00
06:0
007
:00
08:0
009
:00
10:0
011
:00
12:0
013
:00
14:0
015
:00
16:0
017
:00
18:0
019
:00
20:0
021
:00
22:0
023
:00
Lansdowne Way West : Average Daily HGV Flows
Dec-19 : Actual Dec-19 : Normalised
Dec-20 : Actual Dec-20 : Normalised
Apr-21 : Actual
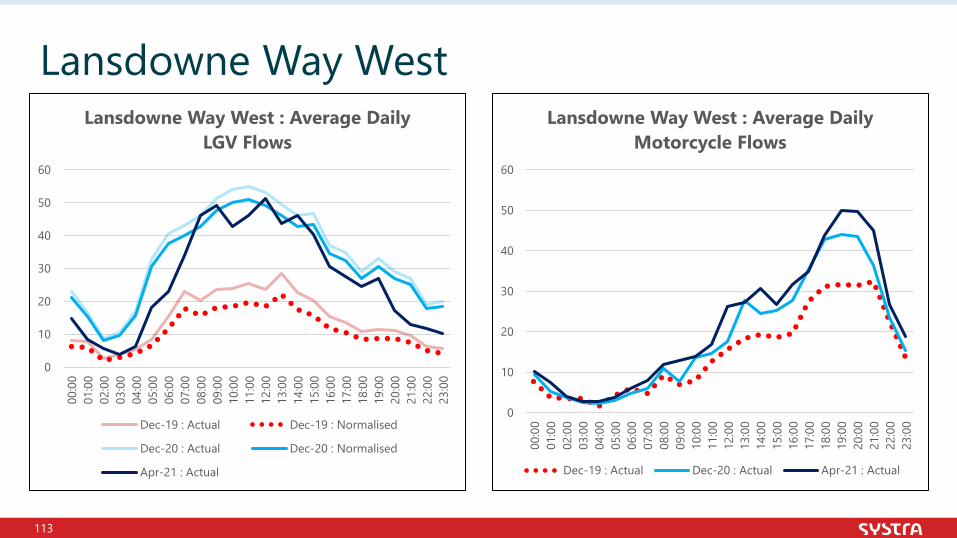
113
Lansdowne Way West
0
10
20
30
40
50
60
00:0
001
:00
02:0
003
:00
04:0
005
:00
06:0
007
:00
08:0
009
:00
10:0
011
:00
12:0
013
:00
14:0
015
:00
16:0
017
:00
18:0
019
:00
20:0
021
:00
22:0
023
:00
Lansdowne Way West : Average Daily LGV Flows
Dec-19 : Actual Dec-19 : Normalised
Dec-20 : Actual Dec-20 : Normalised
Apr-21 : Actual
0
10
20
30
40
50
60
00:0
001
:00
02:0
003
:00
04:0
005
:00
06:0
007
:00
08:0
009
:00
10:0
011
:00
12:0
013
:00
14:0
015
:00
16:0
017
:00
18:0
019
:00
20:0
021
:00
22:0
023
:00
Lansdowne Way West : Average Daily Motorcycle Flows
Dec-19 : Actual Dec-20 : Actual Apr-21 : Actual
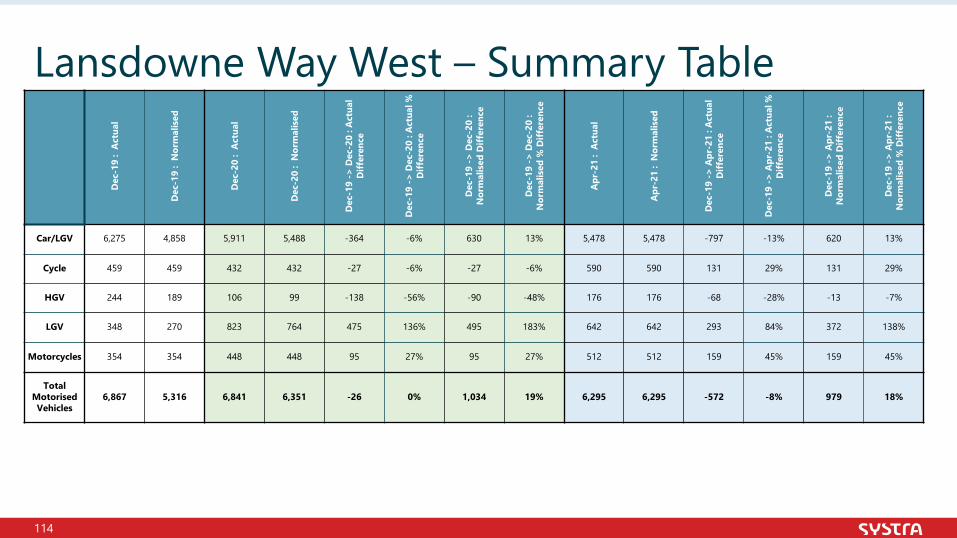
114
Lansdowne Way West – Summary TableD
ec-1
9 :
Act
ual
Dec
-19
: N
orm
alis
ed
Dec
-20
: A
ctua
l
Dec
-20
: N
orm
alis
ed
Dec
-19
-> D
ec-2
0 : A
ctua
l D
iffer
ence
Dec
-19
-> D
ec-2
0 : A
ctua
l %
Diff
eren
ce
Dec
-19
-> D
ec-2
0 :
Nor
mal
ised
Diff
eren
ce
Dec
-19
-> D
ec-2
0 :
Nor
mal
ised
% D
iffer
ence
Apr
-21
: A
ctua
l
Apr
-21
: N
orm
alis
ed
Dec
-19
-> A
pr-2
1 : A
ctua
l D
iffer
ence
Dec
-19
-> A
pr-2
1 : A
ctua
l %
Diff
eren
ce
Dec
-19
-> A
pr-2
1 :
Nor
mal
ised
Diff
eren
ce
Dec
-19
-> A
pr-2
1 :
Nor
mal
ised
% D
iffer
ence
Car/LGV 6,275 4,858 5,911 5,488 -364 -6% 630 13% 5,478 5,478 -797 -13% 620 13%
Cycle 459 459 432 432 -27 -6% -27 -6% 590 590 131 29% 131 29%
HGV 244 189 106 99 -138 -56% -90 -48% 176 176 -68 -28% -13 -7%
LGV 348 270 823 764 475 136% 495 183% 642 642 293 84% 372 138%
Motorcycles 354 354 448 448 95 27% 95 27% 512 512 159 45% 159 45%
Total Motorised Vehicles
6,867 5,316 6,841 6,351 -26 0% 1,034 19% 6,295 6,295 -572 -8% 979 18%
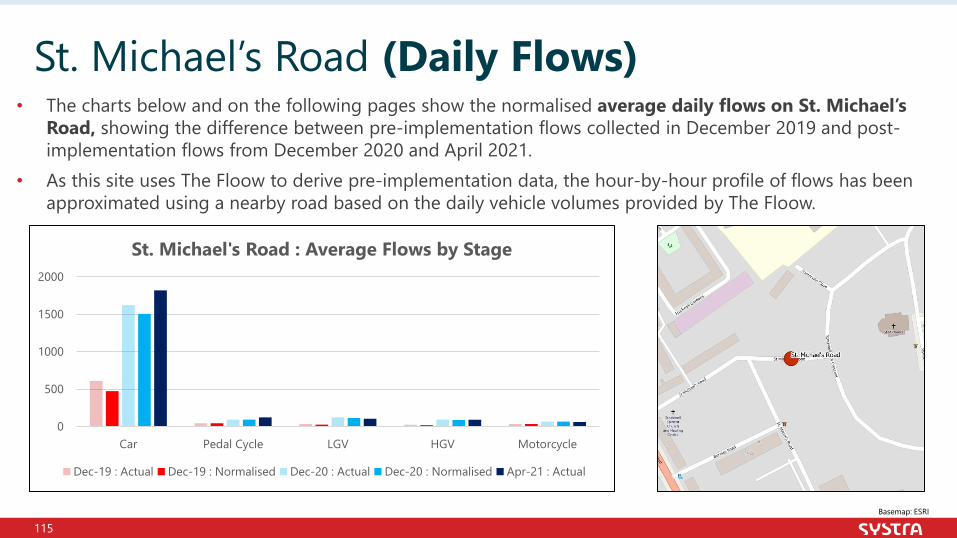
115
• The charts below and on the following pages show the normalised average daily flows on St. Michael’s Road, showing the difference between pre-implementation flows collected in December 2019 and post-implementation flows from December 2020 and April 2021.
• As this site uses The Floow to derive pre-implementation data, the hour-by-hour profile of flows has been approximated using a nearby road based on the daily vehicle volumes provided by The Floow.
St. Michael’s Road (Daily Flows)
Basemap: ESRI
0
500
1000
1500
2000
Car Pedal Cycle LGV HGV Motorcycle
St. Michael's Road : Average Flows by Stage
Dec-19 : Actual Dec-19 : Normalised Dec-20 : Actual Dec-20 : Normalised Apr-21 : Actual
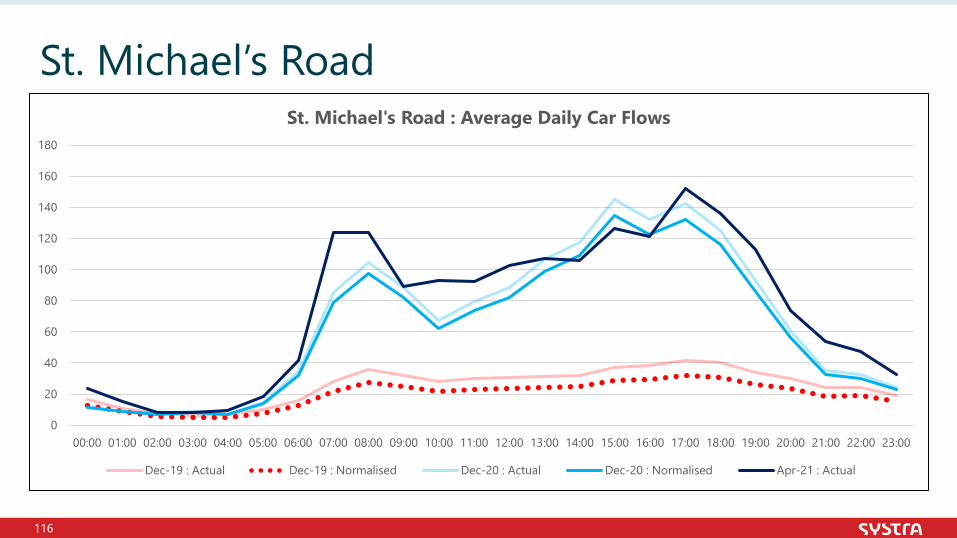
116
St. Michael’s Road
0
20
40
60
80
100
120
140
160
180
00:00 01:00 02:00 03:00 04:00 05:00 06:00 07:00 08:00 09:00 10:00 11:00 12:00 13:00 14:00 15:00 16:00 17:00 18:00 19:00 20:00 21:00 22:00 23:00
St. Michael's Road : Average Daily Car Flows
Dec-19 : Actual Dec-19 : Normalised Dec-20 : Actual Dec-20 : Normalised Apr-21 : Actual
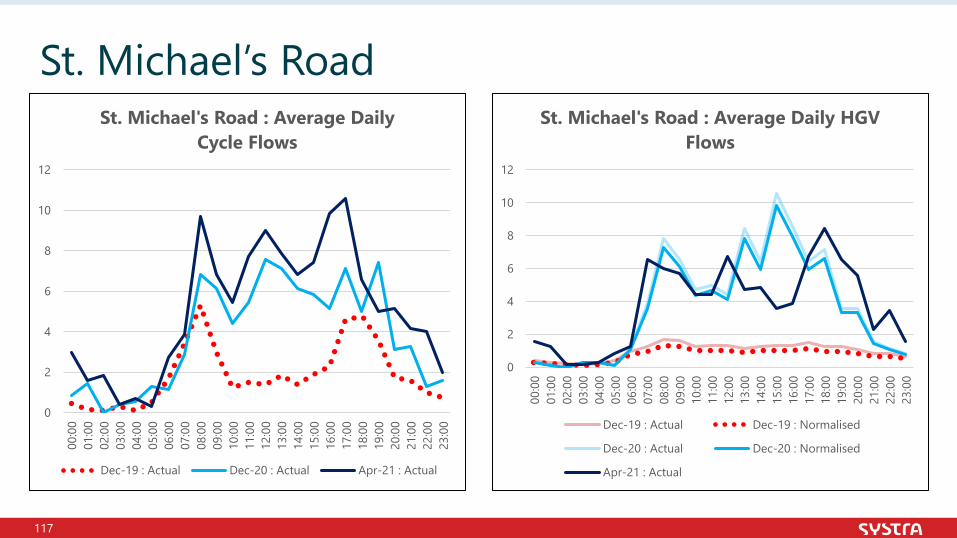
117
St. Michael’s Road
0
2
4
6
8
10
12
00:0
001
:00
02:0
003
:00
04:0
005
:00
06:0
007
:00
08:0
009
:00
10:0
011
:00
12:0
013
:00
14:0
015
:00
16:0
017
:00
18:0
019
:00
20:0
021
:00
22:0
023
:00
St. Michael's Road : Average Daily Cycle Flows
Dec-19 : Actual Dec-20 : Actual Apr-21 : Actual
0
2
4
6
8
10
12
00:0
001
:00
02:0
003
:00
04:0
005
:00
06:0
007
:00
08:0
009
:00
10:0
011
:00
12:0
013
:00
14:0
015
:00
16:0
017
:00
18:0
019
:00
20:0
021
:00
22:0
023
:00
St. Michael's Road : Average Daily HGV Flows
Dec-19 : Actual Dec-19 : Normalised
Dec-20 : Actual Dec-20 : Normalised
Apr-21 : Actual
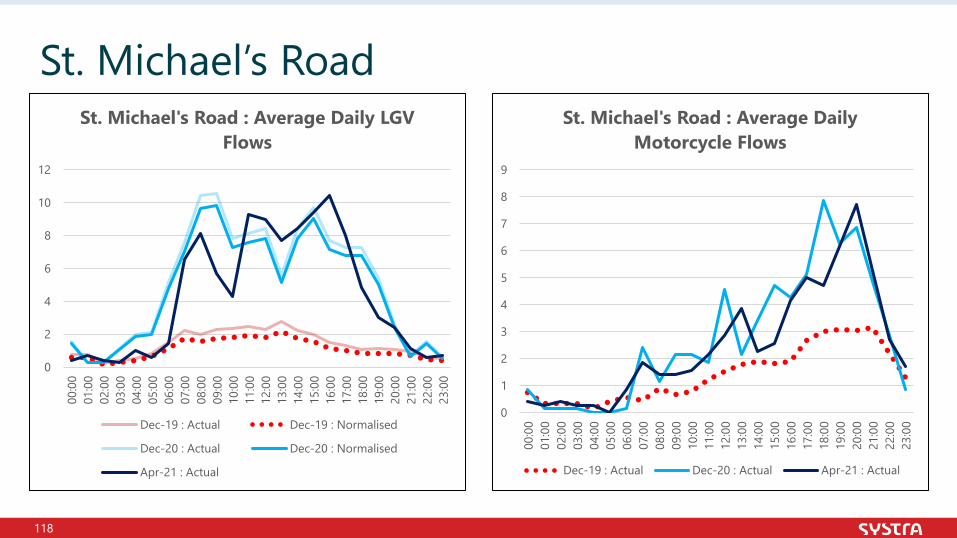
118
St. Michael’s Road
0
2
4
6
8
10
12
00:0
001
:00
02:0
003
:00
04:0
005
:00
06:0
007
:00
08:0
009
:00
10:0
011
:00
12:0
013
:00
14:0
015
:00
16:0
017
:00
18:0
019
:00
20:0
021
:00
22:0
023
:00
St. Michael's Road : Average Daily LGV Flows
Dec-19 : Actual Dec-19 : Normalised
Dec-20 : Actual Dec-20 : Normalised
Apr-21 : Actual
0
1
2
3
4
5
6
7
8
9
00:0
001
:00
02:0
003
:00
04:0
005
:00
06:0
007
:00
08:0
009
:00
10:0
011
:00
12:0
013
:00
14:0
015
:00
16:0
017
:00
18:0
019
:00
20:0
021
:00
22:0
023
:00
St. Michael's Road : Average Daily Motorcycle Flows
Dec-19 : Actual Dec-20 : Actual Apr-21 : Actual
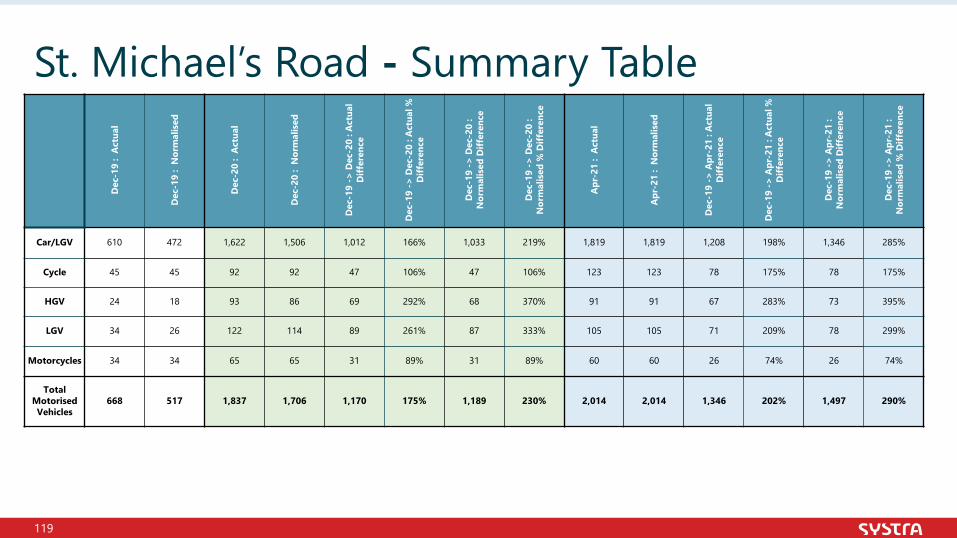
119
St. Michael’s Road - Summary TableD
ec-1
9 :
Act
ual
Dec
-19
: N
orm
alis
ed
Dec
-20
: A
ctua
l
Dec
-20
: N
orm
alis
ed
Dec
-19
-> D
ec-2
0 : A
ctua
l D
iffer
ence
Dec
-19
-> D
ec-2
0 : A
ctua
l %
Diff
eren
ce
Dec
-19
-> D
ec-2
0 :
Nor
mal
ised
Diff
eren
ce
Dec
-19
-> D
ec-2
0 :
Nor
mal
ised
% D
iffer
ence
Apr
-21
: A
ctua
l
Apr
-21
: N
orm
alis
ed
Dec
-19
-> A
pr-2
1 : A
ctua
l D
iffer
ence
Dec
-19
-> A
pr-2
1 : A
ctua
l %
Diff
eren
ce
Dec
-19
-> A
pr-2
1 :
Nor
mal
ised
Diff
eren
ce
Dec
-19
-> A
pr-2
1 :
Nor
mal
ised
% D
iffer
ence
Car/LGV 610 472 1,622 1,506 1,012 166% 1,033 219% 1,819 1,819 1,208 198% 1,346 285%
Cycle 45 45 92 92 47 106% 47 106% 123 123 78 175% 78 175%
HGV 24 18 93 86 69 292% 68 370% 91 91 67 283% 73 395%
LGV 34 26 122 114 89 261% 87 333% 105 105 71 209% 78 299%
Motorcycles 34 34 65 65 31 89% 31 89% 60 60 26 74% 26 74%
Total Motorised Vehicles
668 517 1,837 1,706 1,170 175% 1,189 230% 2,014 2,014 1,346 202% 1,497 290%
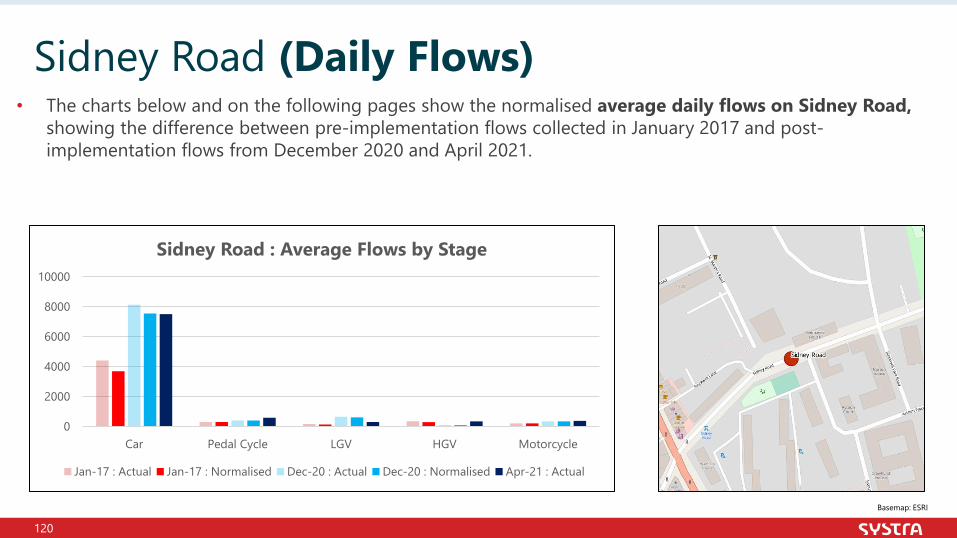
120
• The charts below and on the following pages show the normalised average daily flows on Sidney Road, showing the difference between pre-implementation flows collected in January 2017 and post-implementation flows from December 2020 and April 2021.
Sidney Road (Daily Flows)
Basemap: ESRI
0
2000
4000
6000
8000
10000
Car Pedal Cycle LGV HGV Motorcycle
Sidney Road : Average Flows by Stage
Jan-17 : Actual Jan-17 : Normalised Dec-20 : Actual Dec-20 : Normalised Apr-21 : Actual
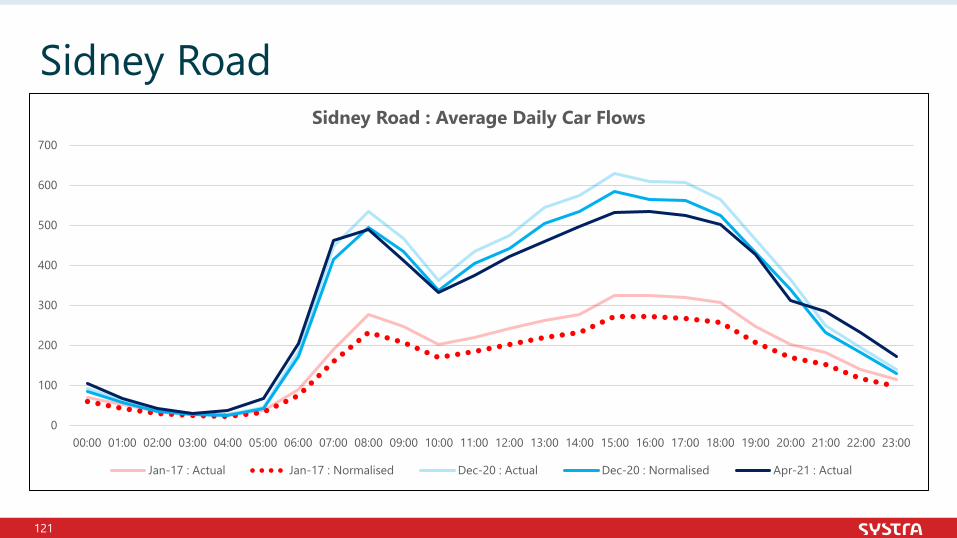
121
Sidney Road
0
100
200
300
400
500
600
700
00:00 01:00 02:00 03:00 04:00 05:00 06:00 07:00 08:00 09:00 10:00 11:00 12:00 13:00 14:00 15:00 16:00 17:00 18:00 19:00 20:00 21:00 22:00 23:00
Sidney Road : Average Daily Car Flows
Jan-17 : Actual Jan-17 : Normalised Dec-20 : Actual Dec-20 : Normalised Apr-21 : Actual
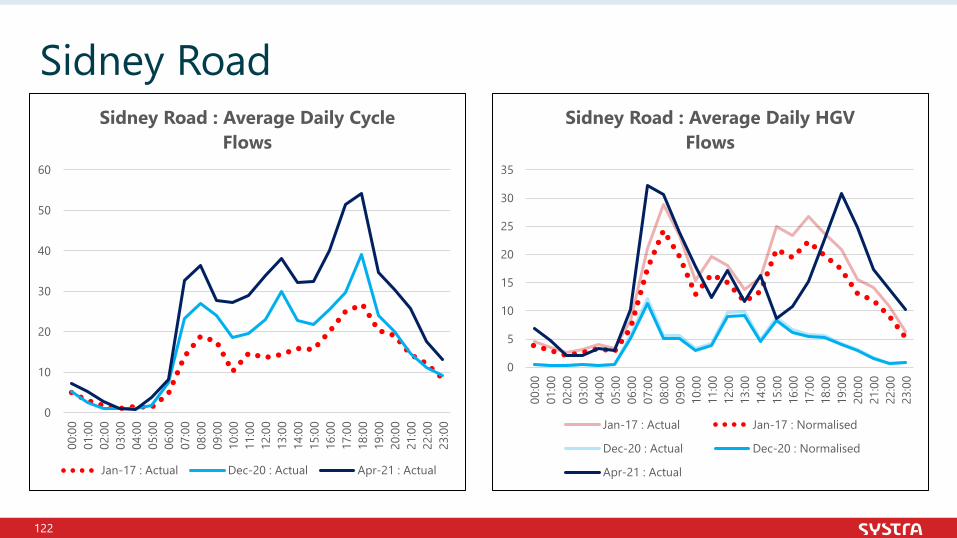
122
Sidney Road
0
10
20
30
40
50
60
00:0
001
:00
02:0
003
:00
04:0
005
:00
06:0
007
:00
08:0
009
:00
10:0
011
:00
12:0
013
:00
14:0
015
:00
16:0
017
:00
18:0
019
:00
20:0
021
:00
22:0
023
:00
Sidney Road : Average Daily Cycle Flows
Jan-17 : Actual Dec-20 : Actual Apr-21 : Actual
0
5
10
15
20
25
30
35
00:0
001
:00
02:0
003
:00
04:0
005
:00
06:0
007
:00
08:0
009
:00
10:0
011
:00
12:0
013
:00
14:0
015
:00
16:0
017
:00
18:0
019
:00
20:0
021
:00
22:0
023
:00
Sidney Road : Average Daily HGV Flows
Jan-17 : Actual Jan-17 : Normalised
Dec-20 : Actual Dec-20 : Normalised
Apr-21 : Actual
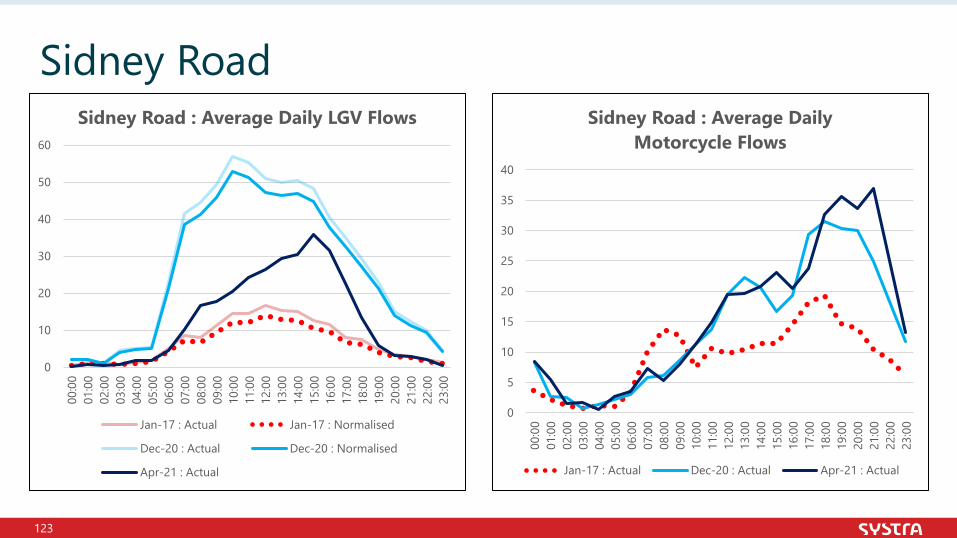
123
Sidney Road
0
10
20
30
40
50
60
00:0
001
:00
02:0
003
:00
04:0
005
:00
06:0
007
:00
08:0
009
:00
10:0
011
:00
12:0
013
:00
14:0
015
:00
16:0
017
:00
18:0
019
:00
20:0
021
:00
22:0
023
:00
Sidney Road : Average Daily LGV Flows
Jan-17 : Actual Jan-17 : Normalised
Dec-20 : Actual Dec-20 : Normalised
Apr-21 : Actual
0
5
10
15
20
25
30
35
40
00:0
001
:00
02:0
003
:00
04:0
005
:00
06:0
007
:00
08:0
009
:00
10:0
011
:00
12:0
013
:00
14:0
015
:00
16:0
017
:00
18:0
019
:00
20:0
021
:00
22:0
023
:00
Sidney Road : Average Daily Motorcycle Flows
Jan-17 : Actual Dec-20 : Actual Apr-21 : Actual
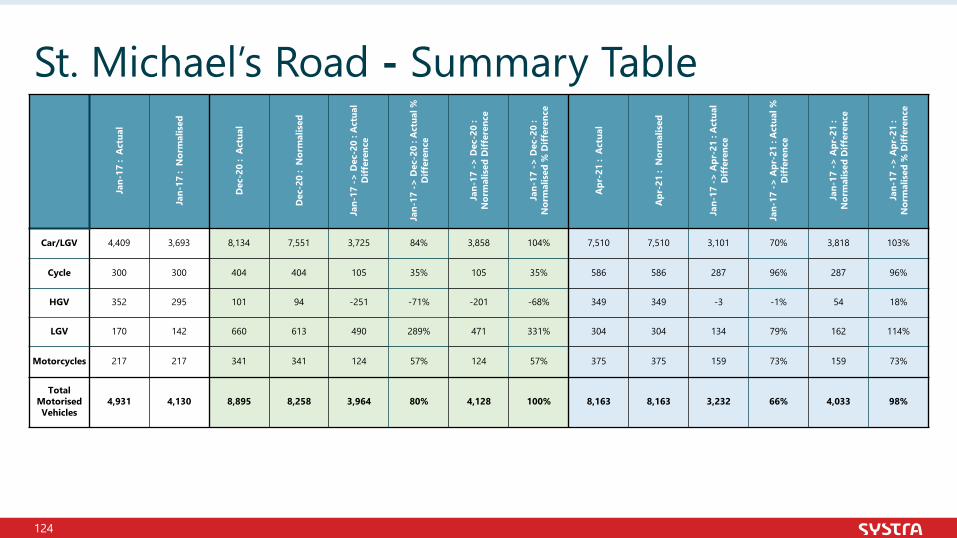
124
St. Michael’s Road - Summary TableJa
n-17
: A
ctua
l
Jan-
17 :
Nor
mal
ised
Dec
-20
: A
ctua
l
Dec
-20
: N
orm
alis
ed
Jan-
17 ->
Dec
-20
: Act
ual
Diff
eren
ce
Jan-
17 ->
Dec
-20
: Act
ual %
D
iffer
ence
Jan-
17 ->
Dec
-20
: N
orm
alis
ed D
iffer
ence
Jan-
17 ->
Dec
-20
: N
orm
alis
ed %
Diff
eren
ce
Apr
-21
: A
ctua
l
Apr
-21
: N
orm
alis
ed
Jan-
17 ->
Apr
-21
: Act
ual
Diff
eren
ce
Jan-
17 ->
Apr
-21
: Act
ual %
D
iffer
ence
Jan-
17 ->
Apr
-21
: N
orm
alis
ed D
iffer
ence
Jan-
17 ->
Apr
-21
: N
orm
alis
ed %
Diff
eren
ce
Car/LGV 4,409 3,693 8,134 7,551 3,725 84% 3,858 104% 7,510 7,510 3,101 70% 3,818 103%
Cycle 300 300 404 404 105 35% 105 35% 586 586 287 96% 287 96%
HGV 352 295 101 94 -251 -71% -201 -68% 349 349 -3 -1% 54 18%
LGV 170 142 660 613 490 289% 471 331% 304 304 134 79% 162 114%
Motorcycles 217 217 341 341 124 57% 124 57% 375 375 159 73% 159 73%
Total Motorised Vehicles
4,931 4,130 8,895 8,258 3,964 80% 4,128 100% 8,163 8,163 3,232 66% 4,033 98%
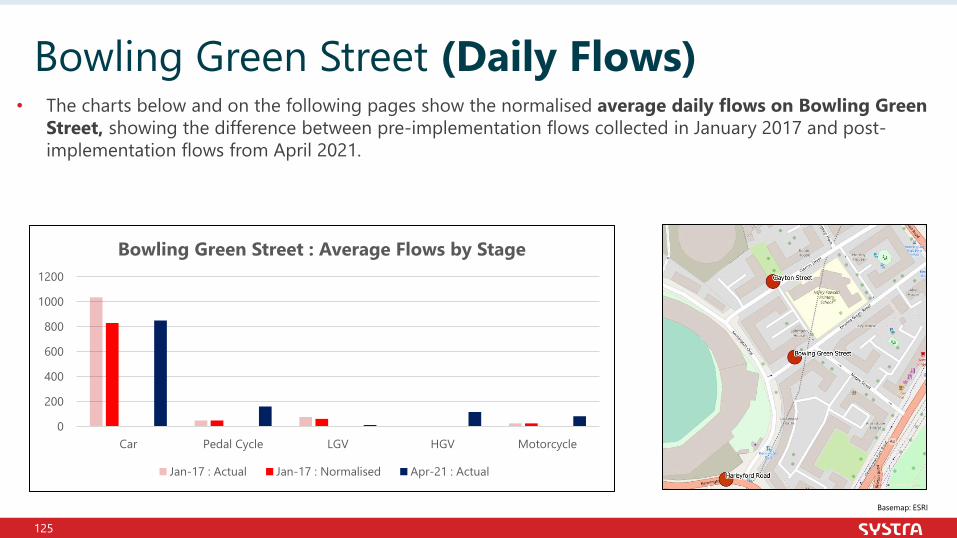
125
• The charts below and on the following pages show the normalised average daily flows on Bowling Green Street, showing the difference between pre-implementation flows collected in January 2017 and post-implementation flows from April 2021.
Bowling Green Street (Daily Flows)
Basemap: ESRI
0
200
400
600
800
1000
1200
Car Pedal Cycle LGV HGV Motorcycle
Bowling Green Street : Average Flows by Stage
Jan-17 : Actual Jan-17 : Normalised Apr-21 : Actual
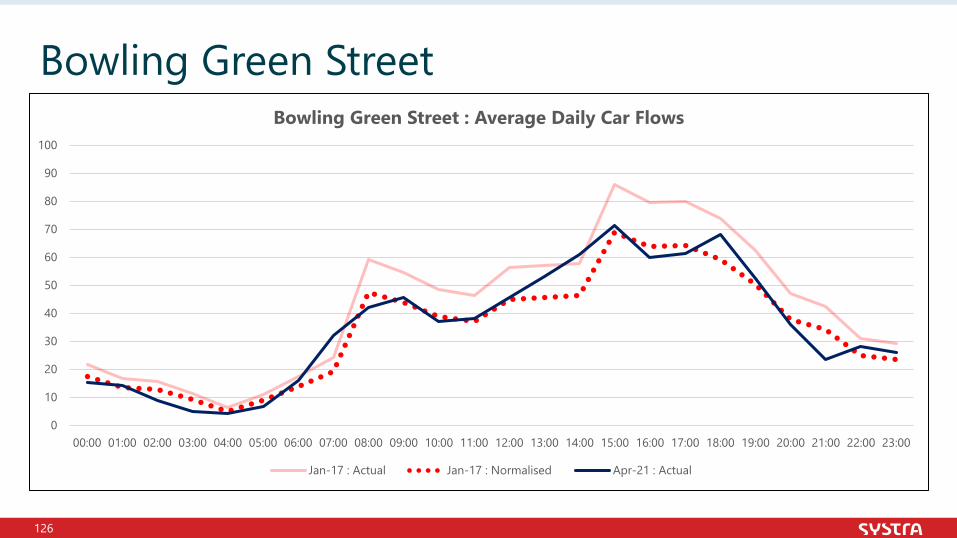
126
Bowling Green Street
0
10
20
30
40
50
60
70
80
90
100
00:00 01:00 02:00 03:00 04:00 05:00 06:00 07:00 08:00 09:00 10:00 11:00 12:00 13:00 14:00 15:00 16:00 17:00 18:00 19:00 20:00 21:00 22:00 23:00
Bowling Green Street : Average Daily Car Flows
Jan-17 : Actual Jan-17 : Normalised Apr-21 : Actual
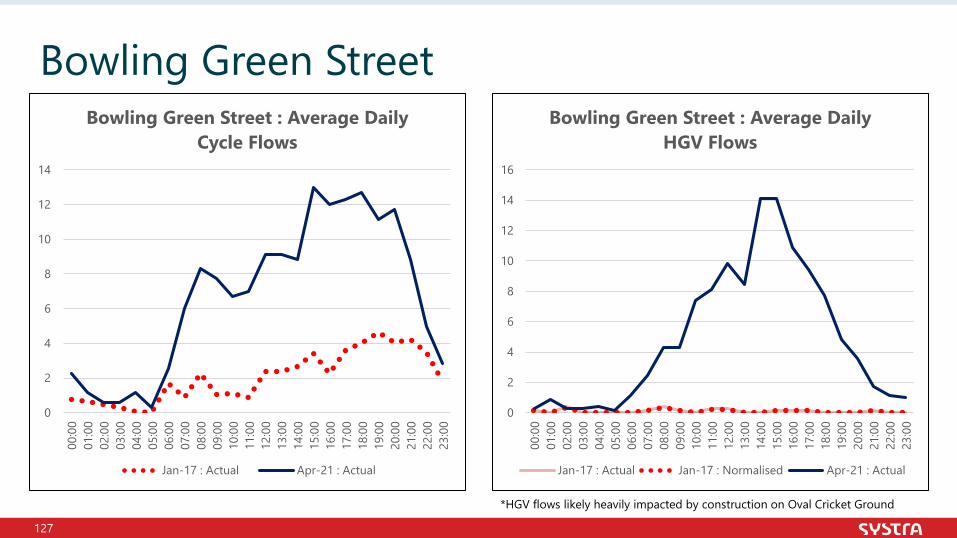
127
Bowling Green Street
*HGV flows likely heavily impacted by construction on Oval Cricket Ground
0
2
4
6
8
10
12
14
00:0
001
:00
02:0
003
:00
04:0
005
:00
06:0
007
:00
08:0
009
:00
10:0
011
:00
12:0
013
:00
14:0
015
:00
16:0
017
:00
18:0
019
:00
20:0
021
:00
22:0
023
:00
Bowling Green Street : Average Daily Cycle Flows
Jan-17 : Actual Apr-21 : Actual
0
2
4
6
8
10
12
14
16
00:0
001
:00
02:0
003
:00
04:0
005
:00
06:0
007
:00
08:0
009
:00
10:0
011
:00
12:0
013
:00
14:0
015
:00
16:0
017
:00
18:0
019
:00
20:0
021
:00
22:0
023
:00
Bowling Green Street : Average Daily HGV Flows
Jan-17 : Actual Jan-17 : Normalised Apr-21 : Actual
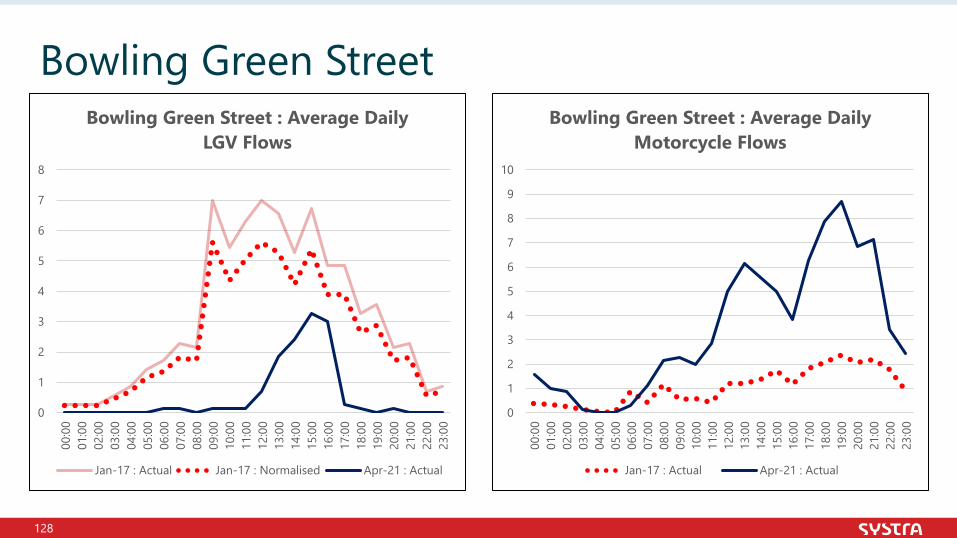
128
Bowling Green Street
0
1
2
3
4
5
6
7
8
00:0
001
:00
02:0
003
:00
04:0
005
:00
06:0
007
:00
08:0
009
:00
10:0
011
:00
12:0
013
:00
14:0
015
:00
16:0
017
:00
18:0
019
:00
20:0
021
:00
22:0
023
:00
Bowling Green Street : Average Daily LGV Flows
Jan-17 : Actual Jan-17 : Normalised Apr-21 : Actual
0
1
2
3
4
5
6
7
8
9
10
00:0
001
:00
02:0
003
:00
04:0
005
:00
06:0
007
:00
08:0
009
:00
10:0
011
:00
12:0
013
:00
14:0
015
:00
16:0
017
:00
18:0
019
:00
20:0
021
:00
22:0
023
:00
Bowling Green Street : Average Daily Motorcycle Flows
Jan-17 : Actual Apr-21 : Actual
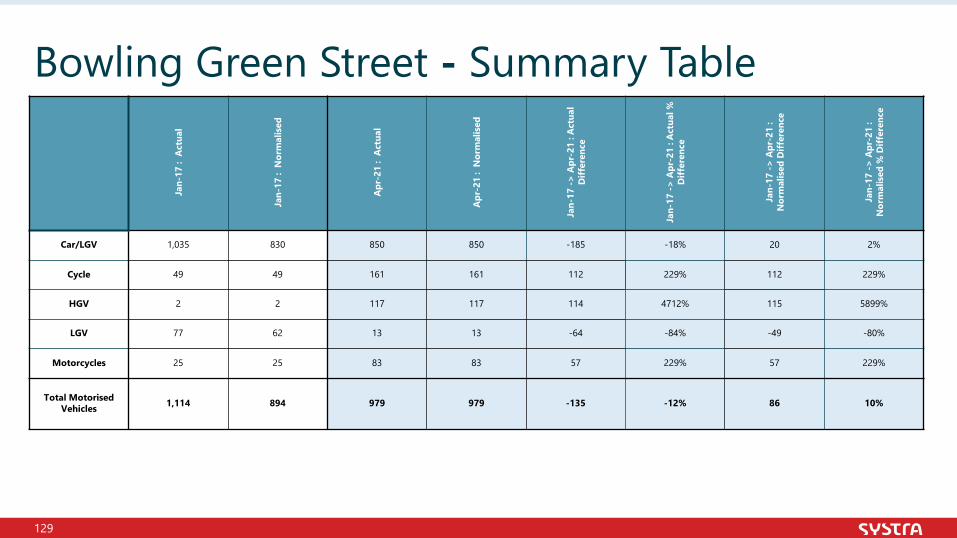
129
Bowling Green Street - Summary Table
Jan-
17 :
Act
ual
Jan-
17 :
Nor
mal
ised
Apr
-21
: A
ctua
l
Apr
-21
: N
orm
alis
ed
Jan-
17 ->
Apr
-21
: Act
ual
Diff
eren
ce
Jan-
17 ->
Apr
-21
: Act
ual %
D
iffer
ence
Jan-
17 ->
Apr
-21
: N
orm
alis
ed D
iffer
ence
Jan-
17 ->
Apr
-21
: N
orm
alis
ed %
Diff
eren
ce
Car/LGV 1,035 830 850 850 -185 -18% 20 2%
Cycle 49 49 161 161 112 229% 112 229%
HGV 2 2 117 117 114 4712% 115 5899%
LGV 77 62 13 13 -64 -84% -49 -80%
Motorcycles 25 25 83 83 57 229% 57 229%
Total Motorised Vehicles 1,114 894 979 979 -135 -12% 86 10%
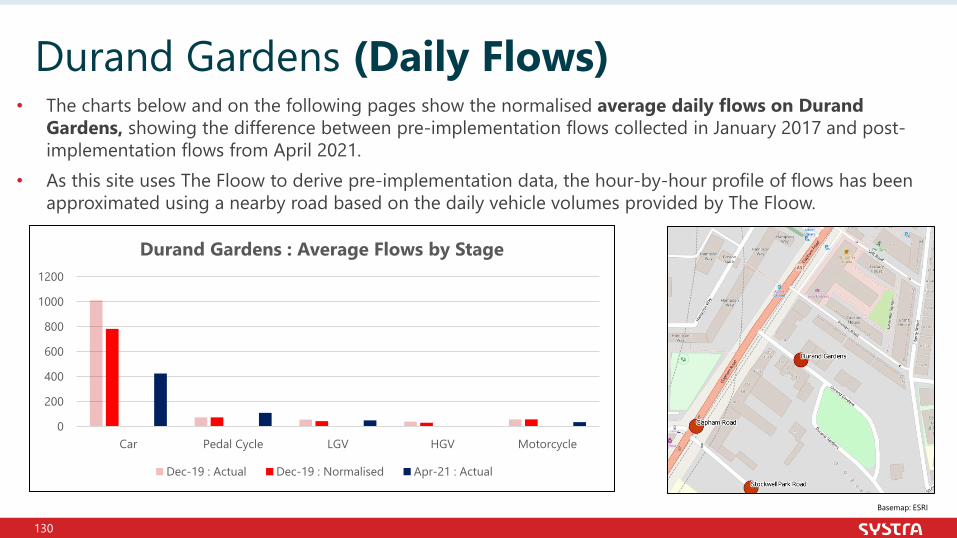
130
• The charts below and on the following pages show the normalised average daily flows on Durand Gardens, showing the difference between pre-implementation flows collected in January 2017 and post-implementation flows from April 2021.
• As this site uses The Floow to derive pre-implementation data, the hour-by-hour profile of flows has been approximated using a nearby road based on the daily vehicle volumes provided by The Floow.
Durand Gardens (Daily Flows)
Basemap: ESRI
0
200
400
600
800
1000
1200
Car Pedal Cycle LGV HGV Motorcycle
Durand Gardens : Average Flows by Stage
Dec-19 : Actual Dec-19 : Normalised Apr-21 : Actual
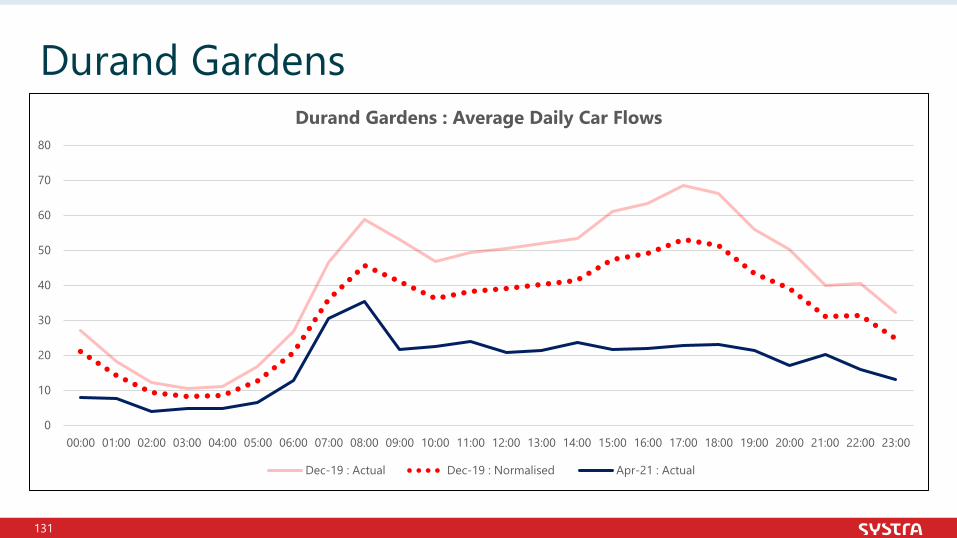
131
Durand Gardens
0
10
20
30
40
50
60
70
80
00:00 01:00 02:00 03:00 04:00 05:00 06:00 07:00 08:00 09:00 10:00 11:00 12:00 13:00 14:00 15:00 16:00 17:00 18:00 19:00 20:00 21:00 22:00 23:00
Durand Gardens : Average Daily Car Flows
Dec-19 : Actual Dec-19 : Normalised Apr-21 : Actual
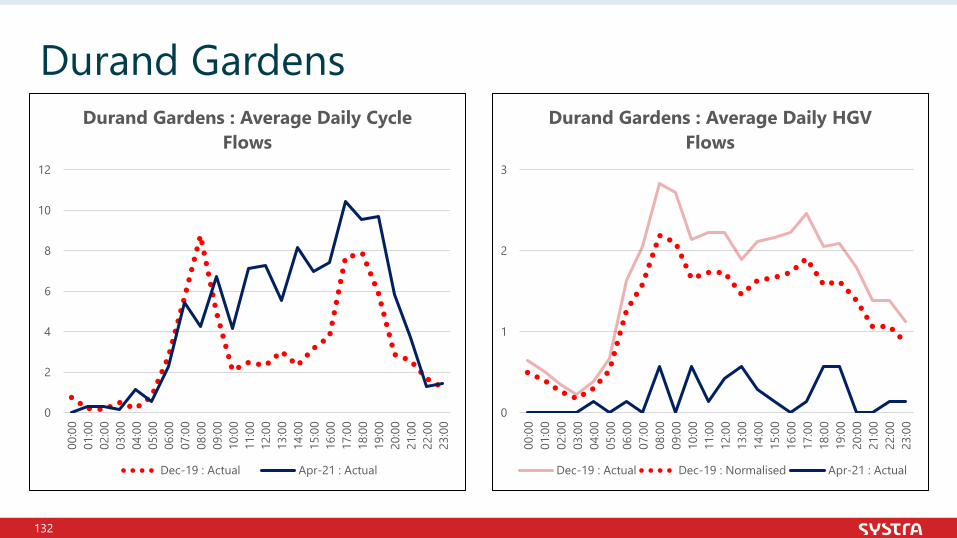
132
Durand Gardens
0
2
4
6
8
10
12
00:0
001
:00
02:0
003
:00
04:0
005
:00
06:0
007
:00
08:0
009
:00
10:0
011
:00
12:0
013
:00
14:0
015
:00
16:0
017
:00
18:0
019
:00
20:0
021
:00
22:0
023
:00
Durand Gardens : Average Daily Cycle Flows
Dec-19 : Actual Apr-21 : Actual
0
1
2
3
00:0
001
:00
02:0
003
:00
04:0
005
:00
06:0
007
:00
08:0
009
:00
10:0
011
:00
12:0
013
:00
14:0
015
:00
16:0
017
:00
18:0
019
:00
20:0
021
:00
22:0
023
:00
Durand Gardens : Average Daily HGV Flows
Dec-19 : Actual Dec-19 : Normalised Apr-21 : Actual
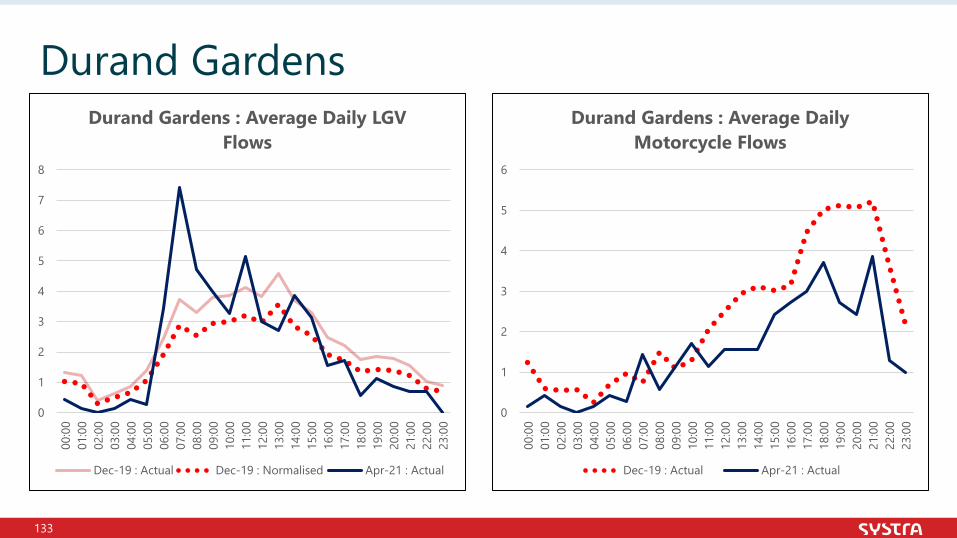
133
Durand Gardens
0
1
2
3
4
5
6
7
8
00:0
001
:00
02:0
003
:00
04:0
005
:00
06:0
007
:00
08:0
009
:00
10:0
011
:00
12:0
013
:00
14:0
015
:00
16:0
017
:00
18:0
019
:00
20:0
021
:00
22:0
023
:00
Durand Gardens : Average Daily LGV Flows
Dec-19 : Actual Dec-19 : Normalised Apr-21 : Actual
0
1
2
3
4
5
6
00:0
001
:00
02:0
003
:00
04:0
005
:00
06:0
007
:00
08:0
009
:00
10:0
011
:00
12:0
013
:00
14:0
015
:00
16:0
017
:00
18:0
019
:00
20:0
021
:00
22:0
023
:00
Durand Gardens : Average Daily Motorcycle Flows
Dec-19 : Actual Apr-21 : Actual
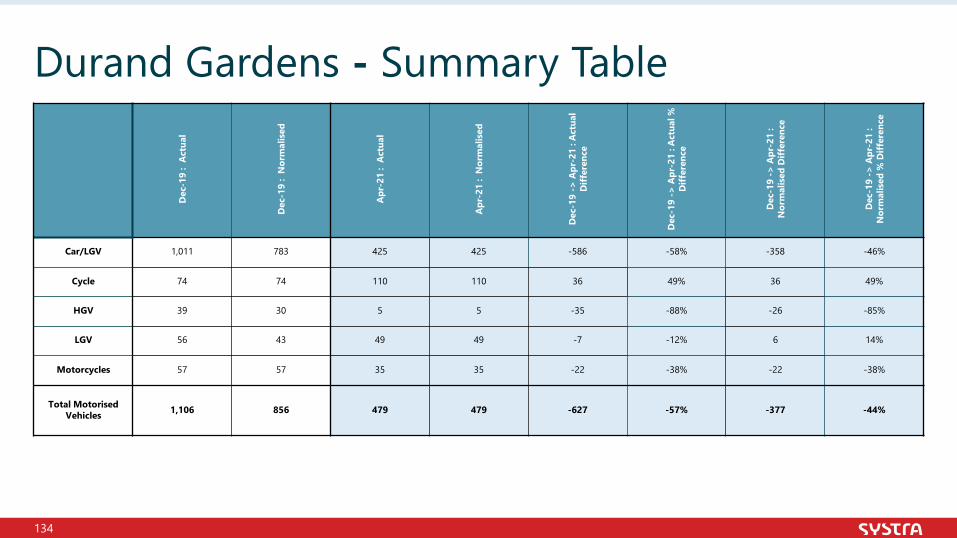
134
Durand Gardens - Summary Table
Dec
-19
: A
ctua
l
Dec
-19
: N
orm
alis
ed
Apr
-21
: A
ctua
l
Apr
-21
: N
orm
alis
ed
Dec
-19
-> A
pr-2
1 : A
ctua
l D
iffer
ence
Dec
-19
-> A
pr-2
1 : A
ctua
l %
Diff
eren
ce
Dec
-19
-> A
pr-2
1 :
Nor
mal
ised
Diff
eren
ce
Dec
-19
-> A
pr-2
1 :
Nor
mal
ised
% D
iffer
ence
Car/LGV 1,011 783 425 425 -586 -58% -358 -46%
Cycle 74 74 110 110 36 49% 36 49%
HGV 39 30 5 5 -35 -88% -26 -85%
LGV 56 43 49 49 -7 -12% 6 14%
Motorcycles 57 57 35 35 -22 -38% -22 -38%
Total Motorised Vehicles 1,106 856 479 479 -627 -57% -377 -44%
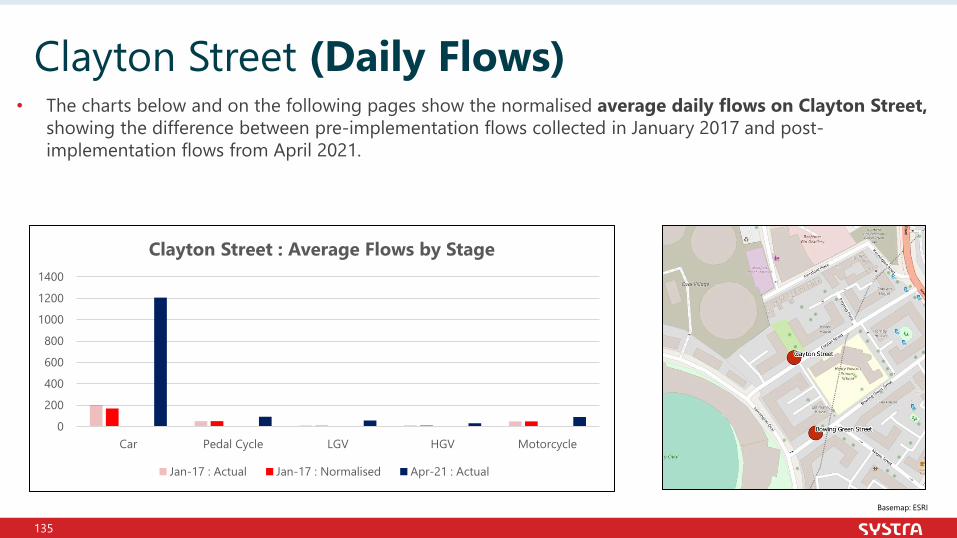
135
• The charts below and on the following pages show the normalised average daily flows on Clayton Street, showing the difference between pre-implementation flows collected in January 2017 and post-implementation flows from April 2021.
Clayton Street (Daily Flows)
Basemap: ESRI
0
200
400
600
800
1000
1200
1400
Car Pedal Cycle LGV HGV Motorcycle
Clayton Street : Average Flows by Stage
Jan-17 : Actual Jan-17 : Normalised Apr-21 : Actual
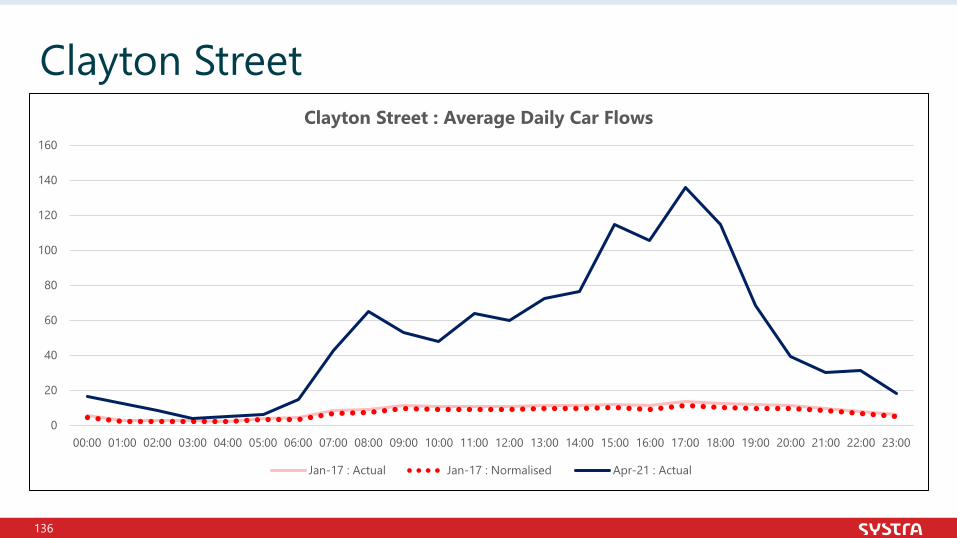
136
Clayton Street
0
20
40
60
80
100
120
140
160
00:00 01:00 02:00 03:00 04:00 05:00 06:00 07:00 08:00 09:00 10:00 11:00 12:00 13:00 14:00 15:00 16:00 17:00 18:00 19:00 20:00 21:00 22:00 23:00
Clayton Street : Average Daily Car Flows
Jan-17 : Actual Jan-17 : Normalised Apr-21 : Actual
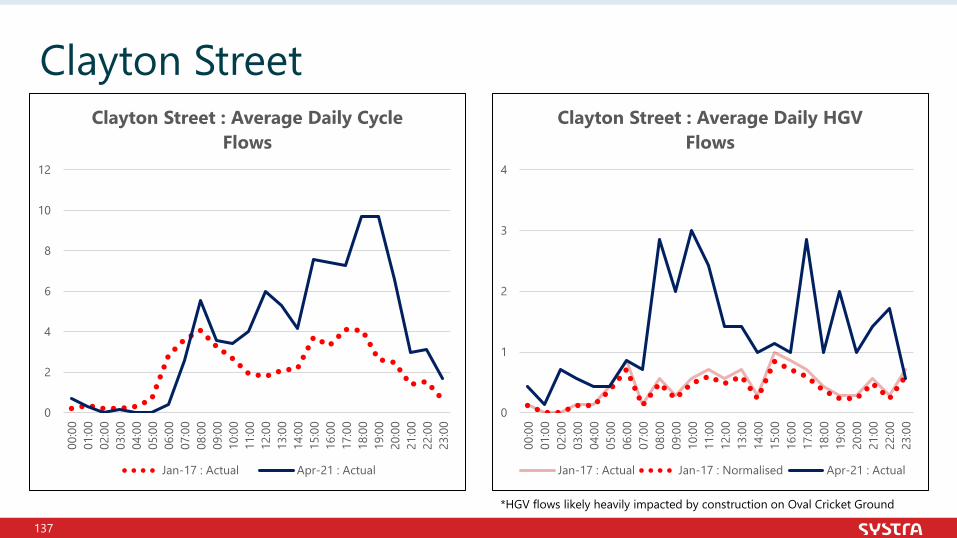
137
Clayton Street
*HGV flows likely heavily impacted by construction on Oval Cricket Ground
0
2
4
6
8
10
12
00:0
001
:00
02:0
003
:00
04:0
005
:00
06:0
007
:00
08:0
009
:00
10:0
011
:00
12:0
013
:00
14:0
015
:00
16:0
017
:00
18:0
019
:00
20:0
021
:00
22:0
023
:00
Clayton Street : Average Daily Cycle Flows
Jan-17 : Actual Apr-21 : Actual
0
1
2
3
4
00:0
001
:00
02:0
003
:00
04:0
005
:00
06:0
007
:00
08:0
009
:00
10:0
011
:00
12:0
013
:00
14:0
015
:00
16:0
017
:00
18:0
019
:00
20:0
021
:00
22:0
023
:00
Clayton Street : Average Daily HGV Flows
Jan-17 : Actual Jan-17 : Normalised Apr-21 : Actual
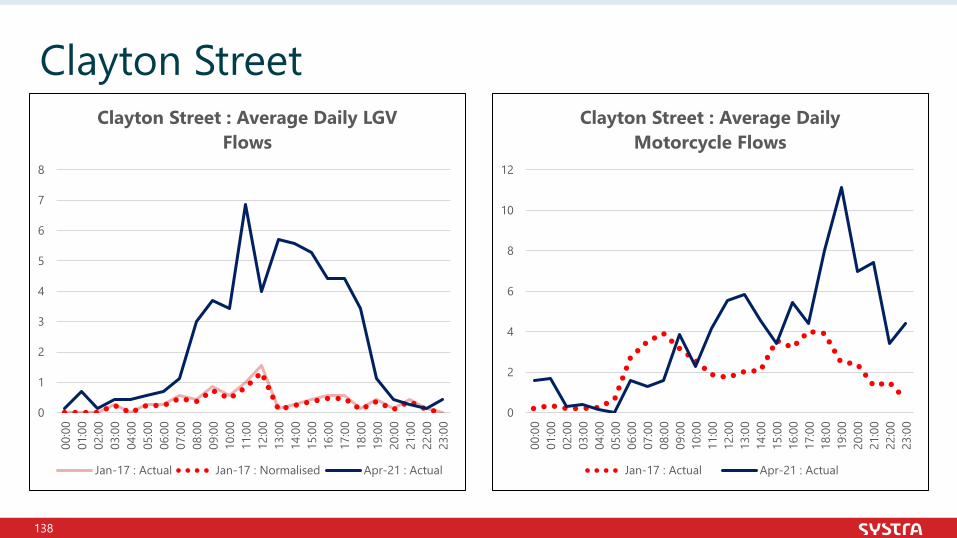
138
Clayton Street
0
1
2
3
4
5
6
7
8
00:0
001
:00
02:0
003
:00
04:0
005
:00
06:0
007
:00
08:0
009
:00
10:0
011
:00
12:0
013
:00
14:0
015
:00
16:0
017
:00
18:0
019
:00
20:0
021
:00
22:0
023
:00
Clayton Street : Average Daily LGV Flows
Jan-17 : Actual Jan-17 : Normalised Apr-21 : Actual
0
2
4
6
8
10
12
00:0
001
:00
02:0
003
:00
04:0
005
:00
06:0
007
:00
08:0
009
:00
10:0
011
:00
12:0
013
:00
14:0
015
:00
16:0
017
:00
18:0
019
:00
20:0
021
:00
22:0
023
:00
Clayton Street : Average Daily Motorcycle Flows
Jan-17 : Actual Apr-21 : Actual
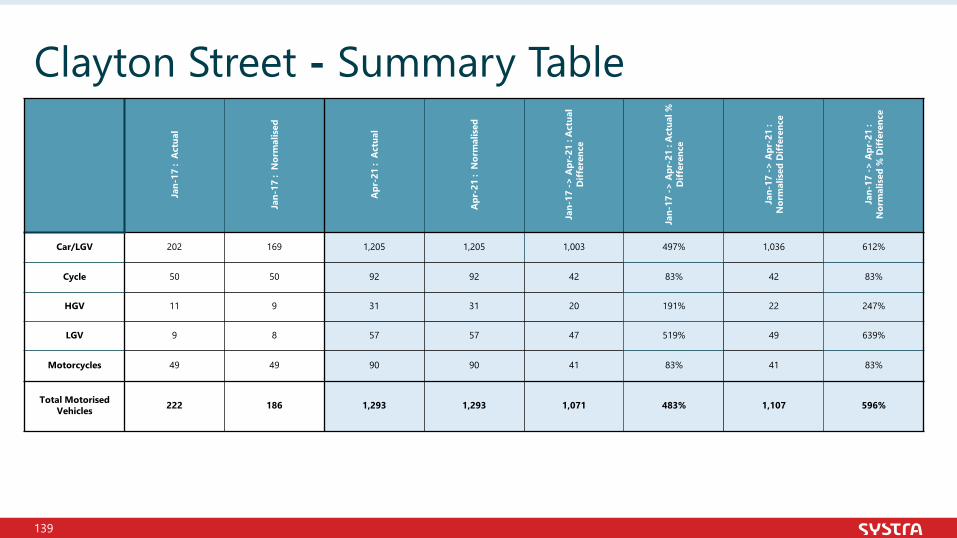
139
Clayton Street - Summary Table
Jan-
17 :
Act
ual
Jan-
17 :
Nor
mal
ised
Apr
-21
: A
ctua
l
Apr
-21
: N
orm
alis
ed
Jan-
17 ->
Apr
-21
: Act
ual
Diff
eren
ce
Jan-
17 ->
Apr
-21
: Act
ual %
D
iffer
ence
Jan-
17 ->
Apr
-21
: N
orm
alis
ed D
iffer
ence
Jan-
17 ->
Apr
-21
: N
orm
alis
ed %
Diff
eren
ce
Car/LGV 202 169 1,205 1,205 1,003 497% 1,036 612%
Cycle 50 50 92 92 42 83% 42 83%
HGV 11 9 31 31 20 191% 22 247%
LGV 9 8 57 57 47 519% 49 639%
Motorcycles 49 49 90 90 41 83% 41 83%
Total Motorised Vehicles 222 186 1,293 1,293 1,071 483% 1,107 596%