Embed Size (px)
Citation preview
APPENDIX 14
WETLAND STUDIES

WETLAND IMPACT ASSESSMENT Proposed Update of existing Water Use Licences pertaining to the
Somkhele Anthracite Mine, Mtubatuba Local Municipality, KwaZulu-
Natal
June 2018
Malachite Ecological Services
Somkhele Anthracite Mine: Update to WUL
Wetland Impact Assessment Report i
WETLAND IMPACT ASSESSMENT:
Proposed Update of existing Water Use Licences pertaining to the Somkhele
Anthracite Mine, Mtubatuba Local Municipality, KwaZulu-Natal
Project Number: 18-012
Version status: FINAL
Client: Karin Loukes
GCS Water and Environmental Consultants
(Pty) Ltd
4a Old Main Road, Judges Walk
Kloof, KwaZulu-Natal
3610
Email: [email protected]
Prepared by:
Malachite Ecological Services
345 Peter Mokaba Road
Morningside, 4001
Cell: 078 023 0532
Email: [email protected]
Author(s):
Rowena Harrison
Dr Craig Widdows
Citation:
Malachite Ecological Services (2018). Wetland Impact Assessment: Update of
existing Water Use Licences pertaining to the Somkhele Anthracite Mine, Mtubatuba
Local Municipality, KwaZulu-Natal. Malachite Specialist Services (Pty) Ltd, Durban.
South Africa.
Malachite Ecological Services
Somkhele Anthracite Mine: Update to WUL
Wetland Impact Assessment Report ii
EXECUTIVE SUMMARY
Malachite Ecological Services was appointed by GCS Water and
Environmental (Pty) Ltd to undertake a Wetland Impact Assessment within the
existing Somkhele Anthracite Mine; Area 1, Area 2 and the Luhlanga
Kwaqubuka Area, as well as within a 500m assessment buffer. This approach
was conducted in order to comply with the existing as well as the proposed
update to these Water Use Licences.
The terms of reference for the study were as follows:
Delineate wetland systems within Area 1, Area 2 and the Luhlanga
Kwaqubuka Area, as well as a 500m assessment buffer according to the
Department of Water Affairs and Forestry1 “Practical field procedure for
the identification and delineation of wetlands and riparian areas”.
Classify the identified wetland habitat in accordance with the latest
approach; ‘Classification System for Wetlands and other Aquatic
Ecosystems in South Africa’ (Ollis et al., 2013).
Determine the Present Ecological State score (PES) and Functional
Integrity of any identified wetlands using the WET-Health and Wet-
EcoServices approach.
Determine the Ecological Importance and Sensitivity (EIS) of the
identified wetlands.
Identify current and possible negative future impacts on any identified
wetlands from the mining activities. Recommend mitigation measures to
lessen the impact of the existing mining activities on wetlands
delineated within the study site and the implementation of suitable
rehabilitation measures, should this be required.
Based on the current identification of the four wetland indicators, four
Hydrogeomorphic (HGM) units were delineated within the assessment area.
Three HGM units have been classified as Channelled Valley Bottom wetlands,
(HGM 1, HGM 2 and HGM 3) and one HGM unit classified as a Seep (HGM 4).
HGM 1 and HGM 2 are situated within the mine boundary and HGM 3 and HGM
4 are situated approximately 550m to 600m from the existing mine boundaries.
These wetlands were included within the assessment as they are situated
directly downstream from the mining area and could therefore be potentially
affected by mining operations.
1 Department of Water Affairs and Forestry (DWAF) is now named the Department of
Water and Sanitation (DWS).
Malachite Ecological Services
Somkhele Anthracite Mine: Update to WUL
Wetland Impact Assessment Report iii
The HGM units were assessed with regards to their health according to the Wet-
Health methodology. HGM 1was classified as Largely Natural (PES Category B),
HGM 2 and HGM 4 classified as Largely Modified (PES Category D), and HGM
3 classified as Moderately Modified (PES Category C). HGM 1 is situated within
a largely natural catchment, with few modifications. HGM 2 is situated within
the mining footprint; this area and the associated catchment have been
largely modified as a result of the open cast pits, discard dumps, haul roads
and associated operations of the mine. HGM 3 and HGM 4 are both situated
outside of the existing mine. HGM 3 is situated within a moderately modified
catchment, largely as a result of livestock grazing, and the presence of road
networks. HGM 4 is likely to have formed as a result of seepage from an
upstream dam as well as an impoundment created from a road.
Ecosystem goods and services were calculated for all HGM units. Scores
received ranged from Low to High for all natural resources. HGM 1 received
the highest scores of all HGM units, indicating that it is a highly functional
system. HGM 2 generally received moderate scores for flood attenuation;
streamflow regulation; sediment trapping; filtration; and erosion control. HGM3
also scored as a moderately functioning system, with ecosystem services
associated with flood attenuation; streamflow regulation; sediment trapping;
filtration; erosion control. HGM 4, due to it degraded state and small size
received generally lower scores compared to the other three HGM units
An Ecological Importance and Sensitivity (EIS) assessment was undertaken to
rank the water resources in terms of provision of goods and service or valuable
ecosystem functions which benefit people; biodiversity support and ecological
value as well as the reliance of subsistence users (especially basic human
needs uses). The EIS score for all HGM units ranged from Low to High. HGM 1 is
considered to have a high Ecological Importance and Sensitivity within the
landscape. It has a wide diversity of habitat types, including surrounding
Lowveld habitat with good basal cover. HGM 2 received a moderate EIS score.
The high vegetation cover within the system and the use of the channel
associated with the system by faunal species, increases its ecological
importance for the provision of habitat within the modified environment. HGM
3 also received a moderate EIS score, largely as a result of the riparian zone
associated with the channel in the system. HGM 4 received a low EIS score, by
virtue of its small size and limited opportunity to provide ecological services to
the catchment.
Malachite Ecological Services
Somkhele Anthracite Mine: Update to WUL
Wetland Impact Assessment Report iv
It is understood from the IWWMP (GCS 2018 –draft report) that an exemption is
being applied for relating to regulations on the use of water for mining and
related activities, aimed at the protection of water resources as published in
terms of the NWA in GN R 704 on 4 June 1999. This exemption is not
recommended for HGM 1, due to its ecological sensitivity and functional
importance within the landscape. It is highly recommended that any mining
activities do not encroach into the 100m buffer around HGM 1. The exemption
could be applied for HGM 2 as mining has already encroached into the 100m
buffer, however the system is still regarded as a moderately functioning system.
The 2016 buffer tool was utilised to calculate the minimum appropriate buffer
width for the protection of the ecosystem services provided by HGM 2 should
this exemption be applied. This buffer has been calculated to be 46m. The
buffer was calculated based on the high risk of the mining operations, the clay
dominated soils with low infiltration rates, the topography of the area and the
vegetation characteristics. If the 100m buffer for this system is relaxed it is
recommended that no mining (including infrastructure, stockpiles and mining
personnel) should be allowed within the 46m buffer. This buffer zone must also
be rehabilitated with regards to the clearing of invasive alien species and the
removal of all rubble and stockpiles associated with the mining activities.
No future expansions are expected to take place within Area 1, Area 2 or the
Kwaqubuka (Area 9) Area. The impacts to the wetlands delineated within
these areas are therefore assessed on current mining operations. A proposed
extension of Luhlanga Pit, otherwise known as ‘Luhlanga Box Cut Zero’ within
the Luhlanga Area has been assessed separately. This proposed extension will
affect a non-perennial watercourse but will not impact any of the wetland
systems delineated during this assessment.
As a result of the topographical setting of the study site as well as the enclosed
nature of stormwater runoff from the mine, there is unlikely to be any negative
impact on HGM 3 and HGM 4, and these wetlands were not assessed further.
The impact assessment has therefore focused on HGM 1 and HGM 2. Impacts
to these wetlands are associated with soil erosion, sedimentation, pollution and
the continued encroachment of invasive alien vegetation.
In order to address the identified impacts and to lower their significance on the
health and functional integrity of the wetlands, a number of recommended
mitigation and rehabilitation/management measures are proposed. These
measures are aimed to improve the health and functional integrity of the
Malachite Ecological Services
Somkhele Anthracite Mine: Update to WUL
Wetland Impact Assessment Report v
wetlands and to avoid a continual decline in the current condition of these
systems. This can be achieved through the following objectives:
Removal of deposited soil and rubble from the edge of the wetlands,
particularly HGM 2, and the subsequent revegetation of the disturbed
areas with appropriate indigenous wetland and terrestrial species.
Removal of invasive alien and problem plant species from the edge of
the wetlands and within their boundaries. This must be conducted in a
phasic approach to ensure that existing and revegetated areas
become established.
Conduct a yearly monitoring of the health (PES Score), Functional
Integrity and Ecological Importance and Sensitivity (EIS) of HGM 1 and
HGM 2 to ensure that the current state of the wetlands does not decline.
Malachite Ecological Services
Somkhele Anthracite Mine: Update to WUL
Wetland Impact Assessment Report vi
TABLE OF CONTENTS
EXECUTIVE SUMMARY .............................................................................................................. II
INTRODUCTION AND BACKGROUND ..................................................................................... 1
PROJECT BACKGROUND AND LOCALITY ........................................................................................... 1
SCOPE OF THE ASSESSMENT ............................................................................................................... 4
ASSUMPTIONS AND LIMITATIONS ........................................................................................................ 5
METHODOLOGY ....................................................................................................................... 6
ASSESSMENT TECHNIQUES AND TOOLS ............................................................................................... 6
BASELINE DATA ................................................................................................................................ 6
SITE INVESTIGATION .......................................................................................................................... 7
WETLAND DEFINITION & DELINEATION TECHNIQUE ............................................................................. 7
WETLAND HEALTH AND FUNCTIONAL INTEGRITY ASSESSMENT TECHNIQUES ........................................... 9
RATIONALE FOR THE ASSESSMENT ...................................................................................................... 9
BASELINE BIOPHYSICAL DESCRIPTION .................................................................................. 11
CLIMATE ........................................................................................................................................ 11
GEOLOGY AND TOPOGRAPHY ....................................................................................................... 11
REGIONAL VEGETATION STRUCTURE AND COMPOSITION ................................................................... 12
BIODIVERSITY ................................................................................................................................. 14
PROVINCIAL CONSERVATION PLANNING ........................................................................................ 15
TERRESTRIAL THREATENED ECOSYSTEMS ............................................................................................ 16
CATCHMENT CHARACTERISTICS AND WATERCOURSES ....................................................................... 19
NATIONAL FRESHWATER ECOSYSTEM PRIORITY AREAS (NFEPA) ....................................................... 20
ASSESSMENT RESULTS ............................................................................................................. 23
WETLAND DELINEATION .................................................................................................................. 23
RIPARIAN DELINEATION AND WATERCOURSE CLASSIFICATION .......................................................... 25
SOIL WETNESS AND SOIL FORM INDICATOR...................................................................................... 29
VEGETATION INDICATOR ................................................................................................................ 34
TERRAIN INDICATOR ....................................................................................................................... 41
WETLAND HEALTH AND FUNCTIONAL ASSESSMENT ............................................................. 42
PRESENT ECOLOGICAL STATE (PES) ................................................................................................ 42
FUNCTIONAL ASSESSMENT (ECOSYSTEM GOODS AND SERVICES) ...................................................... 47
ECOLOGICAL IMPORTANCE AND SENSITIVITY (EIS) ........................................................................... 48
BUFFER REQUIREMENTS .......................................................................................................... 50
Malachite Ecological Services
Somkhele Anthracite Mine: Update to WUL
Wetland Impact Assessment Report vii
IMPACT ASSESSMENT ............................................................................................................. 52
OPERATIONAL PHASE ..................................................................................................................... 56
DECOMMISSIONING AND CLOSURE PHASE ...................................................................................... 58
WETLAND ACTION PLAN ........................................................................................................ 60
REMOVAL OF POLLUTION AND RUBBLE ............................................................................................. 60
INVASIVE ALIEN SPECIES MANAGEMENT PLAN ................................................................................. 61
SITE PREPARATION FOR REVEGETATION ............................................................................................ 63
MONITORING PLAN AND AUDIT REPORTS ......................................................................................... 64
PHOTOGRAPHIC RECORD ............................................................................................................... 64
WETLAND HEALTH AND INTEGRITY .................................................................................................... 64
DECOMMISSIONING AND CLOSURE PHASE ...................................................................................... 64
RISK MATRIX ............................................................................................................................ 65
CONCLUSION ......................................................................................................................... 67
REFERENCES ............................................................................................................................ 69
APPENDICES............................................................................................................................ 72
APPENDIX A – DECLARATIONS .............................................................................................. 72
APPENDIX B – WETLAND DELINEATION AND ASSESSMENT METHODOLOGY ..................... 74
WETLAND DELINEATION TECHNIQUE ................................................................................................ 74
ASSESSMENT OF THE WETLAND’S FUNCTIONAL INTEGRITY .................................................................. 75
ASSESSMENT OF THE WETLAND’S PRESENT ECOLOGICAL STATE (PES)................................................ 75
ASSESSMENT OF ECOLOGICAL IMPORTANCE AND SENSITIVITY (EIS) ................................................... 77
APPENDIX C - SOIL AUGER SAMPLING MAP ....................................................................... 78
APPENDIX D– RISK MATRIX ASSOCIATED WITH HGM 1 ....................................................... 79
APPENDIX E– RISK MATRIX ASSOCIATED WITH HGM 2........................................................ 81
APPENDIX E– RISK MATRIX ASSOCIATED WITH THE EXTENSION OF LUHLANGA BOXCUT
ZERO ........................................................................................................................................ 83
Malachite Ecological Services
Somkhele Anthracite Mine: Update to WUL
Wetland Impact Assessment Report viii
LIST OF FIGURES FIGURE 1: SITE LOCALITY ...................................................................................... 3
FIGURE 2: SITE DESCRIPTION OF AREA 1, AREA 2 AND LUHLANGA KWAQUBUKA AREA .................... 4
FIGURE 3: INCREASING SOIL WETNESS ZONES IDENTIFIED WITHIN VARIOUS WETLAND SYSTEMS ............... 8
FIGURE 4: THREAT STATUS OF WETLAND ECOSYSTEMS (SANBI, 2013) ...................................... 10
FIGURE 5: GEOLOGY OF THE STUDY SITE...................................................................... 12
FIGURE 6: REGIONAL VEGETATION ASSOCIATED WITH THE STUDY SITE ....................................... 14
FIGURE 7: PROVINCIAL AND NATIONAL CONSERVATION PLANNING TOOLS ............................... 18
FIGURE 8: QUATERNARY CATCHMENT LOCATION AND RIVER SYSTEMS ...................................... 19
FIGURE 9: FRESHWATER ECOSYSTEM PRIORITY AREA WETLANDS ............................................. 22
FIGURE 10: DIAGRAMMATIC REPRESENTATION OF COMMON WETLAND SYSTEMS IDENTIFIED IN SOUTHERN
AFRICA ....................................................................................................... 23
FIGURE 11: DIAGRAM SHOWING THE CHANGE OF SATURATION DEPENDING ON THE TYPE OF CHANNEL ... 26
FIGURE 12: DIAGRAMMATIC REPRESENTATION THE ZONES (LOWER, MARGINAL AND UPPER) ASSOCIATED WITH
RIPARIAN HABITATS (EXTRACTED FROM RIVER ECO-CLASSIFICATION MANUAL FOR ECOSTATUS
DETERMINATION, 2007) ...................................................................................... 27
FIGURE 13: DELINEATION OF WETLANDS WITHIN THE SOMKHELE MINE, AREA 1, AREA 2 AND LUHLANGA
KWAQUBUKA AREA AS WELL AS THE 500M ASSESSMENT AREA............................................... 28
FIGURE 14: TOPOGRAPHICAL SETTING ....................................................................... 41
FIGURE 15: GENERAL WET-ECOSERVICES RESULTS FOR THE WETLAND SYSTEMS ............................. 47
FIGURE 16: EXISTING MINING FOOTPRINT IN AREA 1 IN RELATION TO HGM 1, HGM 3 AND HGM 4 ... 54
FIGURE 17: EXISTING AND PROPOSED MINING FOOTPRINT IN AREA 2 AND LUHLANGA KWAQUBUKA AREA
IN RELATION WITH HGM 2 AS WELL AS NON-PERENNIAL WATERCOURSES .................................. 55
LIST OF TABLES
TABLE 1: DIRECT AND INDIRECT BENEFITS OF WETLAND SYSTEMS (KOTZE ET AL. 2005) ....................... 8
TABLE 2: SOILS IDENTIFIED WITHIN THE SAMPLING AREA ...................................................... 31
TABLE 3: THE CLASSIFICATION OF PLANTS ACCORDING TO OCCURRENCE IN WETLANDS (DWAF, 2008) .. 34
TABLE 4: WETLAND INDICATOR SPECIES IDENTIFIED DURING THE SITE INVESTIGATION ........................ 40
TABLE 5: SUMMARY OF PES SCORE .......................................................................... 46
TABLE 6: SUMMARY OF THE ECOLOGICAL IMPORTANCE AND SENSITIVITY .................................. 48
TABLE 7: HEALTH CATEGORIES USED BY WET-HEALTH FOR DESCRIBING THE INTEGRITY OF WETLANDS ...... 76
Malachite Ecological Services
Somkhele Anthracite Mine: Update to WUL
Wetland Impact Assessment Report ix
LIST OF PHOTOGRAPHS
PHOTOGRAPH 1: EXAMPLES OF HYDRIC CHARACTERISTICS USED AS INDICATORS FOR WETLAND CONDITIONS
................................................................................................................ 29
PHOTOGRAPH 2: ENCROACHMENT OF INVASIVE AND PIONEER SPECIES INTO THE RAUVOLFIA – PHOENIX
RIPARIAN ZONE ............................................................................................... 36
PHOTOGRAPH 3: VEGETATION AND HABITATS ASSOCIATED WITH HGM1 .................................. 37
PHOTOGRAPH 4: HARVESTING OF REEDBEDS ................................................................ 38
PHOTOGRAPH 5: MOIST GRASSLAND AND SEMI-CLOSED CANOPY RIPARIAN ZONE OF HGM 3 ........... 39
PHOTOGRAPH 6: HGM 4 SHOWING DOMINATED AREAS OF T. CAPENSIS AND ALIEN INVASIVE SPECIES ... 40
PHOTOGRAPH 7: HGM 1 SHOWING THE MINING WITHIN AREA 1 (A), THE INLET CHANNEL (B) AND OUTLET
CHANNEL INTO THE MFOLOZI RIVER (C) ..................................................................... 43
PHOTOGRAPH 8: PORTION OF HGM 2 SHOWING THE SEVERE ENCROACHMENT OF C. ODORATA ......... 44
PHOTOGRAPH 9: HGM 3 SITUATED TO THE WEST OF AREA 1. (A) LOOKING WESTWARD AND (B) LOOKING
EASTWARD TOWARD AREA 1 ................................................................................. 45
PHOTOGRAPH 10: HGM 4 SHOWING THE UPSTREAM DAM, ENCROACHMENT OF ALIEN INVASIVE SPECIES AND
EROSION ...................................................................................................... 46
Malachite Ecological Services
Somkhele Anthracite Mine: Update to WUL
Wetland Impact Assessment Report 1
INTRODUCTION AND BACKGROUND
PROJECT BACKGROUND AND LOCALITY
Malachite Ecological Services was appointed by GCS Water and
Environmental (Pty) Ltd to undertake a Wetland Impact Assessment within the
existing Somkhele Anthracite Mine area located within Ptn 0 No. 15822 Reserve
No. 3, specifically within Area 1, Area 2 and the Luhlanga (Area 8) Kwaqubuka
(Area 9) sites associated with the mine.
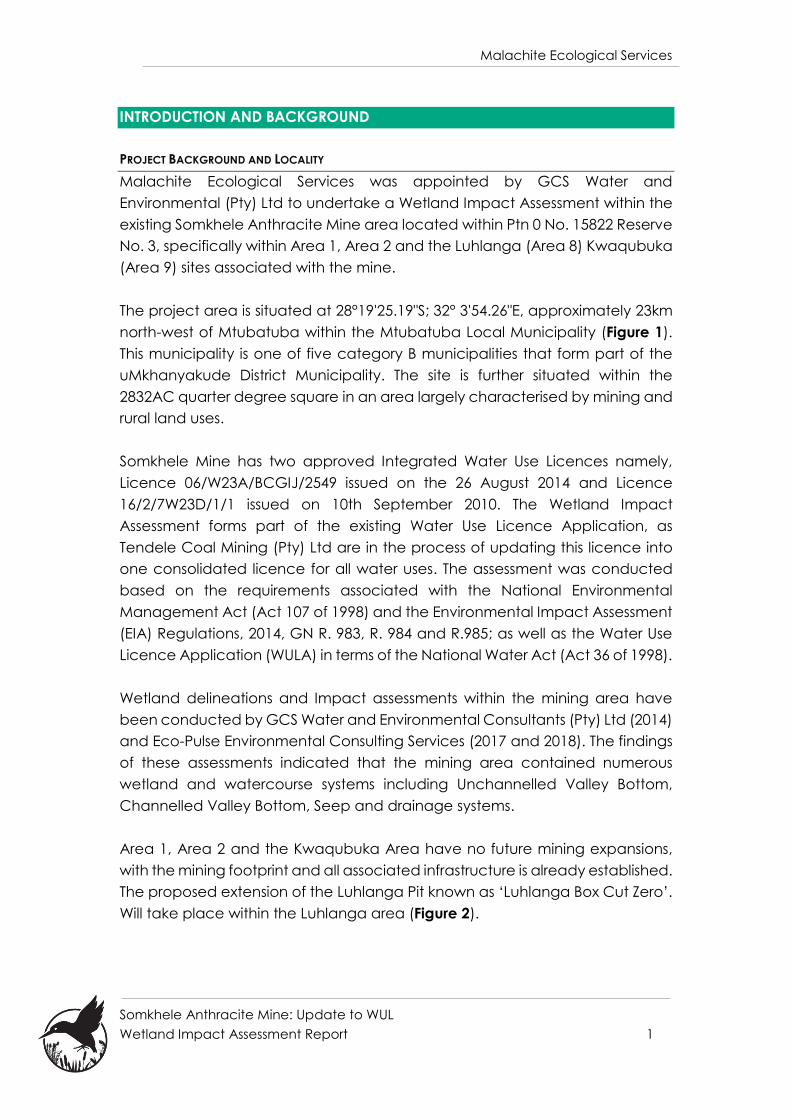
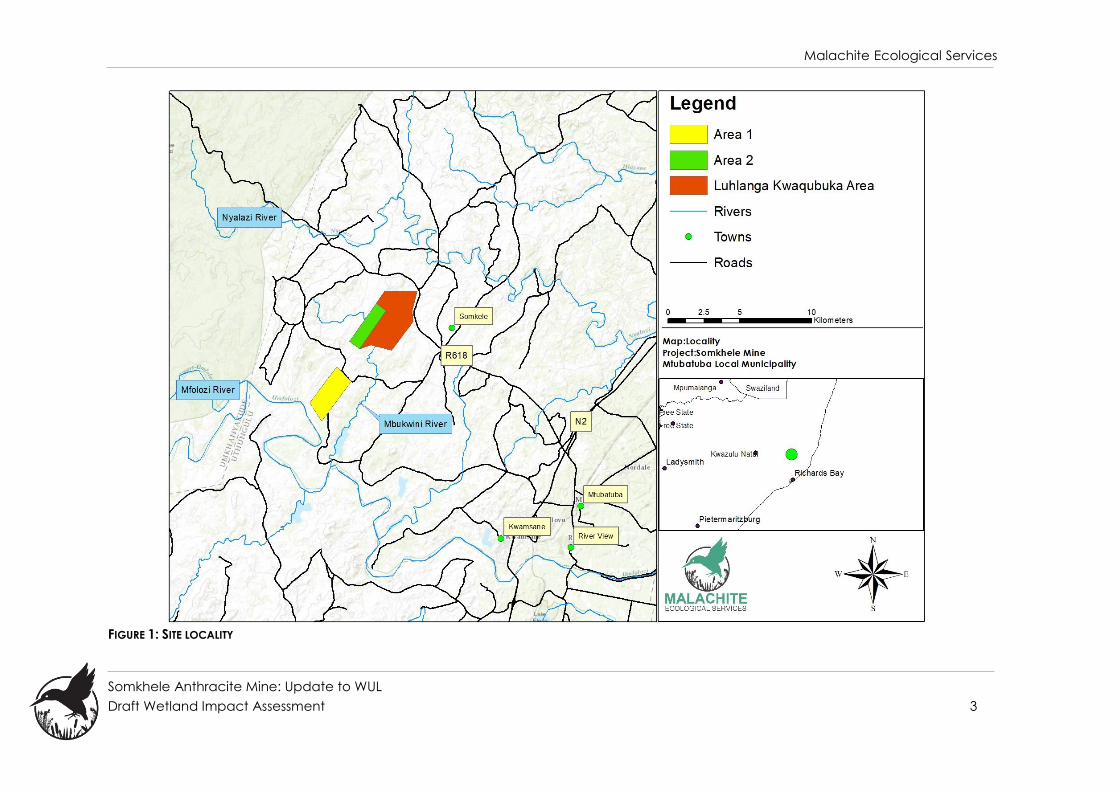
The project area is situated at 28°19'25.19"S; 32° 3'54.26"E, approximately 23km
north-west of Mtubatuba within the Mtubatuba Local Municipality (Figure 1).
This municipality is one of five category B municipalities that form part of the
uMkhanyakude District Municipality. The site is further situated within the
2832AC quarter degree square in an area largely characterised by mining and
rural land uses.
Somkhele Mine has two approved Integrated Water Use Licences namely,
Licence 06/W23A/BCGIJ/2549 issued on the 26 August 2014 and Licence
16/2/7W23D/1/1 issued on 10th September 2010. The Wetland Impact
Assessment forms part of the existing Water Use Licence Application, as
Tendele Coal Mining (Pty) Ltd are in the process of updating this licence into
one consolidated licence for all water uses. The assessment was conducted
based on the requirements associated with the National Environmental
Management Act (Act 107 of 1998) and the Environmental Impact Assessment
(EIA) Regulations, 2014, GN R. 983, R. 984 and R.985; as well as the Water Use
Licence Application (WULA) in terms of the National Water Act (Act 36 of 1998).
Wetland delineations and Impact assessments within the mining area have
been conducted by GCS Water and Environmental Consultants (Pty) Ltd (2014)
and Eco-Pulse Environmental Consulting Services (2017 and 2018). The findings
of these assessments indicated that the mining area contained numerous
wetland and watercourse systems including Unchannelled Valley Bottom,
Channelled Valley Bottom, Seep and drainage systems.
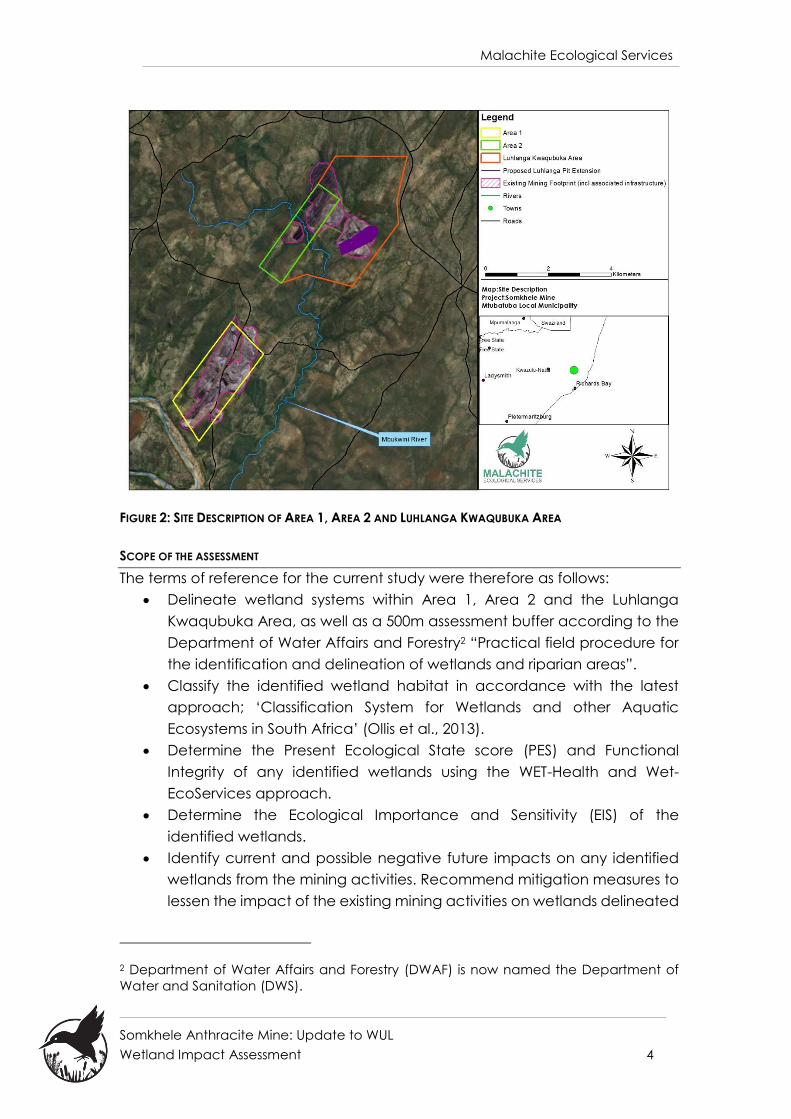
Area 1, Area 2 and the Kwaqubuka Area have no future mining expansions,
with the mining footprint and all associated infrastructure is already established.
The proposed extension of the Luhlanga Pit known as ‘Luhlanga Box Cut Zero’.
Will take place within the Luhlanga area (Figure 2).
Malachite Ecological Services
Somkhele Anthracite Mine: Update to WUL
Wetland Impact Assessment Report 2
The primary aim of the study is therefore to provide a description of the current
ecological integrity and impacts pertaining to any wetland systems occurring
within Area 1, Area 2 and the Luhlanga Kwaqubuka Area and 500m assessment
buffer area, as well as providing appropriate management recommendations
to mitigate any identified impacts as a result of the current and future mining
operations on the delineated wetland systems.
Malachite Ecological Services
Somkhele Anthracite Mine: Update to WUL
Draft Wetland Impact Assessment 3
FIGURE 1: SITE LOCALITY
Malachite Ecological Services
Somkhele Anthracite Mine: Update to WUL
Wetland Impact Assessment 4
FIGURE 2: SITE DESCRIPTION OF AREA 1, AREA 2 AND LUHLANGA KWAQUBUKA AREA
SCOPE OF THE ASSESSMENT
The terms of reference for the current study were therefore as follows:
Delineate wetland systems within Area 1, Area 2 and the Luhlanga
Kwaqubuka Area, as well as a 500m assessment buffer according to the
Department of Water Affairs and Forestry2 “Practical field procedure for
the identification and delineation of wetlands and riparian areas”.
Classify the identified wetland habitat in accordance with the latest
approach; ‘Classification System for Wetlands and other Aquatic
Ecosystems in South Africa’ (Ollis et al., 2013).
Determine the Present Ecological State score (PES) and Functional
Integrity of any identified wetlands using the WET-Health and Wet-
EcoServices approach.
Determine the Ecological Importance and Sensitivity (EIS) of the
identified wetlands.
Identify current and possible negative future impacts on any identified
wetlands from the mining activities. Recommend mitigation measures to
lessen the impact of the existing mining activities on wetlands delineated
2 Department of Water Affairs and Forestry (DWAF) is now named the Department of
Water and Sanitation (DWS).

Malachite Ecological Services
Somkhele Anthracite Mine: Update to WUL
Wetland Impact Assessment 5
within the study site and the implementation of suitable rehabilitation
measures, should this be required.
Typically, surface water attributed to wetland systems, rivers and riparian
habitats comprise an important component of natural landscapes. These
systems are often characterised by high levels of biodiversity and fulfil various
ecosystems functions. As a result, these systems are protected under various
pieces of legislation including; the National Water Act, 1998 (Act No. 36 of 1998)
and the National Environmental Management Act, 1998 (Act No. 107 of 1998).
ASSUMPTIONS AND LIMITATIONS
It is difficult to apply pure scientific methods within a natural environment
without limitations or assumptions. The following apply to this study:
i. The findings, results, observations, conclusions and recommendations
provided in this report are based on the authors’ best scientific and
professional knowledge as well as available information regarding the
perceived impacts on the water resources.
ii. Water resource boundaries are essentially based on GPS coordinate
waypoints taken onsite of indicator features. The accuracy of the GPS
device therefore affects the accuracy of the maps produced. A hand-
held Garmin eTrex 30x was used to delineate the water resources and this
has an accuracy of 3-6m.
iii. The assessment of the health, functional integrity and ecological
importance and sensitivity was based on a three day field investigation
conducted on the 2nd – 4th of May 2018. Once-off assessments such as
this may potentially miss certain ecological information, thus limiting
accuracy, detail and confidence.
iv. The assessment of impacts and recommendation of mitigation measures
was informed by the site-specific ecological issues arising from the field
survey and based on the assessor’s working knowledge and experience
with similar mining assessments.

Malachite Ecological Services
Somkhele Anthracite Mine: Update to WUL
Wetland Impact Assessment 6
METHODOLOGY
ASSESSMENT TECHNIQUES AND TOOLS
The techniques and tools utilised for this assessment can be divided into baseline
data and field investigations. Baseline data was utilised during the desktop
component to determine the biophysical context of the site as well as National
and Provincial legislation that governs the proposed activity.
BASELINE DATA
The desktop study conducted involved the examination of aerial photography,
Geographical Information System (GIS) databases including the National
Freshwater Ecosystem Priority Areas (NFEPA). The study made use of the
following data sources:
Google EarthTM satellite imagery was used at the desktop level.
Relief dataset from the Surveyor General was used to calculate slope and
the desktop mapping of water resources.
Watercourse Delineation and Importance Assessment Report (2017)
conducted by Eco-Pulse Environmental Consulting.
Vegetation Impact Assessment (2018) conducted by David Styles
Vegetation Surveys, Advice and Consulting.
Draft Integrated Water and Waste Management Plan Report (2018). GCS
Water and Environmental Consulting.
The National Freshwater Ecosystem Priority Areas were used in determining
any priority wetlands.
Geology dataset was obtained from AGIS3 and the Council for
Geoscience.
Vegetation type dataset from Mucina & Rutherford (2006) was used in
determining the vegetation type of the study area.
Terrestrial and aquatic habitats were identified and analysed by making
use of the KwaZulu-Natal Biodiversity Sector Plan.
Terrestrial ecosystems within South Africa are governed by legislation and
these legislative requirements were consulted including:
o National Environment Management: Biodiversity Act No. 10 of 2004.
o Conservation of Agricultural Resources Act No. 43 of 1983.
o National Forests Act No. 83 of 1998.
o Chapter 11 of the Nature Conservation Ordinance (No. 15 of 1974).
o Terrestrial Threatened Ecosystems (Government Notice 1002.
(Gazetted on 9 December 2011).
3 Land type information was obtained from the Department of Agriculture’s Global Information
Service (AGIS) January 2014 – www.agis.agric.za
Malachite Ecological Services
Somkhele Anthracite Mine: Update to WUL
Wetland Impact Assessment 7
o GN R 704 published in terms of the National Water Act (Act 36 of 1998)
on 4 June 1999.
SITE INVESTIGATION
In field data collection was taken on the 2nd – 4th May 2018. This included
the delineation of wetland and watercourse systems, topographical
setting, soil sampling techniques, identification of current land use, existing
impacts and dominant vegetation units present. This data was used in
conjunction with the wetland delineation process to not only determine the
functionality of individual wetlands but also understand their connectivity
within the larger study area.
WETLAND DEFINITION & DELINEATION TECHNIQUE
For the purpose of this assessment, wetlands are considered as those
ecosystems defined by the National Water Act (Act 36 of 1998) as:
“land which is transitional between terrestrial and aquatic
systems where the water table is usually at or near the surface,
or the land is periodically covered with shallow water, and
which land in normal circumstances supports or would support
vegetation typically adapted to life in saturated soil.”
Furthermore, the Ramsar Convention4 defines wetlands as:
“areas of marsh, fen, peatland or water, whether natural or
artificial, permanent or temporary, with water that is static or
flowing, fresh, brackish or salt, including areas of marine water
the depth of which at low tide does not exceed 6m”
These habitats are found where the topography and geological parameters
impede the flow of water through the catchment, resulting in the soil profiles of
these habitats becoming temporarily, seasonally or permanently wet. Further to
this, wetlands occur in areas where groundwater or surface water discharges to
the surface forming seeps and springs. Soil wetness and vegetation indicators
change as the gradient of wetness changes (Figure 3).
4 The Ramsar Convention is legally named the Convention on Wetlands of International Importance Especially
as Waterfowl Habitat and was adopted by the International Conference on the Wetlands and Waterfowl at
Ramsar, Iran, 2 February 197 I in order to recognise amongst others that wetlands constitute a resource of
great economic, cultural, scientific and recreational value, the loss of which would be irreparable.
Malachite Ecological Services
Somkhele Anthracite Mine: Update to WUL
Wetland Impact Assessment 8
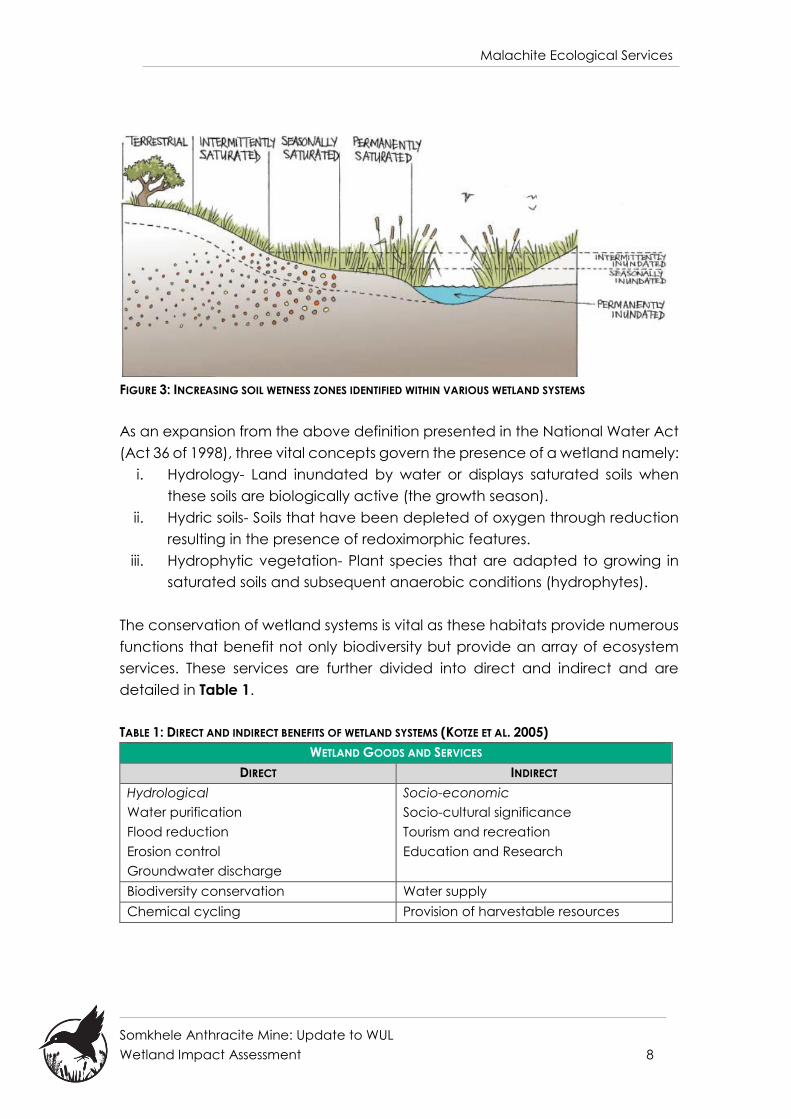
FIGURE 3: INCREASING SOIL WETNESS ZONES IDENTIFIED WITHIN VARIOUS WETLAND SYSTEMS
As an expansion from the above definition presented in the National Water Act
(Act 36 of 1998), three vital concepts govern the presence of a wetland namely:
i. Hydrology- Land inundated by water or displays saturated soils when
these soils are biologically active (the growth season).
ii. Hydric soils- Soils that have been depleted of oxygen through reduction
resulting in the presence of redoximorphic features.
iii. Hydrophytic vegetation- Plant species that are adapted to growing in
saturated soils and subsequent anaerobic conditions (hydrophytes).
The conservation of wetland systems is vital as these habitats provide numerous
functions that benefit not only biodiversity but provide an array of ecosystem
services. These services are further divided into direct and indirect and are
detailed in Table 1.
TABLE 1: DIRECT AND INDIRECT BENEFITS OF WETLAND SYSTEMS (KOTZE ET AL. 2005)
WETLAND GOODS AND SERVICES
DIRECT INDIRECT
Hydrological
Water purification
Flood reduction
Erosion control
Groundwater discharge
Socio-economic
Socio-cultural significance
Tourism and recreation
Education and Research
Biodiversity conservation Water supply
Chemical cycling Provision of harvestable resources

Malachite Ecological Services
Somkhele Anthracite Mine: Update to WUL
Wetland Impact Assessment 9
The study site was assessed with regards to the determination of the presence
of wetland and watercourse areas according to the procedure described in ‘A
Practical Field Procedure for Identification and Delineation of Wetland and
Riparian Areas –Edition 1’ (DWAF, 2005).
WETLAND HEALTH AND FUNCTIONAL INTEGRITY ASSESSMENT TECHNIQUES
As per the requirements of the Water Use Authorisation Application (WULA) for
Somkhele Mine, a Level 2 Wet-Health Assessment to determine the Present
Ecological State as well as a Level 2 Wet-EcoServices Assessment to determine
the Functional Integrity of each wetland unit was carried out. Further to this the
Ecological Importance and Sensitivity of each delineated wetland unit was
determined.
Detailed methodology for the wetland delineation, health, provision of
ecosystem goods and services (functional integrity), ecological importance
and sensitivity is given in Appendix B.
RATIONALE FOR THE ASSESSMENT
South Africa comprises a region of high biodiversity with high levels of endemism
(Bates et al., 2014). According to the National Environmental Management:
Biodiversity Act (NEMBA) (Act no.10 of 2004), biodiversity is defined as:
“the variability among living organisms from all sources
including, terrestrial, marine and other aquatic ecosystems
and the ecological complexes of which they are part and
also includes diversity within species, between species, and of
ecosystems”
An ecosystem is a complex, self-sustaining natural system centred on the
interaction between the structural components of the system (biotic and
abiotic). Effective conservation of wetlands and associated biodiversity is
paramount for the provision of ecosystem services. The degradation of the
ecological integrity of wetland systems has a direct negative impact on the
system’s ability to provide these essential ecosystem goods and services.
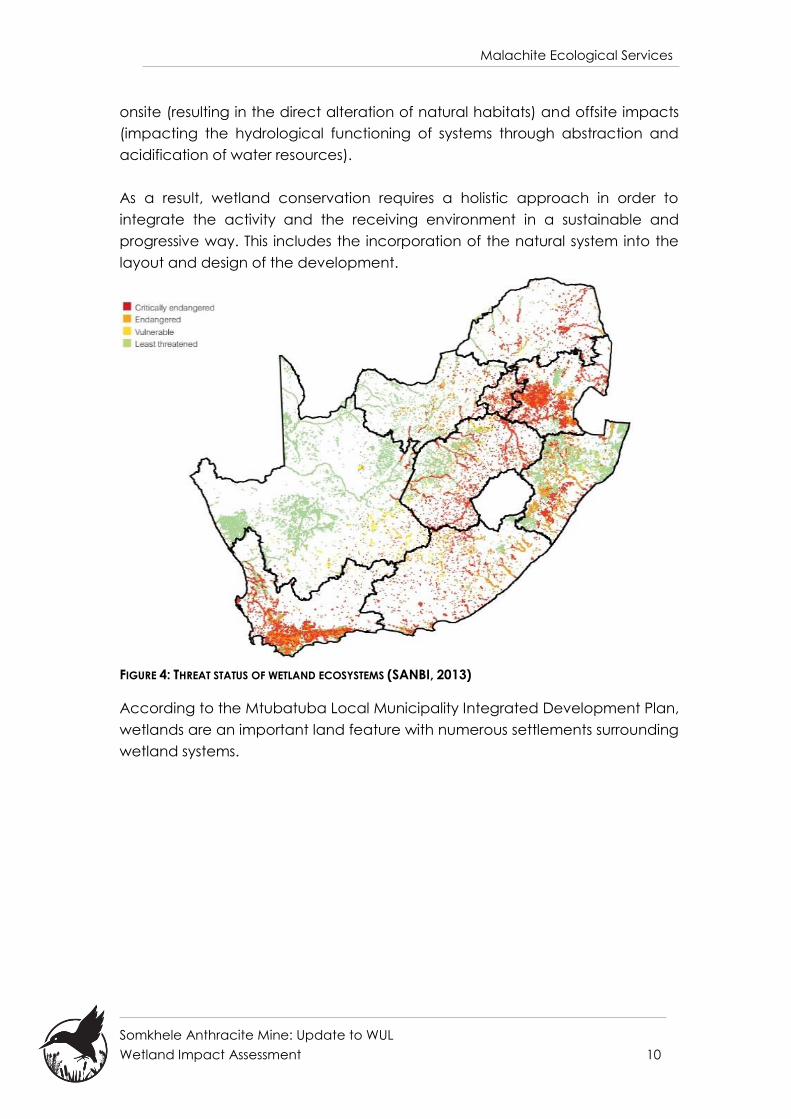
Wetlands are particularly susceptible to anthropogenic activities and are
threatened throughout South Africa (Figure 4). Wetland degradation is
associated with agricultural (ploughing, drainage, alteration of flow regimes
and nutrient enrichment), mining (effluent and industrial discharges), and urban
activities (desiccation, channelization and loss of wetland systems). The impact
of mining on biodiversity is often detrimental, effectively removing both the
structural and compositional biodiversity. Impacts can further be divided into
Malachite Ecological Services
Somkhele Anthracite Mine: Update to WUL
Wetland Impact Assessment 10
onsite (resulting in the direct alteration of natural habitats) and offsite impacts
(impacting the hydrological functioning of systems through abstraction and
acidification of water resources).
As a result, wetland conservation requires a holistic approach in order to
integrate the activity and the receiving environment in a sustainable and
progressive way. This includes the incorporation of the natural system into the
layout and design of the development.
FIGURE 4: THREAT STATUS OF WETLAND ECOSYSTEMS (SANBI, 2013)
According to the Mtubatuba Local Municipality Integrated Development Plan,
wetlands are an important land feature with numerous settlements surrounding
wetland systems.
Malachite Ecological Services
Somkhele Anthracite Mine: Update to WUL
Wetland Impact Assessment 11
BASELINE BIOPHYSICAL DESCRIPTION
CLIMATE
The project area is characterised by seasonal summer rainfall patterns with
sporadic rainfall events in the winter months. The mean annual precipitation
ranges from 650mm – 700mm (Mtubatuba). The wettest time of the year is
February with an average of 88mm and the driest is July with 14mm. The
seasonality of precipitation is a driving factor behind the hydrological cycles of
rivers and drainage lines within the area. Typically, rivers and drainage lines have
a higher flow rate during the summer months. Mean temperatures range from
17.60C in July to 25.40C in January. The altitude of the study site is ± 125m Above
Sea Level (www.saexplorer.co.za; www.climate.org).
GEOLOGY AND TOPOGRAPHY
The geological characteristics of an area influences the topography,
vegetation community’s and faunal assemblages present. Three dominant rock
formations occur within The Mtubatuba Municipality, including:
Lebombo Rock Formations: dominant within central Mtubatuba
Municipal area and supports flat topography and deep soils.
Mudstone and Shale: dominant on the western side of the municipality
within Mpukunyoni Traditional Area.
Sandy Rock Formations: Located on the eastern portion of the
municipality and gives rise to sandy soils within the coastal belt.
The geology of the project area is associated with the Natal Group Sandstones
and is dominated by the Dwyka Tillite, Ecca Group Sandstone, Shale and
Mudstone as well as Mapumulo Gneiss (Department of Mineral and Energy
Affairs, 1988; AGIS; Figure 5). More specifically the area is comprised of three
seams:
Basic volcanic rocks (tholeiites, picrate basalts and nephelinites)
Equigranular, unfoliated biotite granite
Mudrock, Sandstone and minor coal seams
Lithologies supported by these geological features are most commonly shallow
over the hard, older Sandstone and deeper above younger rock formations.
These include Glenrosa, Mispah and Oakleaf soils as well as compact clayey
soils of the Katspruit form.
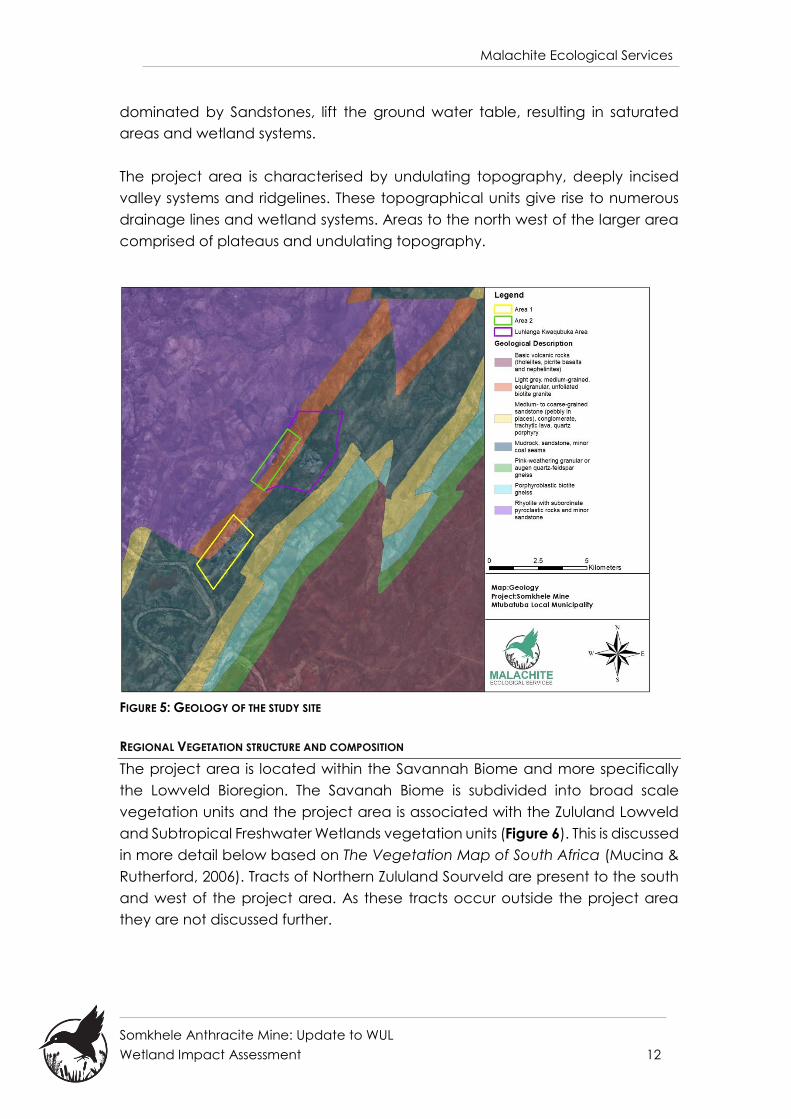
Geological intrusions were noted on the site, particularly Dolerite. This intrusion
becomes noticeable at a specific point along watercourses, where there is a
sudden change in the terrain of the site. Dolerite intrusions, in an area otherwise
Malachite Ecological Services
Somkhele Anthracite Mine: Update to WUL
Wetland Impact Assessment 12
dominated by Sandstones, lift the ground water table, resulting in saturated
areas and wetland systems.
The project area is characterised by undulating topography, deeply incised
valley systems and ridgelines. These topographical units give rise to numerous
drainage lines and wetland systems. Areas to the north west of the larger area
comprised of plateaus and undulating topography.
FIGURE 5: GEOLOGY OF THE STUDY SITE
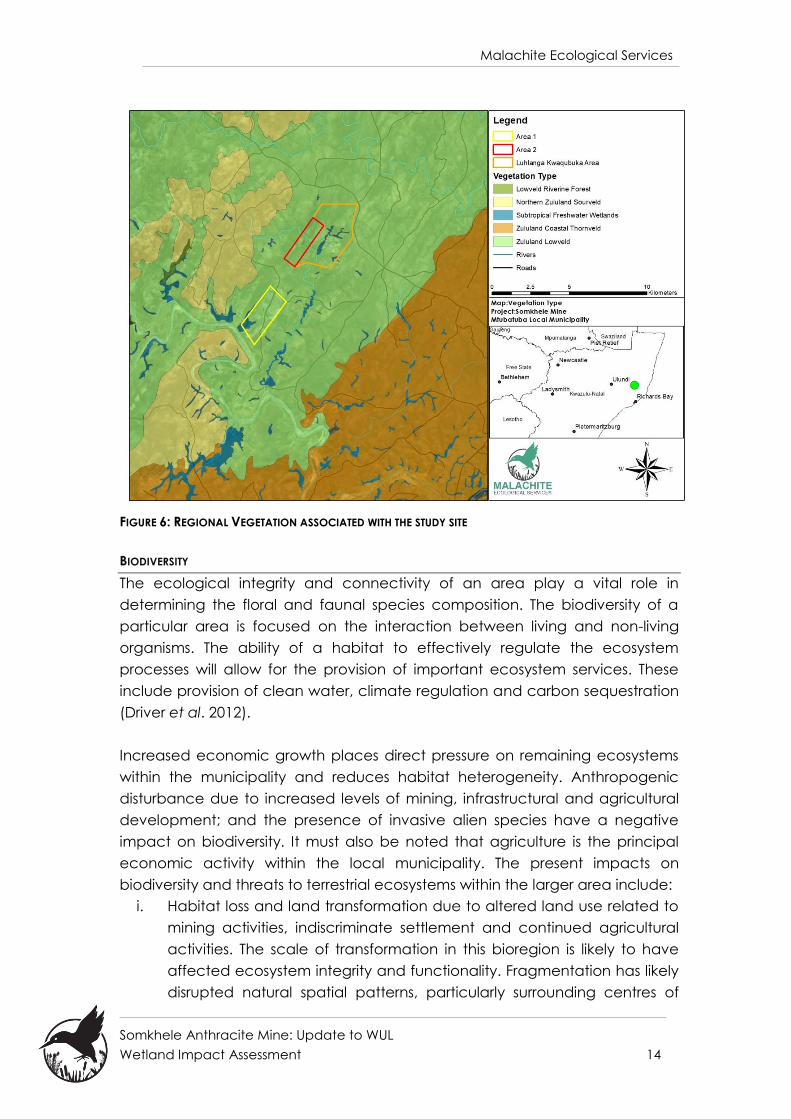
REGIONAL VEGETATION STRUCTURE AND COMPOSITION
The project area is located within the Savannah Biome and more specifically
the Lowveld Bioregion. The Savanah Biome is subdivided into broad scale
vegetation units and the project area is associated with the Zululand Lowveld
and Subtropical Freshwater Wetlands vegetation units (Figure 6). This is discussed
in more detail below based on The Vegetation Map of South Africa (Mucina &
Rutherford, 2006). Tracts of Northern Zululand Sourveld are present to the south
and west of the project area. As these tracts occur outside the project area
they are not discussed further.
Malachite Ecological Services
Somkhele Anthracite Mine: Update to WUL
Wetland Impact Assessment 13
Zululand Lowveld
This vegetation unit is distributed within the KwaZulu-Natal and Mpumalanga
Provinces as well as within portions of Swaziland. It is characterised by extensive
flat or slightly undulating landscapes supporting various bushveld units.
Vegetation composition is comprised of dense thickets (Dichrostachys cinerea
and Vachellia species), broad-leafed bushveld (Sclerocarya birrea and
Senegalia nigrescens) and savannah thornveld-bushveld mosaics. Common
species include S. nigrescens, S. birrea, Vachellia tortilis, Aloe marlothii and
Euclea divinorum.
This vegetation type is considered Vulnerable (Mucina & Rutherford, 2006). It is
predicted that more than 26% of this vegetation type has been transformed
largely attributed to cultivation. An estimated 11% is statutorily conserved within
the Hluhluwe-iMfolozi Park and Phongolapoort Nature Reserves.
Subtropical Freshwater Wetlands
This vegetation unit is widely distributed within the KwaZulu-Natal, Mpumalanga,
Gauteng, North-West, Limpopo and Eastern Cape Provinces as well as in
portions of Swaziland. It is characterised by flat landscapes supporting various
low beds dominated by reeds, sedges and rushes. This vegetation unit is often
present surrounding aeolian depressions, alluvial backwater pans and artificial
dam systems.
This vegetation type is considered Least Threatened (Mucina & Rutherford,
2006). It is predicted that more 40-50% is statutorily conserved within the Greater
St Lucia Wetland Park, Kruger National Park, Ndumo Game Reserve, Tembe
Elephant Park as well as in Nhlabane, Nylsvley and Richards Bay Nature
Reserves.
Malachite Ecological Services
Somkhele Anthracite Mine: Update to WUL
Wetland Impact Assessment 14
FIGURE 6: REGIONAL VEGETATION ASSOCIATED WITH THE STUDY SITE
BIODIVERSITY
The ecological integrity and connectivity of an area play a vital role in
determining the floral and faunal species composition. The biodiversity of a
particular area is focused on the interaction between living and non-living
organisms. The ability of a habitat to effectively regulate the ecosystem
processes will allow for the provision of important ecosystem services. These
include provision of clean water, climate regulation and carbon sequestration
(Driver et al. 2012).
Increased economic growth places direct pressure on remaining ecosystems
within the municipality and reduces habitat heterogeneity. Anthropogenic
disturbance due to increased levels of mining, infrastructural and agricultural
development; and the presence of invasive alien species have a negative
impact on biodiversity. It must also be noted that agriculture is the principal
economic activity within the local municipality. The present impacts on
biodiversity and threats to terrestrial ecosystems within the larger area include:
i. Habitat loss and land transformation due to altered land use related to
mining activities, indiscriminate settlement and continued agricultural
activities. The scale of transformation in this bioregion is likely to have
affected ecosystem integrity and functionality. Fragmentation has likely
disrupted natural spatial patterns, particularly surrounding centres of
Malachite Ecological Services
Somkhele Anthracite Mine: Update to WUL
Wetland Impact Assessment 15
anthropogenic activities.
ii. Untransformed land is susceptible to invasive alien plant infestation and
degradation due to surrounding developments. Problematic species
within this bioregion are comprised of herbaceous (Chromolaena
odorata and Lantana camara) and woody species (Acacia mearnsii
and Eucalyptus spp.).
iii. Loss of natural vegetation units and subsequent decline in endemic
species and sites of Conservation Value. This is particularly associated
with the loss and degradation of wetland systems.
iv. Loss of sensitive sites due to mismanagement/ lack of appropriate
protection.
This combination of factors has resulted in habitat transformation and
subsequent reduction in suitable habitats for floral and faunal species. These
impacts have had a direct negative impact on biodiversity within the larger
project area.
PROVINCIAL CONSERVATION PLANNING
Loss of biodiversity results in ecosystem degradation and subsequent loss of
important ecological services. Anthropogenic developments are a driving force
that exerts pressure on the natural habitat and biological diversity.
Sensitivity of the area was assessed through the interrogation of biodiversity
databases. The Provincial Biodiversity Sector Plan is a conservation plan
introduced and implemented by Ezemvelo KZN Wildlife. Ezemvelo KZN Wildlife is
the Nature Conservation Agency within the province whose core disciplines
include biodiversity conservation, sustainable use of natural resources, the
creation and management of partnerships with stakeholders and communities
and the provision of affordable eco-tourism destinations within the Province
(uThukela District Municipality Biodiversity Sector Plan). The primary aim of this
conservation plan is to ensure that representative biodiversity samples are
conserved to ensure that subsequent conservation targets are achieved. Areas
within the province are categorised based on the sites ecological sensitivity,
biological functioning and conservation significance. Classification of sites
within this plan makes reference to the following:
Optimal CBA: Areas identified through systematic conservation planning
which represent the optimal/best localities out of a larger selection of
available planning units that are optimally located to meet conservation
targets.
Malachite Ecological Services
Somkhele Anthracite Mine: Update to WUL
Wetland Impact Assessment 16
Irreplaceable CBA: Areas that are critical for meeting conservation
targets and thresholds and are required to ensure the persistence of
viable populations of species and the functionality of ecosystems.
Therefore, the site has an irreplaceable conservation value with no
alternative sites available.
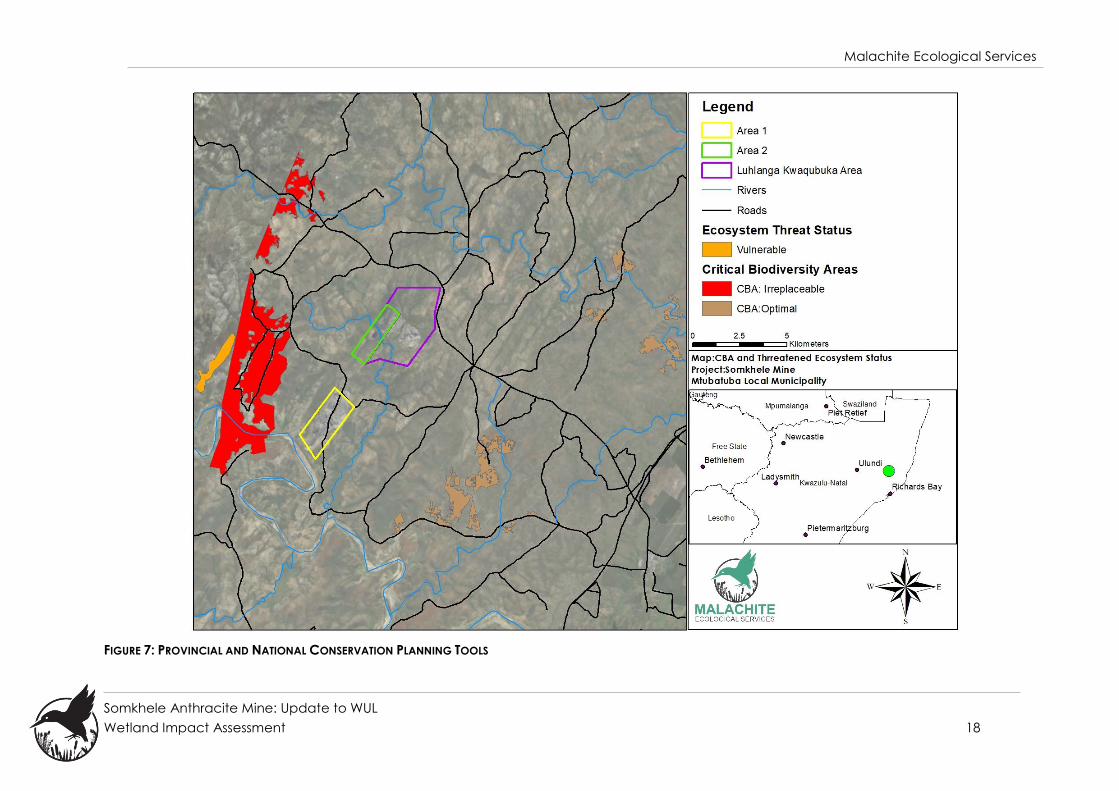
Interrogation of the KZN Biodiversity Sector Plan indicated that the ecosystems
within the project area are not classified as either Critical Biodiversity Areas or
Ecological Support Areas (Figure 7).
TERRESTRIAL THREATENED ECOSYSTEMS
The South African National Biodiversity Institute (SANBI) in collaboration with the
DEAT and DWAF focused on the identification of threatened ecosystems within
South Africa. The primary focus of this listing process was to reduce the rate of
ecosystem and species loss and to preserve areas with high conservation value.
As specified within Government Notice 1002 (gazetted on 9 December 2011)
the criteria used to identify threatened terrestrial ecosystems include the
following aspects:
A1-Irreversible loss of natural habitat.
A2-Ecosystem degradation and loss of integrity.
B-Rate of loss of natural habitat.
C- Limited extent and imminent threat.
D1- Threatened plant species associations.
D2- Threatened animal species associations.
E- Fragmentation.
F- Priority areas for meeting explicit biodiversity targets as defined in a
systematic biodiversity plan.
NB. Due to data constraints A2 and C have been applied to forests but no other
vegetation types. Furthermore, Criteria B, D2 and E are dormant as thresholds
have not been set due to a lack of a workable criterion.
The National Environmental Management: Biodiversity Act (Act 10 of 2004)
provides for listing of threatened or protected ecosystems in the following
categories:
• Critically Endangered (CR) ecosystems: This refers to ecosystems that
have undergone severe degradation of ecological structure, function or
composition as a result of human intervention and are subject to an
extremely high risk of irreversible transformation.
• Endangered (EN) ecosystems: This refers to ecosystems that have
undergone degradation of ecological structure, function or composition
Malachite Ecological Services
Somkhele Anthracite Mine: Update to WUL
Wetland Impact Assessment 17
as a result of human intervention, although they are not critically
endangered ecosystems.
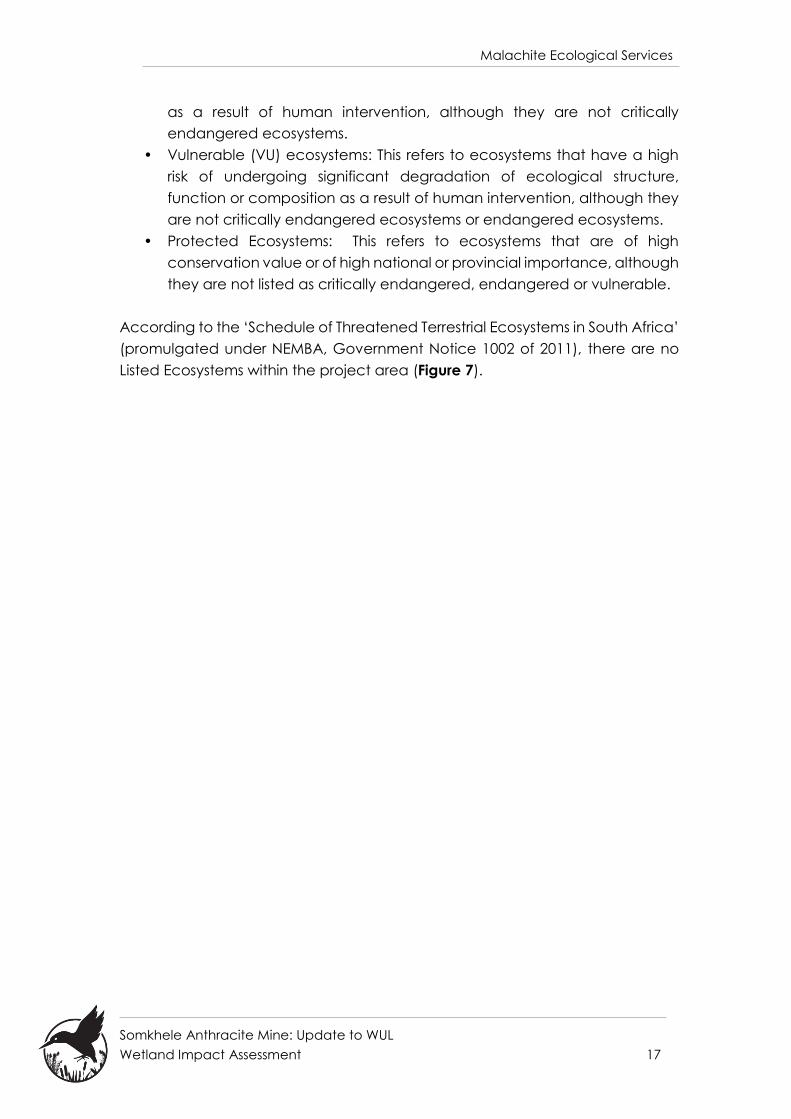
• Vulnerable (VU) ecosystems: This refers to ecosystems that have a high
risk of undergoing significant degradation of ecological structure,
function or composition as a result of human intervention, although they
are not critically endangered ecosystems or endangered ecosystems.
• Protected Ecosystems: This refers to ecosystems that are of high
conservation value or of high national or provincial importance, although
they are not listed as critically endangered, endangered or vulnerable.
According to the ‘Schedule of Threatened Terrestrial Ecosystems in South Africa’
(promulgated under NEMBA, Government Notice 1002 of 2011), there are no
Listed Ecosystems within the project area (Figure 7).
Malachite Ecological Services
Somkhele Anthracite Mine: Update to WUL
Wetland Impact Assessment 18
FIGURE 7: PROVINCIAL AND NATIONAL CONSERVATION PLANNING TOOLS
Malachite Ecological Services
Somkhele Anthracite Mine: Update to WUL
Wetland Impact Assessment 19
CATCHMENT CHARACTERISTICS AND WATERCOURSES
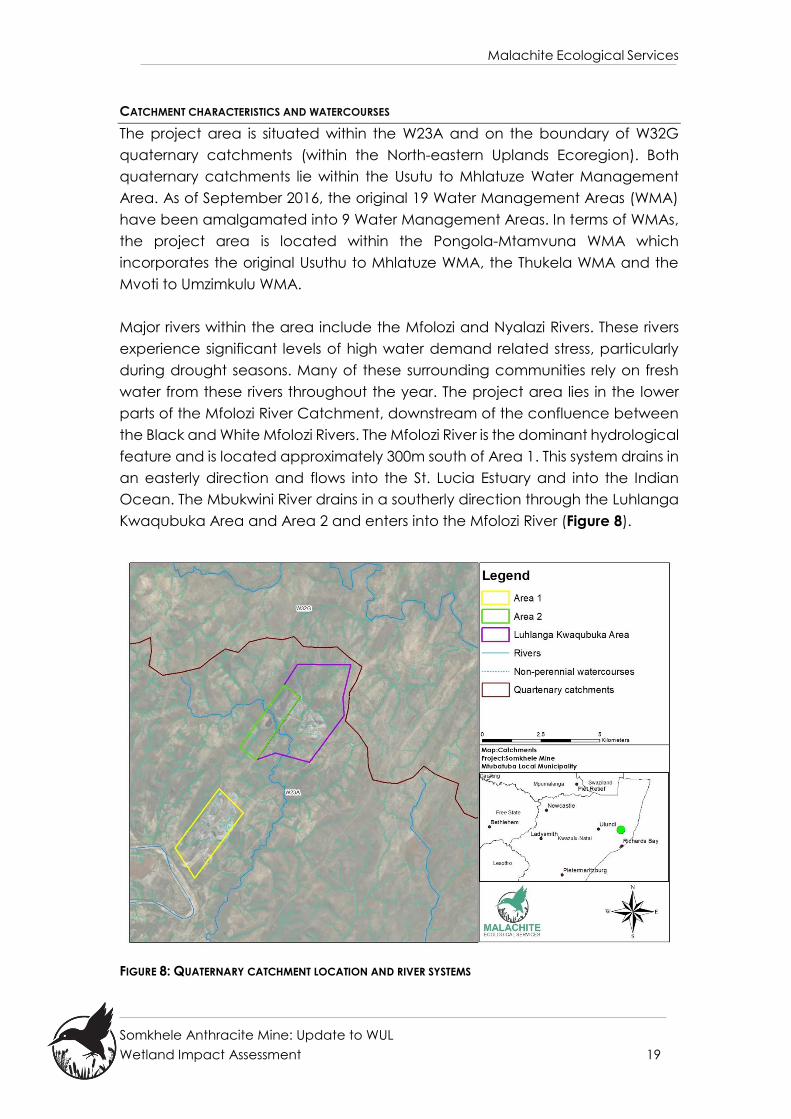
The project area is situated within the W23A and on the boundary of W32G
quaternary catchments (within the North-eastern Uplands Ecoregion). Both
quaternary catchments lie within the Usutu to Mhlatuze Water Management
Area. As of September 2016, the original 19 Water Management Areas (WMA)
have been amalgamated into 9 Water Management Areas. In terms of WMAs,
the project area is located within the Pongola-Mtamvuna WMA which
incorporates the original Usuthu to Mhlatuze WMA, the Thukela WMA and the
Mvoti to Umzimkulu WMA.
Major rivers within the area include the Mfolozi and Nyalazi Rivers. These rivers
experience significant levels of high water demand related stress, particularly
during drought seasons. Many of these surrounding communities rely on fresh
water from these rivers throughout the year. The project area lies in the lower
parts of the Mfolozi River Catchment, downstream of the confluence between
the Black and White Mfolozi Rivers. The Mfolozi River is the dominant hydrological
feature and is located approximately 300m south of Area 1. This system drains in
an easterly direction and flows into the St. Lucia Estuary and into the Indian
Ocean. The Mbukwini River drains in a southerly direction through the Luhlanga
Kwaqubuka Area and Area 2 and enters into the Mfolozi River (Figure 8).
FIGURE 8: QUATERNARY CATCHMENT LOCATION AND RIVER SYSTEMS
Malachite Ecological Services
Somkhele Anthracite Mine: Update to WUL
Wetland Impact Assessment 20
The dominant land use surrounding the project area is associated with the
existing Somkhele Anthracite Mine as well as rural communities interspersed with
tracts of natural vegetation often associated with wetland and riparian systems.
Large portions of the area surrounding the existing mine were utilised for
settlements (and subsequent livestock grazing and agriculture) prior to its
establishment.
Further impacts include the spread and colonisation of invasive alien species
through edge effects due to anthropogenic disturbances, conversion and over
utilisation of natural vegetation and degradation of water resources. The
transformation of biophysical characteristics exacerbates impacts such as
sedimentation and reduced water quality within the catchment.
NATIONAL FRESHWATER ECOSYSTEM PRIORITY AREAS (NFEPA)
South Africa’s freshwater ecosystems are diverse and these ecosystems refer to
all inland water bodies (fresh or saline) including rivers, lakes, wetlands, sub-
surface waters and estuaries (Nel et al., 2011). More than half of the country’s
freshwater ecosystems are considered threatened with the taxa associated with
these habitats also displaying high levels of threat (fishes, molluscs, dragonflies,
crabs and vascular plants). These statistics emphasise the need to protect and
conserve the remaining freshwater ecosystems.
The NFEPA project was developed to provide strategic spatial priorities for
conserving South Africa’s freshwater ecosystems and supporting sustainable use
of water resources. These strategic spatial priorities are known as Freshwater
Ecosystem Priority Areas, or FEPAs (Driver et al., 2011). NFEPA further supports the
implementation of the National Water Act, the Biodiversity Act and the
Protected Areas Act.
As discussed in the regional vegetation component, vegetation in South Africa
has been categorised into special units based on biotic factors, physical
features and assemblages. In a similar way the NFEPA wetland vegetation
groups have further categorised vegetation units associated with water
resources. These vegetation groups were derived from grouping the 438
vegetation units into 133 wetland vegetation groups. The site is situated within
the Lowveld Group 11 wetland ecosystem type. This ecosystem type is listed as
Vulnerable.
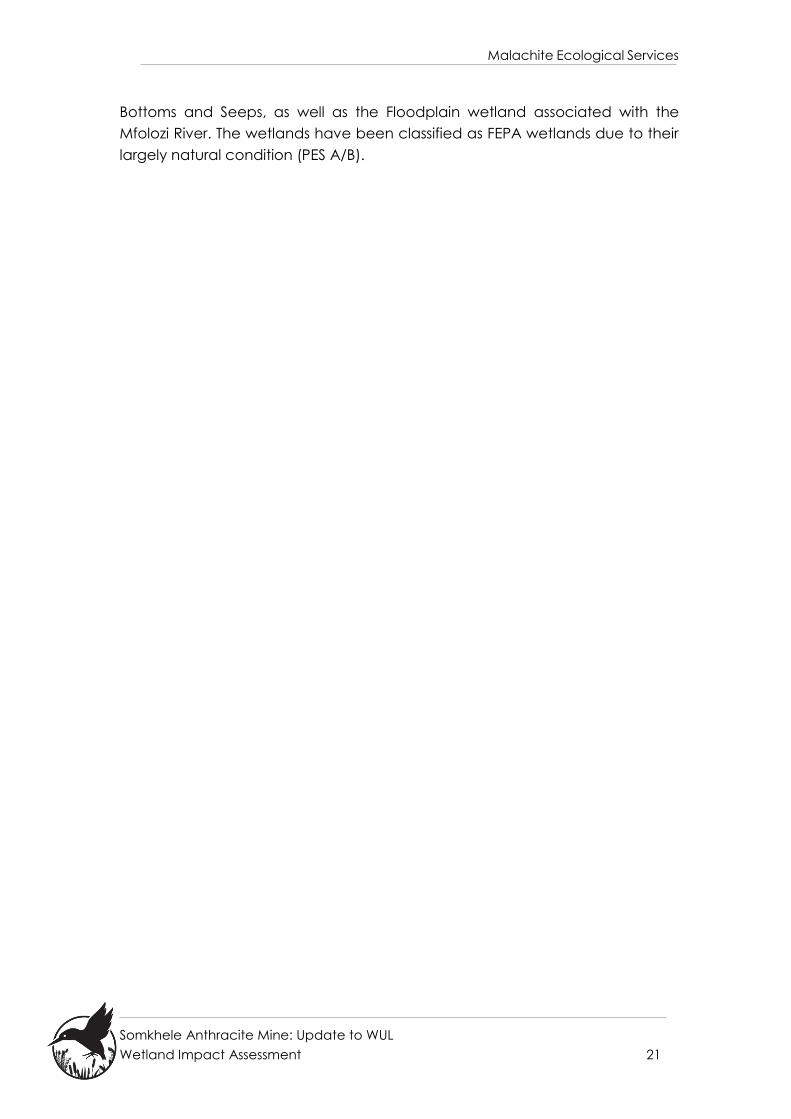
An examination of the NFEPA database was undertaken. A number of wetland
systems were identified within the project area as well as within the 500m
assessment buffer (Figure 9). These wetlands are classified as Channelled Valley
Malachite Ecological Services
Somkhele Anthracite Mine: Update to WUL
Wetland Impact Assessment 21
Bottoms and Seeps, as well as the Floodplain wetland associated with the
Mfolozi River. The wetlands have been classified as FEPA wetlands due to their
largely natural condition (PES A/B).
Malachite Ecological Services
Somkhele Anthracite Mine: Update to WUL
Wetland Impact Assessment 22
FIGURE 9: FRESHWATER ECOSYSTEM PRIORITY AREA WETLANDS
Malachite Ecological Services
Somkhele Anthracite Mine: Update to WUL
Wetland Impact Assessment 23
ASSESSMENT RESULTS
WETLAND DELINEATION
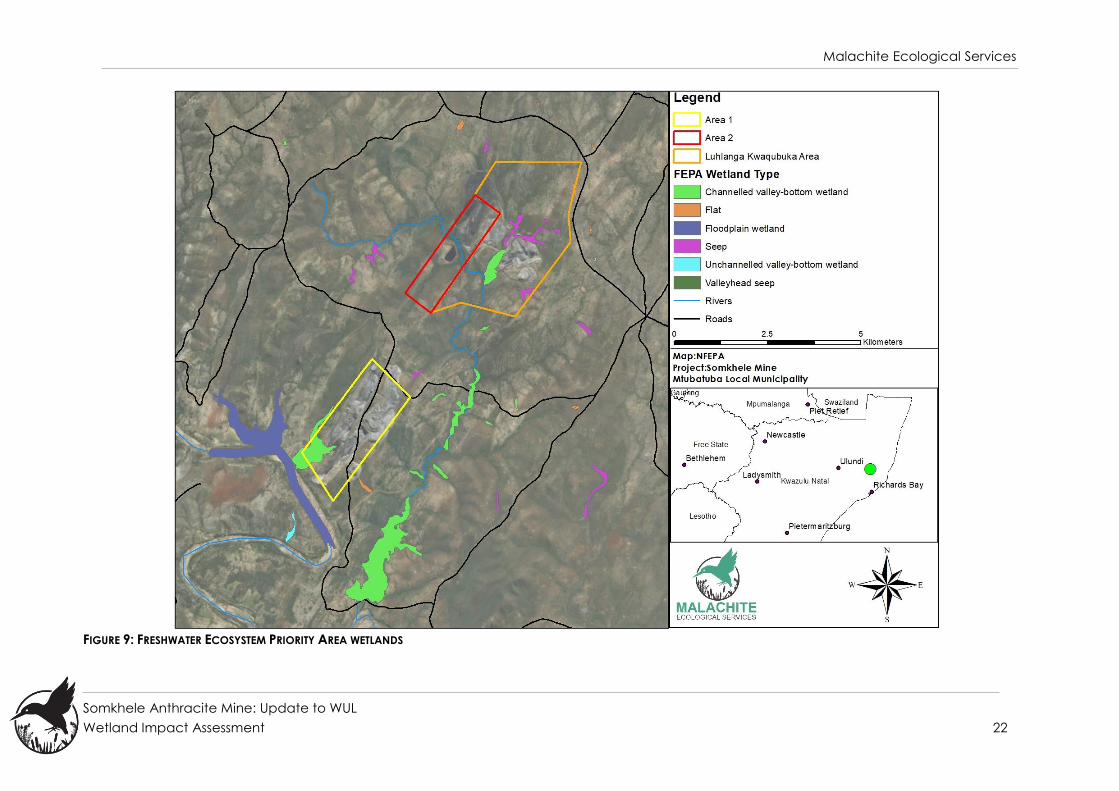
The South African classification system categorises wetland systems based on
the characteristics of different Hydrogeomorphic (HGM) Units. A HGM unit is a
recognisable physiographic wetland-unit based on the geomorphic setting,
water source of the wetland and the water flow patterns (Macfarlane et al.,
2008). There are five broad recognised wetland systems based on the
abovementioned system and these are depicted in Figure 10. The classification
of these wetlands is then further refined as per the ‘Classification System for
Wetlands and other Aquatic Ecosystems in South Africa’ (Ollis et al., 2013).
FIGURE 10: DIAGRAMMATIC REPRESENTATION OF COMMON WETLAND SYSTEMS IDENTIFIED IN SOUTHERN
AFRICA
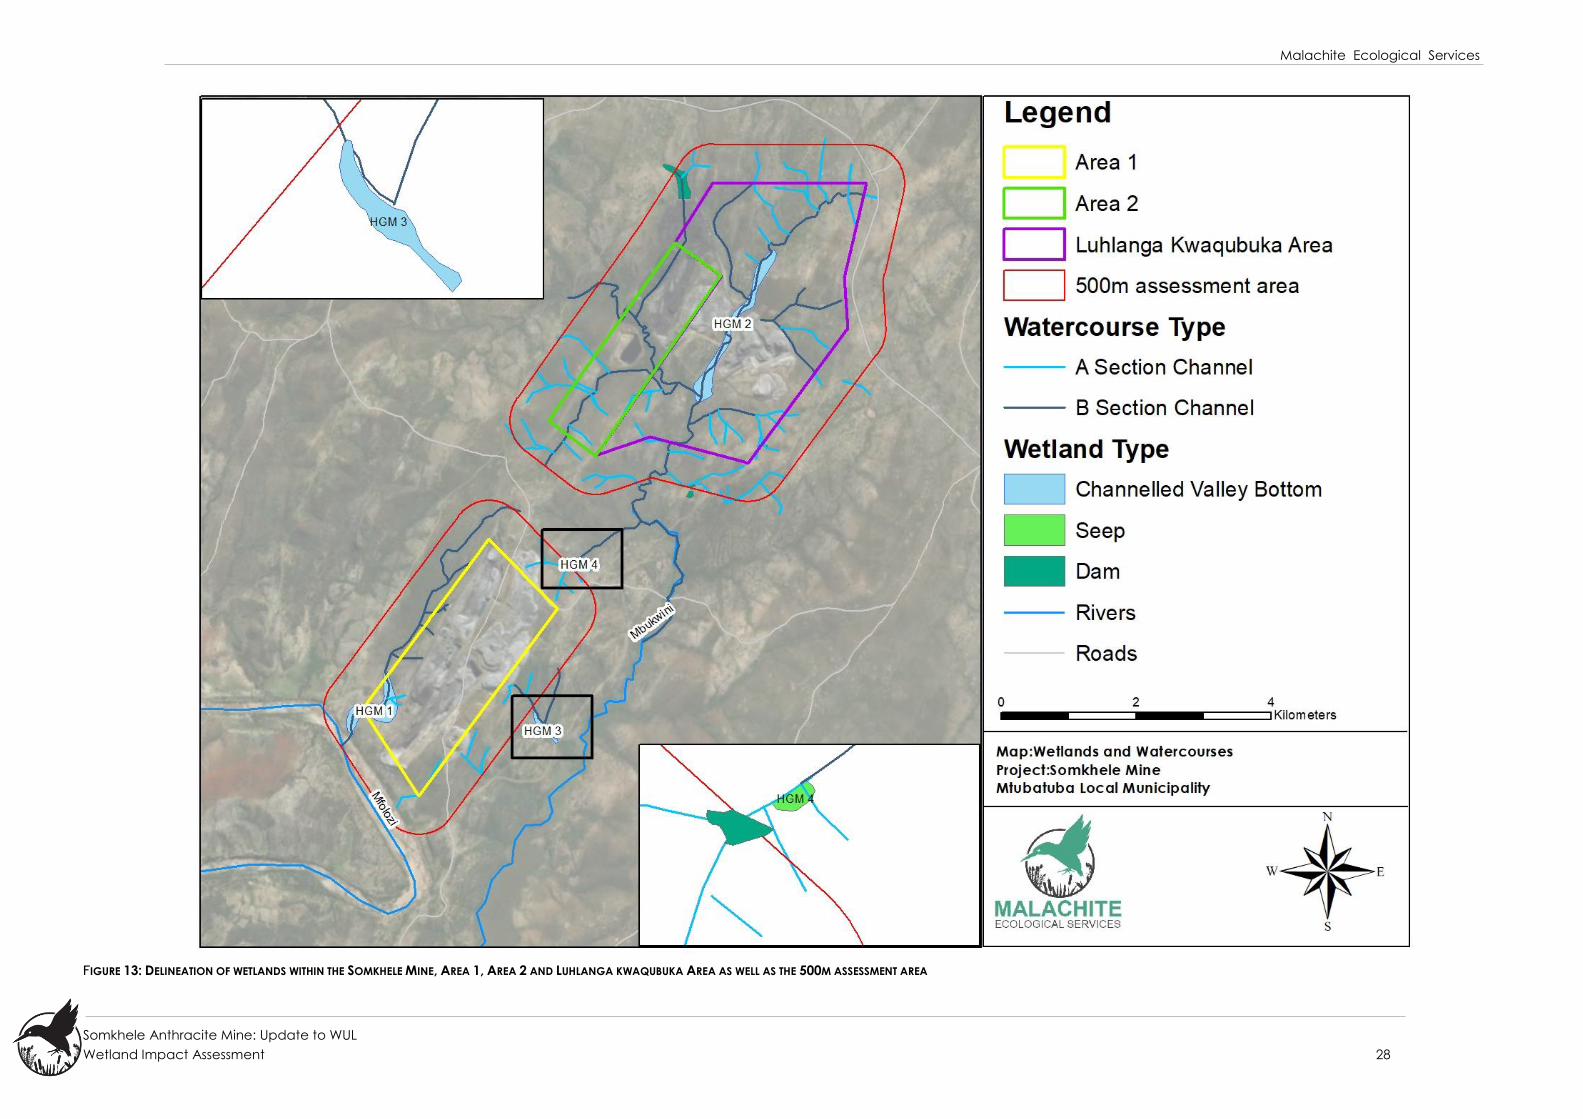
Based on the current identification of the four wetland indicators, four HGM units
were delineated within the assessment area (Figure 13). Three HGM units have
been classified as Channelled Valley Bottom wetlands, (HGM 1, HGM 2 5 and
5 It must be noted that a Watercourse Delineation and Importance Assessment Report was conducted by
Eco-Pulse Environmental Services in 2017. The assessment area identified within this report covers portions of
the assessment area in the Luhlanga Kwaqubuka Area. The wetland systems identified by Eco-Pulse within the
area have been classified differently to the classification in this report. Eco-Pulse have classified three wetland
systems as a Depression, an Unchannelled Valley Bottom wetland and a Channelled Valley Bottom wetland.
As part of the current assessment in this report we delineated an extension to this area and have combined
all wetland units into one HGM unit and classified this as HGM 2, a Channelled Valley Bottom system. This was
due to our identification of characteristics relating to this wetland type, namely a non-perennial channel
which is consistently present within the area.

Malachite Ecological Services
Somkhele Anthracite Mine: Update to WUL
Wetland Impact Assessment 24
HGM 3) and one HGM unit classified as a Seep (HGM 4). HGM 1 and HGM 2 are
situated within the mine boundary and HGM 3 and HGM 4 are situated
approximately 550m to 600m from the existing mine boundaries. These wetlands
were included within the assessment as they are situated directly downstream
from the mining area and could therefore be potentially affected by mining
operations.
Channelled Valley Bottom wetlands are characterised by their location on
valley floors and the presence of a river or stream channel flowing through the
wetland (but lacking characteristic floodplain features). This may be gently
sloped and characterised by the net accumulation of alluvial deposits or have
steeper slopes and be characterised by the net loss of sediment. Dominant
water inputs to these wetlands are derived from the channels flowing through
the wetland, either as surface flows resulting from flooding or as subsurface flow.
Water generally moves through the wetland as diffuse surface flow although
occasionally as short-lived concentrated flows during flood events (Ollis et al.,
2013).
Seepage wetlands are characterised by their association with topographic
positions that either cause groundwater to discharge to the land surface or rain-
derived water to seep down-slope as subsurface interflow. Water movement
through the Seep is primarily attributed to interflow, with diffuse overland flow
often being significant during and after rainfall events (Kotze et al., 2008; Ollis et
al., 2013). Water inputs are mainly from sub-surface flow and outflow is usually
via a well-defined stream channel connecting the area directly to a stream
channel.

Malachite Ecological Services
Somkhele Anthracite Mine: Update to WUL
Wetland Impact Assessment 25
The wetland delineation was conducted based on the dominant indicators,
including soil type (i.e. Soil Form and the presence of hydric characteristics);
vegetation; and topographic position within a landscape. These are discussed
in more detail below.
RIPARIAN DELINEATION AND WATERCOURSE CLASSIFICATION
A number of watercourses were identified flowing through the project area and
were delineated based on topographic setting, vegetative indicators as well as
the presence or absence of alluvial soils as described in ‘A Practical Field
Procedure for Identification and Delineation of Wetland and Riparian Areas –
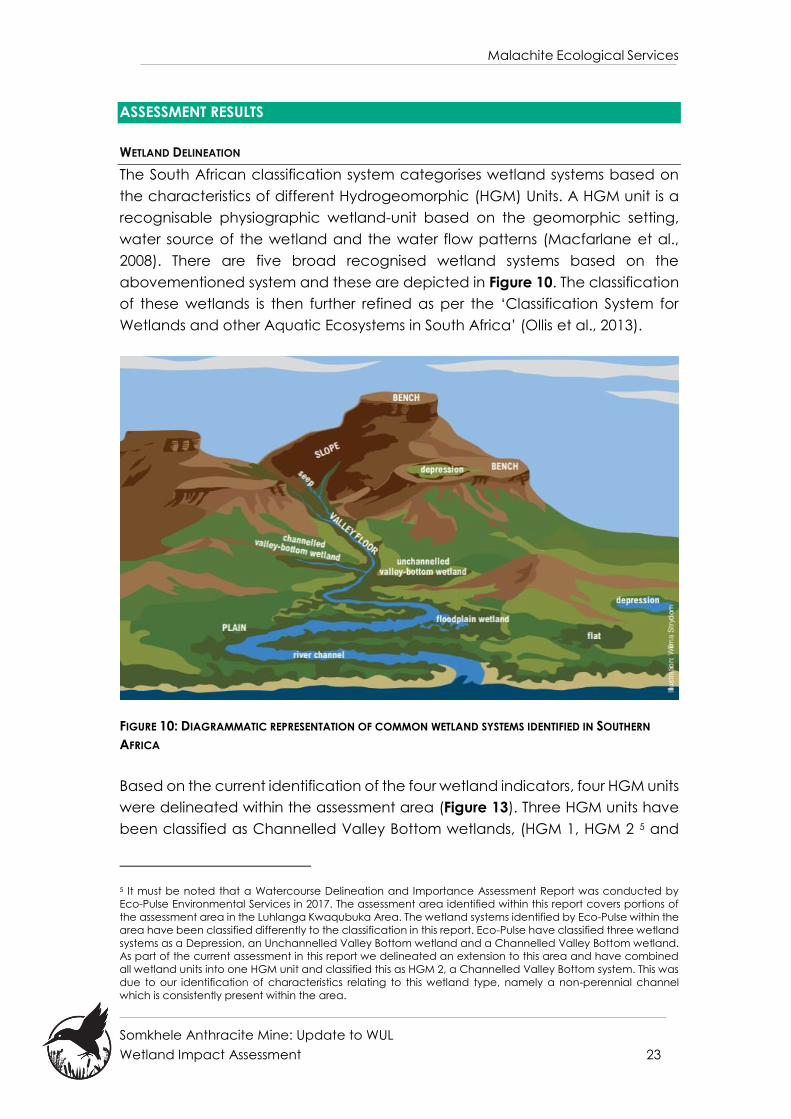
Edition 1’ (DWAF, 2005) requirements. This manual separates the classification of
watercourses into three (3) separate types of channels or sections defined by
their position relative to the zone of saturation in the riparian area (Figure 11).
The classification system separates channels into:
o Those that do not have baseflow (‘A’ Sections).
o Those that sometimes have baseflow (‘B’ Sections) or non-perennial.
o Those that always have baseflow (‘C’ Sections) or perennial.
Malachite Ecological Services
Somkhele Anthracite Mine: Update to WUL
Wetland Impact Assessment 26
FIGURE 11: DIAGRAM SHOWING THE CHANGE OF SATURATION DEPENDING ON THE TYPE OF CHANNEL
The majority of watercourses were classified as either ‘A’ Section, or ‘B’ Section
channels. ‘A’ Section Channels are channels convey surface runoff
immediately after a storm event and are not associated with a riparian zone.
They are therefore ephemeral or intermittent channels.
‘B’ Section channels are in contact with the zone of saturation often enough to
have vegetation associated with saturated conditions as well as gleyed soil
within the channel confine. They are therefore described as non-perennial.
Furthermore two perennial rivers flow within the project area, including the
Mfolozi and the Mbukwini River. The non-perennial and perennial watercourses
are considered hydrologically sensitive as they are associated with riparian
habitats.
The National Water Act (Act 36 of 1998), defines a riparian habitat as:
“Riparian habitat includes the physical structure and
associated vegetation of the areas associated with a
watercourse which are commonly characterised by alluvial
soils and which are inundated or flooded to an extent and with
a frequency sufficient to support vegetation of species with a
composition and physical structure distinct from those of
adjacent land areas.”
The riparian zone or riparian area of a river is the portion of land directly
adjacent to the active channel (i.e. on the banks of the river), which is
Channel Bed Profile
A Section
B Section C Section
Always Frequently Very seldom
Frequency of Saturation of Channel Bed
Wet
Dry
Water Table
Malachite Ecological Services
Somkhele Anthracite Mine: Update to WUL
Wetland Impact Assessment 27
influenced by river-induced or river-related processes. These areas are
commonly characterised by alluvial soils and by vegetation that is distinct from
that of adjacent land areas in terms of its composition and physical structure.
The riparian zone of a river is typically located between the outside edge of the
active channel and the outside edge of the macro-channel (Ollis et al., 2013).
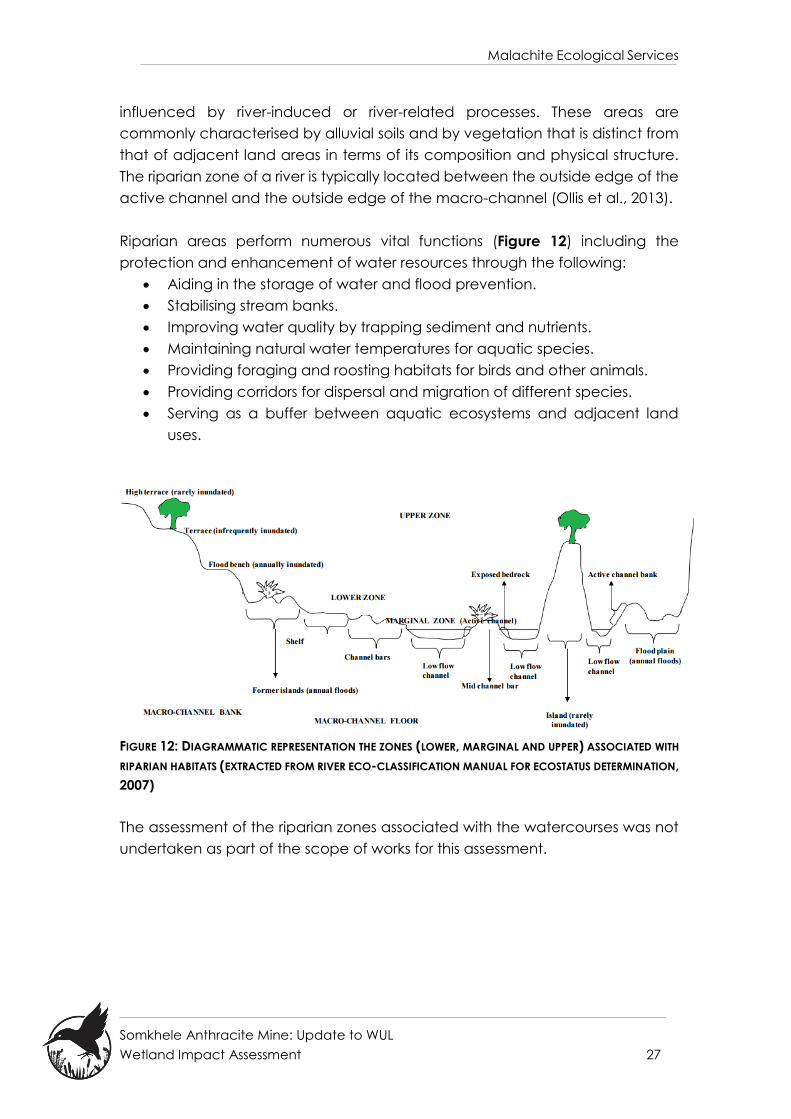
Riparian areas perform numerous vital functions (Figure 12) including the
protection and enhancement of water resources through the following:
Aiding in the storage of water and flood prevention.
Stabilising stream banks.
Improving water quality by trapping sediment and nutrients.
Maintaining natural water temperatures for aquatic species.
Providing foraging and roosting habitats for birds and other animals.
Providing corridors for dispersal and migration of different species.
Serving as a buffer between aquatic ecosystems and adjacent land
uses.
FIGURE 12: DIAGRAMMATIC REPRESENTATION THE ZONES (LOWER, MARGINAL AND UPPER) ASSOCIATED WITH
RIPARIAN HABITATS (EXTRACTED FROM RIVER ECO-CLASSIFICATION MANUAL FOR ECOSTATUS DETERMINATION,
2007)
The assessment of the riparian zones associated with the watercourses was not
undertaken as part of the scope of works for this assessment.
Malachite Ecological Services
Somkhele Anthracite Mine: Update to WUL
Wetland Impact Assessment 28
FIGURE 13: DELINEATION OF WETLANDS WITHIN THE SOMKHELE MINE, AREA 1, AREA 2 AND LUHLANGA KWAQUBUKA AREA AS WELL AS THE 500M ASSESSMENT AREA
Malachite Ecological Services
Somkhele Anthracite Mine: Update to WUL
Wetland Impact Assessment 29
SOIL WETNESS AND SOIL FORM INDICATOR
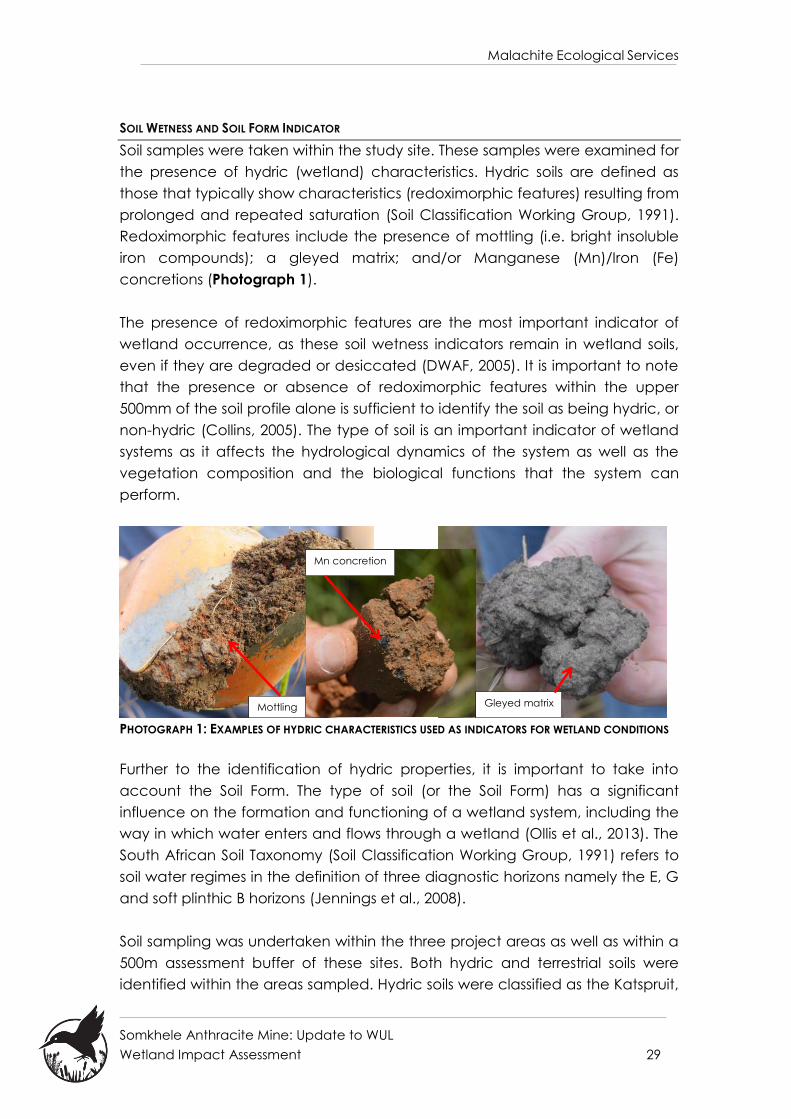
Soil samples were taken within the study site. These samples were examined for
the presence of hydric (wetland) characteristics. Hydric soils are defined as
those that typically show characteristics (redoximorphic features) resulting from
prolonged and repeated saturation (Soil Classification Working Group, 1991).
Redoximorphic features include the presence of mottling (i.e. bright insoluble
iron compounds); a gleyed matrix; and/or Manganese (Mn)/Iron (Fe)
concretions (Photograph 1).
The presence of redoximorphic features are the most important indicator of
wetland occurrence, as these soil wetness indicators remain in wetland soils,
even if they are degraded or desiccated (DWAF, 2005). It is important to note
that the presence or absence of redoximorphic features within the upper
500mm of the soil profile alone is sufficient to identify the soil as being hydric, or
non-hydric (Collins, 2005). The type of soil is an important indicator of wetland
systems as it affects the hydrological dynamics of the system as well as the
vegetation composition and the biological functions that the system can
perform.
PHOTOGRAPH 1: EXAMPLES OF HYDRIC CHARACTERISTICS USED AS INDICATORS FOR WETLAND CONDITIONS
Further to the identification of hydric properties, it is important to take into
account the Soil Form. The type of soil (or the Soil Form) has a significant
influence on the formation and functioning of a wetland system, including the
way in which water enters and flows through a wetland (Ollis et al., 2013). The
South African Soil Taxonomy (Soil Classification Working Group, 1991) refers to
soil water regimes in the definition of three diagnostic horizons namely the E, G
and soft plinthic B horizons (Jennings et al., 2008).
Soil sampling was undertaken within the three project areas as well as within a
500m assessment buffer of these sites. Both hydric and terrestrial soils were
identified within the areas sampled. Hydric soils were classified as the Katspruit,
Mottling
Mn concretion
Gleyed matrix
Malachite Ecological Services
Somkhele Anthracite Mine: Update to WUL
Wetland Impact Assessment 30
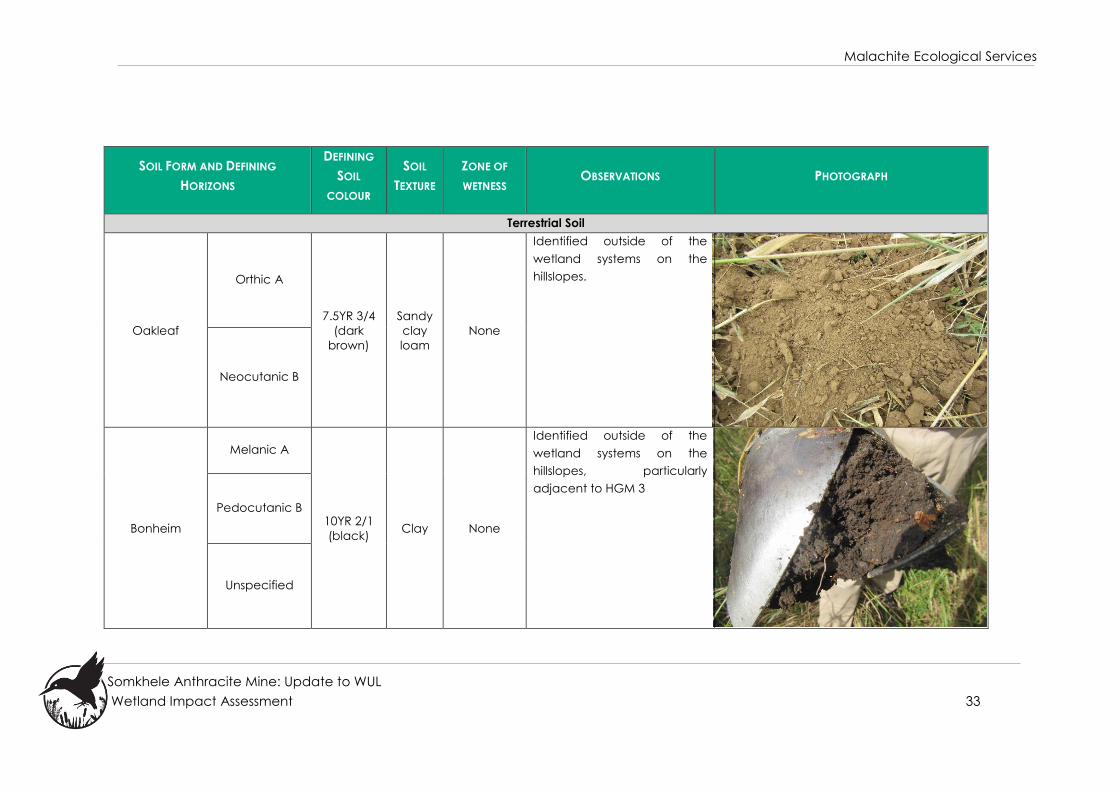
Pinedene and Tukulu soil forms, while the terrestrial soils were classified as the
Bonheim, Clovelly, Oakleaf, Glenrosa and Mispah soils.
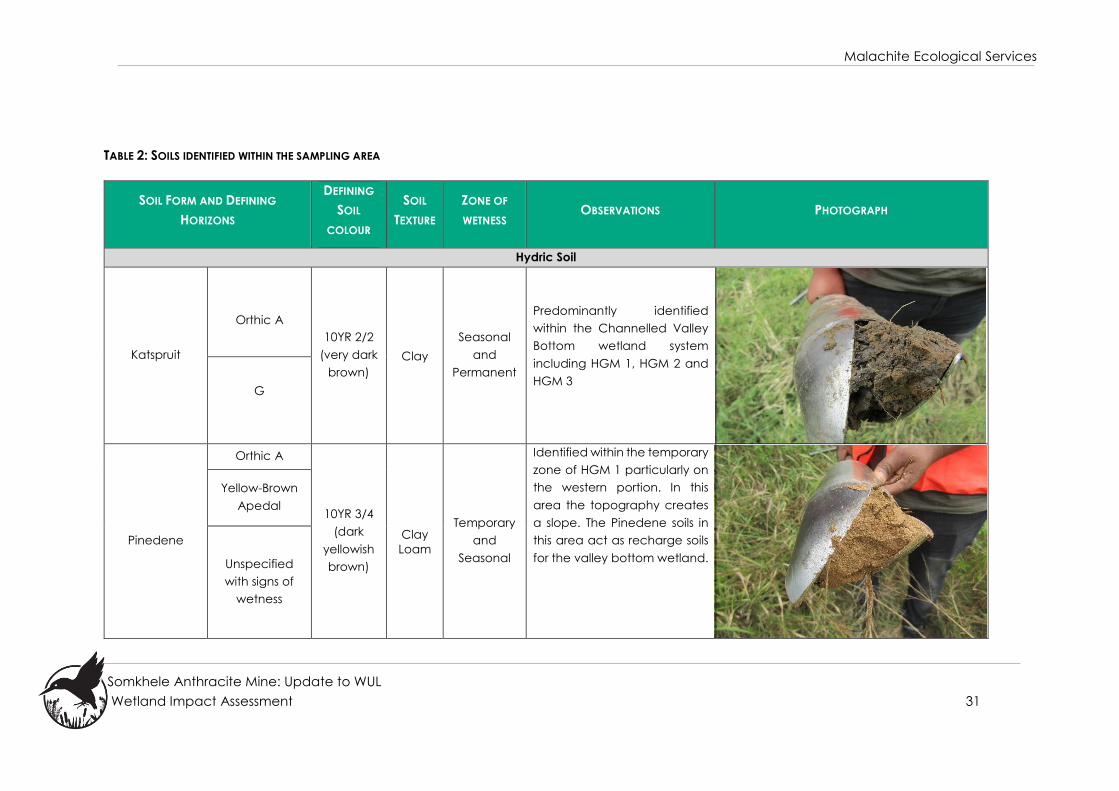
The Katspruit soil form is a clay soil that displays a gleyed matrix with bluish tints
as well as mottling. This soil is seasonally to permanently saturated, and is the
most widely encountered wetland soil in South Africa (Fey, 2010). They are most
commonly associated with valley bottom and floodplain wetlands.
Pinedene soils are oxidic in nature, meaning that they have a uniformly coloured
yellow oxides of iron within the sub horizon. Signs of wetness were noted at
approximately 300mm-500mm below this horizon in the form of mottling as well
as a gleyed matrix. These soils are associated with recharge characteristics and
are important within the landscape as they provide necessary interflow to
replenish valley bottom wetlands. These soils are therefore often associated with
seep wetlands.
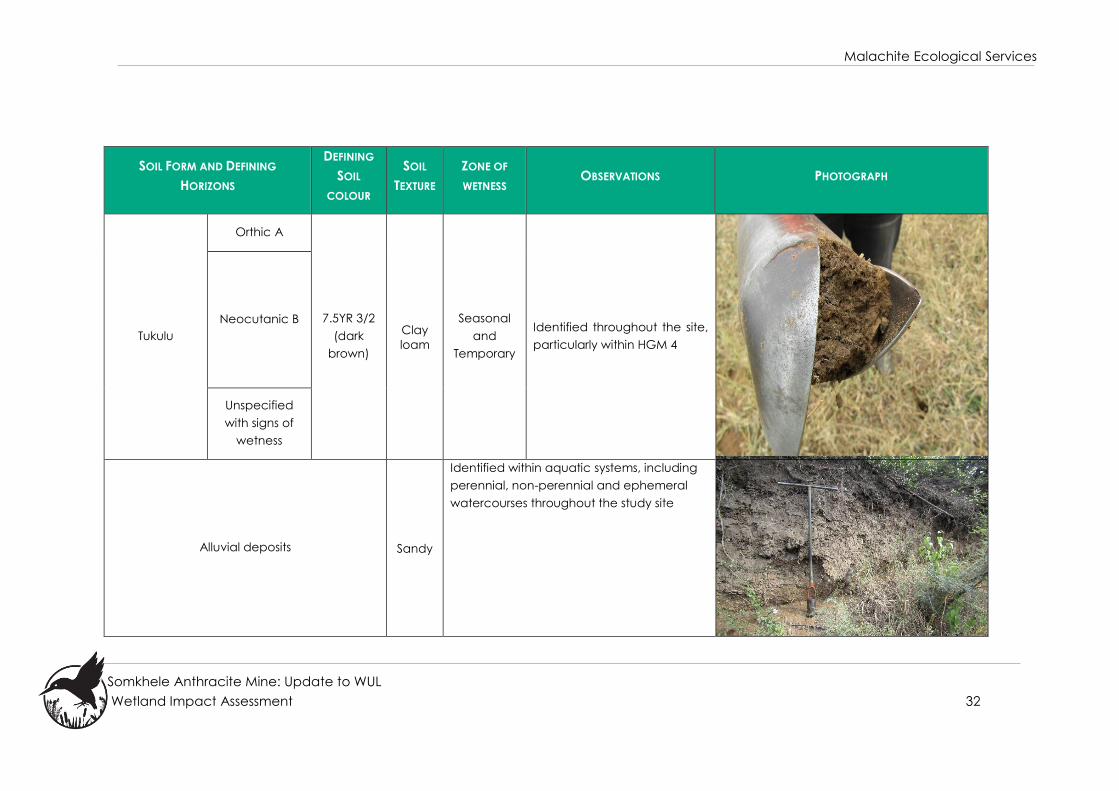
The Tukulu soil is defined as a cumulic soil and is characteristically immature in
nature. This immaturity within the development of the soil is noted by the lack of
structure within the sub horizons. The Tukulu soil sampled within the site, showed
signs of wetness at approximately 400-700mm in profile depth in the form of
mottling, as well as a paler more gleyed horizon.
Soils identified within the site are displayed in Table 2 and the Soil auger point
positions and the associated soil form identified are provided in Appendix C.
Malachite Ecological Services
Somkhele Anthracite Mine: Update to WUL
Wetland Impact Assessment 31
TABLE 2: SOILS IDENTIFIED WITHIN THE SAMPLING AREA
SOIL FORM AND DEFINING
HORIZONS
DEFINING
SOIL
COLOUR
SOIL
TEXTURE
ZONE OF
WETNESS OBSERVATIONS PHOTOGRAPH
Hydric Soil
Katspruit
Orthic A
10YR 2/2
(very dark
brown)
Clay
Seasonal
and
Permanent
Predominantly identified
within the Channelled Valley
Bottom wetland system
including HGM 1, HGM 2 and
HGM 3
G
Pinedene
Orthic A
10YR 3/4
(dark
yellowish
brown)
Clay
Loam
Temporary
and
Seasonal
Identified within the temporary
zone of HGM 1 particularly on
the western portion. In this
area the topography creates
a slope. The Pinedene soils in
this area act as recharge soils
for the valley bottom wetland.
Yellow-Brown
Apedal
Unspecified
with signs of
wetness
Malachite Ecological Services
Somkhele Anthracite Mine: Update to WUL
Wetland Impact Assessment 32
SOIL FORM AND DEFINING
HORIZONS
DEFINING
SOIL
COLOUR
SOIL
TEXTURE
ZONE OF
WETNESS OBSERVATIONS PHOTOGRAPH
Tukulu
Orthic A
7.5YR 3/2
(dark
brown)
Clay
loam
Seasonal
and
Temporary
Identified throughout the site,
particularly within HGM 4
Neocutanic B
Unspecified
with signs of
wetness
Alluvial deposits Sandy
Identified within aquatic systems, including
perennial, non-perennial and ephemeral
watercourses throughout the study site
Malachite Ecological Services
Somkhele Anthracite Mine: Update to WUL
Wetland Impact Assessment 33
SOIL FORM AND DEFINING
HORIZONS
DEFINING
SOIL
COLOUR
SOIL
TEXTURE
ZONE OF
WETNESS OBSERVATIONS PHOTOGRAPH
Terrestrial Soil
Oakleaf
Orthic A
7.5YR 3/4
(dark
brown)
Sandy
clay
loam
None
Identified outside of the
wetland systems on the
hillslopes.
Neocutanic B
Bonheim
Melanic A
10YR 2/1
(black) Clay None
Identified outside of the
wetland systems on the
hillslopes, particularly
adjacent to HGM 3
Pedocutanic B
Unspecified
Malachite Ecological Services
Somkhele Anthracite Mine: Update to WUL
Wetland Impact Assessment 34
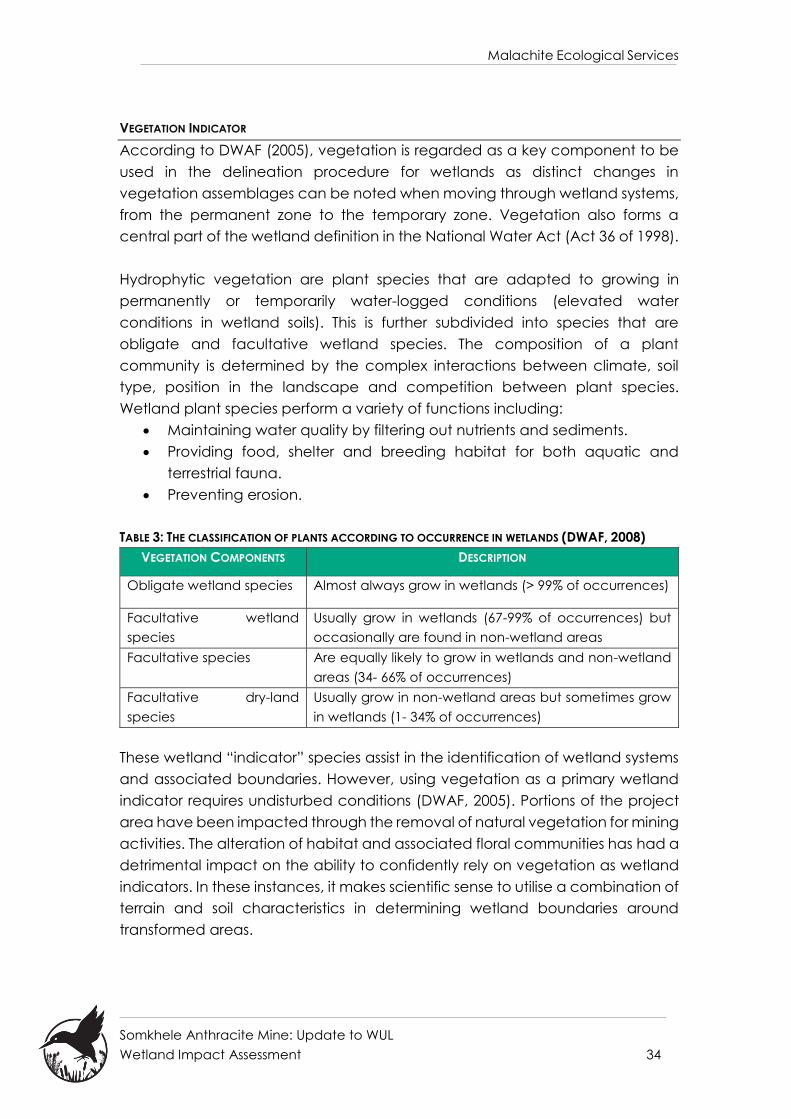
VEGETATION INDICATOR
According to DWAF (2005), vegetation is regarded as a key component to be
used in the delineation procedure for wetlands as distinct changes in
vegetation assemblages can be noted when moving through wetland systems,
from the permanent zone to the temporary zone. Vegetation also forms a
central part of the wetland definition in the National Water Act (Act 36 of 1998).
Hydrophytic vegetation are plant species that are adapted to growing in
permanently or temporarily water-logged conditions (elevated water
conditions in wetland soils). This is further subdivided into species that are
obligate and facultative wetland species. The composition of a plant
community is determined by the complex interactions between climate, soil
type, position in the landscape and competition between plant species.
Wetland plant species perform a variety of functions including:
Maintaining water quality by filtering out nutrients and sediments.
Providing food, shelter and breeding habitat for both aquatic and
terrestrial fauna.
Preventing erosion.
TABLE 3: THE CLASSIFICATION OF PLANTS ACCORDING TO OCCURRENCE IN WETLANDS (DWAF, 2008)
VEGETATION COMPONENTS DESCRIPTION
Obligate wetland species Almost always grow in wetlands (> 99% of occurrences)
Facultative wetland
species
Usually grow in wetlands (67-99% of occurrences) but
occasionally are found in non-wetland areas
Facultative species Are equally likely to grow in wetlands and non-wetland
areas (34- 66% of occurrences)
Facultative dry-land
species
Usually grow in non-wetland areas but sometimes grow
in wetlands (1- 34% of occurrences)
These wetland “indicator” species assist in the identification of wetland systems
and associated boundaries. However, using vegetation as a primary wetland
indicator requires undisturbed conditions (DWAF, 2005). Portions of the project
area have been impacted through the removal of natural vegetation for mining
activities. The alteration of habitat and associated floral communities has had a
detrimental impact on the ability to confidently rely on vegetation as wetland
indicators. In these instances, it makes scientific sense to utilise a combination of
terrain and soil characteristics in determining wetland boundaries around
transformed areas.

Malachite Ecological Services
Somkhele Anthracite Mine: Update to WUL
Wetland Impact Assessment 35
Variations in wetland systems also have an impact on vegetation communities
through the topographical setting. The topographic position of plant
communities is believed to influence plant distribution through variations in
radiant (solar) energy and subsequent variations in soil moisture levels.
Therefore, Channelled Valley Bottom wetlands generally provide unique
environmental conditions compared to the Seepage system.
Hydrophytic vegetation was noted within the Channelled Valley Bottom and
Seep wetland systems. Species noted within the permanent zone were
dominated by graminoid, sedge and in some instances rush species. Commonly
noted species included Phragmites australis, Typha capensis, Juncus effuses
and Cyperus dives. Paspalum distichum and Cyperus longus were also noted
within the seasonal zone as well as a variety of graminoid species (Eragrostis
spp., Cynodon dactylon, Sporobolus pyrimidalis, S. africanus, Chloris gayana
and Imperata cylindrica) transitioning from the drier wetland edge to the
terrestrial habitat components. The grassland communities outside of wetland
systems were often largely secondary in nature with a moderate-low diversity of
indigenous herbaceous species.
Riparian vegetation associated with the Zululand Lowveld habitat was
comprised of Ficus sycamorus, Trichilia spp, Euclea daphnoides, Ziziphus
mucronata, Gymnosporia senegalensis, Dichrostachys cinerea and Olea
europeae subsp. africana. Grassland-thicket systems (Vachellia nilotica, V.
robusta and D. cinerea) were also common in the southern portion of the
project area.
Stands of alien invasive Chromolaena odorata (Paraffin weed), Lantana
camara (Tickberry) and to a lesser extent Senna didymobotrya (Peanut Butter
Cassia) and Ricinus communis (Castor-oil Bush) were noted within the seasonal
zone of saturation and adjacent to onsite wetlands in close proximity to mining
activities within the mining area. In certain riparian systems the encroachment
of Pereskia aculeata (Barbados Gooseberry) and Melia azedarach (Syringa
tree) was noted. There is a concern that the continued spread of these species
will result in a decline of the health and functionality of these systems. Therefore,
it is recommended that an invasive alien plant management plan be
implemented surrounding the affected systems to ensure the continued
provision of ecosystem services.
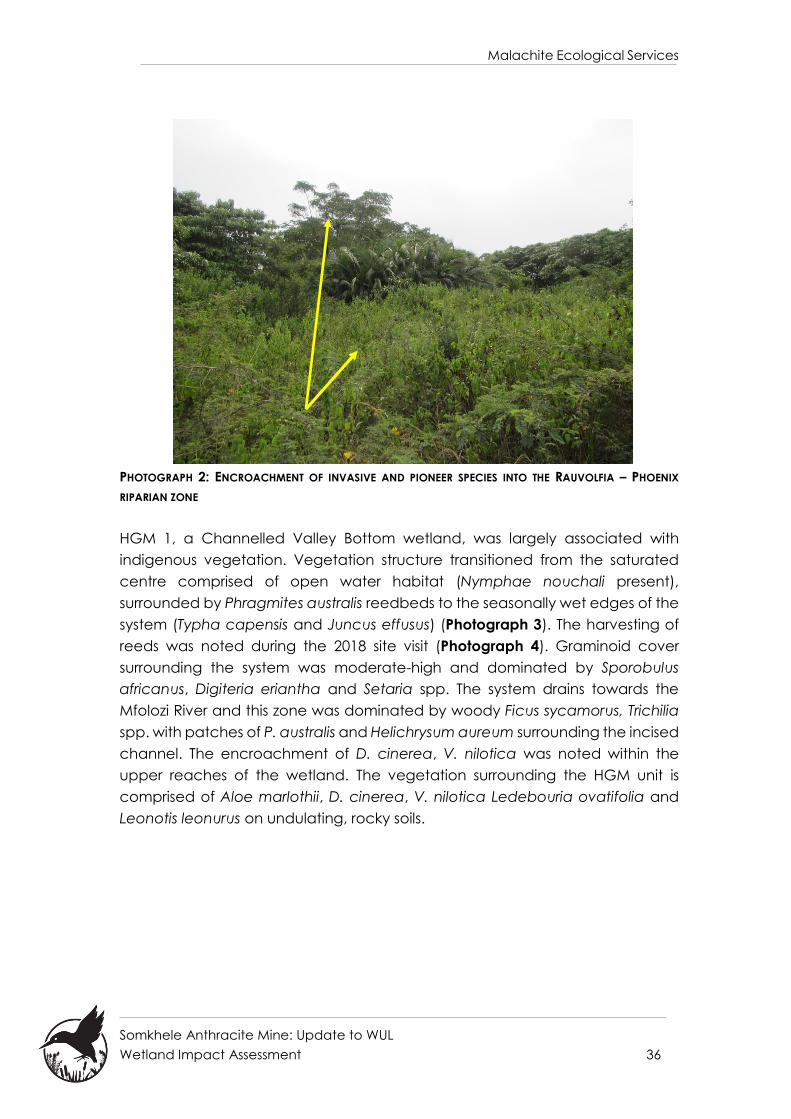
Malachite Ecological Services
Somkhele Anthracite Mine: Update to WUL
Wetland Impact Assessment 36
PHOTOGRAPH 2: ENCROACHMENT OF INVASIVE AND PIONEER SPECIES INTO THE RAUVOLFIA – PHOENIX
RIPARIAN ZONE
HGM 1, a Channelled Valley Bottom wetland, was largely associated with
indigenous vegetation. Vegetation structure transitioned from the saturated
centre comprised of open water habitat (Nymphae nouchali present),
surrounded by Phragmites australis reedbeds to the seasonally wet edges of the
system (Typha capensis and Juncus effusus) (Photograph 3). The harvesting of
reeds was noted during the 2018 site visit (Photograph 4). Graminoid cover
surrounding the system was moderate-high and dominated by Sporobulus
africanus, Digiteria eriantha and Setaria spp. The system drains towards the
Mfolozi River and this zone was dominated by woody Ficus sycamorus, Trichilia
spp. with patches of P. australis and Helichrysum aureum surrounding the incised
channel. The encroachment of D. cinerea, V. nilotica was noted within the
upper reaches of the wetland. The vegetation surrounding the HGM unit is
comprised of Aloe marlothii, D. cinerea, V. nilotica Ledebouria ovatifolia and
Leonotis leonurus on undulating, rocky soils.

Malachite Ecological Services
Somkhele Anthracite Mine: Update to WUL
Wetland Impact Assessment 37
PHOTOGRAPH 3: VEGETATION AND HABITATS ASSOCIATED WITH HGM1

Malachite Ecological Services
Somkhele Anthracite Mine: Update to WUL
Wetland Impact Assessment 38
PHOTOGRAPH 4: HARVESTING OF REEDBEDS
The vegetation community associated with HGM 2 (Channelled Valley Bottom
Wetland) comprised of woody Rauvolfia caffra and Phoenix reclinata mosaic
forming a semi-closed riparian zone. Areas surrounding this Rauvolfia-Phoenix
zone were dominated by a mixture of C. odorata and D. cinerea thickets
interspersed with the graminoid species S. pyramidalis. Further encroachment of
L. camara was noted surrounding the wetland system. A study conducted by
Eco-Pulse Environmental Consulting services (Pty) Ltd in December 2017
identified the same vegetation structure within this HGM unit. The upper reaches
of this system have been impacted through the construction of haul roads and
close proximity mining. As such, the interface between these two land uses has
the propensity to be colonised by invasive and pioneer species. This was the
case as C. odorata and L. camara which were noted within this interface. These
species compete and replaces natural veld (and reduces productivity of these
systems) at an enormous rate and scale. Basal cover within this interface was
moderate and in patches open tracts of exposed soil was noted.
HGM 3, was classified as a Channelled Valley bottom wetland and is associated
with moist grassland and a woody riparian zone (Photograph 5). The grassland
was characterised by a moderate-high graminoid and herbaceous basal
cover. The riparian zone was deeply incised with a Sandstone embankment and
comprised of a semi-closed canopy. Agglomerations of T. capensis were noted
within this system.
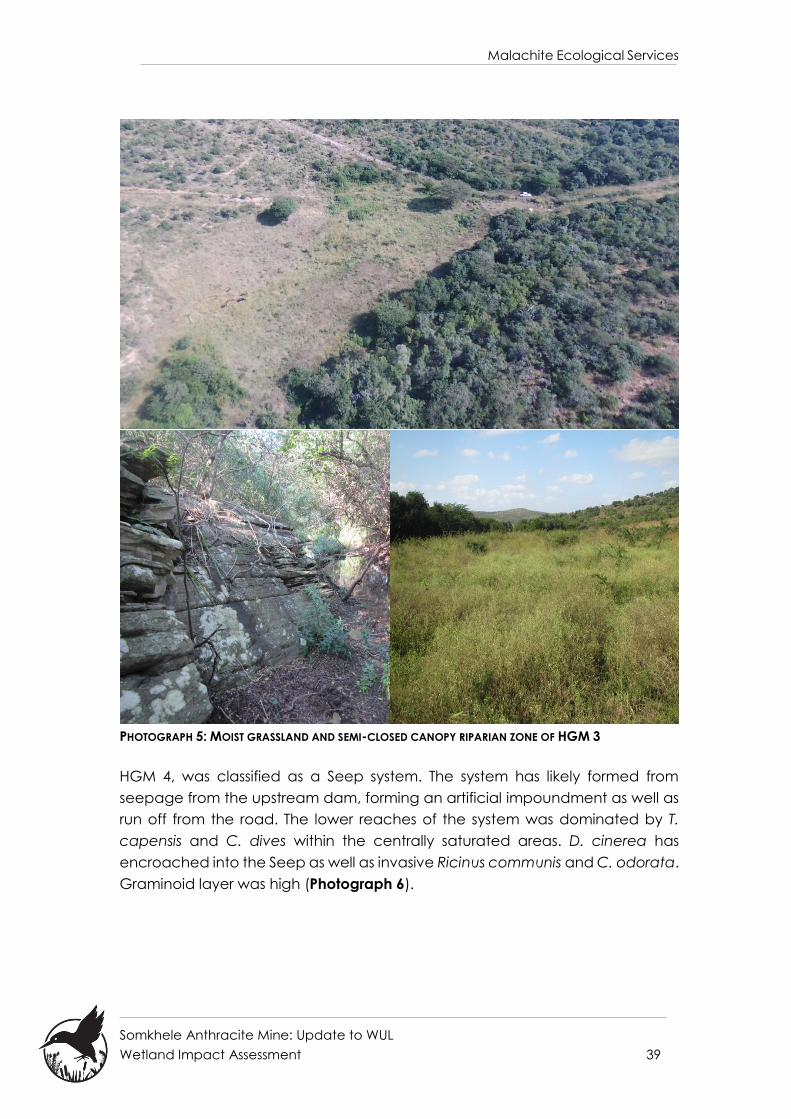
Malachite Ecological Services
Somkhele Anthracite Mine: Update to WUL
Wetland Impact Assessment 39
PHOTOGRAPH 5: MOIST GRASSLAND AND SEMI-CLOSED CANOPY RIPARIAN ZONE OF HGM 3
HGM 4, was classified as a Seep system. The system has likely formed from
seepage from the upstream dam, forming an artificial impoundment as well as
run off from the road. The lower reaches of the system was dominated by T.
capensis and C. dives within the centrally saturated areas. D. cinerea has
encroached into the Seep as well as invasive Ricinus communis and C. odorata.
Graminoid layer was high (Photograph 6).
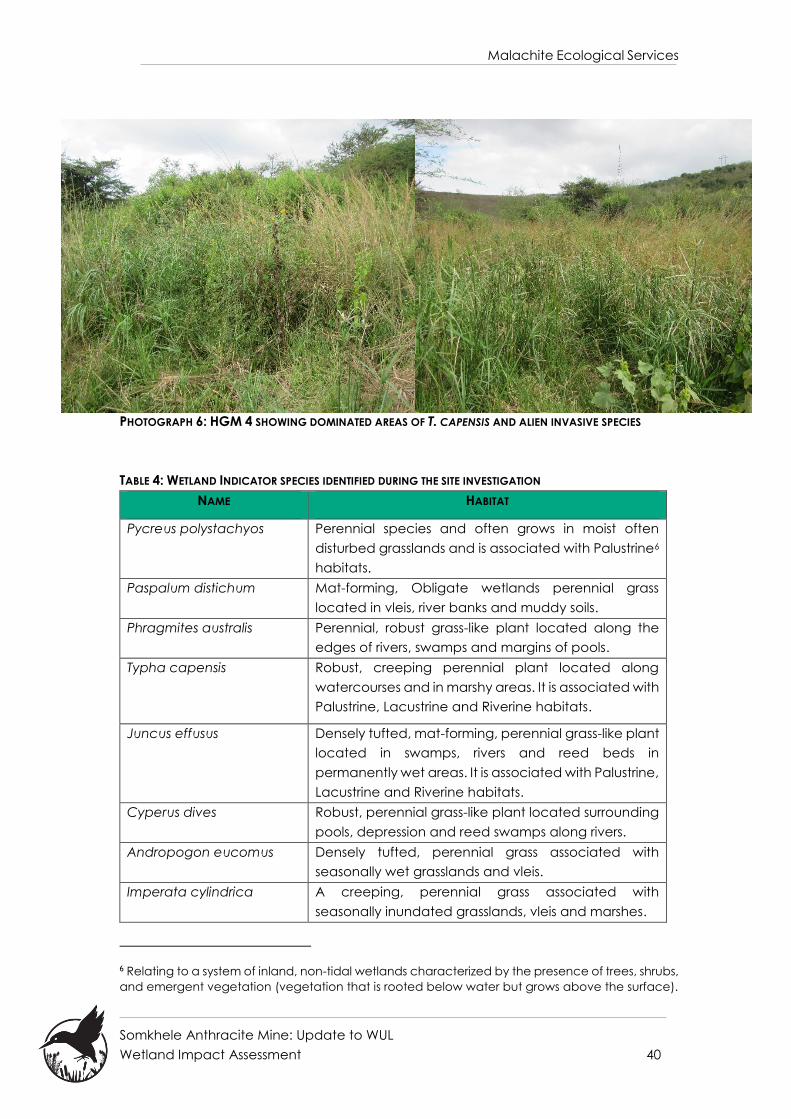
Malachite Ecological Services
Somkhele Anthracite Mine: Update to WUL
Wetland Impact Assessment 40
PHOTOGRAPH 6: HGM 4 SHOWING DOMINATED AREAS OF T. CAPENSIS AND ALIEN INVASIVE SPECIES
TABLE 4: WETLAND INDICATOR SPECIES IDENTIFIED DURING THE SITE INVESTIGATION
NAME HABITAT
Pycreus polystachyos Perennial species and often grows in moist often
disturbed grasslands and is associated with Palustrine6
habitats.
Paspalum distichum Mat-forming, Obligate wetlands perennial grass
located in vleis, river banks and muddy soils.
Phragmites australis Perennial, robust grass-like plant located along the
edges of rivers, swamps and margins of pools.
Typha capensis Robust, creeping perennial plant located along
watercourses and in marshy areas. It is associated with
Palustrine, Lacustrine and Riverine habitats.
Juncus effusus Densely tufted, mat-forming, perennial grass-like plant
located in swamps, rivers and reed beds in
permanently wet areas. It is associated with Palustrine,
Lacustrine and Riverine habitats.
Cyperus dives Robust, perennial grass-like plant located surrounding
pools, depression and reed swamps along rivers.
Andropogon eucomus Densely tufted, perennial grass associated with
seasonally wet grasslands and vleis.
Imperata cylindrica A creeping, perennial grass associated with
seasonally inundated grasslands, vleis and marshes.
6 Relating to a system of inland, non-tidal wetlands characterized by the presence of trees, shrubs,
and emergent vegetation (vegetation that is rooted below water but grows above the surface).
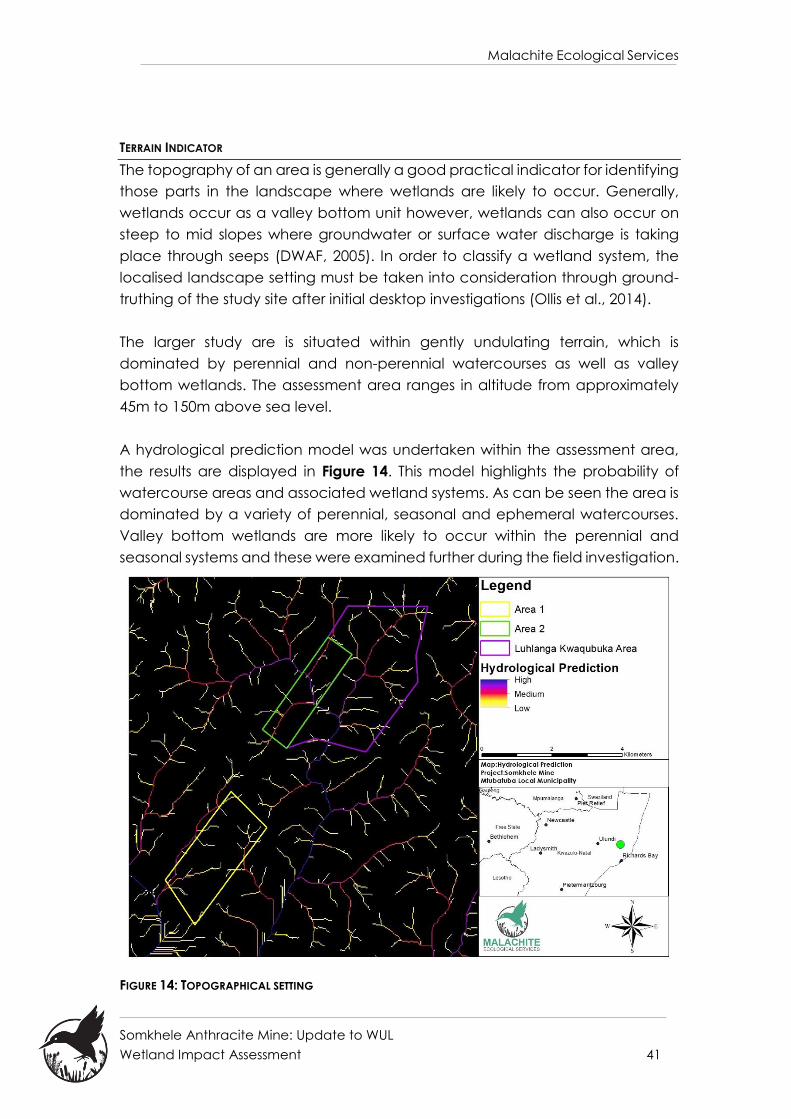
Malachite Ecological Services
Somkhele Anthracite Mine: Update to WUL
Wetland Impact Assessment 41
TERRAIN INDICATOR
The topography of an area is generally a good practical indicator for identifying
those parts in the landscape where wetlands are likely to occur. Generally,
wetlands occur as a valley bottom unit however, wetlands can also occur on
steep to mid slopes where groundwater or surface water discharge is taking
place through seeps (DWAF, 2005). In order to classify a wetland system, the
localised landscape setting must be taken into consideration through ground-
truthing of the study site after initial desktop investigations (Ollis et al., 2014).
The larger study are is situated within gently undulating terrain, which is
dominated by perennial and non-perennial watercourses as well as valley
bottom wetlands. The assessment area ranges in altitude from approximately
45m to 150m above sea level.
A hydrological prediction model was undertaken within the assessment area,
the results are displayed in Figure 14. This model highlights the probability of
watercourse areas and associated wetland systems. As can be seen the area is
dominated by a variety of perennial, seasonal and ephemeral watercourses.
Valley bottom wetlands are more likely to occur within the perennial and
seasonal systems and these were examined further during the field investigation.
FIGURE 14: TOPOGRAPHICAL SETTING
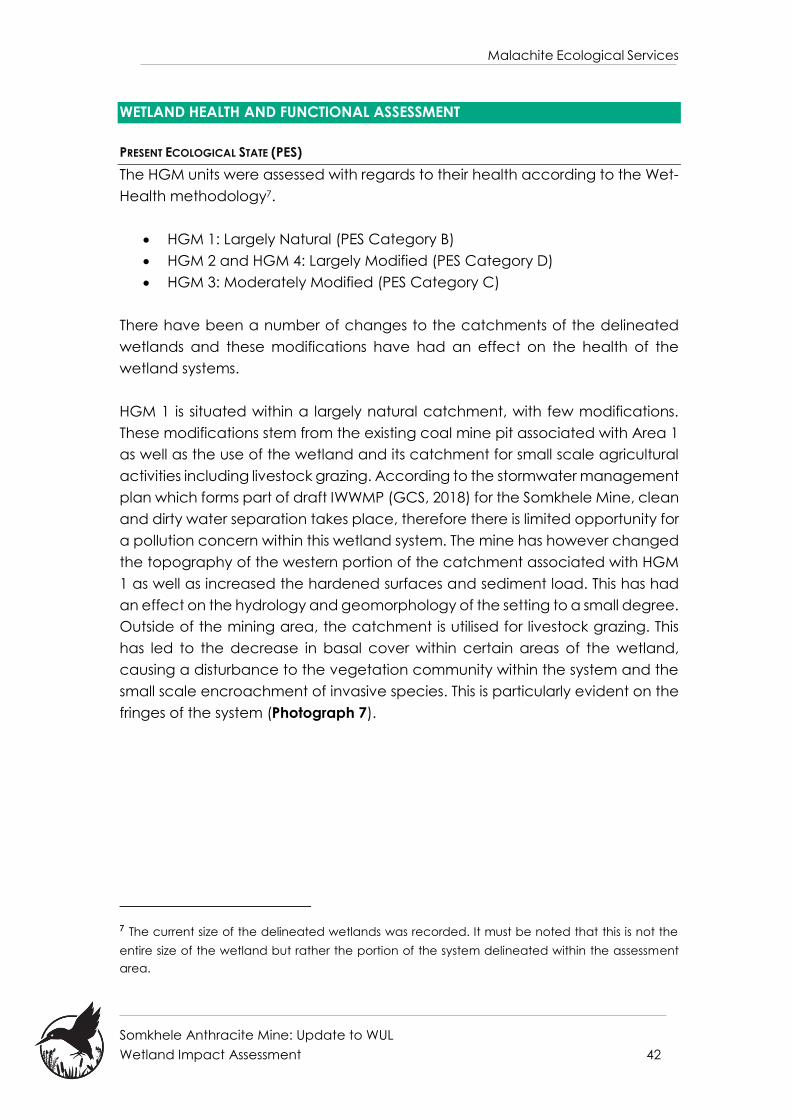
Malachite Ecological Services
Somkhele Anthracite Mine: Update to WUL
Wetland Impact Assessment 42
WETLAND HEALTH AND FUNCTIONAL ASSESSMENT
PRESENT ECOLOGICAL STATE (PES)
The HGM units were assessed with regards to their health according to the Wet-
Health methodology7.
HGM 1: Largely Natural (PES Category B)
HGM 2 and HGM 4: Largely Modified (PES Category D)
HGM 3: Moderately Modified (PES Category C)
There have been a number of changes to the catchments of the delineated
wetlands and these modifications have had an effect on the health of the
wetland systems.
HGM 1 is situated within a largely natural catchment, with few modifications.
These modifications stem from the existing coal mine pit associated with Area 1
as well as the use of the wetland and its catchment for small scale agricultural
activities including livestock grazing. According to the stormwater management
plan which forms part of draft IWWMP (GCS, 2018) for the Somkhele Mine, clean
and dirty water separation takes place, therefore there is limited opportunity for
a pollution concern within this wetland system. The mine has however changed
the topography of the western portion of the catchment associated with HGM
1 as well as increased the hardened surfaces and sediment load. This has had
an effect on the hydrology and geomorphology of the setting to a small degree.
Outside of the mining area, the catchment is utilised for livestock grazing. This
has led to the decrease in basal cover within certain areas of the wetland,
causing a disturbance to the vegetation community within the system and the
small scale encroachment of invasive species. This is particularly evident on the
fringes of the system (Photograph 7).
7 The current size of the delineated wetlands was recorded. It must be noted that this is not the
entire size of the wetland but rather the portion of the system delineated within the assessment
area.
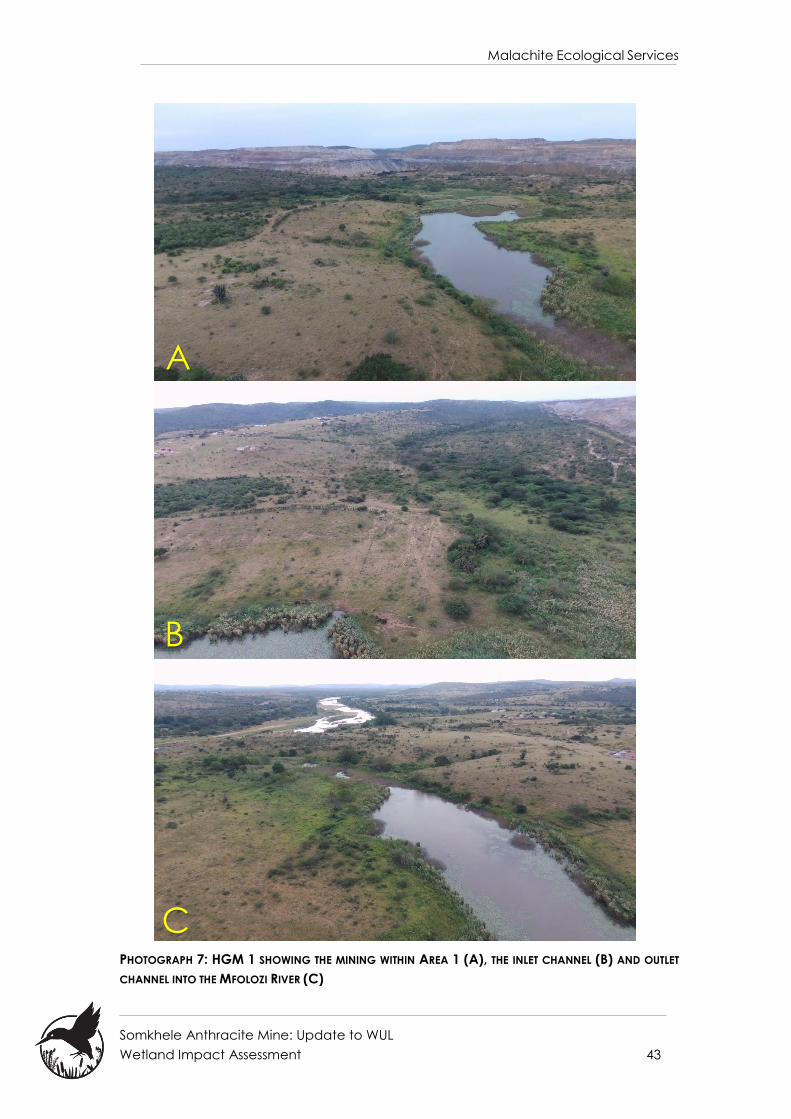
Malachite Ecological Services
Somkhele Anthracite Mine: Update to WUL
Wetland Impact Assessment 43
PHOTOGRAPH 7: HGM 1 SHOWING THE MINING WITHIN AREA 1 (A), THE INLET CHANNEL (B) AND OUTLET
CHANNEL INTO THE MFOLOZI RIVER (C)
A
B
C
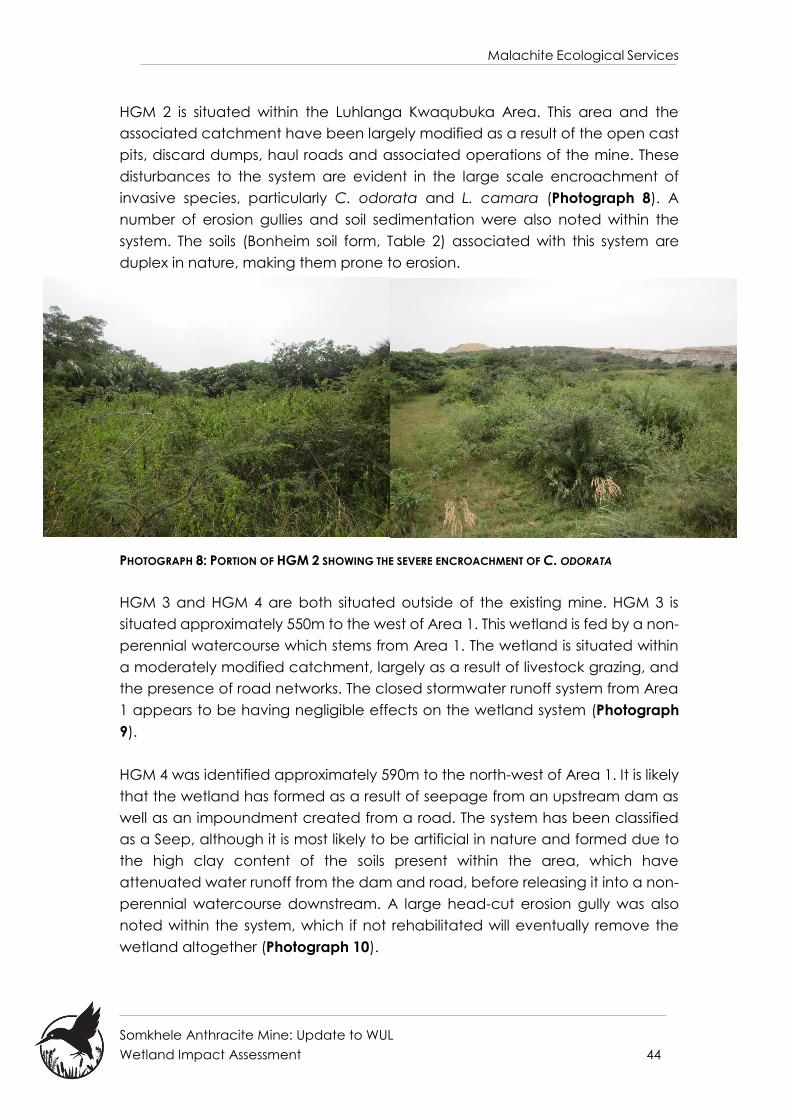
Malachite Ecological Services
Somkhele Anthracite Mine: Update to WUL
Wetland Impact Assessment 44
HGM 2 is situated within the Luhlanga Kwaqubuka Area. This area and the
associated catchment have been largely modified as a result of the open cast
pits, discard dumps, haul roads and associated operations of the mine. These
disturbances to the system are evident in the large scale encroachment of
invasive species, particularly C. odorata and L. camara (Photograph 8). A
number of erosion gullies and soil sedimentation were also noted within the
system. The soils (Bonheim soil form, Table 2) associated with this system are
duplex in nature, making them prone to erosion.
PHOTOGRAPH 8: PORTION OF HGM 2 SHOWING THE SEVERE ENCROACHMENT OF C. ODORATA
HGM 3 and HGM 4 are both situated outside of the existing mine. HGM 3 is
situated approximately 550m to the west of Area 1. This wetland is fed by a non-
perennial watercourse which stems from Area 1. The wetland is situated within
a moderately modified catchment, largely as a result of livestock grazing, and
the presence of road networks. The closed stormwater runoff system from Area
1 appears to be having negligible effects on the wetland system (Photograph
9).
HGM 4 was identified approximately 590m to the north-west of Area 1. It is likely
that the wetland has formed as a result of seepage from an upstream dam as
well as an impoundment created from a road. The system has been classified
as a Seep, although it is most likely to be artificial in nature and formed due to
the high clay content of the soils present within the area, which have
attenuated water runoff from the dam and road, before releasing it into a non-
perennial watercourse downstream. A large head-cut erosion gully was also
noted within the system, which if not rehabilitated will eventually remove the
wetland altogether (Photograph 10).
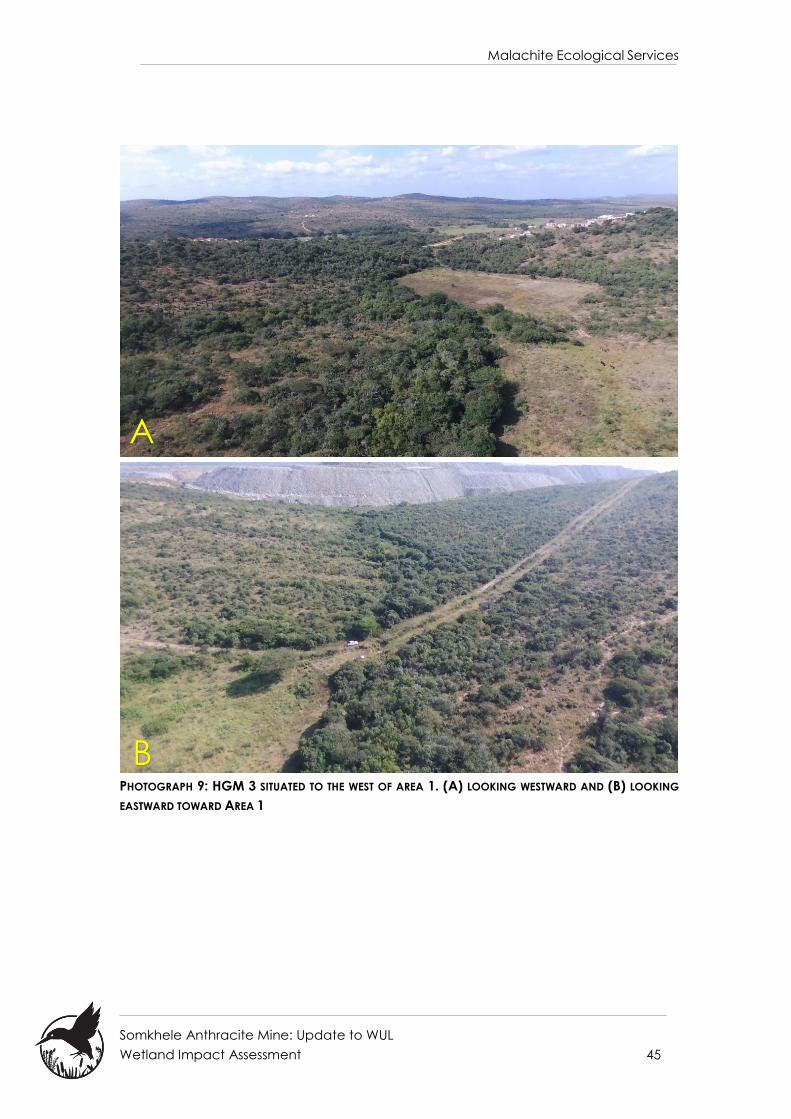
Malachite Ecological Services
Somkhele Anthracite Mine: Update to WUL
Wetland Impact Assessment 45
PHOTOGRAPH 9: HGM 3 SITUATED TO THE WEST OF AREA 1. (A) LOOKING WESTWARD AND (B) LOOKING
EASTWARD TOWARD AREA 1
A
B
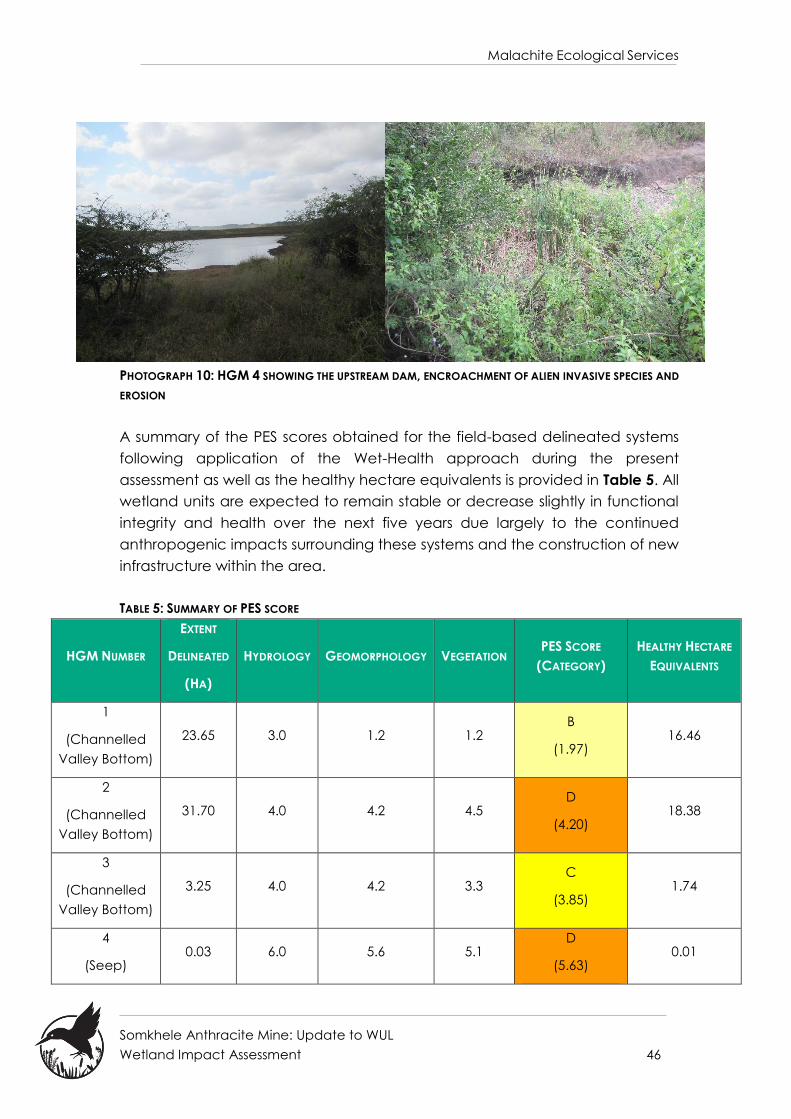
Malachite Ecological Services
Somkhele Anthracite Mine: Update to WUL
Wetland Impact Assessment 46
PHOTOGRAPH 10: HGM 4 SHOWING THE UPSTREAM DAM, ENCROACHMENT OF ALIEN INVASIVE SPECIES AND
EROSION
A summary of the PES scores obtained for the field-based delineated systems
following application of the Wet-Health approach during the present
assessment as well as the healthy hectare equivalents is provided in Table 5. All
wetland units are expected to remain stable or decrease slightly in functional
integrity and health over the next five years due largely to the continued
anthropogenic impacts surrounding these systems and the construction of new
infrastructure within the area.
TABLE 5: SUMMARY OF PES SCORE
HGM NUMBER
EXTENT
DELINEATED
(HA)
HYDROLOGY GEOMORPHOLOGY VEGETATION PES SCORE
(CATEGORY)
HEALTHY HECTARE
EQUIVALENTS
1
(Channelled
Valley Bottom)
23.65 3.0 1.2 1.2 B
(1.97) 16.46
2
(Channelled
Valley Bottom)
31.70 4.0 4.2 4.5 D
(4.20) 18.38
3
(Channelled
Valley Bottom)
3.25 4.0 4.2 3.3 C
(3.85) 1.74
4
(Seep) 0.03 6.0 5.6 5.1
D
(5.63) 0.01

Malachite Ecological Services
Somkhele Anthracite Mine: Update to WUL
Wetland Impact Assessment 47
FUNCTIONAL ASSESSMENT (ECOSYSTEM GOODS AND SERVICES)
Ecosystem goods and services were calculated for the HGM units. Scores
received ranged from Low to High for all natural resources (Figure 15). HGM 1
received the highest scores of all HGM units, indicating that it is a highly
functional system. Ecosystem services associated with flood attenuation;
streamflow regulation; sediment trapping; filtration (i.e. phosphate, nitrate and
toxicant trapping); erosion control; carbon storage; the maintenance of
biodiversity within the landscape; and the provision of natural resources in the
form of the use of the wetland by the local community for agricultural and the
harvesting of thatching grass scored moderate to high scores.
HGM 2 generally received moderate scores for flood attenuation; streamflow
regulation; sediment trapping; filtration; and erosion control.
HGM3 also scored as a moderately functioning system, with ecosystem services
associated with flood attenuation; streamflow regulation; sediment trapping;
filtration; erosion control. HGM 4, due to it degraded state and small size
received generally lower scores compared to the other three HGM units. Scores
for Streamflow regulation; filtration and sediment trapping were the highest.
FIGURE 15: GENERAL WET-ECOSERVICES RESULTS FOR THE WETLAND SYSTEMS
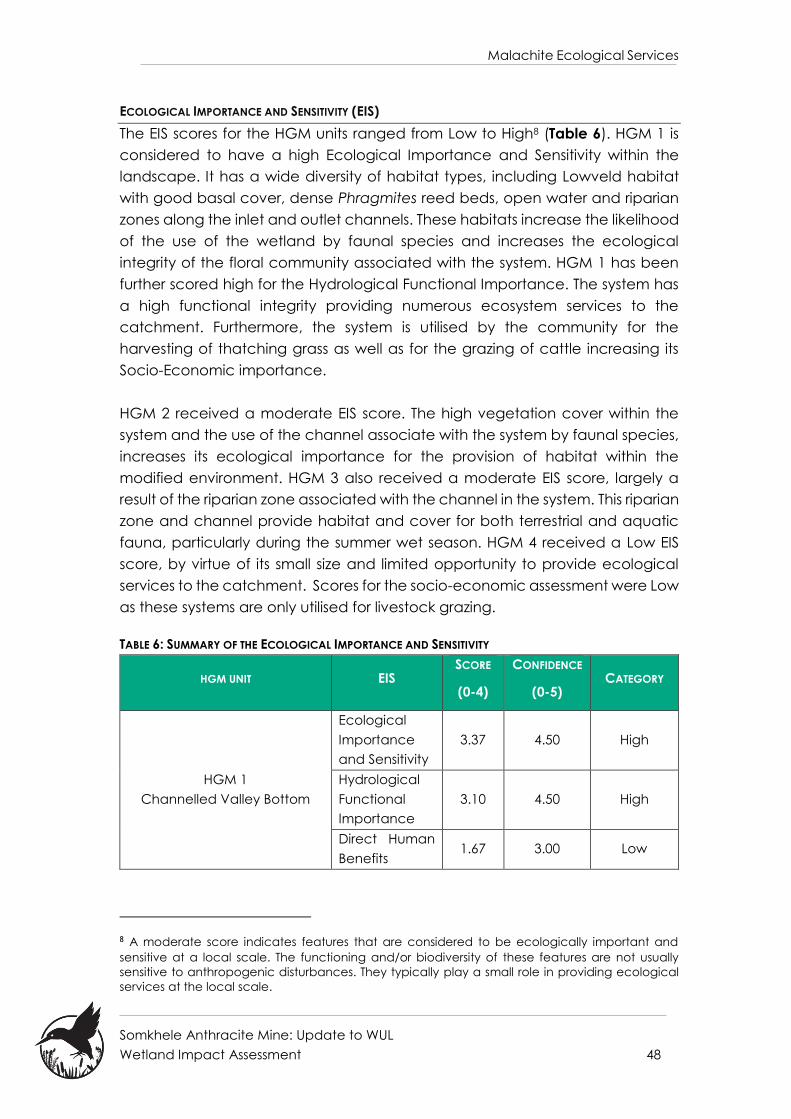
Malachite Ecological Services
Somkhele Anthracite Mine: Update to WUL
Wetland Impact Assessment 48
ECOLOGICAL IMPORTANCE AND SENSITIVITY (EIS)
The EIS scores for the HGM units ranged from Low to High8 (Table 6). HGM 1 is
considered to have a high Ecological Importance and Sensitivity within the
landscape. It has a wide diversity of habitat types, including Lowveld habitat
with good basal cover, dense Phragmites reed beds, open water and riparian
zones along the inlet and outlet channels. These habitats increase the likelihood
of the use of the wetland by faunal species and increases the ecological
integrity of the floral community associated with the system. HGM 1 has been
further scored high for the Hydrological Functional Importance. The system has
a high functional integrity providing numerous ecosystem services to the
catchment. Furthermore, the system is utilised by the community for the
harvesting of thatching grass as well as for the grazing of cattle increasing its
Socio-Economic importance.
HGM 2 received a moderate EIS score. The high vegetation cover within the
system and the use of the channel associate with the system by faunal species,
increases its ecological importance for the provision of habitat within the
modified environment. HGM 3 also received a moderate EIS score, largely a
result of the riparian zone associated with the channel in the system. This riparian
zone and channel provide habitat and cover for both terrestrial and aquatic
fauna, particularly during the summer wet season. HGM 4 received a Low EIS
score, by virtue of its small size and limited opportunity to provide ecological
services to the catchment. Scores for the socio-economic assessment were Low
as these systems are only utilised for livestock grazing.
TABLE 6: SUMMARY OF THE ECOLOGICAL IMPORTANCE AND SENSITIVITY
HGM UNIT EIS SCORE
(0-4)
CONFIDENCE
(0-5) CATEGORY
HGM 1
Channelled Valley Bottom
Ecological
Importance
and Sensitivity
3.37 4.50 High
Hydrological
Functional
Importance
3.10 4.50 High
Direct Human
Benefits 1.67 3.00 Low
8 A moderate score indicates features that are considered to be ecologically important and
sensitive at a local scale. The functioning and/or biodiversity of these features are not usually
sensitive to anthropogenic disturbances. They typically play a small role in providing ecological
services at the local scale.
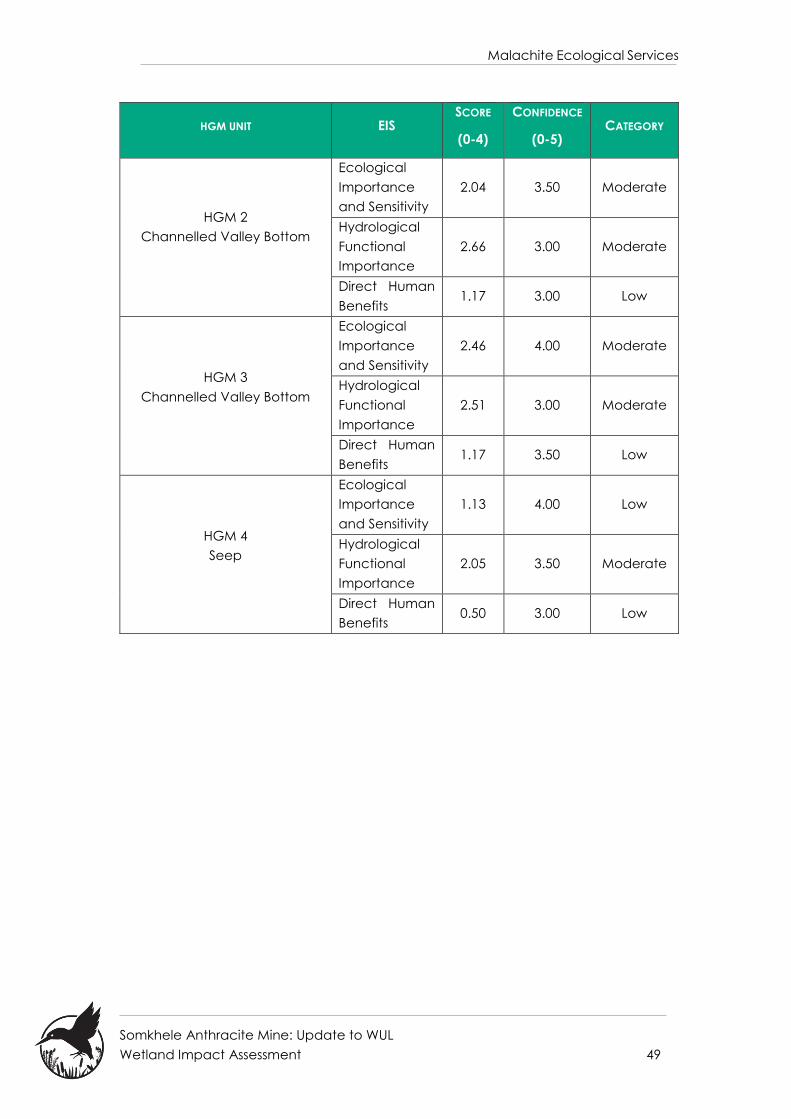
Malachite Ecological Services
Somkhele Anthracite Mine: Update to WUL
Wetland Impact Assessment 49
HGM UNIT EIS SCORE
(0-4)
CONFIDENCE
(0-5) CATEGORY
HGM 2
Channelled Valley Bottom
Ecological
Importance
and Sensitivity
2.04 3.50 Moderate
Hydrological
Functional
Importance
2.66 3.00 Moderate
Direct Human
Benefits 1.17 3.00 Low
HGM 3
Channelled Valley Bottom
Ecological
Importance
and Sensitivity
2.46 4.00 Moderate
Hydrological
Functional
Importance
2.51 3.00 Moderate
Direct Human
Benefits 1.17 3.50 Low
HGM 4
Seep
Ecological
Importance
and Sensitivity
1.13 4.00 Low
Hydrological
Functional
Importance
2.05 3.50 Moderate
Direct Human
Benefits 0.50 3.00 Low
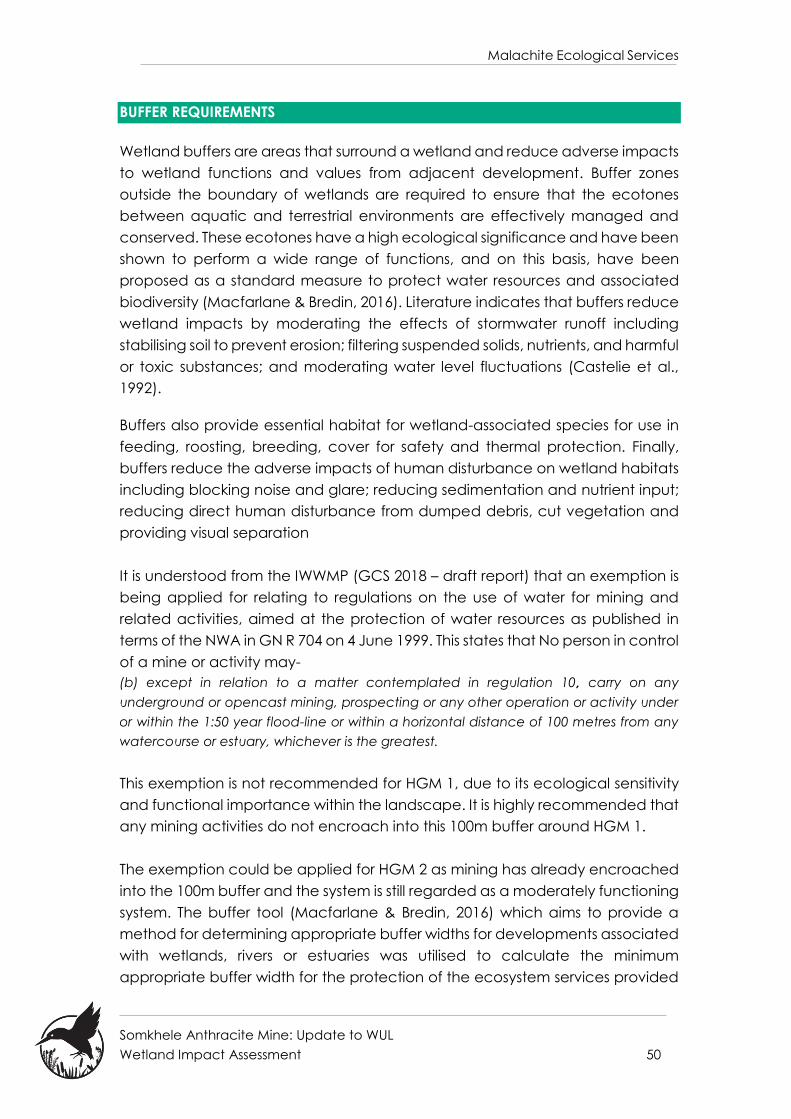
Malachite Ecological Services
Somkhele Anthracite Mine: Update to WUL
Wetland Impact Assessment 50
BUFFER REQUIREMENTS
Wetland buffers are areas that surround a wetland and reduce adverse impacts
to wetland functions and values from adjacent development. Buffer zones
outside the boundary of wetlands are required to ensure that the ecotones
between aquatic and terrestrial environments are effectively managed and
conserved. These ecotones have a high ecological significance and have been
shown to perform a wide range of functions, and on this basis, have been
proposed as a standard measure to protect water resources and associated
biodiversity (Macfarlane & Bredin, 2016). Literature indicates that buffers reduce
wetland impacts by moderating the effects of stormwater runoff including
stabilising soil to prevent erosion; filtering suspended solids, nutrients, and harmful
or toxic substances; and moderating water level fluctuations (Castelie et al.,
1992).
Buffers also provide essential habitat for wetland-associated species for use in
feeding, roosting, breeding, cover for safety and thermal protection. Finally,
buffers reduce the adverse impacts of human disturbance on wetland habitats
including blocking noise and glare; reducing sedimentation and nutrient input;
reducing direct human disturbance from dumped debris, cut vegetation and
providing visual separation
It is understood from the IWWMP (GCS 2018 – draft report) that an exemption is
being applied for relating to regulations on the use of water for mining and
related activities, aimed at the protection of water resources as published in
terms of the NWA in GN R 704 on 4 June 1999. This states that No person in control
of a mine or activity may-
(b) except in relation to a matter contemplated in regulation 10, carry on any
underground or opencast mining, prospecting or any other operation or activity under
or within the 1:50 year flood-line or within a horizontal distance of 100 metres from any
watercourse or estuary, whichever is the greatest.
This exemption is not recommended for HGM 1, due to its ecological sensitivity
and functional importance within the landscape. It is highly recommended that
any mining activities do not encroach into this 100m buffer around HGM 1.
The exemption could be applied for HGM 2 as mining has already encroached
into the 100m buffer and the system is still regarded as a moderately functioning
system. The buffer tool (Macfarlane & Bredin, 2016) which aims to provide a
method for determining appropriate buffer widths for developments associated
with wetlands, rivers or estuaries was utilised to calculate the minimum
appropriate buffer width for the protection of the ecosystem services provided
Malachite Ecological Services
Somkhele Anthracite Mine: Update to WUL
Wetland Impact Assessment 51
by HGM 2 should this exemption be applied. This buffer has been calculated to
be 46m. The buffer was calculated based on the high risk of the mining
operations, the clay dominated soils with low infiltration rates, the topography
of the area and the vegetation characteristics. If the 100m buffer for this system
is relaxed it is recommended that no mining (including infrastructure, stockpiles
and mining personal) should be allowed within the 46m buffer. This buffer must
also be rehabilitated with regards to the clearing of alien invasive species and
the removal of all rubble and stockpiles associated with the mining activities.
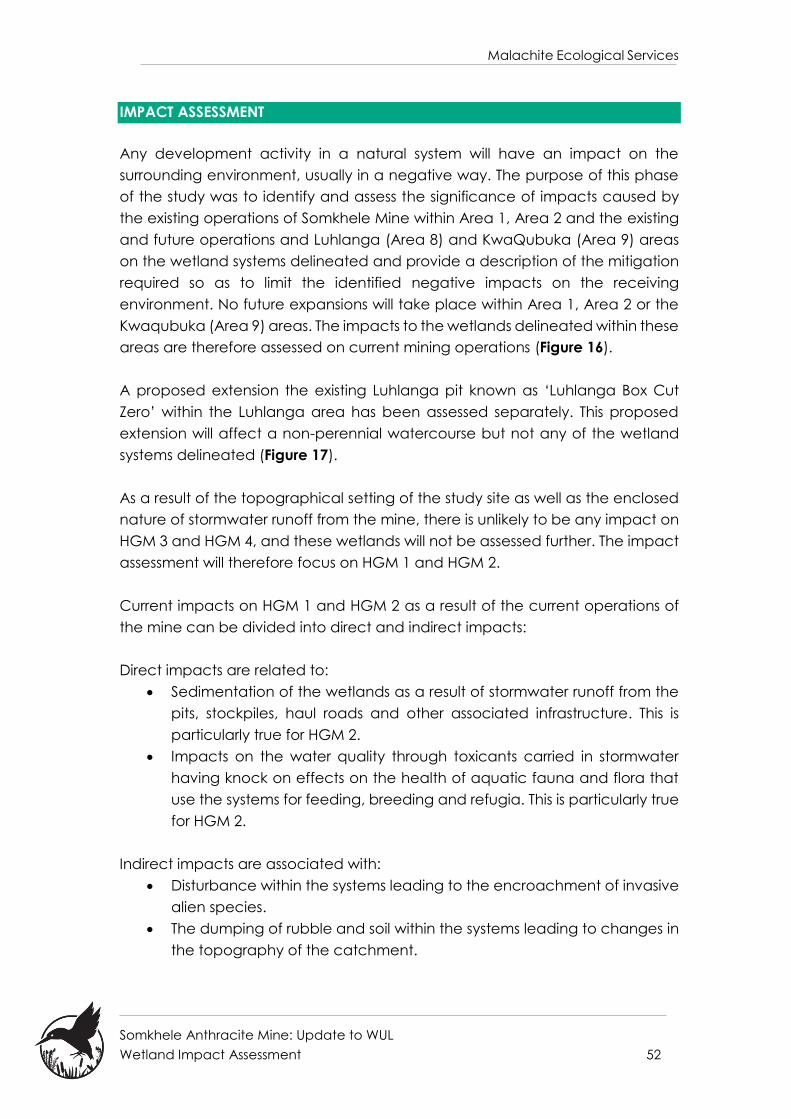
Malachite Ecological Services
Somkhele Anthracite Mine: Update to WUL
Wetland Impact Assessment 52
IMPACT ASSESSMENT
Any development activity in a natural system will have an impact on the
surrounding environment, usually in a negative way. The purpose of this phase
of the study was to identify and assess the significance of impacts caused by
the existing operations of Somkhele Mine within Area 1, Area 2 and the existing
and future operations and Luhlanga (Area 8) and KwaQubuka (Area 9) areas
on the wetland systems delineated and provide a description of the mitigation
required so as to limit the identified negative impacts on the receiving
environment. No future expansions will take place within Area 1, Area 2 or the
Kwaqubuka (Area 9) areas. The impacts to the wetlands delineated within these
areas are therefore assessed on current mining operations (Figure 16).
A proposed extension the existing Luhlanga pit known as ‘Luhlanga Box Cut
Zero’ within the Luhlanga area has been assessed separately. This proposed
extension will affect a non-perennial watercourse but not any of the wetland
systems delineated (Figure 17).
As a result of the topographical setting of the study site as well as the enclosed
nature of stormwater runoff from the mine, there is unlikely to be any impact on
HGM 3 and HGM 4, and these wetlands will not be assessed further. The impact
assessment will therefore focus on HGM 1 and HGM 2.
Current impacts on HGM 1 and HGM 2 as a result of the current operations of
the mine can be divided into direct and indirect impacts:
Direct impacts are related to:
Sedimentation of the wetlands as a result of stormwater runoff from the
pits, stockpiles, haul roads and other associated infrastructure. This is
particularly true for HGM 2.
Impacts on the water quality through toxicants carried in stormwater
having knock on effects on the health of aquatic fauna and flora that
use the systems for feeding, breeding and refugia. This is particularly true
for HGM 2.
Indirect impacts are associated with:
Disturbance within the systems leading to the encroachment of invasive
alien species.
The dumping of rubble and soil within the systems leading to changes in
the topography of the catchment.

Malachite Ecological Services
Somkhele Anthracite Mine: Update to WUL
Wetland Impact Assessment 53
Proposed future impacts associated with the proposed extension of Luhlanga
Pit, otherwise known as ‘Luhlanga Box Cut Zero’ include:
Direct impacts are related to:
the diversion of the non-perennial watercourse away from the proposed
extension the existing Luhlanga pit known as ‘Luhlanga Box Cut Zero’
area and into another watercourse located to the north.
Removal and stockpiling of topsoil and soft materials resulting in
sedimentation of the watercourse.
Relocation of identified plants within the riparian zone.
Indirect impacts are associated with:
Disturbance within the systems leading to the encroachment of invasive
alien species.
The dumping of rubble and soil within the systems leading to changes
in the topography of the catchment.
Impacts associated with the decommissioning and closure phase for all
activities include:
Decreased downstream water quality during the decommissioning
phase.
Removal of infrastructure during the decommissioning phase leading to
the compaction of soils as well as further disturbance allowing for the
encroachment of alien invasive species.
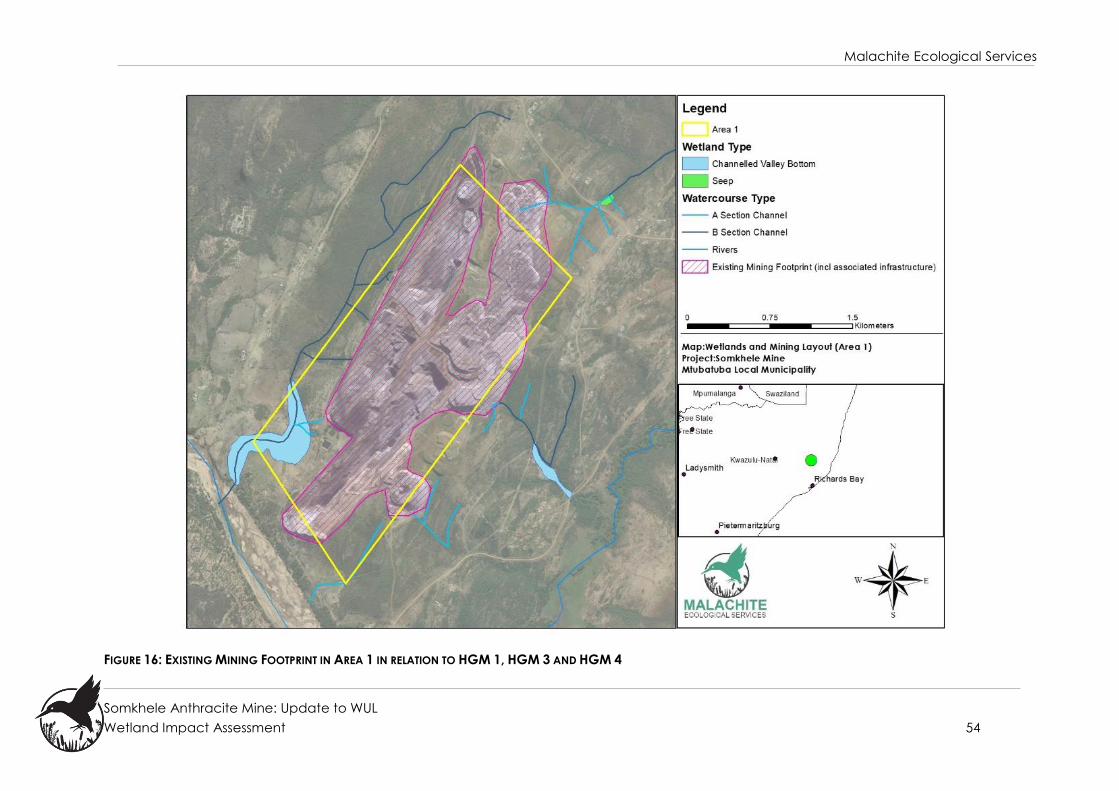
Malachite Ecological Services
Somkhele Anthracite Mine: Update to WUL
Wetland Impact Assessment 54
FIGURE 16: EXISTING MINING FOOTPRINT IN AREA 1 IN RELATION TO HGM 1, HGM 3 AND HGM 4
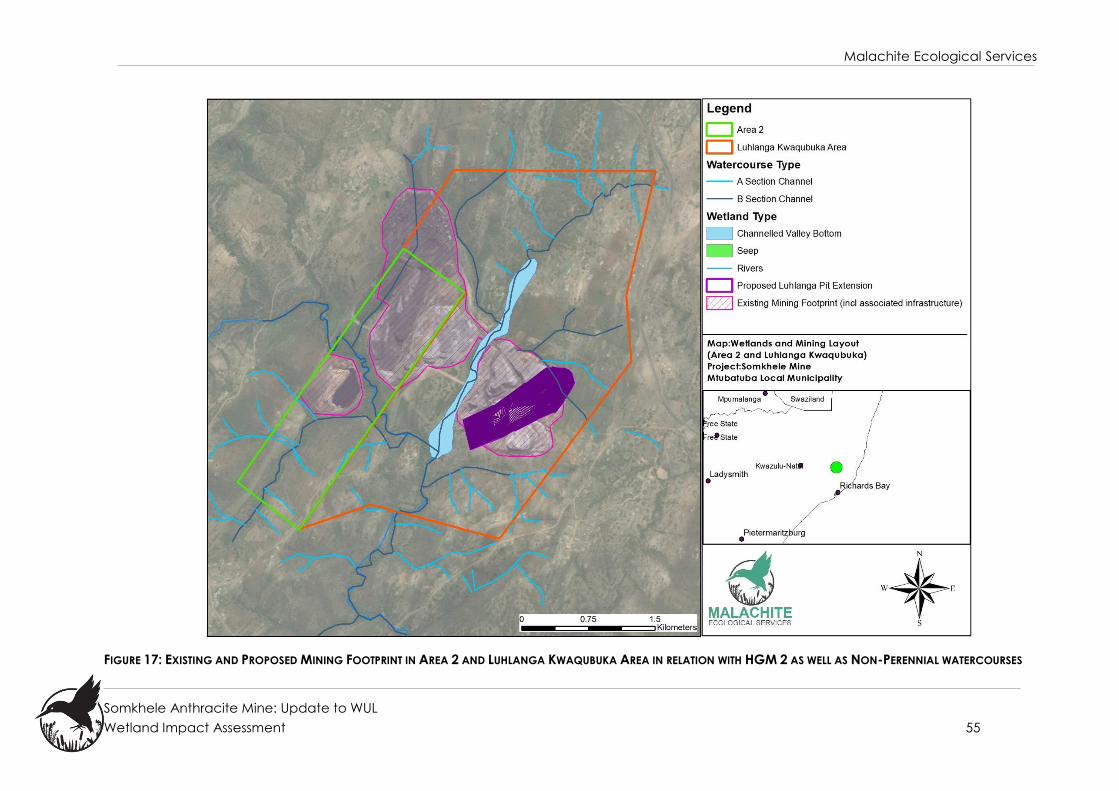
Malachite Ecological Services
Somkhele Anthracite Mine: Update to WUL
Wetland Impact Assessment 55
FIGURE 17: EXISTING AND PROPOSED MINING FOOTPRINT IN AREA 2 AND LUHLANGA KWAQUBUKA AREA IN RELATION WITH HGM 2 AS WELL AS NON-PERENNIAL WATERCOURSES
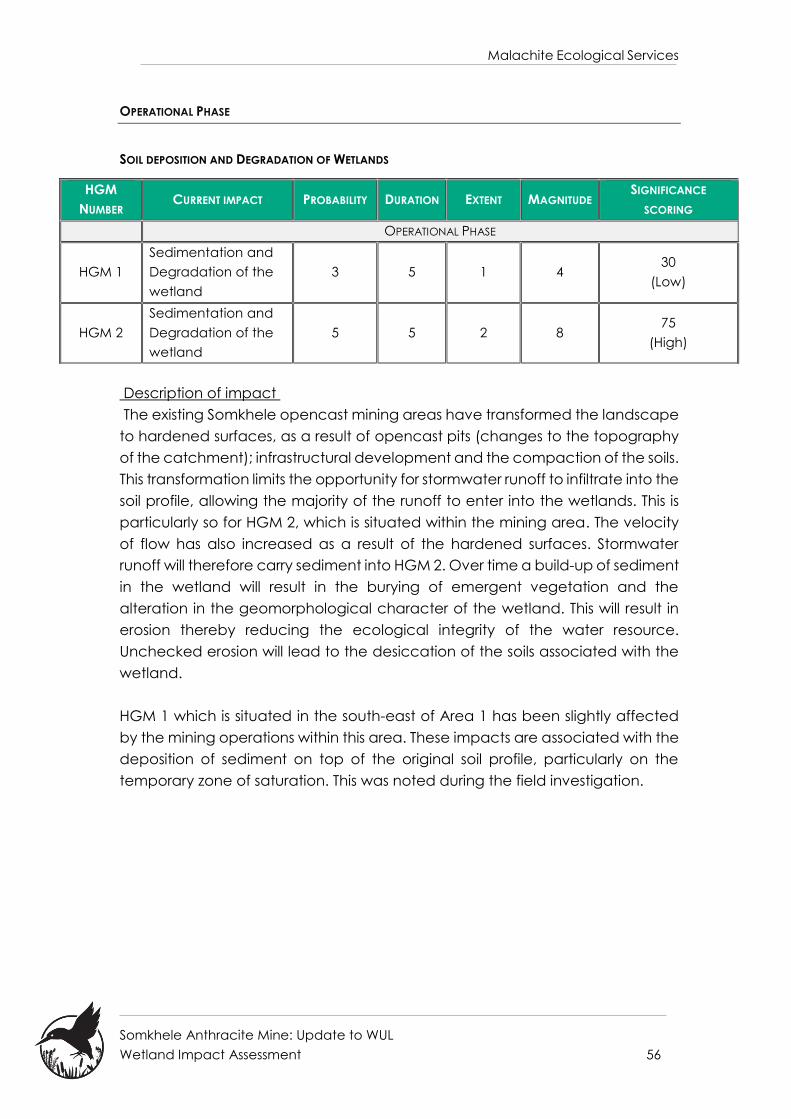
Malachite Ecological Services
Somkhele Anthracite Mine: Update to WUL
Wetland Impact Assessment 56
OPERATIONAL PHASE
SOIL DEPOSITION AND DEGRADATION OF WETLANDS
Description of impact
The existing Somkhele opencast mining areas have transformed the landscape
to hardened surfaces, as a result of opencast pits (changes to the topography
of the catchment); infrastructural development and the compaction of the soils.
This transformation limits the opportunity for stormwater runoff to infiltrate into the
soil profile, allowing the majority of the runoff to enter into the wetlands. This is
particularly so for HGM 2, which is situated within the mining area. The velocity
of flow has also increased as a result of the hardened surfaces. Stormwater
runoff will therefore carry sediment into HGM 2. Over time a build-up of sediment
in the wetland will result in the burying of emergent vegetation and the
alteration in the geomorphological character of the wetland. This will result in
erosion thereby reducing the ecological integrity of the water resource.
Unchecked erosion will lead to the desiccation of the soils associated with the
wetland.
HGM 1 which is situated in the south-east of Area 1 has been slightly affected
by the mining operations within this area. These impacts are associated with the
deposition of sediment on top of the original soil profile, particularly on the
temporary zone of saturation. This was noted during the field investigation.
HGM
NUMBER CURRENT IMPACT PROBABILITY DURATION EXTENT MAGNITUDE
SIGNIFICANCE
SCORING
OPERATIONAL PHASE
HGM 1
Sedimentation and
Degradation of the
wetland
3 5 1 4 30
(Low)
HGM 2
Sedimentation and
Degradation of the
wetland
5 5 2 8 75
(High)
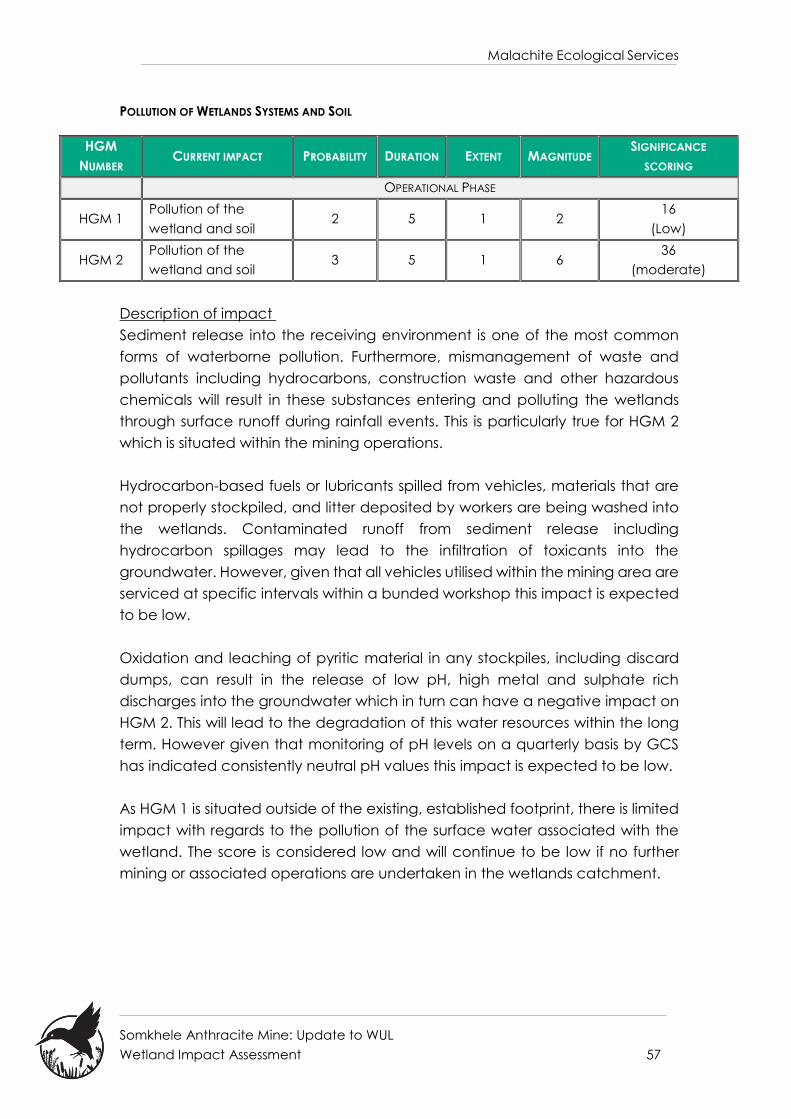
Malachite Ecological Services
Somkhele Anthracite Mine: Update to WUL
Wetland Impact Assessment 57
POLLUTION OF WETLANDS SYSTEMS AND SOIL
Description of impact
Sediment release into the receiving environment is one of the most common
forms of waterborne pollution. Furthermore, mismanagement of waste and
pollutants including hydrocarbons, construction waste and other hazardous
chemicals will result in these substances entering and polluting the wetlands
through surface runoff during rainfall events. This is particularly true for HGM 2
which is situated within the mining operations.
Hydrocarbon-based fuels or lubricants spilled from vehicles, materials that are
not properly stockpiled, and litter deposited by workers are being washed into
the wetlands. Contaminated runoff from sediment release including
hydrocarbon spillages may lead to the infiltration of toxicants into the
groundwater. However, given that all vehicles utilised within the mining area are
serviced at specific intervals within a bunded workshop this impact is expected
to be low.
Oxidation and leaching of pyritic material in any stockpiles, including discard
dumps, can result in the release of low pH, high metal and sulphate rich
discharges into the groundwater which in turn can have a negative impact on
HGM 2. This will lead to the degradation of this water resources within the long
term. However given that monitoring of pH levels on a quarterly basis by GCS
has indicated consistently neutral pH values this impact is expected to be low.
As HGM 1 is situated outside of the existing, established footprint, there is limited
impact with regards to the pollution of the surface water associated with the
wetland. The score is considered low and will continue to be low if no further
mining or associated operations are undertaken in the wetlands catchment.
HGM
NUMBER CURRENT IMPACT PROBABILITY DURATION EXTENT MAGNITUDE
SIGNIFICANCE
SCORING
OPERATIONAL PHASE
HGM 1 Pollution of the
wetland and soil 2 5 1 2
16
(Low)
HGM 2 Pollution of the
wetland and soil 3 5 1 6
36
(moderate)

Malachite Ecological Services
Somkhele Anthracite Mine: Update to WUL
Wetland Impact Assessment 58
INVASIVE ALIEN SPECIES ENCROACHMENT
Description of impact
A number of invasive alien species were noted, particularly along the edge of
the wetlands as well as within large portions of HGM 2. These species tend to
invade areas that have been disturbed (e.g. on stockpiles and excavated or
eroded areas). Alien species generally out-compete indigenous species for
water, light, space and nutrients as they are adaptable to changing conditions
and are able to easily invade a wide range of ecological niches (Bromilow,
2010). Alien invader plant species pose an ecological threat as they alter
habitat structure, lower biodiversity (both number and “quality” of species),
change nutrient cycling and productivity, and modify food webs (Zedler, 2004).
DECOMMISSIONING AND CLOSURE PHASE
DECREASED DOWNSTREAM WATER QUALITY
Description of impact
Contaminated groundwater base-flow can occur in the wetlands and
watercourses associated with the study area. After mine closure, however all of
the pits are expected to be will filled, capped and grassed as part of the rehabilitation plan.
If this is not conducted the old opencast pits will start filling with water and
eventually start decanting water. Decanting water can have a low pH and be
HGM
NUMBER CURRENT IMPACT PROBABILITY DURATION EXTENT MAGNITUDE
SIGNIFICANCE
SCORING
OPERATIONAL PHASE
HGM 1
Encroachment of
invasive alien
species
2 5 1 4 20
(Low)
HGM 2
Encroachment of
invasive alien
species
5 5 2 8 75
(high)
HGM
NUMBER CURRENT IMPACT PROBABILITY DURATION EXTENT MAGNITUDE
SIGNIFICANCE
SCORING
DECOMMISSIONING PHASE
HGM 1
Decreased
downstream water
quality
2 3 1 4 16
(Low)
HGM 2
Decreased
downstream water
quality
4 3 2 8 52
(Moderate)

Malachite Ecological Services
Somkhele Anthracite Mine: Update to WUL
Wetland Impact Assessment 59
metal and sulphate rich. It is likely to discharge into the surface waters and
wetlands adjacent to the mining area. This is especially true for HGM 2 as a result
of its location within the Luhlanga Kwaqubuka Area. As all pits will be capped
during the decommissioning phase, surface runoff containing sediment from the
rehabilitated areas couldlead to sedimentation of downstream water
resources. Furthermore underground seepage from the capped pits could enter
unconfined aquifers, especially in the long term (more than 50 years).
As HGM 1 is not situated within the mining footprint the impact of a decrease in
water quality will be low, particularly if the closed dirty water system is
maintained during this phase and no water from any of the open cast pits reach
the wetland system.
REMOVAL OF INFRASTRUCTURE DURING THE DECOMMISSIONING PHASE
Description of impact
Upon closure of the mine, all mine infrastructures will be demolished and
removed, while the mined-out areas will be closed, landscaped and
rehabilitated. Rehabilitation of disturbed areas can, in fact, create additional
disturbance through the compaction of soils leading to erosion. If not properly
controlled, these activities will lead to destruction of wetland vegetation and
compaction of wetland soils in the wetlands adjacent to the mining
infrastructure footprint.
Any mining infrastructure that remains on site will pose a long-term risk to water
quality, particularly in terms of persistent organic pollutants such as PVC, rubber,
oil spills and tyres. Rusting metallic equipment may also cause pollution.
As HGM 1 is not situated within the mining footprint the impact of the removal
of infrastructure including soil compaction, siltation and erosion will be low,
particularly if the closed dirty water system is maintained during this phase and
no water from any of the open cast pits reach the wetland system.
HGM
NUMBER CURRENT IMPACT PROBABILITY DURATION EXTENT MAGNITUDE
SIGNIFICANCE
SCORING
DECOMMISSIONING PHASE
HGM 1 Removal of
infrastructure 2 3 1 4
16
(Low)
HGM 2
Decreased
downstream water
quality
4 3 2 6 44
(Moderate)
Malachite Ecological Services
Somkhele Anthracite Mine: Update to WUL
Wetland Impact Assessment 60
WETLAND ACTION PLAN
In order to address these identified impacts and to lower their significance on
the health and functional integrity of the wetlands, a number of recommended
mitigation and rehabilitation/management measures are proposed. These
measures are aimed to improve the health and functional integrity of the
wetlands to avoid a continual decline in the current condition of these system.
This can be achieved through the following objectives:
Removal of deposited soil and rubble from the edge of the wetlands
(particularly HGM 2) and the subsequent revegetation of the disturbed
area with appropriate indigenous wetland and terrestrial species.
Removal of invasive alien and problem plant species from the edge of
both wetland systems and within their boundaries. This must be
conducted in a phasic approach to ensure that existing and
revegetated areas become established.
Conduct a yearly monitoring of the health (PES Score), Functional
Integrity and Ecological Importance and Sensitivity (EIS) of both HGM
units to ensure that the current state of the wetlands does not decline.
REMOVAL OF POLLUTION AND RUBBLE
During the site investigation, mounds of soil and rubble were noted along the
boundary of HGM 2. During high intensity rainfall events, this waste material has
and will continue to enter into the water resource, resulting in increased levels
of sedimentation. It is imperative that these areas are cleared of waste and re-
vegetated. This is especially so to re-instate the 46m buffer that is recommended
around HGM 2 to protect the ecosystem services provided by this wetland.
Any waste noted within the wetland system and associated buffer zone must
be removed.
Proper management and disposal of waste (building materials, rubble) must
be enforced.
Ensure that all employees are trained on the existing procedure regarding
any spillages of fuels, oils and other potentially harmful chemicals. This must
be well executed and contaminants properly drained and disposed of using
proper solid/hazardous waste facilities.
Should heavy machinery be required for the removal of soil mounds, the
compacted surfaces must be revegetated. Prior to the establishment and
preparation of the ground for planting of indigenous wetland vegetation,
these rehabilitated areas must be “ripped” to uncompact and loosen the

Malachite Ecological Services
Somkhele Anthracite Mine: Update to WUL
Wetland Impact Assessment 61
upper soil profile. These areas must then be graded to create an even
surface.
The deposited soil within the rehabilitation area must be loosened up and
compost must be added to the soil during the final preparations for
revegetation. The use of fertilisers and other chemical soil enhancers must
be avoided.
INVASIVE ALIEN SPECIES MANAGEMENT PLAN
Many Invasive Alien Plants (IAP) are products of unwise and unintentional plant
introductions and are widely considered as a major threat to biodiversity,
human health and livelihoods and economic development. IAPs cost South
Africans tens of billions of rand annually in lost agricultural productivity and
resources spent on management. IAPs increase fire hazards and accelerate soil
erosion; they are usually “water-hungry” plants/shrubs/trees resulting in a much
higher use of precious ground water and pose a major threat to our own
indigenous species diversity. Woody alien species are also predicted to
decrease groundwater recharge, decrease total annual flow and baseflow
and have a variable effect on stormflow (Rebelo et al., 2015).
The introduction and spread of invasive alien species is closely correlated with
human activities. Virtually all ecosystems and habitats in South Africa have been
modified or transformed by human activities. Three key, inter-related threats are
habitat removal, invasive alien species and climate change. Land degradation,
clearing of indigenous vegetation, invasion of land by alien species and climate
change all interlink to create synergies that exacerbate and compound the
impact on biodiversity, leading in turn to further degradation and loss.
ALIEN CONTROL PLAN
The removal of alien invasive vegetation must occur prior to the re-vegetation
of disturbed areas. The primary benefits of alien invasive control plans include:
Limit the spread of alien plant species into non-affected areas;
Improvement of water quality and quantity;
Legal compliance;
Improvement of biodiversity in and around the wetlands; and
Reduction in soil erosion. Certain species of alien invader plants reduce soil
cover, leading to increased erosion.
IMPORTANT FACTORS INFLUENCING THE EFFECTIVENESS OF A CONTROL PROGRAMME
Timeous implementation of control operations is important as alien plants are
more susceptible to herbicides when they are young and lower herbicide
rates can be used;
Malachite Ecological Services
Somkhele Anthracite Mine: Update to WUL
Wetland Impact Assessment 62
Appropriate herbicides must be chosen. Care must be taken when applying
herbicides and label prescriptions must be strictly adhered to;
Operations must be directed towards eradicating alien vegetation; and
A reputable company or a suitably qualified person must be hired to
undertake herbicide application and train staff on-site.
REQUIREMENTS FOR AN EFFECTIVE ALIEN VEGETATION CONTROL PROGRAMME
Identify the problem: extent, location and species of problem plants;
Identify any sensitive ecosystems, rare or endangered plants etc. which may
be affected by a control programme. Identify the original ecosystem
applicable to the area. The method of control will be influenced by the type
of vegetation to which the area must revert;
Identify an appropriate control method: mechanical or chemical, type of
herbicide, application etc. (Mechanical methods are preferred, compared
to chemical methods). The preferred method will be influenced by a variety
of factors including applications, sensitivity of the site, species to be
controlled and age of the plant. Further to this, the financial implications of
the selected method of treatment must be considered to ensure the
effective clearing of the site.
Consideration must be given to both the topography of the site and the
connectivity of water resources. Due to the ability of water resources to
transport pollutants into downstream habitats, only the use of herbicides
approved for use in wetland systems are to be considered.
Make provision for a number of follow up operations. The initial clearing
operation is only part of the total programme. Failure to follow up will result
in a failure of the entire programme.
Recommended methods of control associated with the age and size of
target plants are detailed below:
METHODS TO BE UTILISED
Hand pulling or hoeing: Hand pulling and hoeing are most suited where
sparse stands of vegetation are noted, where seedlings are easily removed
from the soil. Seedlings should be severed below the soil surface and
removed from the soil. Soil disturbance must be minimised to reduce the
likelihood of re-germination.
Foliar applications: spraying of herbicides can be carried out where dense
stands are noted. Leaves are sprayed to the point of run-off. The use of mist
spraying however, is discouraged as this often results in the dying off of non-
targeted species. The fitment of a narrow angle solid cone nozzle and a
coarse droplet spray will minimise this impact and must be used on leaves
and small cut stems. It is imperative that there is sufficient foliage to carry the
applied herbicide to the root system.
Malachite Ecological Services
Somkhele Anthracite Mine: Update to WUL
Wetland Impact Assessment 63
Basal stem treatments. Application of suitable herbicides can be carried out
to the bottom 250 mm of the stem. Application must be by means of a low
pressure, coarse droplet spray from a narrow angle solid cone nozzle.
Slashing: The seed stalks/branches of annuals can be slashed with a bill hook
or slasher before the seeds have matured. This is an effective method that
significantly reduces the presence of viable seeds that will germinate in the
new season.
The seed bed for many invasive alien species is about 15 years so it is important
to continue monitoring the vegetation communities present within the property
and manage the regrowth of weeds.
The removal of alien species must occur four times a year for the first three years
and then twice a year for the next three years or until the seed bank has
become depleted and indigenous vegetation has become dominant. This
elimination effort must be adjusted as required. Vegetation must be removed
from the site and disposed of at a registered land fill site.
SITE PREPARATION FOR REVEGETATION
The land and soil preparation must be conducted with an experienced wetland
specialist on site to guide this process. This will promote basal cover which will
assist in the stabilisation of the soil and reduce the potential for soil erosion.
Prior to the preparation of the ground for the planting of indigenous vegetation,
areas must be scarified or “ripped” to uncompact and loosen the upper soil
profile, if compaction has occurred. Areas that consist of organically suitable
material, the topsoil is to be ripped to a minimum depth of 150mm (preferably
250mm – 500mm) to form drills along the contours approximately 150mm apart.
Areas that do not contain organically suitable material, the ripped subsoil should
be covered with a layer (150mm) of topsoil and the final surface must mimic the
natural contours of the land. Where the soil is too hard to be scarified, soil is to
be ripped to a depth of 300mm before it is loosened by a scarifier to a depth of
150mm.
The re-vegetation process must take wetland zones and associated
hydrological conditions into consideration and ensure that selected
assemblages are suited to the saturation levels associated with each zone. Due
to the valuable role of vegetation in wetland systems, the re-vegetation process
is vital to the successful rehabilitation of the system.
Malachite Ecological Services
Somkhele Anthracite Mine: Update to WUL
Wetland Impact Assessment 64
MONITORING PLAN AND AUDIT REPORTS
The success of the rehabilitation plan is dependent on frequent monitoring of
the for the noting of changes to the systems, which in turn will indicate the
efficiency of the implemented rehabilitation measures. Monitoring of the
wetland systems must be undertaken by a suitably qualified wetland ecologist.
PHOTOGRAPHIC RECORD
It is important to monitor the visual appearance of the vegetation cover. A
photographic record is an ideal method of documenting these visual changes
and serves as a record of the success or failure of rehabilitation. Photographs
must be taken to track broad-scale changes in vegetation. Panoramic photos
must be taken at a fixed location to provide good coverage of the wetlands at
the frequency indicated above. The location of the fixed points must be
recorded with a GPS device. Information on the type of camera, lens and zoom
must be recorded. The camera must also be located on a tripod at a fixed
height.
WETLAND HEALTH AND INTEGRITY
Following on from the monitoring of the vegetation, both HGM 1 and HGM 2
must be monitored independently through assessing the Present Ecological
Score (PES) using the WET-Health methods (Macfarlane et al., 2009), the
Functional Integrity using the Wet-EcoServices methods (Kotze et al, 2009) and
the Ecological Importance and Sensitivity methods. These scores must be
evaluated on a yearly basis to determine if any changes have occurred within
the systems as a result of the mine operations and to provide recommendations
to mitigate and rehabilitate any identified impacts.
DECOMMISSIONING AND CLOSURE PHASE
Mitigation measures associated with limiting the impacts as a result of the
decommissioning phase are associated with the following:
Limiting the amount of water entering the voids left by mining can be
achieved by replacing spoils in such a manner as to be free-draining and
preventing the collection and pooling of water on rehabilitated mined land
and thus reducing the volumes of water infiltrating into the old opencast pits.
Treating of decanting mine water to acceptable water quality levels can be
achieved by the installation of a treatment plant, typically a Reverse Osmosis
Plant. The necessity and feasibility of treating the decanting water should
also be investigated and treatment implemented if necessary.
The timing, location and amount of decant that is expected to occur post
mining must be determined to allow more detailed decisions to be made

Malachite Ecological Services
Somkhele Anthracite Mine: Update to WUL
Wetland Impact Assessment 65
regarding possible mitigation and management measures to be
implemented.
All activities linked to the closure of the mine and the removal of mine
infrastructure must be limited to the footprint of the mining activities. Should
any damage occur within surrounding wetlands during this time, a suitably
qualified wetland rehabilitation specialist must be employed to lead the
rehabilitation process.
Careful monitoring is needed to ensure new erosion points (e.g. around
gabions) are detected and managed. Sediments eroded from remaining
stockpiles or rehabilitated pits must be minimised and prevented from
reaching watercourses. Ensure the PES score of wetland systems is not
degraded.
Thorough and appropriate disposal of waste is essential. Persistent organic
pollutants must be treated as toxic waste and responsibly disposed.
RISK MATRIX
The Risk Assessment for the existing and future operations of Somkhele Mine as
per the General Authorisation in terms of Section 39 of the National Water Act,
1998 (Act No. 36 of 1998) for Water Uses as defined in Section 21 (c) and (i)
(Notice 509 of 2016) was undertaken.
The risk assessment involves the analysis of the risk matrix provided in appendix
1 of this notice and involves the evaluation of the severity of impacts to the flow
regime, water quality, habitat, and biota of the water resource. Based on the
outcome of the Risk Assessment Matrix, low risk activities will be generally
authorised with conditions, while moderate to high risk activities will be required
to go through a Water Use Licence Application Process. Water use activities that
are authorised in terms of the General authorisations will still need to be
registered with the DWS.
It must be borne in mind that when assessing the impact significance following
the DWS Risk Assessment Matrix, determination of the significance of the impact
assumes that mitigation measures as listed within the present report as well as
within reports associated with the proposed pit extension of Luhlanga, known as
‘Luhlanga Box Cut Zero’ within the Luhlanga Area are feasible and will be
implemented, and as such does not take into consideration significance before
implementation of mitigation measures.
The risk assessment for existing mining operations is provided in Appendix D and
Appendix E for both HGM 1 and HGM 2 and the proposed extension of the
‘Luhlanga Boxcut Zero’ pit. Impacts associated with the operations of the mining

Malachite Ecological Services
Somkhele Anthracite Mine: Update to WUL
Wetland Impact Assessment 66
activities received Low Risk Scores for HGM 1 with impacts to the water resource
being small and easily managed and Moderate Risk Scores for HGM 2 with
impacts to the resource being notable and mitigation measures requiring
specialist input.
Impacts associated with the proposed extension of Boxcut Zero received Low
Risk Scores with impacts to the water resources and resource quality being small
and mitigation measures easily managed after consultation with specialist
consultants. The proposed extension will only affect a non-perennial
watercourse, with a limited obligate riparian species within the riparian zone as
well as a lack of aquatic biota. Furthermore, it must be reiterated that the Low
Risk scores are based on the implementation of all mitigation measures as
outlined in reports associated with the environmental and water use
authorisation of this proposed activity.
Malachite Ecological Services
Somkhele Anthracite Mine: Update to WUL
Wetland Impact Assessment 67
CONCLUSION
Based on the current identification of the four wetland indicators, four HGM units
were delineated within the assessment area. Three HGM units have been
classified as Channelled Valley Bottom wetlands, (HGM 1, HGM 2 and HGM 3)
and one HGM unit classified as a Seep (HGM 4). HGM 1 and HGM 2 are situated
within the mine boundary and HGM 3 and HGM 4 are situated approximately
550m to 600m from the existing mine boundaries.
The HGM units were assessed with regards to their health according to the Wet-
Health methodology. HGM 1 was classified as Largely Natural (PES Category B),
HGM 2 and HGM 4 classified as Largely Modified (PES Category D), and HGM 3
classified as Moderately Modified (PES Category C).
It is understood from the IWWMP (GCS 2018 –draft report) that an exemption is
being applied for relating to regulations on the use of water for mining and
related activities, aimed at the protection of water resources as published in
terms of the NWA in GN R 704 on 4 June 1999. This exemption is not
recommended for HGM 1, due to its ecological sensitivity and functional
importance within the landscape. It is highly recommended that any mining
activities do not encroach into this 100m buffer around HGM 1. The exemption
could be applied for HGM 2 as mining has already encroached into the 100m
buffer and the system is still regarded as a moderately functioning system. The
2016 buffer tool was utilised to calculate the minimum appropriate buffer width
for the protection of the ecosystem services provided by HGM 2 should this
exemption be applied. This buffer has been calculated to be 46m. The buffer
was calculated based on the high risk of the mining operations, the clay
dominated soils with low infiltration rates, the topography of the area and the
vegetation characteristics. If the 100m buffer for this system is relaxed it is
recommended that no mining (including infrastructure, stockpiles and mining
personal) should be allowed within the 46m buffer. This buffer must also be
rehabilitated with regards to the clearing of alien invasive species and the
removal of all rubble and stockpiles associated with the mining activities.
No future expansions will take place within Area 1, Area 2 or the KwaQubuka
(Area 9) Area. The impacts to the wetlands delineated within these areas are
therefore assessed on current mining operations. A proposed extension of
Luhlanga, known as ‘Luhlanga Box Cut Zero’ within the Luhlanga Area has been
assessed separately. This proposed extension will affect a non-perennial
watercourse but not any of the wetland systems delineated.

Malachite Ecological Services
Somkhele Anthracite Mine: Update to WUL
Wetland Impact Assessment 68
As a result of the topographical setting of the study site as well as the enclosed
nature of stormwater runoff from the mine, there is unlikely to be any negative
impact on HGM 3 and HGM 4, and these wetlands will not be assessed further.
The impact assessment has therefore focus on HGM 1 and HGM 2. Impacts to
these wetlands are associated with soil erosion, sedimentation, pollution and the
continued encroachment of alien invasive species.
In order to address the identified impacts and to lower their significance on the
health and functional integrity of the wetlands, a number of recommended
mitigation and rehabilitation/management measures are proposed. These
measures are aimed to improve the health and functional integrity of the
wetlands to avoid a continual decline in the current condition of these systems.
This can be achieved through the following objectives:
Removal of deposited soil and rubble from the edge of the wetlands,
particularly HGM 2, and the subsequent revegetation of the disturbed
areas with appropriate indigenous wetland and terrestrial species.
Removal of invasive alien and problem plant species from the edge of
the wetlands and within their boundaries. This must be conducted in a
phasic approach to ensure that existing and revegetated areas become
established.
Conduct a yearly monitoring of the health (PES Score), Functional
Integrity and Ecological Importance and Sensitivity (EIS) of HGM 1 and
HGM 2 to ensure that the current state of the wetlands does not decline
Malachite Ecological Services
Somkhele Anthracite Mine: Update to WUL
Wetland Impact Assessment 69
REFERENCES
BlackRock-Environmental. (2018). Basic Assessment Report Proposed Extension of
Luhlanga Opencast Pit at Somkhele Anthracite Mine, Mtubatuba Local
Municipality, Kwazulu-Natal. Prepared for Tendele Coal Mine. DMR Reference:
KZN 30/5/1/2/2/216EA
Bromilow, C. (2010). Problem plants and alien weeds of South Africa. Briza Publications
Collins, N.B. (2005). Wetlands: The basics and some more. Free State Department of
Tourism, Environment and Economic Affairs
Driver, A., Nel, J., Snaddon, K., Murray, K., Roux, D., Hill, L. & Swartz, E. (2011).
Implementation Manual for Freshwater Ecosystem Priority Areas. WRC Report No.
1801/1/11. Pretoria: Water Research Commission
Du Preez, L., Carruthers, V. (2009). A Complete Guide to the Frogs of Southern Africa,
Cape Town: Struik Nature.
DWA (2010). License in Terms of Chapter 4 of the National Water Act, 1998 (Act No 36.
of 1998) (The Act). Tendele Coal Mining (Pty) Ltd
DWA (2014). License in Terms of Chapter 4 of the National Water Act, 1998 (Act No 36.
of 1998) (The Act). License Number: 06/W23A/BCGIJ/2549. Tendele Coal Mining
(Pty) Ltd Somkhele Anthracite Mine.
DWAF, D. O. (2005). A Practical Field Procudure for Identification and Delineation of
Wetlands and Riparian Areas - Edition 1
DWAF (2008) Updated Manual for the Identification and Delineation of Wetlands and
Riparian Areas, prepared by M. Rountree, A. L. Batchelor, J. MacKenzie and D.
Hoare. Stream Flow Reduction Activities, Department of Water Affairs and
Forestry, Pretoria, South Africa
Eco-Pulse Environmental Consulting Services (2017) Watercourse Delineation &
Importance Assessment Report. Somkhele Mine Haul Roads and Mine Residue
Pit Establishment in the Hlabisa Local Municipality, Kwazulu-Natal. Report No:
Ep312-01. Hilton, Kwazulu-Natal
Eco-Pulse Environmental Consulting Services (2018). Wetland Habitat Screening Report
– Proposed Clean Water Storage Facility for the Somkhele Mine Within The
Hlabisa Local Municipality, Kwazulu-NataL. Hilton. KwaZulu-Natal
Fey, M. (2010). Soils of South Africa. Their distribution, properties, classification, genesis,
use and environmental significance. Cambridge University Press. Cape Town
Malachite Ecological Services
Somkhele Anthracite Mine: Update to WUL
Wetland Impact Assessment 70
GCS Water and Environmental Consulting. (2014). Proposed Somkhele Mine Expansion
in the Hlabisa Local Municipality, KwaZulu-Natal. Preliminary Wetland Impact
Assessment Report. GCS Project Number: 12-350. Kloof KwaZulu-Natal
GCS Water and Environmental Consulting. (2018). Somkhele Mine, KwaZulu-Natal:
Kwaqubuka and Luhlanga Flood Line Analysis Report GCS Project Number: 17-
0284. Kloof KwaZulu-Natal
GCS Water and Environmental Consulting. (2018). Draft Somkhele Mine: Integrated
Water and Waste Management Plan Report. GCS Project Number: 16-1243.
Kloof KwaZulu-Natal
Harvey, J., Shab, S., Li, H, Jones, D.J. & Wu, R. (2017). Fully Permeable Pavement for
Stormwater Management: Progress and Obstacles to Implementation in
California. Technical Memorandum: UCPRC-TM-2017-03
Inqubeko Consulting Engineers. (2017). Somkhele Mines Proposed Diversion of Storm
Water around Luhlanga Boxcut Zero (Area 8) Preliminary Design Report. Report
prepared for Tendele Coal Mining
Kotze, D., et al, Marneweck, G., Batchelor, A., Lindley, D. & Collins, N. (2007). WET-
EcoServices: A technique for rapidly assessing ecosystem services supplied by
wetlands. WRC Report No TT 339/08. Pretoria: Water Research Commission
Jennings, K., Le Roux, P.A.L., Van Huyssteen, C.W., Hensley, M., and Zere, T.B. (2008).
Redox conditions related to interflow in a soil of the Kroonstad form in the
Weatherley catchment, South African Journal of Plant and Soil, 25:4, 204-213,
DOI: 10.1080/02571862.2008.10639918
Macfarlane, D., Kotze, D., Ellery, W., Walters, D., Koopman, V., Goodman, P. & Goge, C.
(2007). WET-Health: A Technique for rapidly assessing wetland health. WRC
Report No TT 340/08. Pretoria: Water Reseach Commision
Minter L.R., Burger M., Harrison J.A., Braack H.H., Bishop P.J. & Kloepfer D. (eds).
2004. Atlas and Red Data book of the frogs of South Africa, Lesotho and
Swaziland. SI/MAB Series no. 9. Smithsonian Institution, Washington, D.C.
Mitsch, W. J. & Gosselink, J. G. (1993) Wetlands (2nd edn) Van Nostrand Reinhold, New
York
Mucina, L., Rutherford, M.C. & Powrie, L.W. (eds). (2006). Vegetation Map of South
Africa, Lesotho and Swaziland, edn 2, 1:1 000 000 scale sheet maps. South
African National Biodiversity Institute, Pretoria. ISBN 978-1-919976-42-6

Malachite Ecological Services
Somkhele Anthracite Mine: Update to WUL
Wetland Impact Assessment 71
Nel, J.L., Driver, A., Strydom, W.F., Maherry, A., Petersen, C., Hill, L., Roux, D.J., Nienaber,
S., van Deventer, H., Swartz, E., and Smith-Adao, L.B. (2011). Atlas of Freshwater
ECOSYSTEM Priority Areas in South Africa: Maps to support sustainable
development of water resources. Water Research Commission.
NSW Scientific Committee. 2002. Alteration to the natural flow regimes of rivers, streams,
floodplains & wetlands – key threatening process listing. Last updated 13
December 2013. Accessed at
http://www.environment.nsw.gov.au/threatenedspecies/AlterationNaturalFlow
KTPListing.htm
Ollis, D., Snaddon, K., Job, N. & Mbona, N. (2013). Classification Systems for Wetlands
and other Aquatic Ecosystems in South Africa. User Manual: Inland Systems.
SANBI Biodiversity Series 22. Pretoria: South African National Biodiversity Institute
Pooley E. (1998). A field guide to the wild flowers of KwaZulu-Natal and the Eastern
Region. Natal Flora Publications Trust, Durban
SANBI. (2013). Grasslands Ecosystem Guidelines: landscape interpretation for planners
and managers. Compiled by Cadman, M., de Villiers, C., Lechmere-Oertel, R.
and D. McCulloch. South African National Biodiversity Institute, Pretoria
South African National Biodiversity Institute. (2013). Life: the state of South Africa’s
biodiversity 2012. South African National Biodiversity Institute, Pretoria.
Soil Classification Working Group (1991). Soil Classification: A Taxonomic System for South
Africa. Department of Agriculture
Styles, D. (2018) Vegetation Impact Assessment for the Luhlanga Pit Extension, Somkhele
Performed for Tendele Coal Mining Pty Ltd. Umbilo KwaZulu-Natal
Van Oudtshoorn, F. (1992). Guide to grasses of South Africa. Briza Publications, Arcadia
Van Wyk, B. & Van Wyk, P. (2007). Field guide to trees of South Africa. Struik Publishers.
Cape Town
Water Resource Commission (2011). Easy Identification of some South African Wetland
Plants. WRC Report No TT 479/10
West, J and Herman, K (2005). Northington Residential Estate: Wetland delineation,
KwaZulu-Natal. WSP Walmsley. Westville, Durban
Zedler, J.B. & Kercher, S. (2004). Causes and Consequences of Invasive Plants in
Wetlands: Opportunities, Opportunists, and Outcomes. Critical Reviews in Plant
Sciences, 23(5):431–452
Malachite Ecological Services
Somkhele Anthracite Mine: Update to WUL
Wetland Impact Assessment 72
APPENDICES
APPENDIX A – DECLARATIONS
I Rowena Harrison, declare that -
I act as the independent specialist in this matter;
I do not have and will not have any vested interest (either business, financial,
personal or other) in the undertaking of the proposed activity, other than
remuneration for work performed in terms of the Environmental Impact Assessment
Regulations, 2014;
I will perform the work relating to the application in an objective manner, even if
this results in views and findings that are not favourable to the applicant;
I declare that there are no circumstances that may compromise my objectivity in
performing such work;
I have expertise in conducting the specialist report relevant to this application,
including knowledge of the National Environmental Management Act (Act 107 of
1998) (NEMA), regulations and any guidelines that have relevance to the proposed
activity;
I will comply with the NEMA Act, regulations and all other applicable legislation;
As a registered member of the South African Council for Natural Scientific
Professions in terms of the Natural Scientific Professions Act, 2003 (Act No. 27 of
2003), I will undertake my professional duties in accordance with the Code of
Conduct of the Council, as well as any other societies of which I am a member;
and
I am aware that a person is guilty of an offence in terms of Regulation 48 (1) of the
EIA Regulations, 2014, if that person provides incorrect or misleading information. A
person who is convicted of an offence in terms of sub-regulation 48(1) (a)-(e) is
liable to the penalties as contemplated in section 49B-(1) of the National
Environmental Management Act, 1998 (Act 107 of 1998).
Signature of the specialist:
Date:
Specialist: Rowena Harrison for Malachite Specialist Services (Pty) Ltd
Qualification: MSc Soil Science (UKZN)
E-mail: [email protected]
Professional
affiliation(s) (if any)
SACNASP Pr. Sci.Nat: 400715/15
IAIAsa (No. 2516)
Malachite Ecological Services
Somkhele Anthracite Mine: Update to WUL
Wetland Impact Assessment 73
I Craig Widdows, declare that -
I act as the independent specialist in this matter;
I do not have and will not have any vested interest (either business, financial,
personal or other) in the undertaking of the proposed activity, other than
remuneration for work performed in terms of the Environmental Impact Assessment
Regulations, 2014;
I will perform the work relating to the application in an objective manner, even if
this results in views and findings that are not favourable to the applicant;
I declare that there are no circumstances that may compromise my objectivity in
performing such work;
I have expertise in conducting the specialist report relevant to this application,
including knowledge of the National Environmental Management Act (Act 107 of
1998) (NEMA), regulations and any guidelines that have relevance to the proposed
activity;
I will comply with the NEMA Act, regulations and all other applicable legislation;
As a registered member of the South African Council for Natural Scientific
Professions in terms of the Natural Scientific Professions Act, 2003 (Act No. 27 of
2003), I will undertake my professional duties in accordance with the Code of
Conduct of the Council, as well as any other societies of which I am a member;
I undertake to disclose to the applicant and the competent authority all material
information in my possession that reasonably has or may have the potential of
influencing any decision to be taken with respect to the application by the
competent authority; and the objectivity of any report, plan or document to be
prepared by myself for submission to the competent authority; all the particulars
furnished by me in this report are true and correct; and
I am aware that a person is guilty of an offence in terms of Regulation 48 (1) of the
EIA Regulations, 2014, if that person provides incorrect or misleading information. A
person who is convicted of an offence in terms of sub-regulation 48(1) (a)-(e) is
liable to the penalties as contemplated in section 49B-(1) of the National
Environmental Management Act, 1998 (Act 107 of 1998).
Signature of the specialist:
Date:
Specialist: Dr Craig Widdows for Malachite Specialist Services (Pty) Ltd
Qualification: PhD Ecology (UKZN)
Email: [email protected]
Professional
affiliation(s) (if any)
SACNASP Pr. Sci.Nat: 117852

Malachite Ecological Services
Somkhele Anthracite Mine: Update to WUL
Wetland Impact Assessment 74
APPENDIX B – WETLAND DELINEATION AND ASSESSMENT METHODOLOGY
WETLAND DELINEATION TECHNIQUE
For the purpose of this assessment, wetlands are considered as those
ecosystems defined by the National Water Act as:
“land which is transitional between terrestrial and aquatic
systems where the water table is usually at or near the surface,
or the land is periodically covered with shallow water, and
which land in normal circumstances supports or would support
vegetation typically adapted to life in saturated soil.”
The study site was assessed with regards to the determination of the presence
of wetland areas according to the procedure described in ‘A Practical Field
Procedure for Identification and Delineation of Wetland and Riparian Areas –
Edition 1’ (DWAF, 2005). This methodology requires the delineator to give
consideration to the following four indicators in order to identify wetland areas;
to find the outer edge of the wetland zone; and identify the different zones of
saturation within the wetland systems identified:
i. Terrain Unit Indicator: helps to identify those parts of the landscape where
wetlands are more likely to occur.
ii. Soil Form Indicator: identifies the soil forms, as defined by the Soil
Classification Working Group (1991), which are associated with
prolonged and frequent saturation.
iii. Soil Wetness Indicator: identifies the morphological "signatures"
developed in the soil profile as a result of prolonged and frequent
saturation. Signs of wetness are characterised by a variety of aspects
including marked variations in the colour of various soil components,
known as mottling; a gleyed soil matrix; or the presence of Fe/Mn
concretions. It should be noted that the presence of signs of wetness
within a soil profile is sufficient to classify an area as a wetland area
despite the lack of other indicators.
iv. Vegetation Indicator: identifies hydrophilic vegetation associated with
frequently saturated soils.
In assessing whether an area is a wetland, the boundary of a wetland should be
considered as the point where the above indicators are no longer present. An
understanding of the hydrological processes active within the area is also
considered important when undertaking a wetland assessment. Indicators
Malachite Ecological Services
Somkhele Anthracite Mine: Update to WUL
Wetland Impact Assessment 75
should be 'combined' to determine whether an area is a wetland, to delineate
the boundary of that wetland and to assess its level of functionality and health.
ASSESSMENT OF THE WETLAND’S FUNCTIONAL INTEGRITY
Wetlands within the study area serve to improve habitat within and potentially
downstream of the study area through the provision of various ecosystem
services. These ecosystem services relate to:
Flood attenuation.
Streamflow regulation.
Water purification (including sediment trapping and the assimilation of
phosphates, nitrates and toxicants).
Carbon storage.
Maintenance of biodiversity.
Provision of water for human and agricultural use.
Cultural benefits (including tourism, recreation and cultural heritage).
Wetlands therefore affect the quantity and quality of water within a catchment
(Mitsch & Gosselink, 1993). The importance of wetland conservation and
sustainable management is directly related to the value of the functions
provided by a wetland. An indication of the functions and ecosystem services
provided by wetlands is assessed through the WET-EcoServices manual (Kotze
et al., 2008) and is based on a number of characteristics that are relevant to the
particular benefit provided by the wetland. The tool uses biophysical
characteristics of the wetland and the level of disturbance within the wetland
and its catchment to estimate the level of supply of ecosystem goods and
services. A Level 2 WET-EcoServices assessment was undertaken for the
wetlands identified along the power line corridor. A Level 2 assessment is the
highest WET-EcoServices assessment that can be undertaken and involves an
on-site assessment as well as desktop work.
ASSESSMENT OF THE WETLAND’S PRESENT ECOLOGICAL STATE (PES)
The Present Ecological State (PES) for wetlands which is defined as ‘a measure
of the extent to which human impacts have caused the wetland to differ from
the natural reference condition’ is also an indication of each wetland’s ability
to contribute to ecosystem services within the study area. This was assessed
according to the methods contained in the Level 2 WET-Health: A technique for
rapidly assessing wetland health (Macfarlane et al., 2009).
This document assesses the health status of a wetland through evaluation of
three main factors -

Malachite Ecological Services
Somkhele Anthracite Mine: Update to WUL
Wetland Impact Assessment 76
Hydrology: defined as the distribution and movement of water through a
wetland and its soils.
Geomorphology: defined as the distribution and retention patterns of
sediment within the wetland.
Vegetation: defined as the vegetation structural and compositional
state.
The WET-Health tool evaluates the extent to which anthropogenic changes
have impacted upon the functional integrity or health of a wetland through
assessment of the above-mentioned three factors. The deviation from the
natural condition is given a rating based on a score of 0-10 with 0 indicating no
impact and 10 indicating modifications have reached a critical level. Since
hydrology, geomorphology and vegetation are interlinked their scores are then
aggregated to obtain an overall PES health score These scores are then used to
place the wetland into one of six health classes (A – F; with A representing
completely unmodified/natural and F representing severe/complete deviation
from natural as depicted in Table 7.
TABLE 7: HEALTH CATEGORIES USED BY WET-HEALTH FOR DESCRIBING THE INTEGRITY OF WETLANDS
DESCRIPTION IMPACT
SCORE
HEALTH
CATEGORY
Unmodified, natural. 0 - 1.0 A
Largely natural with few modifications. A slight change in
ecosystem processes is discernible and a small loss of natural
habitats and biota may have taken place
1.1 - 2.0 B
Moderately modified. A moderate change in ecosystem
processes and loss of natural habitats has taken place but the
natural habitat remains predominantly intact
2.1 - 4.0 C
Largely modified. A large change in ecosystem processes and
loss of natural habitat and biota and has occurred. 4.1 - 6.0 D
The change in ecosystem processes and loss of natural habitat
and biota is great but some remaining natural habitat features
are still recognizable
6.1 - 8.0 E
Modifications have reached a critical level and the ecosystem
processes have been modified completely with an almost
complete loss of natural habitat and biota
8.1 - 10.0 F
Due to differences in the pattern of water flow through various hydro-
geomorphic (HGM) types, the tool requires that the wetland is divided into
distinct HGM units at the outset. Ecosystem services for each HGM unit are then
assessed separately.
Malachite Ecological Services
Somkhele Anthracite Mine: Update to WUL
Wetland Impact Assessment 77
ASSESSMENT OF ECOLOGICAL IMPORTANCE AND SENSITIVITY (EIS)
The Ecological Importance and Sensitivity (EIS) assessment was determined by
utilising a rapid scoring system. The system has been developed to assess the
‘Ecological Importance and Sensitivity’ of the wetland within the larger
landscape; the ‘Hydrological Functional Importance’ of the wetland; and the
‘Direct Human Benefits’ obtained from the wetland through either subsistence
or cultural practices. The scoring assessments for these three aspects of wetland
importance and sensitivity have been based on the requirements of the NWA,
the original Ecological Importance and Sensitivity assessments developed for
riverine assessments (DWAF, 1999), and the work conducted by Kotze et al.
(2008) on the assessment of wetland ecological goods and services from the
WET-EcoServices tool. The scores obtained were placed into a category of very
low; low; medium; high; and very high as shown:
Very low: 0 – 1.0
Low: 1.1 – 2.0
Medium: 2.1 – 3.0
High: 3.1 – 4.0
Very High 4.1 – 5.0
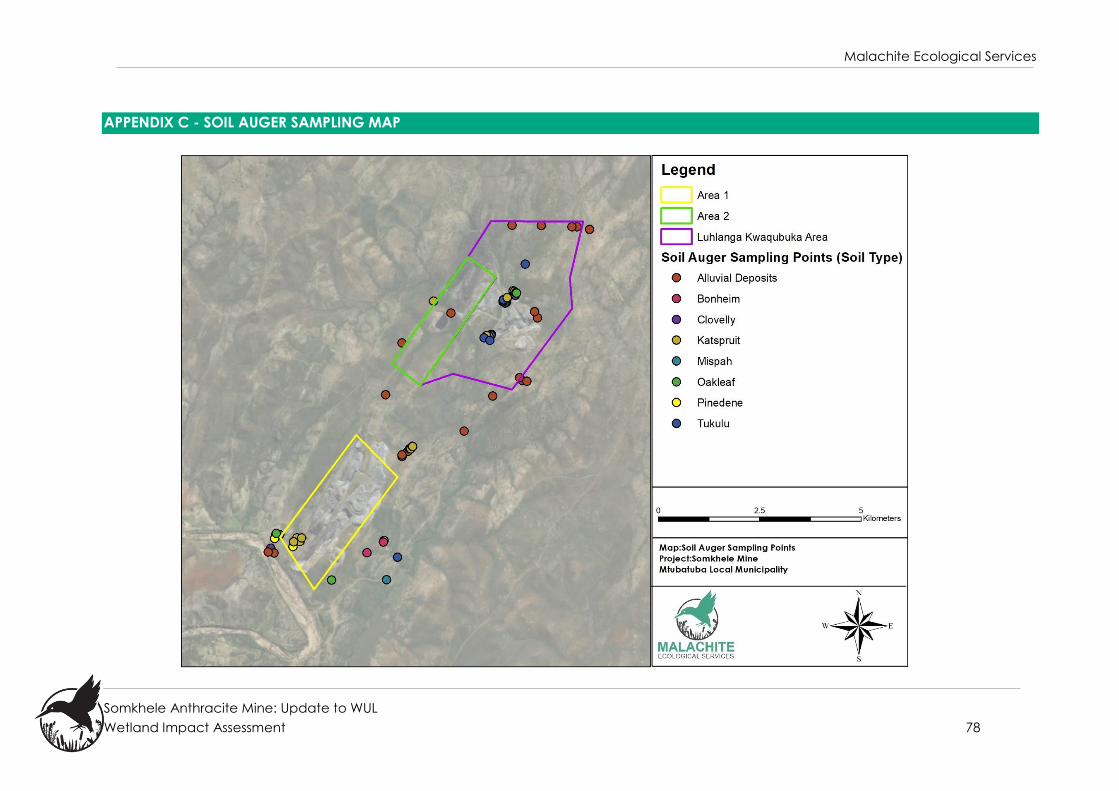
Malachite Ecological Services
Somkhele Anthracite Mine: Update to WUL
Wetland Impact Assessment 78
APPENDIX C - SOIL AUGER SAMPLING MAP

Malachite Ecological Services
Somkhele Anthracite Mine: Update to WUL
Wetland Impact Assessment 79
APPENDIX D– RISK MATRIX ASSOCIATED WITH HGM 1
RISK MATRIX (Based on DWS 2015 publication: Section 21 c and I water use Risk Assessment Protocol)
NAME and REGISTRATION No of SACNASP Professional member: Rowena Harrison Reg no. 400715/15
Risk to be scored for construction and operational phases of the project. MUST BE COMPLETED BY SACNASP PROFESSIONAL MEMBER REGISTERED IN AN APPROPRIATE FIELD OF EXPERTISE.
Se
ve
rity
Se
ve
rity
Sp
atia
l sc
ale
Du
ratio
n
Co
nse
qu
en
ce
Fre
qu
en
cy
of
ac
tivity
Fre
qu
en
cy
of
imp
ac
t
Leg
al Is
sue
s
De
tec
tio
n
Lik
elih
oo
d
Sig
nific
an
ce
Ris
k R
atin
g
Co
nfid
en
ce
le
ve
l
Co
ntr
ol M
ea
sure
s
Bo
rde
rlin
e L
OW
MO
DER
ATE
Ra
tin
g C
lass
es
PES A
ND
EIS
OF
WA
TER
CO
UR
SE
N
o. Phases Activity Aspect Impact
Flo
w
Re
gim
e
Ph
ysi
co
&
Ch
em
ica
l
(Wa
ter
Qu
ality
)
Ha
bita
t
(Ge
om
or
ph
+
Ve
ge
tatio
n
Bio
ta
1 Operational
Phase
Day to day
activity of
opencast
mining
operations
Stormwater
runoff from the
hardened
surfaces
entering into
HGM 1
Sedimentation of
HGM 1
2 2 2 2 2 1 1 4 2 2 5 1 10 40 L 70
As per
Section
8 of this
report
One
Chan
nelle
d
Valle
y
Botto
m
syste
ms
HGM
1 -
PES B
and
EIS
high
2 Operational
Phase
Day to day
activity of
opencast
mining
operations
Stormwater
runoff from the
hardened
surfaces
entering into
HGM 1
carrying
pollutants
Pollution of HGM
1 including water
quality and soil
1 1 1 2 1.25 1 1 3.25 2 2 5 1 10 32.5 L 70
As per
Section
8 of this
report
One
Chan
nelle
d
Valle
y
Botto
m
syste
ms
HGM
1 -
PES B
and
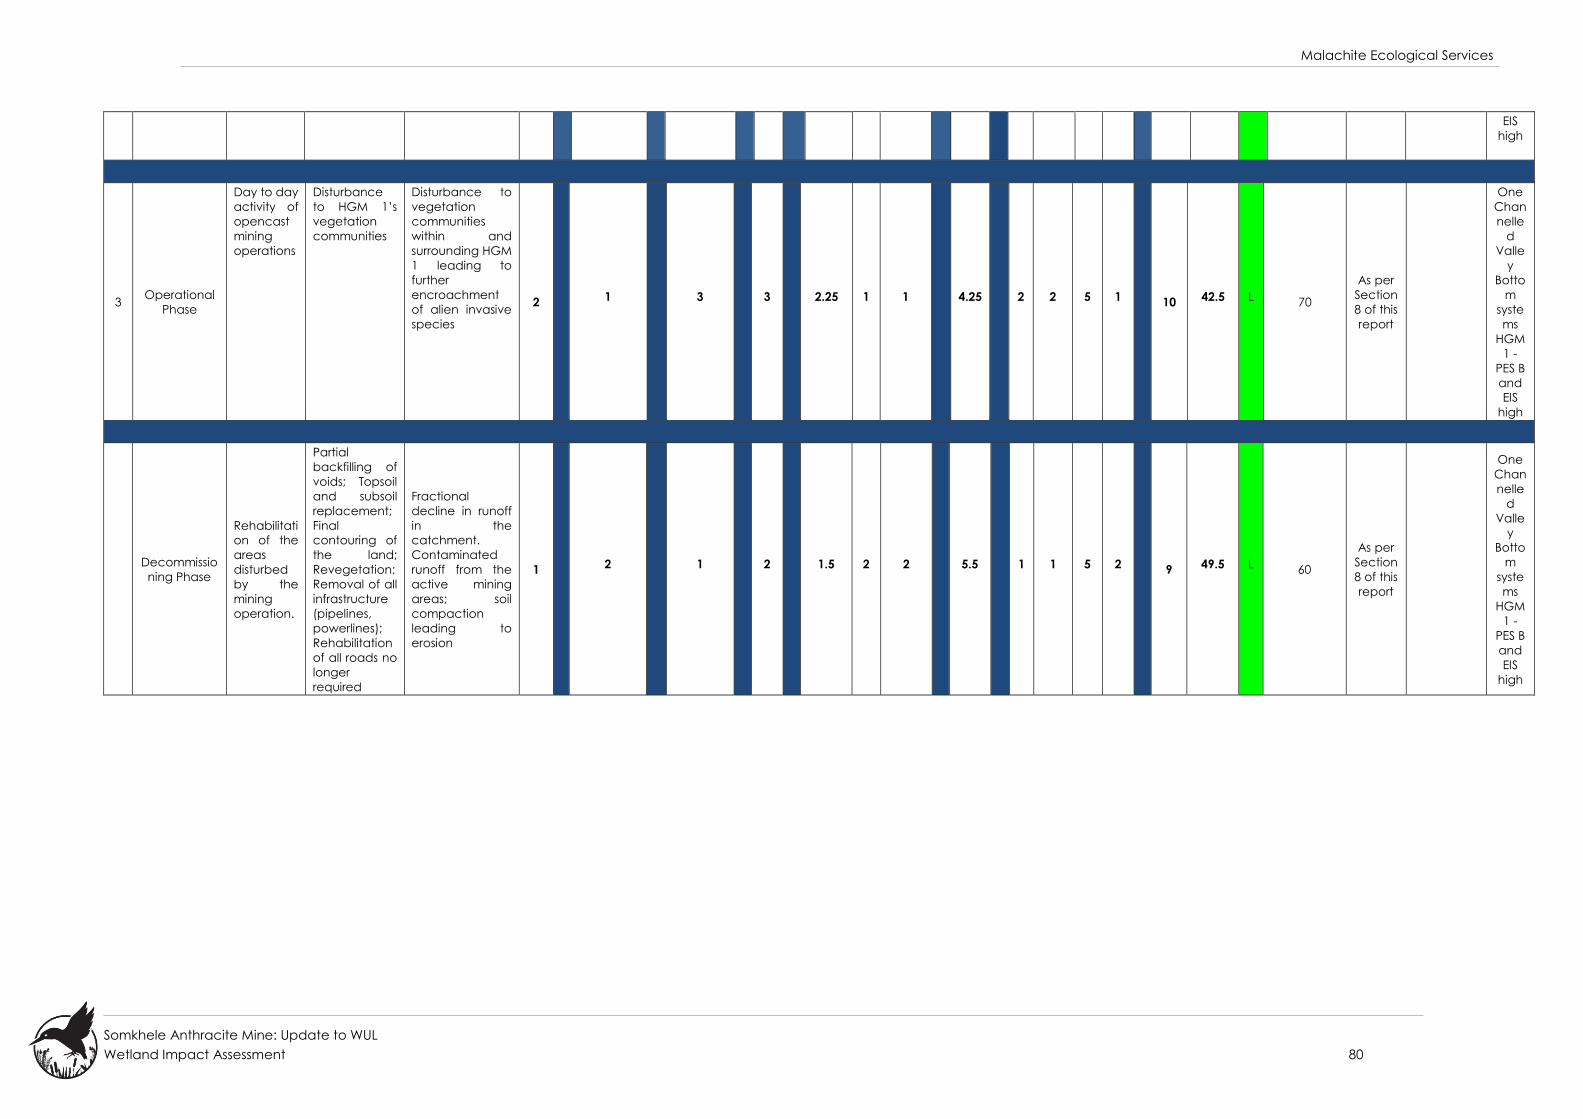
Malachite Ecological Services
Somkhele Anthracite Mine: Update to WUL
Wetland Impact Assessment 80
EIS
high
3 Operational
Phase
Day to day
activity of
opencast
mining
operations
Disturbance
to HGM 1’s
vegetation
communities
Disturbance to
vegetation
communities
within and
surrounding HGM
1 leading to
further
encroachment
of alien invasive
species
2 1 3 3 2.25 1 1 4.25 2 2 5 1 10 42.5 L 70
As per
Section
8 of this
report
One
Chan
nelle
d
Valle
y
Botto
m
syste
ms
HGM
1 -
PES B
and
EIS
high
Decommissio
ning Phase
Rehabilitati
on of the
areas
disturbed
by the
mining
operation.
Partial
backfilling of
voids; Topsoil
and subsoil
replacement;
Final
contouring of
the land;
Revegetation;
Removal of all
infrastructure
(pipelines,
powerlines);
Rehabilitation
of all roads no
longer
required
Fractional
decline in runoff
in the
catchment.
Contaminated
runoff from the
active mining
areas; soil
compaction
leading to
erosion
1 2 1 2 1.5 2 2 5.5 1 1 5 2 9 49.5 L 60
As per
Section
8 of this
report
One
Chan
nelle
d
Valle
y
Botto
m
syste
ms
HGM
1 -
PES B
and
EIS
high
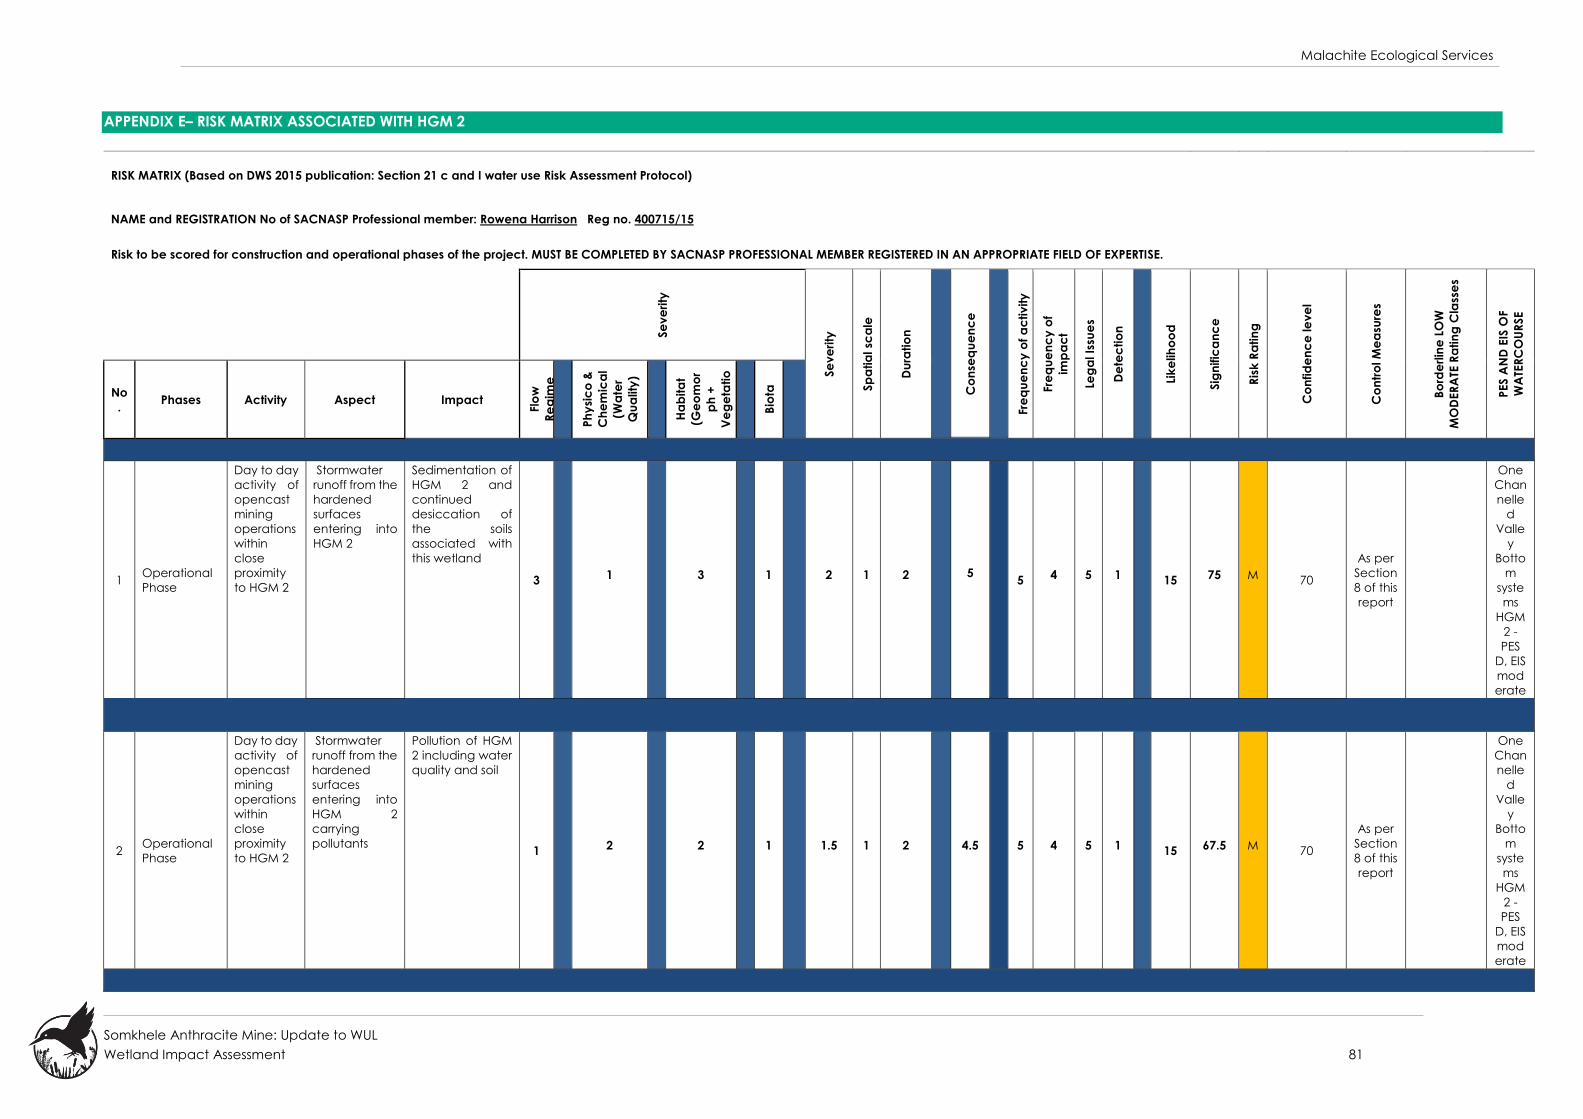
Malachite Ecological Services
Somkhele Anthracite Mine: Update to WUL
Wetland Impact Assessment 81
APPENDIX E– RISK MATRIX ASSOCIATED WITH HGM 2
RISK MATRIX (Based on DWS 2015 publication: Section 21 c and I water use Risk Assessment Protocol)
NAME and REGISTRATION No of SACNASP Professional member: Rowena Harrison Reg no. 400715/15
Risk to be scored for construction and operational phases of the project. MUST BE COMPLETED BY SACNASP PROFESSIONAL MEMBER REGISTERED IN AN APPROPRIATE FIELD OF EXPERTISE.
Se
ve
rity
Se
ve
rity
Sp
atia
l sc
ale
Du
ratio
n
Co
nse
qu
en
ce
Fre
qu
en
cy
of
ac
tivity
Fre
qu
en
cy
of
imp
ac
t
Leg
al Is
sue
s
De
tec
tio
n
Lik
elih
oo
d
Sig
nific
an
ce
Ris
k R
atin
g
Co
nfid
en
ce
le
ve
l
Co
ntr
ol M
ea
sure
s
Bo
rde
rlin
e L
OW
MO
DER
ATE
Ra
tin
g C
lass
es
PES A
ND
EIS
OF
WA
TER
CO
UR
SE
No
. Phases Activity Aspect Impact
Flo
w
Re
gim
e
Ph
ysi
co
&
Ch
em
ica
l
(Wa
ter
Qu
ality
)
Ha
bita
t
(Ge
om
or
ph
+
Ve
ge
tatio
n
Bio
ta
1 Operational
Phase
Day to day
activity of
opencast
mining
operations
within
close
proximity
to HGM 2
Stormwater
runoff from the
hardened
surfaces
entering into
HGM 2
Sedimentation of
HGM 2 and
continued
desiccation of
the soils
associated with
this wetland
3 1 3 1 2 1 2
5
5 4 5 1 15 75 M 70
As per
Section
8 of this
report
One
Chan
nelle
d
Valle
y
Botto
m
syste
ms
HGM
2 -
PES
D, EIS
mod
erate
2 Operational
Phase
Day to day
activity of
opencast
mining
operations
within
close
proximity
to HGM 2
Stormwater
runoff from the
hardened
surfaces
entering into
HGM 2
carrying
pollutants
Pollution of HGM
2 including water
quality and soil
1 2 2 1 1.5 1 2 4.5 5 4 5 1 15 67.5 M 70
As per
Section
8 of this
report
One
Chan
nelle
d
Valle
y
Botto
m
syste
ms
HGM
2 -
PES
D, EIS
mod
erate
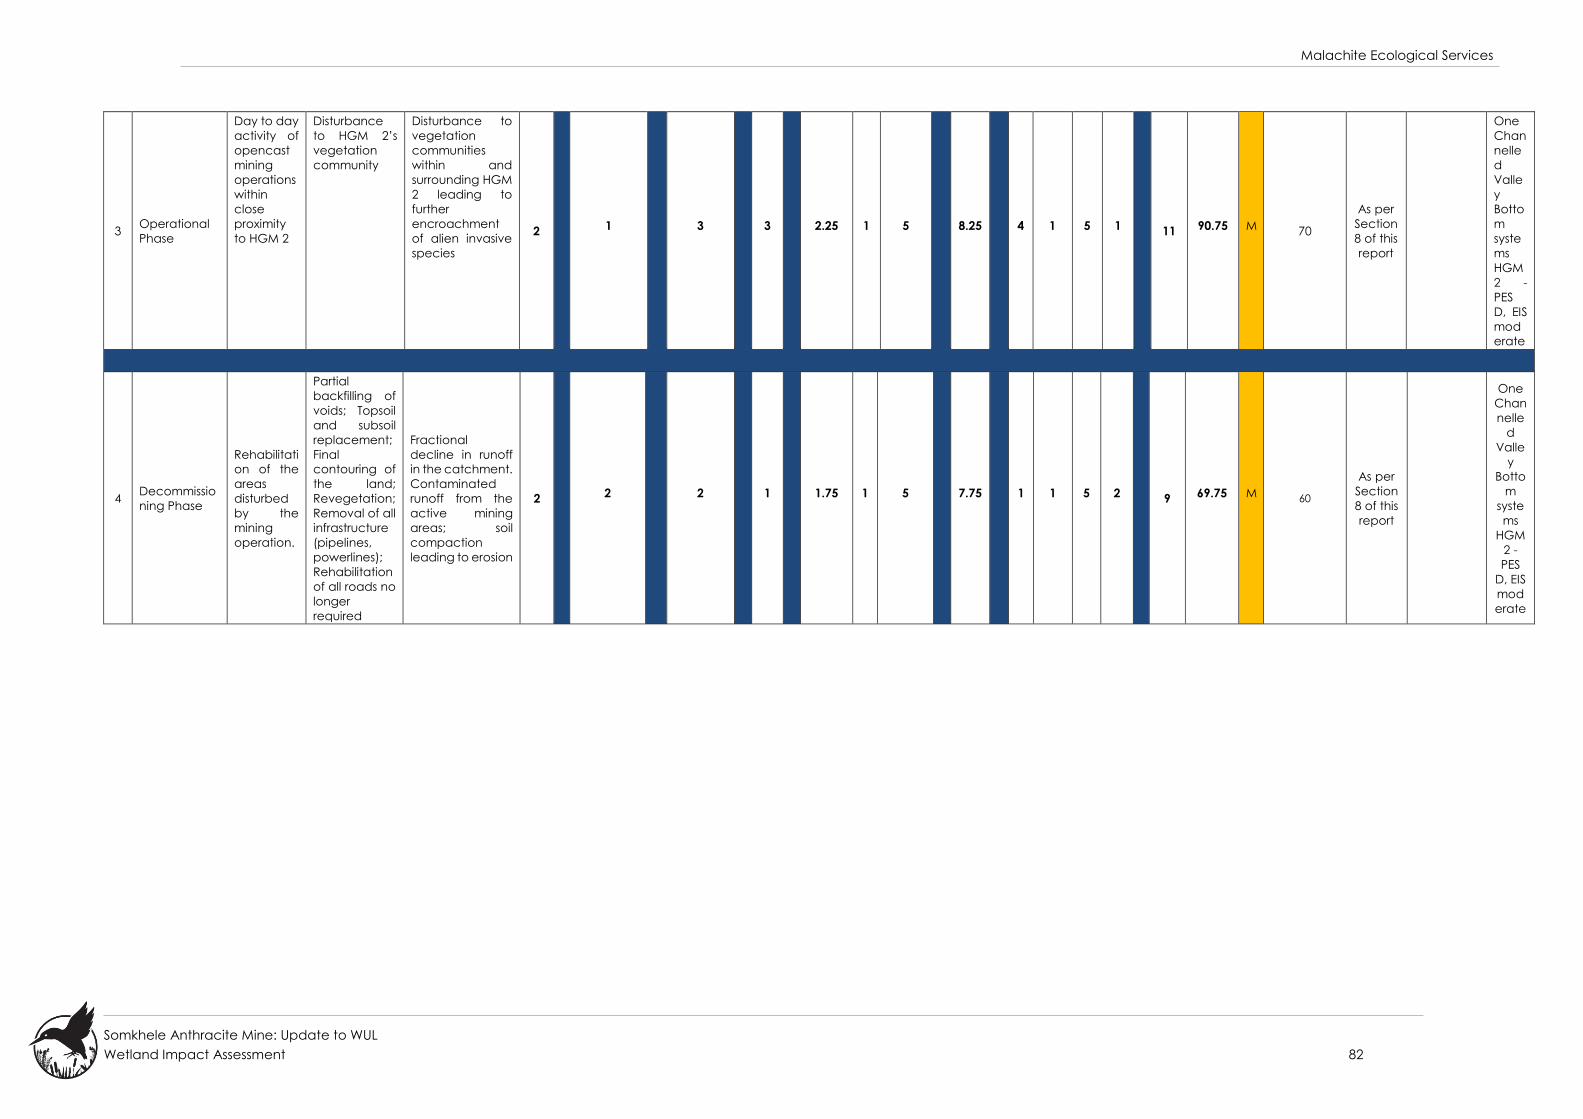
Malachite Ecological Services
Somkhele Anthracite Mine: Update to WUL
Wetland Impact Assessment 82
3 Operational
Phase
Day to day
activity of
opencast
mining
operations
within
close
proximity
to HGM 2
Disturbance
to HGM 2’s
vegetation
community
Disturbance to
vegetation
communities
within and
surrounding HGM
2 leading to
further
encroachment
of alien invasive
species
2 1 3 3 2.25 1 5 8.25 4 1 5 1 11 90.75 M 70
As per
Section
8 of this
report
One
Chan
nelle
d
Valle
y
Botto
m
syste
ms
HGM
2 -
PES
D, EIS
mod
erate
4 Decommissio
ning Phase
Rehabilitati
on of the
areas
disturbed
by the
mining
operation.
Partial
backfilling of
voids; Topsoil
and subsoil
replacement;
Final
contouring of
the land;
Revegetation;
Removal of all
infrastructure
(pipelines,
powerlines);
Rehabilitation
of all roads no
longer
required
Fractional
decline in runoff
in the catchment.
Contaminated
runoff from the
active mining
areas; soil
compaction
leading to erosion
2 2 2 1 1.75 1 5 7.75 1 1 5 2 9 69.75 M 60
As per
Section
8 of this
report
One
Chan
nelle
d
Valle
y
Botto
m
syste
ms
HGM
2 -
PES
D, EIS
mod
erate
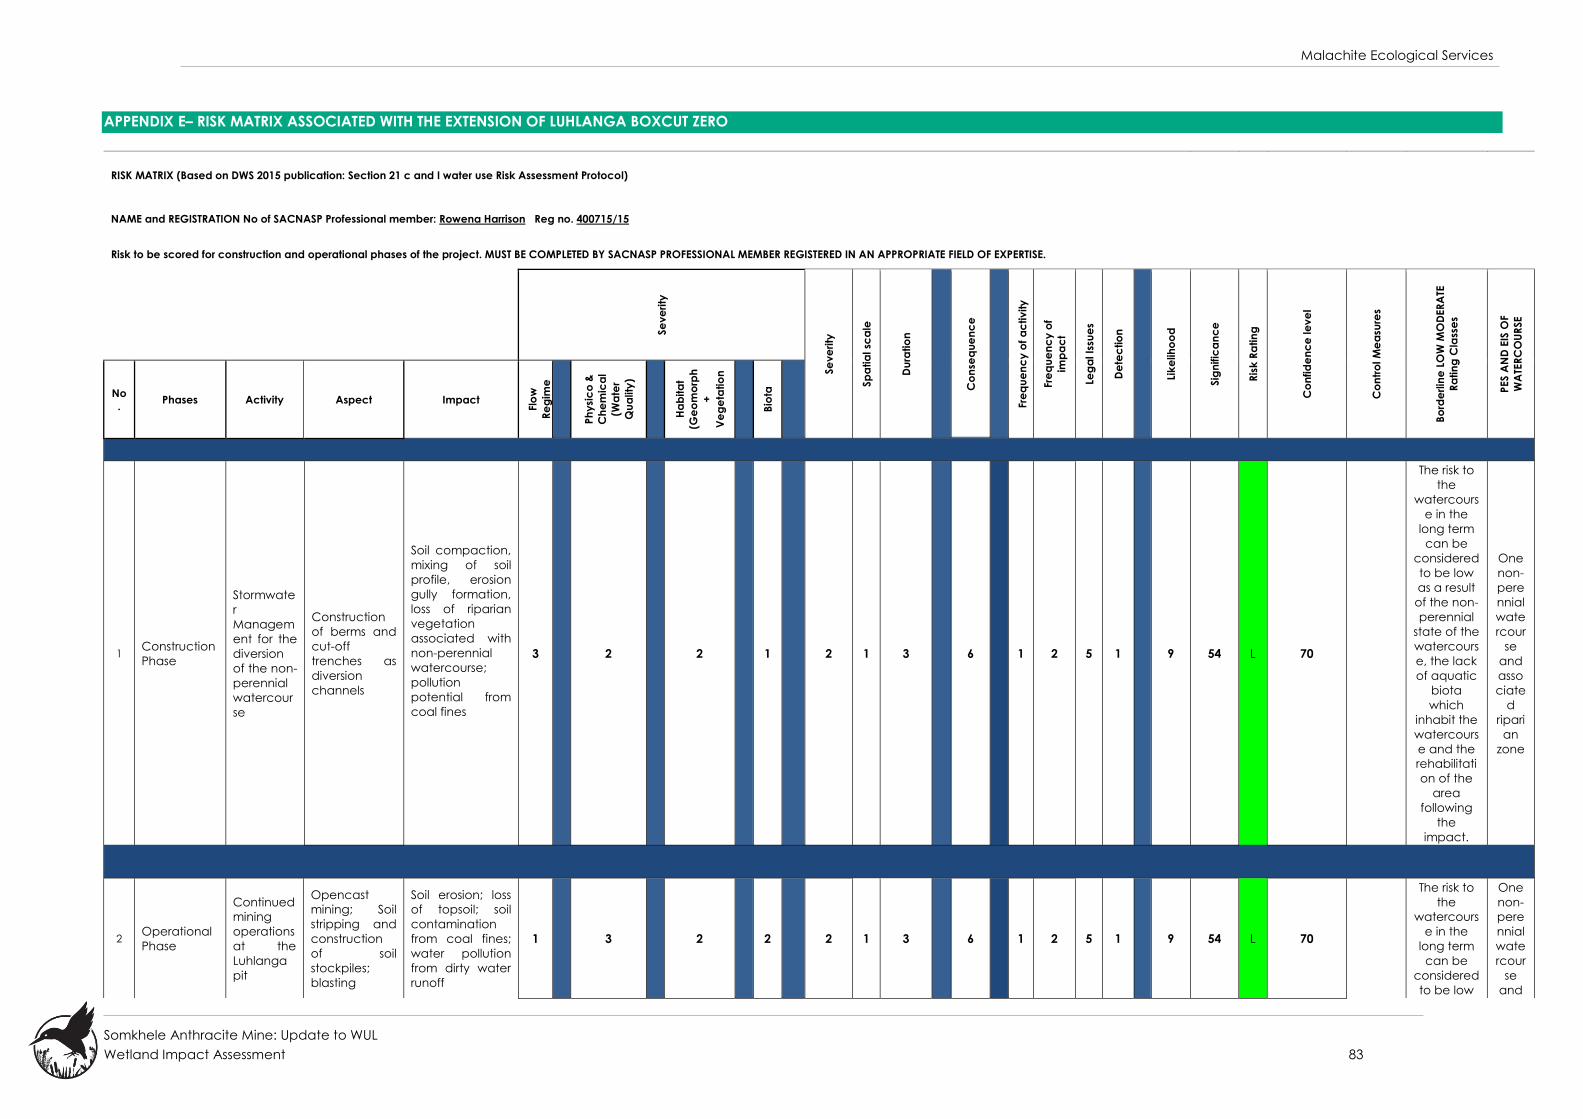
Malachite Ecological Services
Somkhele Anthracite Mine: Update to WUL
Wetland Impact Assessment 83
APPENDIX E– RISK MATRIX ASSOCIATED WITH THE EXTENSION OF LUHLANGA BOXCUT ZERO
RISK MATRIX (Based on DWS 2015 publication: Section 21 c and I water use Risk Assessment Protocol)
NAME and REGISTRATION No of SACNASP Professional member: Rowena Harrison Reg no. 400715/15
Risk to be scored for construction and operational phases of the project. MUST BE COMPLETED BY SACNASP PROFESSIONAL MEMBER REGISTERED IN AN APPROPRIATE FIELD OF EXPERTISE.
Se
ve
rity
Se
ve
rity
Sp
atia
l sc
ale
Du
ratio
n
Co
nse
qu
en
ce
Fre
qu
en
cy
of
ac
tiv
ity
Fre
qu
en
cy
of
imp
ac
t
Leg
al Is
sue
s
De
tec
tio
n
Lik
elih
oo
d
Sig
nific
an
ce
Ris
k R
atin
g
Co
nfid
en
ce
le
ve
l
Co
ntr
ol M
ea
sure
s
Bo
rde
rlin
e L
OW
MO
DER
ATE
Ra
tin
g C
lass
es
PES A
ND
EIS
OF
WA
TER
CO
UR
SE
No
. Phases Activity Aspect Impact
Flo
w
Re
gim
e
Ph
ysi
co
&
Ch
em
ica
l
(Wa
ter
Qu
ality
)
Ha
bita
t
(Ge
om
orp
h
+
Ve
ge
tatio
n
Bio
ta
1 Construction
Phase
Stormwate
r
Managem
ent for the
diversion
of the non-
perennial
watercour
se
Construction
of berms and
cut-off
trenches as
diversion
channels
Soil compaction,
mixing of soil
profile, erosion
gully formation,
loss of riparian
vegetation
associated with
non-perennial
watercourse;
pollution
potential from
coal fines
3 2 2 1 2 1 3 6 1 2 5 1 9 54 L 70
The risk to
the
watercours
e in the
long term
can be
considered
to be low
as a result
of the non-
perennial
state of the
watercours
e, the lack
of aquatic
biota
which
inhabit the
watercours
e and the
rehabilitati
on of the
area
following
the
impact.
One
non-
pere
nnial
wate
rcour
se
and
asso
ciate
d
ripari
an
zone
2 Operational
Phase
Continued
mining
operations
at the
Luhlanga
pit
Opencast
mining; Soil
stripping and
construction
of soil
stockpiles;
blasting
Soil erosion; loss
of topsoil; soil
contamination
from coal fines;
water pollution
from dirty water
runoff
1 3 2 2 2 1 3 6 1 2 5 1 9 54 L 70
The risk to
the
watercours
e in the
long term
can be
considered
to be low
One
non-
pere
nnial
wate
rcour
se
and
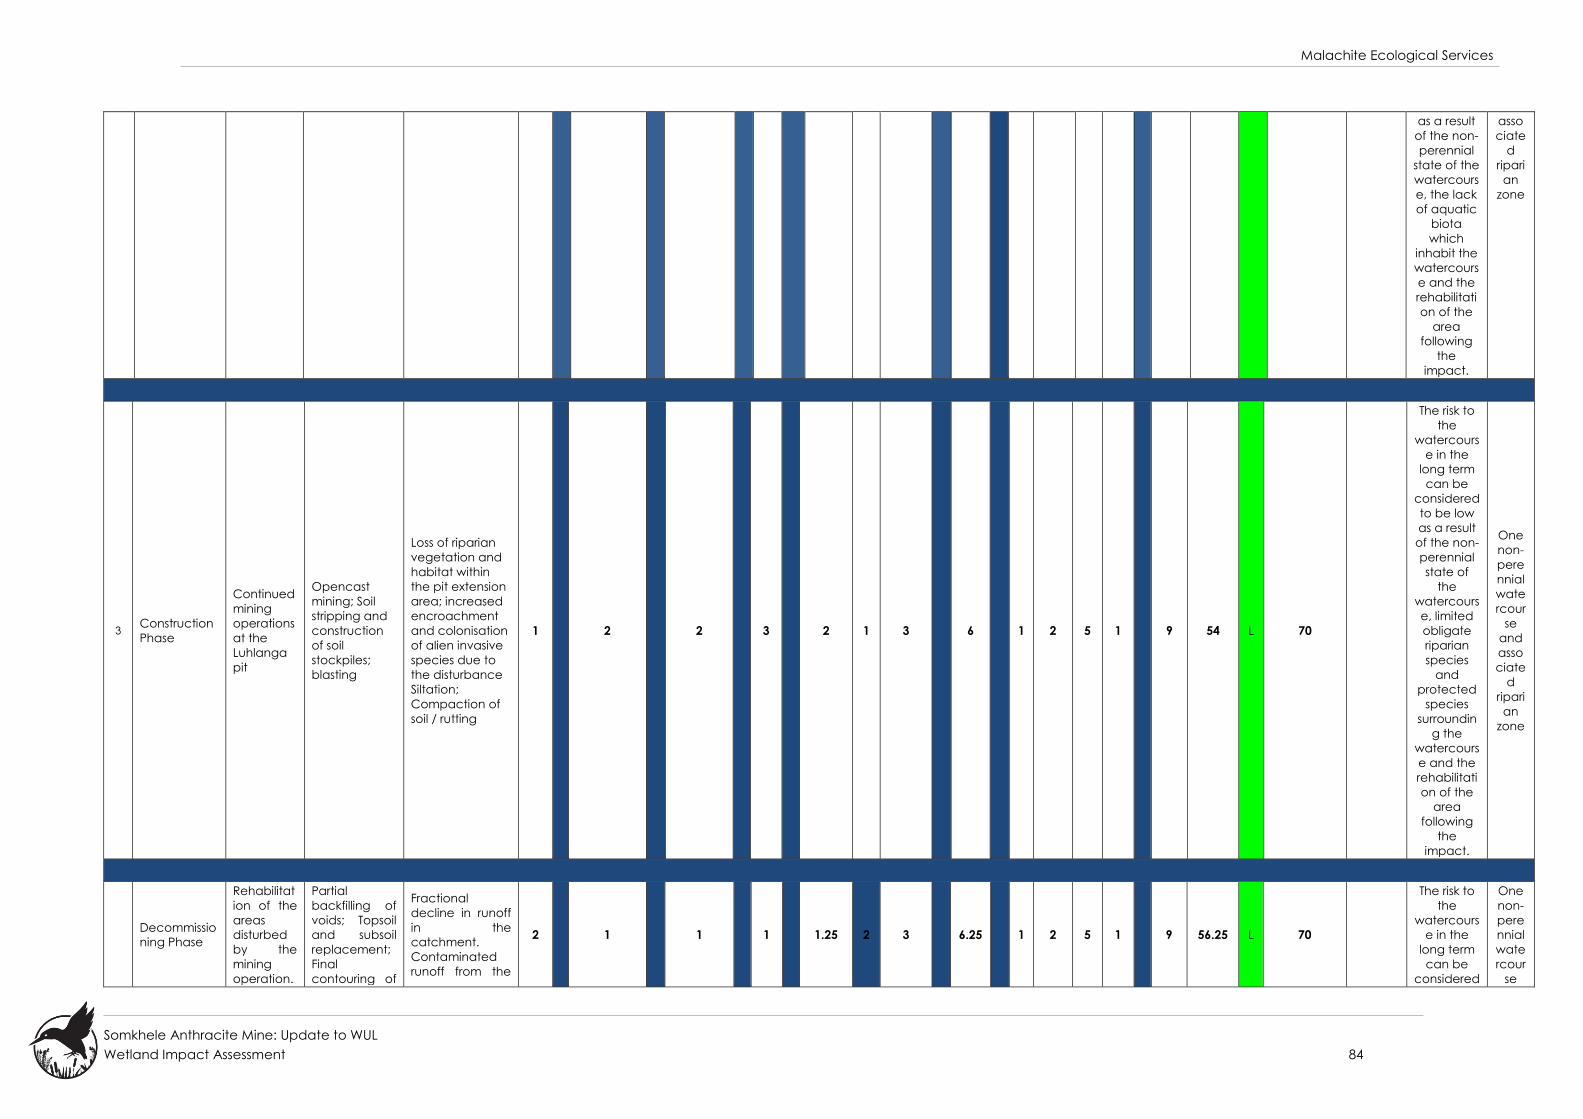
Malachite Ecological Services
Somkhele Anthracite Mine: Update to WUL
Wetland Impact Assessment 84
as a result
of the non-
perennial
state of the
watercours
e, the lack
of aquatic
biota
which
inhabit the
watercours
e and the
rehabilitati
on of the
area
following
the
impact.
asso
ciate
d
ripari
an
zone
3 Construction
Phase
Continued
mining
operations
at the
Luhlanga
pit
Opencast
mining; Soil
stripping and
construction
of soil
stockpiles;
blasting
Loss of riparian
vegetation and
habitat within
the pit extension
area; increased
encroachment
and colonisation
of alien invasive
species due to
the disturbance
Siltation;
Compaction of
soil / rutting
1 2 2 3 2 1 3 6 1 2 5 1 9 54 L 70
The risk to
the
watercours
e in the
long term
can be
considered
to be low
as a result
of the non-
perennial
state of
the
watercours
e, limited
obligate
riparian
species
and
protected
species
surroundin
g the
watercours
e and the
rehabilitati
on of the
area
following
the
impact.
One
non-
pere
nnial
wate
rcour
se
and
asso
ciate
d
ripari
an
zone
Decommissio
ning Phase
Rehabilitat
ion of the
areas
disturbed
by the
mining
operation.
Partial
backfilling of
voids; Topsoil
and subsoil
replacement;
Final
contouring of
Fractional
decline in runoff
in the
catchment.
Contaminated
runoff from the
2 1 1 1 1.25 2 3 6.25 1 2 5 1 9 56.25 L 70
The risk to
the
watercours
e in the
long term
can be
considered
One
non-
pere
nnial
wate
rcour
se
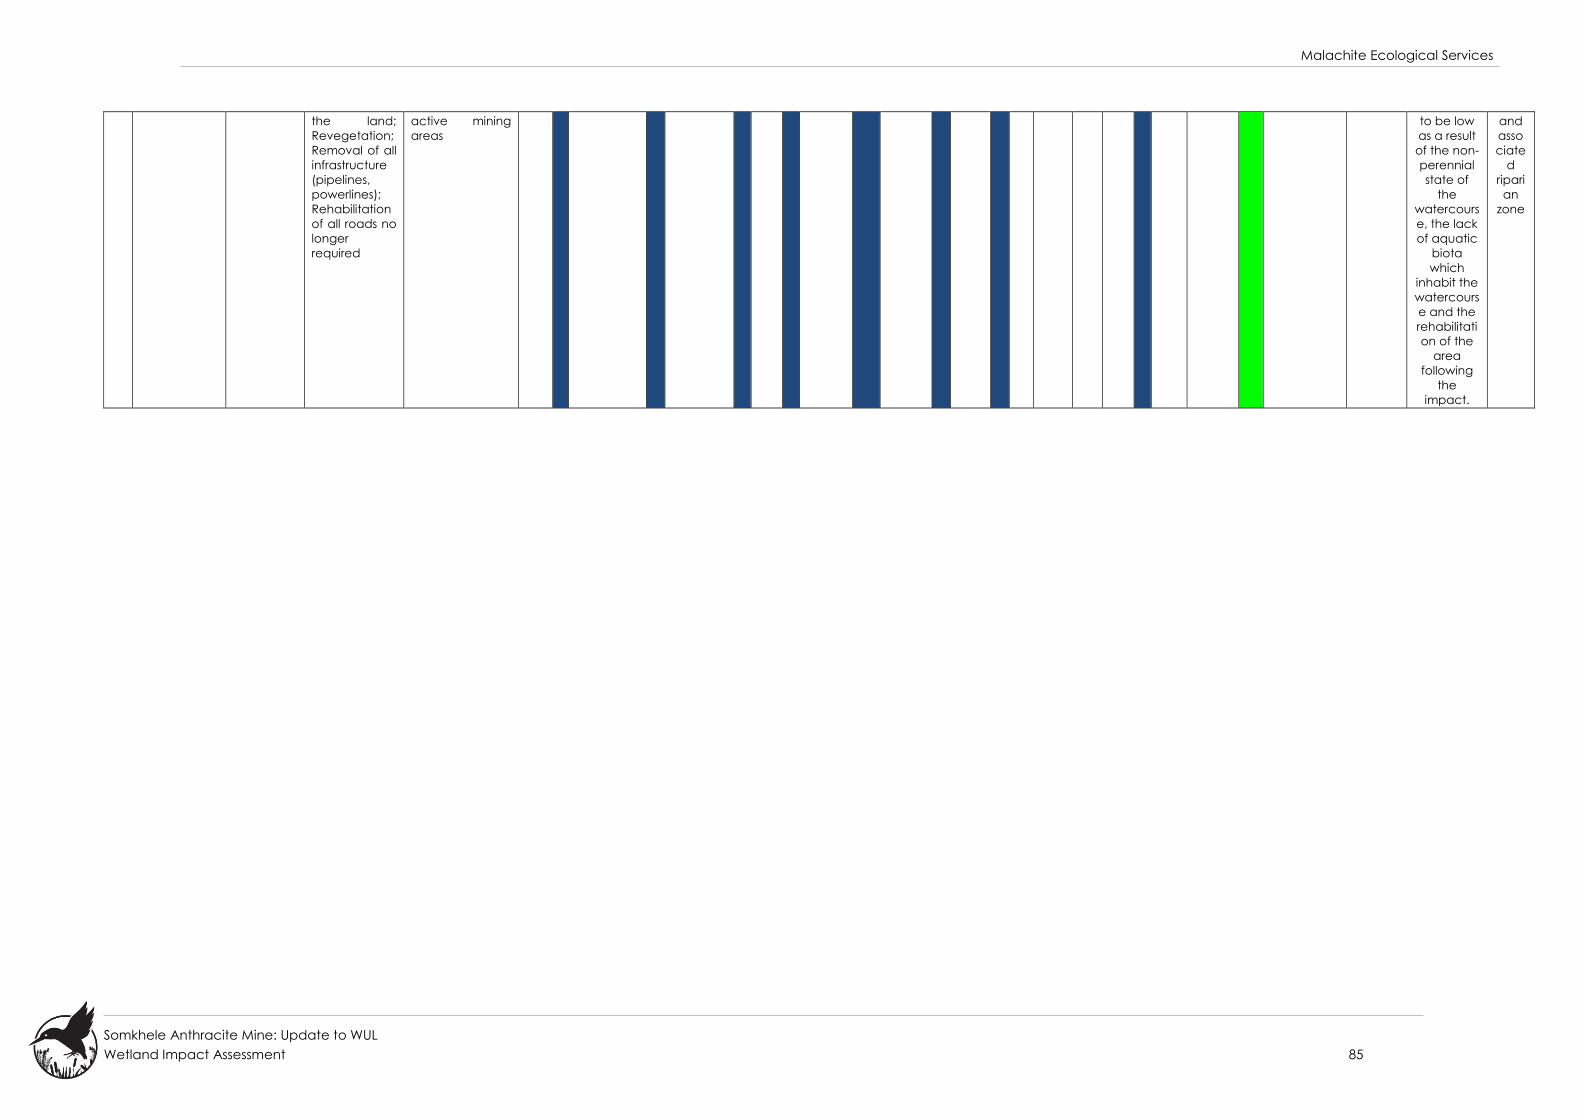
Malachite Ecological Services
Somkhele Anthracite Mine: Update to WUL
Wetland Impact Assessment 85
the land;
Revegetation;
Removal of all
infrastructure
(pipelines,
powerlines);
Rehabilitation
of all roads no
longer
required
active mining
areas
to be low
as a result
of the non-
perennial
state of
the
watercours
e, the lack
of aquatic
biota
which
inhabit the
watercours
e and the
rehabilitati
on of the
area
following
the
impact.
and
asso
ciate
d
ripari
an
zone
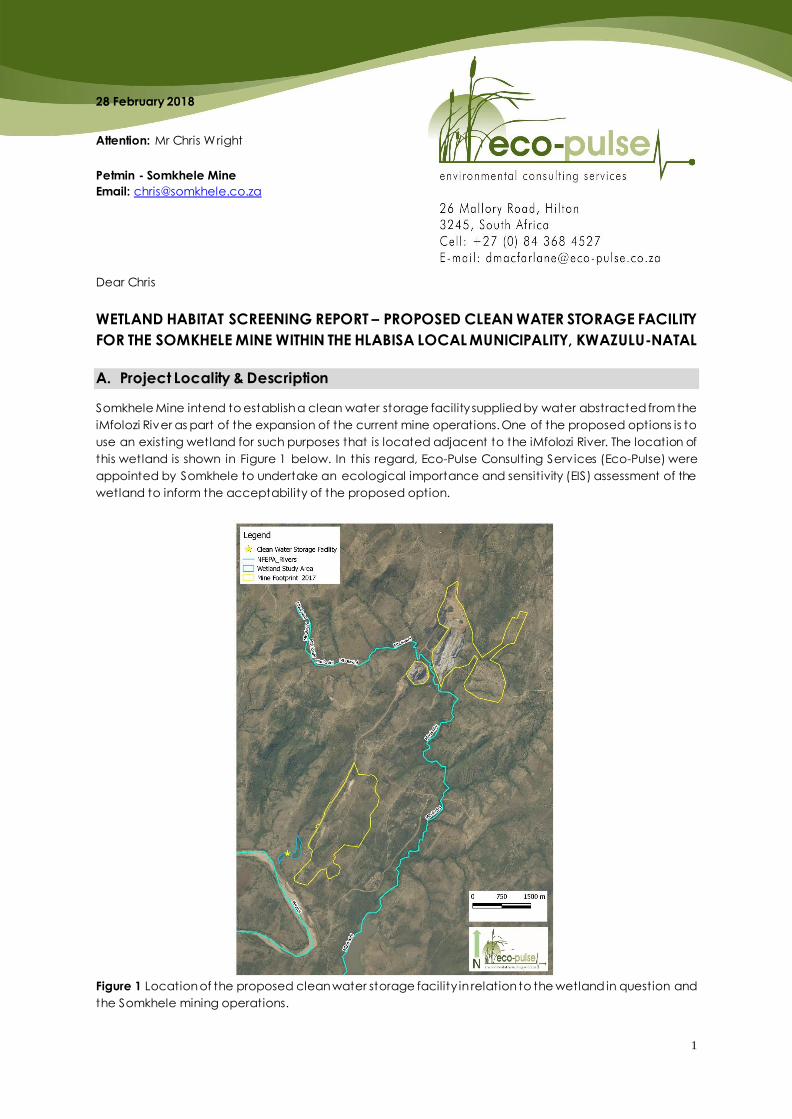
1
28 February 2018
Dear Chris
WETLAND HABITAT SCREENING REPORT – PROPOSED CLEAN WATER STORAGE FACILITY
FOR THE SOMKHELE MINE WITHIN THE HLABISA LOCAL MUNICIPALITY, KWAZULU-NATAL
A. Project Locality & Description
Somkhele Mine intend to establish a clean water storage facility supplied by water abstracted from the
iMfolozi River as part of the expansion of the current mine operations. One of the proposed options is to
use an existing wetland for such purposes that is located adjacent to the iMfolozi River. The location of
this wetland is shown in Figure 1 below. In this regard, Eco-Pulse Consulting Serv ices (Eco-Pulse) were
appointed by Somkhele to undertake an ecological importance and sensitivity (EIS) assessment of the
wetland to inform the acceptability of the proposed option.
Figure 1 Location of the proposed clean water storage facility in relation to the wetland in question and
the Somkhele mining operations.
Attention: Mr Chris Wright
Petmin - Somkhele Mine
Email: [email protected]
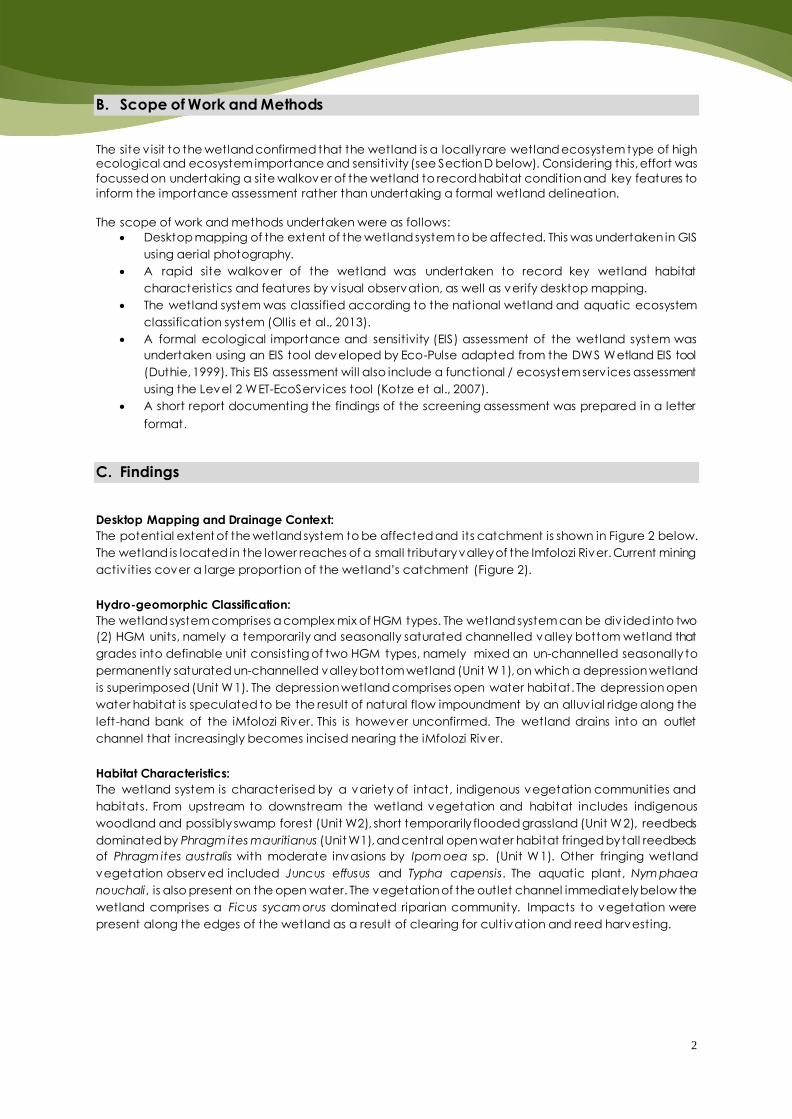
2
B. Scope of Work and Methods
The site v isit to the wetland confirmed that the wetland is a locally rare wetland ecosystem type of high ecological and ecosystem importance and sensitivity (see Section D below). Considering this, effort was
focussed on undertaking a site walkover of the wetland to record habitat condition and key features to
inform the importance assessment rather than undertaking a formal wetland delineation.
The scope of work and methods undertaken were as follows:
Desktop mapping of the extent of the wetland system to be affected. This was undertaken in GIS
using aerial photography.
A rapid site walkover of the wetland was undertaken to record key wetland habitat
characteristics and features by v isual observation, as well as verify desktop mapping.
The wetland system was classified according to the national wetland and aquatic ecosystem
classification system (Ollis et al., 2013).
A formal ecological importance and sensitivity (EIS) assessment of the wetland system was
undertaken using an EIS tool developed by Eco-Pulse adapted from the DWS Wetland EIS tool
(Duthie, 1999). This EIS assessment will also include a functional / ecosystem serv ices assessment
using the Level 2 WET-EcoServ ices tool (Kotze et al., 2007).
A short report documenting the findings of the screening assessment was prepared in a letter
format.
C. Findings
Desktop Mapping and Drainage Context:
The potential extent of the wetland system to be affected and its catchment is shown in Figure 2 below.
The wetland is located in the lower reaches of a small tributary valley of the Imfolozi River. Current mining
activ ities cover a large proportion of the wetland’s catchment (Figure 2).
Hydro-geomorphic Classification:
The wetland system comprises a complex mix of HGM types. The wetland system can be div ided into two
(2) HGM units, namely a temporarily and seasonally saturated channelled valley bottom wetland that
grades into definable unit consisting of two HGM types, namely mixed an un-channelled seasonally to
permanently saturated un-channelled valley bottom wetland (Unit W1), on which a depression wetland
is superimposed (Unit W1). The depression wetland comprises open water habitat. The depression open
water habitat is speculated to be the result of natural flow impoundment by an alluv ial ridge along the
left-hand bank of the iMfolozi River. This is however unconfirmed. The wetland drains into an outlet
channel that increasingly becomes incised nearing the iMfolozi River.
Habitat Characteristics:
The wetland system is characterised by a variety of intact, indigenous vegetation communities and
habitats. From upstream to downstream the wetland vegetation and habitat includes indigenous
woodland and possibly swamp forest (Unit W2), short temporarily flooded grassland (Unit W2), reedbeds
dominated by Phragm ites mauritianus (Unit W1), and central open water habitat fringed by tall reedbeds
of Phragm ites australis with moderate invasions by Ipom oea sp. (Unit W1). Other fringing wetland
vegetation observed included Juncus effusus and Typha capensis. The aquatic plant, Nym phaea
nouchali, is also present on the open water. The vegetation of the outlet channel immediately below the
wetland comprises a Ficus sycam orus dominated riparian community. Impacts to vegetation were
present along the edges of the wetland as a result of clearing for cultivation and reed harvesting.
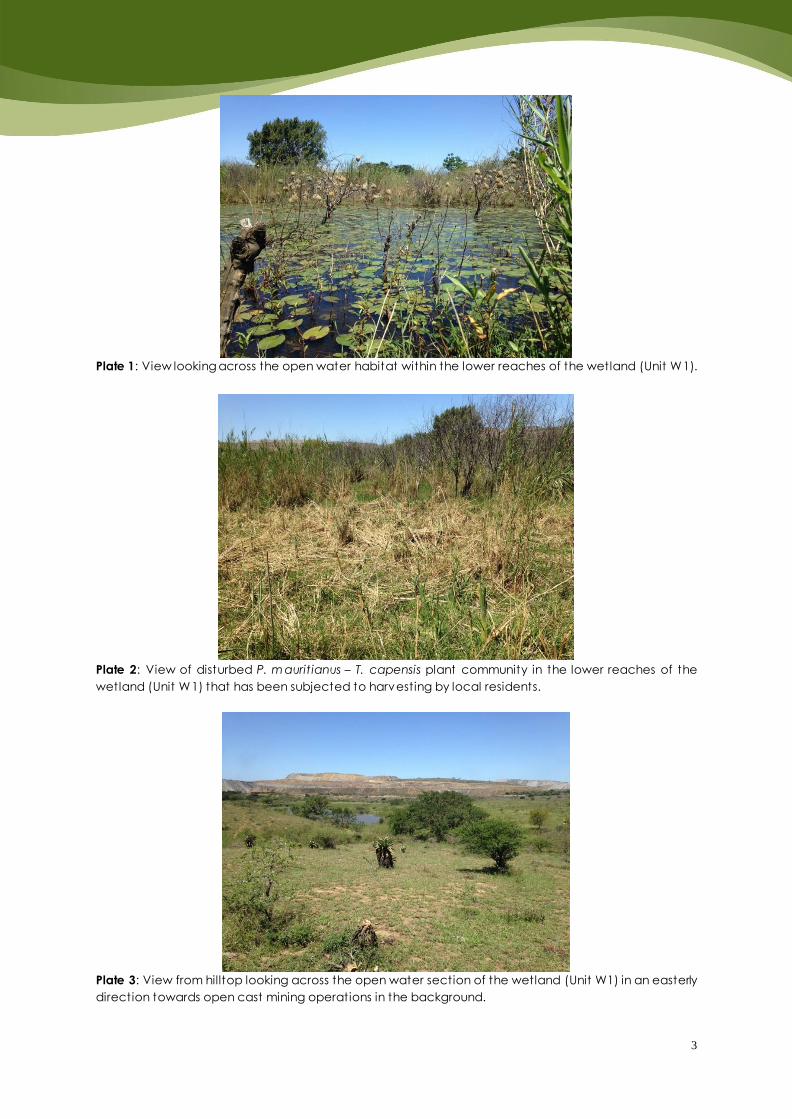
3
Plate 1: View looking across the open water habitat within the lower reaches of the wetland (Unit W1).
Plate 2: View of disturbed P. m auritianus – T. capensis plant community in the lower reaches of the
wetland (Unit W1) that has been subjected to harvesting by local residents.
Plate 3: View from hilltop looking across the open water section of the wetland (Unit W1) in an easterly
direction towards open cast mining operations in the background.
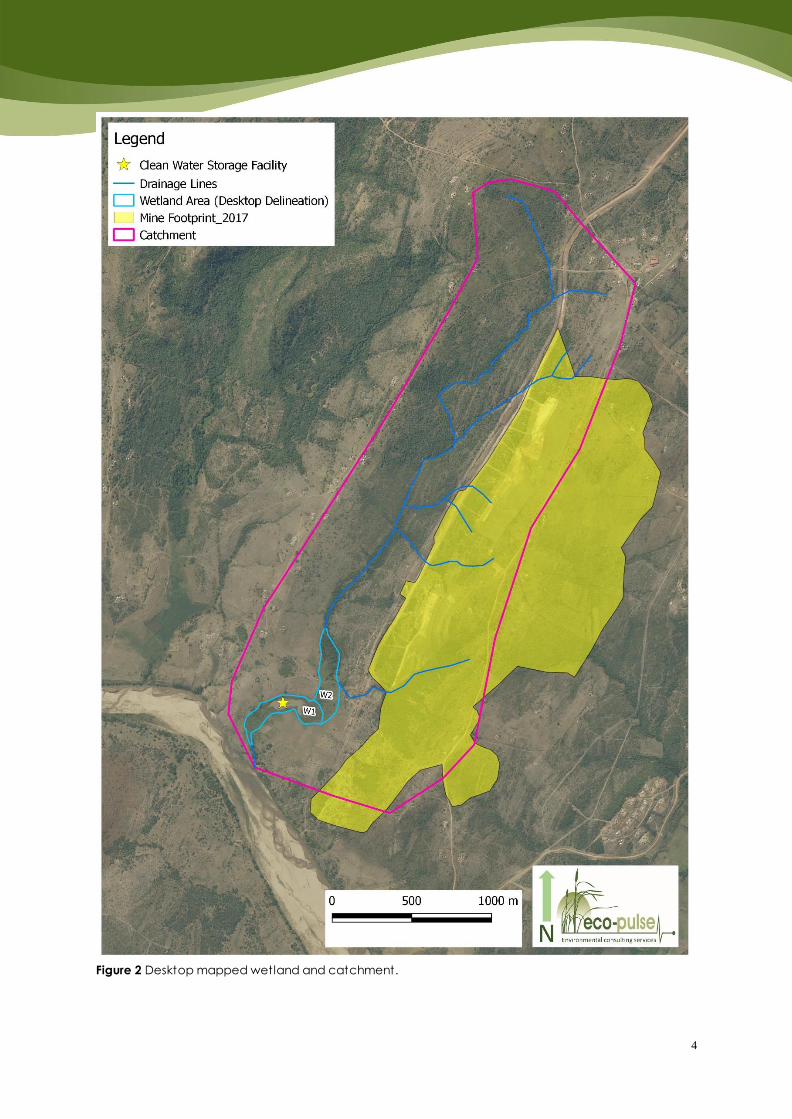
4
Figure 2 Desktop mapped wetland and catchment.
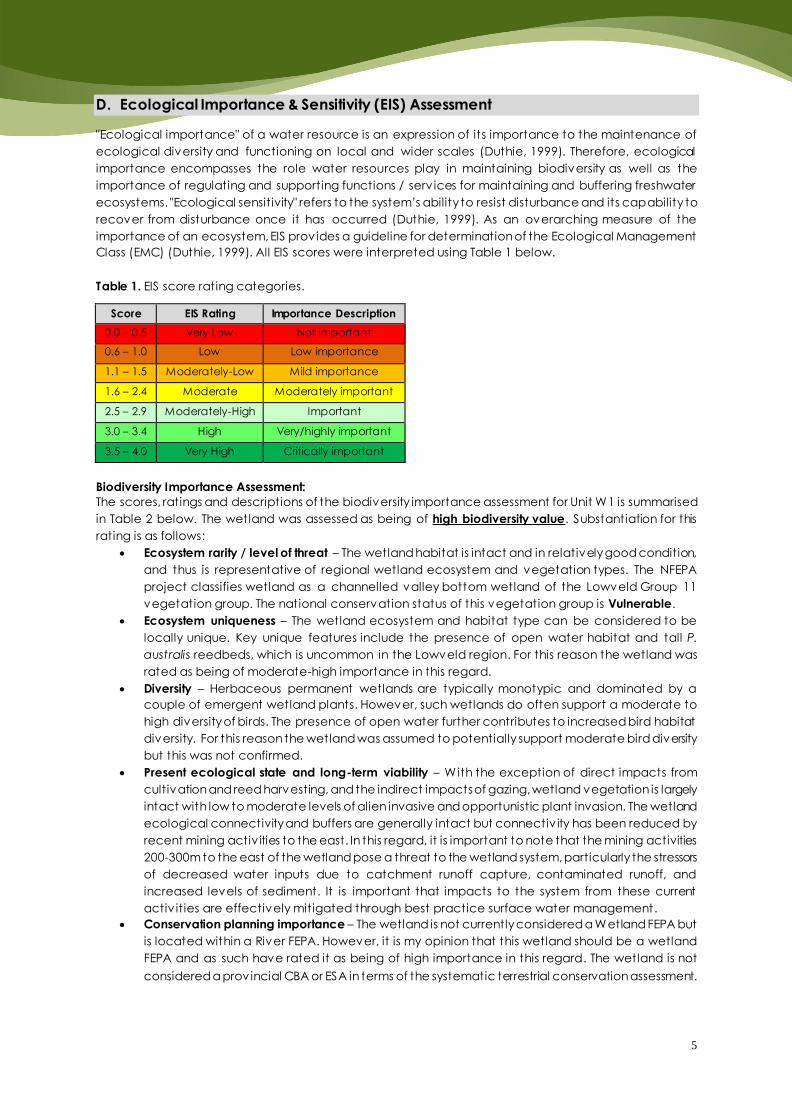
5
D. Ecological Importance & Sensitivity (EIS) Assessment
"Ecological importance" of a water resource is an expression of its importance to the maintenance of
ecological diversity and functioning on local and wider scales (Duthie, 1999). Therefore, ecological
importance encompasses the role water resources play in maintaining biodiversity as well as the
importance of regulating and supporting functions / serv ices for maintaining and buffering freshwater
ecosystems. "Ecological sensitivity" refers to the system’s ability to resist disturbance and its capability to
recover from disturbance once it has occurred (Duthie, 1999). As an overarching measure of the
importance of an ecosystem, EIS prov ides a guideline for determination of the Ecological Management
Class (EMC) (Duthie, 1999). All EIS scores were interpreted using Table 1 below.
Table 1. EIS score rating categories.
Score EIS Rating Importance Description
0.0 – 0.5 Very Low Not important
0.6 – 1.0 Low Low importance
1.1 – 1.5 Moderately-Low Mild importance
1.6 – 2.4 Moderate Moderately important
2.5 – 2.9 Moderately-High Important
3.0 – 3.4 High Very/highly important
3.5 – 4.0 Very High Critically important
Biodiversity Importance Assessment:
The scores, ratings and descriptions of the biodiversity importance assessment for Unit W1 is summarised
in Table 2 below. The wetland was assessed as being of high biodiversity value. Substantiation for this
rating is as follows:
Ecosystem rarity / level of threat – The wetland habitat is intact and in relatively good condition,
and thus is representative of regional wetland ecosystem and vegetation types. The NFEPA
project classifies wetland as a channelled valley bottom wetland of the Lowveld Group 11
vegetation group. The national conservation status of this vegetation group is Vulnerable.
Ecosystem uniqueness – The wetland ecosystem and habitat type can be considered to be
locally unique. Key unique features include the presence of open water habitat and tall P.
australis reedbeds, which is uncommon in the Lowveld region. For this reason the wetland was
rated as being of moderate-high importance in this regard.
Diversity – Herbaceous permanent wetlands are typically monotypic and dominated by a
couple of emergent wetland plants. However, such wetlands do often support a moderate to
high diversity of birds. The presence of open water further contributes to increased bird habitat
diversity. For this reason the wetland was assumed to potentially support moderate bird diversity
but this was not confirmed.
Present ecological state and long-term viability – W ith the exception of direct impacts from
cultivation and reed harvesting, and the indirect impacts of gazing, wetland vegetation is largely
intact with low to moderate levels of alien invasive and opportunistic plant invasion. The wetland
ecological connectivity and buffers are generally intact but connectiv ity has been reduced by
recent mining activ ities to the east. In this regard, it is important to note that the mining activities
200-300m to the east of the wetland pose a threat to the wetland system, particularly the stressors
of decreased water inputs due to catchment runoff capture, contaminated runoff, and
increased levels of sediment. It is important that impacts to the system from these current
activ ities are effectively mitigated through best practice surface water management.
Conservation planning importance – The wetland is not currently considered a Wetland FEPA but
is located within a River FEPA. However, it is my opinion that this wetland should be a wetland
FEPA and as such have rated it as being of high importance in this regard. The wetland is not
considered a provincial CBA or ESA in terms of the systematic terrestrial conservation assessment.
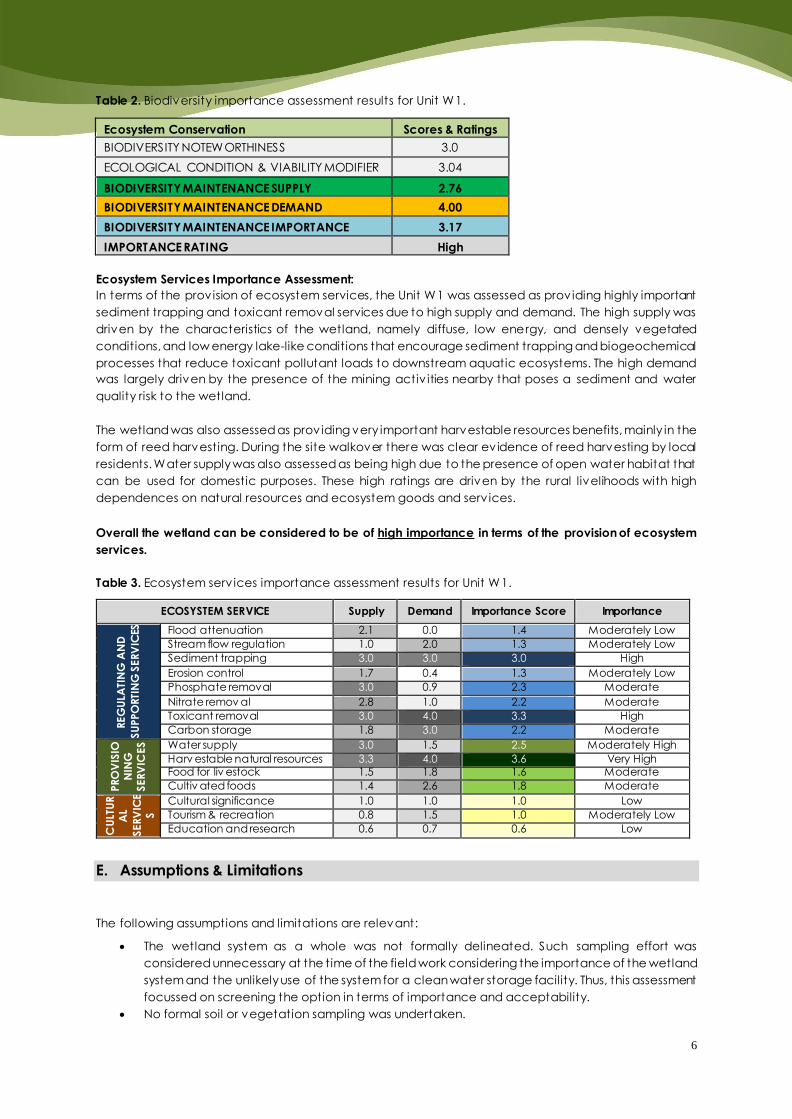
6
Table 2. Biodiversity importance assessment results for Unit W1.
Ecosystem Conservation Scores & Ratings
BIODIVERSITY NOTEWORTHINESS 3.0
ECOLOGICAL CONDITION & VIABILITY MODIFIER 3.04
BIODIVERSITY MAINTENANCE SUPPLY 2.76
BIODIVERSITY MAINTENANCE DEMAND 4.00
BIODIVERSITY MAINTENANCE IMPORTANCE 3.17
IMPORTANCE RATING High
Ecosystem Services Importance Assessment:
In terms of the provision of ecosystem services, the Unit W1 was assessed as prov iding highly important
sediment trapping and toxicant removal services due to high supply and demand. The high supply was
driven by the characteristics of the wetland, namely diffuse, low energy, and densely vegetated
conditions, and low energy lake-like conditions that encourage sediment trapping and biogeochemical
processes that reduce toxicant pollutant loads to downstream aquatic ecosystems. The high demand
was largely driven by the presence of the mining activ ities nearby that poses a sediment and water
quality risk to the wetland.
The wetland was also assessed as prov iding very important harvestable resources benefits, mainly in the
form of reed harvesting. During the site walkover there was clear ev idence of reed harvesting by local
residents. Water supply was also assessed as being high due to the presence of open water habitat that
can be used for domestic purposes. These high ratings are driven by the rural livelihoods with high
dependences on natural resources and ecosystem goods and serv ices.
Overall the wetland can be considered to be of high importance in terms of the provision of ecosystem
services.
Table 3. Ecosystem serv ices importance assessment results for Unit W1.
ECOSYSTEM SERVICE Supply Demand Importance Score Importance
REG
ULA
TIN
G A
ND
SU
PPO
RTI
NG
SERV
ICES
Flood attenuation 2.1 0.0 1.4 Moderately Low
Stream flow regulation 1.0 2.0 1.3 Moderately Low
Sediment trapping 3.0 3.0 3.0 High
Erosion control 1.7 0.4 1.3 Moderately Low
Phosphate removal 3.0 0.9 2.3 Moderate
Nitrate remov al 2.8 1.0 2.2 Moderate
Toxicant removal 3.0 4.0 3.3 High
Carbon storage 1.8 3.0 2.2 Moderate
PRO
VIS
ION
ING
SERV
ICES
Water supply 3.0 1.5 2.5 Moderately High
Harv estable natural resources 3.3 4.0 3.6 Very High Food for liv estock 1.5 1.8 1.6 Moderate
Cultiv ated foods 1.4 2.6 1.8 Moderate
CU
LTU
RA
L
SERV
ICE
S
Cultural significance 1.0 1.0 1.0 Low
Tourism & recreation 0.8 1.5 1.0 Moderately Low
Education and research 0.6 0.7 0.6 Low
E. Assumptions & Limitations
The following assumptions and limitations are relevant:
The wetland system as a whole was not formally delineated. Such sampling effort was
considered unnecessary at the time of the field work considering the importance of the wetland
system and the unlikely use of the system for a clean water storage facility. Thus, this assessment
focussed on screening the option in terms of importance and acceptability.
No formal soil or vegetation sampling was undertaken.
7
The rapid site walkover and field verification of the wetland was focused around the open water
sections and outlet channel of Unit W1 where the clean water storage facility may occur. A rapid
walkover of the wetland area upstream of the open water section (Units W2 & W3) was not
undertaken.
The importance and ecosystems serv ices assessments only apply to Unit W1.
Certain aspects of the WET-EcoServ ices assessment were not confirmed in the field and had to
be assessed at a desktop level.
This wetland assessment report was drafted for the specific purpose of screening the significance
and acceptability of using Wetland Unit W1 as a clean water storage facility in order to assist
Somkhele in their clean water storage planning. This report does not include an investigation or
assessment of the impacts of any exiting mining activities occurring to the east of the wetland.
F. Conclusion and Recommendations
This screening assessment confirms that the wetland system under investigation is import ant in terms of
maintaining biodiversity and meeting wetland ecosystem conservation targets , and that it prov ides
highly important ecosystem serv ices. For these reasons, the wetland system should be preserved in its
current state and direct and indirect impacts to the wetland avoided or minimised to low levels. The
establishment of a clean water storage facility within the wetland or within the main feeder stream will
likely cause measurable changes in the wetland’s hydrology and habitat characteristics, which would
be a significant impact considering its importance and desired state. Such impacts would likely be
unacceptable and considered a fatally flawed option. Therefore it is recommended that the clean water
storage facility be established outside of the wetland and ideally located outside of the main feeder
stream to avoid indirect hydrological impacts associated with the operation of the clean water storage
facility.
Furthermore, it is important to note that the mining activ ities 200-300m to the east of the wetland pose a
potential threat to the wetland system, particularly the stressors of decreased water inputs due to
catchment runoff capture, contaminated runoff, and increased levels of sediment ation. It is important
that exposure of the wetland to these stressors are minimised and that best practice surface water
management is implemented like the separation of dirty and clean water management systems and the
use of lined pollution controls dams to capture and contain dirty water.
Yours faithfully,
Ryan Edwards (Pr. Sci. Nat.)
Senior Environmental Scientist & Wetland Ecologist
Eco-Pulse Environmental Consulting Services
Tel: 073 121 3392
Email: [email protected]
8
G. References
CSIR (Council for Scientific and Industrial Research). 2010. National Freshwater Ecosystem Priority Areas
(NFEPA). Council for Scientific and Industrial Research, Pretoria, South Africa.
Duthie, A. 1999. Appendix W5: IER (Floodplains): Determining the Ecological Importance and Sensitivity
(EIS) and the Ecological Management Class (EMC). From DWAF (Department of Water Affairs and Forestry. 1999. Resource Directed Measures for Protection of Water Resources. Volume 4: Wetland
Ecosystems Version 1.0, Pretoria.
Kotze, D., Marneweck, G., Batchelor, A., Lindley, D. and Collins, N. 2007. WET-EcoServices: A technique for rapidly assessing ecosystem serv ices prov ided by wetlands. Wetland Management Series. Water
Research Commission Report TT 339/09.
Kotze, D. C., Macfarlane, D.M., & Edwards, R., 2016. A preliminary rev ision of the WET-EcoServices
assessment tool for assessing the ecosystem serv ices prov ided by wetlands and riparian areas.
Unpublished report prepared by Eco-Pulse Env ironmental Consulting Serv ices. Version 2.0. May 2016.
Nel, J. L., Murray, K. M., AM Maherry, A. M., Petersen, C. P., DJ Roux, D. J., Driver, A., Hill, L., van Deventer,
H., Funke, N., Swartz, E. R., Smith-Adao, L. B., Mbona, N., Downsborough, L. and Nienaber, S. 2011.
Technical Report for the National Freshwater Ecosystem Priority Areas project. Report to the Water Research Commission. WRC Report No. 1801/2/11.
Nel, J.L., Murray, K.M., Maherry, A.M., Petersen, C.P., Roux, D.J., Driver, A., Hill, L., Van Deventer, H., Funke,
N., Swartz, E.R., Smith-Adao, L.B., Mbona, N., Downsborough, L. and Nienaber, S. (2011). Technical Report for the National Freshwater Ecosystem Priority Areas project. WRC Report No. K5/1801.
Ollis, D., Snaddon, K., Job. N. and Mbona. N. 2013. Classification system for wetland and other aquatic ecosystems in South Africa. User manual: inland systems. SANBI biodiversity series 22. SANBI Pretoria.